task 1 final report part 1 evaluation of approaches to ... · 1 | p a g e task 1 final report –...
TRANSCRIPT

1 | P a g e
Task 1 Final Report – Part 1
Task 1 Final Report – Part 1
Evaluation of Approaches to Reduce
Greenhouse Gas Emissions in Washington State
Task 1.a – Analyze Washington State’s total consumption and expenditures for energy
Task 1.c – Analyze the state’s non-energy sources of greenhouse gas emissions, such as
cement production and agricultural sources, based on available data and information
Delivered August 23, 2013
Revised October 2013
Table of Contents
Key Findings ................................................................................................................................... 2
1 Introduction – Energy Consumption and Expenditure Analysis ............................................. 6
2 Washington’s Greenhouse Gas Profile .................................................................................... 7
3 Washington’s Energy Profile ................................................................................................. 13
3.1.1 Production ............................................................................................................... 13
3.1.2 Consumption ........................................................................................................... 13
3.1.3 Expenditures ........................................................................................................... 15
4 Transportation Sector ............................................................................................................ 19
4.1.1 Consumption ........................................................................................................... 19
4.1.2 Expenditures ........................................................................................................... 20
5 Residential Commercial Industrial (RCI) Sector ................................................................... 23
5.1.1 Residential............................................................................................................... 23
5.1.2 Commercial ............................................................................................................. 25
5.1.3 Industrial ................................................................................................................. 27
6 Electricity Sector ................................................................................................................... 31
6.1.1 Consumption ........................................................................................................... 31
6.1.2 Expenditures ........................................................................................................... 36

2 | P a g e
Task 1 Final Report – Part 1
Key Findings
As part of its Evaluation of Approaches to Reduce Greenhouse Gas Emissions in Washington
State, the Climate Legislative and Executive Workgroup (CLEW), through the Office of
Financial Management (OFM), has tasked Science Applications International Corporation
(SAIC) with analyzing Washington State Emissions and Related Energy Consumption (Task 1),
in several parts. This document presents the results of Task 1.a – Analysis of Washington
State’s total consumption and expenditures for energy, and Task 1.c – Analyze the state’s non-
energy sources of greenhouse gas emissions, such as cement production and agricultural sources,
based on available data and information. SAIC completed these tasks, with the following
analysis of emissions, energy consumption, and energy expenditures in Washington from 1990 to
2011. This document provides an analysis of energy consumption and expenditures in
Washington State and examines how energy consumption impacts GHG emissions. Key trends
in energy consumption and expenditures are highlighted and additional detail is provided for
individual sources within sectors that show the highest GHG emissions, energy consumption,
and expenditures. A separate document, Task 1 Final Report – Part 2, presents the results of
other Task 1 items.
Emissions
The transportation sector is the largest source of emissions in Washington State. Within this
sector, on-road gasoline consumption is the largest single source of emissions. Other
important emission sources in the transportation sector are aviation fuels and diesel fuel.
The electricity and residential, commercial, and industrial (RCI) sectors are the second
largest emitting sectors, after transportation. In the electricity sector, coal consumption for
electricity is the largest single source, while in the RCI sector, natural gas consumption is the
largest source.
Natural gas consumption is the largest source of emission in the RCI sector, primarily
heating fuel for buildings, followed by oil, which is primary used in the industrial sector.
Total emissions in the state have been declining since 2007. There was a small increase in
emission in 2010, primarily due to increased fossil fuel electricity consumption in response to
drought conditions that reduced hydroelectric power output. The only other sectors that
showed increased emissions in 2010 were the industrial processes and waste management
sectors.

3 | P a g e
Task 1 Final Report – Part 1
Figure 1: Emissions by Sector, 2005 - 2010
Source: Washington State Greenhouse Gas Emissions Inventory 1990 - 2010
Energy Production
Washington has one large coal-fired plant, the Centralia plant owned by TransAlta, which
has two units totaling 1,340 MW in generation capacity. The plant originally used coal from
the State’s only coal mine, which was shut down in 2006, and now imports coal from
Wyoming and Montana. Starting by shutting down the first unit in 2020, the State plans to
phase out in-state coal-fired generation entirely by the end of 2025.1
Washington produces very few fossil fuel resources, but is a principal petroleum refining
center that imports crude and supplies finished products to Pacific Northwest markets.
Washington is the Nation’s largest producer of hydroelectric power; which generally
accounts for approximately three-fourths of the State electricity generation.2
Among the State’s significant non-hydro renewable resources are existing fuel wood
resources, and wind power potential. The State ranked 7th
in the nation for wind capacity in
20133.
Washington also has one nuclear plant, the Columbia Generating Station, which generates
about one-tenth of the electricity generated in the state.4
1 U.S. Energy Information Administration. Washington State Profile and Energy Estimates.
http://www.eia.gov/state/analysis.cfm?sid=WA 2 U.S. Energy Information Administration. http://www.eia.gov/state/analysis.cfm?sid=WA.
3 American Wind Energy Association. U.S. Wind Industry First Quarter2013 Market Report.
http://awea.rd.net/Resources/Content.aspx?ItemNumber=5400 4 Although the Columbia Generating Station accounts for one-tenth of electricity generated in Washington, the
output from the plant is sold to BPA and marketed to customers throughout the Pacific Northwest, with only about
350 average megawatts actually consumed in Washington.

4 | P a g e
Task 1 Final Report – Part 1
Energy Consumption
Washington consumed just over 1.5 quadrillion Btu of total energy in 2011.
On a per capita basis, Washington consumed about 220 million Btu in 2011. Oregon and
California consumed less energy per capita, at 193 and 201 million Btu per capita,
respectively, in 2011. Idaho and Montana consumed more energy per capita, at 278 and 319
million Btu per capita, respectively, in 2011.
In the transportation sector, Washington consumes less on-road transportation fuel (gasoline
and diesel) per person than all other states in the region, except California. However,
consumption of gasoline is still the largest source of emissions in the state.
Figure 2: Per Capita On-Road (Gasoline and Diesel) Fuel Consumption 1990 - 2011
Source: EIA SEDS. Based on resident population including Armed Forces.
Energy Prices and Expenditures
Washington spent $27 billion on energy in 2011, over 7 percent of gross state product.
The transportation sector accounts for the largest share of state energy expenditures, 58
percent in 2010. Gasoline accounted for the largest share of expenditures, followed by diesel
and aviation fuel.
On-road fuel (gasoline and diesel) prices have been increasing every year since 2003, except
for a sharp decline in 2009 during the economic recession. Gasoline prices increased an
annual average of 20 percent in 2010 and 2011. Diesel prices show a similar trend with
prices increasing an average of 25 percent annually in 2010 and 2011.

5 | P a g e
Task 1 Final Report – Part 1
Figure 3: Total Energy Consumption and Expenditures, 1990 - 2010:
Source: 2013 Biennial Energy Report. Expenditures in billion 2005 dollars.

6 | P a g e
Task 1 Final Report – Part 1
1 Introduction – Energy Consumption and Expenditure Analysis
Energy consumption, particularly the combustion of fossil fuels, is the principal source of
greenhouse gas (GHG) emissions in Washington State and around the globe. Any discussion of
policies and programs aimed at reducing GHG emissions must consider energy consumption and
its contribution to GHG emissions. An analysis of energy prices and expenditures allows the
State to consider how policies that target emissions relate to energy price and the economy.
The main energy consuming sectors in Washington State, and therefore the sectors that produce
the most GHG emissions, are the transportation sector, the residential, commercial, and industrial
(RCI) sector5, and the electricity sector. Together these three sectors were responsible for 86
percent of Washington’s total GHG emissions in 2010. The remaining emissions come from
non-energy sources in the industrial, agricultural, and waste management sectors, such as
industrial process emissions and methane (CH4) emissions from agricultural and waste
management activities.
This document provides an analysis of energy consumption and expenditures in Washington
State and examines how energy consumption impacts GHG emissions. Key trends in energy
consumption and expenditures are highlighted and additional detail is provided for individual
sources within sectors that show the highest GHG emissions, energy consumption, and
expenditures. These highlighted sources are compared to similar jurisdictions outside
Washington6 to identify areas where potential reduction measures might be focused.
5 The RCI sector includes direct fuel consumption in the residential, commercial, and industrial sectors and does not
include electricity consumption. 6 Primarily the Western States, whose energy profile is similar to Washington’s, and California, which has GHG
reduction policies in place similar to those in Washington.

7 | P a g e
Task 1 Final Report – Part 1
2 Washington’s Greenhouse Gas Profile
Total emissions in Washington State in 2010 were 96.1 million metric tons of carbon dioxide
equivalent (MMTCO2e) according to the Washington State Greenhouse Gas Emissions Inventory
published in 2012 (which includes data from 1990 to 2010). Washington’s emission profile
differs slightly from most other states and the United States as a whole. The electric power
sector is the largest source of emissions on average in the United States, accounting for about 33
percent of total emissions in 2011.7 The residential, commercial, and industrial (RCI) and
transportation sectors are the next largest sources, at 31 and 28 percent, respectively. In
Washington, the largest source of emissions is the transportation sector, which in 2010 accounted
for 44 percent of total GHG emissions in the State. This is similar to other Northwestern states
where hydropower is a primary source of electricity which offsets emissions from fossil fueled
power plants in the electricity sector.
Although most of the electricity
produced within Washington comes
from hydropower, a portion of the
electricity actually consumed in the
State is imported from fossil fueled
power plants outside the State including
plants in Montana and Wyoming.
Therefore, on a net consumption basis,
the electricity sector contributes to a
significant portion of emissions and is
the second largest emissions source in the state accounting for 22 percent of total emissions in
2010.8 To determine the GHG inventory boundary approach, we analyzed indirect emissions
from electricity consumed rather than only direct emissions from in-state generation only.
Washington State decided to emphasize the consumption approach in its 2007 inventory,9 after
analyzing both approaches, and for the purpose of this project, we followed that established
approach.
The third largest source of emissions in Washington is the residential, commercial, and industrial
(RCI) sector which accounted for 20 percent of total emissions in 2010. Emissions in this sector
are primarily from the combustion of fossil fuels in houses and buildings as well as fuel for
7 US EPA. Inventory of U.S. Greenhouse Gas Emissions and Sinks, 1990-2011.
http://www.epa.gov/climatechange/ghgemissions/usinventoryreport.html 8 Hydropower cannot supply all of the state’s electricity demand. The hydro Washington exports is surplus power in
excess of the state’s demand at the time it is generated. Washington imports energy at times when hydro cannot
meet the state’s demand. 9 Center for Climate Strategies. Washington State Greenhouse Gas Inventory and Reference Case Projections, 1990-
2020, December 2007.
Consumption Based Inventory Approach
Leidos evaluated policies in a consistent framework to
how Washington’s statutory baseline inventory (1990)
and subsequent inventories have been calculated. The
goal of this effort has been to evaluate how the State’s
emissions inventory can or will meet statutory targets
in light of existing and potential policies, and that
means evaluating policies as they would be reflected
in the State inventory methodology.

8 | P a g e
Task 1 Final Report – Part 1
industrial activities. Figure 4 shows the percent share of emissions by sector in Washington and
in the United States.10
Figure 4: Share of Emissions by Sector for Washington and United States
Washington United States
Note: Fossil Fuel Industry, Industrial Processes, and Waste Management are included in the RCI sector in the
United States Chart.
The consumption of gasoline in vehicles is the largest single source of emissions in Washington,
accounting for over 23 percent of total emissions in 2010. Electricity produced from coal is the
second largest source of emissions in the State. Although Washington only has one coal fired
power plant, a portion of the electricity consumed in the state is imported from coal burning
power plants outside the state and these emissions are included in the inventory. Washington’s
existing GHG reduction policies targeting fossil fueled power plants, including emission
performance standards and renewable portfolio standards, apply to coal and other fossil fueled
plants both inside and outside the state. Combustion of natural gas and oil in the RCI sector
follow as the next largest sources of emissions. The residential sector is the largest consumer of
natural gas in Washington, followed closely by the industrial and electric power sectors. Roughly
one-third of Washington households use natural gas as their main energy source for home
heating.11
Consumption of jet fuel is the next largest source of emissions. Washington is one of
the largest consumers of jet fuel in the United States, due in part to several large Air Force and
Navy installations located in the state. Diesel fuel in vehicles and equipment emit about half as
much emissions as coal fired electricity. Figure 2 below shows the contribution of individual
sources of emissions in Washington in 2010.
10
Washington State GHG Inventory, 1990 – 2010. United State data from US EPA. 11
U.S. Energy Information Administration. http://www.eia.gov/state/analysis.cfm?sid=WA

9 | P a g e
Task 1 Final Report – Part 1
Figure 5: Washington State GHG Emissions by Source in 2010
0 5 10 15 20 25
Electricity from Biomass and Waste ( …
Coal Mining (CH4)
Oil Industry (CH4)
Limestone and Dolomite Use (CO2)
Electricity from Petroleum
Soda Ash
Semiconductor Manufacturing (HFC, …
RCI Wood (CH4 and N2O)
RCI Coal
Cement Manufacture (CO2)
Electric Power T&D (SF6)
Rail
Aluminum Production ( CO2, PFC)
Transportation Natural Gas, LPG
Natural Gas Industry(CH4)
Wastewater Management
Manure Management
Enteric Fermentation
Agriculture Soils
ODS Substitutes (HFC, PFC and SF6)
Marine Vessels
Solid Waste Management
Electricity from Natural Gas
Onroad Diesel
Jet Fuel and Aviation Gasoline
RCI Oil
RCI Natural Gas
Electricity from Coal
Onroad Gasoline
MMTCO2e

10 | P a g e
Task 1 Final Report – Part 1
From 2005 to 2007 emissions increased at an average annual rate of 3.5 percent followed by a
comparable decrease in emissions in 2008 and 2009, when emissions dropped to very near 2005
levels. Emissions increased by just over one percent from 2009 to 2010. Figure 3 shows
emissions by sector from 2005 to 2010. Total GHG emissions in 2010 were 1.1 MMTCO2e (5.7
percent) higher than in 1990, the baseline year from which emission targets will be measured. In
2010, emissions from the electricity sector overtook emissions from the RCI sector for the first
time to become the second largest source of emissions in the state. A contributing factor to the
increase in electricity emissions in 2010 was reduced output of hydropower due to the severe
drought that occurred in that year. This increased the amount of electricity imported into the
state, some of which was generated with fossil fuel. There was also an increase of emissions
from the waste management sector in 2010.
Figure 6: Emissions by Sector, 2005 - 2010
Source: Washington State Greenhouse Gas Emissions Inventory 1990 - 2010
From 2005 to 2006, all sectors except electricity and the fossil fuel industry showed increases in
emissions, with the transportation sector showing the largest increase. All sectors increased
emissions from 2006 to 2007, with the transportation sector again showing the largest increase.
Conversely, the majority of sectors showed decreases in emissions in 2008 and 2009 with the
transportation and RCI sectors leading the reductions. Reduced demand for energy, especially
transportation fuels, during the global economic recession was a significant contributing factor to
the reductions during this time period. The only sector in which emissions increased from 2008
to 2009 was the electricity sector. Figure 7 shows the amount of change year-over-year by sector
from 2005 to 2010 in MMTCO2e.12
12
Washington State GHG Inventory, 1990 – 2010.

11 | P a g e
Task 1 Final Report – Part 1
Figure 7: Change in Emissions by Sector
Non-energy emissions sources in Washington accounted for 13.5 MMTCO2e, or 14 percent of
total emissions, in 2010. Non-energy emissions occur in four sectors including the Fossil Fuel
Industry, Industrial Processes, Waste Management, and Agriculture. The Fossil Fuel Industry
sector emitted 0.7 MMTCO2e in 2010, approximately 0.7 percent of total emissions. This sector
includes CH4 emissions that are released due to leakage and venting (fugitive emissions) during
the production, processing, transmission and distribution of fossil fuels. All of the emissions in
this sector in 2010 were from the natural gas industry.13
The Industrial Processes sector accounted for 3.8 MMTCO2e, or 4 percent of total emissions, in
2010. This sector includes CO2 emissions from industrial processes such as aluminum and
cement manufacturing, fugitive emissions of hydrofluorocarbons (HFCs), perfluorocarbons
(PFCs) and sulfur hexafluoride (SF6) used as substitutes for ozone depleting substances (ODS),
and fugitive emissions of SF6 from electric power transmission and distribution systems.
Fugitive emissions of ODS substitutes, typically used in applications such as refrigeration, air
conditioning systems, aerosols, and fire suppression, accounted for 66 percent of emissions in
this sector in 2010 and have been increasing at average annual rate of 6.6 percent per year since
2008. Although these gases are less harmful to the ozone layer than the gases they replace, they
have much higher global warming potentials than other GHGs.
13
There was a small amount of emissions (0.01 MMTCO2e) from coal mining in 2005 before the states only mine
was closed in 2006.

12 | P a g e
Task 1 Final Report – Part 1
The Waste Management sector includes CH4 emissions from solid waste management practices
and wastewater treatment. This sector accounted for 3.8 MMTCO2e in 2010, or 4 percent of
total emissions. Most of the emissions in this sector, 82 percent in 2010, are from solid waste
management activities, such as landfills. There has been a general increase in per capita waste
generation in Washington since 1999. However, the amount of waste recycled and diverted
over this time period has also increased.14
The tracking of waste generation and disposal
continues to improve and a portion of the increase in emissions from waste management
activities from 2009 to 2010 can be attributed to enhanced reporting requirements and improved
data quality.15
The Agriculture sector accounted for 5.2 MMTCO2e, or 5.4 percent of total emissions, in 2010.
This sector includes CH4 and nitrous oxide (N2O) emissions from enteric fermentation by
livestock, manure management, and agricultural soils. Enteric fermentation from livestock is the
largest source of emissions in this sector, followed by agricultural soils. These sources
accounted for almost 80 percent of emissions in this sector in 2010 and have been decreasing
since 2007. Manure management emissions have remained flat at 1.1 MMTCO2e since 2005.
14
For a detailed discussion of solid waste in Washington see the Washington State Department of Ecology report
Solid Waste in Washington State: 20th Annual Status Report. December 2011.
https://fortress.wa.gov/ecy/publications/publications/1107039.pdf 15
Washington State Department of Ecology. Solid Waste in Washington State: 20th Annual Status Report.
December 2011. https://fortress.wa.gov/ecy/publications/publications/1107039.pdf

13 | P a g e
Task 1 Final Report – Part 1
3 Washington’s Energy Profile
3.1.1 Production
Washington produces very few fossil fuel resources but is the Nation’s largest producer of
hydroelectric power, with much of the output coming from the Columbia and Snake Rivers.
Washington also has significant non-hydro renewable resources. The State’s western forests
offer fuel wood resources, and large areas of the State are conducive to wind power generation
and potentially conducive to geothermal power development. The high-temperature geothermal
areas in Washington have the potential to produce up to 300 MW of electric power.16
Washington is a major producer of wind energy and in 2013 ranked seventh in the U.S. in wind
capacity.17
Washington is also a substantial producer of energy from wood and wood waste,
accounting for approximately 3 percent of U.S. production.18
Wood and wood waste biomass is
primarily burned for electricity production and process steam at pulp and paper mills and is also
used for residential heating.19
Although Washington does not produce any petroleum, the state is a principal refining center
serving Pacific Northwest markets. There are five refineries in Washington that receive crude oil
supply primarily from Alaska, and increasingly from Canada and other states and countries.
Washington has one large coal-fired plant, the Centralia plant owned by TransAlta. The plant
originally used coal from the State’s only coal mine which was shut down in 2006. Coal is now
imported from Wyoming and Montana. According to the EPA’s Greenhouse Gas Reporting
Program (GHGRP), the Centralia plant emitted 5.6 MMTCO2e in 2011.20
The plant is currently
in the process of transitioning away from coal power. One of the two 670 MW coal burning
units will shut down in 2020, the other in 2025. Washington also has one nuclear plant, the
Columbia Generating Station, which generates about one-tenth of the electricity generated in the
state.21
3.1.2 Consumption
Washington consumed just over 1.5 quadrillion Btu of total energy in 2011.22
On a per capita
basis, Washington consumed about 220 million Btu in 2011. Oregon and California consumed
16
Energy Information Administration. State Profile and Energy Estimates.
http://www.eia.gov/state/analysis.cfm?sid=WA 17
American Wind Energy Association. U.S. Wind Industry First Quarter2013 Market Report.
http://awea.rd.net/Resources/Content.aspx?ItemNumber=5400 18
EIA State Energy Profile. Washington. http://www.eia.gov/state/?sid=WA 19
Washington State Department of Commerce. 2013 Biennial Energy Report. 20
EPA Greenhouse Gas Reporting Program. 2011. http://www.epa.gov/ghgreporting/ghgdata/reported/index.html 21
Although the Columbia Generating Station accounts for one-tenth of electricity generated in Washington, the
output from the plant is sold to BPA and marketed to customers throughout the Pacific Northwest, with only about
350 average megawatts actually consumed in Washington. 22
Energy Information Administration. State Energy Database, http://www.eia.gov/state/seds/. Note that EIA
converts hydroelectricity net generation from kilowatthours (kWh) to British thermal units (Btu) using the U.S.

14 | P a g e
Task 1 Final Report – Part 1
less energy per capita than Washington, at 193 and 201 million Btu per capita, respectively, in
2011. Idaho and Montana consumed more energy per capita than Washington, at 278 and 319
million Btu per capita, respectively, in 2011.
Coal, petroleum, and natural gas make up the largest share of fossil fuel consumption. In 2011,
petroleum represented 69 percent of total fossil fuel consumption, while natural gas and coal
accounted for 26 percent and 5 percent, respectively. Figure 8 shows the share of fossil fuel
consumption by fuel in 2011.23
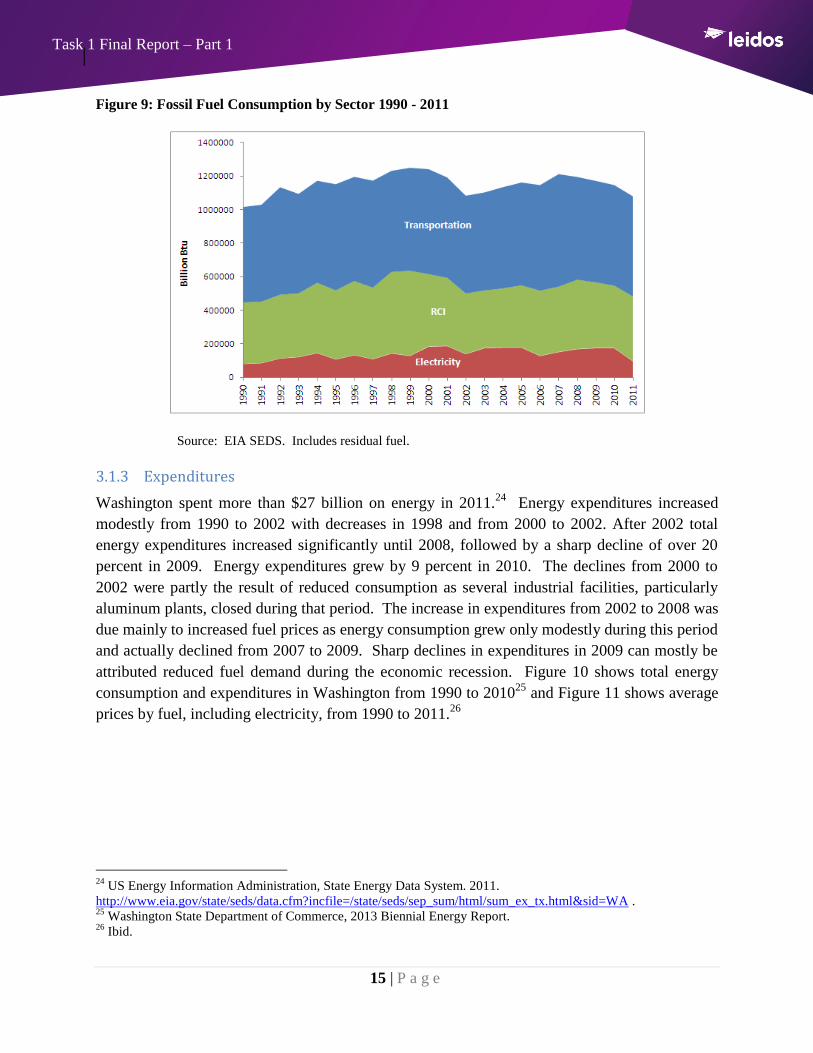
The trend in fossil fuel
consumption by sector from 1990 to 2011 is shown in
Figure 6. Consumption increased steadily from 1990
to 1999. The noticeable drop in fossil fuel
consumption from 1999 to 2002, particularly in the
RCI and Electricity sectors was primarily the result of
the closure of several energy intensive aluminum
plants during that time. The main drivers for the plant
closures were weak aluminum prices and increasing
energy prices, particularly electricity prices, which are
discussed further in section 6. Fossil fuel consumption
showed another steady increase from 2002 to 2008
following general trends in energy demand. The
decrease in fossil fuel consumption after 2008, particularly in the transportation and RCI sectors,
is largely due to a decrease in demand for energy during the global economic crisis. Fossil fuel
consumption in the electricity sector is highly dependent on hydroelectricity production. When
hydroelectricity output is low, more power is imported from out of state, some of which is fossil
fuel power. Fossil fuel use in the electricity sector showed a sharp decline in 2011 due in part to
an increase in renewable electricity production, particularly wind power.
average heat content of fossil fuels consumed at steam-electric power plants as a conversion factor. In this analysis
hydroelectricity is converted from kWh to Btu by applying the constant conversion factor of 3,412 Btu/kWh to
remain consistent with the approach Washington State (and the international community) uses to calculate
hydroelectricity consumption. 23
EIA SEDS. Note that this data includes fossil fuels consumed in all sectors, including the electric power sector,
within the state. Emissions from the electric power sector are calculated on a net consumption basis and include
emissions from electricity that is consumed in the state, but that may have been generated by fossil fuels consumed
by generators outside the state. See Section 6 for a more detailed analysis of the Electric Power sector.
Figure 8: Share of Fossil Fuel
Consumption
15 | P a g e
Task 1 Final Report – Part 1
Figure 9: Fossil Fuel Consumption by Sector 1990 - 2011
Source: EIA SEDS. Includes residual fuel.
3.1.3 Expenditures
Washington spent more than $27 billion on energy in 2011.24
Energy expenditures increased
modestly from 1990 to 2002 with decreases in 1998 and from 2000 to 2002. After 2002 total
energy expenditures increased significantly until 2008, followed by a sharp decline of over 20
percent in 2009. Energy expenditures grew by 9 percent in 2010. The declines from 2000 to
2002 were partly the result of reduced consumption as several industrial facilities, particularly
aluminum plants, closed during that period. The increase in expenditures from 2002 to 2008 was
due mainly to increased fuel prices as energy consumption grew only modestly during this period
and actually declined from 2007 to 2009. Sharp declines in expenditures in 2009 can mostly be
attributed reduced fuel demand during the economic recession. Figure 10 shows total energy
consumption and expenditures in Washington from 1990 to 201025
and Figure 11 shows average
prices by fuel, including electricity, from 1990 to 2011.26
24
US Energy Information Administration, State Energy Data System. 2011.
http://www.eia.gov/state/seds/data.cfm?incfile=/state/seds/sep_sum/html/sum_ex_tx.html&sid=WA . 25
Washington State Department of Commerce, 2013 Biennial Energy Report. 26
Ibid.

16 | P a g e
Task 1 Final Report – Part 1
Figure 10: Total Energy Consumption and Expenditures, 1990 - 2010
Source: 2013 Biennial Energy Report. Expenditures in billion 2005 dollars.
Figure 11: Price by Fuel, 1990 - 2010
Source: EIA SEDS. Current Dollars.
Washington’s total energy expenditure per capita is similar to that of neighboring states, except
for Montana whose population spends significantly more on energy per person than Washington.
Figure 12 shows total per capita energy expenditures for Washington, Oregon, Idaho, Montana,
and California from 1990 to 2011. Oregon and Idaho show slightly larger, although very similar,
per capita energy expenditures to Washington, while California is slightly lower over the time

17 | P a g e
Task 1 Final Report – Part 1
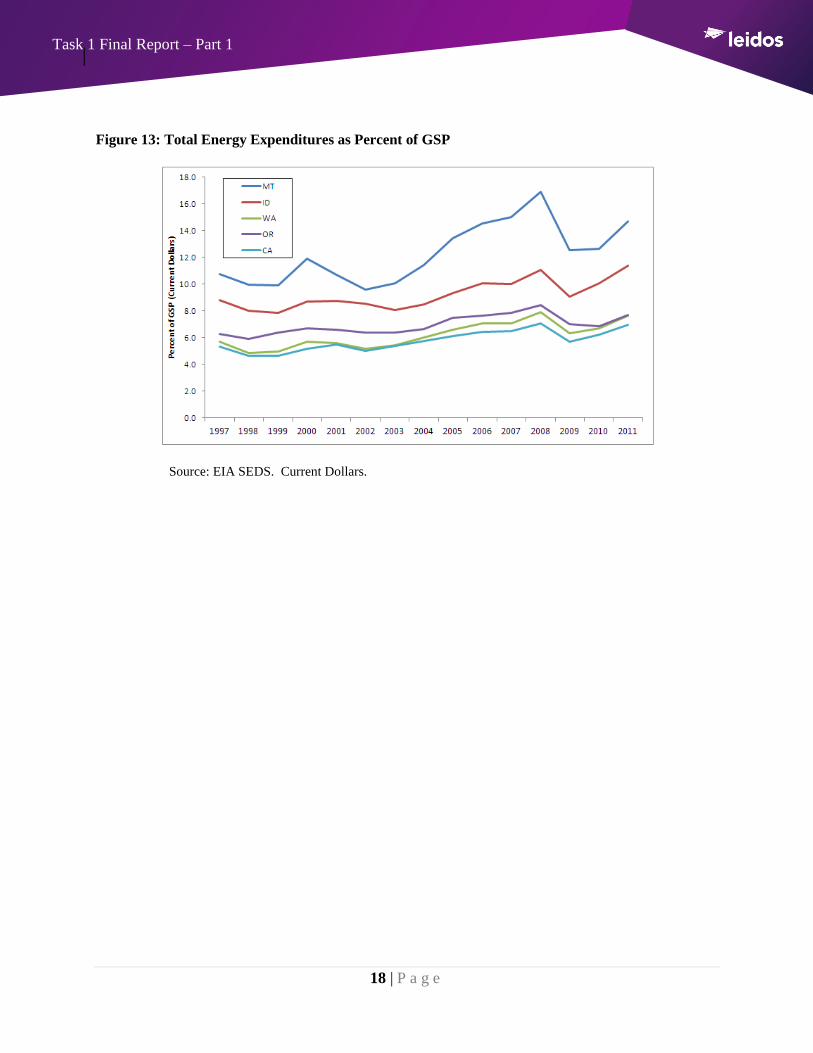
period.27
Figure 10 shows energy expenditures as percent of Gross State Product (GSP) for
Washington, Oregon, Idaho, Montana, and California from 1997 to 2011.28
Figure 12: Total Per Capita Energy Expenditures by State
Source: EIA SEDS. Current Dollars.
27
Expenditures are based on data from EIA and represent estimates of money spent directly by consumers to
purchase energy, generally including taxes. Tax rates for fuels vary among the states. For example, Washington’s
gasoline and diesel fuel taxes are higher than those in Oregon, Idaho, and Montana. Source: Federation of Tax
Administrators. January 2013. http://www.taxadmin.org/fta/rate/mf.pdf. 28
This data is presented from 1997 because there is a discontinuity in the GSP by state time series at 1997, where
the data changes from Standard Industrial Classification (SIC) industry definitions to North American Industry
Classification System (NAICS) industry definitions.
18 | P a g e
Task 1 Final Report – Part 1
Figure 13: Total Energy Expenditures as Percent of GSP
Source: EIA SEDS. Current Dollars.

19 | P a g e
Task 1 Final Report – Part 1
4 Transportation Sector
4.1.1 Consumption
The transportation sector is the largest energy consuming sector in Washington and the largest
source of GHG emissions. Figure 14 shows the share of consumption by fuel in the
transportation sector from 1990 to 2011. Motor gasoline, diesel, and aviation fuel (aviation
gasoline and jet fuel) accounted for 90 percent of fossil fuel consumption in the transportation
sector in 2011, with motor gasoline accounting for the largest share at over 54 percent. Residual
fuel, which accounted for 8 percent of consumption in 2011, is not included in this chart. Bunker
fuel makes up the majority of residual fuel used for transportation and consumption is highly
variable depending on marine traffic at Washington ports.29
Figure 14: Transportation Consumption by Fuel, 1990 - 2011
Source: EIA SEDS. Other includes lubricants, LPG, electricity, natural gas and coal.
Washington is a major consumer of aviation fuel and is home to several military bases. Aviation
fuel consumption has dropped more than 20 percent since 2000, mostly due to changes in
commercial transportation patterns and more efficient aircraft engines. Motor gasoline
consumption remained relatively flat from 2000 to 2011 following a period of rapid growth from
1990 to 2000. Diesel consumption shows a period of significant growth from 2006 to 2007
followed by a sharp decline through 2010. Diesel fuel consumption increased 9 percent in 2011.
Interestingly, gasoline consumption declined only minimally, by just over 1 percent, during the
height of the economic recession, from 2008 to 2009, which is in contrast to the trend in diesel
29
Washington State Department of Commerce, 2013 Biennial Energy Report,
www.commerce.wa.gov/Documents/2013-biennial-energy-report.pdf. Also note that residual fuel consumption
includes both fuel consumed on ships and fuel transported by ships, complicating the allocation of emissions from
this fuel.

20 | P a g e
Task 1 Final Report – Part 1
consumption, which declined by almost 13 percent during that period. Statewide fuel
consumption models prepared by the Washington State Department of Transportation show that
diesel consumption has a strong positive correlation to the rate of Washington real personal
income which helps to explain the decline in consumption during the period of reduced personal
income.30
Washington’s per capita on-road (gasoline and diesel) fuel consumption is the second lowest in
the region after California. Per capita on-road fuel consumption remained relatively steady from
1990 to 2007 followed by an average annual decrease of 3.3 percent from 2007 to 2010 and
increased 0.3 percent in 2011. Figure 12 shows per capita on-road fuel consumption for
Washington and neighboring states from 1990 to 2011.
Figure 15: Per Capita On-Road (Gasoline and Diesel) Fuel Consumption 1990 - 2011
Source: EIA SEDS. Based on resident population including Armed Forces.
4.1.2 Expenditures
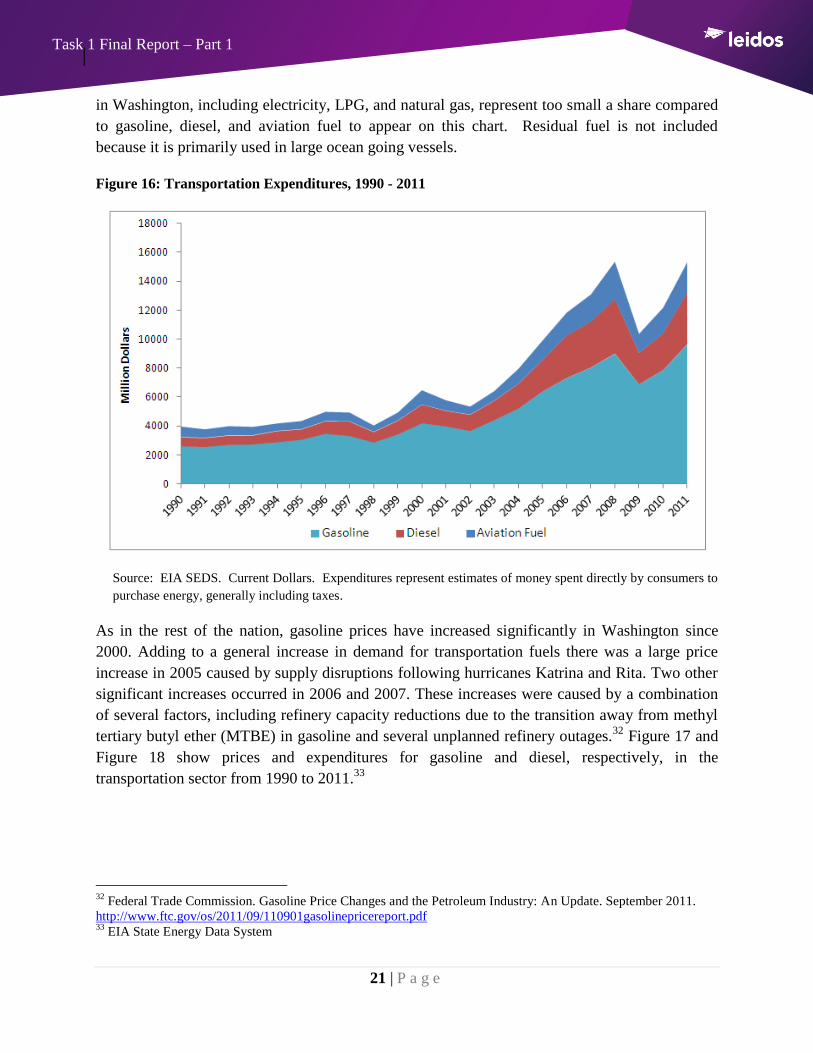
The transportation sector accounts for the largest share of energy expenditures in Washington
(58 percent in 2010).31
The largest energy expenditures in the transportation sector are for motor
gasoline, followed by diesel fuel and aviation fuel. Figure 16 shows expenditures for these fuels
in the transportation sector from 1990 through 2011. Other fuels used in the transportation sector
30
Washington State Department of Transportation. Statewide Fuel Consumption Forecast Models. 31
2013 Biennial Energy Report. http://www.commerce.wa.gov/Documents/2013-biennial-energy-report.pdf
21 | P a g e
Task 1 Final Report – Part 1
in Washington, including electricity, LPG, and natural gas, represent too small a share compared
to gasoline, diesel, and aviation fuel to appear on this chart. Residual fuel is not included
because it is primarily used in large ocean going vessels.
Figure 16: Transportation Expenditures, 1990 - 2011
Source: EIA SEDS. Current Dollars. Expenditures represent estimates of money spent directly by consumers to
purchase energy, generally including taxes.
As in the rest of the nation, gasoline prices have increased significantly in Washington since
2000. Adding to a general increase in demand for transportation fuels there was a large price
increase in 2005 caused by supply disruptions following hurricanes Katrina and Rita. Two other
significant increases occurred in 2006 and 2007. These increases were caused by a combination
of several factors, including refinery capacity reductions due to the transition away from methyl
tertiary butyl ether (MTBE) in gasoline and several unplanned refinery outages.32
Figure 17 and
Figure 18 show prices and expenditures for gasoline and diesel, respectively, in the
transportation sector from 1990 to 2011.33
32
Federal Trade Commission. Gasoline Price Changes and the Petroleum Industry: An Update. September 2011.
http://www.ftc.gov/os/2011/09/110901gasolinepricereport.pdf 33
EIA State Energy Data System

22 | P a g e
Task 1 Final Report – Part 1
Figure 17: Gasoline Prices and Expenditures, 1990 - 2011
Source: EIA SEDS. Current Dollars. Expenditures represent estimates of money spent directly by consumers to
purchase energy, generally including taxes.
Figure 18: Diesel Prices and Expenditures, 1990 - 2011
Source: EIA SEDS. Current Dollars. Expenditures represent estimates of money spent directly by consumers to
purchase energy, generally including taxes.

23 | P a g e
Task 1 Final Report – Part 1
5 Residential Commercial Industrial (RCI) Sector
Washington’s GHG Inventory categorizes the residential, commercial, and industrial sectors into
one energy consuming group referred to as the RCI sector. This sector consumes fuel and
electricity primarily for heating and cooling buildings and for industrial activities. This analysis
explores each sector individually as each has unique trends relating to energy consumption and
expenditures. The analysis focuses on fossil fuel consumption as this is the source of GHG
emissions in the RCI sector. The main fossil fuels consumed in the sector are petroleum and
natural gas. A small amount of coal is consumed in the industrial sector. Electricity
consumption is also included because it makes up a significant share of energy consumption in
each sector; however, emissions associated with electricity consumption are accounted for in the
electricity sector which is treated as a separate energy consuming sector. See Section 6 for a
more detailed analysis of the electricity sector.
5.1.1 Residential
The majority of energy consumption in the residential sector in Washington is from electricity,
followed by natural gas. Electricity accounted for 55 percent of residential energy consumption
in 2011 while natural gas accounted for 39 percent. A small amount of petroleum is used, about
6 percent, which consists mostly of fuel oil for home heating. A very small amount of coal was
consumed in the residential sector until 2004. Energy consumption in the residential sector has
been increasing steadily since 1990, with a noticeable decline in consumption in 2002.
Consumption increased steadily through 2009 then decreased 6 percent in 2010 followed by a 5
percent increase in 2011. Figure 19 shows the share of fuel consumption in the residential sector
in 2011 and consumption by fuel in the sector from 1990 to 2011.
Figure 19: Residential Fuel Share in 2010 and Consumption by Fuel, 1990 – 2011
Source: EIA SEDS.

24 | P a g e
Task 1 Final Report – Part 1
Expenditures for fuels in the residential sector increased steadily from 1990 through 2000 and
then sharply from 2000 to 2009. A notable spike in expenditures for natural gas and electricity
occurred in the early 2000’s. Some year-over-year consumption and expenditure changes result
from above or below average temperatures that increase building heating and cooling demands,
which affect regional supply and therefore price. Natural gas expenditures decreased
significantly in 2010, by 21 percent, then increased 14 percent in 2011. Electricity expenditures
increased by 7 percent in 2011. Figure 16 shows expenditures by fuel in the residential sector
from 1990 to 2011. Figure 17 shows prices in the residential sector, by fuel, from 1990 to
2011.34
Figure 20: Residential Expenditures by Fuel, 1990 - 2011
Source: EIA SEDS. Current Dollars. Expenditures represent estimates of money spent directly by
consumers to purchase energy, generally including taxes. Coal represents a very small portion of
residential energy expenditures.
34
Coal is not shown as it accounts for an insignificant portion of consumption in the residential sector

25 | P a g e
Task 1 Final Report – Part 1
Figure 21: Residential Prices by Fuel, 1990 - 2011
Source: EIA SEDS. Current dollars.
5.1.2 Commercial
Energy consumption in the commercial sector is primarily for heating and cooling buildings.
Energy consumption follows a pattern similar to the residential sector. The principal fuel
consumed is electricity, followed by natural gas. However, the commercial sector consumes less
total energy than the residential sector. Figure 18 shows the share of fuel consumption in the
commercial sector in 2011 and consumption by fuel in the sector from 1990 to 2011.
Figure 22: Commercial Fuel Share in 2010 and Consumption by Fuel, 1990 – 2011
Source: EIA SEDS.

26 | P a g e
Task 1 Final Report – Part 1
Energy expenditures in the commercial sector show a similar trend as the residential sector.
There was a 21 percent decrease in natural gas expenditures in 2010 followed by a 9 percent
increase in 2011. Expenditures on electricity in the commercial sector increased almost 4
percent in 2011. Figure 23 shows expenditures by fuel in the commercial sector from 1990 to
2011. Figure 24 shows prices in the commercial sector, by fuel, from 1990 to 2011.35
Figure 23: Commercial Expenditures by Fuel, 1990 - 2011
Source: EIA SEDS. Current Dollars. Expenditures represent estimates of money spent directly by
consumers to purchase energy, generally including taxes. Coal represents a very small portion of
residential energy expenditures.
35
Coal is not shown as it accounts for an insignificant portion of consumption in the commercial sector.

27 | P a g e
Task 1 Final Report – Part 1
Figure 24: Commercial Prices by Fuel
Source: EIA SEDS. Current dollars.
5.1.3 Industrial
A large portion of energy consumption in the industrial sector in Washington is from refining.
Although Washington does not produce any crude oil, it is a major refining center in the
Northwest. Washington is home to five refineries and ranked sixth in the Nation in crude oil
refining capacity in 2011.36
The industrial sector consumes a larger amount of energy than either
the residential or commercial sectors. This sector also has a much different fuel mix and
consumption trend. Figure 20 shows the energy consumption for the industrial, residential, and
commercial sectors from 1990 to 2011.
36
EIA State Energy Profiles. http://www.eia.gov/state/?sid=WA#tabs-5

28 | P a g e
Task 1 Final Report – Part 1
Figure 25: Energy Consumption in the Industrial, Residential, and Commercial Sectors 1990 - 2011
Source: EIA SEDS.
Petroleum had the largest share of consumption in the industrial sector in 2011 at 44 percent,
followed by electricity at 31 percent and natural gas at 25 percent. The industrial sector also
consumes a small amount of coal representing less than 1 percent of total consumption in the
sector in 2011. Energy consumption in the industrial sector was relatively flat from 1990 to
1997. Consumption rose sharply from 1997 to 1999, and then decreased dramatically until 2004.
As discussed previously, this large decrease was due to the closure of several energy intensive
aluminum plants in the state during this time period. Consumption increased moderately through
2006 followed by an average decrease of 0.4 percent through 2010 and an increase of 1.8 percent
in 2011. Figure 26 shows the share of fuel consumption in the industrial sector in 2011 and
consumption by fuel in the sector from 1990 to 2011.
Figure 26: Industrial Fuel Share in 2010 and Consumption by Fuel, 1990 - 2011
Source: EIA SEDS.
29 | P a g e
Task 1 Final Report – Part 1
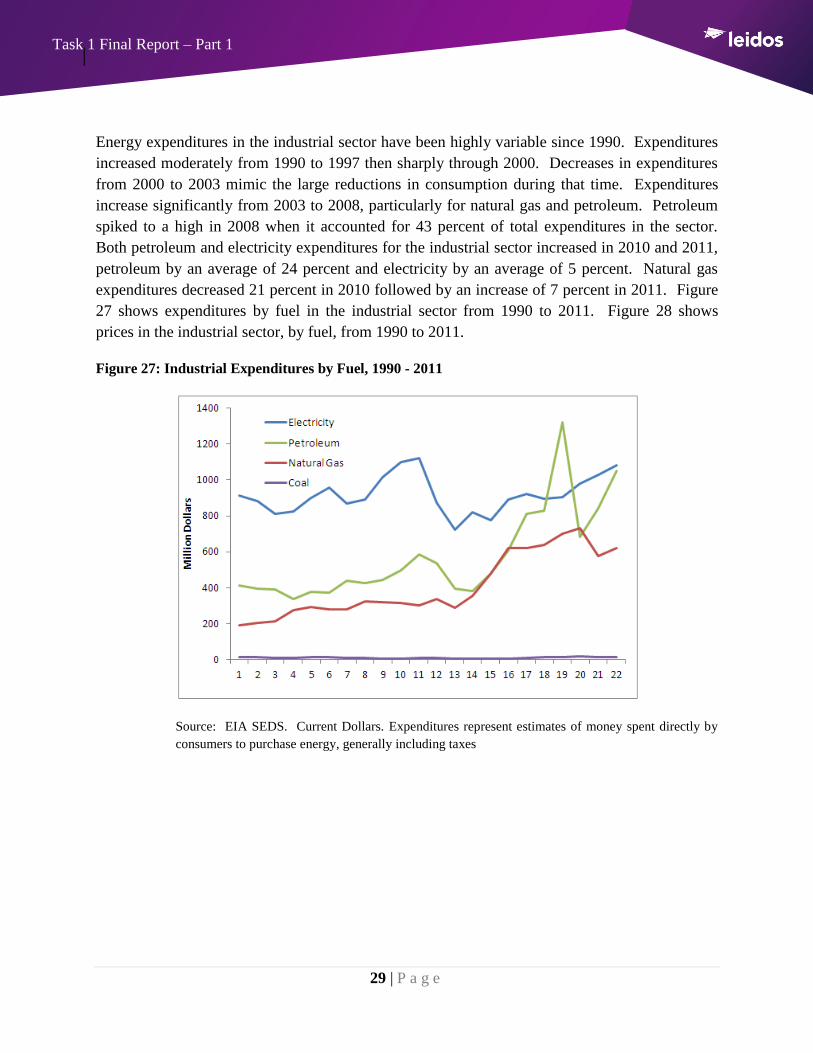
Energy expenditures in the industrial sector have been highly variable since 1990. Expenditures
increased moderately from 1990 to 1997 then sharply through 2000. Decreases in expenditures
from 2000 to 2003 mimic the large reductions in consumption during that time. Expenditures
increase significantly from 2003 to 2008, particularly for natural gas and petroleum. Petroleum
spiked to a high in 2008 when it accounted for 43 percent of total expenditures in the sector.
Both petroleum and electricity expenditures for the industrial sector increased in 2010 and 2011,
petroleum by an average of 24 percent and electricity by an average of 5 percent. Natural gas
expenditures decreased 21 percent in 2010 followed by an increase of 7 percent in 2011. Figure
27 shows expenditures by fuel in the industrial sector from 1990 to 2011. Figure 28 shows
prices in the industrial sector, by fuel, from 1990 to 2011.
Figure 27: Industrial Expenditures by Fuel, 1990 - 2011
Source: EIA SEDS. Current Dollars. Expenditures represent estimates of money spent directly by
consumers to purchase energy, generally including taxes

30 | P a g e
Task 1 Final Report – Part 1
Figure 28: Industrial Prices by Fuel, 1990 - 2011
Source: EIA SEDS. Current dollars.

31 | P a g e
Task 1 Final Report – Part 1
6 Electricity Sector
6.1.1 Consumption
According to the Washington State GHG Inventory for 2010 the electricity sector accounts for
the second largest amount of emissions after the transportation sector with 22 percent of total
emissions. Although the vast majority of electricity generated within the state is from
hydropower, Washington imports a significant amount of electricity from other states to meet
demand. Some of this electricity is generated with fossil fuel and therefore there are GHG
emissions associated with its use. The GHG emissions for the electricity sector were calculated
using a load based, or net consumption, method. A load-based method includes emissions from
all electric power generation used to meet demand for electricity in Washington, regardless of
where the generating plant is located or what fuel was used to produce the electricity. Beginning
in 2000 Washington has tracked sales of electricity by generating resource for each electric
utility in the state under legislative action known as the Fuel Mix Disclosure (FMD). The FMD
provides a statewide picture of all the energy sources used to generate electricity consumed in
the state. This analysis of energy consumption for the electricity sector relies heavily on the
FMD because this data is reported directly from utilities and represents a complete account of
fuel consumption in the sector. Some of the analysis in this section uses a time period of 2000 –
2012 because that is the time period for which FMD data were available.
Energy consumption in the electric power sector dropped sharply after 2000 following a
statewide trend of reduced energy consumption resulting from a reduction in industrial activity
during that time. Consumption in the sector has grown at an average annual rate of 1.7 percent
since 2001. Figure 29 shows total consumption in the electricity sector by fuel from 2000 to
2012.37
Figure 30 shows the share of fuels in the electricity sector in 2012.38
37
Washington State Department of Commerce. Fuel Mix Disclosure.
http://www.commerce.wa.gov/Programs/Energy/Office/Utilities/Pages/FuelMix.aspx 38
Ibid.

32 | P a g e
Task 1 Final Report – Part 1
Figure 29: Electricity Sector Consumption by Fuel 2000 – 2012
Source: Washington State Department of Commerce. Fuel Mix Disclosure.
http://www.commerce.wa.gov/Programs/Energy/Office/Utilities/Pages/FuelMix.aspx. Other includes: blast
furnace gas, other biomass gas such as digester gas and methane, and purchased steam.
Figure 30: Share of Fuels in the Electricity Sector 2012
Source: Washington State Fuel Mix Disclosure 2012.
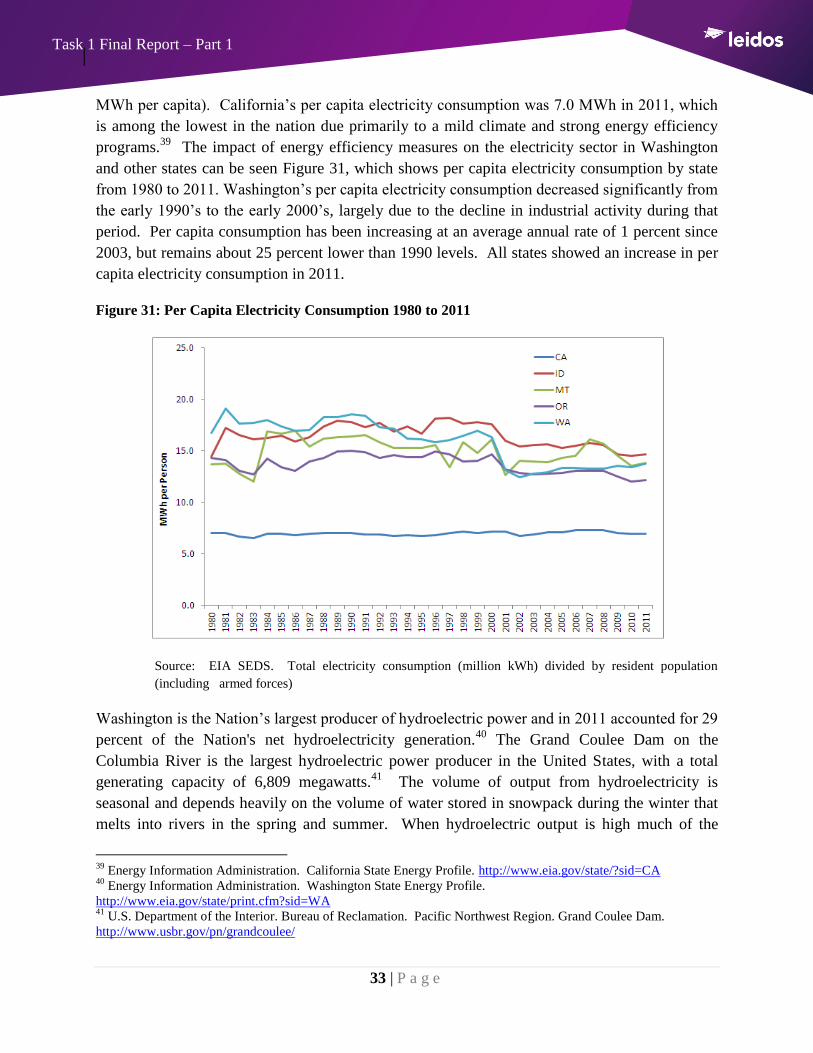
Washington consumed 13.7 MWh of electricity per capita in 2011, slightly less than Idaho and
Montana (14.7 and 13.8 MWh per capita, respectively) and slightly more than Oregon (12.2
33 | P a g e
Task 1 Final Report – Part 1
MWh per capita). California’s per capita electricity consumption was 7.0 MWh in 2011, which
is among the lowest in the nation due primarily to a mild climate and strong energy efficiency
programs.39
The impact of energy efficiency measures on the electricity sector in Washington
and other states can be seen Figure 31, which shows per capita electricity consumption by state
from 1980 to 2011. Washington’s per capita electricity consumption decreased significantly from
the early 1990’s to the early 2000’s, largely due to the decline in industrial activity during that
period. Per capita consumption has been increasing at an average annual rate of 1 percent since
2003, but remains about 25 percent lower than 1990 levels. All states showed an increase in per
capita electricity consumption in 2011.
Figure 31: Per Capita Electricity Consumption 1980 to 2011
Source: EIA SEDS. Total electricity consumption (million kWh) divided by resident population
(including armed forces)
Washington is the Nation’s largest producer of hydroelectric power and in 2011 accounted for 29
percent of the Nation's net hydroelectricity generation.40
The Grand Coulee Dam on the
Columbia River is the largest hydroelectric power producer in the United States, with a total
generating capacity of 6,809 megawatts.41
The volume of output from hydroelectricity is
seasonal and depends heavily on the volume of water stored in snowpack during the winter that
melts into rivers in the spring and summer. When hydroelectric output is high much of the
39
Energy Information Administration. California State Energy Profile. http://www.eia.gov/state/?sid=CA 40
Energy Information Administration. Washington State Energy Profile.
http://www.eia.gov/state/print.cfm?sid=WA 41
U.S. Department of the Interior. Bureau of Reclamation. Pacific Northwest Region. Grand Coulee Dam.
http://www.usbr.gov/pn/grandcoulee/
34 | P a g e
Task 1 Final Report – Part 1
excess power is exported out of state. However, when the capability of hydroelectric power is
reduced the energy is largely replaced with generation from fossil fuels.42
Hydropower
production in the Pacific Northwest is depends largely on natural water storage in snow pack and
glaciers. The amount of water available that is available for hydropower production is sensitive
to changes in climate, for example, when water storage is reduced due to changes in precipitation
or warmer temperatures, hydropower production is reduced.
The principal fossil fuels used for generation of electricity that is ultimately consumed in
Washington, and the main source of GHG emissions in the sector, are coal and natural gas. Coal
has accounted for 60 percent of fossil fuel consumption for electricity generation, on average,
across the time period and accounted for 62 percent in 2012. Natural gas represents an average
of 39 percent of fossil fuel consumption for electricity generation and accounted for 38 percent
in 2010. Petroleum accounts for a very small portion of consumption and has remained well
below 1 percent of total fossil fuel consumption for electricity generation over the time period,
except for 2000 and 2001 when it represented just below 2 percent of consumption.
Fossil fuel consumption for electricity generation increased in 2010 due to drought conditions
that reduced hydropower output. Since then, fossil fuel consumption has declined significantly
in response to increasing hydropower consumption as well as increased consumption of nuclear
power and wind power. Figure 32 shows fossil fuel consumption in the Electricity Sector from
2000 to 2012.43
42
Some demand is replaced with nuclear power. 43
Washington State Department of Commerce. Fuel Mix Disclosure.
http://www.commerce.wa.gov/Programs/Energy/Office/Utilities/Pages/FuelMix.aspx

35 | P a g e
Task 1 Final Report – Part 1
Figure 32: Electricity Sector Fossil Fuel Consumption
Source: Washington State Fuel Mix Disclosure 2012.
Emissions in the electric power sector result from the consumption of fossil fuels used to
generate electricity. Figure 33 shows the total electricity consumption produced by fossil fuels
and non-fossil fuels compared to emissions from 2005 to 2010.
Figure 33: Electricity Sector Consumption of Fossil and Non-Fossil Fuels and Emissions
Sources: WA Fuel Mix Disclosure and WA GHG Inventory 1990 -2010
36 | P a g e
Task 1 Final Report – Part 1
Although 2010 is the latest year that GHG inventory data is available for Washington, the state
will almost certainly see reduced emissions in the electricity sector in 2011 and 2012 due to
reduced fossil fuel consumption. The reduction in fossil consumption is primarily the result of
increased hydropower production and rapidly increasing production of wind power, most of
which is produced in the state. Washington was an early leader in the wind industry and ranked
seventh in the nation for installed capacity in early 2013.44
Washington’s first utility-scale wind
project went online in 2001, and wind power development has continued to grow, particularly in
the Columbia Gorge region. Washington consumed over 3 million MWh of electricity from
wind power sources in 2012, accounting for 3.3 percent of total electricity consumption.45
6.1.2 Expenditures
Expenditures in the electricity sector are driven by fossil fuels prices, particularly coal and
natural gas prices. Regional natural gas prices in the electricity sector spiked in 2001 because
shortages in hydroelectricity resulted in high demand for natural gas.46
Prices decreased sharply
in 2002 followed by significant increases through 2008. Prices for natural gas fell sharply in
2009 during the economic recession, but began to increase again in 2010. Natural gas prices
remain low partly due to the growth of production from nonconventional sources. Average price
trends for coal are similar to natural gas, but the price swings have been less dramatic. Figure 34
shows prices and expenditures for natural gas from 1990 to 2011 and Figure 35 shows prices and
expenditures for coal from 1990 to 2011.47
44
American Wind Energy Association. U.S. Wind Industry First Quarter2013 Market Report.
http://awea.rd.net/Resources/Content.aspx?ItemNumber=5400 45
Washington State Fuel Mix Disclosure 2012. 46
2013 Biennial Energy Report. http://www.commerce.wa.gov/Documents/2013-biennial-energy-report.pdf 47
Energy Information Administration. State Energy Data System. http://www.eia.gov/state/seds/

37 | P a g e
Task 1 Final Report – Part 1
Figure 34: Electricity Sector Prices and Expenditures for Natural Gas
Source: EIA SEDS. Current dollars. Expenditures represent estimates of money spent directly by
consumers to purchase energy, generally including taxes
Figure 35: Electricity Sector Prices and Expenditures for Coal
Source: EIA SEDS. Current dollars. Expenditures represent estimates of money spent directly by
consumers to purchase energy, generally including taxes