technology development prospects for the indian · pdf filetechnology development prospects...
TRANSCRIPT
Uwe Remme, Nathalie tRUdeaU, dagmaR gRaczyk aNd PeteR tayloR
INFORMATION PAPER
TECHNOLOGY DEVELOPMENT PROSPECTS FOR THE INDIAN POWER SECTOR
2011 February


Uwe Remme, Nathalie tRUdeaU, dagmaR gRaczyk aNd PeteR tayloR
INFORMATION PAPER
TECHNOLOGY DEVELOPMENT PROSPECTS FOR THE INDIAN POWER SECTOR
2011 February
This information paper was prepared for the Energy Technology Perspective Project of the International Energy Agency (IEA). It was drafted by the Energy Technology Policy Division of the International Energy Agency (IEA).
This paper reflects the views of the IEA Secretariat, but does not necessarily reflect those of individual IEA member countries. For further information, please contact Uwe Remme at [email protected]

INTERNATIONAL ENERGY AGENCY
The International Energy Agency (IEA), an autonomous agency, was established in November 1974. Its primary mandate was – and is – two-fold: to promote energy security amongst its member countries through collective response to physical disruptions in oil supply, and provide authoritative
research and analysis on ways to ensure reliable, affordable and clean energy for its 28 member countries and beyond. The IEA carries out a comprehensive programme of energy co-operation among its member countries, each of which is obliged to hold oil stocks equivalent to 90 days of its net imports. The Agency’s aims include the following objectives:
n Secure member countries’ access to reliable and ample supplies of all forms of energy; in particular, through maintaining effective emergency response capabilities in case of oil supply disruptions.
n Promote sustainable energy policies that spur economic growth and environmental protection in a global context – particularly in terms of reducing greenhouse-gas emissions that contribute to climate change.
n Improve transparency of international markets through collection and analysis of energy data.
n Support global collaboration on energy technology to secure future energy supplies and mitigate their environmental impact, including through improved energy
efficiency and development and deployment of low-carbon technologies.
n Find solutions to global energy challenges through engagement and dialogue with non-member countries, industry, international
organisations and other stakeholders. IEA member countries:
Australia Austria
Belgium Canada
Czech RepublicDenmark
Finland France
GermanyGreece
HungaryIreland
ItalyJapan
Korea (Republic of)LuxembourgNetherlandsNew Zealand NorwayPolandPortugalSlovak RepublicSpainSwedenSwitzerland
TurkeyUnited Kingdom
United States
The European Commission also participates in
the work of the IEA.
Please note that this publication is subject to specific restrictions that limit its use and distribution.
The terms and conditions are available online at www.iea.org/about/copyright.asp
© OECD/IEA, 2011International Energy Agency
9 rue de la Fédération 75739 Paris Cedex 15, France
www.iea.org

© OECD/IEA 2011 Technology Development Prospects for the Indian Power Sector
Page | 3
Table of Contents Acknowledgements ........................................................................................................................ 5
Executive summary......................................................................................................................... 7
Introduction .................................................................................................................................. 11
Chapter 1: Overview of current situation ..................................................................................... 13
Global context ....................................................................................................................... 13
The Indian context ................................................................................................................. 14
Power sector .......................................................................................................................... 19
Resource availability .............................................................................................................. 25
Chapter 2: India energy technology strategies and development activities ................................ 41
India’s energy policies ........................................................................................................... 41
India’s current and planned technology development activities ............................................ 46
Chapter 3: Power sector scenarios in India .................................................................................. 59
Electricity demand projections .............................................................................................. 59
Power capacity and generation projections .......................................................................... 61
Scenario variants for the Indian power sector ...................................................................... 64
Investment needs .................................................................................................................. 66
Conclusions: Towards a power sector decarbonisation strategy ............................................ 68
Annex A: Regional results of the BLUE Map Scenario ................................................................... 71
Annex B: The IEA power sector model for India ........................................................................... 73
Annex C: Abbreviations and units ................................................................................................. 75
Annex D: References ..................................................................................................................... 79
List of figures
Figure ES.1: Contribution of emission reduction options on a global level, 2010‐50 ..................... 11 Figure 1.1: Reduction of CO2 emissions in the BLUE Map Scenario by sector, 2010‐50 ................ 13 Figure 1.2: Total primary energy supply in India ............................................................................ 16 Figure 1.3: Total final energy consumption in India ....................................................................... 16 Figure 1.4: Final electricity demand in India by sector and by region in 2006/07 .......................... 18 Figure 1.5: India’s electricity use breakdown in commercial and residential buildings ................. 18 Figure 1.6: Development of total installed capacity in India .......................................................... 20 Figure 1.7: Age structure of existing power capacity ..................................................................... 20 Figure 1.8: India’s electrical generation capacity and gross generation, 2007/08 ......................... 21 Figure 1.9: Transmission capacities among India’s five regional grids at the end of 2008............. 24 Figure 1.10: Major coalfields and mining centres in India .............................................................. 27 Figure 1.11: Regional distribution of CO2 storage potentials in geographical model analysis ....... 30 Figure 1.12: Regional distribution of existing hydropower capacity and remaining resources ............ 33 Figure 1.13: Regional distribution of India’s onshore wind resources ........................................... 37 Figure 1.14: Regional distribution of geothermal resources .......................................................... 38 Figure 2.1: Possible scenario for electricity generation mix in India’s Integrated Energy Policy ... 46
Technology Development Prospects for the Indian Power Sector © OECD/IEA 2011
Page | 4
Figure 2.2: Regional distribution of existing coal capacity in India and planned UMPPs ............... 47 Figure 2.3: Regional distribution of existing gas capacity in India .................................................. 50 Figure 2.4: Existing and planned nuclear capacity in India ............................................................. 51 Figure 2.5: Existing and planned nuclear capacity in India ............................................................. 53 Figure 2.6: Existing biomass capacity in India ................................................................................. 54 Figure 2.7: Existing wind capacity in India ...................................................................................... 55 Figure 3.1: Electricity demand projections 2007‐50 ....................................................................... 60 Figure 3.2: Power capacities by region in the BLUE Map Scenario, 2050 ....................................... 63 Figure 3.3: Electricity demand projections for India in the power sector variants, 2007‐2050 ..... 65 Figure B.1: Map of India showing simulation model structure ...................................................... 73 Figure B.2: Map of India: distances in kilometres ........................................................................... 74
List of tables
Table 1.1: High‐level energy indicators for the world and four regions, 2007 ............................... 15 Table 1.2: Indian renewable power generation capacities, 31 March 2010 .................................. 22 Table 1.3: Proven fossil energy reserves in India, China, OECD Europe, the United States and the world ..................................................................................................... 26 Table 1.4: Renewable energy resource potentials ......................................................................... 32 Table 1.5: Wastelands suitable for energy production in India, 200 .............................................. 35 Table 1.6: Residual biomass availability .......................................................................................... 36 Table 2.1: Original and likely new capacity additions for utilities in the 11th Five‐Year Plan ......... 45 Table 3.1: Comparison of GDP projections for India ...................................................................... 59 Table 3.2: Residential electricity demand in India and emerging economies with similar climate in Asia .............................................................................................................. 60 Table 3.3: Final electricity demand breakdown and projection for BLUE Map Scenario ............... 61 Table 3.4: India power generation capacity in the ETP 2010 Scenarios, 2050 ............................... 62 Table 3.5: India power generation capacity in the ETP 2010 variants, 2050 .................................. 66 Table 3.6: Power sector investment needs in India in Baseline and BLUE Map Scenarios ............ 67 Table 3.6: Power sector investment needs in India in Baseline and BLUE Map Scenarios ............ 71
List of boxes
Box ES.1: Scenarios for the power sector ........................................................................................ 7 Box 1: Space cooling technologies and their use ........................................................................... 19 Box 2: Cost of coal imports vs. indigenous supply ......................................................................... 29
Box 3: National missions within the National Action Plan on Climate Change .............................. 43
Box 4: A future for ultra‐clean coal in India? ................................................................................. 48 Box 5: Air cooling: an option for India? .......................................................................................... 64

© OECD/IEA 2011 Technology Development Prospects for the Indian Power Sector
Page | 5
Acknowledgements This paper was prepared by staff of the International Energy Agency’s Directorate of Sustainable Energy Policy and Technology in collaboration with the Directorate of Global Energy Dialogue.
A number of Indian experts have contributed significantly to the improvement of the data and analysis presented in this paper. The IEA is grateful for the contribution of the India Energy Technology Perspectives Expert Group, and wishes to thank the then Secretary, Ministry of Power, H. S. Brahma, for establishing the India Energy Technology Expert Group to work with IEA in the preparation for Energy Technology Perspectives 2010 (ETP 2010) (IEA, 2010a).
The expert group provided invaluable insights to our team for this analysis. The IEA wish to thank for their important contributions; S.M. Dhiman, Member (Planning), Central Electricity Authority, chairman of the Expert group; I.C.P. Keshari, Joint Secretary, Ministry of Power, chairman of the power sub‐group; Dr. Ajay Mathur, Director General, Bureau of Energy Efficiency, chairman of the buildings sub‐group; V. Raghuraman, Chief Adviser, Jaguar Overseas Ltd, chairman of the industry sub‐group; Dilip Chenoy, Director General, SIAM, chairman of the transportation sub‐group; Amarjeet Singh, Chief Engineer, CEA (C&E); A. S. Bakshi, Chief Engineer, CEA ; Anita Gahlot, Deputy Director, CEA; and the convener and members of the sub‐working groups:
Sub‐Group for power sector: A.S. Bakshi, Chief Engineer (IRP), CEA (convener); R.K. Kaul, Joint Advisor, Planning Commission; R.K. Sethi, Director, MOEF; D.N. Prasad, Director, Ministry of Coal; P.K. Goel, Director, Ministry of Power; Sudhir Mohan, Advisor, MNRE; R.B. Grover, Scientific Adviser, DAE; Arun Srivastava, Scientific Officer/Engineer‐H, (Strategic Planning Group), DAE; Sunil Parwani, Addl. General Manager (Power Sector‐Planning & Monitoring), BHEL; D.K. Jain, Executive Director (Engg), NTPC; D.K. Dubey, AGM (CCT); Sanjeev Mahajan, DGM (PE‐CCT); Pradeep Dadhich, Senior Fellow, TERI; Sudhir Kapur, Member CII National Committee on Power and MD & CEO‐Country Strategy Business; Shruti Bhatia, CII; B.H. Narayana, Addl. Dir., CPRI.
Sub‐Group for buildings sector: Sanjay Seth, Energy Economist, BEE (Convener); Lekhan Thakkar, Vice President, GUDC; K.I. Singh, GM (PE‐Infrastructure Services), NTPC; S. Srinivas, Principal Counsellor, CII Green Business Centre, Hyderabad; Vakil, CEPT University, Ahmedabad; Pradeep Kumar, Senior Fellow, TERI.
Sub‐Group for industry sector: Amarjeet Singh, Chief Engineer (C&E), CEA (Convener); B.N. Bankapur, Director (Ref), IOC; Saurabh Yadav, Knowledge Management Specialist, BEE; S.B. Thakur, DGM (S&EP), IOCL; A. Panda, ED (S&EP), IOCL; U. Venkata Ramana, Chief Technical Service Manager, Refineries Division, IOCL, ; Gautam Roy, GM(T), IOCL; K.Murali, Director (Ref), HPCL; S.P. Singh, GM (E&P), HPCL; Satish Kumar, Chief of Party, USAID ECO‐III Project, IRG; K.S. Venkatagiri, Principal Counsellor, CII Green Business Centre, Hyderabad; Girish Sethi, Director (EET Division), TERI; Ambuj Sagar, IIT Delhi; M.R. Gandhi, Scientist‐G, Central Salt & Marine Chemical Research Institute.
Sub‐Group for transport sector: Neerja Mathur, Chief Engineer (OM), CEA (Convener); Ajit Gupta, Retd. Advisor,MNRE; Dinesh Tyagi, Director (Tech) NATRiP; Saurabh Dalela, Addl. Dir, NATRiP.
Other participants at the Joint IEA‐India Workshop on Regional Analysis of India who provided valuable comments and feedback on the India analysis include, but are not limited to: S. M. Kulkarni, Hindalco; Nand, Fertiliser Association of India; B.P. Thapliyal, Scientist, CPRI; Alok Kumar Goyal, Scientist, CPRI; Avtar Singh, IPMA; R.C Mall, IPMA; A.K. Gupta, Chief Engineer, CEA; M.S. Puri, Chief Engineer, CEA; Praveen Gupta, Director, CEA; V.K. Singh, Deputy Director, CEA; Rajesh Kumar, Assistant Director, CEA; Major Singh, Chief Engineer, CEA; Suresh Chander, Chief
Technology Development Prospects for the Indian Power Sector © OECD/IEA 2011
Page | 6
Engineer, CEA; S. Mahajan, Deputy GM, CCT; P. Pal, Deputy GM, Engineering; A.K. Kulshreshtha, CDE (PE‐ Mech); Sriganesh Gandham, GM‐Corporate R&D, HPCL; Naveen Kumar Sharma, GM, Grinding unit, JK Lakshmi Cement Ltd.; Ravi Kapoor, USAID, ECO‐III; Anil K. Varshney, Additional Vice President, BSES Rajdhani Power; Prof. V.K. Paul, Head of the Dept of Building Engineering & Management; Prof. P.K. Sarkar, Professor of Transport Planning; K. Sheshadri, Assistant Director I, CEA; Hardayal Singh, Deputy Director, CEA; C.B. Trivedi, Deputy Director, CEA; K. K. Roy Chowdhury, Technical Associate, Cement Manufacturers’ Association.
Special thanks go to Dolf Gielen, a former IEA colleague, for his contribution and input at an early stage of the analysis.
The IEA’s Chief Editor Marilyn Smith worked with Peter Chambers, a consultant editor, to prepare the manuscript for production; layout was then carried out by Anne Mayne with production and co‐ordination assistance from other members of the Communications and Information Office (CIO), including Jane Barbière, Madeleine Barry and Muriel Custodio. Cover design was completed by Corinne Hayworth, also of CIO.

© OECD/IEA 2011 Technology Development Prospects for the Indian Power Sector
Page | 7
Executive summary The world is facing serious challenges in energy. The global economy is set to grow fourfold in the next 40 years, which promises economic benefits and huge improvements in people’s standard of living. But it also implies a much greater use of energy. A global revolution is needed in the ways that energy is produced, supplied and used. A core requirement is far greater energy efficiency, which will necessitate unprecedented levels of co‐operation among all major economies.
Recognising the diverse challenges faced by different countries, the International Energy Agency (IEA) analysed the energy trends in four countries/regions – India, China, Europe and the United States. These analyses are included in the publication Energy Technology Perspectives 2010 (ETP 2010) (IEA, 2010a), which examines potential technology pathways to achieving a 50% reduction in worldwide energy‐related carbon dioxide (CO2) emissions by 2050 compared to 2005 levels.
This working paper served as an input to the Indian regional chapter in ETP 2010, but also extends the analysis. It investigates the mix of technologies needed to achieve deep CO2 emission cuts in the Indian power sector while keeping pace with the strong growth in energy requirements that will result from a rapidly growing economy.
Social and economic development in India both depend on access to modern forms of energy. Around 404 million people in India do not have access to electricity. Providing electricity to these people while moving to low‐carbon electricity generation is a social imperative. Indian electricity supply and demand are projected to increase fivefold to sixfold between now and 2050. This development will require massive investment, but it also creates unique opportunities to transform the country’s CO2 intensity.
The analysis shows that India will face significant challenges in achieving deep CO2 reduction in power generation while also meeting the predicted growth in demand and supply. Achieving success will mean tackling a number of issues simultaneously, including a geographically uneven distribution of natural resources, financial constraints and high system losses. Accelerated exploitation of natural resources and more transmission and distribution (T&D) capacity are essential to overcome the current problems. Increased competition, additional equipment supply capacity and other actions to involve the private sector can help to accelerate investments.
Box ES.1: Scenarios for the power sector
In ETP 2010 (IEA, 2010a), the IEA developed two different scenarios to analyse the power sector:
The Baseline Scenario reflects expected developments on the basis of the energy policies that have been implemented or approved for implementation.
The BLUE Map Scenario is target‐driven and aims to halve global energy‐related CO2 emissions by 2050 compared to 2005 levels. A global carbon price of USD 175/tCO2 in 2050 is needed to achieve this reduction target. Worldwide CO2 emissions in the power sector are reduced by 74% in this scenario relative to 2005.
Going beyond the analysis presented in the ETP 2010, the IEA has developed an alternative strong growth case for India. In this alternative case, the future growth of GDP is higher than that used for the development of ETP 2010. This paper later analyses “high‐demand” cases for both the Baseline and Blue Scenarios.
Technology Development Prospects for the Indian Power Sector © OECD/IEA 2011
Page | 8
Analysis of the BLUE Map Scenario developed by the IEA for India indicates that electricity demand can be limited to 3 700 TWh in 2050. This would allow for the projected annual increase of 4.9% in gross domestic product (GDP) and 0.8% in population, and access to electricity for all. This demand can be met with a capacity of 748 GW, which implies an expansion by 580 GW compared to the installed capacity in 2007/08. In a strong growth case, which is based on an average annual GDP growth rate of 6.3% between 2007 and 2050, the total capacity requirement in 2050 increases to 1 277 GW.
The potential technology transition to achieve this expanded capacity is based on a number of technical and non‐technical elements.
Technical elements
The technical challenges of the electricity sector in India include low efficiencies of thermal power plants, continued reliance on coal plants, and inadequate transmission and distribution networks.
Improving the efficiency of electricity generation from coal is needed to exploit the extensive domestic coal resources and reduce air pollution. Integrated gasification combined‐cycle (IGCC) technology could achieve this, but has to be adapted to India’s coal quality or to rely on imported coal.
Power generation from natural gas is projected to increase by a factor of nine by 2050. This requires accelerated exploration and development of offshore gas fields, construction of liquefied natural gas (LNG) terminals and gas pipelines, and deployment of natural gas combined cycle (NGCC) power plants.
Low‐carbon generation options, such as carbon capture and storage (CCS), nuclear and renewable technologies, are needed to substantially reduce emissions in Indian power.
Around 77 GW of coal‐fired power plants equipped with CCS should operate by 2050. Due to the high ash content of Indian coal, oxy‐fuelling and post‐combustion CO2 capture would appear to be suitable options for India. Pre‐combustion capture in a coal‐fired IGCC plant would require the adaptation of the technology to the Indian coal quality, or the use of imported coal. Retrofitting coal power plants with CO2 capture could be an option for the new coal power plants without CCS being currently planned in India.
Nuclear power would increase by a factor of 30 to about 120 GW (more than 100 new nuclear reactors) by 2050 in the BLUE Map Scenario. One strategy India can continue to pursue is to exploit its vast thorium resources, along with developing the required fast breeder and heavy water reactor technologies. This would facilitate self‐sufficiency over the entire nuclear chain. Relying on imported uranium to fuel light water reactors (LWR) can be an alternative strategy for India’s nuclear future, which does not require the development of the more complex nuclear technology chain as needed for thorium. The use of uranium would initially require imported reactors, later to be replaced by Indian designed reactors.
Due to good solar irradiation conditions in many parts of India, the combination of photovoltaic (PV) and concentrated solar power (CSP) can contribute significantly to fulfilling the country’s electricity demand. Given the size of the Indian market, it is worthwhile to develop an Indian equipment industry for solar‐PV and CSP, and for T&D equipment.
The use of hydropower can be trebled, notably to supply the north. India has enough hydro potential to meet this increase, but will require new line connections to the centres of demand. The environmental and social impacts of hydropower projects need to be carefully considered in the planning process.
© OECD/IEA 2011 Technology Development Prospects for the Indian Power Sector
Page | 9
Losses in transport and distribution could be reduced from the current 32% to 15% in the medium term. Grid expansion is needed to provide electricity access to areas that have been neglected to date. Depending on local conditions, decentralised production of electricity in isolated off‐grid applications (e.g. solar‐powered water pumps) or to feed a local mini‐grid (e.g. by mini‐hydro plants) can be an alternative solution.
New technologies and energy saving methods, such as energy‐efficient building design, can help to reduce electricity demand growth.
The strong growth case of the BLUE Scenario examines the implications of higher economic growth, which implies higher electricity demand, and finds that nuclear capacity would have to increase by a factor of 50, and hydro capacity by a factor of four. Solar capacity would have to reach 370 GW by 2050 compared to 191 GW in the BLUE Map Scenario and just 13 MW in 2010.
Non‐technical elements
More efficient use of electricity and reduced CO2 in India would be greatly helped by regulations and standards encouraging the use of more efficient appliances and systems. This should be supplemented by a combination of a revised electricity tariff scheme and the introduction of subsidies for energy‐efficient equipment.
Low‐carbon power technologies, such as nuclear or renewables, generally need larger initial capital spending compared to fossil‐based options, but offer lower operating costs. Government can do much to encourage the required investment by working for macroeconomic stability, availability of financing, an enabling infrastructure and an innovative industrial base. Policy makers should also implement consistent and transparent regulation. For example, a policy framework that properly rewards T&D investments is needed. Joint ventures between public and private companies can be a valuable approach for stimulating private sector involvement. India should seek international technology co‐operation in nuclear energy, dry cooling technologies for steam cycles, solar and CCS methods, as well as in electricity grids. More nationally oriented research, development and demonstration policies and programmes addressing the use of high‐ash Indian coal for power generation have to be continued and expanded.
These developments should be combined with cost‐based pricing and careful reconsideration of subsidies for certain consumer groups to ease supply constraints and environmental impacts.


© OECD/IEA 2011 Technology Development Prospects for the Indian Power Sector
Page | 11
Introduction The Fourth Assessment Report of the Intergovernmental Panel on Climate Change (IPCC) released in November 2007 concluded that global carbon dioxide (CO2) emissions must be reduced by 50%
to 85% of 2000 levels by 2050 if global warming is to be confined to between 2 Celsius (C) and 2.4 C (IPCC, 2007).1 Following the publication of the IPCC report, awareness of the urgent need to address climate change rose significantly, as it became clear that much deeper CO2 emission cuts are required than those previously recommended. A general guideline is that global CO2 emissions must be halved.
In 2010, the IEA published Energy Technology Perspectives 2010 (ETP 2010) (IEA, 2010a), which aims to explain how to transform the global energy sector over the coming decades. The book describes the rationale and implications of the IEA’s BLUE Map Scenario, which explores the energy policy and technology options needed to achieve a 50% reduction in global energy‐related CO2 emissions by 2050.
If fully implemented, the BLUE Map Scenario could be consistent with stabilising long‐term greenhouse‐gas emissions (GHG) in the atmosphere at 450 ppm, which climate scientists believe would limit the long‐term global mean temperature rise to 2°C to 3°C. The analysis indicated that achieving such reductions would require maximum implementation of energy efficiency worldwide and a virtually decarbonised power sector (Figure ES.1). The decarbonisation of the power sector, in particular, poses a major challenge.
Figure ES.1: Contribution of emission reduction options on a global level, 2010‐50
0
5
10
15
20
25
30
35
40
45
50
55
60
2010 2015 2020 2025 2030 2035 2040 2045 2050
Gt CO2
Carbon capture and storage (CCS) 19%
Renewables 17%
Nuclear 6%
Power generation efficiency and fuel switching 5%
End‐use fuel switching 15%
End‐use fuel and electricity efficiency 38%
BLUE Map emissions 14 Gt
Baseline emissions 57 Gt
WEO 2009 450 ppmcase ETP2010 analysis
Source: IEA, 2010a.
As part of the ETP 2010 analysis, the Baseline and BLUE Map Scenarios presented in the previous ETP report (ETP 2008) (IEA, 2008) have been extended for four countries/regions – India, China, Europe and the United States. ETP 2010 discusses in more detail scenario results for these parts of the world, and presents more detailed geographical modelling of the power sector. The goal was to refine the ETP 2008 scenarios and to assess their viability in greater detail. For example: the potential of high quality renewable energy resources is often concentrated in specific regions, 1 Significant reductions in non‐energy CO2 emissions and non‐CO2 greenhouse gases would also be required to achieve the 450 ppm target.
Technology Development Prospects for the Indian Power Sector © OECD/IEA 2011
Page | 12
while the siting of nuclear power plants is limited by the availability of cooling water. Long‐range transmission lines can overcome such problems, but add to the cost of electricity supply.
This information paper presents in more detail the underlying regional analysis for India used in ETP 2010 (IEA, 2010a). The paper investigates the best way to achieve deep CO2 emission cuts in the Indian power system while allowing the Indian economy to continue to grow and alleviating energy poverty. It does so from a techno‐economic perspective ‐– building on detailed resource and technology data for India – and identifies the key technologies needed for India to realise such a transition.
This paper’s intent is not to analyse how to achieve this technology deployment in India, where technology transfer would be needed, or what technology transfer should look like. The purpose is rather to identify the technologies needed for a transition to a low‐carbon power system in the country. Discussion of generic technology transfer issues is included in ETP 2010 (IEA, 2010a).
The paper comprises three sections:
Chapter 1 provides an overview of the current situation in the Indian power sector. It describes the available indigenous fossil and nuclear resources as well as renewable potentials.
Chapter 2 highlights the existing Indian policies affecting the power sector, and discusses the current development strategies for power technologies in India.
Chapter 3 presents future scenarios for the development of the Indian power sector.
Since factors affecting future Indian electricity demand, such as economic growth, are highly uncertain, chapter 3 also analyses the results of two strong growth cases of the Baseline and BLUE Scenarios.

© OECD/IEA 2011 Technology Development Prospects for the Indian Power Sector
Page | 13
Chapter 1: Overview of current situation
Global context
Globally, the power sector is responsible for more than two‐fifths (41%) of total energy‐related CO2 emissions. In 2007, the power sector accounted for 12 gigatonnes (Gt) of CO2 (IEA, 2009a); in the IEA Baseline Scenario, this figure climbs to 23 Gt of CO2 by 2050 (IEA, 2010a). Coal‐fired power plants are expected to be the main source of this considerable increase.
However, the power sector holds strong potential to play a key role in CO2 reduction, as it has centralised major sources, proven alternative low‐carbon technology options and relatively low abatement costs. The IEA estimates that a virtual decarbonisation of the power sector can be achieved with CO2 abatement costs of between USD 50/tCO2 and USD 100/tCO2. By contrast, halving global emissions in other sectors would require options with a cost of up to USD 175/tCO2. Emissions reduction in the power sector can contribute one‐third of the total reduction needed in BLUE Map compared to Baseline in 2050, 14 Gt of CO2 reduction out of 43.3 Gt (Figure 1.1).
Figure 1.1: Reduction of CO2 emissions in the BLUE Map Scenario by sector, 2010‐50
0
5
10
15
20
25
30
35
40
45
50
55
60
2010 2015 2020 2025 2030 2035 2040 2045 2050
Gt CO2
Buildings 14%
Transport 37%
Industry 17%
Power sector 32%
BLUE Map emissions 14 Gt
Baseline emissions 57 Gt
WEO 2009 450 ppmcase ETP2010 analysis
Source: IEA, 2010a.
This excludes any additional benefits that might arise from end‐use electricity savings and widespread use of carbon‐free electricity as a substitute for fossil fuels.
The cost and savings potential estimated in ETP 2010 (IEA, 2010a) assume a global decarbonisation of the power sector. Without such global action, it will not be possible to achieve emissions halving, and the cost to reach the same level of emissions reduction will be much higher. Therefore, it is imperative that every country contributes towards this target. (The question of how to finance this reduction is not addressed in this paper.)
Technology Development Prospects for the Indian Power Sector © OECD/IEA 2011
Page | 14
The Indian context
The Republic of India is the seventh‐largest country in the world. The land area covers 2.97 million square kilometres (km2) with an elevated tableland in the south, deserts in the west, and in the north the Himalayan mountains and plains along the Ganges River (IEA, 2010d). Politically, India is a federal state divided into 27 states and 7 union territories (UTs).
India has the second‐largest population after China, with an estimated 1.123 billion people in 2007, about 17% of the world’s total population. In 2008, 60% of the labour force was involved in agriculture, 12% in industry and 28% in services. India has the largest rural population in the world: in 2008, some 71% of the population (828 million people) lived in rural areas. The rate of migration to urban areas, at 2.3% per year, is lower in India than in many other developing countries (IEA, 2010a).
India’s GDP was slightly over USD 4 trillion (INR 181 trillion) in 2007.2 Annual GDP growth has been high, averaging 7.6% from 2000 to 2007. In 2007, services accounted for 54.9% of total GDP, industry for 26.6% and agriculture for 18.5% (MoF, 2008a). The share of services in total GDP is much higher than that in most other developing economies.
While economic development has led to an increase in the average standard of living, it has largely bypassed most of the rural poor. So although the Indian economy has grown rapidly, poverty remains a major challenge.
Economic and energy indicators
India ranked third in the world in 2007 in terms of absolute GDP, based on purchasing power parity (PPP); but on a per‐capita basis it is in 100th position, well behind other fast‐growing economies such as Brazil (69th), China (75th), Russia (54th) and South Africa (57th).
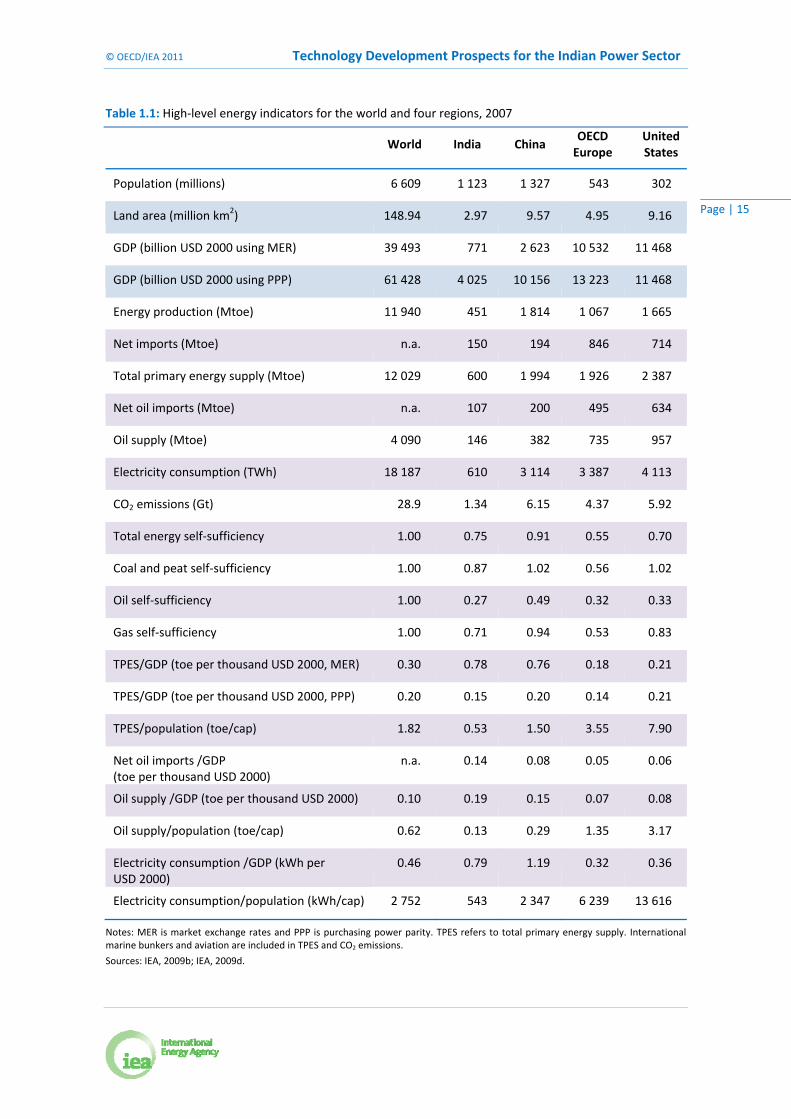
India’s primary energy consumption per capita in 2007 was with 0.53 toe per capita (/cap) much lower than that of China (1.50 toe/cap) and also below the world average of 1.82 toe/cap. For electricity consumption the difference is even more pronounced: India’s consumption of 543 kWh/cap was only one‐fifth of the world average (Table 1.1).
Low energy consumption is a main reason behind India’s very low CO2 emissions per capita (the other factor is the high primary energy share of traditional biomass). With 1.19 tonnes of carbon dioxide per capita (tCO2/cap), India’s per‐capita emissions in 2007 were well below the world average of 4.38 tCO2/cap.
Energy consumption
India consumed 600 Mtoe of primary energy in 2007 (Figure 1.2). Coal represented the largest primary energy source with a share of 40%. Despite a doubling of domestic coal production between 2000 and 2007, imports have taken an increasing share of total primary coal supply, from 9% in 2000 to 14% in 2007. Biomass and oil each provide around one‐quarter of the primary energy demand. The large biomass share reflects the use of traditional biomass for heating and cooking, which accounts for large shares of final energy needs in the residential (78%) and service (46%) sectors.
2 USD and INR in prices of the year 2000 and exchange rate in terms of purchasing power parity (PPP).
© OECD/IEA 2011 Technology Development Prospects for the Indian Power Sector
Page | 15
Table 1.1: High‐level energy indicators for the world and four regions, 2007
World India China
OECD Europe
United States
Population (millions) 6 609 1 123 1 327 543 302
Land area (million km2) 148.94 2.97 9.57 4.95 9.16
GDP (billion USD 2000 using MER) 39 493 771 2 623 10 532 11 468
GDP (billion USD 2000 using PPP) 61 428 4 025 10 156 13 223 11 468
Energy production (Mtoe) 11 940 451 1 814 1 067 1 665
Net imports (Mtoe) n.a. 150 194 846 714
Total primary energy supply (Mtoe) 12 029 600 1 994 1 926 2 387
Net oil imports (Mtoe) n.a. 107 200 495 634
Oil supply (Mtoe) 4 090 146 382 735 957
Electricity consumption (TWh) 18 187 610 3 114 3 387 4 113
CO2 emissions (Gt) 28.9 1.34 6.15 4.37 5.92
Total energy self‐sufficiency 1.00 0.75 0.91 0.55 0.70
Coal and peat self‐sufficiency 1.00 0.87 1.02 0.56 1.02
Oil self‐sufficiency 1.00 0.27 0.49 0.32 0.33
Gas self‐sufficiency 1.00 0.71 0.94 0.53 0.83
TPES/GDP (toe per thousand USD 2000, MER) 0.30 0.78 0.76 0.18 0.21
TPES/GDP (toe per thousand USD 2000, PPP) 0.20 0.15 0.20 0.14 0.21
TPES/population (toe/cap) 1.82 0.53 1.50 3.55 7.90
Net oil imports /GDP (toe per thousand USD 2000)
n.a. 0.14 0.08 0.05 0.06
Oil supply /GDP (toe per thousand USD 2000) 0.10 0.19 0.15 0.07 0.08
Oil supply/population (toe/cap) 0.62 0.13 0.29 1.35 3.17
Electricity consumption /GDP (kWh per USD 2000)
0.46 0.79 1.19 0.32 0.36
Electricity consumption/population (kWh/cap) 2 752 543 2 347 6 239 13 616
Notes: MER is market exchange rates and PPP is purchasing power parity. TPES refers to total primary energy supply. International marine bunkers and aviation are included in TPES and CO2 emissions.
Sources: IEA, 2009b; IEA, 2009d.

Technology Development Prospects for the Indian Power Sector © OECD/IEA 2011
Page | 16
Figure 1.2: Total primary energy supply in India (600 Mtoe in 2007)
Coal40%
Oil24%
Natural gas6%
Nuclear1%
Hydro2%
Biomass and waste27%
Source: IEA, 2009b.
The power sector in India was responsible for 36% of primary energy consumption in 2007, a share comparable to the world average of 35%. The important role of biomass in the energy sector becomes more apparent in the final energy mix, where biomass had the largest share with 41% in 2007, against 27% for oil (Figure 1.3).
Figure 1.3: Total final energy consumption in India (394 Mtoe in 2007)
Biomass, waste and other41%
Electricity12%
Natural gas5%
Coal15%
Oil27%
Industry (44%)
Residential (21%)
Agriculture (19%)
Services (8%)
Non‐specified (5%)
Source: IEA, 2009b.
India’s lower oil consumption per capita compared to the other countries/regions (Table 1.1) is explained by relatively low usage in transport. Transport accounted for only 41% of oil consumption in India, whereas it accounts for 79% of oil consumption in the United States and 68% in OECD Europe.
Electricity accounted for only 12% of India’s final energy needs in 2007, against 21% in the OECD. Industry constitutes 44% of total electricity consumption in India, followed by the residential
© OECD/IEA 2011 Technology Development Prospects for the Indian Power Sector
Page | 17
sector with 21%, agriculture with 19% and the service sector with 8% (IEA, 2009b). Agriculture’s large share of electricity use is caused by more than 15 million electric pump sets, which tend to have poor efficiency. Low electricity tariffs to farmers reduce the incentive to invest in more efficient pumps. The Bureau of Energy Efficiency (BEE) estimates an electricity saving potential of 30% through the use of more efficient pumps (BEE, 2009).
Regional and sectoral variations
Industrial development has contributed significantly to economic growth in India over the last few decades. However, industrialisation has not been uniform: large, modern urban centres, such as Delhi and Mumbai, co‐exist with the traditional rural and agrarian economy in states such as Bihar. Due to its industry and banking sectors, the state of Maharashtra in the west has the largest GDP among the Indian states and accounts alone for 14% of the national GDP. Per‐capita GDP varies drastically across the country, from INR 119 240/cap (USD 2 889/cap3) in Chandigarh in the north to INR 12 643/cap (USD 306/cap) in Bihar in the west (MoF, 2010).
The varying sectoral growth rates, consumption patterns and resource endowments have led to widely different regional and sectoral energy consumption and GHG emissions. Regional analyses of the CO2 and GHG data for the years 1995 (Garg et al., 2001) and 2000 (Kapshe, Garg and Shukla, 2002) show significant differences among districts in terms of GHG emissions per square metre. GHG intensities range from values below 100 tCO2‐equivalent (tCO2‐eq)/km
2 in some Himalayan districts to more than 10 000 tCO2‐eq/km
2 in the metropolitan area of Chennai. The highest emissions occur in a band from Punjab to Calcutta in the south, and along the east coast.
Most of the electricity is consumed in the northern part of India (Figure 1.4). The states Punjab, Rajasthan, and Uttar Pradesh, and the capital Delhi are together responsible for one‐fifth of India’s final electricity demand. Residential, industry and agriculture sectors are the main electricity consumers in this part of India, which has to rely on electricity imports to cover demand. Industry is the main driver for comparably high electricity needs in Maharashtra in the west, Andhra Pradesh in the east and Tamil Nadu in the south. Each of these three states is responsible for around 10% of the national electricity demand. At the opposite end of the spectrum, the north‐eastern region accounts for less than 1% of India’s electricity demand.
Domestic electricity use also varies by state and territory. On a per‐capita basis, it was in 2007 highest in Delhi with 424 kWh/cap; and lowest in Bihar in the east with only 18 kWh/cap. On a regional level, consumption varied from 149 kWh/cap in southern India to 43 kWh/cap in the north‐eastern region. The national average for India was 106 kWh/cap in 2007, which is much lower than the average residential electricity consumption of 4 615 kWh/cap in the United States, 1 595 kWh/cap in OECD Europe and 281 kWh/cap in China.
3 Currency conversions within this paper are based on the average nominal exchange rates in the considered years, unless stated otherwise.

Technology Development Prospects for the Indian Power Sector © OECD/IEA 2011
Page | 18
Figure 1.4: Final electricity demand in India by sector and by region in 2006/07
Notes: The boundaries and names shown and the designations used on maps included in this publication do not imply official endorsement or acceptance by the IEA. The definition of the regions within India corresponds to the one used in the geographical model analysis (see Annex B).
Source: CEA, 2009a.
For India, on average, space conditioning (heating and cooling through air‐conditioning units, fans and evaporative air coolers) accounts for 45% of residential electricity consumption, while lighting accounts for 28% (Figure 1.5).
Figure 1.5: India’s electricity use breakdown in commercial and residential buildings
Lighting 28%
Air conditioning 7%
Fans 34%
Evaporative air cooler 4%
Refrigeration 13%
TV 4%
Others 10%
Lighting 60%
Heating, ventilation, air conditioning
32%
Others 8%
Residential buildings Commercial buildings
Source: Bassi, n.d.

© OECD/IEA 2011 Technology Development Prospects for the Indian Power Sector
Page | 19
In a typical commercial building in India, it is estimated that about 60% of the total electricity is used for lighting, 32% for space conditioning as well as 8% for heating ventilation and air‐conditioning. Electricity needs for space cooling could be reduced by more efficient conventional air‐conditioning technologies, combined with evaporative air coolers or seawater cooling, depending on local conditions (Box 1).
Box 1: Space cooling technologies and their use
Power sector
The Indian electricity system
Total Indian installed capacity stood at 168 GW on 31 March 2008 (CEA, 2009a), of which 143 GW was utility‐owned, with shares as follows: coal (53.1%); hydro (25.1%); gas (10.3%); renewable energy sources (7.8%); nuclear (2.9%) and diesel (0.8%).4 To ensure the supply and quality of their power requirements, many industries have installed their own plants. Of the 25 GW of industrial, captive (privately owned) plants 47.1% was coal‐based, 34.6% diesel, 16.8% gas, 1.2% wind and 0.2% hydro. Almost one‐third of industrial electricity demand was provided by captive power plants in 2007/08; this share was much lower in the United States (17%) and OECD Europe (23%). The enactment of the Electricity Act 2003 in India eased the regulations for industrial concerns building power plants and allowed industry‐owned plants to feed electricity into the public grid (GoI, 2003). As a consequence, captive power capacity grew by 57% between 2002 and 2009, compared to a growth of 41% in public capacity (Figure 1.6).
4 ETP 2010 used 2007/08 as base year to allow comparison with other countries for which (in contrast to India) comprehensive statistics were not yet available for more recent years. CEA reports that India’s total installed grid‐connected capacity totalled 183 GW on 31 July 2010 (CEA, 2010a).
The future of space cooling is a key question for residential electricity demand in India, where air‐conditioning equipment is not yet widespread but evaporative air coolers (also known as swamp or wet air coolers) are widely used.
Evaporative air coolers use the hot air from within the building to evaporate water. The evaporation cools the outgoing air, and this cooling is transferred to the incoming air in a heat exchanger. This system can be combined with conventional air‐conditioning for further cooling. Such hybrid air‐conditioning systems reduce by one‐half the energy use of conventional air conditioners (Bootsveld and Afink, 2002), but they are only suited for dry, inland climate conditions, not for the humid, coastal cities of India.
It is estimated that, in 2006, 22.5 million air coolers were used in the Indian residential sector, compared to 2 million air‐conditioner units (World Bank, 2008). If all the evaporative air coolers existing in 2006 were replaced by air‐conditioning units, India’s residential electricity demand would be approximately 17 TWh higher, corresponding to 15% of the residential electricity consumption in 2006.

Technology Development Prospects for the Indian Power Sector © OECD/IEA 2011
Page | 20
Figure 1.6: Development of total installed capacity in India
0
20
40
60
80
100
120
140
160
180
1979 1980 1985 1990 1992 1997 2002 2007 2008
GW Captive railways
Captive gas
Captive diesel
Captive steam
Captive hydro
Utilities renewables
Utilities nuclear
Utilities diesel
Utilities gas
Utilities coal/lignite
Utilities hydro
Source: CEA, 2009b.
India’s power sector is highly dependent on coal, which has 52% of installed power capacity. Most of the coal capacity has been added over the last three decades (Figure 1.7). Gas capacity has increased since the 1990s, as a result of several factors. Steps to liberalise the Indian economy after the crisis in 1990/91 led to an accelerated build‐up of the necessary gas supply infrastructure. In addition, the start of liberalisation of the power market allowed industrial consumers to become less dependent on unreliable public supply by building their own gas‐based plants. Due to lower impact on land and air pollution, these faced less local opposition than coal power projects.
Figure 1.7: Age structure of existing power capacity
0
5
10
15
20
25
30
35
40
45
50
GW Wind
Biomass
Pumped storage
Hydro
Nuclear
Gas
Oil
Coal
Sources: Platts, 2010; IEA analysis.
© OECD/IEA 2011 Technology Development Prospects for the Indian Power Sector
Page | 21
Since 2003 the number of new hydro plant installations has also increased, thanks to better preparation of hydro projects by avoiding errors made in past projects (e.g. delay in equipment ordering, poor geological assessment, environmental clearance, land acquisition), leading to shorter implementation times.
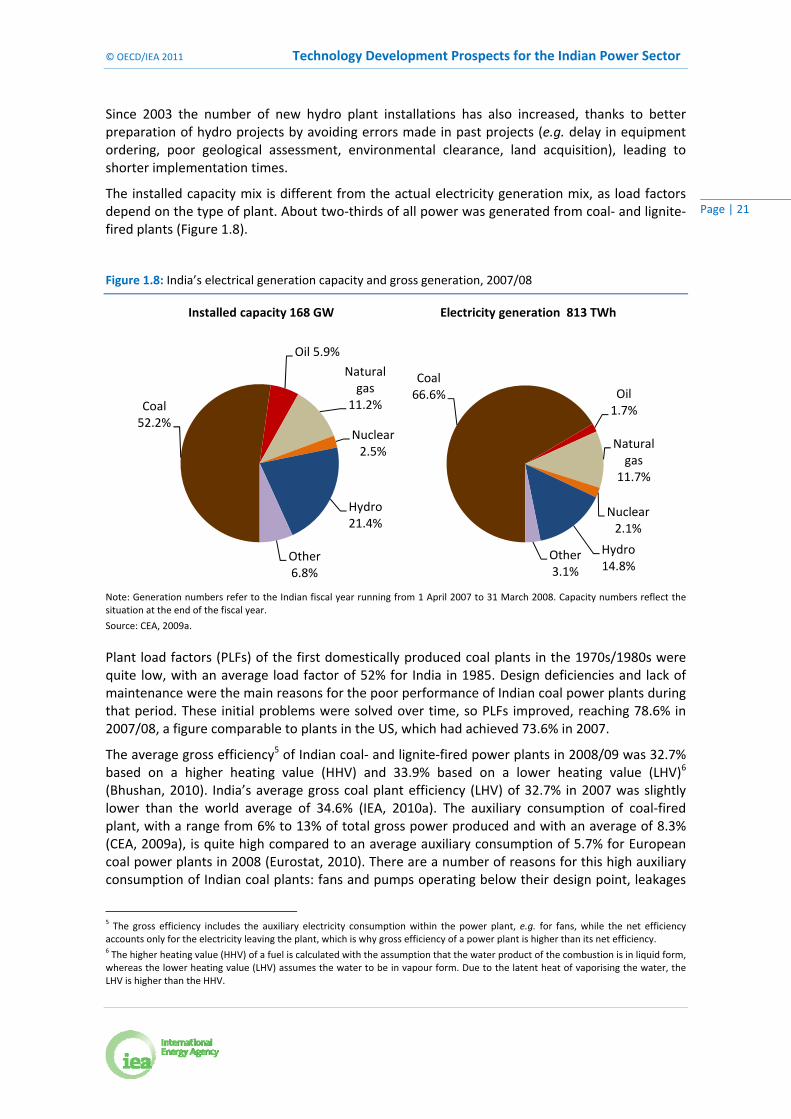
The installed capacity mix is different from the actual electricity generation mix, as load factors depend on the type of plant. About two‐thirds of all power was generated from coal‐ and lignite‐fired plants (Figure 1.8).
Figure 1.8: India’s electrical generation capacity and gross generation, 2007/08
Coal 52.2%
Oil 5.9%
Natural gas
11.2%
Nuclear2.5%
Hydro 21.4%
Other 6.8%
Installed capacity 168 GW
Coal 66.6% Oil
1.7%
Natural gas
11.7%
Nuclear2.1%
Hydro 14.8%
Other 3.1%
Electricity generation 813 TWh
Note: Generation numbers refer to the Indian fiscal year running from 1 April 2007 to 31 March 2008. Capacity numbers reflect the situation at the end of the fiscal year.
Source: CEA, 2009a.
Plant load factors (PLFs) of the first domestically produced coal plants in the 1970s/1980s were quite low, with an average load factor of 52% for India in 1985. Design deficiencies and lack of maintenance were the main reasons for the poor performance of Indian coal power plants during that period. These initial problems were solved over time, so PLFs improved, reaching 78.6% in 2007/08, a figure comparable to plants in the US, which had achieved 73.6% in 2007.
The average gross efficiency5 of Indian coal‐ and lignite‐fired power plants in 2008/09 was 32.7% based on a higher heating value (HHV) and 33.9% based on a lower heating value (LHV)6 (Bhushan, 2010). India’s average gross coal plant efficiency (LHV) of 32.7% in 2007 was slightly lower than the world average of 34.6% (IEA, 2010a). The auxiliary consumption of coal‐fired plant, with a range from 6% to 13% of total gross power produced and with an average of 8.3% (CEA, 2009a), is quite high compared to an average auxiliary consumption of 5.7% for European coal power plants in 2008 (Eurostat, 2010). There are a number of reasons for this high auxiliary consumption of Indian coal plants: fans and pumps operating below their design point, leakages
5 The gross efficiency includes the auxiliary electricity consumption within the power plant, e.g. for fans, while the net efficiency accounts only for the electricity leaving the plant, which is why gross efficiency of a power plant is higher than its net efficiency. 6 The higher heating value (HHV) of a fuel is calculated with the assumption that the water product of the combustion is in liquid form, whereas the lower heating value (LHV) assumes the water to be in vapour form. Due to the latent heat of vaporising the water, the LHV is higher than the HHV.
Technology Development Prospects for the Indian Power Sector © OECD/IEA 2011
Page | 22
in the combustion air system, and lack of maintenance in the coal mills. A preliminary assessment of the Indo‐German Energy Programme estimates a potential saving of 4.2% of the total coal consumed in Indian plants if all 210 MW coal units (144 units in total) in India were to operate at the efficiency observed at the best unit within its age class (Chakarvarti, 2010).
The average net efficiency for gas‐fired power plants in India in 2008/09 was 41.9%, comparable to the world average of 41.5% in 2007.
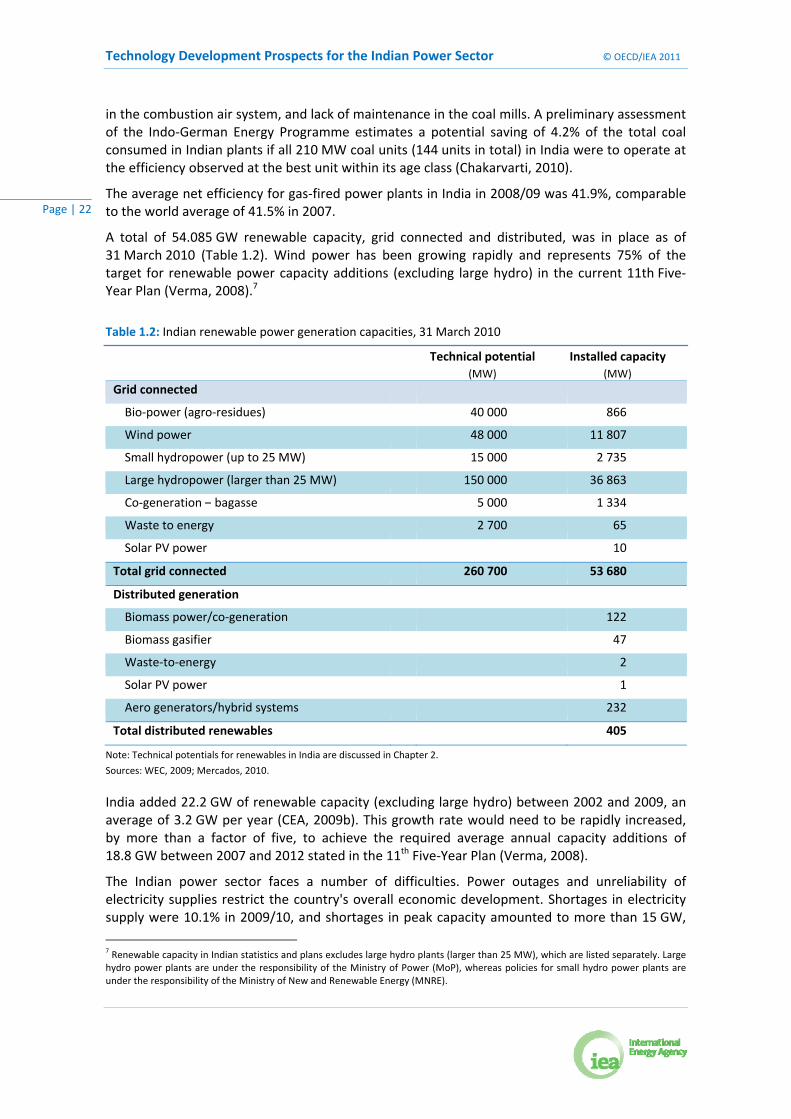
A total of 54.085 GW renewable capacity, grid connected and distributed, was in place as of 31 March 2010 (Table 1.2). Wind power has been growing rapidly and represents 75% of the target for renewable power capacity additions (excluding large hydro) in the current 11th Five‐Year Plan (Verma, 2008).7
Table 1.2: Indian renewable power generation capacities, 31 March 2010
Technical potential Installed capacity
(MW) (MW)
Grid connected
Bio‐power (agro‐residues) 40 000 866
Wind power 48 000 11 807
Small hydropower (up to 25 MW) 15 000 2 735
Large hydropower (larger than 25 MW) 150 000 36 863
Co‐generation – bagasse 5 000 1 334
Waste to energy 2 700 65
Solar PV power 10
Total grid connected 260 700 53 680
Distributed generation
Biomass power/co‐generation 122
Biomass gasifier 47
Waste‐to‐energy 2
Solar PV power 1
Aero generators/hybrid systems 232
Total distributed renewables 405
Note: Technical potentials for renewables in India are discussed in Chapter 2.
Sources: WEC, 2009; Mercados, 2010.
India added 22.2 GW of renewable capacity (excluding large hydro) between 2002 and 2009, an average of 3.2 GW per year (CEA, 2009b). This growth rate would need to be rapidly increased, by more than a factor of five, to achieve the required average annual capacity additions of 18.8 GW between 2007 and 2012 stated in the 11th Five‐Year Plan (Verma, 2008).
The Indian power sector faces a number of difficulties. Power outages and unreliability of electricity supplies restrict the country's overall economic development. Shortages in electricity supply were 10.1% in 2009/10, and shortages in peak capacity amounted to more than 15 GW,
7 Renewable capacity in Indian statistics and plans excludes large hydro plants (larger than 25 MW), which are listed separately. Large hydro power plants are under the responsibility of the Ministry of Power (MoP), whereas policies for small hydro power plants are under the responsibility of the Ministry of New and Renewable Energy (MNRE).

© OECD/IEA 2011 Technology Development Prospects for the Indian Power Sector
Page | 23
corresponding to 12.7% of the peak demand of 119 GW (CEA, 2010b). Deficits in electricity supply and peak capacity have resulted from growth in demand outstripping increases in capacity. Peak demand, for example, grew from 73 GW in 1999/2000 to 119 GW in 2009/10, an average annual growth of 5%. The last three five‐year plans have shown that actual capacity additions have been below those targeted: on average only 50.5% of the foreseen capacity has been added. Government‐controlled prices cross‐subsidise lower tariffs for the residential and farming sector with higher tariffs for industry and commerce. As a result, average price of electricity sold covers only a portion of the average production costs. The total under‐recovery of costs, which was estimated to be INR 431 billion (USD 10 billion) in 2008 (MoF, 2008b), discourages private investment in the Indian power sector (Mathy and Guivarch, 2009).
Most of these shortcomings are not entirely technical, but they have an influence on the effectiveness and efficiency of transition to the required technology.
The Indian power grid
The Indian electricity transmission system is divided into five regional grids. Since August 2006, four of the regional grids have been integrated: the Northern, Eastern, Western and North Eastern grids (the NEWNE grid). Only the southern grid still operates independently, covering the states of Andhra Pradesh, Karnataka, Kerala, Tamil Nadu, Pondicherry and Lakshadweep. The southern grid is scheduled to be synchronised with NEWNE by the end of the 12th Five‐Year Plan (2012‐17). At present, the southern grid is connected to the western and eastern grids through a high‐voltage direct current (HVDC) transmission line and HVDC back‐to‐back systems (Figure 1.9).8
The total transmission capacity of lines with a voltage level of 110 kV stands at 20.8 GW (Alagh, 2010). This corresponds to only 12% of the installed generation capacity. The 11th Five‐Year Plan has set the target to boost the transmission capacity from 14 GW in 2007 to 32.6 GW by 2012. This is an ambitious goal, given that during the first two years of the 11th Five‐Year Plan only 5.9 GW have been built (GoI, 2010).
India’s T&D losses are among the highest in the world, averaging 32% of total electricity generation, with losses in some states as high as 50% (CEA, 2008a).9 Both technical and commercial factors contribute to these losses, but quantifying their proportions is difficult. Some experts estimate that technical losses are about 15% to 20% (Bhushan, 2010). A high proportion of non‐technical losses are caused by illegal tapping of lines, but faulty electric meters that underestimate actual consumption also contribute to reduced payment collection. A case study in Kerala estimated that replacing faulty meters could reduce distribution losses from 34% to 29% (Suresh and Elachola, 2000).
Losses in distribution power lines also result from the geographical spread of the system, especially for rural distribution systems with a small number of consumers spread over a large area. In extreme cases, losses in these regions may exceed 30% (Suresh and Elachola, 2000). Due to historical development, the length of low voltage lines in these distribution networks exceeds the length of high voltage lines.
8 Purpose of an HVDC back‐to‐back system is to connect two asynchronous operating networks. It is a plant in which the equipment necessary to transform alternating current into direct current, and vice versa (static inverters and rectifiers), are in the same area, usually in the same building. The length of the direct current line is kept as short as possible. 9 The T&D losses mentioned are the aggregated technical and commercial (ATC) losses, which are defined as the difference between electricity input into the grid and the electricity for which payment is collected.

Technology Development Prospects for the Indian Power Sector © OECD/IEA 2011
Page | 24
Figure 1.9: Transmission capacities among India’s five regional grids at the end of 2008
Note: The boundaries and names shown and the designations used on maps included in this publication do not imply official endorsement or acceptance by the IEA.
Source: CEA, 2008b.
The high ratio of low voltage to high voltage line kilometres leads to high voltage and line losses. In such systems, the ratio of low to high voltage line kilometres should be optimised by increasing the number of lower‐capacity substations. Converting single‐phase supply to three‐phase supply would reduce losses further.
The power factor is one influence on the efficiency of an electricity grid. It is defined as the ratio of real power to reactive power. Real power is the net transfer of power to the consumer, whereas reactive power is stored in the system and returned to the source. In an electric power system, a load with a low power factor draws more current than a load with a high power factor for the same amount of useful power transferred. Thus, higher currents increase the energy lost in the system. Ideally, the power factor should be above unity. To reduce these losses in times of low power factor, often decreasing to 0.8 in off‐peak times in rural distribution systems in India, installing devices such as capacitors can help to increase the power factor and reduce losses.
During periods of peak load, current electricity losses may even exceed 45%, due to overloading of the distribution equipment. Designing systems with sufficient reserve is therefore important. Obviously, this reserve capacity adds to the upfront investment cost, requiring a trade‐off between investment and distribution costs.
Measures to reduce peak demand should also be promoted. Since the daily peak demand in rural Indian areas typically occurs in the evening through lighting loads, replacing incandescent lights by compact fluorescent lamps can help to reduce the peak load.
In addition to improving the efficiency of the Indian T&D system, it is important to increase the electrification rate. Around 404 million people in India, or 36% of the population, mostly living in rural areas, have no access to electricity (IEA, 2010c). Rural electrification has been an important issue of India’s policies since its independence. Initially the focus was on electrification of irrigation pumps for agriculture, especially during the time of the green revolution in the 1960s.
© OECD/IEA 2011 Technology Development Prospects for the Indian Power Sector
Page | 25
Since then the emphasis has changed towards access to electricity as a pre‐requisite for social and economic development (Oda and Tsujita, 2010). At the end of March 2010, 84% of Indian villages were electrified. The rate has accelerated rapidly over recent years through government programmes, but there are still wide discrepancies between different parts of India. While several states, such as Andhra Pradesh, Punjab and Haryana, achieved 100% electrification rates, the rates remain low in Jharkhand (31%), Bihar (61%) and Orissa (63%).10
An improved grid should be a top priority for reducing constraints on power supply and increasing access to electricity throughout the country. Substantial investments are needed to achieve this. Although power transmission projects were opened to private investments in 1998, success has so far been limited (GoI, 2010).
However, some encouraging examples illustrate how to overcome these problems. A tariff‐based competitive bidding system is one way of stimulating private sector investments. The state of Rajasthan awarded two large transmission projects through tariff‐based competitive bidding in 2010. Joint ventures between state‐owned and private companies can be another approach. In Maharashtra, the western state's power utility Mahatransco formed a minority‐equity joint venture with JSW Energy in 2008 to implement a transmission system for JSW Energy's 1 200 MW Jaigad coal‐fired power project (Electrical Monitor, 2010).
In the distribution sector, privatisation of the Delhi system in 2002 appeared to be quite successful. Instead of a tariff‐based bidding, the bidding process focused on reduction in losses/efficiency gains, with tariffs and incentives based on achievement of improvement targets (Alagh, 2010). Distribution losses were reduced from more than 50% in 2002 to below 20% in 2009.
For remote villages, development of a mini‐grid based on distributed electricity generation may be an alternative to connection to the central grid. Such a strategy requires access to local energy sources such as hydro, biomass or solar energy and the use of a robust power generation technology (e.g. a mini‐hydro plant). Local people can then manage and maintain the system.
Resource availability
In 2007, India provided 77% of its total primary energy needs from domestic energy resources. This represents a high degree of self‐sufficiency compared to other world regions or countries, such as OECD Europe (55%) or the United States (70%). The contribution of imports needed to cover India’s energy needs is, however, increasing: from a net import share of 10% in 1990 to 23% in 2007. This trend is driven by increased oil imports for the transport and industry sector. Also coal imports have been rising over recent years despite indigenous reserves, since domestic coal suffers from a high ash content and its low quality reduces power generation efficiency. Moreover, on the west coast indigenous coal is more expensive than imported coal due to the cost of rail transport from the coal mines in the east.
India has significant hydropower potential, of which only around one‐quarter has been developed so far. It also has a vast under‐utilised solar potential. Other renewable potentials, such as biomass, wind and geothermal energy, are rather restricted.
10 The village electrification rate differs from the proportion of the population with access to electricity, since according to India’s
Ministry of Power a village is considered electrified if it has distribution transformers and lines, electricity is provided to public places and at least 10% of the households are electrified (MoP, 2004).
Technology Development Prospects for the Indian Power Sector © OECD/IEA 2011
Page | 26
Uranium resources for nuclear power generation in India are limited. Only 1% of the global uranium resources are found in India. India has huge thorium resources, but exploiting them requires nuclear technologies that are more complex than the uranium‐fuelled LWR technology used in other parts of the world.
Resources for thermal power generation
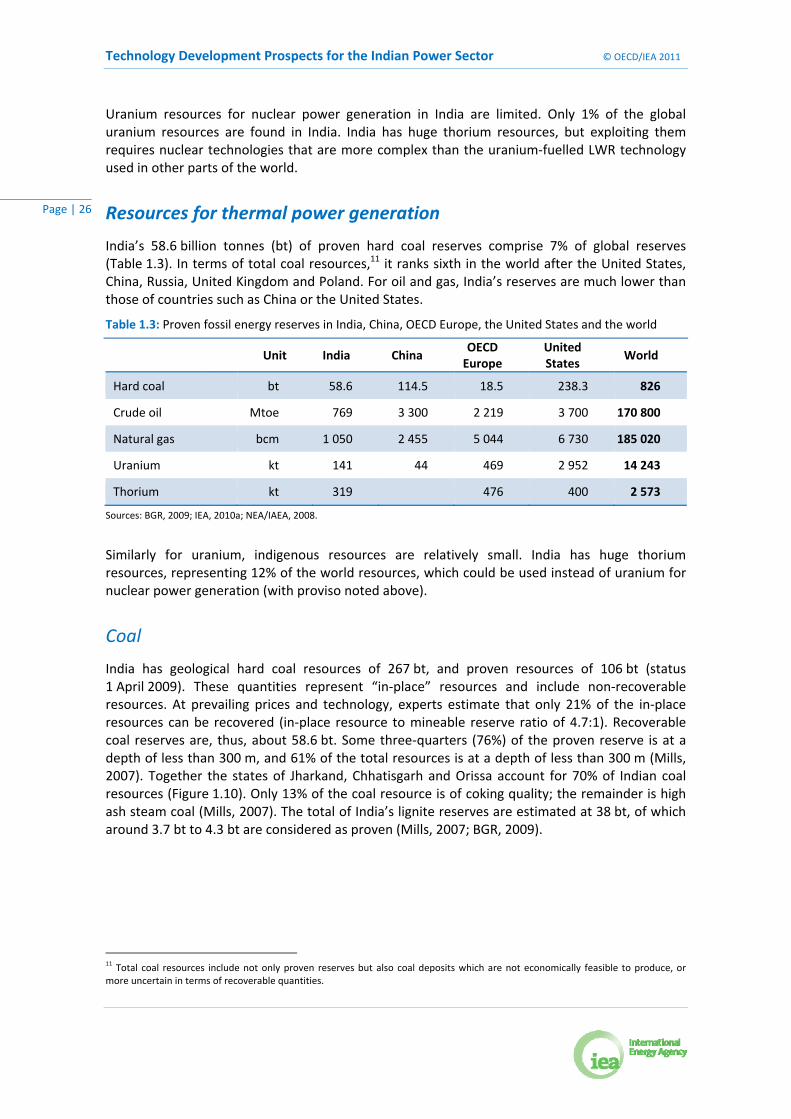
India’s 58.6 billion tonnes (bt) of proven hard coal reserves comprise 7% of global reserves (Table 1.3). In terms of total coal resources,11 it ranks sixth in the world after the United States, China, Russia, United Kingdom and Poland. For oil and gas, India’s reserves are much lower than those of countries such as China or the United States.
Table 1.3: Proven fossil energy reserves in India, China, OECD Europe, the United States and the world
Unit India China
OECD Europe
United States
World
Hard coal bt 58.6 114.5 18.5 238.3 826
Crude oil Mtoe 769 3 300 2 219 3 700 170 800
Natural gas bcm 1 050 2 455 5 044 6 730 185 020
Uranium kt 141 44 469 2 952 14 243
Thorium kt 319 476 400 2 573
Sources: BGR, 2009; IEA, 2010a; NEA/IAEA, 2008.
Similarly for uranium, indigenous resources are relatively small. India has huge thorium resources, representing 12% of the world resources, which could be used instead of uranium for nuclear power generation (with proviso noted above).
Coal
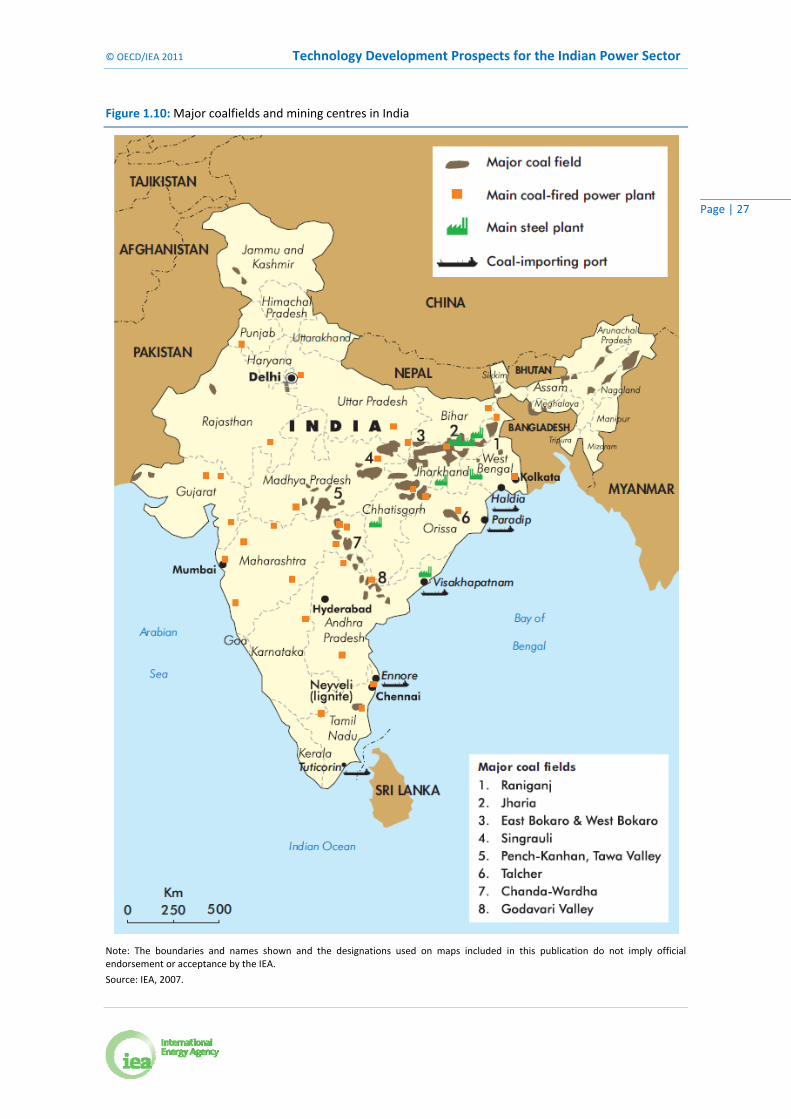
India has geological hard coal resources of 267 bt, and proven resources of 106 bt (status 1 April 2009). These quantities represent “in‐place” resources and include non‐recoverable resources. At prevailing prices and technology, experts estimate that only 21% of the in‐place resources can be recovered (in‐place resource to mineable reserve ratio of 4.7:1). Recoverable coal reserves are, thus, about 58.6 bt. Some three‐quarters (76%) of the proven reserve is at a depth of less than 300 m, and 61% of the total resources is at a depth of less than 300 m (Mills, 2007). Together the states of Jharkand, Chhatisgarh and Orissa account for 70% of Indian coal resources (Figure 1.10). Only 13% of the coal resource is of coking quality; the remainder is high ash steam coal (Mills, 2007). The total of India’s lignite reserves are estimated at 38 bt, of which around 3.7 bt to 4.3 bt are considered as proven (Mills, 2007; BGR, 2009).
11 Total coal resources include not only proven reserves but also coal deposits which are not economically feasible to produce, or
more uncertain in terms of recoverable quantities.
© OECD/IEA 2011 Technology Development Prospects for the Indian Power Sector
Page | 27
Figure 1.10: Major coalfields and mining centres in India
Note: The boundaries and names shown and the designations used on maps included in this publication do not imply official endorsement or acceptance by the IEA.
Source: IEA, 2007.

Technology Development Prospects for the Indian Power Sector © OECD/IEA 2011
Page | 28
With a hard coal production of 489 million tonnes (Mt), India was the third‐largest coal producer in the world in 2008, after China and the United States. Coal India Ltd., a public sector undertaking of the Indian government, dominates the coal market with a production share of 82% in 2008. The Ministry of Coal expects that Indian coal production will increase to 630 Mt by 2012 (Ministry of Coal, 2010).
Geography is one of the biggest barriers facing the coal industry in India. The coalbeds are often in remote areas where safety is an issue and access rights are not guaranteed. Also, large populations live immediately above many of the coal reserves. Negotiations to allocate mines between state and central government can delay development by a decade or more. Given these barriers the expansion target seems challenging, and the government has sanctioned increased coal imports. Five of the nine sites considered within the Ultra‐mega Power Projects (UMPP) programme, which aims for the construction of 14 large coal power projects each with a capacity of 4 GW, are located at the west and east coasts and will rely on imported coal.
Cumulative coal demand in the ETP 2010 Baseline Scenario for India (IEA, 2010a) is around 36 Gt coal equivalent (Gtcoe) over the period to 2050, corresponding to almost two‐thirds of the present proven reserves. As a gradual rise and fall of indigenous supply is likely, based on the bell‐shaped supply curve that has been observed elsewhere, the Baseline Scenario would imply massive coal imports, of about 25% to 50% of total supply in 2050. Imports are already rapidly increasing: India imported 52 Mtcoe of coal in 2008, about 16% of total coal supply. The rapid increase in imports can, in part, be explained by:
indigenous coal production not having kept pace with demand;
supply cost of indigenous coal on the west coast being higher than for imported coal; and
indigenous coal being of low quality (up to 50% ash), which limits efficiency and power production capacity.
Carbon capture and storage
Carbon capture and storage (CCS) is a system of technologies that integrates three stages: CO2 capture, transport, and geological storage. Each of these stages is technically viable and they have been demonstrated individually in relation to electricity generation, but not in integrated form or on a commercial scale for power generation (IEA, 2010a). If available in the future CCS may, however, play an important role in reaching deep CO2 reductions in power generation, not only in OECD countries, but especially in developing regions as China and India that rely strongly on coal for power generation.
India has some potential storage sites for CCS in two main geological formations: the depleted oil and gas fields, unmineable coal seams and saline aquifers in sedimentation basins; and the volcanic (basalt) rocks of the Deccan traps in west‐central India.
The first group includes potential storage sites in three main regions: in the west, Rajahstan along the Pakistan border, the Cambay basin north of Ahmedabad, and the offshore Mumbai basin; along the east coast the Cauvery and Godavary basins (south and north of Chennai); and Assam in the north‐east. The total storage potential in this category is estimated to be 65 Gt. These potentials are regionally concentrated, so Mumbai, Chennai and Ahmedabad can store significant amounts of CO2 while other areas such as Delhi and Calcutta cannot. The Indian storage potential in depleted oil and gas fields is estimated to be in the range 3.7 GtCO2 to 4.6 GtCO2, while the storage potential in coal seams is much smaller at 345 MtCO2 (IEAGHG, 2008).

© OECD/IEA 2011 Technology Development Prospects for the Indian Power Sector
Page | 29
Box 2: Cost of coal imports vs. indigenous supply
12
12 Indian coal is priced based on its grade, which depends on its heating value.
Superior grades (A, B, C, D) have contributed one‐third of the proven non‐coke coal resources in India.12 The rest were inferior grades (E, F, G), which are typically used for power generation (Chikkatur and Sagar, 2007).
India’s hard coal reserves are concentrated in the east, in a band that stretches from Chhattisgarh over Orissa and West Bengal to the Bangladesh border. This band continues further northeast in Assam. The typical distance for transport to Delhi, Mumbai or Chennai from the western part of this band is 1500 km. Two‐thirds (66%) of all coal was transported by rail in 2005/06 (Raghuram and Gangwar, 2008). About 88% of all coal transported by rail originated in mines; the remaining 12% from harbours (total 370 Mt in 2008/09). Only 20% of all steam coal that arrives by ship is subsequently transported by rail.
Cost factors
Rail transportation costs over a distance of 1 500 km from the coal mines in the east to the electricity demand centres, such as Delhi, Mumbai or Chennai, are typically INR 1 300 per tonne of coal (USD 30/t) (IR, 2006). The mine‐mouth cost of coal is in the range USD 15/t to USD 20/t. The energy content of washed Indian coal for power generation is typically 18 MJ/t, vs. 26 MJ/t for imported coal. So in harbour locations on the west and south coasts, imported coal may cost INR 90/GJ (USD 2/GJ), vs. INR 180/GJ (USD 4/GJ) for indigenous coal.
For more inland locations, costs are closer to parity, while on locations in the east, indigenous coal is cheaper. The policy of the Government of India stipulates use of only washed domestic coal by power plants located at distances of 1 000 km or more from coal mines. However, availability of washed coal is limited.
Transport capacity
Rail transport capacity poses important constraints. On average 620 trains loaded with coal crossed the country daily in 2008/09, 44% of all freight transport in tonnes, 42% in tonne‐kilometres (tkm) and 38% in earnings (IR, 2010). The average transport distance for coal was 623 km in 2008/09. Coal and other freight transport is subsidising passenger transportation. Actual freight costs are about one‐third below transportation prices.
If coal transport expands in line with the Baseline Scenario, a massive increase in rail transport capacity will be needed, as total freight volumes would triple (an increase of 2.7% per year). As other freight transport will also increase, a 5% to 6% growth per year will be needed. Typically about 200 km of track has been added per year in the past 20 years (0.23% per year), and about 250 km per year of track doubling (0.29% per year). This can be compared to a total track length of 86 937 km.
The gross freight‐km per track‐km ratio has increased by more than 50% between 1999 and 2009 through an increased axle load, quicker turn‐around times and higher train speed. Further potential exists to increase the capacity by modernisation of the existing system, e.g. better maintenance of tracks and signalling or use lighter materials in wagon design (GoI, 2010). Between 2006/07 and 2011/12, the 11th Five‐Year Plan expects freight transport to increase from 726 Mt to 1 100 Mt, and from 469 to 702 billion tkm (Raghuram and Gangwar, 2008). This represents an annual increase of 8.4%. Sea transport may ease the inland transport problem, but that would require expansion of harbour charging and discharging capacity. The UMPP policy favours new coal plant locations close to mines or ports to reduce the need for coal transportation. This requires, however, investments in the transmission grid to transport the electricity to the demand centres.
Technology Development Prospects for the Indian Power Sector © OECD/IEA 2011
Page | 30
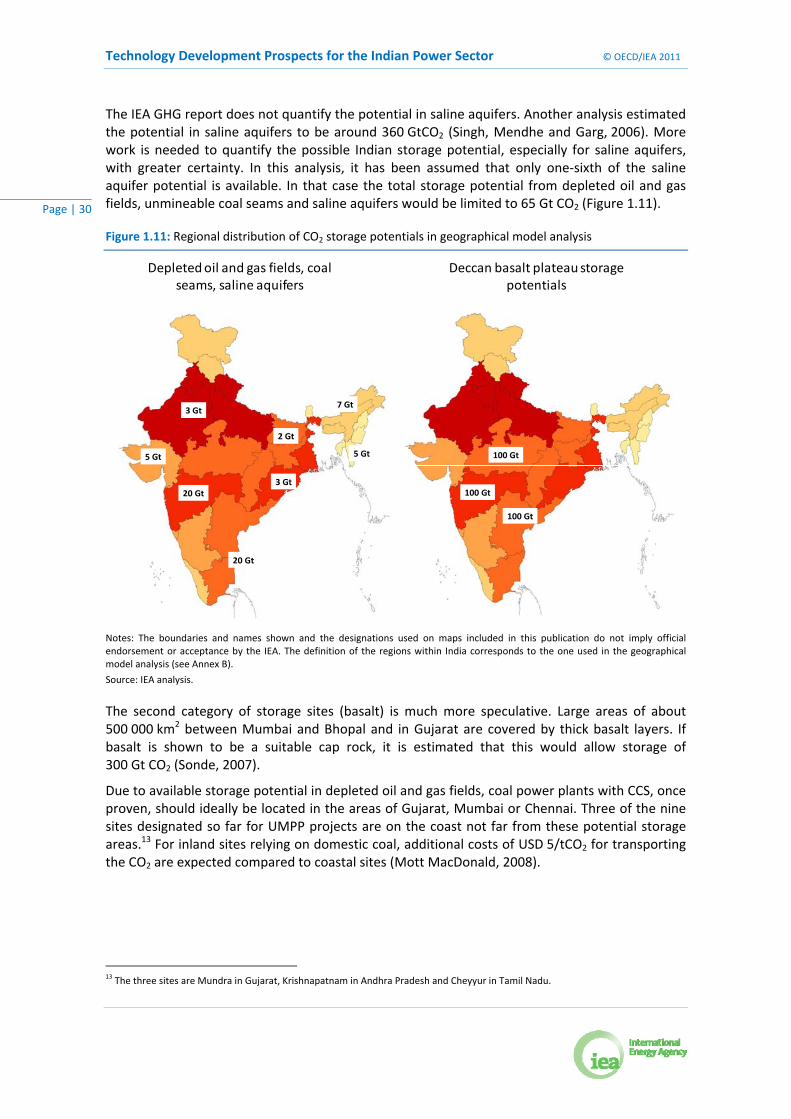
The IEA GHG report does not quantify the potential in saline aquifers. Another analysis estimated the potential in saline aquifers to be around 360 GtCO2 (Singh, Mendhe and Garg, 2006). More work is needed to quantify the possible Indian storage potential, especially for saline aquifers, with greater certainty. In this analysis, it has been assumed that only one‐sixth of the saline aquifer potential is available. In that case the total storage potential from depleted oil and gas fields, unmineable coal seams and saline aquifers would be limited to 65 Gt CO2 (Figure 1.11).
Figure 1.11: Regional distribution of CO2 storage potentials in geographical model analysis
Depleted oil and gas fields, coal seams, saline aquifers
Deccan basalt plateau storage potentials
20 Gt
20 Gt
5 Gt
7 Gt
5 Gt
3 Gt
3 Gt
2 Gt
100 Gt
100 Gt
100 Gt
Notes: The boundaries and names shown and the designations used on maps included in this publication do not imply official endorsement or acceptance by the IEA. The definition of the regions within India corresponds to the one used in the geographical model analysis (see Annex B).
Source: IEA analysis.
The second category of storage sites (basalt) is much more speculative. Large areas of about 500 000 km2 between Mumbai and Bhopal and in Gujarat are covered by thick basalt layers. If basalt is shown to be a suitable cap rock, it is estimated that this would allow storage of 300 Gt CO2 (Sonde, 2007).
Due to available storage potential in depleted oil and gas fields, coal power plants with CCS, once proven, should ideally be located in the areas of Gujarat, Mumbai or Chennai. Three of the nine sites designated so far for UMPP projects are on the coast not far from these potential storage areas.13 For inland sites relying on domestic coal, additional costs of USD 5/tCO2 for transporting the CO2 are expected compared to coastal sites (Mott MacDonald, 2008).
13 The three sites are Mundra in Gujarat, Krishnapatnam in Andhra Pradesh and Cheyyur in Tamil Nadu.

© OECD/IEA 2011 Technology Development Prospects for the Indian Power Sector
Page | 31
Natural gas
India consumed 59 billion cubic meters (bcm) of natural gas in 2008, of which 46 bcm were from domestic production. Gas consumption has been rapidly growing at a rate of 8% between 1990 and 2009. In 2008, gas accounted for 6% of total primary energy supply. Of this, 44% was used for power generation, 35% in industry, 13% in the upstream sector, 6% in transport and 2% in the buildings sector. Total gas demand is projected to increase to 132 bcm in 2030 (IEA, 2009e). Gas use for power generation would increase at an even faster rate, from 19 bcm in 2008 to 75 bcm in 2030. The other 57 bcm would largely go to making fertiliser and other industrial uses.
Proven and indicated gas reserves were 1 074 bcm at 1 April 2009. Most of this, 787 bcm, is located offshore (MPNG, 2009): in the Mumbai basin on the west coast and the KG basin halfway between Chennai and Calcutta on the east coast. In addition to conventional gas, India has estimated coalbed methane (CBM) resources between of 1.4 tcm and 2.6 tcm, mainly in the east in the area of the coal resources. Just 0.05 bcm of CBM have been produced in 2008/09, but it is planned to expand production to 2.7 bcm by 2015 (Srivastava, 2010).
Shale gas could be a further source for India’s indigenous gas supply, but the potential shale gas reserves have not yet been assessed. The Damodar basin in West Bengal and the Cambay basin in Gujarat are, according to the state‐owned Oil and Natural Gas Corporation of India (ONGC, 2010), promising formations for shale gas. In November 2010, the US and Indian governments announced that the US Geological Survey will help India to assess its shale gas reserves. India plans to auction acreages for shale gas exploration in 2011.
Most parts of India do not have access to natural gas. Transmission pipelines exist mainly in the northeast. The first major long‐distance gas transportation pipeline is the Hazira‐Vijaipur‐Jagdishpur (HVJ) line built by GAIL, which is state‐owned and the largest Indian gas transmission company. It connects Hazira in Gujarat, the landing point of offshore South Bassein field, to demand centres in the northwest including Jagdishpur in Uttar Pradesh and Vijaipur in Madhya Pradesh. It has a capacity of around 12.4 bcm per year and serves a number of large power and fertiliser plants, as well as smaller industrial units lying along its route. GAIL has recently constructed other pipelines, connecting the LNG terminal of Dahej to Vijaipur (Dahej‐Vijaipur pipeline, running parallel to the HVJ pipeline) and to Uran (Dahej‐Uran pipeline) and the power plant at Dabhol to Panvel (Dabhol‐Panvel pipeline). GAIL has also executed the Hazira‐Bijaypur‐Jagdishpur (HBJ) trunk pipeline connecting Gujarat to Uttar Pradesh. It plans to lay further pipelines between indigenous gas fields and imported LNG terminals and various demand centres.
In 2008, India’s largest private‐owned company Reliance Industries Limited (RIL) completed the 1 400 km long east‐west pipeline (EWPL) connecting Kakinada in Andhra Pradesh to Baruch in Gujarat. EWPL connects with GAIL's HVJ line and the Dahej‐Vijaipur pipeline at Ankot in Gujarat. EWPL is also linked to the Dahej‐Uran pipeline as well as the Dabhol‐Panvel pipeline through a connection point at Mashkal in Maharashtra (IEA, 2010b).
India has two LNG import terminals with a current combined import capacity of 18 bcm. Both terminals are located on the western coast, in Dahej and Hazira. A third terminal, the Dabhol‐Ratnagiri LNG terminal with a capacity of 7.5 bcm, became operational in December 2010, after many delays. A fourth terminal at Kochi on the southern west coast with a planned capacity of 3.4 bcm is under construction.

Technology Development Prospects for the Indian Power Sector © OECD/IEA 2011
Page | 32
Nuclear
India has only limited uranium resources with a total amount of 141 kt, including undiscovered resources (so‐called prognosticated and speculative resources). Discovered resources are 73 kt comprising about 49 kt of uranium reasonably assured and 24 kt inferred additional resources. The discovered resources are enough to supply a capacity of about 440 GW of LWRs for one year (based on the assumption of 17 t uranium needed per 1 GW LWR and year).
The country does, however, have huge thorium resource potential, as mentioned above. Its estimated thorium resources of 225 kt metal correspond to an annual production of 155 500 GW of breeder reactors (DAE, n.d.). Utilising these thorium resources for nuclear power generation requires a more complex chain of nuclear technologies than required for the use of uranium as fuel.
Renewables potential
The renewable energy resources in the four global regions that have been analysed in ETP 2010 differ considerably (Table 1.4). India has good hydropower resources and excellent solar resources with an average 300 sunny days per year and an average yearly irradiation of 200 W/m2. Its potential in other renewables is more limited.
Table 1.4: Renewable energy resource potentials
OECD Europe
United States
China India
Wind onshore (GW) 2 2877 10 4591 2 38011 6014
Wind offshore (<60 m water depth) (GW) 8757 1 7002 20011 2015
Wind floating (<100 km distance, >60 m water depth) (GW)
n.a. 2 4512 n.a. n.a.
Large hydro (GW) 268‐2778,9 413 3907 15016
Small hydro (GW) 10‐199 813 12812 1516
Biomass (primary) (assuming 50% use for PG) (GW) [Mtoe]
35
[1504]
50
[2004]
50
[2004]
40
[6017]
Geothermal (GW) 10‐2010 2605 6 <1018
Ocean (TWh) 6 9007 5046 1 1007 1519 GW
Note: Solar is not included in this table because the resource is not the limiting factor in any of these regions.
Sources:
United States: 1) NREL, 2010; 2) Schwartz et al., 2010; 3) Hall et al., 2006; in MWa, i.e. 100% load factor; 4) VTT, 2007; 5) Glitnir, 2007; 6) Thresher and Musial, 2010
Europe: 4) VTT, 2007; 7) UBA, 2009; 8) WEC, 2010; assuming average full load hours of 3200h; 9) ESHA, 2005; 10) Bertani, 2009; Eliasson, 2008
China: 4) VTT, 2007; 7) UBA, 2009; 11) CMA, 2010; 12) Wang and Chen, 2010; 16) NDRC, 2007
India: 14) Arora et al., 2010; 15) Study by C‐WET assessing India’s offshore potential started in 2010, results expected for 2012/13. Offshore potential conservatively assumed to be 20 GW in the scenario analysis. UBA (2009) assumes 208 TWh (or 52 GW with 4000 h load factor).; 16) MoP, 2008; 17) see section on biomass below, 12) MNRE, 2010c; 18) Holm et al., 2010; 19) GEDA, 2003), Paimpillil and Baba (2009).
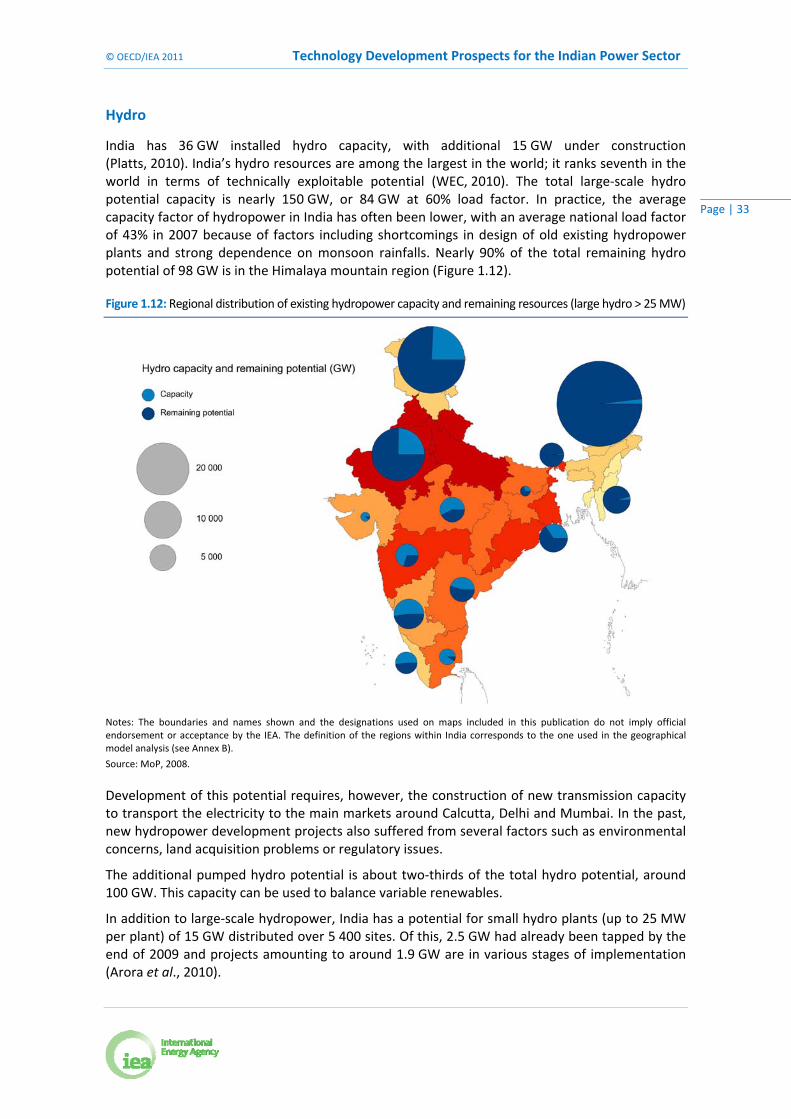
© OECD/IEA 2011 Technology Development Prospects for the Indian Power Sector
Page | 33
Hydro
India has 36 GW installed hydro capacity, with additional 15 GW under construction (Platts, 2010). India’s hydro resources are among the largest in the world; it ranks seventh in the world in terms of technically exploitable potential (WEC, 2010). The total large‐scale hydro potential capacity is nearly 150 GW, or 84 GW at 60% load factor. In practice, the average capacity factor of hydropower in India has often been lower, with an average national load factor of 43% in 2007 because of factors including shortcomings in design of old existing hydropower plants and strong dependence on monsoon rainfalls. Nearly 90% of the total remaining hydro potential of 98 GW is in the Himalaya mountain region (Figure 1.12).
Figure 1.12: Regional distribution of existing hydropower capacity and remaining resources (large hydro > 25 MW)
Notes: The boundaries and names shown and the designations used on maps included in this publication do not imply official endorsement or acceptance by the IEA. The definition of the regions within India corresponds to the one used in the geographical model analysis (see Annex B).
Source: MoP, 2008.
Development of this potential requires, however, the construction of new transmission capacity to transport the electricity to the main markets around Calcutta, Delhi and Mumbai. In the past, new hydropower development projects also suffered from several factors such as environmental concerns, land acquisition problems or regulatory issues.
The additional pumped hydro potential is about two‐thirds of the total hydro potential, around 100 GW. This capacity can be used to balance variable renewables.
In addition to large‐scale hydropower, India has a potential for small hydro plants (up to 25 MW per plant) of 15 GW distributed over 5 400 sites. Of this, 2.5 GW had already been tapped by the end of 2009 and projects amounting to around 1.9 GW are in various stages of implementation (Arora et al., 2010).

Technology Development Prospects for the Indian Power Sector © OECD/IEA 2011
Page | 34
Biomass
India has 16% of the world population, while its land is only 2% of the total geographical area of the world. As a result, pressure on the land is often beyond its carrying capacity, so productive lands, especially farmlands, are in a constant process of degradation and are fast turning into wastelands.14 Experts estimate that around 105 million hectares (ha) of land, almost one‐third of India’s geographic area, are being degraded (Ajai et al., 2009).
In order to map and tap this potential, the Indian government has developed a “biomass atlas”, using satellite data as input for geographical information systems (NRSA, 2005). Wastelands statistics indicated that about 55.3 million ha, which account for 16.8% of the total geographical area (328.7 million ha) could be categorised as wasteland in India in 2003. About 20 million hectares of these wastelands are currently in use for agriculture, but the yields are low. About 34% is land with or without scrub. Another 20% is degraded forest, and 10% is unsuited for cropping (barren rock, snow cover, glaciers etc.).
The current assumption is that 20 million ha of the wastelands (36%) are accessible and could yield around 5 tonnes of additional woody biomass per hectare per year if the productivity were restored. With an average lower heating value of 17 MJ per kilogram, this corresponds to 80 Mtoe (100 Mt) of energy, which can be converted in biomass power plants with an efficiency of around 30%. Assuming a load factor of 60%, this biomass can sustain 25 GW biomass power generation capacity.
Residual biomass from agriculture and industry is another energy source. Sugar production residues represent the single most important category. With the establishment of new sugar mills and the modernisation of existing ones, the technically feasible potential for bagasse cogeneration is estimated to be around 5 GW (DOE, 2009). Another 39 GW (30% efficiency, 60% load factor) can be obtained from other agricultural and plantation residues, based on a potential for agricultural residues of 145 Mt (Table 1.6). The principal total biomass potential in India is, therefore, estimated to be around 65 GW to 70 GW.
The government’s new environment policy sets an ambitious target of achieving 33% green cover over the geographical area of India by 2012, from 23% forest cover in 2007. Tens of millions of hectares of degraded forest lands have been regenerated and conserved by communities across India, either on their own, or under joint forest management processes, in which villages together with the state government are responsible for the management of nearby forest areas. To reach the 33% forestation target requires an additional 34 million hectares of wasteland to be transformed into forests. The investment required to afforest this land is nearly INR 600 million (USD 13 million).
The afforestation target means the 33 million ha of wasteland shown in Table 1.5 are not available for bioenergy production. As a result the primary biomass supply, largely from biomass residues, is around 145 Mt (Table 1.6), which in energy terms equals around 60 Mtoe.
14 A large amount of land in India is indeed degraded, but it is not totally “waste”. Millions of poor people rely on such lands for fuel,
fodder, wild foods and other survival resources.

© OECD/IEA 2011 Technology Development Prospects for the Indian Power Sector
Page | 35
Table 1.5: Wastelands suitable for energy production in India, 2003 (million ha)
Land with scrub
Land without scrub
Degraded forest
Degradedforest agricultural
use
Degraded pastures/
grazing land Total
Andhra Pradesh 1.6 0.2 2.0 0.3 0.0 4.1
Arunachal Pradesh 0.3 0.3 0.0 0.0 0.0 0.6
Assam 0.2 0.0 0.2 0.4 0.0 0.8
Bihar 0.0 0.0 0.3 0.0 0.0 0.4
Chhattisgarh 0.3 0.1 0.3 0.0 0.0 0.7
Goa 0.0 0.0 0.0 0.0 0.0 0.0
Gujarat 1.2 0.5 0.1 0.0 0.0 1.8
Haryana 0.1 0.0 0.1 0.0 0.1 0.3
Himachal Pradesh 0.2 0.0 0.1 0.0 0.6 1.0
Jammu and Kashmir 0.0 0.0 0.7 0.0 0.1 0.8
Jharkhand 0.2 0.0 0.7 0.1 0.0 1.0
Karnataka 0.4 0.1 0.5 0.1 0.0 1.1
Kerala 0.1 0.0 0.0 0.0 0.0 0.1
Madhya Pradesh 2.7 0.2 1.8 0.4 0.0 5.1
Maharashtra 1.9 1.0 1.2 0.2 0.0 4.4
Manipur 0.8 0.0 0.0 0.0 0.0 0.8
Meghalaya 0.1 0.2 0.0 0.0 0.0 0.3
Mizoram 0.0 0.0 0.0 0.0 0.0 0.0
Nagaland 0.2 0.0 0.0 0.0 0.0 0.2
Orissa 0.8 0.1 0.5 0.2 0.0 1.6
Punjab 0.0 0.0 0.0 0.0 0.0 0.0
Rajasthan 3.0 0.7 0.9 0.1 0.9 5.5
Sikkim 0.0 0.0 0.1 0.0 0.0 0.1
Tripura 0.0 0.0 0.1 0.0 0.0 0.1
Tamil Nadu 0.5 0.1 0.8 0.0 0.0 1.4
Uttarranchal 0.2 0.0 0.1 0.0 0.1 0.5
Uttar Pradesh 0.3 0.1 0.2 0.0 0.0 0.6
West Bengal 0.0 0.1 0.1 0.0 0.0 0.2
Delhi 0.0 0.0 0.0 0.0 0.0 0.0
Total 15.1 3.7 10.8 1.8 1.0 33.4
Source: NRSA, 2005.
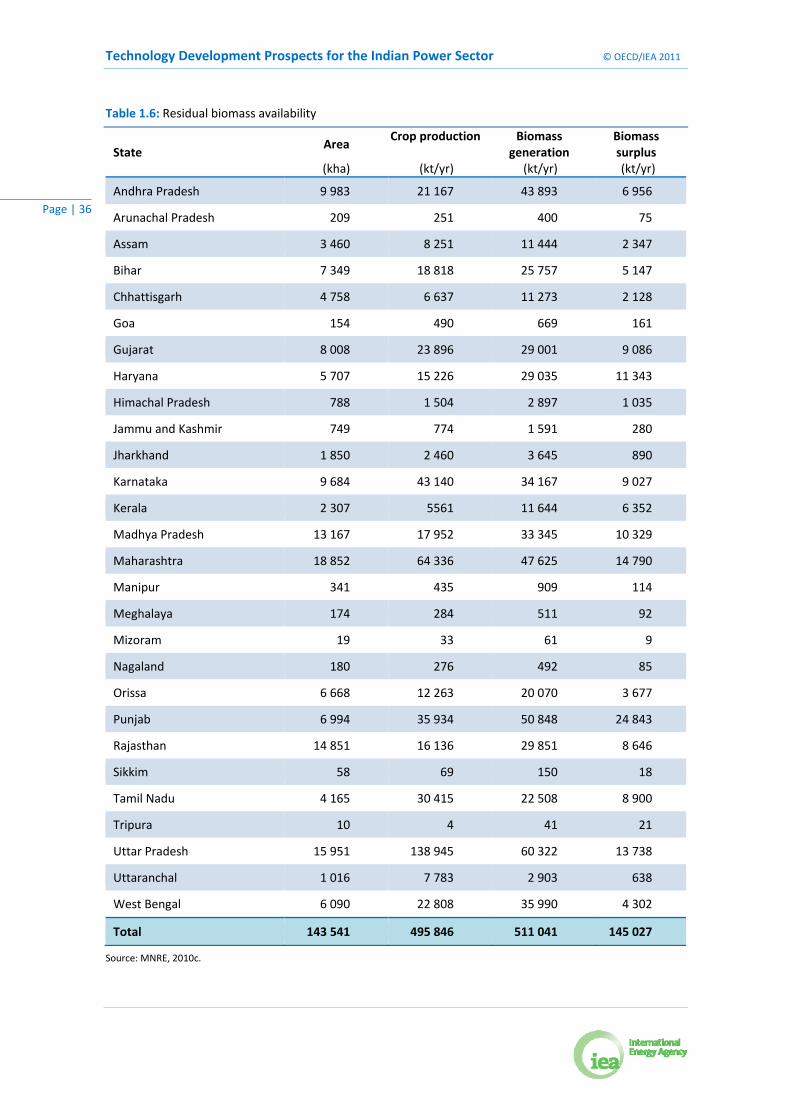
Technology Development Prospects for the Indian Power Sector © OECD/IEA 2011
Page | 36
Table 1.6: Residual biomass availability
State Area
Crop production Biomass generation
Biomass surplus
(kha) (kt/yr) (kt/yr) (kt/yr)
Andhra Pradesh 9 983 21 167 43 893 6 956
Arunachal Pradesh 209 251 400 75
Assam 3 460 8 251 11 444 2 347
Bihar 7 349 18 818 25 757 5 147
Chhattisgarh 4 758 6 637 11 273 2 128
Goa 154 490 669 161
Gujarat 8 008 23 896 29 001 9 086
Haryana 5 707 15 226 29 035 11 343
Himachal Pradesh 788 1 504 2 897 1 035
Jammu and Kashmir 749 774 1 591 280
Jharkhand 1 850 2 460 3 645 890
Karnataka 9 684 43 140 34 167 9 027
Kerala 2 307 5561 11 644 6 352
Madhya Pradesh 13 167 17 952 33 345 10 329
Maharashtra 18 852 64 336 47 625 14 790
Manipur 341 435 909 114
Meghalaya 174 284 511 92
Mizoram 19 33 61 9
Nagaland 180 276 492 85
Orissa 6 668 12 263 20 070 3 677
Punjab 6 994 35 934 50 848 24 843
Rajasthan 14 851 16 136 29 851 8 646
Sikkim 58 69 150 18
Tamil Nadu 4 165 30 415 22 508 8 900
Tripura 10 4 41 21
Uttar Pradesh 15 951 138 945 60 322 13 738
Uttaranchal 1 016 7 783 2 903 638
West Bengal 6 090 22 808 35 990 4 302
Total 143 541 495 846 511 041 145 027
Source: MNRE, 2010c.
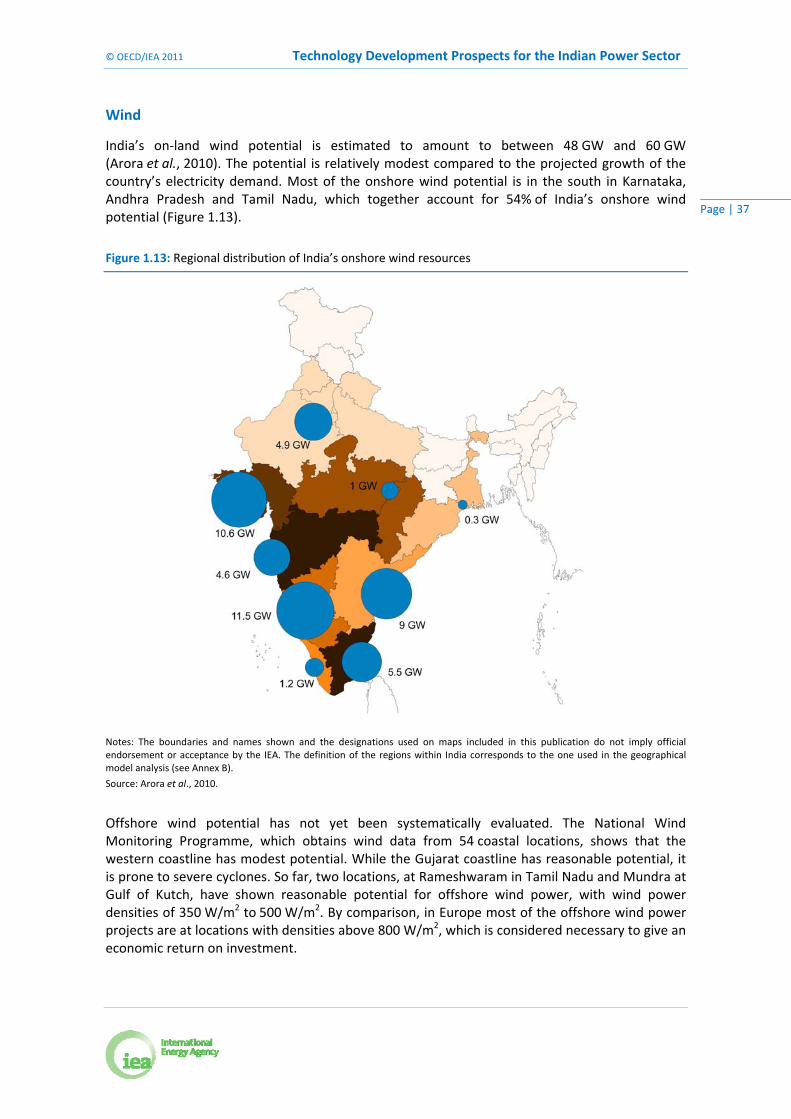
© OECD/IEA 2011 Technology Development Prospects for the Indian Power Sector
Page | 37
Wind
India’s on‐land wind potential is estimated to amount to between 48 GW and 60 GW (Arora et al., 2010). The potential is relatively modest compared to the projected growth of the country’s electricity demand. Most of the onshore wind potential is in the south in Karnataka, Andhra Pradesh and Tamil Nadu, which together account for 54% of India’s onshore wind potential (Figure 1.13).
Figure 1.13: Regional distribution of India’s onshore wind resources
Notes: The boundaries and names shown and the designations used on maps included in this publication do not imply official endorsement or acceptance by the IEA. The definition of the regions within India corresponds to the one used in the geographical model analysis (see Annex B).
Source: Arora et al., 2010.
Offshore wind potential has not yet been systematically evaluated. The National Wind Monitoring Programme, which obtains wind data from 54 coastal locations, shows that the western coastline has modest potential. While the Gujarat coastline has reasonable potential, it is prone to severe cyclones. So far, two locations, at Rameshwaram in Tamil Nadu and Mundra at Gulf of Kutch, have shown reasonable potential for offshore wind power, with wind power densities of 350 W/m2 to 500 W/m2. By comparison, in Europe most of the offshore wind power projects are at locations with densities above 800 W/m2, which is considered necessary to give an economic return on investment.

Technology Development Prospects for the Indian Power Sector © OECD/IEA 2011
Page | 38
Geothermal
Geothermal energy potential is mainly concentrated in the Himalaya region, in Jammu and Kashmir and in Himachal Pradesh. Other potential sites for geothermal power generation are the Sonata basin in Madhya Pradesh and Chattisgarh, the Cambay basin in Gujarat, the Godavari basin in Andhra Pradesh and the Sohana basin in Rajasthan (Figure 1.14).
Figure 1.14: Regional distribution of geothermal resources
Himalaya
Himalaya
Sohana
West Coast
Cambay Sonata
Godavari
Mahanadi
Notes: The boundaries and names shown and the designations used on maps included in this publication do not imply official endorsement or acceptance by the IEA. The definition of the regions within India corresponds to the one used in the geographical model analysis (see Annex B).
Source: Chandrasekharam, 2000.
The total potential is around 10 GW (Holm et al., 2010). No geothermal power plants currently operate in India; five projects with a combined capacity of 251 MW are in the planning phase (BNEF, 2010a).
Wave and tidal energy
Tidal power is a form of hydropower that converts the energy of tides into electricity. A water turbine is placed in a tidal current and drives an electrical generator or a gas compressor, which stores the energy until needed. Wave power systems transform the motion of the waves into

© OECD/IEA 2011 Technology Development Prospects for the Indian Power Sector
Page | 39
mechanical energy, which can be used to generate electricity. These systems can be floating or fixed to the seabed offshore, or may be constructed on a suitable shoreline.
For tidal power, the identified economic potential in India is about 8‐9 GW. Sites suitable for producing tidal energy include the Gulf of Cambay (7 GW approx.) and the Gulf of Kachchh (1.2 GW approx.) on the west coast (GEDA, 2003). The theoretical annual wave energy potential along the Indian coast is about 60 GW (between 5 MW and 15 MW per metre for a coastline of 6000 km). However, the realistic and economic potential is likely to be considerably less.
To date, no wave or tidal energy plant exists in India. Two tidal energy projects (50 MW in Gujarat, and 3.75 MW in West Bengal) as well as two wave energy projects (5 MW in Gujarat, and 1 MW in Maharashtra) are in the planning phase (BNEF, 2010a).

© OECD/IEA 2011 Technology Development Prospects for the Indian Power Sector
Page | 41
Chapter 2: India energy technology strategies and development activities
India’s energy policies
India’s energy sector is administered and managed through a complex multi‐ministerial structure that involves the Union Ministry of Power (MoP), the Ministry of Coal, the Ministry of Petroleum and Natural Gas (MPNG), the Ministry for New and Renewable Energy (MNRE), the Department of Atomic Energy (DAE) and the Planning Commission, as well as other government bodies and agencies such as the Bureau of Energy Efficiency (BEE). The role of the Ministry of Environment and Forests in energy policy has also increased in recent years.
Reflecting India’s federal governance structure, each of India’s states and union territories (UTs) has significant constitutional rights in the power sector. Most states and UTs have established a state‐level ministry or department for electricity, and some also have ministries or departments for energy. The pace of electricity reform varies considerably among energy sub‐sectors and across the Indian states and UTs.
The Government of India and its agencies and institutes have recently developed a number of plans and strategies involving power sector technology.
Integrated Energy Policy
In 2006, the Government of India released its first Integrated Energy Policy (IEP) (GoI, 2006). The broad vision behind the IEP is to meet reliably the demand for energy services with safe and convenient energy at the least cost in a technically efficient, economically viable and environmentally sustainable manner. All sectors are included; the lifeline energy needs of vulnerable households are a particular concern. More specifically, the document sets out strategies in four key areas: coal, efficiency, renewables and planning capacity.
Coal
Coal is expected to remain the dominant energy source for India until 2031/32, and possibly beyond. Key strands of the strategy include: developing in situ gasification to tap those coal resources difficult to mine through conventional technology; increasing coal production through competition and coal import facilities to be built along the western and southern coasts; coal washing should become the norm; and increasingly, coal should be auctioned on the Internet. Environmental factors should be treated consistently and included into coal costings.
Efficiency
India’s energy intensity should be reduced by up to 25% from current levels, and the average gross efficiency of power generation should be raised from 30.5% in 2006 to 34%. All new plants should adopt technologies that improve their gross efficiency from the prevailing 36% in 2006 to at least 38% to 40%. Aggregate technical and commercial losses should be reduced, with the aid of automated meter reading, geographic information systems (GIS), and separation of feeders and agricultural pumps.

Technology Development Prospects for the Indian Power Sector © OECD/IEA 2011
Page | 42
Renewables
The IEP suggests policies for promoting specific renewable energy sources, including fuel wood plantations, biogas plants, wood gasifier based power plants, solar water heaters, solar PV plants, CSP plants, bio‐diesel, and ethanol. The policy states incentives for renewables should be linked to the energy generated and not just the installed capacity. Supply options on a village level, especially for remote settlements, include electricity from mini‐hydro plants and wood gasification. In rural areas, community biogas plants could provide energy for cooking and water heating. Surplus gas may be used for electricity generation.
Planning capacity
India needs to increase greatly resources for energy‐related research and development (R&D) and to allocate these strategically. Capabilities in energy policy modelling should be improved and the modellers should be brought together periodically in a forum to address specific policy issues. International collaboration on research, development, demonstration and deployment is required.
Climate change initiatives
In July 2008, the Indian government released its first National Action Plan on Climate Change (NAPCC) (GoI, 2008a). The plan stresses the need to maintain high economic growth while effectively addressing climate change. It summarises existing and future policies and programmes that address climate change and adaptation. The NAPCC defines eight core national missions for the development and use of new technologies (Box 3). Two of these, the National Mission on Enhanced Energy Efficiency (NMEEE) and the Jawaharlal Nehru National Solar Mission, focus specifically on the energy sector. The NAPCC also proposes that nationally 5% of the electricity purchased should be from renewable sources in 2009/10. This share should increase by 1% per year for the next ten years.
In July 2010, India introduced a carbon tax on coal, at the rate of INR 50/t (USD 1.07/t), which will apply to both domestic and imported coal. For coal used in power generation, this tax represents a price increase in the order of 5% to 10% based on run‐of‐mine prices in October 2010, depending on the coal quality. The income from the tax goes into a National Clean Energy Fund for funding research, innovative projects in clean energy technologies, and programmes to repair environmental damage. Earnings from this tax for 2010/11 are estimated to be around INR 22.5 billion (USD 500 million).
Within the Copenhagen Accord, India has pledged to reduce the emission intensity of its GDP by 20% to 25% by 2020 relative to 2005 levels. The pledge is voluntary. As India’s pledge refers to articles in the United Nations Framework Convention on Climate Change (UNFCCC) related to the provision of financial resources and technology transfer from developed countries, it is unclear whether India regards this technology co‐operation as a precondition for pursuing its reduction efforts. The pledge explicitly excludes emissions from agriculture, but it is also not clear whether the target refers to CO2 or GHG emissions. If it is taken to refer to energy‐related CO2 emissions excluding agriculture, the target would be achieved within the less ambitious ETP 2010 Baseline Scenario, in which India’s CO2 intensity would fall by 30% compared to 2005 levels (IEA, 2010a.).
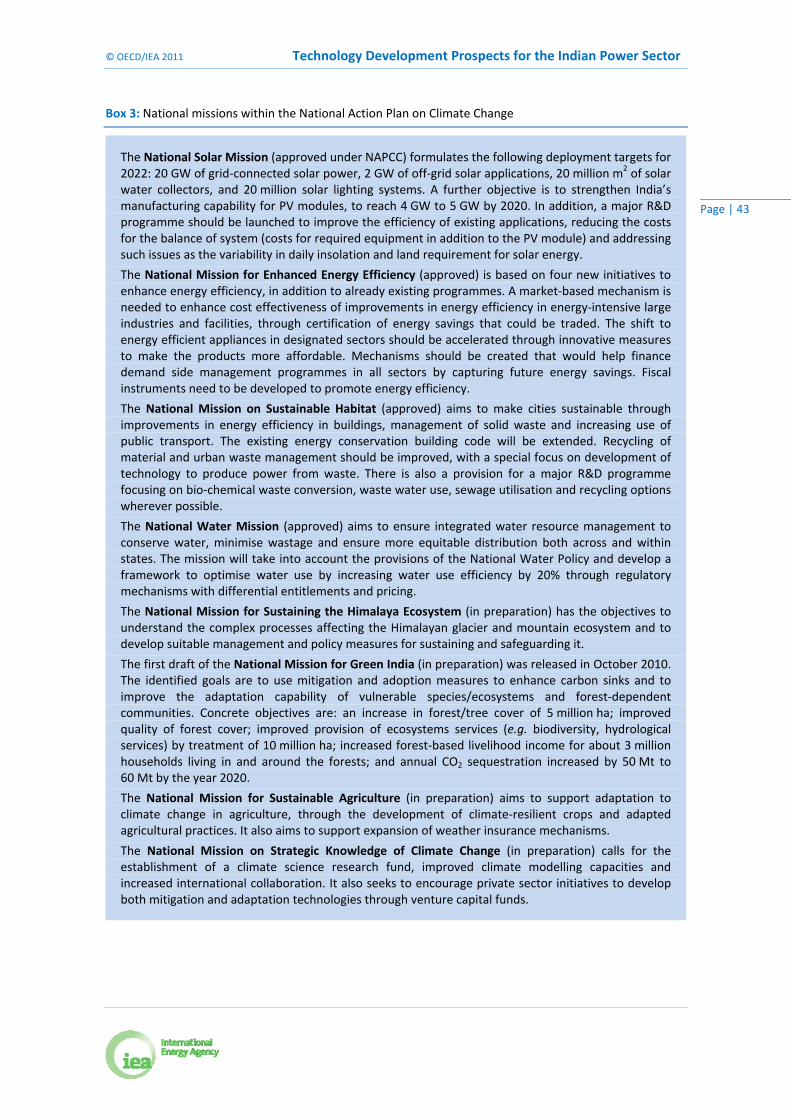
© OECD/IEA 2011 Technology Development Prospects for the Indian Power Sector
Page | 43
Box 3: National missions within the National Action Plan on Climate Change
The National Solar Mission (approved under NAPCC) formulates the following deployment targets for 2022: 20 GW of grid‐connected solar power, 2 GW of off‐grid solar applications, 20 million m2 of solar water collectors, and 20 million solar lighting systems. A further objective is to strengthen India’s manufacturing capability for PV modules, to reach 4 GW to 5 GW by 2020. In addition, a major R&D programme should be launched to improve the efficiency of existing applications, reducing the costs for the balance of system (costs for required equipment in addition to the PV module) and addressing such issues as the variability in daily insolation and land requirement for solar energy.
The National Mission for Enhanced Energy Efficiency (approved) is based on four new initiatives to enhance energy efficiency, in addition to already existing programmes. A market‐based mechanism is needed to enhance cost effectiveness of improvements in energy efficiency in energy‐intensive large industries and facilities, through certification of energy savings that could be traded. The shift to energy efficient appliances in designated sectors should be accelerated through innovative measures to make the products more affordable. Mechanisms should be created that would help finance demand side management programmes in all sectors by capturing future energy savings. Fiscal instruments need to be developed to promote energy efficiency.
The National Mission on Sustainable Habitat (approved) aims to make cities sustainable through improvements in energy efficiency in buildings, management of solid waste and increasing use of public transport. The existing energy conservation building code will be extended. Recycling of material and urban waste management should be improved, with a special focus on development of technology to produce power from waste. There is also a provision for a major R&D programme focusing on bio‐chemical waste conversion, waste water use, sewage utilisation and recycling options wherever possible.
The National Water Mission (approved) aims to ensure integrated water resource management to conserve water, minimise wastage and ensure more equitable distribution both across and within states. The mission will take into account the provisions of the National Water Policy and develop a framework to optimise water use by increasing water use efficiency by 20% through regulatory mechanisms with differential entitlements and pricing.
The National Mission for Sustaining the Himalaya Ecosystem (in preparation) has the objectives to understand the complex processes affecting the Himalayan glacier and mountain ecosystem and to develop suitable management and policy measures for sustaining and safeguarding it.
The first draft of the National Mission for Green India (in preparation) was released in October 2010. The identified goals are to use mitigation and adoption measures to enhance carbon sinks and to improve the adaptation capability of vulnerable species/ecosystems and forest‐dependent communities. Concrete objectives are: an increase in forest/tree cover of 5 million ha; improved quality of forest cover; improved provision of ecosystems services (e.g. biodiversity, hydrological services) by treatment of 10 million ha; increased forest‐based livelihood income for about 3 million households living in and around the forests; and annual CO2 sequestration increased by 50 Mt to 60 Mt by the year 2020.
The National Mission for Sustainable Agriculture (in preparation) aims to support adaptation to climate change in agriculture, through the development of climate‐resilient crops and adapted agricultural practices. It also aims to support expansion of weather insurance mechanisms.
The National Mission on Strategic Knowledge of Climate Change (in preparation) calls for the establishment of a climate science research fund, improved climate modelling capacities and increased international collaboration. It also seeks to encourage private sector initiatives to develop both mitigation and adaptation technologies through venture capital funds.
Technology Development Prospects for the Indian Power Sector © OECD/IEA 2011
Page | 44
Power sector reforms
Liberalisation of India’s power sector began in 1991 by opening it for foreign and private investments in generation. The target of attracting private investors was, however, not achieved, since private investors had to rely on state‐owned, integrated utilities (state electricity boards, SEBs) for transmitting and distributing their electricity. The poor financial health of the SEBs discouraged private companies from entering the power sector.
The Electricity Act 2003 (GoI, 2003), which replaced earlier legislation related to the power sector in India, provides an enabling framework for development of the sector. The Act introduced reforms related to: the unbundling of the SEBs, open access to transmission and distribution networks, introducing competition in generation, facilitating electricity trading, and independent tariff settings and regulation. The Act also mandates each state to establish state electricity regulatory commissions (SERCs). While on a national level the Central Electricity Regulatory Commission (CERC) covers much of the regulation on generation and interstate transmission, the SERCs have exclusive jurisdiction on electricity distribution. Before the 2003 reforms the Central Electricity Authority (CEA) was responsible for licensing power plants on technical and economic aspects. This role changed: it became an advisory body for the government on matters related to national electricity policy and technical matters, as well as specifying technical and safety standards for power plants and transmission grids.
Furthermore, the Act requires the central government to develop every five years, in consultation with state governments and the Central Electricity Authority, a National Electricity Policy (NEP, notified in 2005) and a National Tariff Policy (NTP, notified in 2006). The NEP sets guidelines for accelerated development of the power sector, supplying electricity to all areas and protecting the interests of consumers and other stakeholders. The NTP provides general and uniform parameters to the SERCs for formulating regulations and fixing tariffs, ensuring adequate returns and reasonable user charges.
The NTP 2006 asks each state to introduce renewable purchase obligations (RPOs), which require a minimum share of renewable electricity being bought by distribution companies. The SERCs are responsible for specifying the renewable percentages in their states. Renewable generators receive a higher tariff for electricity sold to the distribution companies. The tariffs are being set by the SERCs following guidelines from the CERC. So far, 21 states have introduced renewable quotas between 1% and 14% for 2010/11 (MNRE, 2010b). RPOs can be technology‐specific or technology‐independent. For example, Gujarat distinguishes three categories: solar, wind and other renewables. Failure of the distribution companies in meeting the RPO targets is, however, rarely penalised. Only three states have introduced penalties. Only four states met their target for the 2009/10. Most states have specified RPOs targets only up to 2012. Uncertainties about conditions beyond the end of the 11th Five‐Year Plan may limit investments in renewable technologies.
The authorities in India introduced renewable electricity certificates (RECs) in November 2010, aiming to ensure that renewable capacity is added at the least cost. The RECs, either solar or non‐solar, are tradable across states, and so give distribution companies the opportunity to fulfil their RPOs from renewable sources outside of their states. Generation companies have three options for selling their renewable electricity: selling it to the distribution company at the tariff fixed by the SERC, as before the introduction of the RECs; selling the RECs at power exchanges and the electricity to the distribution company separately; or selling both electricity and RECs at the power exchanges. The impact of the REC mechanism on the Clean Development Mechanism (CDM) registration for renewable electricity project is unclear: at time of writing neither CERC nor the UNFCCC executive board had taken a view.
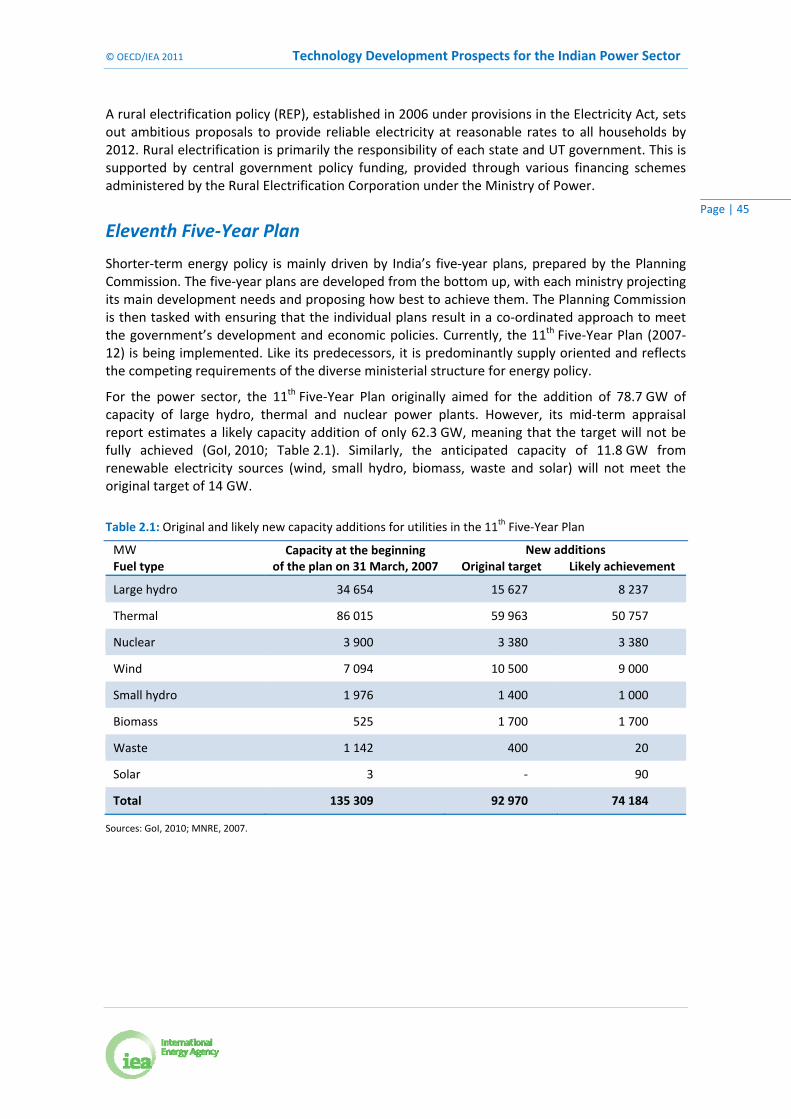
© OECD/IEA 2011 Technology Development Prospects for the Indian Power Sector
Page | 45
A rural electrification policy (REP), established in 2006 under provisions in the Electricity Act, sets out ambitious proposals to provide reliable electricity at reasonable rates to all households by 2012. Rural electrification is primarily the responsibility of each state and UT government. This is supported by central government policy funding, provided through various financing schemes administered by the Rural Electrification Corporation under the Ministry of Power.
Eleventh Five‐Year Plan
Shorter‐term energy policy is mainly driven by India’s five‐year plans, prepared by the Planning Commission. The five‐year plans are developed from the bottom up, with each ministry projecting its main development needs and proposing how best to achieve them. The Planning Commission is then tasked with ensuring that the individual plans result in a co‐ordinated approach to meet the government’s development and economic policies. Currently, the 11th Five‐Year Plan (2007‐12) is being implemented. Like its predecessors, it is predominantly supply oriented and reflects the competing requirements of the diverse ministerial structure for energy policy.
For the power sector, the 11th Five‐Year Plan originally aimed for the addition of 78.7 GW of capacity of large hydro, thermal and nuclear power plants. However, its mid‐term appraisal report estimates a likely capacity addition of only 62.3 GW, meaning that the target will not be fully achieved (GoI, 2010; Table 2.1). Similarly, the anticipated capacity of 11.8 GW from renewable electricity sources (wind, small hydro, biomass, waste and solar) will not meet the original target of 14 GW.
Table 2.1: Original and likely new capacity additions for utilities in the 11th Five‐Year Plan
MW Capacity at the beginning of the plan on 31 March, 2007
New additions Fuel type Original target Likely achievement
Large hydro 34 654 15 627 8 237
Thermal 86 015 59 963 50 757
Nuclear 3 900 3 380 3 380
Wind 7 094 10 500 9 000
Small hydro 1 976 1 400 1 000
Biomass 525 1 700 1 700
Waste 1 142 400 20
Solar 3 ‐ 90
Total 135 309 92 970 74 184
Sources: GoI, 2010; MNRE, 2007.

Technology Development Prospects for the Indian Power Sector © OECD/IEA 2011
Page | 46
India’s current and planned technology development activities
India’s Integrated Energy Policy (IEP, see section above) examines several scenarios for future development of the Indian energy sector. It does not however present scenarios aiming for deep CO2 reductions. The policy envisages CO2 emissions for India in 2031/32 to be between 5.5 Gt CO2 and 3.9 Gt CO2, compared to 1.34 Gt in 2007, while the BLUE Map Scenario in ETP 2010 (IEA, 2010a) limits the CO2 emission increase to 2.2 Gt in 2030. Based on an average annual GDP growth report of 8% to 9% between 2006/07 and 2031/32, electricity generation in 2031/32 is estimated at between 3 628 TWh and 4 493 TWh. These figures correspond to installed capacities of 778 GW and 960 GW.
The development of the electricity generation mix for one scenario is discussed in more detail in IEP (Figure 2.1). This scenario would require the exploitation of the full hydro potential of 150 GW, the addition of 63 GW of nuclear capacity by 2031/32.
Figure 2.1: Possible scenario for electricity generation mix in India’s Integrated Energy Policy
0
500
1 000
1 500
2 000
2 500
3 000
3 500
4 000
4 500
2006/07 2011/12 2016/17 2021/22 2026/27 2031/32
TWh
Thermal fuels 9% GDP growth
Thermal fuels 8% GDP growth
Other renewables
Nuclear
Hydro
Source: GoI, 2006.
Coal power technologies
Coal power generation in India is still based entirely on subcritical technology. Coal plants are concentrated in regions close to the coal mines (such as in Uttar Pradesh and West Bengal), and in more distant regions with high electricity demand (such as in Maharashtra and Andhra Pradesh) (Figure 2.2).
India is working on supercritical coal‐fired power plants (660 MW to 800 MW units): 37 units at eleven power plant sites are under construction in 2010, corresponding to a capacity of around 26 GW (Platts, 2010).
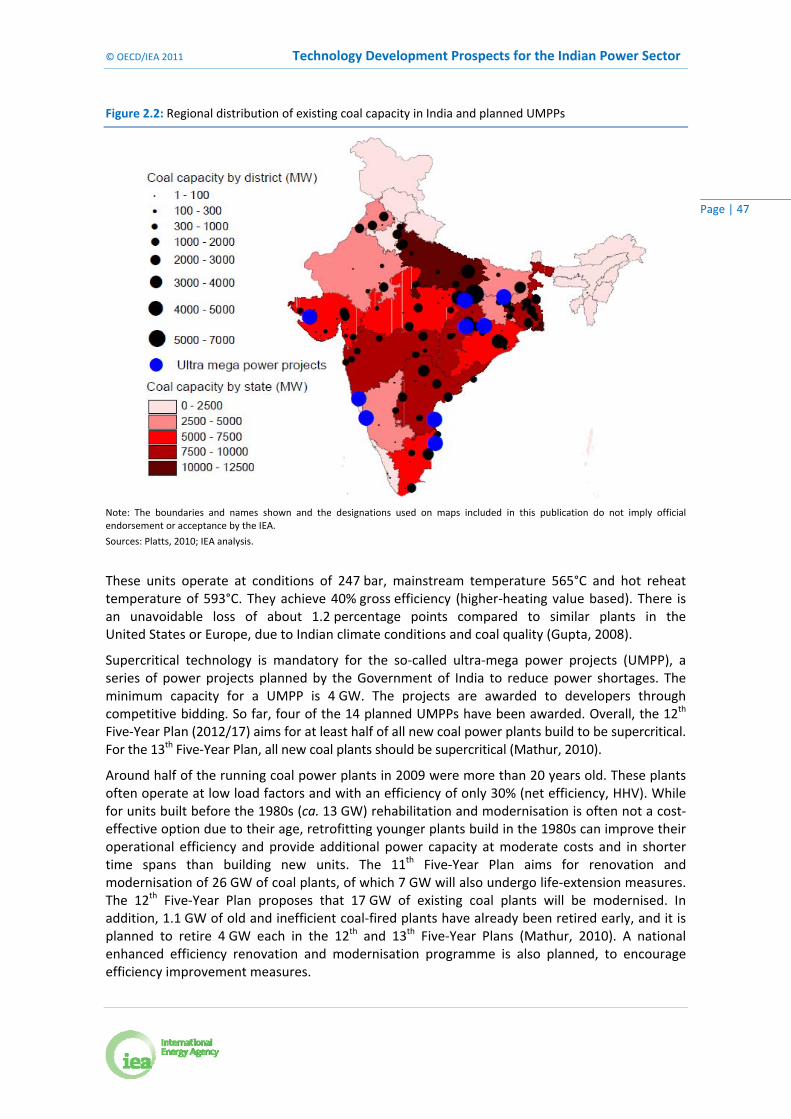
© OECD/IEA 2011 Technology Development Prospects for the Indian Power Sector
Page | 47
Figure 2.2: Regional distribution of existing coal capacity in India and planned UMPPs
Note: The boundaries and names shown and the designations used on maps included in this publication do not imply official endorsement or acceptance by the IEA.
Sources: Platts, 2010; IEA analysis.
These units operate at conditions of 247 bar, mainstream temperature 565°C and hot reheat temperature of 593°C. They achieve 40% gross efficiency (higher‐heating value based). There is an unavoidable loss of about 1.2 percentage points compared to similar plants in the United States or Europe, due to Indian climate conditions and coal quality (Gupta, 2008).
Supercritical technology is mandatory for the so‐called ultra‐mega power projects (UMPP), a series of power projects planned by the Government of India to reduce power shortages. The minimum capacity for a UMPP is 4 GW. The projects are awarded to developers through competitive bidding. So far, four of the 14 planned UMPPs have been awarded. Overall, the 12th Five‐Year Plan (2012/17) aims for at least half of all new coal power plants build to be supercritical. For the 13th Five‐Year Plan, all new coal plants should be supercritical (Mathur, 2010).
Around half of the running coal power plants in 2009 were more than 20 years old. These plants often operate at low load factors and with an efficiency of only 30% (net efficiency, HHV). While for units built before the 1980s (ca. 13 GW) rehabilitation and modernisation is often not a cost‐effective option due to their age, retrofitting younger plants build in the 1980s can improve their operational efficiency and provide additional power capacity at moderate costs and in shorter time spans than building new units. The 11th Five‐Year Plan aims for renovation and modernisation of 26 GW of coal plants, of which 7 GW will also undergo life‐extension measures. The 12th Five‐Year Plan proposes that 17 GW of existing coal plants will be modernised. In addition, 1.1 GW of old and inefficient coal‐fired plants have already been retired early, and it is planned to retire 4 GW each in the 12th and 13th Five‐Year Plans (Mathur, 2010). A national enhanced efficiency renovation and modernisation programme is also planned, to encourage efficiency improvement measures.

Technology Development Prospects for the Indian Power Sector © OECD/IEA 2011
Page | 48
Bharat Heavy Electricals Ltd. (BHEL), an Indian company established by the government, supplies most of the coal‐fired power generation equipment in India. The company has a 65% market share in India, while 10 to 15% of its production is aimed for export.
Market barriers for foreign power equipment manufacturers have been gradually reduced, so joint ventures of Indian and foreign companies are now bidding for state and private projects. In 2007, Mitsubishi Heavy Industries (MHI) started a joint venture with Larsen & Toubro Ltd. (one of the largest private companies in India) to form the second domestic manufacturer of supercritical boilers in India. By mid‐2010, L&T/MHI had secured contracts totalling 6.5 GW of capacity.
Ultra‐supercritical coal technology is under development. In September 2010, the Indira Gandhi Centre for Atomic Research (IGCAR) announced the development of an advanced ultra‐supercritical boiler with steam capacity of 350 bar and 700°C for an 800 MW coal power plant. This will be undertaken in co‐operation with BHEL and the National Thermal Power Corporation (NTPC), the largest and state‐owned power utility in India. Construction of the plant should start by 2018 (Jagannathan, 2010).
Box 4: A future for ultra‐clean coal in India?
By comparison with pulverised coal systems, fluidised‐bed boilers allow combustion of larger pieces of coal. Advantages of fluidised‐bed combustion (FBC) are: the possibility of using a wide range of fuels, including low‐quality coals, waste and biomass feedstocks; the removal of sulphur in the combustion zone by adding limestone; and reduced NOx emissions due to lower temperatures in the combustion zone.
Two types of fluidised‐bed boilers, bubbling and circulating, are commercially used. Pressurised fluidised‐bed combustion (PFBC) has been demonstrated in a number of countries, but operating problems have prevented it being promoted commercially. Bubbling FBC is used mainly for biomass and waste fuels in smaller units, whereas circulating fluidised‐bed combustion (CFBC) is the only FBC variant currently being used in plants larger than 100 MW. In India, the first two lignite‐firing CFBC units (125 MW each) were commissioned in 2000 based on German technology licensed by BHEL (Chikkatur and Sagar, 2007). In 2010, CFBC plants with a capacity of around 2 500 MW were in operation and 2 400 MW under construction.
The high ash content of Indian coal poses many problems. Research in India, Australia and Japan is aiming for ash removal using a chemical leaching process. The product is an ultra‐clean coal with less than 0.2% ash content, which can be burned directly in a gas turbine. This allows the use of combined cycles and results in a major efficiency gain. Compared to IGCC, in which gasification and turbine combustion are directly linked, ultra‐clean coal is still a solid energy carrier that can be produced and stored close to the mines (Nunes, 2009).
Ultra Clean Coal (UCC) Energy has constructed a pilot plant in New South Wales, Australia, which is capable of processing 350 kg per hour of coal. Mitsubishi Heavy Industries in Japan successfully tested the use of this coal with an ash content of less than 0.2% in gas turbines (SKM, 2009). This impurity level should not cause major problems in the gas turbine.
However, this process is not yet proven on a commercial scale, and it is unclear whether it is economically viable. Initial estimates suggest that the fuel cost in Australia would be rather high, ASD 0.05 to ASD 0.08 per kWh, compared to ASD 0.02 per kWh for regular hard coal. Cost may come down as the technology develops. The extreme high ash content of Indian coal could constitute a barrier for the use of this technology, although researchers from Tata Steel claimed in a recent patent application that they have developed a process capable of handling the high‐ash content of Indian coal (WIPO, 2010).

© OECD/IEA 2011 Technology Development Prospects for the Indian Power Sector
Page | 49
A 6.4 MW IGCC pilot unit has been operating by BHEL since 1989, based on Siemens and Alstom technology. Construction of a 200 MW IGCC demonstration plant in Vijayawada in Andhra was begun in summer 2010 by a consortium of BHEL, Andhra Pradesh Power Generation Corporation Limited (APGENCO) and the Department of Science. The Indian high‐ash coal requires the use of fluidised‐bed gasifiers, which is a different type to the well‐established entrained‐flow gasifier used for low‐ash coals.
Carbon capture and storage technology in coal‐fired generation is rather controversial as there are in general no other benefits apart from CO2 reduction, so the technology is considered less suitable for India in the short term. From a technical viewpoint, there are three options for capturing CO2 in coal‐based power generation: pre‐combustion capture by separating the carbon from fuel before burning it in an IGCC plant; post‐combustion capture by capturing the CO2 from the flue gas of the coal plant; and oxy‐fuelling by burning the fossil fuel in an oxygen atmosphere, resulting in flue gas with a high CO2 concentration. For India, post‐combustion CO2 capture or oxy‐fuelling seems more suitable, since they would allow the use of both domestic and imported coal.
Natural gas power technologies
A total of 18.9 GW of gas‐fuelled power plants was installed in India in 2007/08. Most of the gas plants are combined‐cycle power plants (15 GW), which have a higher efficiency compared to simple gas turbine units. The average net efficiency of gas‐fired power generation was 41.9%. A major part of the capacity (16 GW) has been added over the last two decades, closely linked to the development of gas production and infrastructure (Platts, 2010). Gas plants are located close to the gas production areas on the east coast, in Andhra Pradesh, and Gujarat and Maharashtra on the west coast, where the LNG import terminals are located, as well as in Assam in the northeast. Almost one third of the Indian gas‐fired capacity is located in Gujarat. Early development of the gas infrastructure in this state favoured the uptake gas use in power generation, especially for captive plants in industry. Due to the gas pipeline from Gujarat, gas plants have also been built near the inland demand centres in Uttar Pradesh and Delhi (Figure 2.3).
The 11th Five‐Year Plan foresees the addition of 7 313 MW of gas‐based capacity, of which 2 984 MW was commissioned by the end of June 2009. The capacity addition for the 12th Five‐Year Plan will depend on the availability of gas, which is also used for fertiliser and transportation. The natural gas production in the Krishna‐Godavari Basin (KG Basin) could in principle boost gas‐based generation, especially to cover demand in the south. But under the government’s gas‐allocation policy, new power projects would get lower priority than industry and transport. Thus, planners are being cautious about increasing the capacities of gas‐based generation.
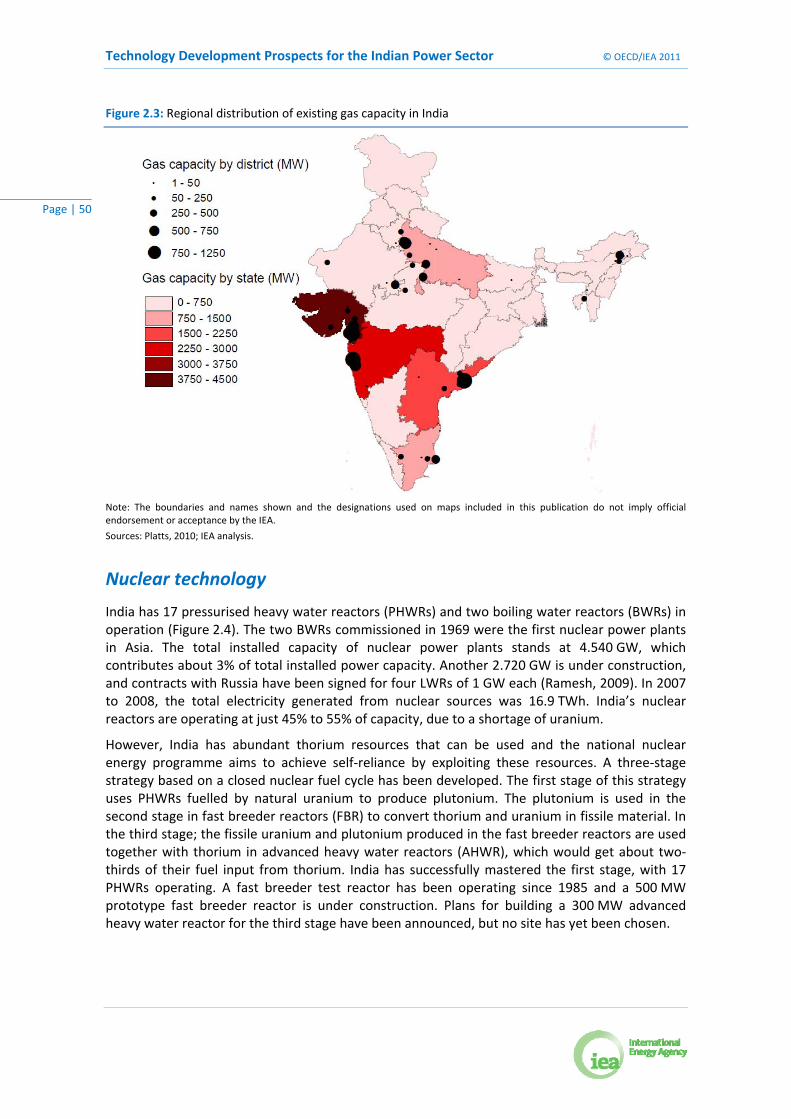
Technology Development Prospects for the Indian Power Sector © OECD/IEA 2011
Page | 50
Figure 2.3: Regional distribution of existing gas capacity in India
Note: The boundaries and names shown and the designations used on maps included in this publication do not imply official endorsement or acceptance by the IEA.
Sources: Platts, 2010; IEA analysis.
Nuclear technology
India has 17 pressurised heavy water reactors (PHWRs) and two boiling water reactors (BWRs) in operation (Figure 2.4). The two BWRs commissioned in 1969 were the first nuclear power plants in Asia. The total installed capacity of nuclear power plants stands at 4.540 GW, which contributes about 3% of total installed power capacity. Another 2.720 GW is under construction, and contracts with Russia have been signed for four LWRs of 1 GW each (Ramesh, 2009). In 2007 to 2008, the total electricity generated from nuclear sources was 16.9 TWh. India’s nuclear reactors are operating at just 45% to 55% of capacity, due to a shortage of uranium.
However, India has abundant thorium resources that can be used and the national nuclear energy programme aims to achieve self‐reliance by exploiting these resources. A three‐stage strategy based on a closed nuclear fuel cycle has been developed. The first stage of this strategy uses PHWRs fuelled by natural uranium to produce plutonium. The plutonium is used in the second stage in fast breeder reactors (FBR) to convert thorium and uranium in fissile material. In the third stage; the fissile uranium and plutonium produced in the fast breeder reactors are used together with thorium in advanced heavy water reactors (AHWR), which would get about two‐thirds of their fuel input from thorium. India has successfully mastered the first stage, with 17 PHWRs operating. A fast breeder test reactor has been operating since 1985 and a 500 MW prototype fast breeder reactor is under construction. Plans for building a 300 MW advanced heavy water reactor for the third stage have been announced, but no site has yet been chosen.

© OECD/IEA 2011 Technology Development Prospects for the Indian Power Sector
Page | 51
Figure 2.4: Existing and planned nuclear capacity in India
Note: The boundaries and names shown and the designations used on maps included in this publication do not imply official endorsement or acceptance by the IEA.
Sources: Platts, 2010; IEA analysis.
The nuclear co‐operation agreement signed with the United States in 2005 put an end to more than three decades of Indian isolation from trade in nuclear material and technology. A new safeguard agreement was adopted in 2008, putting most of India’s reactors under the safeguards of the International Atomic Energy Agency (IAEA). In the same year a consensus with the Nuclear Suppliers Group has been reached, exempting India from its rule of prohibiting trade with non‐members of the Non‐Proliferation Treaty (Zaleski and Cruciani, 2009). These developments have given a considerable boost to the nuclear power prospects for India and have resulted in some shift in emphasis from developing the use of thorium to imported uranium, at least for the near future.
As part of the 11th Five‐Year Plan, the Nuclear Power Corporation of India Ltd (NPCIL) announced in 2008 that it will start site work for 12 indigenously developed reactors, comprising eight 700 MW PHWRs, three 500 MW FBRs and one 300 MW AHWR. NPCIL’s plan also includes construction of 25 to 30 LWRs of 1 GW and 1.65 GW by 2030. Agreements exist to build up to 10 Russian VVER 1200 model LWRs in addition to the two under construction, six by 2017 and four after 2017. In addition, there are plans to import LWR technology from other reactor suppliers (Areva’s EPR, GE‐Hitachi’s ABWR, Westinghouse’s AP1000 and KEPCO’s APR‐1400) (WNA, 2010a).
India plans to build a new facility to reprocess spent fuel from the LWRs. The recycled uranium can be used in the LWRs, while the produced plutonium can be used in the Indian‐design FBRs. The target is to increase nuclear power capacity to 63 GW in 2030. Most of these reactors will be located along the coast, because of cooling water requirements (Kanwarpal, 2009). Based on these plans the IEA projects a potential capacity of up to 120 GW in 2050 in the BLUE Map Scenario.
Technology Development Prospects for the Indian Power Sector © OECD/IEA 2011
Page | 52
The Indian government has more optimistic projections for nuclear power with potentially 470 GW installed in 2050, based on the three‐stage strategy using thorium (IAEA, 2010). India has an ongoing programme of building 220 MW PHWRs, a reactor system that is competitive in terms of capital costs, safety performance and unit energy cost. This system is well suited to the needs of countries with small electricity grids, especially those in the developing world. India has reached world leadership in this area. Nearly 55% of all scientific publications on PHWRs in 2006 were Indian, and India is leading the research in FBRs (Kakodkar, 2008).
Indian PHWRs are about 15% to 30% cheaper than those elsewhere (INR 76 500/kW, USD 1 700/kW). Future PFBRs are estimated to cost nearly INR 70 000/kW or around USD 1 250/kW (Kakodkar, 2008). Based on experience with the imported LWR types under construction or planned, India may also decide to develop its own LWR type, with the longer‐term opportunity to export this technology to other countries. Indeed, for the Russian LWRs currently under construction, most of the work has been undertaken by Indian staff.
Renewable technologies
Renewable grid‐connected capacity in India almost quintupled from 3.5 GW in 2002 to 16.8 GW in March 2010. 15 With a capacity addition of 10.1 GW, wind has been the main factor behind this growth. Government incentives on a central and state level – largely through capital subsidies, tax incentives, feed‐in tariffs and RPOs – has been pushing the deployment of renewable technologies in recent years. Renewable capacity will reach 72.4 GW by 2022, according to MNRE forecasts, of which 38.5 GW will be from wind, 20 GW from solar power, 7.3 GW from biomass and 6.6 GW from small hydro. This would correspond to an estimated renewable share in electricity generation of 6.4% in 2022, compared to 4% in 2010. The NAPCC suggests more ambitious targets, with a renewable share of 10% by 2015 and 15% by 2020.
Hydro
India has an installed hydro capacity of 36 GW, distributed over 256 projects with 761 dams in operation. Existing hydropower capacity is concentrated in the north of India in the Himalaya region (Figure 2.5).
In the past, hydropower development has been slow because of factors such as the dearth of adequately investigated sites, environmental concerns, land acquisition problems, regulatory issues, long clearance and approval procedures, power evacuation problems, and the dearth of good contractors. Only 55% of the planned capacity of 14 GW under the 10th Five‐Year Plan was achieved.
Most of the factors delaying the development of hydro projects have now been addressed through legislative and policy initiatives (Ramanathan and Abeygunawardena, 2007). Programme feasibility reports and costings of 162 new projects with an aggregate capacity of 48 GW were prepared under the 50 GW Initiative in May 2003. Of these, 77 schemes with an indicative tariff below INR 2.5/kWh (USD 0.05/kWh), amounting to 33.9 GW, were selected for detailed project reports and subsequent implementation.
Typical specific investment costs for projects completed between 2000 and 2008 were USD 1 450/kW (INR 70 000/kW), with a wide range of USD 540/kW (INR 26 000/kW) to USD 3 700/kW (INR 179 000/kW) (Lako et al., 2003).
15 Excluding hydro plants with a capacity larger than 25 MW.

© OECD/IEA 2011 Technology Development Prospects for the Indian Power Sector
Page | 53
Figure 2.5: Existing and planned nuclear capacity in India
Note: The boundaries and names shown and the designations used on maps included in this publication do not imply official endorsement or acceptance by the IEA.
Sources: Platts, 2010; IEA analysis.
Resistance by local populations, who are often fundamentally affected by hydro projects through farming land being submerged or even people having to be resettled, is a further factor hampering the development of hydropower in India. In 2009, NTPC announced that they would provide assurance cover for the affected village against any mishap from one of their hydropower projects in Uttarakhand state (Electrical Monitor, 2009). If proven successful, such approaches may help to gain local people’s confidence. In addition, the ecological impacts of hydropower projects must be analysed carefully taking into account the benefits and impacts of a hydropower project over its full life cycle.
In addition to building new hydropower plants, the Indian government has put emphasis on the renovation, modernisation and uprating (RM&U) of existing hydro plants. The costs of RM&U per MW gained are estimated to be about 20% of the costs for a new hydropower unit (MoP, 2008). The shorter time period for RM&U works, of typically 1 to 3 years, is a further advantage compared to the construction period of 5 to 6 years for a new hydro plant. In the 11th Five‐Year plan, it is planned to gain an additional capacity of 1 936 MW through RM&U of 43 hydro projects at a total cost of INR 8 459 million (USD 195 million).
Biomass
The existing biomass‐fired power capacity in India of 2 666 MW falls broadly into three categories: grid‐connected large‐scale plants using combustion or gasification technology (931 MW), off‐grid or distributed power plants largely based on gasification (401 MW) and combined heat and power (CHP) plants (1 334 MW). The CHP plants are mostly industrial installations, the overwhelming majority being found in the sugar industry and fired by bagasse (a fibrous residue from sugarcane stalks).

Technology Development Prospects for the Indian Power Sector © OECD/IEA 2011
Page | 54
India has several decades of experience in small‐scale, domestically developed biomass gasifier systems for mechanical, thermal and electrical purposes. Research efforts for distributed biomass power generation started in the 1980s with the setting‐up of five gasifier research action centres. Research in these centres led to the development and commercialisation of downdraft, atmospheric gasifier technology, which is a variant of a fixed‐bed gasifier. The downdraft gasifier is available from several commercial manufacturers in India for capacities up to 500 kW. By 2003, more than 1 800 gasifiers with a combined capacity of 75 MW were installed in India (Buragohain, Mahanta and Moholkar, 2010).
Figure 2.6: Existing biomass capacity in India
Note: The boundaries and names shown and the designations used on maps included in this publication do not imply official endorsement or acceptance by the IEA.
Sources: BNEF, 2010a; IEA analysis.
Wind
In 2009, India had the fifth‐largest installed wind capacity globally, behind only the United States, China, Germany and Spain. The total installed wind power capacity in India amounted to 11.8 GW in March 2010, about 7% of the total installed generation capacity. Most of the capacity is installed in the state Tamil Nadu (42%), followed by Maharashtra (20%), Gujarat (16%) and Karnataka (13%) (MNRE, 2010a) (Figure 2.7).
The poor state of the power transmission infrastructure is one of the barriers to wind power development. In Tamil Nadu, wind farms are often shut down in peak season because grid capacity is too low to transport the power.
Despite the high installed capacity, the actual utilisation of wind power in India is low because policy incentives (tax depreciation benefits) are geared towards installation rather than operation of the plants. On average, across the country, the plant load factor of wind energy has increased marginally from 13.5% in 2003 to 17% in 2007. But in states such as Gujarat and Andhra Pradesh,

© OECD/IEA 2011 Technology Development Prospects for the Indian Power Sector
Page | 55
wind energy is functioning at a plant load factor of less than 10%. By comparison, average annual load factors in 2007 were 23.9% in the United States, 21.2% in Spain and 20.4% in Germany. China’s load factor was 16.6% in 2007. As in India, the performance of Chinese wind plants suffered from the lack of adequate grid connection.
Figure 2.7: Existing wind capacity in India
Note: The boundaries and names shown and the designations used on maps included in this publication do not imply official endorsement or acceptance by the IEA.
Sources: BNEF, 2010a; IEA analysis.
The National Tariff Policy 2006 introduced renewable purchase obligations at state level accompanied by state‐level incentives (varying between INR 3.55/kWh to 5.33/kWh or USD 0.08/kWh to 0.12/kWh; CERC, 2010a), which should lead to higher load factors of wind projects in the future. The introduction of generation‐based incentives for grid‐connected wind plants in 2009 by the central government (INR 0.5/kWh or USD 0.01/kWh) (MNRE, 2009b) may also help. However, the very low level of the central government incentive and the lack of enforcement of renewable obligations may limit the impact of these measures.
Because of lower labour and production costs, wind power equipment costs in India are lower than in other countries. In the first half of 2010, the average installed cost for a wind power project in India was INR 53 700/kW (USD 1 105/kW) (CERC, 2010a). The current annual production capacity of wind turbines manufactured in India is about 3 000 MW to 3 500 MW, including turbines for the domestic as well as for export markets (GWEC, 2009). Major wind turbine manufacturers in India are Suzlon, Enercon, RRB Energy and Vestas; together they account for more than 85% of the new capacity added in India between 2009 and 2010 (WPI, 2010). Indigenously produced wind turbines and turbine blades have been exported to the United States, Europe, Australia, China and Brazil. The size of wind turbines produced in India ranges from 250 kW to 2 000 kW (C‐WET, 2010).
Technology Development Prospects for the Indian Power Sector © OECD/IEA 2011
Page | 56
Solar PV and CSP
India announced in its solar mission a target of generating 22 GW (20 GW grid‐connected, 2 GW off‐grid) of electricity from solar energy by 2022 (MNRE, 2009a).
Solar capacity is still very small compared to other countries. India had 10.2 MW grid connected photovoltaic systems and 2.5 MW stand‐alone systems in March 2010 (Mercados, 2010). On top of that there were about 592 000 solar street and home lighting systems, and 7 300 agricultural pumps driven by PV. Some estimates are modest in terms of PV growth, to around 100 MW in 2022 (Bannerjee, 2008). Others are more ambitious and project a potential for 1.8 GW solar PV in the next five to six years (ISA, 2008). India’s solar mission is structured in three phases: the first aiming for a deployment of 1 GW of grid‐connected solar by 2013, the second 4 GW by 2017 and the final one to reach 20 GW by 2022.
Thanks to a major initiative by Indira Gandhi, a solar PV R&D programme was started by Central Electronics, Ltd. (CEL), as early as 1976. In 2010, India had a solar cell production capacity of 490 MW per year, from nine manufacturers. The aggregate annual module production capacity rose from less than 60 MW in 2005 to more than 1.27 GW in 2010 with 15 assemblers having an annual production capacity larger than 30 MW (BNEF, 2010b). Indian companies do not currently cover the entire PV value chain from silicon supply, through ingot and waver production to cell and module manufacturing. They focus on the more labour‐intensive and less technology‐intensive part of cell and module production. Therefore, India’s PV industry depends largely on the import of silicon wavers as input for its PV cell production. By 2020, India’s solar mission aims for an annual PV production capacity equivalent to 10 GW, including dedicated manufacturing capacities for poly silicon material corresponding to 2 GW capacity of solar cells. Solar PV module costs in India are around INR 180 000/kW (USD 3 850/kW) (CERC, 2010b).
India also has good concentrated solar power (CSP) potential, notably in Rajasthan, with a solar insolation of 2 400 kWh/m2 and high proportion of sunny days. The land requirement for 100 GW is 3 600 km2. Rajasthan has more than 175 000 km2 of desert land. So far, no CSP plant exists in India, but several projects with a combined capacity of 381 MW are in the planning or construction phase in Gujarat and Rajasthan (Arora et al., 2010). Within its solar mission, India strives to reach a CSP capacity of 10 GW by 2022.
Three ongoing CSP projects in Rajasthan have been included as so‐called migration projects with special tariff conditions within the solar mission, each having a capacity of 10 MW, but based on different technology concepts (tower systems, parabolic dish, parabolic trough with storage). Costs vary from INR 150 000/kW (USD 3 208/kW) for the tower system to INR 400 000/kW (USD 8 555/kW) for the trough project. For its base tariff, CERC assumes calculation investment costs of INR 153 000/kW (USD 3 330/kW), which can be considered very low compared with commissioned plants worldwide.
Within the first phase of the solar mission, 446 MW of PV and 470 MW of CSP capacity are being allocated in tender processes by 2012, in which project developers are bidding for a discount on base tariffs being determined by CERC.16 Independent of these national support measures, several Indian states are promoting solar power through feed‐in tariffs.
16 India plans to achieve the 1 GW target of the first phase of the solar mission, including 54 MW of PV and 30 MW of CSP capacity
already under development before the launch of the solar mission in November 2009 (so‐called migration projects). The migration projects benefit from special tariff conditions, since they do not have to undergo the bidding process of the regular projects in the solar mission.

© OECD/IEA 2011 Technology Development Prospects for the Indian Power Sector
Page | 57
A recent development is the introduction of PV‐based lighting systems, initiated by the non‐profit research organisation The Energy and Resources Institute (TERI). So far, 32 000 solar lanterns have been provided with PV charging stations to 570 rural villages in India. The costs of INR 234 billion (USD 5 billion) needed to provide 65 million rural households with solar lanterns are estimated by TERI to be less than half of the implied annual subsidy on kerosene consumption in India (Shrivastava, 2010).


© OECD/IEA 2011 Technology Development Prospects for the Indian Power Sector
Page | 59
Chapter 3: Power sector scenarios in India
Electricity demand projections
India’s economy has been growing rapidly over the last decades: at an average rate of 5% between 1975 and 1995, and an even higher rate of 6.9% between 1995 and 2008. While in the first period growth in total commercial primary energy supply (TPES) (i.e. excluding traditional biomass), outpaced economic growth with an average annual growth of 6.3%, a decoupling of economic and primary energy demand can be observed in the period up to 2008 with an average annual growth of commercial TPES of 4.9%. Similarly, between 1975 and 1995 final electricity demand grew at an annual rate of 8% faster than GDP, but electricity growth fell with a rate of 5.3% below GDP between 1995 and 2008.
Projections for future electricity demand are very uncertain, because of the expected continuation of India’s dynamic development. GDP development, industry structure, population growth and income levels are important drivers for energy and electricity demand as well as their impact on CO2 emissions.
According to IEA analysis, the Indian economy is projected to grow at a much faster rate than those of Europe or the United States during the coming four decades. A consequence of this growth will be a significant increase in energy use and associated CO2 emissions, in absolute and relative terms. In the ETP 2010 Baseline Scenario for India (IEA, 2010a), between 2007 and 2050 GDP will increase eightfold, primary energy use quadruple and CO2 emissions increase almost fivefold. India’s proportion of total global CO2 emissions is projected to double from 5% to 11%. The power sector plays an especially important role as electricity demand is projected to rise fivefold. Maintaining the current high share of coal‐fired power generation also in the future would cause drastic increases in India’s CO2 emissions.
Other agencies give very different growth projections for the Indian economy in the next decades. GDP projections from the CEA/Indian government (Verma, 2008) and the IEA analysis (IEA, 2010a) are compared in Table 3.1. The Indian projections of the GDP level in 2050 are more than twice as high as the IEA projections. CEA projections for the average annual growth rate in GDP for the 2005‐30 period are about two percentage points higher than the IEA projection (8% per year for CEA vs. about 6% for IEA). For the 2030‐50 period, the difference in projected growth rates increases to 2.5 percentage points (5.8% for CEA and about 3.3% for IEA). Because energy demand growth is closely related to GDP growth, this has a major impact on energy demand projections.
Table 3.1: Comparison of GDP projections for India (index, 2005=100)
2005 2010 2020 2030 2040 2050
CEA 100 147 317 685 1 335 2 153
IEA 100 147 273 485 671 928
Sources: Verma, 2008; IEA, 2010a.
The two projections from CEA (Verma, 2008) do not include any future CO2 mitigation policies for India. In this aspect they are comparable to the IEA’s ETP Baseline Scenario (IEA, 2010a). One of the CEA scenarios assumes that no energy efficiency improvements will be implemented. The demand elasticity of electricity declines in this scenario from 0.95 in 2011/12 to 0.725 in 2051/52. The second CEA scenario, with energy efficiency improvements, assumes a decline in demand

Technology Development Prospects for the Indian Power Sector © OECD/IEA 2011
Page | 60
elasticity from 0.95 to 0.5 over time. This significantly affects demand in 2050. Both projections are, however, still considerably higher than those from the IEA.
The two projections from the IEA, the Baseline and the BLUE Map Scenarios, are based on a bottom‐up system engineering model. A fivefold increase in electricity demand from 792 TWh in 2007 to 4 069 TWh in 2050 is projected in the Baseline Scenario. Total electricity demand is reduced in BLUE Map to the level of 3 769 TWh. Figure 3.1 shows electricity demand projections for India from the two different sources.
Figure 3.1: Electricity demand projections 2007‐50
0
1 000
2 000
3 000
4 000
5 000
6 000
7 000
8 000
9 000
2000 2010 2020 2030 2040 2050
Electricity generation (TW
h)
CEA without energy efficiency
CEA with energy efficiency
ETP Baseline
ETP BLUE Map
Sources: Verma, 2008; IEA, 2010a.
Total Indian electricity demand in 2007/08 stood at 717 kWh per capita (based on UN practice17) (CEA, 2009a); an increase of 6.7% over the previous year. For the residential sector, electrical energy sales to domestic consumers amounted on average to 106 kWh in 2007/08, with a range from 18 kWh/cap in Bihar to 424 kWh/cap in Delhi.
Table 3.2: Residential electricity demand in India and emerging economies with similar climate in Asia
2007 Population Per‐capita income Residential electricity demand
(million) (USD 2000 (PPP)/cap) (ktoe) (kWh/cap)
Singapore 4.6 29 603 587 1 795
Malaysia 26.5 10 934 1 598 858
Thailand 63.8 8 585 2 412 477
India 1 123.3 3 583 10 408 125
Source: IEA, 2009b.
17 UN practice for the per‐capita electricity consumption is calculated on the basis of the gross electricity generation during the year.

© OECD/IEA 2011 Technology Development Prospects for the Indian Power Sector
Page | 61
Comparing these levels of electricity use to those of other countries in similar climate zones gives some insight into future domestic demand development in India. Singapore, Malaysia and Thailand are in a similar climate zone but with much higher income levels. Their statistics suggest a clear relation between income levels and per‐capita residential electricity demand (Table 3.2). Given a projected GDP per‐capita growth of a factor of 5.7 between 2007 and 2050 in India, one would expect the growth of residential electricity demand per capita to rise by a similar amount, to over 800 kWh/cap per year in 2050.
This implies that the average residential electricity consumption per capita in India would reach nearly twice the current Delhi demand level in 2050. The demand would be at a similar level to the current level of Malaysia, but still well below that of Singapore. In combination with an assumed 44% population growth between 2007 and 2050, this would result, excluding any efficiency improvements, in a residential electricity demand of 1 311 TWh, some 12 times the demand level of 2006/07.
A breakdown for all demand categories in India in the BLUE Map Scenario is given in Table 3.3. In total, the final electricity demand grows in the BLUE Map Scenario from 567 TWh in 2007 to 3 168 TWh in 2050. On the production side (industry, commerce and agriculture), significant changes are expected as the economy grows nearly eightfold. This implies a massive expansion of the commercial/services sector (by a factor of six), a significant expansion of manufacturing activity, and more limited growth of activity in agriculture. However, water needs to be pumped from increasing depth and this is the main source of electricity demand in agriculture.
Table 3.3: Final electricity demand breakdown and projection for BLUE Map Scenario
TWh/yr 2006/07 2050
Domestic 121 994
Commercial 44 283
Industry 257 1 202
Transport 12 532
Agriculture and other 133 156
Total 567 3 168
Note: The projections for industry are based on IEA analysis (IEA, 2009c).
Sources: IEA, 2009b; IEA, 2010a; IEA, 2009c.
Power capacity and generation projections
Assuming that the transmission and distribution losses can be reduced to 15% in 2050, about 3 700 TWh of electricity production is needed in the BLUE Map Scenario in 2050. At full load, 114 GW can generate 1 000 TWh per year. However, in practice plants operate on average far below the maximum load. This is related partly to energy resource availability (e.g. for variable renewables) and partly to fluctuations in demand during the year.
India had about 168 GW of total installed capacity in 2008, with an average load factor of 48%. Table 3.4 shows the power capacity in the ETP Baseline and BLUE Map Scenarios in 2050 (IEA, 2010a). The total capacity in 2050 is between 3.8 and 4.5 times the installed capacity in 2008. However, the mix of resources used is quite different.
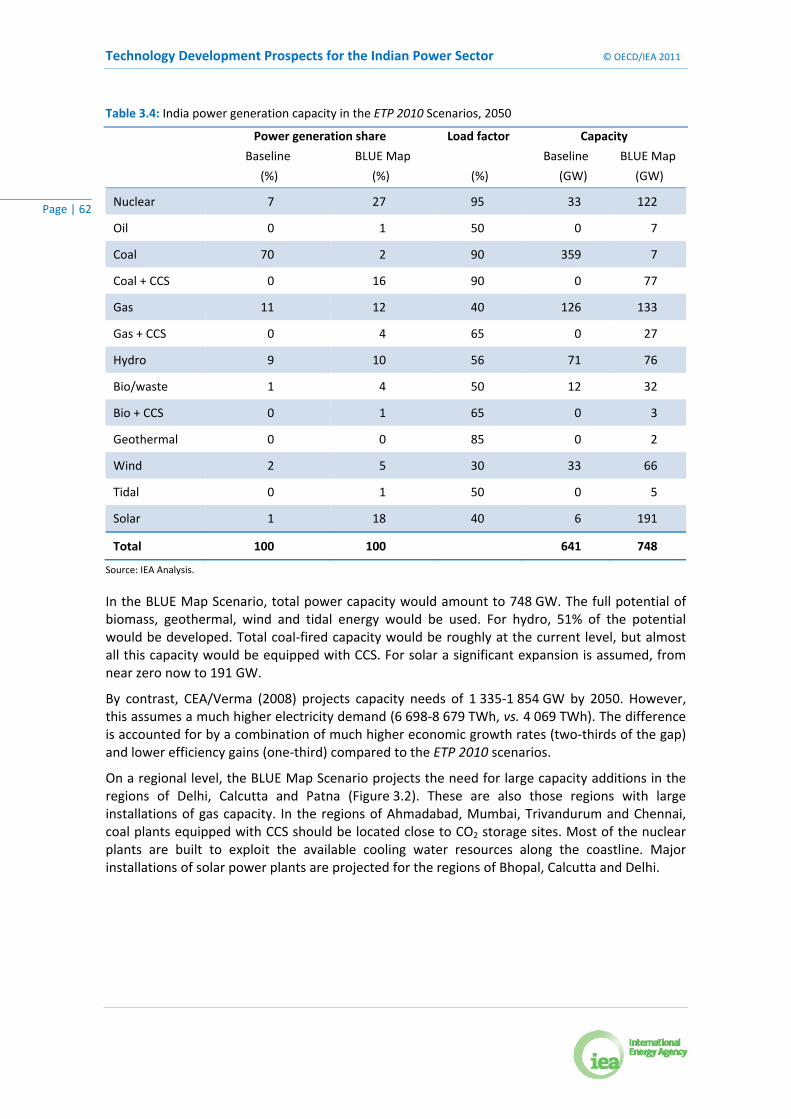
Technology Development Prospects for the Indian Power Sector © OECD/IEA 2011
Page | 62
Table 3.4: India power generation capacity in the ETP 2010 Scenarios, 2050
Power generation share Load factor Capacity
Baseline BLUE Map Baseline BLUE Map
(%) (%) (%) (GW) (GW)
Nuclear 7 27 95 33 122
Oil 0 1 50 0 7
Coal 70 2 90 359 7
Coal + CCS 0 16 90 0 77
Gas 11 12 40 126 133
Gas + CCS 0 4 65 0 27
Hydro 9 10 56 71 76
Bio/waste 1 4 50 12 32
Bio + CCS 0 1 65 0 3
Geothermal 0 0 85 0 2
Wind 2 5 30 33 66
Tidal 0 1 50 0 5
Solar 1 18 40 6 191
Total 100 100 641 748
Source: IEA Analysis.
In the BLUE Map Scenario, total power capacity would amount to 748 GW. The full potential of biomass, geothermal, wind and tidal energy would be used. For hydro, 51% of the potential would be developed. Total coal‐fired capacity would be roughly at the current level, but almost all this capacity would be equipped with CCS. For solar a significant expansion is assumed, from near zero now to 191 GW.
By contrast, CEA/Verma (2008) projects capacity needs of 1 335‐1 854 GW by 2050. However, this assumes a much higher electricity demand (6 698‐8 679 TWh, vs. 4 069 TWh). The difference is accounted for by a combination of much higher economic growth rates (two‐thirds of the gap) and lower efficiency gains (one‐third) compared to the ETP 2010 scenarios.
On a regional level, the BLUE Map Scenario projects the need for large capacity additions in the regions of Delhi, Calcutta and Patna (Figure 3.2). These are also those regions with large installations of gas capacity. In the regions of Ahmadabad, Mumbai, Trivandurum and Chennai, coal plants equipped with CCS should be located close to CO2 storage sites. Most of the nuclear plants are built to exploit the available cooling water resources along the coastline. Major installations of solar power plants are projected for the regions of Bhopal, Calcutta and Delhi.

© OECD/IEA 2011 Technology Development Prospects for the Indian Power Sector
Page | 63
Figure 3.2: Power capacities by region in the BLUE Map Scenario, 2050
Electricity demand (TWh)
> 400
300 - 400
200 - 300
100 - 200
50 - 100
0 - 50
120
60
30
Power capacity by energy source (GW)
Coal
Coal + CCS
Oil
Gas
Gas + CCS
Nuclear
Hydro
Biomass and waste
Biomass and waste + CCS
Wind
Solar
Other
Note: The boundaries and names shown and the designations used on maps included in this publication do not imply official endorsement or acceptance by the IEA.
In the Baseline Scenario, India’s total CO2 emissions grow almost fivefold, from 1.34 Gt in 2007 to 6.45 Gt in 2050. The drastic growth in electricity demand combined with the reliance on coal for power generation leads to an increase of CO2 emissions in the power sector from 0.75 Gt in 2007 to 2.87 Gt in 2050. However, efficiency improvements in new coal power plants reduce the average CO2 intensity of electricity generation in the Baseline Scenario from 935 gCO2/kWh in 2007 to 707 gCO2/kWh in 2050.
In the BLUE Map Scenario, the global carbon price of USD 175/tCO2, which is required to achieve the 50% reduction in global CO2 emissions by 2050, reduces the total CO2 emissions of the Indian energy sector in 2050 by 73% compared to the Baseline Scenario. Relative to 2007, this emission level in 2050 of 1.47 Gt corresponds to a modest emission increase of 10%. India’s power sector gets essentially decarbonised in the BLUE Map Scenario. The shift to nuclear, CCS and solar power yields a dramatic decline in the average CO2 intensity of India’s power generation from 935 gCO2/kWh in 2007 to 79 gCO2/kWh in 2050.

Technology Development Prospects for the Indian Power Sector © OECD/IEA 2011
Page | 64
Box 5: Air cooling: an option for India?
Scenario variants for the Indian power sector
Scenarios for future electricity demand and the power generation mix of a strong‐growing economy such as India over the next four decades are highly uncertain. For that reason, alternative cases of the Baseline and the BLUE Map Scenario in ETP 2010 for India (IEA, 2010a) have been developed for this paper.
Baseline high‐demand case: Following the projections in CEA/Verma (2008), a higher economic growth for India than in the Baseline Scenario in ETP 2010 (IEA, 2010a) has been assumed. Assuming an average economic growth of 8% per year between 2010 and 2030 and of 5.8% thereafter up to 2050, India’s electricity generation would be expected to reach 6 600 TWh in 2050 compared to 4 069 TWh in the standard Baseline Scenario.
BLUE high‐demand case: Based on the same economic growth as in the Baseline strong growth case for India, electricity generation is estimated to amount to 5 000 TWh in 2050 compared to 3 700 TWh in the BLUE Map Scenario (Figure 3.3).
For any thermal power plant, once‐through cooling systems using fresh water and seawater are less costly to build and more energy efficient than systems using wet recirculation through cooling towers or ponds. Thus, the siting of coal and nuclear power plants on coastlines is usually preferable, when other considerations allow.
For inland locations without suitable access to cooling water, alternative solutions do exist. Siemens has demonstrated in Australia with the 750 MW coal power plant (at Kogan Creek) that it is possible to operate a coal plant with almost no cooling water consumption (Siemens, 2008). By means of a special air‐cooled condenser (ACC), the plant uses air instead of water to cool the hot steam (60°C to 80°C) leaving the plant turbine. Within the ACC, fans nine metres in diameter blow air against the metal sheets from below to cool and finally condense the steam. Five hundred litres of water per second flow into a collector at the lower end of the heat exchanger and then into a tank, from where pumps feed it back into the power plant to generate steam. The power plant cannot operate entirely without fresh water, however. Water drawn from deep bores replenishes losses in the steam cycle of the turbines and serves as cooling water for the electrical equipment, which cannot be cooled with air alone. Nevertheless, with its water savings rate of 90%, Kogan Creek far outperforms comparable power plants when it comes to economy of water use. This saving offers extra reserves in extremely dry periods, when water‐cooled power plants are forced to scale back their output. At Kogan Creek, the plant’s operators run it at its full capacity of 750 MW even at temperatures well over 40°C. Moreover, with its 45% efficiency, it is one of the most efficient power plants in the country. In terms of reduced water needs, air cooling could be an ideal solution for coal‐based power generation in arid regions. However, while the whole power plant uses less than 10% of the water required for a wet‐cooled plant (about 0.25 litre/kWh), the large fans consume a lot of power (around 1% to 1.5% of the power station's output) (WNA, 2010b).
Like Kogan Creek, another Australian coal‐fired power station at Millmerran (840 MW supercritical) uses ACC, as do two plants in South Africa (Matimba and Majuba). South African experience puts ACC cost at about 50% more than recirculating wet cooling. An ACC typically requires an investment of INR 2 700/kW to 3 150/kW (USD 60/kW to 70/kW).

© OECD/IEA 2011 Technology Development Prospects for the Indian Power Sector
Page | 65
Figure 3.3: Electricity demand projections for India in the power sector variants, 2007‐2050
0
1 000
2 000
3 000
4 000
5 000
6 000
7 000
2000 2010 2020 2030 2040 2050
Electricity generation (TW
h)
IEA Baseline
IEA BLUE Map
IEA Baseline high‐demand
IEA BLUE high‐demand
In addition, it has been assumed that higher construction rates for new nuclear power plants in India can be achieved: 5.3 GW per year compared to 3.1 GW per year in the BLUE Map Scenario. This construction rate assumption follows the one for India used in a global high nuclear variant of the BLUE Map Scenario in ETP 2010 (IEA, 2010a). It results in an installed nuclear capacity in India of 216 GW in 2050, more than 10% of the global nuclear capacity of 2 000 GW in this scenario. The Indian nuclear capacity figure for 2050 lies between the optimistic (275 GW) and the pessimistic (208 GW) scenarios in the IEP report of the Indian government (GoI, 2006). It is also assumed that the feasible hydro potential of almost 150 GW in India can be exploited to a large degree by 2050. Carbon capture and storage for power generation is assumed not to be available as a mitigation option in this low‐carbon scenario for India.
The capacity needs in the Baseline strong growth case increase to almost 1 000 GW. Assuming that nuclear and hydro capacity in the strong growth case cannot be expanded beyond the level in the standard scenario, more than two‐thirds of the capacity in 2050 would be based on coal (Table 3.5). As a consequence, CO2 emissions of the power sector would increase from 2.8 Gt in 2050 in the standard Baseline Scenario to almost 5 Gt in the high demand case. In the high demand case of the BLUE Scenario, nuclear provides one‐half of the electricity in 2050. Of the other two major low‐carbon generation options, solar covers 22% and hydro 11% of electricity demand.
In the absence of CCS in the BLUE strong growth case, gas becomes the most attractive fossil generation option, covering the remaining demand for electricity. In relative terms the share of gas in power generation in this case is, at 16%, similar to the BLUE Map Scenario. Since the absolute generation from gas is, however, about 60% higher, gas imports increase by approximately 30 bcm in 2050, compared to a gas consumption in the power sector of 100 bcm in the BLUE Map Scenario in 2050.
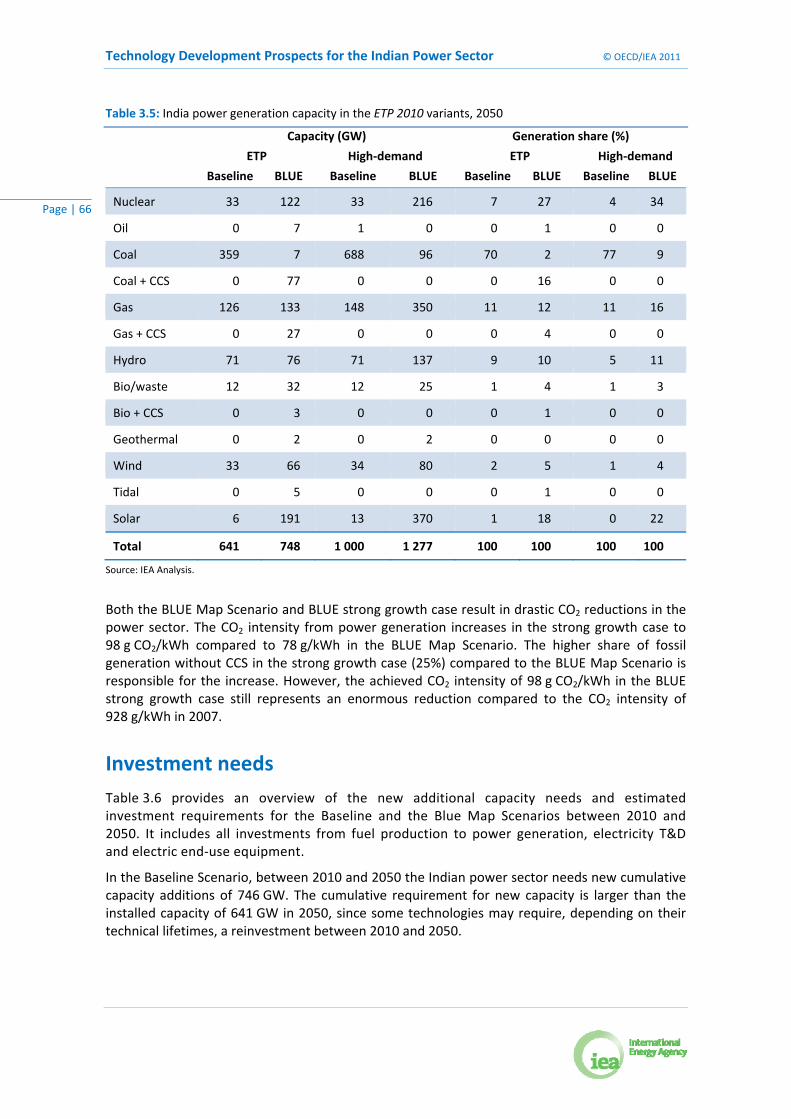
Technology Development Prospects for the Indian Power Sector © OECD/IEA 2011
Page | 66
Table 3.5: India power generation capacity in the ETP 2010 variants, 2050
Capacity (GW) Generation share (%)
ETP High‐demand ETP High‐demand
Baseline BLUE Baseline BLUE Baseline BLUE Baseline BLUE
Nuclear 33 122 33 216 7 27 4 34
Oil 0 7 1 0 0 1 0 0
Coal 359 7 688 96 70 2 77 9
Coal + CCS 0 77 0 0 0 16 0 0
Gas 126 133 148 350 11 12 11 16
Gas + CCS 0 27 0 0 0 4 0 0
Hydro 71 76 71 137 9 10 5 11
Bio/waste 12 32 12 25 1 4 1 3
Bio + CCS 0 3 0 0 0 1 0 0
Geothermal 0 2 0 2 0 0 0 0
Wind 33 66 34 80 2 5 1 4
Tidal 0 5 0 0 0 1 0 0
Solar 6 191 13 370 1 18 0 22
Total 641 748 1 000 1 277 100 100 100 100
Source: IEA Analysis.
Both the BLUE Map Scenario and BLUE strong growth case result in drastic CO2 reductions in the power sector. The CO2 intensity from power generation increases in the strong growth case to 98 g CO2/kWh compared to 78 g/kWh in the BLUE Map Scenario. The higher share of fossil generation without CCS in the strong growth case (25%) compared to the BLUE Map Scenario is responsible for the increase. However, the achieved CO2 intensity of 98 g CO2/kWh in the BLUE strong growth case still represents an enormous reduction compared to the CO2 intensity of 928 g/kWh in 2007.
Investment needs
Table 3.6 provides an overview of the new additional capacity needs and estimated investment requirements for the Baseline and the Blue Map Scenarios between 2010 and 2050. It includes all investments from fuel production to power generation, electricity T&D and electric end‐use equipment.
In the Baseline Scenario, between 2010 and 2050 the Indian power sector needs new cumulative capacity additions of 746 GW. The cumulative requirement for new capacity is larger than the installed capacity of 641 GW in 2050, since some technologies may require, depending on their technical lifetimes, a reinvestment between 2010 and 2050.

© OECD/IEA 2011 Technology Development Prospects for the Indian Power Sector
Page | 67
Table 3.6: Power sector investment needs in India in Baseline and BLUE Map Scenarios
New capacity Costs
Baseline BLUE Map Baseline BLUE Map
(GW) (GW) (billion USD) (billion USD)
Nuclear 33 122 74 279
Oil 0 7 0 5
Coal 451 54 688 80
Coal + CCS 0 77 0 175
Gas 126 133 86 90
Gas + CCS 0 27 0 27
Hydro 43 46 86 93
Bio/waste 12 32 26 68
Bio + CCS 0 3 0 9
Geothermal 0 2 0 8
Wind 62 96 98 129
Tidal 0 5 1 12
Solar 19 222 41 421
Efficient lighting 23 29
Efficient equipment 457
Efficient motor systems 22 29
Transmission and distribution 1 021 1 718
Electricity storage 10 35 5 18
Total electricity related 2 171 3 647
Gas offshore fields (bcm) 100 100 118 118
Gas LNG terminals (bcm) 80 80 10 10
Gas pipelines (bcm) 180 180 81 81
Total gas 209 209
Coal mines (Mtcoe) 1029 0 64 0
Coal harbours (Mtcoe) 405 424 32 34
Coal railroads (Mtcoe) 1029 0 126 0
Total coal 303 115
Total all 2 683 3 971
Source: IEA analysis.

Technology Development Prospects for the Indian Power Sector © OECD/IEA 2011
Page | 68
Overall, the power sector in the Baseline Scenario has a capital requirement of USD 2.2 trillion. The BLUE Map scenario results in new capacity additions on the generation side of 826 GW. The capital requirements for power generation, T&D and efficient electric end‐use equipment are USD 3.6 trillion, almost 80% higher than in the Baseline scenario. On the generation side, the additional investment is needed to fund higher capacities for nuclear, CCS and solar power. Further capital is needed for the expansion of the grid to connect solar plants in remote areas with demand centres, and for more efficient electric equipment in the end‐use sectors.
The analysis also includes costs for coal and gas supply infrastructure, which is very important for the power sector. For natural gas, the Baseline and the BLUE Map Scenarios show quite similar natural gas infrastructure needs, of maximum gas use by 2050 of 180 bcm in total and 100 bcm in power generation. About 30 bcm would be delivered from existing fields, 50 bcm from new fields and 100 bcm from LNG imports. This would imply an almost tenfold increase of LNG imports between 2008 and 2050, or six new, very large 10 Mt/year LNG regasification facilities. Overall, the gas infrastructure in both scenarios requires investment of around USD 209 billion.
For coal supply, in the Baseline Scenario India relies to a large degree on domestic production, which despite the additional rail transport costs is more cost‐effective than the use of imported coal. The capital needs for coal supply amount to USD 303 billion in the Baseline Scenario. In the BLUE Map Scenario by contrast, the use of imported coal is more attractive than the mining of domestic Indian coal, since the coal import price is lower than in the Baseline Scenario as a result of the lower global coal demand. The investments for the coal supply infrastructure of USD 115 billion in the BLUE Map Scenario are mainly related to expansion of the harbour infrastructure.
Total investment costs in the Baseline Scenario, including power generation, T&D, electric end‐use equipment, and coal and gas supply, are USD 2.7 trillion. In the BLUE Map Scenario, these investment needs increase to USD 4.0 trillion. The addition of almost 50% in the BLUE Map Scenario may initially appear huge. Comparing the investment needs for the power sector, however, with India’s cumulative gross domestic product (PPP based in 2008 prices) of USD 855 trillion between 2010 and 2050, the total investment needs related to power generation in the Baseline and BLUE Map scenario represent only a range of 0.3 to 0.5% of total cumulative GDP.
Conclusions: Towards a power sector decarbonisation strategy
Several characteristics make the Indian power sector very different from those in the other three regions analysed in ETP 2010 (China, Europe and the United States). First, the demand growth in percentage terms is expected to be much higher. This means that virtually the whole power system must be re‐planned from scratch, which opens up interesting opportunities to truly transform the power sector. Second, while coal is an important indigenous energy resource, the coal quality is much lower than elsewhere. Thus, Indian coal is not per se the most economic supply option: coal imports or other power supply options are often more cost‐effective. Third, renewable resources, with the exception of solar, are limited in India, particularly when considered in relation to the demand growth forecast for the coming decades.
Nuclear and coal with CCS represent two alternative, carbon‐free supply options.
Clearly, nuclear power must play a crucial role in a CO2‐free electricity supply in India. The prospects for nuclear have improved dramatically in recent years thanks to two factors: the agreement between India and the United States in 2005 lifting a three‐decade US moratorium on nuclear trade with India and allowing the IAEA to inspect civilian nuclear facilities, and in 2008 the consent of the Nuclear Suppliers Group to India’s trade with non‐members of the Non‐

© OECD/IEA 2011 Technology Development Prospects for the Indian Power Sector
Page | 69
Proliferation Treaty. The option to use imported uranium in combination with an Indian LWR design may present an alternative (or at least complementary) strategy to developing the thorium‐based nuclear industry.
The urgency of reducing CO2 emissions is increasing: if full decarbonisation is to be achieved, coal with CCS must be part of the solution. CCS is a relatively new concept in CO2‐free electricity supply, and development of a technology suited for Indian coal will require special attention. However, the complexity of this technology and its impact on electricity cost make it a less attractive option for India in the short term. For coal with CCS, it is important to investigate the suitability of different methods of capture (oxy‐fuelling, pre‐combustion and post‐combustion CO2 capture) for Indian coal, which suffers from high ash content. Therefore, pre‐combustion capture would require the adaptation of IGCC technology to Indian coal quality or instead the use of imported coal, but would offer additional benefits such as higher efficiency.
Solar is the only option with a large technical potential, and must be included in the decarbonisation strategy for India. However, its use is starting from a very low level of installed capacity and a much more ambitious approach is needed for both PV and CSP. India needs to capitalise on solar investment opportunities in the short and medium term.
Providing electricity access for poor rural villages also requires immediate attention. Continuing and expanding programmes to develop decentralised solar systems with storage, and other types of decentralised renewable supply options, could enable the achievement of this important goal.
This analysis has generally taken a long‐term perspective, but short‐term options to use electricity more efficiently should not be neglected. Maximising transmission and distribution efficiency, together with end‐use efficiency, should be top priorities. Many of these options are already cost‐effective, if prices reflect the supply costs and are not distorted by subsidies. Instead of subsidising electricity use through too‐low tariffs, policies should support and subsidise the purchase of energy‐efficient appliances. Such a strategy may result in substantial savings and reduced demand growth.


© OECD/IEA 2011 Technology Development Prospects for the Indian Power Sector
Page | 71
Annex A: Regional results of the BLUE Map Scenario Table 3.6: Power sector investment needs in India in Baseline and BLUE Map Scenarios
Total
3 168
122
7
7
77
133
27
76
32
3
2
66
5
191
748
Agartala
18
0
1
0
0
0
2
0
0
0
17
20
Shillong
66
0
1
0
0
23
2
0
0
0
17
43
Gan
tok
2
0
1
0
0
9
2
0
0
0
17
29
Patna
243
0
0
0
44
11
0
2
0
2
0
17
76
Calcutta
344
10
2
0
0
44
5
0
2
0
0
1
27
92
Chennai
230
20
2
27
0
2
1
0
3
55
Trivan
durum
94
20
2
20
0
2
1
0
5
1
51
Ban
galore
195
10
0
0
12
2
0
7
1
32
Hyderabad
280
10
0
0
5
2
0
8
1
27
Mumbai
356
20
2
1.5
20
4
2
1
0
10
1
62
Ahmad
abad
186
20
1.5
10
0
2
1
0.3
7
0
17
59
Bhopal
239
0
0
0
0
2
0.3
6
0
32
40
Delhi
855
10
0
0
44
11
0
2
0.3
18
0
32
118
Srinagar
60
0
0
0
23
2
1
0
0
17
43
Final demand
(TWh)
Nuclear (GW)
Oil (GW)
Coal (GW)
Coal w CCS
(GW)
Gas [GW]
Gas w CCS
(GW)
Hydro (GW)
Bio/w
aste
(GW)
Bio w CCS
(GW)
Geotherm
al
(GW)
Wind (GW)
Tidal 9GW)
Solar (GW)
Total (GW)


© OECD/IEA 2011 Technology Development Prospects for the Indian Power Sector
Page | 73
Annex B: The IEA power sector model for India The analysis of the Indian power sector is based on the ETP MARKAL model, complemented by a geographically more detailed spreadsheet‐based simulation model. While the MARKAL model contains no geographical information, the simulation model divides India into 14 regions (Figure B.1).
Figure B.1: Map of India showing simulation model structure
Trivandrum
Chennai
Bangalore
Hyderabad
Bhopal
New Delhi
Mumbai
Ahmadabad
Srinagar
Patna
Calcutta
Gantok
Shillong
Agartala
Note: The boundaries and names shown and the designations used on maps included in this publication do not imply official endorsement or acceptance by the IEA.
The simulation model allows analysis of the Indian power sector in more detail, taking into account regional characteristics on the supply and demand side of electricity within India. At each of the 14 nodes the simulation model describes the development of the power sector based on electricity demand in terms of existing capacity, new capacity additions by technology type, and input fuel demand. Regional restrictions, such as fossil resources or renewable potentials, are taken into account. Trade in electricity, coal and gas between the 14 nodes as well as the necessary transport infrastructure is also depicted in the simulation model. The assumed trade links and the transport distances between the model nodes, which influence the investment costs and thereby the overall costs for energy trade between the regions, are shown in Figure B.2.
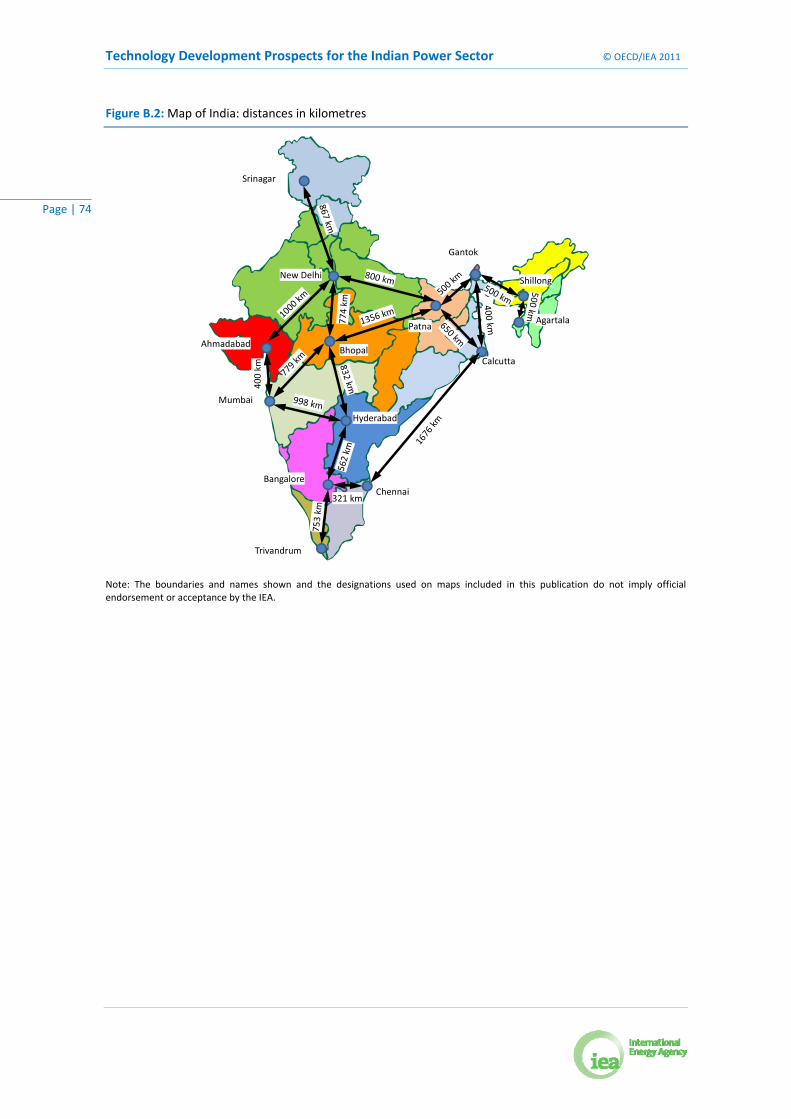
Technology Development Prospects for the Indian Power Sector © OECD/IEA 2011
Page | 74
Figure B.2: Map of India: distances in kilometres
Trivandrum
Chennai
Bangalore
Hyderabad
Bhopal
New Delhi
Mumbai
Ahmadabad
Srinagar
Patna
Calcutta
Gantok
Shillong
Agartala
400 km
321 km
Note: The boundaries and names shown and the designations used on maps included in this publication do not imply official endorsement or acceptance by the IEA.

© OECD/IEA 2011 Technology Development Prospects for the Indian Power Sector
Page | 75
Annex C: Abbreviations and units Abbreviations
AC alternating current
ACC air‐cooled condensers
ABWR advanced boiling water reactor
AHWR advanced heavy water reactor
APR‐1400 advanced pressurised reactor, 1400 MW capacity
BEE Bureau of Energy Efficiency
BHEL Bharat Heavy Electricals Limited
C Celsius
CBM coalbed methane
CCS carbon capture and storage
CDM Clean Development Mechanism
CEA Central Electricity Authority
CERC Central Electricity Regulatory Commission
CFBC circulating fluidised‐bed combustion
CO2 carbon dioxide
CSP concentrating solar power
DAE Department of Atomic Energy
DC direct current
EPR European pressurised reactor
ETP Energy Technology Perspectives
EWPL East‐West pipeline
FBC fluidised‐bed combustion
FBR fast breeder reactor
GAIL Gas Authority of India Limited
GDP gross domestic product
GHG greenhouse gas
HBJ Hazira‐Bijaypur‐Jagdishpur gas pipeline
HVJ Hazira‐Vijaipur‐Jagdishpur gas pipeline
IAEA International Atomic Energy Agency
IEA International Energy Agency
IEP Integrated Energy Policy

Technology Development Prospects for the Indian Power Sector © OECD/IEA 2011
Page | 76
IGCC integrated gasification combined‐cycle
IPCC Intergovernmental Panel on Climate Change
IR Indian Railways
LED light‐emitting diode
LNG liquefied natural gas
LWR light water reactor
MER market exchange rate
MNRE Ministry of New and Renewable Energy (India)
MoF Ministry of Finance (India)
MoP Ministry of Power (India)
MPNG Ministry of Petroleum and Natural Gas (India)
NAPCC National Action Plan on Climate Change (India)
NEP National Electricity Policy (India)
NGCC natural gas combined‐cycle
NMEEE National Mission on Enhanced Energy Efficiency (India)
NOx nitrogen oxides
NPCIL Nuclear Power Corporation of India Limited
NTP National Tariff Policy (India)
NTPC National Thermal Power Corporation (India)
OECD Organisation for Economic Co‐operation and Development
PFBC pressurised fluidised bed combustion
PHWR pressurised heavy water reactor
PLF plant load factor
PPP purchasing power parity
PV photovoltaic
R&D research and development
REC renewable electricity certificate
REP Rural Electrification Policy
RM&U renovation, modernisation and up‐rating
RPO renewable purchase obligation
SEB State Electricity Board (India)
SERC State Electricity Regulatory Commission (India)
T&D transmission and distribution
TERI The Energy and Resources Institute (India)
TPES total primary energy supply

© OECD/IEA 2011 Technology Development Prospects for the Indian Power Sector
Page | 77
UMPP Ultra‐mega Power Project (India)
UNFCCC United Nations Framework Convention on Climate Change
UT Union Territory (India)
VVER Vodo‐Vodyanoi Energetichesky Reactor (Water‐Water Energetic Reactor)
Units
bcm billion cubic metres = 109 cubic metres
bt billion tonne = 109 tonnes
cap capita
g grammes
GJ gigajoule = 109 joules
Gt gigatonne = 109 tonnes
Gtcoe gigatonne coal equivalent
GW gigawatt = 109 watt
GWh gigawatt‐hour = 109 watt x 1 hour
ha hectare
INR Indian rupee
km kilometre
km2 square kilometres
kt kilotonne
kV kilo volt = 103 volt
kWh kilowatt‐hour = 103 watt x hour
MJ megajoule = 106 joules
Mtcoe million tonne coal equivalent = 106 tonne of coal equivalent
Mtoe million tonne of oil equivalent = 106 tonne of oil equivalent
MW megawatt = 106 watt
ppm parts per million
t tonne
toe tonne of oil equivalent
TWh Terawatt‐hour = 1012 watt x 1 hour
USD United States dollar
W watt

© OECD/IEA 2011 Technology Development Prospects for the Indian Power Sector
Page | 79
Annex D: References Ajai, Arya, A.S., Dhinwa, P.S., S.K. Pathan and K. Ganesh Raj (2009), “Desertification/land degradation
status mapping of India”, Current Science, Vol. 97, No. 10.
Alagh, Y.K. (2010), “Transmission and Distribution of Electricity in India Regulation, Investment and Efficiency”, http://www.oecd.org/dataoecd/35/33/46235043.pdf.
Arora, D.S., S. Busche, S. Cowlin, T. Engelmeier, H. Jaritz, A. Milbrandt and S. Wang (2010), “Indian Renewable Energy Status Report: Background Report for DIREC 2010”, NREL/TP‐6A20‐48948, US Department of Energy, Oak Ridge, USA.
Banerjee, R. (2008), “Renewable Power Generation in India: Establishing Feasible Targets”, presentation at IIASA seminar, Laxenburg, 4 June, www.me.iitb.ac.in/~rangan/professional_activity/Renpower.pdf.
Bassi, S. (n.d.), “Bureau of Energy Efficiency and Energy Conservation Building Code: An Overview”, undated Powerpoint presentation, BEE, www.hareda.gov.in/SHABNAM.ppt.
BEE (Bureau of Energy Efficiency, Government of India) (2009), BEE Agricultural Demand Side Management Programme, 2009, Government of India.
Bertani, R. (2009), “Geothermal energy: an overview on resources and potential”, presentation at International Geothermal Days Slovakia 2009, Conference and Summer School, May 26‐29, Častá‐Papiernička.
BGR (Bundesanstalt für Geowissenschaften und Rohstoffe, Federal Institute for Geosciences and Natural Resources) (2009), Energy Resources 2009: Reserves, Resources, Availability, BGR, Hannover, www.bgr.bund.de/cln_144/nn_335082/EN/Themen/Energie/Produkte/energyresources__2009.html?__nnn=true.
Bhushan, C. (2010), Challenge of the New Balance, Centre for Science and Environment, New Delhi.
BNEF (Bloomberg New Energy Finance) (2010a), Industry Intelligence, Renewable Energy Assets Database.
BNEF (2010b), India, Solar‐PV value chain, Research Note, November 23.
Bootsveld,N.R. and J. Afink (2002), “Summary of the investigation evaluation technology dew point cooling”, TNO report R2002/576 Summary, http://oxy‐com.com/cmsfiles/PDF/TNO%20Report%20‐%20Summary%20English.pdf.
Buragohain B., P. Mahanta and V.S. Moholkar (2010), “Biomass Gasification for Decentralized Power Generation: The Indian Perspective”, Renewable and Sustainable Energy Reviews, Vol. 14, pp. 73‐92.
CEA (2008a), “Annual Report 2007/08”, Central Electricity Authority, New Delhi.
CEA (2008b), “Major Transmission Network of India”, Central Electricity Authority, New Delhi.
CEA (2009a), “All India Electricity Statistics 2009, General Review 2009”, Central Electricity Authority, New Delhi.
CEA (2009b), “Growth of Electricity Sector in India from 1947‐2009”, Central Electricity Authority, New Delhi.
CEA (2010a), “Monthly Review of Power Sector 31 July 2010”, Central Electricity Authority, New Delhi.
CEA (2010b), “Load Generation Balance Report, 2010‐11”, Central Electricity Authority, New Delhi.
CERC (Central Electricity Regulatory Commission) (2010a), “Determination of Generic Levellised Generation Tariff under Regulation 8 of the Central Electricity Regulatory Commission”, Petition No.256/2010, CERC, New Delhi.
CERC (2010b), “Determination of Benchmark Capital Cost Norm for Solar PV Power Projects and Solar Thermal Power Projects Applicable During FY 2011‐12”, Petition No.255/2010, CERC, New Delhi.
Technology Development Prospects for the Indian Power Sector © OECD/IEA 2011
Page | 80
Chakarvarti, K.K., “Indo‐German Energy Programme: Thermal Power Plant Optimization Component”, presentation at Workshop on Adoption of energy efficient process technologies & practices and implementation of Energy Conservation Act 2001 in Power Plants, New Delhi, November 29.
Chandrasekharam, D. (2000), “Geothermal Resources of India”, presentation at Geothermal Power Asia 2000, February.
Chikkatur, A.P. and A.D. Sagar (2007), “Cleaner Power in India: Towards a Clean‐Coal‐Technology Roadmap”, Belfer Center Discussion Paper 2007‐06, December 2007, Harvard University.
CMA (China Meteorological Association) (2010), “Detailed investigation of wind energy resources: wind energy development potential of over 2.5 billion kilowatts”, 5 January, http://www.cma.gov.cn/mtjj/201001/t20100105_55807.html (on Chinese).
C‐WET (Centre for Wind Energy Technology) (2010), “Revised List of Models and Manufacturers of Wind Turbines, 18.05.2010 ”, www.windpowerindia.com/index.php?option=com_content&view=article&id=16&Itemid=20
DAE (Department of Atomic Energy) (n.d.), “Document 10: Strategy for Growth of Electrical Energy in India”, www.dae.gov.in/publ/doc10/index.htm.
DOE (US Department of Energy) (2009), “Alternative Bagasse Cogeneration(Greenhouse Gas Pollution Prevention Project)”, www.pi.energy.gov/documents/EWSLindia.pdf.
Electrical Monitor (2009), “Hydro Power Gears up for XII Plan”, Electrical Monitor, 1 December, www.electricalmonitor.com/GENERAL/hydro‐power‐gears‐up‐for‐xii‐plan.
Electrical Monitor (2010), “Rajasthan Takes Lead in Tariff‐Based Power Transmission”, Electrical Monitor, 10 November, www.electricalmonitor.com/T&D/rajasthan‐takes‐lead‐in‐tariffbased‐power‐transmission.
Eliasson, L. (2008), Geothermal potential in Europe, http://eng.idnadarraduneyti.is/media/Acrobat/Geothermal_Potential_in_Europe_Enex_080201_Larus_Eliasson.ppt.
ESHA (European Small Hydropower Association) (2005), “Blue energy for a green Europe: strategic study for the development of small hydro power in the European Union”, Brussels, http://www.esha.be/fileadmin/esha_files/documents/publications/publications/BlueAGE.pdf.
Eurostat (2010), Statistics: Supply, transformation, consumption ‐ electricity ‐ annual data (nrg_105a), last updated 23 October, http://epp.eurostat.ec.europa.eu/portal/page/portal/statistics/search_database.
Garg, A., S. Bhattacharya, P.R. Shukla and V.K. Dadhwal (2001), “Atmospheric and Sectoral Assessment of Greenhouse Gas Emissions in India”, Atmospheric Environment, No. 35, pp. 2679‐2695.
GEDA (Gujarat Energy Development Agency) (2003), “Tidal energy“, www.geda.org.in/other_sources/other_re_sources.htm.
Glitnir (2007), “United States Geothermal Energy Market Report”, Glitnir Geothermal Research, September.
GoI (Government of India) (2003), The Electricity Act: 2003, Ministry of Law and Justice, GOI, New Delhi.
GoI (2006), “Integrated Energy Policy, Report of the Expert Committee”, Planning Commission, GoI, New Delhi.
GoI (2008), “National Action Plan on Climate Change”, Prime Minister’s Council on Climate Change, GoI, New Delhi.
GoI (2010), “Mid term Appraisal of the 11th Five‐Year Plan”, GoI, New Delhi, http://planningcommission.gov.in/plans/mta/11th_mta/MTA.html.

© OECD/IEA 2011 Technology Development Prospects for the Indian Power Sector
Page | 81
Gupta, P. (2008), “Super Critical Technology in NTPC India: A Brief Overview”, Presentation at Cleaner Coal Workshop On Solutions to Asia’s Growing Energy and Environmental Challenges, APEC Energy Working Group, Ha Long City, Vietnam, 19‐21 August, www.egcfe.ewg.apec.org/publications/proceedings/CleanerCoal/HaLong_2008/.
GWEC (Global Wind Energy Council) (2009), “Indian Wind Energy Outlook 2009”, GWEC, New Delhi.
Hall, D.G., Reeves, K.S., Brizzee, J., Lee, R.D., G.R. Carroll and G.L. Sommers (2006), “Feasibility Assessment of the Water Energy Resources of the United States for New Low Power and Small Hydro Classes of Hydroelectric Plants”, Idaho National Laboratory, January, http://www1.eere.energy.gov/windandhydro/pdfs/doewater‐11263.pdf.
Holm, A., L. Blodgett, D. Jennejohn and K. Gawell (2010), “Geothermal Energy: International Market Update May 2010”, GEA (Geothermal Energy Association).
IAEA (International Atomic Energy Agency) (2010), “Nuclear Technology Review 2010”, GC(54)/INF/3, 10 August, www.iaea.org/About/Policy/GC/GC54/GC54InfDocuments/English/gc54inf‐3_en.pdf.
IEA (International Energy Agency) (2007), World Energy Outlook 2007, IEA/OECD, Paris.
IEA (2008), Energy Technology Perspectives 2008, Scenarios & Strategies to 2050, IEA/OECD, Paris, www.iea.org/w/bookshop/add.aspx?id=330.
IEA (2009a), CO2 Emissions from Fuel Combustion, 2009 Edition, IEA/OECD, Paris.
IEA (2009b), Energy Balances of Non‐OECD Countries, 2009 Edition, IEA/OECD, Paris, www.iea.org/Textbase/publications/free_new_Desc.asp?PUBS_ID=1078.
IEA (2009c), Energy Technology Transitions for Industries: Strategies for the Next Industrial Revolution, IEA/OECD, Paris, www.iea.org/Textbase/publications/free_new_Desc.asp?PUBS_ID=2104.
IEA (2009d), Energy Balances of OECD Countries, 2009 Edition, IEA/OECD, Paris, www.iea.org/Textbase/publications/free_new_Desc.asp?PUBS_ID=2033.
IEA (2009e), World Energy Outlook 2009, IEA/OECD, Paris.
IEA (2010a), Energy Technology Perspectives 2010, Scenarios & Strategies to 2050, IEA/OECD, Paris.
IEA (2010b), Natural Gas in India, IEA/OECD, Paris.
IEA (2010c), World Energy Outlook 2010, IEA/OECD, Paris.
IEA (2010d), “Comparative Study on Rural Electrification Policies in Emerging Economies: Keys to Successful Policies”, working paper, IEA/OECD, Paris.
IEAGHG (IEA Greenhouse Gas) (2008), “A Regional Assessment of the Potential for CO2 Storage in the Indian Subcontinent”, IEAGHG R&D Programme Report 2008/2, IEA Environmental Projects Ltd. (Greenhouse Gas R&D Programme), Cheltenham, UK.
Indian Railways (IR) (2006), Freight rate tables, http://www.indianrailways.gov.in/indianrailways/directorate/traffic_comm/index.jsp.
IPCC (Intergovernmental Panel on Climate Change) (2007), Intergovernmental Panel on Climate Change Fourth Assessment Report, IPCC, Geneva.
IR (2010), Indian Railways Annual Statistical Statements 2008‐09, http://www.indianrailways.gov.in/indianrailways/directorate/stat_econ/downloads/Final_Railway_08‐09.pdf.
ISA (India Semiconductor Association) (2008), “Solar PV Industry: Global and Indian Scenario”, Supported by National Manufacturing Competitiveness Council (NMCC), ISA, Bangalore.
Jagannathan, V. (2010), “Indira Gandhi Centre for Atomic Research to Develop Advanced Boiler for Coal‐ Fired Power Plants”, India Vision, http://www.indiavision.com/news/article/scitech/99359/.

Technology Development Prospects for the Indian Power Sector © OECD/IEA 2011
Page | 82
Kakodkar, A. (2008), “Evolving Indian Nuclear Programme – Rationale and Perspective”, http://www.dae.gov.in/lecture/paperiasc.pdf.
Kanwarpal, V. (2009), “India: The New Nuclear Age”, The Energy Industry Times, January, p. 14.
Kapshe, M., A. Garg and P. R. Shukla (2002), “Application of AIM/Local Model to India Using Area and Large Point Sources”, in M. Kainuma, Y. Matsuoka and T. Morita (eds.), Climate Policy Assessment: Asia‐Pacific Integrated Modelling, Springer‐Verlag, Tokyo.
Lako, P., H. Eder, M. de Noord and H. Reisinger (2003), Hydropower Development with a Focus on Asia and Western Europe, Verbundplan and ECN.
Mathy, S. and C. Guivarch (2009), “What if Energy Decoupling of Emerging Economies Were Not so Spontaneous? An Illustrative Example on India”, CIRED working papers No. 13‐2009, CIRED, Nogent‐sur‐Marne, France.
Mathur, N. (2010), “Overview of Indian power sector”, presentation at Joint IEA‐India Workshop on Industrial Energy Efficiency, New Delhi, 27 January.
Mercados (2010), “Development of a Five Year Strategy for Ministry of New and Renewable Energy”, briefing paper, http://mnre.gov.in/pdf/strategic_plan_RE.pdf.
Mills, S.J. (2007), “Prospects for Coal and Clean Coal Technologies in India”, Report CCC/129, December 2007, IEA CCC (IEA Clean Coal Centre), London.
Ministry of Coal India (2010), “Annual report 2009‐2010”, Government of India, New Delhi.
MNRE (Ministry of New and Renewable Energy India) (2007), Renewable Energy Akshay Urja, newsletter of the Ministry of New and Renewable Energy, Vol. 3, No. 2, Government of India.
MNRE (2009a), “Jawaharlal Nehru National Solar Mission: Towards Building SOLAR INDIA”, Government of India, http://mnre.gov.in/pdf/mission‐document‐JNNSM.pdf.
MNRE (2009b), “Scheme for Implementation of Generation Based Incentives (GBI) for Grid Interactive Wind Power Projects”, 17 December, Government of India, www.mnre.gov.in/gbi‐scheme.htm.
MNRE (2010a), “Annual Report 2009‐10”, Government of India, http://mnre.gov.in/annualreport/2009‐10EN/index.htm.
MNRE (2010b), “Renewable Energy in India: Progress, Vision and Strategy”, Government of India, www.indiaenvironmentportal.org.in/files/mnre‐paper‐direc2010‐25102010.pdf.
MNRE (2010c), “Biomass Resource Atlas of India”, http://lab.cgpl.iisc.ernet.in/atlas/Default.aspx.
MoF (Ministry of Finance) (2008a), “Monthly economic report December 2007”, http://www.finmin.nic.in/stats_data/monthly_economic_report/2007/inddec07.pdf.
MoF (2008b), “Economic Survey 2007‐08”, http://indiabudget.nic.in/es2007‐08/esmain.htm.
MoF (2010), “Economic Survey 2009‐10”, http://indiabudget.nic.in/es2009‐10/esmain.htm .
MoP (Ministry of Power India) (2004), “Definition of electrified village”, http://rggvy.gov.in/rggvy/rggvyportal/index.html.
MoP (2008), “Hydro Power Policy 2008”, Government of India, New Delhi.
Mott MacDonald (2008), “British High Commission – UMPP Risk Analysis”, British High Commission, New Delhi, http://www.decc.gov.uk/assets/decc/what%20we%20do/global%20climate%20change%20and%20energy/tackling%20climate%20change/intl_strategy/dev_countries/india/umpp‐risk‐analysis.pdf.
MPNG (Ministry of Petroleum and Natural Gas India) (2009), “Basic Statistics on Indian Petroleum & Natural Gas 2008‐09”, September 2009, Government of India.

© OECD/IEA 2011 Technology Development Prospects for the Indian Power Sector
Page | 83
NDRC (National Development and Reform Commission) (2007), “Medium and long‐term development plan for renewable energy in China (abbreviated version, English draft)”, September, http://www.chinaenvironmentallaw.com/wp‐content/uploads/2008/04/medium‐and‐long‐term‐development‐plan‐for‐renewable‐energy.pdf.
NEA/IAEA (Nuclear Energy Agency/International Atomic Energy Agency) (2008), “Uranium 2007: Resources, Production and Demand”, OECD/NEA press release, OECD, Biggleswade, UK.
NREL (National Renewable Energy Laboratory, US Department of Energy) (2010), “80‐Meter Wind Maps and Wind Resource Potential”, US Department of Energy, http://www.windpoweringamerica.gov/wind_maps.asp.
NRSA (National Remote Sensing Agency) (2005), “Wasteland Atlas of India”, NRSA, Bangalore/Hyderabad.
Nunes, S. (2009), “Coal upgrading”, Report CCC/156, October 2009, IEA CCC (IEA Clean Coal Centre), London.
Oda, H. and Y. Tsujita (2010), “The Determinants of Rural Electrification in Bihar, India”, IDE discussion paper No. 254, https://ir.ide.go.jp/dspace/bitstream/2344/916/1/ARRIDE_Discussion_No.254_oda.pdf .
ONGC (Oil and Natural Gas Corporation of India) (2010), “ONGC begins Shale Gas exploration”, http://www.ongcindia.com/def1.asp?fold=headline&file=headline254.txt.
Paimpillil, S. J. and M. Baba (2009), “Linking of wave energy utilisation with coastal protection”, presentation at 2nd International Conference on the Palestinian Environment, 13‐15 October, Nablus.
Platts (2010), World Electric Power Plants Database 2009, Platts/McGraw‐Hill, New York.
Raghuram, G. and R. Gangwar (2008), “Indian Railways in the Past Twenty Years: Issues, Performance and Challenges”, W.P. No. 2008‐07‐05, Indian Institute of Management, Ahmedabad.
Ramanathan, K. and P. Abeygunawardena (2007), Hydropower Development in India: A Sector Assessment, ADB (Asian Development Bank), www.adb.org/Documents/Reports/Hydropower‐Devt‐India/Hydropower‐Devt‐India.pdf.
Ramesh, J. (2009), “India Opens up Nuclear to Private Sector”, The Energy Industry Times, January, p. 7.
Schwartz, M., D. Heimiller, S. Haymes, and W. Musial (2010), “Assessment of Offshore Wind Energy Resources for the United States”, Technical Report, NREL/TP‐500‐45889, US Department of Energy.
Shrivastava, M. (2009), “Solar Energy in India: On its feet, but can it win the marathon?”, presentation 6 December, Cancun, Mexico.
Siemens (2008), Siemens builds coal‐fired power station that operates without cooling water, Press release 13 June, http://www.siemens.co.za/en/news_press/news2008/index/june132008.htm.
Singh, A.K., V.A. Mendhe and A. Garg (2006), “CO2 Sequestration Potential of Geological Formations in India”, presentation at 8th International Conference on Greenhouse Gas Control Technologies, Trondheim, Norway, 19‐22 June.
SKM (Sinclair Knight Merz Consulting) (2009), “The case for ultra clean coal”, http://www.skmconsulting.com/Knowledge‐and‐Insights/Publications/Achieve‐Magazine/Previous‐Editions/2009/Issue‐1/09‐01‐06.aspx.
Sonde, R.R. (2007), “Carbon Capture and Storage: Indian Perspective ‐ Need for High End R&D and International Collaboration”, presentation at Overcoming Barriers to CCS Deployment Workshop, Paris, 27 March 2007.
Srivastava, S.K. (2010), “CBM Development in India”, presentation at Australia‐India Energy and Minerals Forum 2010, Australian Government Department of Resources, Energy and Tourism, Perth, 7‐8 June 2010.
Technology Development Prospects for the Indian Power Sector © OECD/IEA 2011
Page | 84
Suresh, P.R. and S. Elachola (2000), “Distribution Loss of Electricity and Influence of Energy Flows: A Case Study of a Major Section in Kerala”, Discussion Paper No. 23, Kerala Research Programme on Local Level Development, Thiruvananthapuram, India.
Thresher R. and W. Musial (2010), “Ocean Renewable Energy’s Potential Role in Supplying Future Electrical Energy Needs”, Oceanography, Vol. 23, No. 2, pp. 16‐21.
UBA (Umweltbundesamt, Federal Environment Agency Germany) (2009), “Role and Potential of Renewable Energy and Energy Efficiency for Global Energy Supply”, press release December 2009, UBA, Germany.
Verma, V.S. (2008), “Indian Scenarios and Technology Data”, Presentation at MoP/NTPC IEA‐ETP2010 workshop, New Delhi, 21 November 2008.
VTT Technical Research Institute of Finland (2007), “Bioenergy Technology Review”, internal report for IEA, Edita Prima, Helsinki.
Wang, Q. and Y. Chen (2010), “Status and outlook of China’s free‐carbon electricity”, Renewable and Sustainable Energy Reviews, 14, pp. 1014‐1025.
WEC (World Energy Council) (2009), India Energy Book – 2007 (Volume I & Volume II), WEC, www.indiaworldenergy.org/WEC‐IMC_publication.php.
WEC (2010), 2010 Survey of Energy Resources, WEC, London.
WIPO (World Intellectual Property Organization) (2010), “An Improved beneficiation process to produce low‐ash clean coal from high‐ash coals”, WO 2010/026600 A1, 11 March.
WNA (World Nuclear Association) (2010a), “Nuclear power in India”, WNA, www.world‐nuclear.org/info/inf53.html.
WNA (2010b), “Cooling power plants”, WNA, www.world‐nuclear.org/info/cooling_power_plants_inf121.html.
World Bank (2008), “Residential Consumption of Electricity in India: Documentation of Data and Methodology”, background paper draft, July 2008, World Bank, http://moef.nic.in/downloads/public‐information/Residentialpowerconsumption.pdf.
WPI (Wind Power India) (2010), “Manufacturers‐Wise Wind Electric Generators Installed in India (as on 31.03.2010)”, http://www.windpowerindia.com/index.php?option=com_content&view=article&id=19&Itemid=24.
Zaleski, C.P. and M. Cruciani (2009), “Nuclear Power in India”, in J. Lesourne and W.C. Ramsay (eds.), Energy in India’s Future: Insights, Institut Français des Relations Internationales (IFRI), Paris.


9 rue de la Fédération 75739 Paris Cedex 15
www.iea.org