the 2018 status report on engineering education: a
TRANSCRIPT

The 2018 Status Report on Engineering Education: A Snapshot of Diversity in Degrees Conferred in Engineering

THE 2018 STATUS REPORT ON ENGINEERING EDUCATION2
The Association of Public and Land-grant Universities
The Association of Public and Land-grant Universities (APLU) is a research, policy, and advocacy organization dedicated to strengthening and advancing the work of public universities in the U.S., Canada, and Mexico. With a membership of 238 public research universities, land-grant institutions, state university systems, and affiliated organizations, APLU’s agenda is built on the three pillars of increasing degree completion and academic success, advancing scientific research, and expanding engagement. The association’s work is furthered by an active and effective advocacy arm that works with Congress and the administration as well as the media to advance federal policies that strengthen public universities and benefit the students they serve.
Suggested Citation: Anderson, E. L., Williams, K. L., Ponjuan, L., & Frierson, H. (2018). The 2018 Status Report on Engineering Education: A Snapshot of Diversity in Degrees Conferred in Engineering, Association of Public & Land-grant Universities: Washington, D.C.
COVER PHOTOSFRONT COVER PHOTOS COURTESY OF (LEFT TO RIGHT) FLORIDA A&M UNIVERSITY; THE UNIVERSITY OF WASHINGTON; AND THE UNIVERSITY OF CALIFORNIA, MERCED
BACK COVER PHOTO COURTESY OF THE UNIVERSITY OF VIRGINIA
i
Table of Contents
Acknowledgments ii
Executive Summary iv
List of Figures viii
List of Tables x
Introduction 1
SECTION 1: ENGINEERING OUTCOMES BY RACE AND ETHNICITY 5
Underrepresented Racial and Ethnic Groups In Engineering• Degrees Conferred to Hispanic Graduates• Degrees Conferred to Black Graduates• Degrees Conferred to American Indian/Alaska Native Graduates• Degrees Conferred to Native Hawaiian/Pacific Islander Graduates
Other Groups In Engineering• Degrees Conferred to White Graduates• Degrees Conferred to Asian American Graduates• Degrees Conferred to Non-U.S. Resident Graduates
Multi-Racial Graduates In Engineering
Summary
SECTION 2: ENGINEERING TOP PRODUCERS FOR UNDERREPRESENTED RACIAL AND ETHNIC GROUPS and Multi-Racial Graduates BY INSTITUTION 59
Degrees Conferred to Hispanic Graduates
Degrees Conferred to Black Graduates
Degrees Conferred to American Indian/Alaska Native Graduates
Degrees Conferred to Native Hawaiian/Pacific Islander Graduates
Degrees Conferred to Multi-Racial Graduates
Summary
SECTION 3: DIVERSITY AND EQUITY IN ENGINEERING BY STATE 85
Analysis
Summary
Conclusion 94
References 96
Appendix A: Methodology and Engineering Subdiscipline Crosswalk 101

THE 2018 STATUS REPORT ON ENGINEERING EDUCATIONii
ACKNOWLEDGMENTS
This project was generously funded by the National Science
Foundation (NSF) (Grant number EEC-1734899). Thank you to all
participants and contributors for their time, expertise and input!
RESEARCH TEAMDr. Eugene L. Anderson, Vice President, Access and Success, APLU
Dr. Krystal Williams, Assistant Professor, Higher Education Program, Department of Educational Leadership, Policy and Technology Studies, The University of Alabama
Dr. Luis Ponjuan, Associate Professor, Educational Administration and Human Resource Development, Texas A&M University
Dr. Henry T. Frierson, Associate Vice President and Dean of the Graduate School, University of Florida
ADVISORY COMMITTEEDr. Lesia Crumpton-Young, Vice President-Research and Sponsored Programs, Tennessee State University
Dr. Juan E. Gilbert, Chair, Computer & Information Science & Engineering Department, The University of Florida
Dr. Willie Pearson, Professor of the School of History and Sociology, Georgia Tech
Dr. Karl Reid, Executive Director, National Society of Black Engineers
Dr. Janet C. Rutledge, Vice Provost and Dean of the Graduate School, University of Maryland, Baltimore County
Dr. Aaron Thomas, Director of Native American Research Laboratory, University of Montana
Dr. Zulma Toro, President, Central Connecticut State University
Note: any opinions, findings and conclusions or recommendations expressed in this material are those of the author(s) and do not necessarily reflect the views of the National Science Foundation.

iii
INTERNAL SUPPORT TEAMRosalina Escandon, Associate Director, Access and Success, APLU
Porshia Brewer, Staff Associate, Access and Success, APLU
STATISTICAL CONSULTANTDr. Brian L. Yoder, Consultant, previously Director of Assessment, Evaluation and Institutional Research, American Society for Engineering Education
REPORT REVIEWERSDr. Bryan Cook, Vice President, Data and Policy Analysis, APLU
Howard Gobstein, Executive Vice President and Co-Project Director, Science & Mathematics Teaching Imperative, APLU
Jeff Lieberson, Vice President, Public Affairs, APLU
Dr. Alan R. Mabe, Chief Academic Officer, Senior Vice President for Academic Affairs, APLU
Hanan Saab, Assistant Director for International Issues, APLU
REPORT DESIGNERS AND EDITORSGloria Allen, Silhouette Media
Monica Drew, DAS Graphics and Printing, Inc.
Lauren Bush, Editor

THE 2018 STATUS REPORT ON ENGINEERING EDUCATIONiv
EXECUTIVE SUMMARY
Careers in engineering encompass a variety of occupations that spur
the creation of new ideas, advance technology, and are essential to a
globally competitive economy and national defense.i Increasing the
number of Americans studying and pursuing careers in engineering is essential
to the preceding points. Shortages in meeting employment demands exist
in the number of U.S. citizens earning undergraduate and advanced degrees
in engineering fields essential to economic growth and national security
such as systems engineers, cyber security, software developers, materials
science engineering, and Ph.D.’s in nuclear and electrical engineering.ii
Thanks to funding from the National Science Foundation, the Association of
Public and Land-grant Universities examined this topic and published this
report which examines recent trends in engineering degrees awarded at
national and institutional levels to determine areas of growth among various
groups, changes in racial, ethnic and gender diversity in engineering, and
which colleges and universities graduate a larger number and proportion of
underrepresented groups in specific engineering disciplines.
Data from the Integrated Postsecondary Education Data System (IPEDS) of
the U.S. Department of Education National Center for Education Statistics
were used primarily from the IPEDS Completion Survey. The survey provides
information about degree completion, including degrees awarded by race,
gender, field of study and degree level. For this study, survey data from the
2010-11 academic year were compared to completions data from 2015-16.
PHOTO COURTESY OF THE UNIVERSITY OF IDAHO

v
BASED ON OUR ANALYSIS THERE ARE SIX MAJOR FINDINGS IN THE REPORT WHICH ARE HIGHLIGHTED IN THE SECTIONS BELOW.
Despite large numerical increases for Hispanic and Black students, these two groups along with American Indian/Alaska Native (AIAN) and Native Hawaiian/Pacific Islander (NHPI) students remain significantly underrepresented in engineering at the undergraduate and graduate level.
In the most recent five-year period where data were available (2011 to 2016), the change in bachelor’s degrees conferred in engineering outperformed all other major fields of study for all racial and ethnic group, 42 percent compared to 11 percent. The number of engineering bachelor’s degrees earned by Hispanic students increased by 79 percent, a percentage only less than Multi-Racial and Non-U.S. Resident students. The number of engineering bachelor’s degrees conferred to Black students increased 35 percent, the same as Asian students and greater than White students (30 percent). However, both Hispanic and Black engineering graduates remain significantly underrepresented. Hispanic students compose 19 percent of college undergraduates but only 11 percent of all engineering bachelor’s degrees conferred in 2016, an 8-percentage point gap. A gap similar for Black students. Although the overall and engineering numbers for American Indians is very small, they are significantly underrepresented in engineering.
The lack of diversity at the graduate level in engineering is an even greater problem than at the undergraduate level. The number of engineering master’s and doctoral degrees conferred to Underrepresented Racial and Ethnic Groups (URG) increased from 2011 to 2016 but had little bearing on diversity of engineering graduate degrees. URGs earned only 6.3 percent of engineering master’s degrees and 4.9 percent of engineering doctoral degrees. At the engineering graduate level, American Indian and Native Hawaiian graduates are almost invisible despite earning a significant number of master’s degrees in non-engineering fields of study. Nearly 3,500 American Indian students earned master’s degrees in non-engineering fields of study, but only 71 earned master’s degrees in engineering. Only 23 Native Hawaiian graduates earned master’s degrees in engineering, despite more than 1,500 Native Hawaiian graduates earning master’s degrees in non-engineering fields of study.
From 2010-11 to 2015-16 there was a massive increase in Non-U.S. Resident graduates in engineering at all levels, especially master’s degree where this group is now the majority of master’s degree earners.
In 2016, Non-U.S. Resident graduates earned the majority of engineering master’s degrees, 58 percent. The shift to the majority of engineering master’s degree earners occurred dramatically over a relatively short period of time; increasing from 45.6 percent of all engineering master’s degrees in 2011 to 58.1 percent in 2016, a 12.5 percentage point increase in only five years. The rapid growth of Non-U.S. Resident graduates is a critical topic. Based on the data, it does not appear that the rapid growth of Non-U.S. Residents in engineering master’s degree programs crowded out U.S. citizens. In 2016, 12,675 more Non-U.S. Resident students earned engineering master’s degrees than in 2011, which was slightly fewer than the 13,779 more engineering master’s degrees awarded to all persons by U.S. colleges and universities. Typically, graduate engineering programs do not provide financial assistance to Non-U.S. Resident students, thus these students
A Snapshot of Diversity in Degrees Conferred in Engineering
1
2

THE 2018 STATUS REPORT ON ENGINEERING EDUCATIONvi
provide important talent that benefits engineering programs in numerous ways. Another factor affecting the diversity of graduate engineering programs is the labor market demands for persons with a bachelor’s degree in engineering. As Carnevale, Smith and Melton found, there are significant financial benefits to STEM baccalaureate graduates both in STEM and non-STEM careers.iii
Additionally, Non-U.S. Residents were heavily concentrated in electrical engineering and related subdisciplines. More than one-third of all engineering master’s degrees earned by Non-U.S. Residents were in electrical engineering, 10,163 degrees in 2016. Another 3,994 degrees were earned by Non-U.S. Residents in computer engineering (2,388 degrees) and software engineering (1,606 degrees). Non-U.S. Residents earned 78 percent of software engineering master’s degrees, 77 percent of electrical engineering master’s degrees, and 77 of percent computer engineering master’s.
The gender disparity transcends URG and majority groups in similar ways with women earning fewer degrees than men, even though in 2015-2016, the majority of degree earners in all fields of study combined are female.
Women earned the majority of all bachelor’s degrees within each racial and ethnic group, except in engineering, the percentage of degrees by women ranged from 26.8 percent among Multi-Racial graduates to 19.4 percent for White graduates. This disparity between women and men in engineering is further exemplified by the difference in where engineering ranks among all major fields of study for bachelor’s degrees conferred. Engineering was the second largest field of study among bachelor’s degrees conferred to White males in 2016, behind only business. The same is also true for Asian American males. However, for Hispanic males, engineering was the fourth largest field of study and among African American males, engineering ranked tenth. Engineering ranked significantly lower among female graduates in 2016. Among White, Hispanic and African American females, engineering was the eighteenth largest field of study. Among Asian American females engineering ranked eighth. Like the baccalaureate level, the gender disparity at the graduate level remains a significant issue. Among U.S. residents, women earn the majority of all master’s degrees, but less than 30 percent of engineering master’s degrees.
At the institutional level there is a high concentration of each URG in a small number of institutions which contrast with a large number of institutions with little to no racial or ethnic diversity in their engineering programs.
The top 10 producers of engineering bachelor’s degrees to Hispanic students conferred 25 percent of all engineering bachelor’s degrees to Hispanic graduates. Among Black students, the top 10 producers conferred one of five engineering bachelor’s degrees to Black graduates. The top nine producers of engineering bachelor’s degrees conferred to American Indian/Alaska Native (AIAN) students conferred 26.8 percent of engineering bachelor’s degrees to AIAN graduates. Among Native Hawaiian/Pacific Islander (NHPI) students, 16 top producers conferred 37.1 percent of engineering bachelor’s degrees to NHPI graduates. At the opposite end are a significant number of engineering programs with very few or no URG students—156 colleges and universities conferred less than 5 percent of their bachelor’s degrees in engineering to URG students in 2016. Eighty-one percent of these schools are smaller engineering schools or programs that awarded less than 100 degrees to all groups combined.
3
4

vii
Historically Black Colleges and Universities (HBCUs) and Hispanic Serving Institutions (HSIs) continue to play an important role in educating Black and Hispanic students in engineering.
Of the 533 colleges and universities with engineering undergraduate programs, 27 are HBCUs (5 percent). This small group of institutions conferred 17 percent of all engineering bachelor’s degrees earned by Black students in 2016. Four HBCUs were among the top 10 producers of bachelor’s degrees to Black graduates. Seven of the top 10 producers among small sized engineering programs are HBCUs. Because of the large size of several HSIs, the significance of these institutions to educating Hispanic engineers is substantial. Nine percent of the 533 colleges and universities with engineering undergraduate programs are HSIs, 46 institutions. A third of engineering bachelor’s degrees conferred to Hispanic students in 2016 were from a HSI. Six of the top 10 producers for Hispanic students are HSIs, seven of the top 10 medium sized engineering programs are HSIs, and seven of the top 10 small sized engineering programs are HSIs.
States with majority-minority or emerging majority-minority college age population are failing to educate a large enough share of their URG students in engineering.
There are 7 states (including the District of Columbia) where a majority of 18-24-year-olds are URGs: New Mexico (70 percent), Texas (60 percent), California (56 percent), District of Columbia (55 percent), Nevada (53 percent), Arizona (52 percent), and Florida (51 percent). The gap between URG college age populations and URGs engineering graduates ranges from 30-34 percentage points for each state except Florida where the gap is 20 percentage points. Economic implications for these states could be dampened in coming years with large numbers entering the workforce not having degrees in fields such as engineering that are key to economic growth.
There should be a similar concern for the following 17 states where a third to under half of all 18-24-year-olds are URGs: Mississippi (48 percent), Georgia (48 percent), Louisiana (46 percent), Maryland (46 percent), New Jersey (41 percent), Delaware (41 percent), Hawaii (40 percent), New York (40 percent), South Carolina (40 percent), Illinois (39 percent), North Carolina (39 percent), Alabama (38 percent), Oklahoma (38 percent), Alaska (37 percent), Virginia (35 percent), Colorado (34 percent), and Connecticut (34 percent). In these states with large shares of URGs, only 12 percent of engineering graduates in 2015-16 were URGs. The gap between URG college age population and URG graduates in engineering ranges from 21-34 percentage points.
5
6

THE 2018 STATUS REPORT ON ENGINEERING EDUCATIONviii
LIST OF FIGURESFigure 1. Number of bachelor’s degrees conferred to Hispanic graduates in ten largest engineering subdisciplines for Hispanic graduates: 2015-16 7
Figure 2. Number of master’s degrees conferred to Hispanic graduates in ten largest engineering subdisciplines for Hispanic graduates: 2015-16 9
Figure 3. Number of doctoral degrees conferred to Hispanic graduates in ten largest engineering subdisciplines for Hispanic graduates: 2015-16 9
Figure 4. Percentage distribution of bachelor’s degrees and master’s degrees conferred to Hispanic graduates, by gender and engineering status: 2015-16 10
Figure 5. Number of bachelor’s degrees conferred to Black graduates in ten largest engineering subdisciplines for Black graduates: 2015-16 13
Figure 6. Number of master’s degrees conferred to Black graduates in ten largest engineering subdisciplines for Black graduates: 2015-16 15
Figure 7. Number of doctoral degrees conferred to Black graduates in ten largest engineering subdisciplines for Black graduates: 2015-16 15
Figure 8. Percentage distribution of bachelor’s degrees and master’s degrees conferred to Black graduates, by gender and engineering status: 2015-16 16
Figure 9. Number of bachelor’s degrees conferred to American Indian/Alaska Native graduates in ten largest engineering subdisciplines for AIAN graduates: 2015-16 19
Figure 10. Number of master’s degrees conferred to American Indian/Alaska Native graduates in ten largest engineering subdisciplines for AIAN graduates: 2015-16 21
Figure 11. Number of doctoral degrees conferred to American Indian/Alaska Native graduates in largest engineering subdisciplines for AIAN graduates: 2015-16 21
Figure 12. Percentage distribution of bachelor’s degrees and master’s degrees conferred to American Indian/Alaska Native graduates, by gender and engineering status: 2015-16 22
Figure 13. Number of bachelor’s degrees conferred to Native Hawaiian/Pacific Islander graduates in ten largest engineering subdisciplines for NHPI graduates: 2015-16 25
Figure 14. Number of master’s degrees conferred to Native Hawaiian/Pacific Islander graduates in ten largest engineering subdisciplines for NHPI graduates: 2015-16 26
Figure 15. Number of doctoral degrees conferred to Native Hawaiian/Pacific Islander graduates in largest engineering subdisciplines for NHPI graduates: 2015-16 26
Figure 16. Percentage distribution of bachelor’s degrees and master’s degrees conferred to Native Hawaiian/Pacific Islander graduates, by gender and engineering status: 2015-16 27
Figure 17. Number of bachelor’s degrees conferred to White graduates in ten largest engineering subdisciplines for White graduates: 2015-16 30
Figure 18. Number of master’s degrees conferred to White graduates in ten largest engineering subdisciplines for White graduates: 2015-16 31

ix
Figure 19. Number of doctoral degrees conferred to White graduates in ten largest engineering subdisciplines for White graduates: 2015-16 32
Figure 20. Percentage distribution of bachelor’s degrees and master’s degrees conferred to White graduates, by gender and engineering status: 2015-16 33
Figure 21. Number of bachelor’s degrees conferred to Asian American graduates in ten largest engineering subdisciplines for Asian American graduates: 2015-16 36
Figure 22. Number of master’s degrees conferred to Asian American graduates in ten largest engineering subdisciplines for Asian American graduates: 2015-16 37
Figure 23. Number of doctoral degrees conferred to Asian American graduates in ten largest engineering subdisciplines for Asian American graduates: 2015-16 37
Figure 24. Percentage distribution of bachelor’s degrees and master’s degrees conferred to Asian American graduates, by gender and engineering status: 2015-16 39
Figure 25. Number of bachelor’s degrees conferred to Non-U.S. Resident graduates in ten largest engineering subdisciplines for Non-U.S. Resident graduates: 2015-16 42
Figure 26. Number of master’s degrees conferred to Non-U.S. Resident graduates in ten largest engineering subdisciplines for Non-U.S. Resident graduates: 2015-16 44
Figure 27. Number of doctoral degrees conferred to Non-U.S. Resident graduates in ten largest engineering subdisciplines for Non-U.S. Resident graduates: 2015-16 44
Figure 28. Percentage distribution of bachelor’s degrees and master’s degrees conferred to Non-U.S. Resident graduates, by gender and engineering status: 2015-16 45
Figure 29. Number of bachelor’s degrees conferred to Multi-Racial graduates in ten largest engineering subdisciplines for Multi-Racial graduates: 2015-16 48
Figure 30. Number of master’s degrees conferred to Multi-Racial graduates in ten largest engineering subdisciplines for Multi-Racial graduates: 2015-16 50
Figure 31. Number of doctoral degrees conferred to Multi-Racial graduates in ten largest engineering subdisciplines for Multi-Racial graduates: 2015-16 50
Figure 32. Percentage distribution of bachelor’s degrees and master’s degrees conferred to Multi-Racial graduates, by gender and engineering status: 2015-16 51
Figure 33. Five year percentage change of bachelor’s degrees in engineering, by race and ethnicity: 2010-11 and 2015-16 52
Figure 34. Percentage distribution of engineering bachelor’s degrees, by race and ethnicity: 2015-16 53
Figure 35. Five year percentage change of master’s degrees in engineering, by race and ethnicity: 2010-11 and 2015-16 54
Figure 36. Percentage distribution of engineering master’s degrees, by race and ethnicity: 2015-16 55
Figure 37. Five year percentage change of doctoral degrees in engineering, by race and ethnicity: 2010-11 and 2015-16 57
Figure 38. Percentage distribution of engineering doctoral degrees, by race and ethnicity: 2015-16 58

THE 2018 STATUS REPORT ON ENGINEERING EDUCATIONx
LIST OF TABLESTable 1. Number and five year percentage change of bachelor’s, master’s, and doctoral degrees in engineering conferred to Hispanic graduates, by subdiscipline: 2010-11 and 2015-16 6
Table 2. Number and five year percentage change of bachelor’s, master’s, and doctoral degrees in engineering conferred to Black graduates, by subdiscipline: 2010-11 and 2015-16 12
Table 3. Number and five year percentage change of bachelor’s, master’s, and doctoral degrees in engineering conferred to AIAN graduates, by subdiscipline: 2010-11 and 2015-16 18
Table 4. Number and five year percentage change of bachelor’s, master’s, and doctoral degrees in engineering conferred to NHPI graduates, by subdiscipline: 2010-11 and 2015-16 24
Table 5. Number and five year percentage change of bachelor’s, master’s, and doctoral degrees in engineering conferred to White graduates, by subdiscipline: 2010-11 and 2015-16 29
Table 6. Number and five year percentage change of bachelor’s, master’s, and doctoral degrees in engineering conferred to Asian American graduates, by subdiscipline: 2010-11 and 2015-16 35
Table 7. Number and five year percentage change of bachelor’s, master’s, and doctoral degrees in engineering conferred to Non-U.S. Resident graduates, by subdiscipline: 2010-11 and 2015-16 41
Table 8. Number and five year percentage change of bachelor’s, master’s, and doctoral degrees in engineering conferred to Multi-Racial graduates, by subdiscipline: 2010-11 and 2015-16 47
Table 9. Number and percentage of bachelor’s degrees conferred in engineering to Hispanic graduates, by institution: 2015-16 60
Table 10. Number and percentage of bachelor’s degrees conferred in engineering to Hispanic graduates, by medium sized engineering program: 2015-16 60
Table 11. Number and percentage of bachelor’s degrees conferred in engineering to Hispanic graduates, by small sized engineering program: 2015-16 61
Table 12. Number of bachelor’s degrees conferred in mechanical engineering to Hispanic graduates, by institution: 2015-16 62
Table 13. Number of bachelor’s degrees conferred in civil engineering to Hispanic graduates, by institution: 2015-16 62
Table 14. Number of bachelor’s degrees conferred in electrical engineering to Hispanic graduates, by institution: 2015-16 63
Table 15. Number of bachelor’s degrees conferred in Chemical, Biochemical, Biomolecular engineering to Hispanic graduates, by institution: 2015-16 63
Table 16. Number of bachelor’s degrees conferred in computer engineering to Hispanic graduates, by institution: 2015-16 64
Table 17. Number and percentage of bachelor’s degrees conferred in engineering to Black graduates, by institution: 2015-16 65

xi
Table 18. Number and percentage of bachelor’s degrees conferred in engineering to Black graduates, by medium sized engineering program: 2015-16 66
Table 19. Number and percentage of bachelor’s degrees conferred in engineering to Black graduates, by small sized engineering program: 2015-16 66
Table 20. Number of bachelor’s degrees conferred in mechanical engineering to Black graduates, by institution: 2015-16 67
Table 21. Number of bachelor’s degrees conferred in electrical engineering to Black graduates, by institution: 2015-16 67
Table 22. Number of bachelor’s degrees conferred in civil engineering to Black graduates, by institution: 2015-16 68
Table 23. Number of bachelor’s degrees conferred in chemical, biochemical, and biomolecular engineering to Black graduates, by institution: 2015-16 69
Table 24. Number of bachelor’s degrees conferred in computer engineering to Black graduates, by institution: 2015-16 69
Table 25. Number and percentage of bachelor’s degrees conferred in engineering to American Indian/Alaska Native graduates, by institution: 2015-16 71
Table 26. Number of bachelor’s degrees conferred in mechanical engineering to American Indian/Alaska Native graduates, by ten institutions: 2015-16 72
Table 27. Number of bachelor’s degrees conferred in civil engineering to American Indian/Alaska Native graduates, by institution: 2015-16 73
Table 28. Number of bachelor’s degrees conferred in electrical engineering to American Indian/Alaska Native graduates, by institution: 2015-16 73
Table 29. Number of bachelor’s degrees conferred in chemical, biochemical, and biomolecular engineering to American Indian/Alaska Native graduates, by institution: 2015-16 73
Table 30. Number of bachelor’s degrees conferred in engineering, general engineering, engineering physics, and engineering science to American Indian/Alaska Native graduates, by institution: 2015-16 73
Table 31. Number and percentage of bachelor’s degrees conferred in engineering to Native Hawaiian/Pacific Islander graduates, by institution: 2015-16 74
Table 32. Number of bachelor’s degrees conferred in mechanical engineering to Native Hawaiian/Pacific Islander graduates, by institution: 2015-16 75
Table 33. Number of bachelor’s degrees conferred in civil engineering to Native Hawaiian/Pacific Islander graduates, by institution: 2015-16 75
Table 34. Number of bachelor’s degrees conferred in electrical engineering to Native Hawaiian/Pacific Islander graduates, by institution: 2015-16 76
Table 35. Number and percentage of bachelor’s degrees conferred in engineering to Multi-racial graduates, by institution: 2015-16 77
Table 36. Number and percentage of bachelor’s degrees conferred in engineering to Multi-racial graduates, by medium sized engineering program: 2015-16 78
Table 37. Number and percentage of bachelor’s degrees conferred in engineering to Multi-racial graduates, by small sized engineering program: 2015-16 78

THE 2018 STATUS REPORT ON ENGINEERING EDUCATIONxii
Table 38. Number of bachelor’s degrees conferred in mechanical engineering to Multi-racial graduates, by institution: 2015-16 79
Table 39. Number of bachelor’s degrees conferred in electrical engineering to Multi-racial graduates, by institution: 2015-16 80
Table 40. Number of bachelor’s degrees conferred in civil engineering to Multi-racial graduates, by institution: 2015-16 80
Table 41. Number of bachelor’s degrees conferred in Chemical, Biochemical, Biomolecular engineering to Multi-racial graduates, by institution: 2015-16 81
Table 42. Number of bachelor’s degrees conferred in bioengineering and biomedical engineering to Multi-racial graduates, by institution: 2015-16 81
Table 43. Colleges/Universities by number of engineering bachelor’s degrees conferred and level of racial and ethnic diversity indicators: 2015-16 83
Table 44. Among Hispanic 18-24-year-olds who earned bachelor’s degrees, percentage of all Hispanic graduates, percentage of all engineering degrees conferred to Hispanic graduates, and percentage of gap difference, by state: 2015-16 86
Table 45. Among Black 18-24-year-olds who earned bachelor’s degrees, percentage of all Black graduates, percentage of all engineering degrees conferred to Black graduates, and percentage of gap difference, by state: 2015-16 88
Table 46. Among American Indian/Alaskan Native (AIAN) 18-24-year-olds who earned bachelor’s degrees, percentage of all AIAN graduates, percentage of all engineering degrees conferred to AIAN graduates, and percentage of gap difference, by state: 2015-16 90
Table 47. Among Native Hawaiian/Pacific Islander (NHPI) 18-24-year-olds who earned bachelor’s degrees, percentage of all NHPI graduates, percentage of all engineering degrees conferred to NHPI graduates, and percentage of gap difference, by state: 2015-16 91

1
INTRODUCTION
THE DEMOGRAPHIC REALITY FOR THE FUTURE OFAMERICAN ENGINEERING PROGRAMS
The current status of engineering education, degree production, and workforce projections are critical to the next 25 years for the nation. In parallel, our nation faces a demographic reality that signifies an essential need to increase racial and ethnic representation in a broad array of engineering programs in higher education insti-tutions. The nation is facing an unprecedented growth in enrollment for students of color in K-12 education that is unlike any other time in American educational history (Pew Research, 2016). Quite simply, the talent pool for the engineering workforce needs to become more racially and ethnically diverse in the future decades (Passel & Cohn, 2017).
While the diversity of the engineering workforce has been an ongoing concern over the last 25 years, there are compelling reasons to present this innovative data report. First, aging of the American workforce in science and engineering have raised concerns regarding scientific innovation and successful succession planning (Blau & Weinberg, 2017). Next, the importance of engineering education suggests that all higher education insti-tutions need to address this issue, not solely Minority Serving Institutions (MSIs) (Carter-Johnson, Inniss, & Lee, 2018). Finally, there is a pressing need to examine how racial/ethnic diversity is represented in all types of engineering programs and not solely in the major fields of study. Towards that goal, this report provides a comprehensive approach to assessing the degree to which higher education institutions, especially Land-grant institutions, achieve racial and ethnic diversity in an array of engineering degree programs.
However, beyond the pressing need to increase representation in these degree programs, this report goes beyond simply stating the reality of the current and future state of the American engineering workforce. The Association of Public Land Grant Universities (APLU) aligns this report with our core land grant mission and commitment to raising the level of awareness of these issues to encourage institutions to move towards action to diversify these programs. This report is an inflection point in the discourse of demographic representation in engineering education. While these challenges have been ongoing and complex, the goal of this report is to be a catalyst for future institutional action.
BEYOND DEMOGRAPHIC REPRESENTATION
While the lack of demographic representation continues to be a reason for many postsecondary institutions to address this issue, institutions need to address their policies, programs, and practices related to diversity in engineering. That is, solely looking at the outcome (i.e. degree recipients) is not sufficient and requires institutions to also examine the educational pathways for racial and ethnic students of color in engineering programs. This report highlights that certain institutions are successful at producing engineering graduates. This report should also serve as a catalyst to explore what key aspects of these degree programs help achieve these outcomes.
INSTITUTIONAL POLICIES. Upon closer review, institutions need to examine how their institutional policies adversely affects certain student populations. Researchers recognized that institutional policies (i.e. color-blind admissions) create challenges for students of color and their educational experiences (Vue, Haslerig, Allen, 2017). This may suggest that institutions need to critically reflect on how certain admissions policies in engineering programs may have unintended consequences that dissuade students of color from applying for engineering programs.

THE 2018 STATUS REPORT ON ENGINEERING EDUCATION2
PHOTO COURTESY OF THE UNIVERSITY OF MINNESOTA

3
INSTITUTIONAL PROGRAMS. The National Science Foundation has supported engineering programs like the NSF-REU initiative to encourage students of color to work with engineering faculty members (Douglas, Ilumoka, & Watson, 2017). NSF-REU directors have also highlighted that creating effective programs has some challenges (Cousins, DeMont, Suggs, & Markey, 2018). While these programs continue to make modest gains, this may suggest that small scope programs are not enough to effectively increase students’ interest and the degree completion rates.
INSTITUTIONAL PRACTICES. The degree completion rates of these engineering programs only tell a portion of this story. This report does not fully capture the number of students who were academically capable but decided to leave their engineering program. Unknown from these numbers were the daily educational experiences that may have made many of these students feel marginalized in classrooms, laboratories, and campus spaces. Researchers have documented challenges facing students of color, especially women of color who face adverse educational climates in engineering programs (Cross, Mendenhal, Clancy, & Amos, 2017). This data report does not address these issues; however, it highlights the number of students who overcame these challenges to persist and complete their engineering degree.
AWARENESS TO ACTION
This report sets a bold new path to critically examine how American institutions and engineering programs are producing the future engineering workforce. In the next sections, this report highlights states, institutions, and colleges and universities that are producing a diverse workforce. However, awareness of the scarcity of engineering programs with diverse student degree recipients is not enough. States, institutions, and engineering colleges need to critically examine how their policies, programs, and practices influence these results. In fact, APLU encourages our American higher education system to boldly take action over the next ten years to radically alter how we inspire, enroll, persist and graduate a diverse engineering workforce.

THE 2018 STATUS REPORT ON ENGINEERING EDUCATION4
PHOTO COURTESY OF THE UNIVERSITY OF SOUTH FLORIDA

5
This section provides information about undergraduate and
graduate engineering outcomes for students in different racial
and ethnic categories for 2011 and 2016.
SECTION 1:ENGINEERING OUTCOMES BY RACE AND ETHNICITY
UNDERREPRESENTED MINORITY GROUPS IN ENGINEERING DEGREES CONFERRED TO HISPANIC GRADUATES
BACHELOR’S DEGREES IN ENGINEERING
From 2011 to 2016, Hispanic graduates had a 79 percent increase in undergraduate engineering degrees conferred (6,323 vs. 11,301, respectively), the largest among all racial and ethnic groups, see table 1. The increase in engineering bachelor’s degrees conferred to Hispanics (79 percent), was higher than the 5-year increase in all other bachelor’s degrees conferred (51 percent).1 However, the number of Hispanic graduates in engineering still lag in other metrics assessing their representation in higher education. Therefore, it is important to consider other contextual characteristics in the higher education landscape. In 2016, 10 percent of all bachelor’s degrees conferred in engineering went to Hispanic students, which is only a 2-percentage point increase from 2011. During the 2015-16 academic year, 12 percent of all bachelor’s degrees were awarded to Hispanic graduates across all fields.2 Hispanic students compose 19 percent of college undergraduates enrolled during the fall semester of 2016.3
BACHELOR’S DEGREES IN ENGINEERING SUBDISCIPLINES
The 10 largest engineering subdisciplines among Hispanics (figure 1) are similar to most racial and ethnic groups with the exception of environmental engineering, which is among the 10 largest subdisciplines for only Hispanic and American Indian/Alaskan Native graduates. Similar to most racial and ethnic groups, Hispanic graduates earned 60 percent of their engineering bachelor’s degrees in mechanical engineering (28 percent), civil engineering (16 percent), and electrical engineering (16 percent).

THE 2018 STATUS REPORT ON ENGINEERING EDUCATION6
TABLE 1. Number and five year percentage change of bachelor’s, master’s, and doctoral degrees in engineering conferred to Hispanic graduates, by subdiscipline: 2010-11 and 2015-16
HISPANICBACHELOR’S DEGREES MASTER’S DEGREES DOCTORAL DEGREES
2011 20165-year change 2011 2016
5-year change 2011 2016
5-year change
Aerospace Engineering 220 431 95.9% 64 79 23.4% 8 15 87.5%
Agricultural Engineering 29 69 137.9% 10 10 0.0% 0 2
Architectural Engineering 43 52 20.9% 4 14 250.0% 0 1
Bioengineering and Biomedical Engineering
220 547 148.6% 54 106 96.3% 19 44 131.6%
Biological Engineering 2 22 1000.0% 0 0 0 1
Chemical, Biochemical, Biomolecular Engineering
431 907 110.4% 39 64 64.1% 21 39 85.7%
Civil Engineering 1,307 1,787 36.7% 266 363 36.5% 13 26 100.0%
Computer Engineering 378 741 96.0% 51 73 43.1% 6 8 33.3%
Construction Engineering 23 37 60.9% 8 9 12.5% 0 0
Electrical Engineering 1,127 1,769 57.0% 241 280 16.2% 34 39 14.7%
Electrical/ Computer Engineering
2 26 1200.0% 1 12 1100.0% 0 1
Engineering Mechanics 2 3 50.0% 3 2 -33.3% 1 0
Engineering, General Engineering, Engineering Physics, Engineering Science
149 273 83.2% 92 105 14.1% 13 10 -23.1%
Environmental Engineering 80 169 111.3% 40 59 47.5% 5 8 60.0%
Geological Engineering 9 17 88.9% 6 10 66.7% 1 0
Industrial Engineering 391 623 59.3% 99 135 36.4% 11 8 -27.3%
Manufacturing Engineering 20 33 65.0% 37 46 24.3% 0 0
Materials, Metallurgical and Ceramics Engineering
62 140 125.8% 33 37 12.1% 10 24 140.0%
Mechanical Engineering 1,529 3,111 103.5% 221 353 59.7% 30 40 33.3%
Mining Engineering 6 20 233.3% 2 4 100.0% 0 0
Naval Architecture and Marine Engineering
19 22 15.8% 0 1 0 0
Nuclear and Radiological Engineering
25 34 36.0% 9 20 122.2% 3 5 66.7%
Ocean Engineering 22 21 -4.5% 3 0 1 0
Optics and Phototonics 0 1 3 0 1 0
Other 30 88 193.3% 45 45 0.0% 1 2 100.0%
Petroleum Engineering 51 167 227.5% 10 13 30.0% 0 0
Software Engineering 55 74 34.5% 23 29 26.1% 1 1 0.0%
Surveying Engineering 0 0 2 2 0.0% 0 0
Systems Engineering 91 117 28.6% 100 137 37.0% 4 4 0.0%
Engineering Total 6,323 11,301 78.7% 1,466 2,008 37.0% 183 278 51.9%
Non-Engineering Total 148,127 223,713 51.0% 45,357 60,938 34.4% 8,479 11,488 35.5%
SOURCE: U.S. Department of Education, National Center for Education Statistics, Integrated Postsecondary Education Data System (IPEDS), Fall 2011 and Fall 2016, Completions component. (This table was prepared May 2018).

7
• Petroleum engineering: 227 percent (from 51 to 167);
• Agricultural engineering: 138 percent (from 29 to 69); and
• Materials, metallurgical, and ceramics engineering: 126 percent (from 62 to 140).
Hispanic graduates earned bachelor’s degrees in agricultural engineering and materials, metallurgical, and ceramics engineering from a variety of colleges and universities across the country. However, most of petroleum engineering bachelor’s degrees awarded to Hispanics in 2016, (107 out of 167 degrees or 64 percent), were from seven schools in Texas and Oklahoma, this region of the country has both a concentration of Hispanic persons and oil and gas companies.
GRADUATE DEGREES IN ENGINEERING
The growth in master’s degrees in engineering earned by Hispanics led all racial and ethnic groups and is similar to the educational outcomes of Hispanic undergraduates (from 1,466 degrees awarded in 2011 to 2,008 degrees awarded in 2016, an increase of 37 percent), see table 1. The growth in the number of master’s degrees in engineering conferred to Hispanic students was similar to the increase in non-engineering master’s
3,111
1,787
1,769
907
741
623
547
431
273
169
FIGURE 1. Number of bachelor's degrees conferred to Hispanic graduates in ten largest engineering subdisciplines for Hispanic graduates: 2015-16
Mechanical Engineering
Civil Engineering
Electrical Engineering
Chemical, Biochemical, Biomolecular Engineering
Computer Engineering
Industrial Engineering
Bioengineering and Biomedical Engineering
Aerospace Engineering
Engineering, General Engineering, Engineering Physics, Engineering Science
Environmental Engineering
SOURCE: U.S. Department of Education, National Center for Education Statistics, Integrated Postsecondary Education Data System (IPEDS), Fall 2011 and Fall 2016, Completions component. (This table was prepared May 2018).
Although attention is primarily given to the larger engineering subdisciplines, there are several smaller specialty subdisciplines in which the number of degrees awarded to Hispanic student increased more than 100 percent.

THE 2018 STATUS REPORT ON ENGINEERING EDUCATION8
degrees, 34.4 percent.4 In addition, the number of engineering doctoral degrees awarded to Hispanic graduates also increased by 52 percent, which was greater than the 35.5 percent increase in all other doctoral degrees. While these increases are substantial, the following statistics provide context for these numbers: in 2016, 4 percent of all master’s degrees and 3 percent of all doctoral degrees in engineering went to Hispanic students, percentages that have remained stable since 2011 and lower than their share of all master’s and doctoral degrees. Arguably, the metrics regarding the higher education context are also indicative of broader college racial and ethnic disparities given that Hispanic graduates compose only 21.7 percent of the U.S. population ages 18 to 24 years in 2016.5
GRADUATE DEGREES IN ENGINEERING SUBDISCIPLINES
Figure 2 shows the 10 largest engineering subdisciplines at the master’s degree level among Hispanic graduates in 2016. Hispanic graduates were the only group to earn most of their engineering master’s degrees in civil engineering (363 degrees in 2016). Electrical engineering was the third largest engineering subdiscipline among Hispanic graduates (280 degrees) and computer engineering was also included in the largest 10 subdisciplines. As previously noted, this subdiscipline is considered a part of electrical engineering on some campuses, therefore, if we added the degrees conferred to Hispanic students in electrical and computer engineering together (280 and 73 degrees) then the total (353 degrees) would match mechanical engineering.
In subdisciplines awarding more than 10 degrees, the largest growth was in the following subdisciplines (These examples focus primarily on subdisciplines that awarded more than 10 degrees in 2016): bioengineering and biomedical engineering (from 54 to 106 degrees, an increase of 96 percent) and chemical, biochemical, biomolecular engineering (from 39 to 64 degrees, an increase of 64 percent) (see table 1). Future research is needed to provide insight on why this significant difference exist between Hispanic master’s degree earners and the majority student subgroups and potential workforce implications.
Hispanic graduates earned the largest number of doctoral degrees in bioengineering and biomedical engineering, 44 degrees in 2016. However, this only comprised 4.2 percent of all doctoral degrees conferred in this subdiscipline in 2016. The top five engineering subdisciplines for Hispanic graduates (figure 3) was similar to all racial and ethnic groups combined. Noteworthy trends from 2011 to 2016 include increases in doctoral degrees in materials, metallurgical, and ceramics engineering (from 10 to 24 degrees, an increase of 140 percent), and aerospace engineering (from 8 to 15 degrees, an increase of 88 percent), see table 1.

9
363
353
280
137
135
106
105
79
73
64
FIGURE 2. Number of master's degrees conferred to Hispanic graduates in ten largest engineering subdisciplines for Hispanic graduates: 2015-16
Civil Engineering
Mechanical Engineering
Electrical Engineering
Systems Engineering
Industrial Engineering
Bioengineering and Biomedical Engineering
Engineering, General Engineering, Engineering Physics, Engineering Science
Aerospace Engineering
Computer Engineering
Chemical, Biochemical, Biomolecular Engineering
SOURCE: U.S. Department of Education, National Center for Education Statistics, Integrated Postsecondary Education Data System (IPEDS), Fall 2011 and Fall 2016, Completions component. (This table was prepared May 2018).
44
40
39
39
26
24
15
10
8
8
FIGURE 3. Number of doctoral degrees conferred to Hispanic graduates in ten largest engineering subdisciplines for Hispanic graduates: 2015-16
Bioengineering and Biomedical Engineering
Mechanical Engineering
Chemical, Biochemical, Biomolecular Engineering
Electrical Engineering
Civil Engineering
Materials, Metallurgical and Ceramics Engineering
Aerospace Engineering
Engineering, General Engineering, Engineering Physics, Engineering Science
Environmental Engineering
Computer Engineering
SOURCE: U.S. Department of Education, National Center for Education Statistics, Integrated Postsecondary Education Data System (IPEDS), Fall 2011 and Fall 2016, Completions component. (This table was prepared May 2018).

THE 2018 STATUS REPORT ON ENGINEERING EDUCATION10
GENDER DEGREE COMPLETION PATTERNS
A similar increase was found in undergraduate engineering degrees earned by Hispanic men and women. However, in 2016, the number of engineering bachelor’s degrees conferred to men was 3.5 times that of women (8,808 vs. 2,493, respectively). This gender disparity is even more noteworthy because in all fields of study, Hispanic women earned more bachelor’s degrees than Hispanic men in 2016, (61 vs. 39 percent, respectively). Hispanic women also earned more master’s degrees and doctoral degrees in all major fields of study than Hispanic men, 64 percent vs. 57 percent respectively (see figure 4).6 7 However, at both the master’s and doctoral levels, the number of engineering degrees conferred to Hispanic men was three times that of Hispanic women.
39.5%
78.3%
36.1%
60.5%
21.7%
63.9%
73.7%
50.0%
FIGURE 4. Percentage distribution of bachelor's degrees and master's degrees conferred to Hispanic graduates, by gender and engineering status: 2015-16
Males Females
All Bachelor's Degrees
Engineering Bachelor's Degrees
All Master's Degrees
Engineering Master's Degrees73.7% 26.3%
SOURCE: U.S. Department of Education, National Center for Education Statistics, Integrated Postsecondary Education Data System (IPEDS), Fall 2011 and Fall 2016, Completions component. (This table was prepared May 2018).

11
DEGREES CONFERRED TO BLACK GRADUATES
BACHELOR’S DEGREES IN ENGINEERING
The number of bachelor’s degrees in engineering conferred to Black students increased by 35 percent over the five-year timespan (from 3,097 degrees in 2011 to 4,166 degrees in 2016), see table 2. While there has been an increase in degrees to Black students during this timeframe, it is important to contextualize these numbers. The increase in engineering bachelor’s degrees conferred to Black students (35 percent) was higher than the 5-year increase in all other bachelor’s degrees conferred (12 percent). However, only 4 percent of all bachelor’s degrees awarded in engineering went to Black students, which is a percentage that has not changed since 2011. Comparatively, across all subdisciplines, 10 percent of all bachelor’s degrees were awarded to Black graduates during the 2015-16 academic year.8 It is also important to note that Black students composed 13 percent of all undergraduate college students during the fall semester of 2016.9
BACHELOR’S DEGREES IN ENGINEERING SUBDISCIPLINES
The 10 largest engineering subdisciplines among Black graduates in 2016 (figure 5) are similar to most other racial and ethnic groups. Black graduates earned the majority of their engineering bachelor’s degrees in mechanical engineering (22 percent), electrical engineering (20 percent), and civil engineering (12 percent) for a combined 54 percent. While computer engineering is the fifth largest subdiscipline for this group, as previously stated, some institutions consider computer engineering a part of electrical engineering. If this broader definition of electrical engineering was utilized, this subdiscipline would then be the largest subdiscipline for bachelor’s degrees to Black graduates.
Although much smaller than the previously noted subdisciplines, some of the largest percentage increases in engineering bachelor’s degrees conferred to Black students were in the following subdisciplines (These examples focus primarily on subdisciplines that awarded more than 10 degrees in 2016): petroleum engineering (from 21 to 99, an increase of 371 percent), environmental engineering (from 14 to 38, an increase of 171 percent), bioengineering and biomedical engineering (from 137 to 256, an increase of 87 percent), and agricultural engineering (from 29 to 49, an increase of 69 percent), see table 2. Unlike Hispanic undergraduates, the rapid growth of Black undergraduates earning degrees in petroleum engineering is occurring in more states than Texas and Oklahoma. Reasons for the growth in this subdiscipline require further study of both workforce demands and recruitment strategies.

THE 2018 STATUS REPORT ON ENGINEERING EDUCATION12
TABLE 2. Number and five year percentage change of bachelor’s, master’s, and doctoral degrees in engineering conferred to Black graduates, by subdiscipline: 2010-11 and 2015-16
BLACKBACHELOR’S DEGREES MASTER’S DEGREES DOCTORAL DEGREES
2011 20165-year change 2011 2016
5-year change 2011 2016
5-year change
Aerospace Engineering 94 116 23.4% 25 26 4.0% 4 4 0.0%
Agricultural Engineering 29 49 69.0% 1 4 300.0% 4 3 -25.0%
Architectural Engineering 35 29 -17.1% 1 8 700.0% 0 0
Bioengineering and Biomedical Engineering
137 256 86.9% 38 54 42.1% 20 29 45.0%
Biological Engineering 1 4 300.0% 1 1 0.0% 0 0
Chemical, Biochemical, Biomolecular Engineering
266 351 32.0% 29 40 37.9% 13 18 38.5%
Civil Engineering 459 514 12.0% 125 135 8.0% 12 13 8.3%
Computer Engineering 218 333 52.8% 30 34 13.3% 7 9 28.6%
Construction Engineering 5 11 120.0% 9 8 -11.1% 0 0
Electrical Engineering 727 831 14.3% 236 194 -17.8% 23 34 47.8%
Electrical/ Computer Engineering
2 3 50.0% 5 6 20.0% 0 1
Engineering Mechanics 0 1 3 1 -66.7% 0 0
Engineering, General Engineering, Engineering Physics, Engineering Science
105 149 41.9% 142 153 7.7% 12 18 50.0%
Environmental Engineering 14 38 171.4% 17 28 64.7% 2 4 100.0%
Geological Engineering 0 1 1 2 100.0% 0 1
Industrial Engineering 205 236 15.1% 93 78 -16.1% 13 8 -38.5%
Manufacturing Engineering 15 15 0.0% 8 8 0.0% 0 0
Materials, Metallurgical and Ceramics Engineering
50 83 66.0% 13 28 115.4% 12 10 -16.7%
Mechanical Engineering 589 920 56.2% 102 106 3.9% 13 21 61.5%
Mining Engineering 1 5 400.0% 5 0 0 0
Naval Architecture and Marine Engineering
1 6 500.0% 0 0 0 0
Nuclear and Radiological Engineering
20 15 -25.0% 5 4 -20.0% 1 1 0.0%
Ocean Engineering 3 3 0.0% 1 0 0 0
Optics and Phototonics 0 0 0 0 2 0
Other 22 36 63.6% 33 44 33.3% 0 7
Petroleum Engineering 21 99 371.4% 13 11 -15.4% 0 0
Software Engineering 42 19 -54.8% 25 35 40.0% 0 0
Surveying Engineering 3 1 -66.7% 0 0 0 0
Systems Engineering 33 42 27.3% 90 108 20.0% 3 11 266.7%
Engineering Total 3,097 4,166 34.5% 1,051 1,116 6.2% 141 192 36.2%
Non-Engineering Total 169,634 190,307 12.2% 79,691 87,701 10.1% 10,793 13,173 22.1%
SOURCE: U.S. Department of Education, National Center for Education Statistics, Integrated Postsecondary Education Data System (IPEDS), Fall 2011 and Fall 2016, Completions component. (This table was prepared May 2018).

13
920
831
514
351
333
256
236
149
116
99
FIGURE 5. Number of bachelor's degrees conferred to Black graduates in ten largest engineering subdisciplines for Black graduates: 2015-16
Mechanical Engineering
Electrical Engineering
Civil Engineering
Chemical, Biochemical, Biomolecular Engineering
Computer Engineering
Bioengineering and Biomedical Engineering
Industrial Engineering
Engineering, General Engineering, Engineering Physics, Engineering Science
Aerospace Engineering
Petroleum Engineering
SOURCE: U.S. Department of Education, National Center for Education Statistics, Integrated Postsecondary Education Data System (IPEDS), Fall 2011 and Fall 2016, Completions component. (This table was prepared May 2018).
GRADUATE DEGREES IN ENGINEERING
Master’s degrees granted to Black graduates in engineering increased at a slightly smaller rate than all other master’s degrees earned by Black graduates from 2011 to 2016 (6 percent compared to 10 percent, respectively).10 Similarly, a small number of doctoral degrees in engineering are conferred to Black graduates although the overall number of degrees increased 36 percent (141 degrees vs. 192 degrees) in this time frame, see table 2. Although the increase in the number of engineering master’s degrees exceed the growth in non-engineering master’s degrees, the reverse was true at the doctoral level. Black graduates saw a significant increase in the number of non-engineering doctoral degrees earned from 2011 to 2016 (22.1 percent) however, that was below the rate of growth among engineering doctoral degrees, 36 percent.11 Despite numerous efforts to broaden participation in graduate engineering programs and small increases in master’s and doctoral degrees in engineering, Black students remain significantly underrepresented across the engineering subdisciplines. In 2016, the percentages of all master’s degrees and doctoral degrees in engineering awarded to Black students (2 percent each) have been relatively unchanged since 2011. However, across all fields, 11 percent of all master’s degrees and 8 percent of all doctoral degrees were awarded to Black graduates during the 2015-16 academic year.12 13

THE 2018 STATUS REPORT ON ENGINEERING EDUCATION14
PHOTO COURTESY OF THE UNIVERSITY OF KENTUCKY
GRADUATE DEGREES IN ENGINEERING SUBDISCIPLINES
The largest engineering subdisciplines conferring master’s degrees among Black graduates in 2016 (figure 6) has similarities to the largest subdisciplines at the undergraduate level. Electrical engineering was the largest producer conferring 17 percent of all master’s degrees, a similar share as at the undergraduate level, 20 percent of bachelor’s degrees in engineering. However, mechanical engineering was only 9 percent of master’s degrees, but 22 percent of all bachelor’s degrees to Black graduates. It should also be noted that software engineering is sometimes included within the field of electrical engineering. While we do not adopt this approach in this report, doing so would increase the overall share of degrees conferred by electrical engineering as a subdiscipline.
With regards to smaller specialty subdisciplines in engineering, the largest percentage increases in engineering master’s degrees to Black graduates were in the following subdisciplines (these examples focus primarily on subdisciplines that awarded more than 10 degrees in 2016) (see table 2):
• Materials, metallurgical and Ceramics Engineering: 115 percent (from 13 to 28);
• Environmental engineering: 65 percent (from 17 to 28);
• Bioengineering and biomedical engineering: 42 percent (from 28 to 54); and
• Software engineering: 40 percent from (from 25 to 35).
At the doctoral level, electrical engineering and bioengineering and biomedical engineering are the two largest subdisciplines and make up a third of all engineering doctoral degrees conferred to Black graduates (34 and 29 respectively), see figure 7. Both of these subdisciplines benefited from significant growth from 2011-16, 48 percent for electrical engineering and 45 percent for bioengineering and biomedical engineering. Another noteworthy increase from 2011-16 was a 62 percent increase in doctoral degrees in mechanical engineering (from 13 to 21, respectively), see table 2.
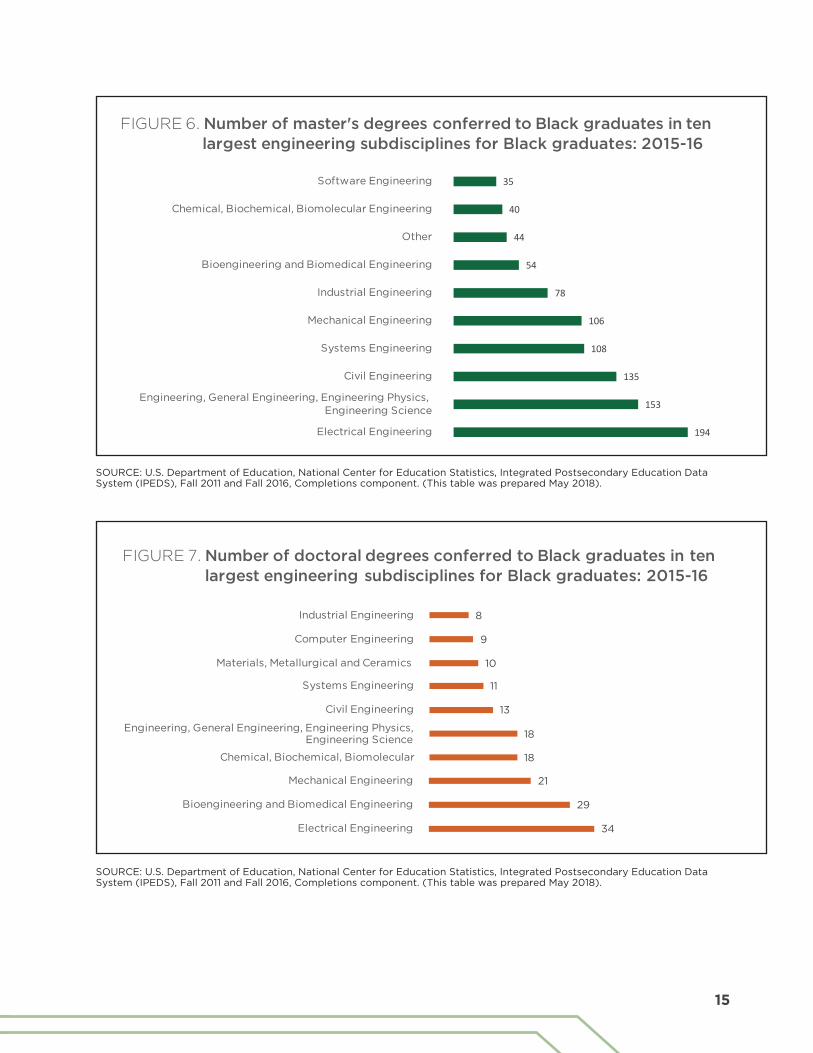
15
194
153
135
108
106
78
54
44
40
35
FIGURE 6. Number of master's degrees conferred to Black graduates in ten largest engineering subdisciplines for Black graduates: 2015-16
Electrical Engineering
Engineering, General Engineering, Engineering Physics, Engineering Science
Civil Engineering
Systems Engineering
Mechanical Engineering
Industrial Engineering
Bioengineering and Biomedical Engineering
Other
Chemical, Biochemical, Biomolecular Engineering
Software Engineering
SOURCE: U.S. Department of Education, National Center for Education Statistics, Integrated Postsecondary Education Data System (IPEDS), Fall 2011 and Fall 2016, Completions component. (This table was prepared May 2018).
34
29
21
18
18
13
11
10
9
8
FIGURE 7. Number of doctoral degrees conferred to Black graduates in ten largest engineering subdisciplines for Black graduates: 2015-16
Electrical Engineering
Bioengineering and Biomedical Engineering
Mechanical Engineering
Chemical, Biochemical, Biomolecular
Civil Engineering
Systems Engineering
Materials, Metallurgical and Ceramics
Computer Engineering
Industrial Engineering
Engineering, General Engineering, Engineering Physics, Engineering Science
SOURCE: U.S. Department of Education, National Center for Education Statistics, Integrated Postsecondary Education Data System (IPEDS), Fall 2011 and Fall 2016, Completions component. (This table was prepared May 2018).

THE 2018 STATUS REPORT ON ENGINEERING EDUCATION16
GENDER DEGREE COMPLETION PATTERNS
The number of engineering degrees conferred to Black men in 2016 was nearly three times the number of degrees conferred to Black women, which illustrates the extreme gender disparities even within a group that is highly underrepresented within the field of engineering, see figure 8. The advantage in number of engineering bachelor’s degrees Black men have over Black women is also striking because Black female earned 64 percent of all bachelor’s degrees in 2016. Despite no significant gender difference in the growth in post-baccalaureate degrees in engineering to Black graduates, the number of degrees conferred to Black men far outnumber those conferred to Black women. In 2016, the number of master’s degrees granted to Black men was 2.5 greater than the number awarded to Black women (796 vs. 320, respectively). At the engineering doctoral level, the number of degrees conferred to Black men was almost twice that conferred to Black women (123 vs. 69, respectively). However, across all other major fields of study, Black women earned 70 percent of master’s degrees conferred, which illustrates the extreme gender disparities in engineering even within a group that is highly underrepresented within the field of engineering.14
35.9%
75.1%
30.4%
71.8%
64.1%
24.9%
69.6%
28.2%
50.0%
FIGURE 8. Percentage distribution of bachelor's degrees and master's degrees conferred to Black graduates, by gender and engineering status: 2015-16
Males Females
All Bachelor's Degrees
Engineering Bachelor's Degrees
All Master's Degrees
Engineering Master's Degrees
SOURCE: U.S. Department of Education, National Center for Education Statistics, Integrated Postsecondary Education Data System (IPEDS), Fall 2011 and Fall 2016, Completions component. (This table was prepared May 2018).

17
DEGREES CONFERRED TO AMERICAN INDIAN/ALASKA NATIVE GRADUATES
BACHELOR’S DEGREES IN ENGINEERING
A small number of undergraduate engineering degrees are conferred to American Indian/Alaska Native (AIAN) graduates and the number of bachelor’s degrees decreased by 5 percent from 321 degrees awarded in 2011 to 306 degrees awarded in 2016, see table 3. AIAN was the only racial and ethnic group to experience a decrease in the number of bachelor’s degrees awarded in engineering from 2011 to 2016. The decline in engineering bachelor’s degrees to AIAN graduates follows a larger trend among this racial/ethnic group. The number of AIAN public high school graduates peaked in 2009-10 and has declined by 11.4 percent in the last six years (2009-10 to 2015-16).15 AIAN enrollment at 4-year colleges and universities also saw a significant decline over the same period, declining 23.3 percent from 2010 to 2016.16 Also, the number of non-engineering bachelor’s degrees to AIAN students declined 19 percent from 2011 to 2016.17
The 306 bachelor’s degrees in engineering awarded to AIAN is 0.3 percent of all engineering bachelor’s degrees. The number of undergraduate degrees conferred to AIAN graduates should be understood within the context of larger demographic characteristics about the United States. In 2016, the Census Bureau estimated that about 1 percent of the total population (approximately 3.7 million people) were AIAN. Therefore, although AIAN represent a very small share of the U.S. population, their small share of engineering degrees shows an extreme underrepresentation. A variety of factors may impact access to engineering professions.
BACHELOR’S DEGREES IN ENGINEERING SUBDISCIPLINES
Mechanical engineering was the largest subdiscipline (nearly one-third of all undergraduate engineering degrees) among AIAN graduates in 2016 (figure 9). Civil engineering was the second largest and awarded 17 percent of all undergraduate engineering degrees to AIAN graduates, followed by electrical engineering, 36 degrees. Amongst the three largest engineering subdisciplines for AIAN graduates, mechanical engineering was the only subdiscipline to experience an increase in degrees awarded from 2011 to 2016 (8 degrees). During the same period there was a large decline (34 percent) in civil engineering degrees, see table 3. Further study is needed to understand both the overall decline in engineering bachelor’s degrees to AIAN graduates and the large declines in certain subdisciplines like civil engineering and aerospace engineering.

THE 2018 STATUS REPORT ON ENGINEERING EDUCATION18
TABLE 3. Number and five year percentage change of bachelor’s, master’s, and doctoral degrees in engineering conferred to AIAN graduates, by subdiscipline: 2010-11 and 2015-16
AMERICAN INDIAN/ALASKA NATIVEBACHELOR’S DEGREES MASTER’S DEGREES DOCTORAL DEGREES
2011 20165-year change 2011 2016
5-year change 2011 2016
5-year change
Aerospace Engineering 16 6 -62.5% 3 3 0.0% 0 0
Agricultural Engineering 2 1 -50.0% 1 1 0.0% 0 1
Architectural Engineering 2 2 0.0% 0 0 0 0
Bioengineering and Biomedical Engineering
9 8 -11.1% 3 7 133.3% 3 1 -66.7%
Biological Engineering 0 0 0 0 0 0
Chemical, Biochemical, Biomolecular Engineering
23 27 17.4% 2 2 0.0% 3 0
Civil Engineering 79 52 -34.2% 13 8 -38.5% 0 1
Computer Engineering 11 5 -54.5% 1 2 100.0% 0 0
Construction Engineering 4 4 0.0% 1 3 200.0% 0 0
Electrical Engineering 40 36 -10.0% 10 4 -60.0% 0 2
Electrical/ Computer Engineering 0 0 0 0 0 0
Engineering Mechanics 0 0 0 0 0 0
Engineering, General Engineering, Engineering Physics, Engineering Science
15 25 66.7% 7 8 14.3% 0 3
Environmental Engineering 5 9 80.0% 2 2 0.0% 1 0
Geological Engineering 0 1 2 0 0 0
Industrial Engineering 10 9 -10.0% 4 2 -50.0% 0 0
Manufacturing Engineering 0 1 0 0 0 0
Materials, Metallurgical and Ceramics Engineering
3 6 100.0% 0 0 3 0
Mechanical Engineering 84 92 9.5% 13 11 -15.4% 4 1 -75.0%
Mining Engineering 0 1 0 0 0 0
Naval Architecture and Marine Engineering
1 3 200.0% 0 0 0 0
Nuclear and Radiological Engineering 0 0 0 0 0 0
Ocean Engineering 1 0 0 0 0 0
Optics and Phototonics 0 0 0 0 0 0
Other 1 5 400.0% 4 2 -50.0% 0 1
Petroleum Engineering 7 11 57.1% 0 1 0 0
Software Engineering 5 1 -80.0% 0 10 0 0
Surveying Engineering 0 0 0 0 0 0
Systems Engineering 3 1 -66.7% 2 5 150.0% 0 0
Engineering Total 321 306 -4.7% 68 71 4.4% 14 10 -28.6%
Non-Engineering Total 11,614 9,431 -18.8% 3,878 3,469 -10.5% 933 798 -14.5%
SOURCE: U.S. Department of Education, National Center for Education Statistics, Integrated Postsecondary Education Data System (IPEDS), Fall 2011 and Fall 2016, Completions component. (This table was prepared May 2018).

19
92
52
36
27
25
11
9
9
8
6
6
5
5
FIGURE 9. Number of bachelor's degrees conferred to American Indian/Alaska Native graduates in ten largest engineering subdisciplines for AIAN graduates: 2015-16
Mechanical Engineering
Civil Engineering
Electrical Engineering
Chemical, Biochemical, Biomolecular Engineering
Engineering, General Engineering, Engineering Physics,Engineering Science
Petroleum Engineering
Environmental Engineering
Industrial Engineering
Bioengineering and Biomedical Engineering
Aerospace Engineering
Materials, Metallurgical and Ceramics Engineering
Computer Engineering
Other
SOURCE: U.S. Department of Education, National Center for Education Statistics, Integrated Postsecondary Education Data System (IPEDS), Fall 2011 and Fall 2016, Completions component. (This table was prepared May 2018).
GRADUATE DEGREES IN ENGINEERING
Like undergraduate degrees, the number of graduate engineering degree degrees conferred to AIAN graduates is also small. For master’s degrees, the number of degrees conferred to AIAN graduates increased by 4 percent from 68 degrees in 2011 to 71 degrees in 2016, despite an overall decline of 10.3 percent in all master’s degrees.18 At the doctoral level, the number of engineering degrees conferred to AIAN graduates decreased from 14 degrees in 2011 to 10 degrees in 2016 (a decrease of 29 percent). The number of non-engineering doctoral degrees conferred to AIAN also declined, 14.5 percent.19
GRADUATE DEGREES IN ENGINEERINGSUBDISCIPLINES
Mechanical engineering was the largest engineering subdiscipline at the master’s degree level with 11 degrees (15 percent of all master’s degrees in engineering earned by AIAN graduates), see figure 10. Software engineering was the second largest, making up 14 percent of all master’s degrees. However, it should be noted that software engineering and computer engineering are considered a part of electrical engineering at some colleges, which made up 6 and 3 percent of all master’s degrees in engineering, respectively. If such a definition was employed in this report, the number of degrees under electrical engineering would be drastically improved, 16 degrees, which would be the largest for any subdiscipline among AIAN.

THE 2018 STATUS REPORT ON ENGINEERING EDUCATION20
Many of the engineering subdisciplines at the master’s degree level experienced modest declines in numbers for AIAN graduates from 2011 to 2016. The overall growth of AIAN master’s degrees in engineering, 4 percent, can mostly be attributed to the increase in AIAN students earning master’s degrees in software engineering, see table 3. In 2011, there were no master’s degrees conferred to AIAN students in software engineering. Only five years later, 10 were conferred. Further study is needed to understand this emerging trend and how it relates to changes in the technology industry workforce demands.
At the doctoral degrees level only two subdisciplines awarded more than one doctoral degree to AIAN students in 2016: electrical engineering; and engineering, general engineering, engineering physics, engineering science, see figure 11. AIAN students earned doctoral degrees in only seven of the engineering subdisciplines and most of these experienced a decline from 2011-16, see table 3.
PHOTO COURTESY OF THE UNIVERSITY OF ARKANSAS

21
11
10
8
8
7
5
4
3
3
FIGURE 10. Number of master's degrees conferred to American Indian/Alaska Native graduates in ten largest engineering subdisciplines for AIAN graduates: 2015-16
Mechanical Engineering
Software Engineering
Civil Engineering
Engineering, General Engineering, Engineering Physics, Engineering Science
Bioengineering and Biomedical Engineering
Systems Engineering
Electrical Engineering
Aerospace Engineering
Construction Engineering
SOURCE: U.S. Department of Education, National Center for Education Statistics, Integrated Postsecondary Education Data System (IPEDS), Fall 2011 and Fall 2016, Completions component. (This table was prepared May 2018).
3
2
1
1
1
1
1
FIGURE 11. Number of doctoral degrees conferred to American Indian/Alaska Native graduates in largest engineering subdisciplines for AIAN graduates: 2015-16
Engineering, General Engineering, Engineering Physics,Engineering Science
Electrical Engineering
Agricultural Engineering
Bioengineering and Biomedical Engineering
Civil Engineering
Mechanical Engineering
Other
SOURCE: U.S. Department of Education, National Center for Education Statistics, Integrated Postsecondary Education Data System (IPEDS), Fall 2011 and Fall 2016, Completions component. (This table was prepared May 2018).

THE 2018 STATUS REPORT ON ENGINEERING EDUCATION22
GENDER DEGREE COMPLETION PATTERNS
Regarding degrees by gender, the number of degrees awarded to AIAN men outnumber those awarded to AIAN women by a 4 to 1 ratio (242 degrees vs. 64 degrees, respectively). Despite this large gender gap in engineering bachelor’s degrees, AIAN women earned 61 percent of all bachelor’s degrees conferred to AIAN graduates in 2016, see figure 12. Furthermore, while there was an overall decrease in the number of engineering bachelor’s degrees to AIAN students, this decrease manifested exclusively for AIAN women whose number of degrees decreased 21 percent from 2011 to 2016. Among all racial and ethnic groups, AIAN women graduates were the only group to experience a decrease in undergraduate engineering degrees over this span of time. While the decreases in undergraduate engineering degrees were experienced solely by women, different patterns emerge for graduate degrees. At the master’s level, the number of degrees conferred to men decreased slightly from 2011 to 2016, (55 vs. 52, respectively). For women, there was in increase in degrees conferred from 13 to 19. Also, at the doctoral level, degrees conferred to AIAN men decreased (13 vs. 7) while the number of degrees conferred to AIAN women increased (1 vs. 3). Nonetheless, at the master’s degree level, the number of graduate degrees awarded to AIAN men in 2016 were at least double those awarded to AIAN women, which was opposite the numbers among all master’s degrees, where American Indian women earned 65 percent of degrees conferred to AIAN graduates.
39.3%
79.4%
34.7%
72.2%
60.7%
20.6%
65.3%
27.8%
50.0%
FIGURE 12. Percentage distribution of bachelor's degrees and master's degrees conferred to American Indian/Alaska Native graduates, by gender and engineering status: 2015-16
Males Females
All Bachelor's Degrees
Engineering Bachelor's Degrees
All Master's Degrees
Engineering Master's Degrees
SOURCE: U.S. Department of Education, National Center for Education Statistics, Integrated Postsecondary Education Data System (IPEDS), Fall 2011 and Fall 2016, Completions component. (This table was prepared May 2018).

23
DEGREES CONFERRED TO NATIVE HAWAIIAN/PACIFIC ISLANDER GRADUATES
BACHELOR’S DEGREES IN ENGINEERING
Native Hawaiian/Pacific Islander (NHPI) earned the fewest bachelor’s degrees in engineering of any racial and ethnic group. While a small number of undergraduate engineering degrees are conferred to NHPI graduates, the number increased by 22 percent from 134 degrees in 2011 to 163 degrees in 2016, see table 4. This discussion of engineering degrees should be understood within the context of larger demographic characteristics about the United States. In 2016, the Census Bureau estimated that less than 1 percent of the total population (approximately 800,000 people) were NHPI.20 Federally collected higher education data implemented a new category in 2010 that separated NHPI students from Asian American Students. Since 2011, NHPI enrollment at 4-year colleges and universities is down from 38,700 to 35,700.21 Accordingly, the small number of NHPI engineering degrees partially reflects the small NHPI population, in addition to other factors that impact access to engineering professions.
BACHELOR’S DEGREES IN ENGINEERING SUBDISCIPLINES
Analysis of the largest subdisciplines for undergraduate engineering degrees to NHPI graduates in 2016 (figure 13) shows that 43 percent of all bachelor’s degrees awarded to NHPI graduates were in mechanical engineering (38 degrees) and civil engineering (32 degrees). Third largest was electrical engineering (25 degrees). However, within some institutions, a broader definition of electrical engineering is adopted which combines electrical engineering with electrical/computer engineering, computer engineering and software engineering—each of which is not included the electrical engineering subdiscipline represented in this report. Using a broader definition of electrical engineering would mean including the eight bachelor’s degrees earned by NHPI graduates in computer engineering. This would make the total for electrical engineering (33 degrees) the second largest subdiscipline for NHPI graduates.

THE 2018 STATUS REPORT ON ENGINEERING EDUCATION24
Table 4. Number and five year percentage change of bachelor’s, master’s, and doctoral degrees in engineering conferred to NHPI graduates, by subdiscipline: 2010-11 and 2015-16
NATIVE HAWAIIAN/PACIFIC ISLANDBACHELOR’S DEGREES MASTER’S DEGREES DOCTORAL DEGREES
2011 20165-year change 2011 2016
5-year change 2011 2016
5-year change
Aerospace Engineering 5 8 60% 0 0 0 0
Agricultural Engineering 0 1 0 0 0 0
Architectural Engineering 1 0 0 0 0 0
Bioengineering and Biomedical Engineering
9 11 22% 2 1 -50% 2 0
Biological Engineering 0 0 0 0 0 0
Chemical, Biochemical, Biomolecular Engineering
5 11 120% 0 0 1 0
Civil Engineering 36 32 -11% 4 4 0% 0 0
Computer Engineering 13 8 -38% 0 2 0 0
Construction Engineering 0 2 0 0 0 0
Electrical Engineering 20 25 25% 6 5 -17% 0 1
Electrical/ Computer Engineering 0 0 0 0 0 0
Engineering Mechanics 0 0 0 0 0 0
Engineering, General Engineering, Engineering Physics, Engineering Science
5 6 20% 2 1 -50% 0 0
Environmental Engineering 2 3 50% 0 1 0 0
Geological Engineering 0 0 1 0 0 0
Industrial Engineering 0 4 0 0 0 0
Manufacturing Engineering 0 1 0 0 0 0
Materials, Metallurgical and Ceramics Engineering
2 4 100% 1 0 0 1
Mechanical Engineering 32 38 19% 2 4 100% 0 0
Mining Engineering 0 0 0 0 0 0
Naval Architecture and Marine Engineering
0 1 0 0 0 0
Nuclear and Radiological Engineering 1 0 0 0 0 1
Ocean Engineering 0 1 0 0 0 0
Optics and Phototonics 0 1 0 0 0 0
Other 0 1 0 1 0 0
Petroleum Engineering 0 0 0 0 0 0
Software Engineering 3 2 -33% 0 1 0 0
Surveying Engineering 0 0 0 0 0 0
Systems Engineering 0 3 3 3 0% 1 0
Engineering Total 134 163 22% 21 23 10% 4 3 -25%
Non-Engineering Total 4,138 4,493 8.6% 1,326 1,562 17.8% 344 326 -5.2%
All 4,272 1,347 348
SOURCE: U.S. Department of Education, National Center for Education Statistics, Integrated Postsecondary Education Data System (IPEDS), Fall 2011 and Fall 2016, Completions component. (This table was prepared May 2018).
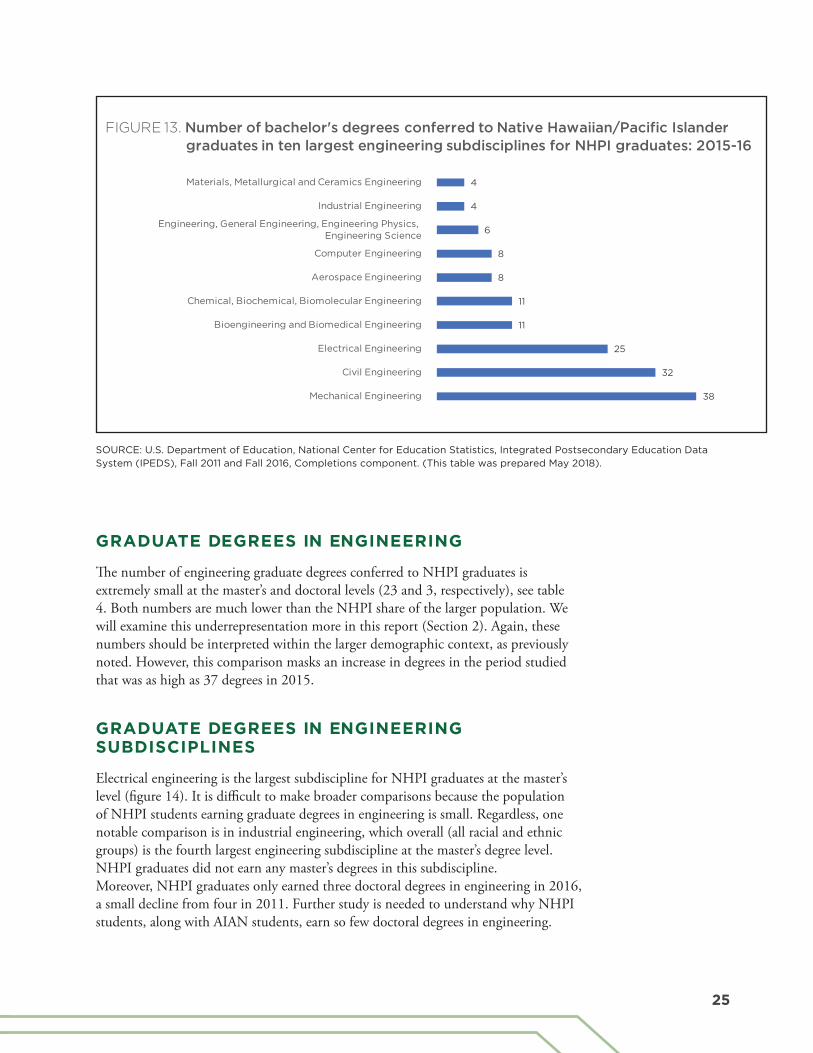
25
38
32
25
11
11
8
8
6
4
4
FIGURE 13. Number of bachelor's degrees conferred to Native Hawaiian/Pacific Islander graduates in ten largest engineering subdisciplines for NHPI graduates: 2015-16
Mechanical Engineering
Civil Engineering
Electrical Engineering
Bioengineering and Biomedical Engineering
Chemical, Biochemical, Biomolecular Engineering
Aerospace Engineering
Computer Engineering
Engineering, General Engineering, Engineering Physics, Engineering Science
Industrial Engineering
Materials, Metallurgical and Ceramics Engineering
SOURCE: U.S. Department of Education, National Center for Education Statistics, Integrated Postsecondary Education Data System (IPEDS), Fall 2011 and Fall 2016, Completions component. (This table was prepared May 2018).
GRADUATE DEGREES IN ENGINEERING
The number of engineering graduate degrees conferred to NHPI graduates is extremely small at the master’s and doctoral levels (23 and 3, respectively), see table 4. Both numbers are much lower than the NHPI share of the larger population. Wewill examine this underrepresentation more in this report (Section 2). Again, thesenumbers should be interpreted within the larger demographic context, as previouslynoted. However, this comparison masks an increase in degrees in the period studiedthat was as high as 37 degrees in 2015.
GRADUATE DEGREES IN ENGINEERINGSUBDISCIPLINES
Electrical engineering is the largest subdiscipline for NHPI graduates at the master’s level (figure 14). It is difficult to make broader comparisons because the population of NHPI students earning graduate degrees in engineering is small. Regardless, one notable comparison is in industrial engineering, which overall (all racial and ethnic groups) is the fourth largest engineering subdiscipline at the master’s degree level. NHPI graduates did not earn any master’s degrees in this subdiscipline.Moreover, NHPI graduates only earned three doctoral degrees in engineering in 2016, a small decline from four in 2011. Further study is needed to understand why NHPI students, along with AIAN students, earn so few doctoral degrees in engineering.

THE 2018 STATUS REPORT ON ENGINEERING EDUCATION26
5
4
4
3
2
1
1
1
1
1
FIGURE 14. Number of master's degrees conferred to Native Hawaiian/Pacific Islander graduates in ten largest engineering subdisciplines for NHPI graduates: 2015-16
Electrical Engineering
Mechanical Engineering
Civil Engineering
Systems Engineering
Computer Engineering
Bioengineering and Biomedical Engineering
Engineering, General Engineering, Engineering Physics, Engineering Science
Software Engineering
Environmental Engineering
Other Engineering
SOURCE: U.S. Department of Education, National Center for Education Statistics, Integrated Postsecondary Education Data System (IPEDS), Fall 2011 and Fall 2016, Completions component. (This table was prepared May 2018).
1
1
1
FIGURE 15. Number of master's degrees conferred to Native Hawaiian/Pacific Islander graduates in largest engineering subdisciplines for NHPI graduates: 2015-16
Electrical Engineering
Materials, Metallurgical and Ceramics Engineering
Nuclear and Radiological Engineering
SOURCE: U.S. Department of Education, National Center for Education Statistics, Integrated Postsecondary Education Data System (IPEDS), Fall 2011 and Fall 2016, Completions component. (This table was prepared May 2018).

27
GENDER DEGREE COMPLETION PATTERNS
Women earned a slight majority of all bachelor’s degrees conferred to NHPI graduates (56 percent). However, they earned less than a quarter of engineering bachelor’s degrees conferred to NHPI graduates overall, see figure 16. In 2016, at the master’s degree level, NHPI men received about four times the number of degrees as women, despite NHPI women earning a majority of all master’s degrees in their racial/ethnic group. During that same year, there were no doctoral degrees conferred to NHPI women and only three were awarded to NHPI men.
43.9%
77.0%
38.4%
78.3%
56.1%
23.0%
61.6%
21.7%
50.0%
FIGURE 16. Percentage distribution of bachelor's degrees and master's degrees conferred to Native Hawaiian/Pacific Islander graduates, by gender and engineering status: 2015-16
Males Females
All Bachelor's Degrees
Engineering Bachelor's Degrees
All Master's Degrees
Engineering Master's Degrees
SOURCE: U.S. Department of Education, National Center for Education Statistics, Integrated Postsecondary Education Data System (IPEDS), Fall 2011 and Fall 2016, Completions component. (This table was prepared May 2018).

THE 2018 STATUS REPORT ON ENGINEERING EDUCATION28
OTHER GROUPS IN ENGINEERINGDEGREES CONFERRED TO WHITE GRADUATES
BACHELOR’S DEGREES IN ENGINEERING
The number of undergraduate engineering degrees conferred to White graduates increased by 30 percent from 2011-16 (49,639 vs. 64,408 degrees), which is very significant because of declines or no growth in the number of White students graduating from high school, enrolled in college and earning bachelor’s degrees in all other major fields of study, see table 5. The number of White public high school graduates has declined by 8 percent since 2007-08.22 Since 2010, the number of White students enrolled in 4-year colleges and universities has also declined 8 percent. Finally, there was no growth in the number of non-engineering bachelor’s degrees earned by White graduates during this period.23 Further study is needed to understand how in the midst of declining and no growth trends, the number of White students earning engineering bachelor’s degrees increased significantly.
While the bulk of all undergraduate engineering degrees were conferred to White graduates, 61 percent in 2016, there was a slight decrease from 2011 when 64 percent of all bachelor’s degrees in engineering were conferred to this group. This decrease in the share of degrees conferred to White graduates is largely due to substantial increases in degrees conferred to the following racial and ethnic groups from 2011-16:
• Hispanic graduates increased their share of all engineering degrees by 2 percentagepoints (from 8 percent to 10 percent);
• Non-U.S. Resident graduates also increased their share of all engineering degreesby 2 percentage points (from 7 percent to 9 percent); and
• Multi-Racial graduates also increased their share of all engineering degrees by 2percentage points (from 1 percent to 3 percent).
In general, the percentage of engineering degrees conferred to White graduates in 2016 is similar to the percentage of bachelor’s degrees across all subjects earned in this group (62 percent), as well as their general representation within the larger U.S. population.24 25
BACHELOR’S DEGREES IN ENGINEERINGSUBDISCIPLINES
Insight into the 10 subdisciplines with the largest number of engineering bachelor’s degrees awarded to White students in 2016 (figure 17) indicates that mechanical engineering degrees granted (30 percent) far outpaced bachelor’s in all other engineering areas. Electrical engineering was the third largest subdiscipline, however,

29
SOURCE: U.S. Department of Education, National Center for Education Statistics, Integrated Postsecondary Education Data System (IPEDS), Fall 2011 and Fall 2016, Completions component. (This table was prepared May 2018).
Table 5. Number and five year percentage change of bachelor’s, master’s, and doctoral degrees in engineering conferred to White graduates, by subdiscipline: 2010-11 and 2015-16
WHITEBACHELOR’S DEGREES MASTER’S DEGREES DOCTORAL DEGREES
2011 20165-year change 2011 2016
5-year change 2011 2016
5-year change
Aerospace Engineering 2,305 2,504 8.6% 706 815 15.4% 96 157 63.5%
Agricultural Engineering 668 799 19.6% 108 112 3.7% 30 36 20.0%
Architectural Engineering 655 469 -28.4% 135 111 -17.8% 3 3 0.0%
Bioengineering and Biomedical Engineering
2,084 3,499 67.9% 578 968 67.5% 342 430 25.7%
Biological Engineering 65 222 241.5% 4 9 125.0% 0 5
Chemical, Biochemical, Biomolecular Engineering
4,131 5,983 44.8% 423 455 7.6% 289 356 23.2%
Civil Engineering 8,577 8,118 -5.4% 2,401 2,105 -12.3% 180 267 48.3%
Computer Engineering 2,347 3,413 45.4% 398 421 5.8% 69 63 -8.7%
Construction Engineering 388 361 -7.0% 58 48 -17.2% 0 0
Electrical Engineering 5,926 7,782 31.3% 1,900 1,694 -10.8% 392 392 0.0%
Electrical/ Computer Engineering
9 44 388.9% 25 51 104.0% 1 5 400.0%
Engineering Mechanics 72 61 -15.3% 70 33 -52.9% 13 21 61.5%
Engineering, General Engineering, Engineering Physics, Engineering Science
2,110 2,174 3.0% 1,105 1,077 -2.5% 180 160 -11.1%
Environmental Engineering 533 941 76.5% 420 391 -6.9% 47 55 17.0%
Geological Engineering 122 233 91.0% 67 124 85.1% 4 8 100.0%
Industrial Engineering 1,950 2,875 47.4% 573 660 15.2% 80 67 -16.3%
Manufacturing Engineering 179 294 64.2% 99 82 -17.2% 1 0
Materials, Metallurgical and Ceramics Engineering
975 1,301 33.4% 328 408 24.4% 170 244 43.5%
Mechanical Engineering 13,753 19,358 40.8% 2,586 2,528 -2.2% 337 461 36.8%
Mining Engineering 190 248 30.5% 23 49 113.0% 2 9 350.0%
Naval Architecture and Marine Engineering
306 351 14.7% 24 33 37.5% 1 3 200.0%
Nuclear and Radiological Engineering
362 354 -2.2% 188 209 11.2% 65 71 9.2%
Ocean Engineering 136 138 1.5% 45 27 -40.0% 5 8 60.0%
Optics and Phototonics 7 18 157.1% 14 11 -21.4% 6 6 0.0%
Other 393 543 38.2% 422 477 13.0% 26 53 103.8%
Petroleum Engineering 560 1,155 106.3% 51 84 64.7% 1 5 400.0%
Software Engineering 419 570 36.0% 201 172 -14.4% 4 5 25.0%
Surveying Engineering 42 26 -38.1% 7 1 -85.7% 0 3
Systems Engineering 375 574 53.1% 717 938 30.8% 25 30 20.0%
Engineering Total 49,639 64,408 29.8% 13,676 14,093 3.0% 2,369 2,923 23.4%
Non-Engineering Total 1,133,051 1,132,991 -0.0% 449,246 417,757 -7.0% 103,621 104,185 0.5%

THE 2018 STATUS REPORT ON ENGINEERING EDUCATION30
it should be noted that this subdiscipline is sometimes combined with computer engineering (sixth largest subdiscipline). This combination is not used in this report in the tables, but if the computer engineering subdiscipline was added to electrical engineering then electrical engineering would be the second largest subdiscipline.In terms of subdisciplines that are much smaller in number, the following had large percentage increases in engineering bachelor’s degrees to White graduates (see table 5):
• Biological engineering: 242 percent (from 65 to 222);
• Petroleum engineering: 106 percent (from 560 to 1155);
• Geological engineering: 91 percent (from 122 to 233); and
• Environmental engineering: 77 percent (from 533 to 941).
As noted, White students earned the majority of engineering degrees in 2016, 61 percent. However, there are several subdisciplines where White graduates earned 74 percent or more of all bachelor’s degrees:
• Naval architecture and marine engineering: 83 percent (425);
• Geological engineering: 81 percent (287);
• Biological engineering: 78 percent (284);
• Construction engineering: 74 percent (487); and
• Mining engineering: 74 percent (336).
19,358
8,118
7,782
5,983
3,499
3,413
2,875
2,504
2,174
1,301
FIGURE 17. Number of bachelor's degrees conferred to White graduates in ten largest engineering subdisciplines for White graduates: 2015-16
Mechanical Engineering
Civil Engineering
Electrical Engineering
Chemical, Biochemical, Biomolecular Engineering
Bioengineering and Biomedical Engineering
Computer Engineering
Industrial Engineering
Aerospace Engineering
Engineering, General Engineering, Engineering Physics, Engineering Science
Materials, Metallurgical and Ceramics Engineering
SOURCE: U.S. Department of Education, National Center for Education Statistics, Integrated Postsecondary Education Data System (IPEDS), Fall 2011 and Fall 2016, Completions component. (This table was prepared May 2018).
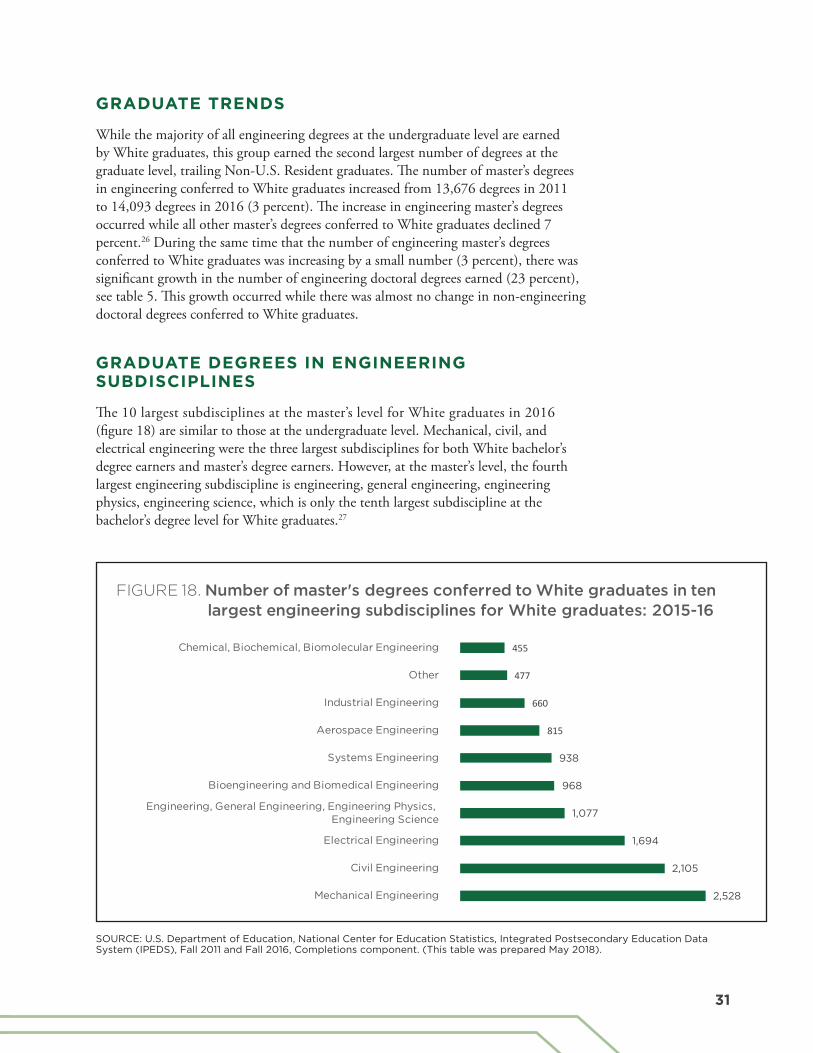
31
GRADUATE TRENDS
While the majority of all engineering degrees at the undergraduate level are earned by White graduates, this group earned the second largest number of degrees at the graduate level, trailing Non-U.S. Resident graduates. The number of master’s degrees in engineering conferred to White graduates increased from 13,676 degrees in 2011 to 14,093 degrees in 2016 (3 percent). The increase in engineering master’s degrees occurred while all other master’s degrees conferred to White graduates declined 7 percent.26 During the same time that the number of engineering master’s degrees conferred to White graduates was increasing by a small number (3 percent), there was significant growth in the number of engineering doctoral degrees earned (23 percent), see table 5. This growth occurred while there was almost no change in non-engineering doctoral degrees conferred to White graduates.
GRADUATE DEGREES IN ENGINEERINGSUBDISCIPLINES
The 10 largest subdisciplines at the master’s level for White graduates in 2016 (figure 18) are similar to those at the undergraduate level. Mechanical, civil, and electrical engineering were the three largest subdisciplines for both White bachelor’s degree earners and master’s degree earners. However, at the master’s level, the fourth largest engineering subdiscipline is engineering, general engineering, engineering physics, engineering science, which is only the tenth largest subdiscipline at the bachelor’s degree level for White graduates.27
2,528
2,105
1,694
1,077
968
938
815
660
477
455
FIGURE 18. Number of master's degrees conferred to White graduates in ten largest engineering subdisciplines for White graduates: 2015-16
Mechanical Engineering
Civil Engineering
Electrical Engineering
Engineering, General Engineering, Engineering Physics, Engineering Science
Bioengineering and Biomedical Engineering
Systems Engineering
Aerospace Engineering
Industrial Engineering
Other
Chemical, Biochemical, Biomolecular Engineering
SOURCE: U.S. Department of Education, National Center for Education Statistics, Integrated Postsecondary Education Data System (IPEDS), Fall 2011 and Fall 2016, Completions component. (This table was prepared May 2018).

THE 2018 STATUS REPORT ON ENGINEERING EDUCATION32
The third most master’s degrees were in electrical engineering, 1,694 degrees, which made up 12 percent of engineering master’s degrees to White graduates. By comparison, electrical engineering made up a third of engineering master’s degrees conferred to both Asian American and Non-U.S. Resident graduates. Also, while engineering, general engineering, engineering physics, engineering science, and bioengineering and biomedical engineering was amongst the fourth largest subdiscipline for White graduates, it was not among the five largest for Asian American and Non-U.S. Resident graduates. Conversely, industrial engineering and computer engineering are amongst the five largest master’s degree subdisciplines for Asian American and Non-U.S. Resident graduates, but not as large a share of White graduates. In fact, computer engineering is not even amongst the 10 largest subdisciplines for White graduates at the master’s level.
Because of the larger number of engineering degrees earned by White students, even small percentage increases translate to large numbers. In terms of growth, some of the largest percentage increases in engineering master’s degrees to White graduates were in the following areas:
• Systems engineering: 31 percent (from 717 to 938); and
• Materials, metallurgical, and ceramics engineering: 24 percent (from 328 to 408).
Nearly one-third of doctoral degrees in engineering earned by White graduates were in mechanical engineering (461 degrees) and bioengineering and biomedical engineering (430 degrees), see figure 19. Noteworthy increases in doctoral degrees from 2011 to 2016 for subdisciplines with fewer than 300 doctoral degrees include (see table 5):
• Aerospace engineering: 64 percent (from 96 to 157);
• Civil engineering: 48 percent (from 180 to 267); and
• Materials, metallurgical, and ceramics engineering: 44 percent (from 170 to 244).
461
430
392
356
267
244
160
157
71
67
Mechanical Engineering
Bioengineering and Biomedical Engineering
Electrical Engineering
Chemical, Biochemical, Biomolecular
Civil Engineering
Materials, Metallurgical and Ceramics
Engineering, General Engineering,
Aerospace Engineering
Nuclear and Radiological Engineering
Industrial Engineering
FIGURE 19. Number of doctoral degrees conferred to White graduates in ten largest engineering subdisciplines for White graduates: 2015-16
SOURCE: U.S. Department of Education, National Center for Education Statistics, Integrated Postsecondary Education Data System (IPEDS), Fall 2011 and Fall 2016, Completions component. (This table was prepared May 2018).
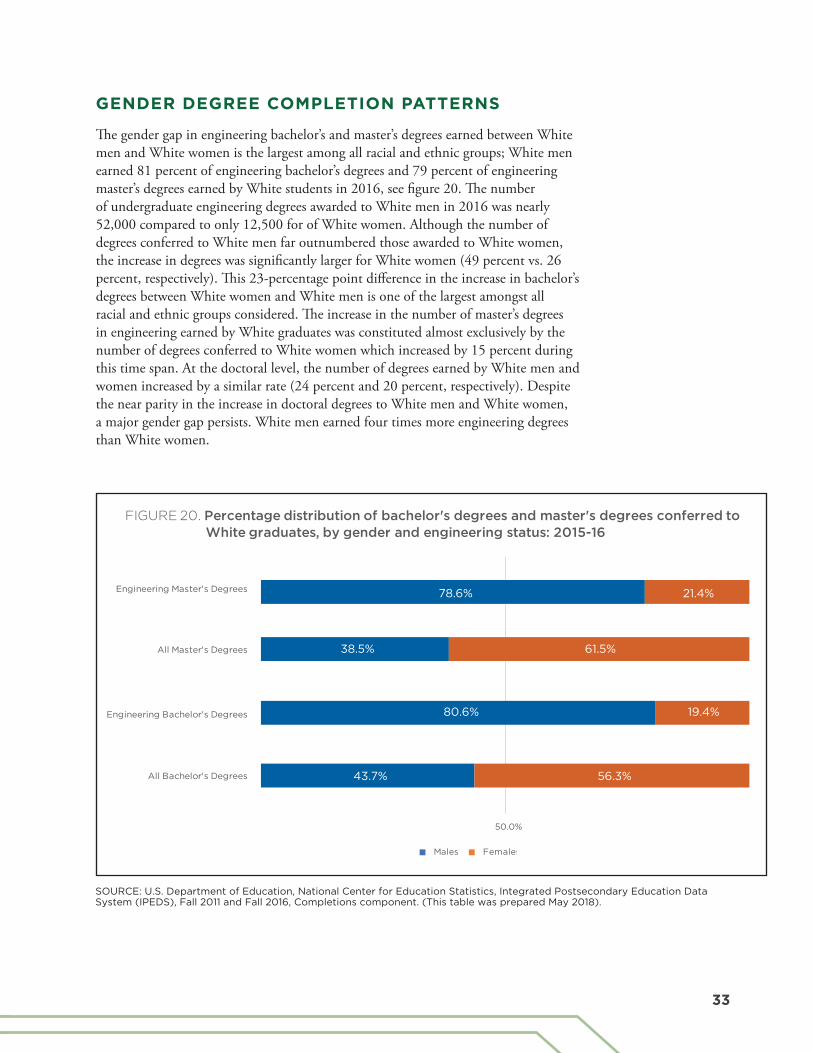
33
GENDER DEGREE COMPLETION PATTERNS
The gender gap in engineering bachelor’s and master’s degrees earned between White men and White women is the largest among all racial and ethnic groups; White men earned 81 percent of engineering bachelor’s degrees and 79 percent of engineering master’s degrees earned by White students in 2016, see figure 20. The number of undergraduate engineering degrees awarded to White men in 2016 was nearly 52,000 compared to only 12,500 for of White women. Although the number of degrees conferred to White men far outnumbered those awarded to White women, the increase in degrees was significantly larger for White women (49 percent vs. 26 percent, respectively). This 23-percentage point difference in the increase in bachelor’s degrees between White women and White men is one of the largest amongst all racial and ethnic groups considered. The increase in the number of master’s degrees in engineering earned by White graduates was constituted almost exclusively by the number of degrees conferred to White women which increased by 15 percent during this time span. At the doctoral level, the number of degrees earned by White men and women increased by a similar rate (24 percent and 20 percent, respectively). Despite the near parity in the increase in doctoral degrees to White men and White women, a major gender gap persists. White men earned four times more engineering degrees than White women.
43.7%
80.6%
38.5%
78.6%
56.3%
19.4%
61.5%
21.4%
50.0%
FIGURE 20. Percentage distribution of bachelor's degrees and master's degrees conferred to White graduates, by gender and engineering status: 2015-16
Males Females
All Bachelor's Degrees
Engineering Bachelor's Degrees
All Master's Degrees
Engineering Master's Degrees
SOURCE: U.S. Department of Education, National Center for Education Statistics, Integrated Postsecondary Education Data System (IPEDS), Fall 2011 and Fall 2016, Completions component. (This table was prepared May 2018).

THE 2018 STATUS REPORT ON ENGINEERING EDUCATION34
DEGREES CONFERRED TO ASIAN AMERICAN GRADUATES
BACHELOR’S DEGREES IN ENGINEERING
The number of undergraduate engineering degrees conferred to Asian American graduates in 2011 to 2016 increased by 35 percent (from 8,925 degrees to 12,006), which allowed this group to keep pace with other racial and ethnic groups, see table 6. The increase in engineering bachelor’s degrees conferred to Asian American students (35 percent) was more than twice the 5-year increase in all other bachelor’s degrees conferred (13 percent).28 Similarly, Asian American students earned 11 percent of all U.S. engineering bachelor’s degrees in 2011 and 2016. Eleven percent, is nearly twice the percentage of bachelor’s degrees across all subjects that this group earned (7 percent).29
BACHELOR’S DEGREES IN ENGINEERINGSUBDISCIPLINES
Electrical engineering and mechanical engineering produced the largest number of undergraduate engineering degrees conferred to Asian American graduates, see figure 21. While electrical engineering was the largest producer in 2016, it should be notedthat computer engineering is the fifth largest subdiscipline. If the number of degreesfor electrical engineering were combined with computer engineering, the combinationwould account for 29 percent of all engineering degrees. The third largest subdisciplinefor Asian American graduates was bioengineering and biomedical with nearly 1,500degrees conferred in 2016. Bioengineering and biomedical engineering is the thirdlargest subdiscipline for Asian American graduates and accounts for 22 percent of allbachelor’s degrees conferred in this subdiscipline.
With regards to engineering areas that experienced substantial growth, a number of subdisciplines showed more than a 100 percent increase in bachelor’s degrees awarded to Asian American graduates including, see table 6):
• Environmental engineering: 113 percent (from 56 to 119);
• Computer engineering: 112 percent (from 532 to 1127); and
• Petroleum engineering: 104 percent (from 56 to 114).
GRADUATE DEGREES IN ENGINEERING
Asian American graduates were one of a few racial and ethnic groups to experience a decrease in the number of master’s degrees from 2011 through 2016. The overall number of master’s degrees in engineering conferred to Asian American graduates decreased by 9 percent from 3,784 degrees in 2011 to 3,461 degrees in 2016, see table 6. The number of master’s degrees in engineering conferred to Asian American students is only 6.6 percent of all master’s degrees in engineering conferred. That is about half of the percentage of bachelor’s degrees in engineering conferred to American students in 2016. The decline in engineering master’s degrees conferred to Asian Americans occurred despite an overall increase in master’s degrees earned

35
Table 6. Number and five year percentage change of bachelor’s, master’s, and doctoral degrees in engi-neering conferred to Asian American graduates, by subdiscipline: 2010-11 and 2015-16
ASIAN AMERICANBACHELOR’S DEGREES MASTER’S DEGREES DOCTORAL DEGREES
2011 20165-year change 2011 2016
5-year change 2011 2016
5-year change
Aerospace Engineering 344 374 8.7% 113 114 0.9% 16 21 31.3%
Agricultural Engineering 117 110 -6.0% 8 14 75.0% 3 2 -33.3%
Architectural Engineering 31 30 -3.2% 4 7 75.0% 0 2
Bioengineering and Biomedical Engineering
1,141 1,479 29.6% 295 354 20.0% 122 160 31.1%
Biological Engineering 6 13 116.7% 1 1 0.0% 0 3
Chemical, Biochemical, Biomolecular Engineering
838 1,300 55.1% 129 175 35.7% 57 87 52.6%
Civil Engineering 1,147 1,095 -4.5% 425 365 -14.1% 40 36 -10.0%
Computer Engineering 532 1,127 111.8% 128 172 34.4% 18 10 -44.4%
Construction Engineering 11 18 63.6% 14 7 -50.0% 0 0
Electrical Engineering 1,920 2,430 26.6% 901 732 -18.8% 161 142 -11.8%
Electrical/ Computer Engineering
1 14 1300.0% 9 17 88.9% 1 0
Engineering Mechanics 7 6 -14.3% 4 3 -25.0% 2 1 -50.0%
Engineering, General Engineering, Engineering Physics, Engineering Science
252 289 14.7% 300 263 -12.3% 35 22 -37.1%
Environmental Engineering 56 119 112.5% 39 47 20.5% 6 5 -16.7%
Geological Engineering 1 7 600.0% 3 2 -33.3% 0 0
Industrial Engineering 451 561 24.4% 168 129 -23.2% 13 10 -23.1%
Manufacturing Engineering 16 26 62.5% 15 9 -40.0% 1 0
Materials, Metallurgical and Ceramics Engineering
187 204 9.1% 64 83 29.7% 28 44 57.1%
Mechanical Engineering 1,604 2,363 47.3% 466 481 3.2% 60 81 35.0%
Mining Engineering 3 5 66.7% 1 0 0 0
Naval Architecture and Marine Engineering
8 12 50.0% 2 1 -50.0% 0 2
Nuclear and Radiological Engineering
28 40 42.9% 13 11 -15.4% 6 5 -16.7%
Ocean Engineering 5 6 20.0% 0 2 2 0
Optics and Phototonics 0 2 0 0 0 1
Other 52 94 80.8% 89 78 -12.4% 3 7 133.3%
Petroleum Engineering 56 114 103.6% 19 30 57.9% 1 2 100.0%
Software Engineering 55 82 49.1% 423 214 -49.4% 2 1 -50.0%
Surveying Engineering 0 1 0 0 0 0
Systems Engineering 56 85 51.8% 151 150 -0.7% 8 5 -37.5%
Engineering Total 8,925 12,006 34.5% 3,784 3,461 -8.5% 585 649 10.9%
Non-Engineering Total 107,869 121,606 12.7% 38,597 40,871 5.9% 16,145 18,602 15.2%
SOURCE: U.S. Department of Education, National Center for Education Statistics, Integrated Postsecondary Education Data System (IPEDS), Fall 2011 and Fall 2016, Completions component. (This table was prepared May 2018).

THE 2018 STATUS REPORT ON ENGINEERING EDUCATION36
by this group, 6.9 percent.30 While there was a decrease in master’s degrees for Asian American graduates, the number of doctoral degrees in engineering conferred to this group increased 11 percent from 585 degrees in 2011 to 649 degrees in 2016. This is similar to the 14.8 percent increase in non-engineering doctoral degrees earned by this group. Asian American graduates were awarded 6 percent of all doctoral degrees in engineering in 2016, this group earned 11 percent of doctoral degrees across all fields that year.31
GRADUATE DEGREES IN ENGINEERINGSUBDISCIPLINES
The two largest subdisciplines for master’s degrees in engineering to Asian American students in 2016 (figure 22) is similar to the undergraduate level, electrical engineering and mechanical engineering. Another similarity to the undergraduate level findings is the large number of degrees in the related subdisciplines of software engineering (214 degrees) and computer engineering (172 degrees). However, the five-year trend in these three subdisciplines is very different at each degree level. The number of Asian American students earning bachelor’s degrees in electrical engineering, computer engineering and software engineering increased significantly from 2011 to 2016, (27, 112, and 49 percent, respectively). At the graduate level, the number of master’s degrees earned by Asian American students declined in both electrical engineering and software engineering (19 vs. 49 percent, respectively). During the same period, the number of master’s degrees earned in computer engineering increased 34 percent, see table 6.
2,430
2,363
1,479
1,300
1,127
1,095
561
374
289
204
FIGURE 21. Number of bachelor's degrees conferred to Asian American graduates in ten largest engineering subdisciplines for Asian American graduates: 2015-16
Electrical Engineering
Mechanical Engineering
Bioengineering and Biomedical Engineering
Chemical, Biochemical, Biomolecular Engineering
Computer Engineering
Civil Engineering
Industrial Engineering
Aerospace Engineering
Engineering, General Engineering, Engineering Physics, Engineering Science
Materials, Metallurgical and Ceramics Engineering
SOURCE: U.S. Department of Education, National Center for Education Statistics, Integrated Postsecondary Education Data System (IPEDS), Fall 2011 and Fall 2016, Completions component. (This table was prepared May 2018).

37
732
481
365
354
263
214
175
172
150
129
FIGURE 22. Number of master's degrees conferred to Asian American graduates in ten largest engineering subdisciplines for Asian American graduates: 2015-16
Electrical Engineering
Mechanical Engineering
Civil Engineering
Bioengineering and Biomedical Engineering
Engineering, General Engineering, Engineering Physics, Engineering Science
Software Engineering
Chemical, Biochemical, Biomolecular Engineering
Computer Engineering
Systems Engineering
Industrial Engineering
SOURCE: U.S. Department of Education, National Center for Education Statistics, Integrated Postsecondary Education Data System (IPEDS), Fall 2011 and Fall 2016, Completions component. (This table was prepared May 2018).
160
142
87
81
44
36
22
21
10
10
Bioengineering and Biomedical Engineering
Electrical Engineering
Chemical, Biochemical, Biomolecular
Mechanical Engineering
Materials, Metallurgical and Ceramics
Civil Engineering
Engineering, General Engineering, Engineering Physics,Engineering Science
Aerospace Engineering
Computer Engineering
Industrial Engineering
FIGURE 23. Number of doctoral degrees conferred to Asian American graduates in ten largest engineering subdisciplines: 2015-16
SOURCE: U.S. Department of Education, National Center for Education Statistics, Integrated Postsecondary Education Data System (IPEDS), Fall 2011 and Fall 2016, Completions component. (This table was prepared May 2018).

THE 2018 STATUS REPORT ON ENGINEERING EDUCATION38
In addition to an increase in computer engineering master’s degrees, there was substantial growth in the following subdisciplines, see table 6:
• Chemical, biochemical, biomolecular engineering: 36 percent (from 129 to 175); and
• Bioengineering and biomedical engineering: 20 percent (from 295 to 354).
Nearly half of all doctoral degrees in engineering earned by Asian Americans in 2016 were in bioengineering and biomedical engineering and electrical engineering, 47 percent combined, see figure 18. Although Asian American students earned similar number of doctoral degrees in these two subdisciplines, the representation of Asian Americans in each field varies significantly. Asian Americans earned 160 doctoral degrees in bioengineering and biomedical engineering which represents 15 percent of all doctoral degrees conferred in this subdiscipline. However, the 140 doctoral degrees in electrical engineering represents only 6 percent of this subdiscipline.
PHOTO COURTESY OF SOUTHERN UNIVERSITY

39
GENDER DEGREE COMPLETION PATTERNS
The overall increase in undergraduate engineering degrees awarded to Asian Americans overall masks differences between Asian American men and women within their racial/ethnic group. While bachelor’s degrees awarded to Asian American men increased 30 percent (from 6,879 in 2011 to 8,973 in 2016), this increase was substantially higher for women, 48 percent, from 2,046 to 3,033. Despite this increase for Asian American women, in 2016, the number of degrees conferred to Asian American men remained approximately 3 times higher than that of their female peers. The distribution of all bachelor’s degrees among Asian American students is almost evenly split as Asian American men earned 54 percent of all bachelor’s degrees in this group, see figure 24. This difference underscores disparities in engineering, even within a racial and ethnic group with a high level of representation in the field. In terms of gender differences, the decrease in engineering degrees in 2011 to 2016 at the master’s level were similar for Asian American men and women, (10 percent vs. 6 percent), and the increase at the doctoral level were also fairly comparable (12 percent vs. 8 percent). However, at each graduate level, the number of engineering degrees conferred to Asian American men was more than twice that of Asian American women.
45.8%
74.8%
43.9%
70.2%
54.2%
25.2%
56.1%
29.8%
50.0%
FIGURE 24. Percentage distribution of bachelor's degrees and master's degrees conferred to Asian American graduates, by gender and engineering status: 2015-16
Males Females
All Bachelor's Degrees
Engineering Bachelor's Degrees
All Master's Degrees
Engineering Master's Degrees
SOURCE: U.S. Department of Education, National Center for Education Statistics, Integrated Postsecondary Education Data System (IPEDS), Fall 2011 and Fall 2016, Completions component. (This table was prepared May 2018).
THE 2018 STATUS REPORT ON ENGINEERING EDUCATION40
DEGREES CONFERRED TO NON-U.S. RESIDENT GRADUATES
It is important to clearly define this group because of some confusion that exists between the definitions of Non-U.S. Resident students versus Resident, non-citizen students. According to the U.S. Department of Education, National Center for Education Statistics:
• Non-Resident alien (person)- A person who is not a citizen or national of the United States and who is in this country on a visa or temporary basis and does not have the right to remain indefinitely.
• Resident alien (person)- A person who is not a citizen or national of the United States but who has been admitted as a legal immigrant for the purpose of obtain-ing permanent resident alien status.
It is also important to note that Non-Resident students are counted as a separate category, while resident, non-citizens are counted in the appropriate racial and ethnic categories along with U.S. citizens. Although, Non-Resident students are not officially counted as a member of a racial group they may be indistinguishable from members of various racial groups.
This report uses the term "Non-U.S. Resident" in place of "Non-Resident" to show that residency pertains to Country, not state.
BACHELOR’S DEGREES IN ENGINEERING
The number of undergraduate engineering degrees conferred to Non-U.S. Resident graduates has nearly doubled in the last five years, increasing by 92 percent (from 5,301 degrees in 2011 to 10,192 degrees in 2016), see table 7. This is the largest increase experienced by any racial and ethnic group. Non-U.S. Resident graduates earned 9 percent of all engineering bachelor’s degrees in 2016. The increase in engineering bachelor’s degrees conferred to Non-U.S. Resident graduates (92 percent) was higher than the 5-year increase in all other bachelor’s degrees conferred (57 percent).32 To provide context, this group of students earned 4 percent of all undergraduate degrees across all fields during the 2015-2016 academic year.33

41
SOURCE: U.S. Department of Education, National Center for Education Statistics, Integrated Postsecondary Education Data System (IPEDS), Fall 2011 and Fall 2016, Completions component. (This table was prepared May 2018).
Table 7. Number and five year percentage change of bachelor’s, master’s, and doctoral degrees in engineering conferred to Non-U.S. Resident graduates, by subdiscipline: 2010-11 and 2015-16
Non-U.S. ResidentBACHELOR’S DEGREES MASTER’S DEGREES DOCTORAL DEGREES
2011 20165-year change 2011 2016
5-year change 2,011 2,016
5-year change
Aerospace Engineering 246 302 22.8% 335 404 20.6% 107 124 15.9%
Agricultural Engineering 19 51 168.4% 101 153 51.5% 88 75 -14.8%
Architectural Engineering 23 53 130.4% 18 21 16.7% 0 9
Bioengineering and Biomedical Engineering
233 383 64.4% 444 721 62.4% 260 296 13.8%
Biological Engineering 3 8 166.7% 15 9 -40.0% 0 12
Chemical, Biochemical, Biomolecular Engineering
475 975 105.3% 608 915 50.5% 420 487 16.0%
Civil Engineering 504 1,139 126.0% 1,358 2,355 73.4% 464 619 33.4%
Computer Engineering 304 594 95.4% 977 2,388 144.4% 204 256 25.5%
Construction Engineering 9 25 177.8% 30 142 373.3% 0 0
Electrical Engineering 1,389 2,187 57.5% 5,971 10,163 70.2% 1,308 1,520 16.2%
Electrical/ Computer Engineering
1 17 1600.0% 142 343 141.5% 16 17 6.3%
Engineering Mechanics 2 11 450.0% 35 41 17.1% 45 48 6.7%
Engineering, General Engineering, Engineering Physics, Engineering Science
175 310 77.1% 907 1,259 38.8% 291 333 14.4%
Environmental Engineering 26 100 284.6% 212 366 72.6% 78 70 -10.3%
Geological Engineering 11 14 27.3% 11 20 81.8% 2 10 400.0%
Industrial Engineering 455 882 93.8% 1,569 2,605 66.0% 218 275 26.1%
Manufacturing Engineering 15 45 200.0% 171 156 -8.8% 3 2 -33.3%
Materials, Metallurgical and Ceramics Engineering
67 189 182.1% 413 608 47.2% 366 423 15.6%
Mechanical Engineering 888 2,240 152.3% 2,201 3,919 78.1% 630 812 28.9%
Mining Engineering 16 44 175.0% 13 44 238.5% 1 15 1400.0%
Naval Architecture and Marine Engineering
23 11 -52.2% 11 15 36.4% 2 2 0.0%
Nuclear and Radiological Engineering
16 38 137.5% 41 56 36.6% 33 51 54.5%
Ocean Engineering 5 6 20.0% 31 40 29.0% 15 7 -53.3%
Optics and Phototonics 0 7 9 29 222.2% 11 11 0.0%
Other 26 108 315.4% 293 460 57.0% 48 82 70.8%
Petroleum Engineering 284 356 25.4% 281 357 27.0% 56 96 71.4%
Software Engineering 28 44 57.1% 514 1,606 212.5% 1 2 100.0%
Surveying Engineering 1 2 100.0% 1 5 400.0% 0 6
Systems Engineering 57 51 -10.5% 326 513 57.4% 59 61 3.4%
Engineering Total 5,301 10,192 92.3% 17,038 29,713 74.4% 4,726 5,721 21.1%
Non-Engineering Total 47,239 74,058 56.8% 69,372 106,229 53.1% 14,239 15,739 10.5%

THE 2018 STATUS REPORT ON ENGINEERING EDUCATION42
BACHELOR’S DEGREES IN ENGINEERINGSUBDISCIPLINES
Mechanical engineering and electrical engineering are the largest bachelor’s degree engineering subdisciplines among Non-U.S. Resident graduates (figure 25), making up 22 and 21 percent of engineering bachelor’s degrees earned by Non-U.S. Resident graduates, respectively.
Compared to the largest five subdisciplines previously noted in table 7, the following subdisciplines are smaller in number, but had large percentage increases in engineering bachelor’s degrees to Non-U.S. Resident graduates:
• Environmental engineering: 285 percent (from 26 to 100);
• Manufacturing engineering: 200 percent (from 15 to 45); and
• Materials, metallurgical, and ceramics engineering: 182 percent (from 67 to 189).
2,240
2,187
1,139
975
882
594
383
356
310
302
Mechanical Engineering
Electrical Engineering
Civil Engineering
Chemical, Biochemical, Biomolecular Engineering
Industrial Engineering
Computer Engineering
Bioengineering and Biomedical Engineering
Petroleum Engineering
Engineering, General Engineering, Engineering Physics, Engineering Science
Aerospace Engineering
FIGURE 25. Number of bachelor's degrees conferred to Non-Resident graduates in ten largest engineering subdisciplines for Non-U.S. Resident graduates: 2015-16
SOURCE: U.S. Department of Education, National Center for Education Statistics, Integrated Postsecondary Education Data System (IPEDS), Fall 2011 and Fall 2016, Completions component. (This table was prepared May 2018).

43
GRADUATE DEGREES IN ENGINEERING
While Non-U.S. Residents only earned 9 percent of undergraduate engineering degrees, they earned 56 percent of master’s and 56 percent of doctoral degrees in engineering. Furthermore, the number of master’s engineering degrees conferred to Non-U.S. Resident graduates has increased by 74 percent (from 17,038 degrees to 29,713), see table 7. The percentage increase in doctoral degrees conferred to this group was smaller, but also substantial at 21 percent. The increase in both engineering master’s degrees and doctoral degrees conferred to Non-U.S. Resident graduates exceeded the growth in the number of non-engineering master’s degrees and doctoral degrees conferred to this group, 74 percent compared to 53.1 percent (master’s degrees) and 21 percent compared to 10.5 percent (doctoral degrees).34 35 This substantial growth in the number of master’s degrees earned by Non-U.S. Resident students has greatly shifted the overall breakdown of engineering degrees. In 2011, Non-U.S. Resident students earned 43 percent of all engineering master’s degrees. Five years later, the share of master’s degrees in engineering going to Non-U.S. Resident students increased to 56 percent.
GRADUATE DEGREES IN ENGINEERINGSUBDISCIPLINES
The 10 largest engineering subdisciplines among Non-U.S. Resident graduates shows the high concentration of master’s degrees conferred in electrical engineering (10,163 degree), see figure 26. More than one-third of all master’s degrees engineering earned by Non-U.S. Resident graduates were in electrical engineering. The large number of master’s degrees in electrical engineering conferred to Non-U.S. Resident students represents 77 percent of all master’s degrees in electrical engineering. Non-U.S. Resident students also earned 77 percent of all master’s degrees in computer engineering and 78 percent of all master’s degrees in software engineering.
In terms of growth areas, the largest percentage increases in master’s degrees occurred in several subdisciplines not listed amongst the largest fields (see table 7):
• Construction engineering: 373 percent, (from 30 to 142);
• Software engineering: 212 percent, (from 514 to 1606); and
• Electrical/computer engineering: 142, (from 142 to 343).
Electrical engineering was also the largest subdiscipline for Non-U.S. Residents at the doctoral level (1,520) which composed 69 percent of all doctoral degrees earned in electrical engineering, see figure 27.
The following subdisciplines experienced considerable growth from 2011 to 2016 (see table 7):
• Petroleum engineering: 71 percent (from 56 to 96); and
• Nuclear and radiological engineering: 55 percent (from 33 to 51).

THE 2018 STATUS REPORT ON ENGINEERING EDUCATION44
SOURCE: U.S. Department of Education, National Center for Education Statistics, Integrated Postsecondary Education Data System (IPEDS), Fall 2011 and Fall 2016, Completions component. (This table was prepared May 2018).
FIGURE 26. Number of master's degrees conferred to Non-U.S. Resident graduates in ten largest engineering subdisciplines for Non-U.S. Resident graduates: 2015-16
3,919
10,163
2,605
2,388
2,355
1,606
1,259
915
721
608
Electrical Engineering
Mechanical Engineering
Industrial Engineering
Computer Engineering
Civil Engineering
Software Engineering
Engineering, General Engineering, Engineering Physics, Engineering Science
Chemical, Biochemical, Biomolecular Engineering
Bioengineering and Biomedical Engineering
Materials, Metallurgical and Ceramics Engineering
124
FIGURE 27. Number of doctoral degrees conferred to Non-U.S. Resident graduates in ten largest engineering subdisciplines for Non-U.S. Resident graduates: 2015-16
1,520
812
619
487
423
333
296
275
256
Electrical Engineering
Mechanical Engineering
Civil Engineering
Chemical, Biochemical, Biomolecular
Materials, Metallurgical and Ceramics
Engineering, General Engineering, Engineering Physics, Engineering Science
Bioengineering and Biomedical Engineering
Industrial Engineering
Computer Engineering
Aerospace Engineering
SOURCE: U.S. Department of Education, National Center for Education Statistics, Integrated Postsecondary Education Data System (IPEDS), Fall 2011 and Fall 2016, Completions component. (This table was prepared May 2018).

45
GENDER DEGREE COMPLETION PATTERNS
Non-U.S. Resident graduates is the only racial and ethnic group where men made up the majority of bachelor’s and master’s degree earners both overall and in the engineering field, see figure 28. Further research is needed to understand possible reasons. The increase in undergraduate degrees was similar for men and women; however, for every undergraduate degree conferred to a Non-U.S. Resident woman in 2016, nearly four were conferred to Non-U.S. Resident men (2,142 vs. 8,050) which is a pattern similar to several other groups. At the master’s and doctoral levels, the increase in degrees conferred to Non-U.S. Resident graduates was higher for women compared to men, master’s level increased 98 percent compared to 67 percent; at the doctoral level, 34 percent compared to 18 percent. Nonetheless, at both levels, for every degree conferred to a Non-U.S. Resident woman, approximately three were conferred to Non-U.S. Resident men. In 2016, 7,775 master’s degrees were awarded to Non-U.S. Resident women and 21,938 were awarded to Non-U.S. Resident men. That same year, 1,291 doctoral degrees were awarded to Non-U.S. Resident women and 4,430 were awarded to Non-U.S. Resident men. These gender differences illuminate disparities even amongst the group of students that receive a large share of graduate degrees in engineering.
50.0%
FIGURE 28. Percentage distribution of bachelor's degrees and master's degrees conferred to Non-U.S. Resident graduates, by gender and engineering status: 2015-16
52.1%
56.8%
74.1%
47.9%
43.2%
25.9%
79.0% 21.0%
All Bachelor's Degrees
Engineering Bachelor's Degrees
All Master's Degrees
Engineering Master's Degrees
Males Females
SOURCE: U.S. Department of Education, National Center for Education Statistics, Integrated Postsecondary Education Data System (IPEDS), Fall 2011 and Fall 2016, Completions component. (This table was prepared May 2018).

THE 2018 STATUS REPORT ON ENGINEERING EDUCATION46
MULTI-RACIAL GRADUATES IN ENGINEERINGDEGREES CONFERRED TO MULTI-RACIAL GRADUATES
BACHELOR’S DEGREES IN ENGINEERING
Changes in undergraduate engineering degrees conferred to Multi-Racial graduates should be understood within broader shifts in the demographics of the United States and recent changes in how colleges and universities collect and report race and ethnicity. The number of students who identify as Multi-Racial has increased drastically in the recent past. Based on the most recent Census estimates, 9 million people within the United States identified as Multi-Racial in 2010 compared to 6.8 million people in 2000.36 Other research suggests an even higher number of Multi-Racial individuals.37 While some of this change in the number of Multi-Racial individuals may be driven by an actual increase in the Multi-Race populace, other key driving forces include changes in social and political thinking about race and identity. For instance, the U.S. Census generally provides national guidance on racial classification and first introduced the option for individuals to select multiple races in 2000.38 This contextual background information is important to consider when examining changes in the number of Multi-Racial students over time. Given current and ongoing changes in the social context which influences how people identify, it is difficult to disentangle the degree to which changes in the number of Multi-Racial students are a reflection of (1) an actual increase in the number of students of more than one race, (2) changes in the overarching classification system, or (3) changes in how people see themselves fitting within that classification system.
The number of undergraduate engineering degrees conferred to Multi-Racial graduates has increased by 281 percent (from 875 graduates in 2011 to 3,337 graduates in 2016), see table 8. The increase in bachelor’s degrees in engineering by Multi-Racial students far outpaced their growth in all other major fields of study, 281 percent compared to 195 percent, respectively. In 2016, 3 percent of all bachelor’s degrees in engineering were awarded to Multi-Racial graduates. This is an increase from 1 percent of all bachelor’s degrees in engineering were awarded to Multi-Racial graduates in 2011. Similarly, across all fields, 3 percent of all bachelor’s degrees awarded in 2015-2016 were granted to individuals with two or more races.39

47
SOURCE: U.S. Department of Education, National Center for Education Statistics, Integrated Postsecondary Education Data System (IPEDS), Fall 2011 and Fall 2016, Completions component. (This table was prepared May 2018).
Table 8. Number and five year percentage change of bachelor’s, master’s, and doctoral degrees in engineering conferred to Multi-Racial graduates, by subdiscipline: 2010-11 and 2015-16
MULTI-RACIALBACHELOR’S DEGREES MASTER’S DEGREES DOCTORAL DEGREES
2011 20165-year change 2011 2016
5-year change 2011 2016
5-year change
Aerospace Engineering 31 138 345.2% 15 32 113.3% 2 4 100.0%
Agricultural Engineering 15 28 86.7% 3 8 166.7% 0 2
Architectural Engineering 4 17 325.0% 2 2 0.0% 0 0
Bioengineering and Biomedical Engineering
63 247 292.1% 14 56 300.0% 7 25 257.1%
Biological Engineering 0 12 0 0 0 0
Chemical, Biochemical, Biomolecular Engineering
86 315 266.3% 13 20 53.8% 2 11 450.0%
Civil Engineering 149 362 143.0% 43 92 114.0% 2 4 100.0%
Computer Engineering 50 229 358.0% 6 31 416.7% 1 6 500.0%
Construction Engineering 5 13 160.0% 1 3 200.0% 0 0
Electrical Engineering 135 451 234.1% 49 99 102.0% 4 14 250.0%
Electrical/ Computer Engineering
0 4 1 1 0.0% 0 0
Engineering Mechanics 1 2 100.0% 2 0 1 0
Engineering, General Engineering, Engineering Physics, Engineering Science
36 118 227.8% 21 54 157.1% 1 6 500.0%
Environmental Engineering 5 58 1060.0% 4 15 275.0% 1 4 300.0%
Geological Engineering 2 12 500.0% 1 1 0.0% 0 1
Industrial Engineering 37 145 291.9% 17 25 47.1% 0 5
Manufacturing Engineering 1 15 1400.0% 2 3 50.0% 0 0
Materials, Metallurgical and Ceramics Engineering
15 96 540.0% 6 22 266.7% 5 12 140.0%
Mechanical Engineering 196 879 348.5% 33 129 290.9% 4 13 225.0%
Mining Engineering 2 10 400.0% 1 1 0.0% 0 0
Naval Architecture and Marine Engineering
2 8 300.0% 1 0 0 0
Nuclear and Radiological Engineering
5 26 420.0% 2 4 100.0% 0 2
Ocean Engineering 5 7 40.0% 1 3 200.0% 0 0
Optics and Phototonics 0 2 0 0 0 0
Other 13 42 223.1% 8 21 162.5% 0 2
Petroleum Engineering 9 44 388.9% 1 1 0.0% 0 0
Software Engineering 1 27 2600.0% 5 6 20.0% 0 0
Surveying Engineering 0 0 0 0 0 0
Systems Engineering 7 30 328.6% 16 37 131.3% 1 0
Engineering Total 875 3,337 281.4% 268 666 148.5% 31 111 258.1%
Non-Engineering Total 19,714 58,238 195.4% 6,329 15,917 151.5% 1,220 3,669 200.7%

THE 2018 STATUS REPORT ON ENGINEERING EDUCATION48
BACHELOR’S DEGREES IN ENGINEERINGSUBDISCIPLINES
The 10 largest engineering subdisciplines among Multi-Racial graduates in 2016 (figure 29) include mechanical engineering as the largest subdiscipline, awarding over a quarter of all undergraduate degrees. The second largest was electrical engineering (14 percent of degrees granted) of degrees, followed by civil engineering (11 percent), and chemical, biochemical, biomolecular engineering (9 percent).
The following areas are much smaller in number but had the largest percentage increases in undergraduate engineering degrees to Multi-Racial graduates, see table 8 (These examples focus primarily on subdisciplines that awarded more than 10 degrees in 2016.):
• Materials, metallurgical, and ceramics engineering: 540 percent (from 15 to 96);
• Computer engineering: 358 percent (from 50 to 229); and
• Aerospace engineering: 345 percent (from 31 to 138).
879
451
362
315
247
229
145
138
118
96
Mechanical Engineering
Electrical Engineering
Civil Engineering
Chemical, Biochemical, Biomolecular Engineering
Bioengineering and Biomedical Engineering
Computer Engineering
Industrial Engineering
Aerospace Engineering
Engineering, General Engineering, Engineering Physics, Engineering Science
Materials, Metallurgical and Ceramics Engineering
FIGURE 29. Number of bachelor's degrees conferred to Multi-Racialgraduates in ten largest engineering subdisciplines for Multi-Racial graduates: 2015-16
SOURCE: U.S. Department of Education, National Center for Education Statistics, Integrated Postsecondary Education Data System (IPEDS), Fall 2011 and Fall 2016, Completions component. (This table was prepared May 2018).

49
GRADUATE DEGREES IN ENGINEERING
The number of master’s degrees in engineering conferred to Multi-Racial graduates has increased by 149 percent (from 268 graduates in 2011 to 666 graduates in 2016), see table 8. This is nearly identical to the growth in non-engineering master’s degrees earned by this group, 151.5 percent.40 Also, the number of doctoral degrees in engineering conferred to Multi-Racial graduates increased from 31 to 111 during this period. At the master’s and doctoral levels, Multi-Racial graduates receive approximately 1 percent of all graduate engineering degrees in 2016 which is an estimate similar to percentage of master’s and doctoral degrees conferred to this group across all fields.41
GRADUATE DEGREES IN ENGINEERINGSUBDISCIPLINES
Multi-Racial graduates earned their largest number of master’s degrees in engineering in mechanical engineering, nearly 1 in 5 of all master’s degrees in engineering to Multi-Racial graduates, see figure 30. Electrical engineering and civil engineering conferred similar shares of degrees (15 percent and 14 percent, respectively).
In terms of smaller engineering subdisciplines, the largest percent increases in the number of master’s degrees to Multi-Racial graduates were in the following areas, see table 8:
• Systems engineering: 131 percent (from 16 to 37);
• Aerospace engineering: 113 percent (from 15 to 32); and
• Chemical, biochemical, biomolecular engineering: 54 percent (from 13 to 20).
At the doctoral level, although degrees conferred to Multi-Racial graduates are much smaller, noteworthy trends from 2011 to 2016 include a 257 percent increase in doctoral degrees in bioengineering and biomedical engineering (from 7 to 25) and a 140 percent increase in doctoral degrees in materials, metallurgical, and ceramics engineering (from 5 to 12), see table 8 and figure 31.

THE 2018 STATUS REPORT ON ENGINEERING EDUCATION50
129
99
92
56
54
37
32
31
25
22
Mechanical Engineering
Electrical Engineering
Civil Engineering
Bioengineering and Biomedical Engineering
Engineering, General Engineering, Engineering Physics, Engineering Science
Systems Engineering
Aerospace Engineering
Computer Engineering
Industrial Engineering
Materials, Metallurgical and Ceramics Engineering
FIGURE 30. Number of master's degrees conferred to Multi-Racial graduates in ten largest engineering subdisciplines for Multi-Racial graduates: 2015-16
SOURCE: U.S. Department of Education, National Center for Education Statistics, Integrated Postsecondary Education Data System (IPEDS), Fall 2011 and Fall 2016, Completions component. (This table was prepared May 2018).
FIGURE 31. Number of doctoral degrees conferred to Multi-Racial graduates in ten largest engineering subdisciplines for Multi-Racial graduates: 2015-16
25
14
13
12
11
6
6
5
4
4
Bioengineering and Biomedical Engineering
Electrical Engineering
Mechanical Engineering
Materials, Metallurgical and Ceramics
Computer Engineering
Engineering, General Engineering,
Industrial Engineering
Aerospace Engineering
Civil Engineering
Chemical, Biochemical, Biomolecular
SOURCE: U.S. Department of Education, National Center for Education Statistics, Integrated Postsecondary Education Data System (IPEDS), Fall 2011 and Fall 2016, Completions component. (This table was prepared May 2018).

51
GENDER DEGREE COMPLETION PATTERNS
Although Multi-Racial students represent individuals with a variety of blended racial and cultural backgrounds, their gender dynamics are similar to other racial and ethnic groups; women earn the majority of all bachelor’s and master’s degrees, but a minority of those degrees in engineering, see figure 32. While both Multi-Racial men and women experienced drastic increases in the percentage of bachelor’s degrees conferred (274 percent and 303 percent, respectively), in 2016 the number of degrees conferred to Multi-Racial men was nearly 3 times as many as Multi-Racial women (2,435 vs. 902). At the master’s level, the increase in degrees was larger for Multi-Racial women than men, 226 percent compared to 129 percent. At the doctoral level, men experienced the largest increase, 305 percent compared to 144 percent. However, at the graduate level, the number of degrees conferred to men in 2016 was about 3 to 4 times that of women. In terms of master’s degrees, 173 degrees were conferred to Multi-Racial women in 2016 and 493 degrees were conferred to Multi-Racial men. At the doctoral level, 22 degrees were conferred to Multi-Racial women relative to the 89 degrees conferred to Multi-Racial men. As with other racial and ethnic groups, there are drastic disparities in graduate engineering degrees between Multi-Racial men and women.
FIGURE 32. Percentage distribution of bachelor's degrees and master's degrees conferred to Multi-Racial graduates, by gender and engineering status: 2015-16
40.8%
73.2%
36.9%
73.8%
59.2%
26.8%
63.1%
26.2%
All Bachelor's Degrees
Engineering Bachelor's Degrees
All Master's Degrees
Engineering Master's Degrees
-
Males Females
50.0%
SOURCE: U.S. Department of Education, National Center for Education Statistics, Integrated Postsecondary Education Data System (IPEDS), Fall 2011 and Fall 2016, Completions component. (This table was prepared May 2018).

THE 2018 STATUS REPORT ON ENGINEERING EDUCATION52
SECTION 1 SUMMARYENGINEERING OUTCOMES BY RACE AND ETHNICITY
An analysis of recent trends in conferred engineering degrees presents a mixed story of limited success and significant problems in representation and diversity. Targeted efforts to broaden participation of traditionally underrepresented groups in engineering appear to be bearing fruit. In the most recent five-year period (2010-11 and 2015-16), the change in conferred bachelor’s degrees in engineering outperformed all other major fields of study for each racial and ethnic group, (42 percent), see figure 33. Despite the significant growth among underrepresented groups in only five years, these URGs remain significantly underrepresented in engineering. Most racial and ethnic minority groups were poorly represented both in engineering schools and the engineering profession. Some instances of numerical changes along with large percentage changes are only making small shifts in the diversity of engineering graduates.
The collective representation of Hispanic, Black, American Indian and Native Hawaiian/Pacific Islander students among engineering bachelor’s degree graduates is significantly lower than their overall representation among all college students.
FIGURE 33. Five year percentage change of bachelor's degrees in engineering, by race and ethnicity: 2010-11 and 2015-16
-5%
22%30% 35% 35%
42%
79%
92%
281%
0%AIAN NHPI White Black Asian American All Hispanic Non-U.S.
ResidentMulti-Racial
SOURCE: U.S. Department of Education, National Center for Education Statistics, Integrated Postsecondary Education Data System (IPEDS), Fall 2011 and Fall 2016, Completions component. (This table was prepared May 2018).

53
Hispanic students compose 19 percent of college undergraduates but only 11 percent of all conferred bachelor’s degrees in engineering during 2015-16, a gap of eight percentage points. A similar gap exists among Black students, 13 percent of college undergraduates are Black but only 4 percent of all engineering bachelor’s degrees were conferred to Black students. Although the overall and engineering numbers for AIAN students is very small, they are also significantly underrepresented in engineering; AIAN students made up 0.8 percent of undergraduate enrollment in 2015-16 and earned only 0.3 percent of engineering bachelor’s degrees.
In addition to the continued underrepresentation of all racial and ethnic minorities with the exception of Asian Americans, women across every racial and ethnic group remain greatly underrepresented. Despite receiving the majority of all bachelor’s degrees within each racial and ethnic group, the percentage of degrees in engineering earned by women ranged from 26.8 percent among Multi-Racial graduates to 19.4 percent for White graduates. The gender disparity in 2015-16 engineering bachelor’s degrees conferred is noteworthy because of a number of reasons.
Hispanic, 10.7%
Black, 3.9%
AIAN, 0.3%
NHPI, 0.2%
White, 60.8%
Asian American, 11.3%
Non-U.S. Resident, 9.6%
Multi-Racial, 3.7%
FIGURE 34. Percentage distribution of engineering bachelor's degrees, by race and ethnicity: 2015-16
SOURCE: U.S. Department of Education, National Center for Education Statistics, Integrated Postsecondary Education Data System (IPEDS), Fall 2011 and Fall 2016, Completions component. (This table was prepared May 2018).
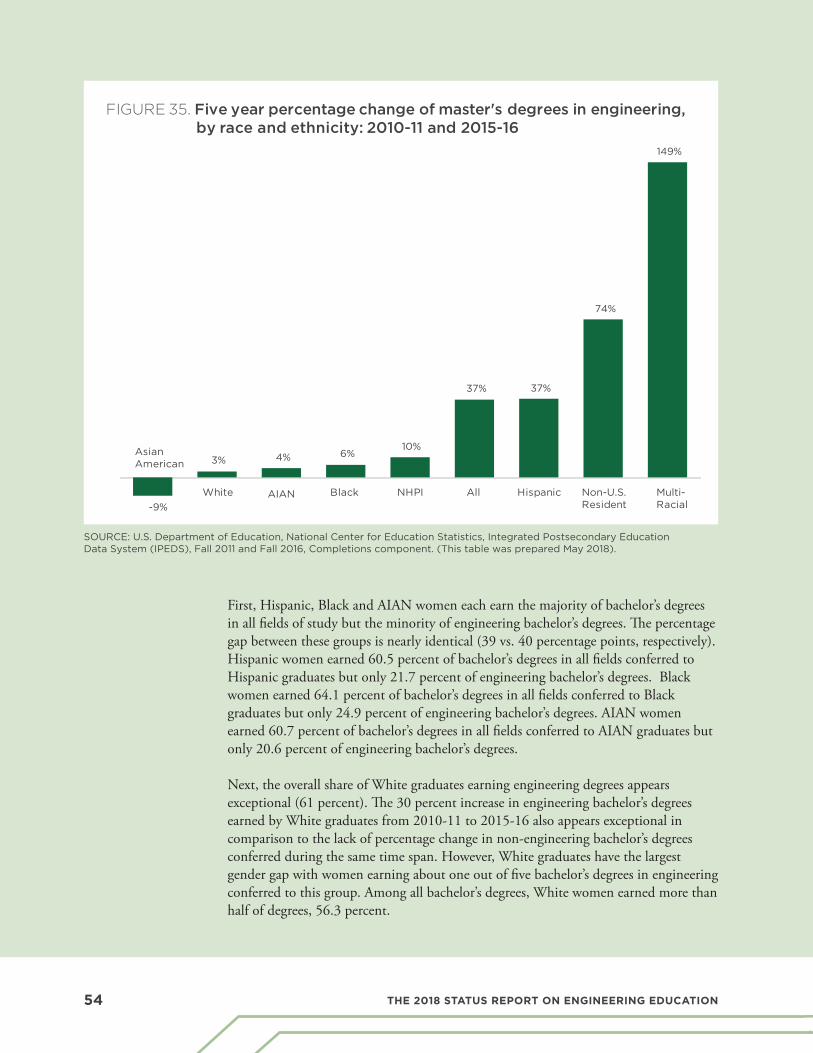
THE 2018 STATUS REPORT ON ENGINEERING EDUCATION54
First, Hispanic, Black and AIAN women each earn the majority of bachelor’s degrees in all fields of study but the minority of engineering bachelor’s degrees. The percentage gap between these groups is nearly identical (39 vs. 40 percentage points, respectively). Hispanic women earned 60.5 percent of bachelor’s degrees in all fields conferred to Hispanic graduates but only 21.7 percent of engineering bachelor’s degrees. Black women earned 64.1 percent of bachelor’s degrees in all fields conferred to Black graduates but only 24.9 percent of engineering bachelor’s degrees. AIAN women earned 60.7 percent of bachelor’s degrees in all fields conferred to AIAN graduates but only 20.6 percent of engineering bachelor’s degrees.
Next, the overall share of White graduates earning engineering degrees appears exceptional (61 percent). The 30 percent increase in engineering bachelor’s degrees earned by White graduates from 2010-11 to 2015-16 also appears exceptional in comparison to the lack of percentage change in non-engineering bachelor’s degrees conferred during the same time span. However, White graduates have the largest gender gap with women earning about one out of five bachelor’s degrees in engineering conferred to this group. Among all bachelor’s degrees, White women earned more than half of degrees, 56.3 percent.
FIGURE 35. Five year percentage change of master's degrees in engineering, by race and ethnicity: 2010-11 and 2015-16
-9%
3% 4% 6%10%
37% 37%
74%
149%
NHPIWhite Black
Asian American
All Hispanic Non-U.S.Resident
Multi-Racial
AIAN
SOURCE: U.S. Department of Education, National Center for Education Statistics, Integrated Postsecondary Education Data System (IPEDS), Fall 2011 and Fall 2016, Completions component. (This table was prepared May 2018).

55
FIGURE 36. Percentage distribution of engineering master's degrees, by race and ethnicity: 2015-16
Hispanic, 3.9%
Black, 2.2%
AIAN, 0.1%
NHPI, 0.0%
White, 27.6%
Asian American, 6.8%
Non-U.S Resident, 58.1%Multi-Racial, 1.3%
SOURCE: U.S. Department of Education, National Center for Education Statistics, Integrated Postsecondary Education Data System (IPEDS), Fall 2011 and Fall 2016, Completions component. (This table was prepared May 2018).
Due to the very low representation of women among engineering bachelor’s degree graduates, percentage growth can appear large, but the actual numerical change is small. Further research is needed to understand 1) the continued persistence of this gender disparity and 2) the impact of broadening participation efforts with a focus on closing the gender gap.
Findings at the bachelor’s degree level reveal two stories of URG growth and continued underrepresentation. However, findings at the graduate degree level reveal two distinct stories about continued low diversity (racial and ethnic and gender) and rapid growth among Non-U.S. Resident graduates. The number of master’s and doctoral degrees in engineering conferred to URGs increased from 2010-11 to 2015-16 but had little impact on the diversity of engineering graduates (6.3 percent and 4.9 percent, respectively). Moreover, Hispanic graduates only increased the number of engineering master’s degrees by 542 despite earning 5,000 more engineering bachelor’s degrees in 2015-16 vs. 2010-11. Black graduates earned nearly 1,100 more engineering bachelor’s degrees in 2015-16vs. 2010-11, but only 65 more engineering master’s degrees in 2015-16.

THE 2018 STATUS REPORT ON ENGINEERING EDUCATION56
This trend also applies to White and Asian American Graduates. White graduates earned nearly 15,000 more engineering bachelor’s degrees in 2015-16 vs. 2010-11 but only 417 more engineering master’s degrees. Despite earning nearly 3,100 more engineering bachelor’s degrees in 2015-16 vs. 2010-11, Asian American graduates earned 323 fewer engineering master’s degrees in 2015-16. Further research is needed to understand the continued low representation of most URGs at the graduate level of engineering. Clearly, the lack of diversity in graduate engineering programs is directly related to the lack of diversity in undergraduate programs. However graduate programs appear to benefit from what success is occurring at the undergraduate level in terms of student diversity.
The other notable story to emerge over the most recent five academic-years of data is the rapid growth among Non-U.S. Resident engineering master’s degree graduates (an increase of 74 percent). In 2015-16, Non-U.S. Resident graduates received a majority of engineering master’s degrees, 58 percent. The shift of this group earning the majority of master’s degrees in engineering between 2010-11 and 2015-16 occurred dramatically and over a relatively short period of time 45.6 percent vs. 58.1 percent (an increase of 12.5 percentage points). The relationship between the rapid growth of Non-U.S. Resident graduates and URGs is a critical topic for further study. In most cases, graduate engineering programs do not provide financial assistance to Non-U.S. Resident students. Therefore, these students provide important talent and revenue that
PHOTO COURTESY OF NORTH CAROLINA STATE

57
FIGURE 37. Five year percentage change of doctoral degrees in engineering,by race and ethnicity: 2010-11 and 2015-16
-29% -25%
11%21% 23% 23%
36%
52%
258%
AIAN NHPI Asian American
Non-U.SResident
All White Black Hispanic Multi-Racial
benefits engineering programs in numerous ways. However, for institutions facing funding challenges, enrolling a full-paying Non-U.S. Resident student may be more financially feasible than a URG enrollee needing financial assistance. Another factor affecting the diversity of graduate engineering programs is the labor market demands for individuals with a bachelor’s degree in engineering. As Carnevale, Smith and Melton found, there are significant financial benefits to STEM graduates both in STEM and non-STEM careers, “The growing demand for STEM talent allows and encourages the diversion of students and workers with STEM competencies.” They also noted that, “65 percent of bachelor’s degree holders in STEM earn more than master’s degree holders.” Moreover, “the earnings gaps are smaller in STEM than in other occupations, and compared with other occupations, women and minorities are better compensated in STEM.” This may lead to URG engineering bachelor’s degree graduates finding financially and professionally satisfying employment with only a bachelor’s degree.
Hidden within this larger trend of rapid growth of Non-U.S. Resident graduates in engineering is the concentration of these students in electrical and related subdisciplines. In 2015-16, Non-U.S. Resident graduates earned 78 percent of all software engineering master’s degrees, 77 percent of all electrical engineering master’s degrees, and 77 percent electrical engineering master’s degrees. Degrees in these three areas are closely linked to demand in the technology industry of the U.S. and abroad. Demand in some career tracks greatly exceeds supply, leading U.S. companies to need Non-U.S. Resident graduates.
SOURCE: U.S. Department of Education, National Center for Education Statistics, Integrated Postsecondary Education Data System (IPEDS), Fall 2011 and Fall 2016, Completions component. (This table was prepared May 2018).

THE 2018 STATUS REPORT ON ENGINEERING EDUCATION58
Similar to the bachelor’s degree level, the gender disparity at the graduate level remains a significant issue. Among U.S. residents, women earn the majority of all master’s degrees, but less than 30 percent of engineering master’s degrees. The worst disparity is among White and NHPI female graduates who earned only 21.4 and 21.7 percent of engineering master’s degrees conferred within their racial group.
Racial and ethnic diversity continues to shrink when examining conferred doctoral degrees in engineering. Only 4.9 percent of engineering doctoral degrees were earned by Hispanic and Black graduates in 2016, see Figure 38. This is after significant increases from 2010-11 to 2015-16, 52 percent among Hispanic graduates and 36 percent among Black graduates, see Figure 37. Although AIAN and NHPI graduates represent a very small number, it is extremely alarming that number of engineering doctoral degrees earned by each group declined significantly from 2011 to 2016, -29 percent for AIAN graduates and -25 percent for NHPI graduates; the only racial and ethnic groups to see a decline in doctoral degrees during this time period.
FIGURE 38. Percentage distribution of engineering doctoral degrees, by race and ethnicity: 2015-16
Hispanic, 2.8%
Black, 1.9%
AIAN, 0.1%
NHPI, 0.0%
White, 29.6%
Asian American, 6.6%
Non-U.S. Resident, 57.9%Multi-Racial, 1.1%
SOURCE: U.S. Department of Education, National Center for Education Statistics, Integrated Postsecondary Education Data System (IPEDS), Fall 2011 and Fall 2016, Completions component. (This table was prepared May 2018).

59
This section provides a detailed examination at the institutional level of undergraduate engineering
outcomes for students from underrepresented racial and ethnic groups in larger subdisciplines. In 2015-
16, 554 colleges and universities awarded at least one bachelor’s degree in an engineering subdiscipline,
according to data reported by each institution to the federal government. However, it is important to note
that the number of engineering degrees conferred at any single institution vary greatly by size of program
and number of different subdisciplines. This is due in part to the fact that some colleges and universities
have schools or colleges of engineering and some only have an engineering program or program in a
specific engineering subdiscipline. This report does not distinguish among colleges and universities by
the range of programs offered from a single department of engineering or an engineering subdiscipline
to a college or school of engineering with numerous distinct departments of engineering subdisciplines.
The average number of bachelor’s degrees in engineering conferred by these 554 schools in 2016 was
197 and the median was 81. These colleges and universities range from the largest, sixteen universities
that conferred 1,000 to 2,141 bachelor’s degrees in engineering to the smallest schools, 300 schools, that
conferred less than 100 bachelor’s degrees in engineering.
DEGREES CONFERRED TO HISPANIC GRADUATESTOP PRODUCERS OVERALL
In 2016, Hispanic Serving Institutions (HSIs) played a critical role in conferring undergraduate engineering degrees to Hispanic students. Six of the top 10 institutions in conferring bachelor’s degrees in engineering to Hispanic students were HSIs, see table 9. Two universities in Puerto Rico — University of Puerto Rico, Mayaguez and Universidad Politecnica de Puerto Rico — were top institutional producers, but the largest number of bachelor’s degrees were conferred to Hispanic students in three states with significantly larger populations and hundreds more colleges and universities—California, Texas, and Florida. The top 10 institutions awarded a quarter of all bachelor’s degrees in engineering to Hispanic students.
The four non-HSIs among the top 10 for Hispanic bachelor’s degrees in engineering are all large universities. There are also noteworthy examples of smaller engineering programs graduating a large number of Hispanic students.
Among medium size engineering programs that conferred 200 to 600 bachelor’s degrees in engineering in 2016, seven of the top 10 producers of Hispanic engineers were HSIs, led by California State University, Long Beach (166 degrees conferred), see table 10.
SECTION 2:ENGINEERING TOP PRODUCERS FOR UNDERREPRESENTED RACIAL AND ETHNIC GROUPS BY INSTITUTION

THE 2018 STATUS REPORT ON ENGINEERING EDUCATION60
Texas A&M University, Kingsville was the top producer of Hispanic bachelor’s degrees among smaller engineering programs (defined as programs that conferred fewer than 200 bachelor’s degrees in engineering to all students in 2016). The majority of the top 10 smaller programs were also HSIs (seven of 10 schools), see table 11.
Table 10. Number and percentage of bachelor’s degrees conferred in engineering to Hispanic graduates, by medium sized engineering program: 2015-16
Degrees Conferred Hispanic
Degrees Conferred
All
Pct of Degrees Conferred to
Hispanics Institution
166 576 28.8% California State University, Long Beach*
144 384 37.5% The University of Texas at San Antonio*
131 391 33.5% University of California, Riverside* °
128 505 25.3% University of Arizona* °
124 251 49.4% California State University, Los Angeles*
123 449 27.4% University of Houston*
121 524 23.1% New Jersey Institute of Technology
116 475 24.4% San Diego State University*
106 369 28.7% California State University, Northridge*
99 498 19.9% University of South Florida
Note: ° are Land-grant universities; * are Hispanic Serving Institutions; + are Historically Black Colleges and Universities.
Medium size programs awarded 200-600 bachelor’s degrees in engineering to all students.
Table 9. Number and percentage of bachelor’s degrees conferred in engineering to Hispanic graduates, by institution: 2015-16
Degrees Conferred Hispanic
Degrees Conferred
All
Pct of Degrees Conferred to
Hispanics Institution
487 515 94.6% University of Puerto Rico, Mayaguez * °
409 423 96.7% Universidad Politecnica de Puerto Rico *
307 489 62.8% Florida International University *
271 1,507 18.0% Texas A & M University, College Station °
251 971 25.8% University of Central Florida *
250 327 76.5% The University of Texas at El Paso *
215 747 28.8% California State Polytechnic University, Pomona *
210 1,090 19.3% University of Florida °
197 1,216 16.2% The University of Texas at Austin
185 233 79.4% The University of Texas Rio Grande Valley *
Note: ° are Land-grant universities; * are Hispanic Serving Institutions; + are Historically Black Colleges and Universities.
SOURCE: U.S. Department of Education, National Center for Education Statistics, Integrated Postsecondary Education Data System (IPEDS), Fall 2016, Completions component. (This table was prepared June 2018).
SOURCE: U.S. Department of Education, National Center for Education Statistics, Integrated Postsecondary Education Data System (IPEDS), Fall 2016, Completions component. (This table was prepared June 2018).

61
Table 11. Number and percentage of bachelor’s degrees conferred in engineering to Hispanic graduates, by small sized engineering program: 2015-16
Degrees Conferred Hispanic
Degrees Conferred
All
Pct of Degrees Conferred to
Hispanics Institution
96 175 54.9% Texas A & M University, Kingsville*
74 74 100.0% Universidad Del Turabo*
61 198 30.8% University of California, Merced*
54 199 27.1% University of Miami
50 179 27.9% California State University, Fresno*
49 184 26.6% New Mexico Institute of Mining and Technology*
48 48 100.0% Inter American University of Puerto Rico, Bayamon*
48 186 25.8% California State University, Chico*
38 112 33.9% Texas State University*
36 186 19.4% University of North Texas
Note: ° are Land-grant universities; * are Hispanic Serving Institutions; + are Historically Black Colleges and Universities.
Small size programs awarded fewer than 200 bachelor’s degrees in engineering to all students.
TOP PRODUCERS FOR LARGEST SUBDISCIPLINES
The following tables show the top institutions for each of the five largest engineering subdisciplines among Hispanic students in 2016.
University of Puerto Rico, Mayaguez, Universidad Politecnica de Puerto Rico, and Florida International University were the top three institutions in conferring bachelor’s degrees in mechanical engineering to Hispanic graduates in 2016, see table 12. These three institutions conferred 10 percent of all degrees to Hispanic graduates in this sub-discipline. Seven of the top 10 institutions to award the most undergraduate mechani-cal engineering degrees to Hispanic graduates were HSIs.
Universidad Politecnica de Puerto Rico and University of Puerto Rico, Mayaguez were the top two institutions in conferring bachelor’s degrees in civil engineering to Hispanics in 2016, see table 13. These two institutions conferred 9.3 percent of all degrees to Hispanics in this subdiscipline. Nearly all the top 10 institutions conferring undergraduate degrees to Hispanic/Hispanic students in civil engineering were HSIs. Despite the more than 500 colleges and universities awarding bachelor’s degrees in en-gineering, these 10 schools awarded 30 percent of all civil engineering degrees earned by Hispanic students.
SOURCE: U.S. Department of Education, National Center for Education Statistics, Integrated Postsecondary Education Data System (IPEDS), Fall 2016, Completions component. (This table was prepared June 2018).

THE 2018 STATUS REPORT ON ENGINEERING EDUCATION62
Each of the top five institutions conferring undergraduate electrical engineering degrees to Hispanic/Hispanic graduates were HSIs, see table 14. Similar to civil engineering, Universidad Politecnica de Puerto Rico and University of Puerto Rico, Mayaguez were the top two institutions in conferring bachelor’s degrees in electrical engineering to Hispanics in 2016. These two institutions conferred 9.4 percent of all degrees to Hispanics in this subdiscipline. The entire top 10 schools combined, awarded nearly one-third of all civil engineering degrees earned by Hispanic students (32 percent).
Table 12. Number of bachelor’s degrees conferred in MECHANICAL ENGINEERING to Hispanic graduates, by institution: 2015-16
Degrees Conferred Institution
126 University of Puerto Rico, Mayaguez * °
103 Universidad Politecnica de Puerto Rico *
88 Florida International University *
87 The University of Texas at El Paso *
84 University of Central Florida*
65 The University of Texas Rio Grande Valley *
63 The University of Texas at San Antonio *
58 California State University, Long Beach *
56 The University of Texas at Austin
52 University of Florida °
Note: ° are Land-grant universities; * are Hispanic Serving Institutions, + Historically Black Colleges and Universities.
Table 13. Number of bachelor’s degrees conferred in CIVIL ENGINEERING to Hispanic graduates, by institution: 2015-16
Degrees Conferred Institution
90 Universidad Politecnica de Puerto Rico *
76 University of Puerto Rico, Mayaguez * °
59 California State University, Los Angeles *
57 California State Polytechnic University, Pomona *
54 The University of Texas at El Paso *
51 Florida International University *
39 San Diego State University *
38 New Jersey Institute of Technology
37 San Jose State University *
36 Texas A & M University, College Station °
Note: ° are Land-grant universities; * are Hispanic Serving Institutions;+ are Historically Black Colleges and Universities.
SOURCE: U.S. Department of Education, National Center for Education Statistics, Integrated Postsecondary Education Data System (IPEDS), Fall 2011 and Fall 2016, Completions component. (This table was prepared May 2018).
SOURCE: U.S. Department of Education, National Center for Education Statistics, Integrated Postsecondary Education Data System (IPEDS), Fall 2011 and Fall 2016, Completions component. (This table was prepared May 2018).

63
Table 14. Number of bachelor’s degrees conferred in ELECTRICAL ENGINEERING to Hispanic graduates, by institution: 2015-16
Degrees Conferred Institution
86 Universidad Politecnica de Puerto Rico *
79 University of Puerto Rico, Mayaguez * °
75 Florida International University *
62 The University of Texas at El Paso *
49 California State Polytechnic University, Pomona *
41 University of Central Florida *
37 The University of Texas at San Antonio *
35 Texas A & M University, College Station °
34 Southern California Institute of Technology
33 Arizona State University, Tempe
33 The University of Texas at Austin
Note: ° are Land-grant universities; * are Hispanic Serving Institutions; + are Historically Black Colleges and Universities.
Table 15. Number of bachelor’s degrees conferred in CHEMICAL, BIOCHEMICAL, BIOMOLECULAR ENGINEERING to Hispanic graduates, by institution: 2015-16
Degrees Conferred Institution
84 University of Puerto Rico, Mayaguez * °
30 Arizona State University, Tempe
30 University of California, San Diego
29 University of California, Riverside * °
28 Universidad Politecnica de Puerto Rico *
27 University of Florida °
23 University of Arizona* °
21 University of California, Davis °
20 The University of Texas at Austin
19 Florida State University
19 Texas A & M University, Kingsville *
17 Texas A & M University, College Station °
Note: ° are Land-grant universities; * are Hispanic Serving Institutions; + are Historically Black Colleges and Universities.
University of Puerto Rico, Mayaguez conferred more than 9 percent of all bachelor’s degrees in chemical, biochemical, and biomolecular engineering to Hispanics in 2016, see table 15. These two institutions conferred 12.3 percent of all degrees to Hispanics in this subdiscipline. The top 10 schools in table 15 awarded 38 percent of all chemical, biochemical, and biomolecular engineering degrees earned by Hispanic students.
SOURCE: U.S. Department of Education, National Center for Education Statistics, Integrated Postsecondary Education Data System (IPEDS), Fall 2011 and Fall 2016, Completions component. (This table was prepared May 2018).
SOURCE: U.S. Department of Education, National Center for Education Statistics, Integrated Postsecondary Education Data System (IPEDS), Fall 2011 and Fall 2016, Completions component. (This table was prepared May 2018.).

THE 2018 STATUS REPORT ON ENGINEERING EDUCATION64
Seven of the top 10 institutions to award the most undergraduate degrees in Com-puter Engineering to Hispanic/Hispanic students were HSIs, see table 16. Similar to mechanical engineering, University of Puerto Rico, Mayaguez, Universidad Politecnica de Puerto Rico, and Florida International University were the top three institutions in conferring bachelor’s degrees in computer engineering to Hispanics in 2016. This sub-discipline was the most concentrated at the top 10 schools, 39 percent of all computer engineering degrees earned by Hispanic students.
Table 16. Number of bachelor’s degrees conferred in COMPUTER ENGINEERING to Hispanic graduates, by institution: 2015-16
Degrees Conferred Institution
55 University of Puerto Rico, Mayaguez * °
45 Universidad Politecnica de Puerto Rico *
40 Florida International University *
24 The University of Texas Rio Grande Valley *
24 University of Central Florida*
20 University of Florida °
19 California State University, Long Beach *
17 Texas A & M University, College Station °
16 Florida Atlantic University *
13 University of California, Santa Cruz *
12 University of South Florida
Note: ° are Land-grant universities; * are Hispanic Serving Institutions; + are Historically Black Colleges and Universities.
PHOTO COURTESY OF THE UNIVERSITY OF CALIFORNIA, MERCED
SOURCE: U.S. Department of Education, National Center for Education Statistics, Integrated Postsecondary Education Data System (IPEDS), Fall 2011 and Fall 2016, Completions component. (This table was prepared May 2018).

65
DEGREES CONFERRED TO BLACK GRADUATESTOP PRODUCERS OVERALL
In 2016, Historically Black Colleges and Universities (HBCUs) were well represented amongst institutions that conferred the most undergraduate degrees to Black graduates, see table 17. North Carolina A&T is among the list of top producers for all categories examined. Although the noted HBCUs are generally smaller than the other institutions included in the list of top producers, their contributions are prevalent in regard to the overall production of degrees to Black graduates as well as degree production within specific engineering subdisciplines. HBCUs made up four of the top five institutions that conferred the most undergraduate engineering degrees to Black graduates. These four institutions conferred approximately one-tenth of all undergraduate engineering degrees conferred to Black students in 2016.
Table 17. Number and percentage of bachelor’s degrees conferred in engineering to Black graduates, by institution: 2015-16
Degrees Conferred
Blacks
Degrees Conferred
All
Pct of Degrees Conferred to
Blacks Institution
153 228 67.1% North Carolina A & T State University + °
124 2,141 5.8% Georgia Institute of Technology
87 153 56.9% Prairie View A & M University + °
82 107 76.6% Morgan State University +
75 83 90.4% Tuskegee University + °
69 971 7.1% University of Central Florida *
64 1,504 4.3% North Carolina State University at Raleigh °
57 1,010 5.6% University of Maryland, College Park °
53 306 17.3% Kennesaw State University
50 683 7.3% The University of Alabama
Note: ° are Land-grant universities; * are Hispanic Serving Institutions; + are Historically Black Colleges and Universities.
SOURCE: U.S. Department of Education, National Center for Education Statistics, Integrated Postsecondary Education Data System (IPEDS), Fall 2011 and Fall 2016, Completions component. (This table was prepared May 2018).
Among medium-sized engineering programs, the top 10 producers for Black students were primarily in the South, led by Georgia Southern University with 43 bachelor’s degrees conferred to Black students in 2016, see table 18.
The top producers among the smaller size engineering programs were mostly HBCUs, led by Howard University (47 degrees conferred) and Florida Agricultural and Mechanical University (44 degrees conferred), see table 19. Each of these HBCUs conferred more degrees than the top producer among medium size programs. Seven of the top 10 producers among small programs are HBCUs.

THE 2018 STATUS REPORT ON ENGINEERING EDUCATION66
Table 18. Number and percentage of bachelor’s degrees conferred in engineering to Black graduates, by medium sized engineering program: 2015-16
Degrees Conferred
Blacks
Degrees Conferred
All
Pct of Degrees Conferred to
Blacks Institution
43 230 18.7% Georgia Southern University
37 250 14.8% Florida Atlantic University *
38 313 12.1% Old Dominion University
44 499 8.8% Mississippi State University °
36 348 10.3% CUNY City College*
39 489 8.0% Florida International University*
38 476 8.0% The University of Tennessee, Knoxville °
34 524 6.5% New Jersey Institute of Technology
23 249 9.2% University of Louisiana at Lafayette
32 485 6.6% Massachusetts Institute of Technology °
Note: ° are Land-grant universities; * are Hispanic Serving Institutions; + are Historically Black Colleges and Universities.
Medium size programs awarded 200-600 bachelor’s degrees in engineering to all students.
Table 19. Number and percentage of bachelor’s degrees conferred in engineering to Black graduates, by small sized engineering program: 2015-16
Degrees Conferred
Blacks
Degrees Conferred
All
Pct of Degrees Conferred to
Blacks Institution
47 58 81.0% Howard University+
44 50 88.0% Florida Agricultural and Mechanical University+ °
35 38 92.1% Alabama A & M University+ °
33 36 91.7% Southern University and A & M College+ °
26 31 83.9% Virginia State University+ °
25 35 71.4% Jackson State University+
19 187 10.2% Southern Illinois University, Carbondale
18 133 13.5% University of Alabama at Birmingham
18 186 9.7% University of North Texas
17 37 45.9% Tennessee State University+ °
Note: ° are Land-grant universities; * are Hispanic Serving Institutions; + are Historically Black Colleges and Universities.
Small size programs awarded fewer than 200 bachelor’s degrees in engineering to all students.
PHOTO COURTESY OF THE UNIVERSITY OF KANSAS
SOURCE: U.S. Department of Education, National Center for Education Statistics, Integrated Postsecondary Education Data System (IPEDS), Fall 2011 and Fall 2016, Completions component. (This table was prepared May 2018).
SOURCE: U.S. Department of Education, National Center for Education Statistics, Integrated Postsecondary Education Data System (IPEDS), Fall 2011 and Fall 2016, Completions component. (This table was prepared May 2018).

67
TOP PRODUCERS FOR LARGEST SUBDISCIPLINES
The following tables show the top institutions for each of the five largest engineering subdisciplines among Black students in 2016.
North Carolina A&T State University, Prairie View A&M University, and Tuskegee University were the top three institutions in conferring bachelor’s degrees in mechanical engineering to Black students in 2016, see Table 20. These three institutions conferred 10 percent of all degrees to Black students in this subdiscipline. The top 10 schools awarded a quarter of all mechanical engineering degrees earned by Black students.
Table 20. Number of bachelor’s degrees conferred in MECHANICAL ENGINEERING to Black graduates, by institution: 2015-16
Degrees Conferred Institution
32 North Carolina A & T State University + °
30 Prairie View A & M University + °
28 Tuskegee University + °
25 Kennesaw State University
23 University of Central Florida *
22 Georgia Institute of Technology
18 Georgia Southern University
17 Massachusetts Institute of Technology °
17 University of Maryland, College Park °
16 Old Dominion University
Note: ° are Land-grant universities; * are Hispanic Serving Institutions; + are Historically Black Colleges and Universities.
Table 21. Number of bachelor’s degrees conferred in ELECTRICAL ENGINEERING to Black graduates, by institution: 2015-16
Degrees Conferred Institution
48 Morgan State University +
22 Georgia Institute of Technology
19 Georgia Southern University
18 North Carolina A & T State University + °
18 Tuskegee University + °
17 Prairie View A & M University + °
17 Alabama A & M University + °
15 Kennesaw State University
12 University of Minnesota, Twin Cities
12 Ohio State University °
12 University of Central Florida *
Note: ° are Land-grant universities; * are Hispanic Serving Institutions; + are Historically Black Colleges and Universities.
SOURCE: U.S. Department of Education, National Center for Education Statistics, Integrated Postsecondary Education Data System (IPEDS), Fall 2011 and Fall 2016, Completions component. (This table was prepared May 2018).
SOURCE: U.S. Department of Education, National Center for Education Statistics, Integrated Postsecondary Education Data System (IPEDS), Fall 2011 and Fall 2016, Completions component. (This table was prepared May 2018).

THE 2018 STATUS REPORT ON ENGINEERING EDUCATION68
The number of electrical engineering degrees conferred at Morgan State University was more than twice the number at the second leading school, see table 21. Similar to me-chanical engineering, the top 11 schools awarded a quarter of all electrical engineering degrees earned by Black students.
Four of the top five institutions conferring the most undergraduate civil engineering degrees to Black students were HBCUs, see table 22. North Carolina A&T State University and Morgan State University were the top two institutions in conferring bachelor’s degrees in civil engineering to Black students in 2016. The top 10 schools awarded 26 percent of all civil engineering degrees earned by Black students.
Each of the top four institutions conferring the most undergraduate chemical, bio-chemical, biomolecular engineering degrees to Black students were HBCUs, see table 23. These four institutions conferred nearly one-fifth of all undergraduate degreesBlack graduates earned in those subdisciplines. All of the top nine schools awarded 30percent of all chemical, biochemical, biomolecular engineering degrees earned by Blackstudents1.
Virginia State University was the top producer of Black computer engineering graduates (23) conferring 6.9 percent of all degrees to Black students in this subdiscipline, see table 24. All of the top eight schools awarded 28 percent of all computer engineering degrees earned by Black students2.
Table 22. Number of bachelor’s degrees conferred in CIVIL ENGINEERING to Black graduates, by institution: 2015-16
Degrees Conferred Institution
23 North Carolina A & T State University + °
22 Morgan State University +
13 Jackson State University +
12 Howard University +
12 University of Maryland, College Park °
12 Florida Atlantic University *
11 Georgia Institute of Technology
10 The University of Alabama
10 Mississippi State University °
9 Florida Agricultural and Mechanical University + °
Note: LGU are Land-grant universities; * are Hispanic Serving Institutions; + are Historically Black Colleges and Universities.
SOURCE: U.S. Department of Education, National Center for Education Statistics, Integrated Postsecondary Education Data System (IPEDS), Fall 2011 and Fall 2016, Completions component. (This table was prepared May 2018).

69
Table 24. Number of bachelor’s degrees conferred in COMPUTER ENGINEERING to Black graduates, by institution: 2015-16
Degrees Conferred Institution
23 Virginia State University + °
13 Georgia Institute of Technology
12 Jackson State University +
12 University of Central Florida *
10 North Carolina A & T State University + °
9 University of Maryland, Baltimore County
8 Benedict College +
7 Florida Atlantic University *
Note: LGU are Land-grant universities; * are Hispanic Serving Institutions; + are Historically Black Colleges and Universities.
Table 23. Number of bachelor’s degrees conferred in CHEMICAL, BIOCHEMICAL, AND BIOMOLECULAR ENGINEERING to Black graduates, by institution: 2015-16
Degrees Conferred Institution
29 Prairie View A & M University + °
14 North Carolina A & T State University + °
13 Tuskegee University + °
11 Howard University +
8 New Jersey Institute of Technology
8 Georgia Institute of Technology
8 The University of Alabama
7 Hampton University +
7 Carnegie Mellon University
6 Florida State University
6 University of Michigan, Ann Arbor
6 Florida Agricultural and Mechanical University + °
6 CUNY City College *
Note: ° are Land-grant universities; * are Hispanic Serving Institutions;+ are Historically Black Colleges and Universities.
SOURCE: U.S. Department of Education, National Center for Education Statistics, Integrated Postsecondary Education Data System (IPEDS), Fall 2011 and Fall 2016, Completions component. (This table was prepared May 2018).
SOURCE: U.S. Department of Education, National Center for Education Statistics, Integrated Postsecondary Education Data System (IPEDS), Fall 2011 and Fall 2016, Completions component. (This table was prepared May 2018).

THE 2018 STATUS REPORT ON ENGINEERING EDUCATION70
PHOTO COURTESY OF THE NORTH CAROLINA STATE UNIVERSITY

71
DEGREES CONFERRED TO AMERICAN INDIAN/ALASKA NATIVE GRADUATESTOP PRODUCERS OVERALL
In 2016, the 306 bachelor’s degrees earned by American Indian/Alaska Native (AIAN) graduates were heavily concentrated at colleges and universities in the West and Southwest of the United States, see table 253. The two public universities in Oklaho-ma — Oklahoma State University and University of Oklahoma, Norman campus — were ranked first and second in conferring the largest number of AIAN undergraduate engineering degrees across all disciplines, (16 and 12 respectively). The United States Coast Guard Academy, located in Connecticut, is the only top five institution confer-ring bachelor’s degrees to AIANs not located in the West or Southwest United States. Compared to other racial and ethnic groups AIAN engineering bachelor’s degree earn-ers are among the most concentrated at a few institutions, earning 27 percent of their engineering degrees from only nine universities.
Table 25. Number and percentage of bachelor’s degrees conferred in engineering to American Indian/Alaska Native graduates, by institution: 2015-16
Degrees Conferred American
Indians
Degrees Conferred
All
Pct of Degrees Conferred
to American Indians Institution
16 407 3.9% Oklahoma State University °
12 544 2.2% University of Oklahoma, Norman Campus
10 267 3.7% University of New Mexico*
9 69 13.0% United States Coast Guard Academy
9 1,115 0.8% Arizona State University, Tempe
7 237 3.0% Northern Arizona University
7 282 2.5% New Mexico State University* °
6 184 3.3% New Mexico Institute of Mining and Technology*
6 202 3.0% Arizona State University, Polytechnic
Note: ° are Land-grant universities; * are Hispanic Serving Institutions; + are Historically Black Colleges and Universities.
SOURCE: U.S. Department of Education, National Center for Education Statistics, Integrated Postsecondary Education Data System (IPEDS), Fall 2011 and Fall 2016, Completions component. (This table was prepared May 2018).

THE 2018 STATUS REPORT ON ENGINEERING EDUCATION72
TOP PRODUCERS FOR LARGEST SUBDISCIPLINES
The following tables show the top institutions for each of the five largest engineering subdisciplines among AIAN students in 2016.
Oklahoma State University conferred the largest number of AIAN undergraduate degrees in mechanical engineering (8 degrees), see table 26. The top seven schools awarded 29 percent of all mechanical engineering degrees earned by AIAN students.
Table 26. Number of bachelor’s degrees conferred in MECHANICAL ENGINEERING to American Indian/Alaska Native graduates, by ten institution: 2015-16
Degrees Conferred Institution
8 Oklahoma State University °
4 Arizona State University, Tempe
3 New Mexico State University* °
3 Northern Arizona University
3 New Mexico Institute of Mining and Technology*
3 University of New Mexico*
3 United States Coast Guard AcademyNote: ° are Land-grant universities; * are Hispanic Serving Institutions; + are Historically Black Colleges and Universities.
Only 10 universities across the country conferred more than one bachelor’s degree in civil engineering to AIAN graduates with the United States Coast Guard Academy leading the group with four degrees, see table 27. The top 10 schools awarded nearly half of all civil engineering degrees earned by AIAN students, 46 percent.
Only three universities across the country conferred more than one bachelor’s degree in electrical engineering to AIAN graduates, see table 28.
Only three universities across the country conferred more than one bachelor’s degree in chemical, biochemical, biomolecular engineering to AIAN graduates with University of Oklahoma leading the group with five degrees conferred, see table 29. The top three schools awarded 41 percent of all civil engineering degrees earned by AIAN students.
Only five universities across the country conferred more than one bachelor’s degree in engineering, general engineering, engineering physics, engineering Science to AIAN graduates. The five leading producers of AIAN bachelor’s degrees in this subdiscipline, led by Arizona State University, conferred 64 percent of all degrees conferred in 2016, see table 30. This engineering subdiscipline has the largest share of AIAN bachelor’s degree earners within a small number of schools. The top five schools awarded nearly two out of three of all engineering, general engineering, engineering physics, and engi-neering science degrees earned by AIAN students.
SOURCE: U.S. Department of Education, National Center for Education Statistics, Integrated Postsecondary Education Data System (IPEDS), Fall 2011 and Fall 2016, Completions component. (This table was prepared May 2018).

73
Table 28. Number of bachelor’s degrees conferred in ELECTRICAL ENGINEERING to American Indian/Alaska Native graduates, by institution: 2015-16
Degrees Conferred Institution
2 University of New Mexico*
2 The University of Texas at Austin
2 New Mexico State University* °
Note: ° are Land-grant universities; * are Hispanic Serving Institutions; + are Historically Black Colleges and Universities.
Table 27. Number of bachelor’s degrees conferred in CIVIL ENGINEERING to American Indian/Alaska Native graduates, by institution: 2015-16
Degrees Conferred Institution
4 United States Coast Guard Academy
3 North Dakota State University °
3 University of New Mexico*
2 Arizona State University, Tempe
2 Auburn University °
2 University of Virginia
2 Northern Arizona University
2 New Mexico State University* °
2 California State University, Sacramento*
2 New Mexico Institute of Mining and Technology*
Note: ° are Land-grant universities; * are Hispanic Serving Institutions; + are Historically Black Colleges and Universities.
Table 29. Number of bachelor’s degrees conferred in CHEMICAL, BIOCHEMICAL, AND BIOMOLECULAR ENGINEERING to American Indian/Alaska Native graduates, by institution: 2015-16
Degrees Conferred Institution
5 University of Oklahoma, Norman Campus
4 Oklahoma State University °
2 Mississippi State University °
Note: ° are Land-grant universities; * are Hispanic Serving Institutions; + are Historically Black Colleges and Universities.
Table 30. Number of bachelor’s degrees conferred in ENGINEERING, GENERAL ENGINEERING, ENGINEERING PHYSICS, AND ENGINEERING SCIENCE to American Indian/Alaska Native graduates, by institution: 2015-16
Degrees Conferred Institution
6 Arizona State University, Polytechnic
3 Fort Lewis College
3 Dartmouth College
2 University of New Mexico*
2 University of Arizona* °
Note: ° are Land-grant universities; * are Hispanic Serving Institutions; + are Historically Black Colleges and Universities.
SOURCE: U.S. Department of Education, National Center for Education Statistics, Integrated Postsecondary Education Data System (IPEDS), Fall 2011 and Fall 2016, Completions component. (This table was prepared May 2018).
SOURCE: U.S. Department of Education, National Center for Education Statistics, Integrated Postsecondary Education Data System (IPEDS), Fall 2011 and Fall 2016, Completions component. (This table was prepared May 2018).
SOURCE: U.S. Department of Education, National Center for Education Statistics, Integrated Postsecondary Education Data System (IPEDS), Fall 2011 and Fall 2016, Completions component. (This table was prepared May 2018).
SOURCE: U.S. Department of Education, National Center for Education Statistics, Integrated Postsecondary Education Data System (IPEDS), Fall 2011 and Fall 2016, Completions component. (This table was prepared May 2018).

THE 2018 STATUS REPORT ON ENGINEERING EDUCATION74
DEGREES CONFERRED TO NATIVE HAWAIIAN/ PACIFIC ISLANDER GRADUATESTOP PRODUCERS OVERALL
Among Native Hawaiian/ Pacific Islander (NHPI) graduates, institutions within the University of California system are well represented amongst the list of top produc-ers in 2016. The University of California, Davis conferred the most undergraduate engineering degrees to NHPI graduates (10 degrees). Other UC schools amongst top producers include University of California, San Diego and University of California, Irvine, which all contributed to California leading the nation in conferring bachelor’s degrees in engineering to NHPI students (53 degrees), see table 31.
Table 31. Number and percentage of bachelor’s degrees conferred in engineering to Native Hawaiian/Pacific Islander graduates, by institution: 2015-16
Degrees Conferred Native Hawaiian/ Pacific
Islander
Degrees Conferred
All
Pct of Degrees Conferred to
Native Hawaiian/ Pacific Islander Institution
10 858 1.2% University of California, Davis °
6 250 2.4% University of Hawaii at Manoa °
4 106 3.8% Virginia Military Institute
4 1,061 0.4% University of California, San Diego
4 715 0.6% University of California, Irvine*
3 466 0.6% Brigham Young University, Provo
3 1,242 0.2% California Polytechnic State University, San Luis Obispo
3 1,315 0.2% Iowa State University °
3 407 0.7% Milwaukee School of Engineering
3 313 1.0% Old Dominion University
3 475 0.6% San Diego State University*
3 225 1.3% Santa Clara University
3 248 1.2% Temple University
3 683 0.4% The University of Alabama
3 429 0.7% United States Naval Academy
3 488 0.6% University of Illinois at Chicago*
Note: ° are Land-grant universities; * are Hispanic Serving Institutions; + are Historically Black Colleges and Universities.
SOURCE: U.S. Department of Education, National Center for Education Statistics, Integrated Postsecondary Education Data System (IPEDS), Fall 2011 and Fall 2016, Completions component. (This table was prepared May 2018).

75
TOP PRODUCERS FOR LARGEST SUBDISCIPLINES
The following tables show the top institutions for each of the three largest engineering subdisciplines among NHPI students in 2016.
Only four schools, all on the West Coast, conferred more than one bachelor’s degree to NHPI students in mechanical engineering in 2016, see table 32.
Table 32. Number of bachelor’s degrees conferred in MECHANICAL ENGINEERING to Native Hawaiian/Pacific Islander graduates, by institution: 2015-16
Degrees Conferred Institution
2 Oregon Institute of Technology
2 Seattle University
2 University of San Diego
2 University of California, Davis °
Note: LGU are Land-grant universities; * are Hispanic Serving Institutions; + are Historically Black Colleges and Universities.
Table 33. Number of bachelor’s degrees conferred in CIVIL ENGINEERING to Native Hawaiian/Pacific Islander graduates, by institution: 2015-16
Degrees Conferred Institution
4 University of Hawaii at Manoa °
2 Brigham Young University, Provo
2 Virginia Military Institute
2 Santa Clara University
2 Iowa State University °
2 University of California, San Diego
2 University of California, Davis °
Note: ° are Land-grant universities; * are Hispanic Serving Institutions; + are Historically Black Colleges and Universities.
SOURCE: U.S. Department of Education, National Center for Education Statistics, Integrated Postsecondary Education Data System (IPEDS), Fall 2011 and Fall 2016, Completions component. (This table was prepared May 2018).
SOURCE: U.S. Department of Education, National Center for Education Statistics, Integrated Postsecondary Education Data System (IPEDS), Fall 2011 and Fall 2016, Completions component. (This table was prepared May 2018).
The University of Hawaii at Manoa conferred the most bachelor’s degrees in civil engineering to NHPI graduates (four degrees) which was 12.5 percent of all degrees conferred to NHPI students in this subdiscipline, see table 33. Only seven schools conferred more than one bachelor’s degree to NHPI students in civil engineering in 2016. The top seven schools awarded half of all civil engineering degrees earned by NHPI students.

THE 2018 STATUS REPORT ON ENGINEERING EDUCATION76
Only three universities awarded more than one bachelor’s degree in electrical engineer-ing to a Native Hawaiian/Pacific Islander Student, see table 34.
Table 34. Number of bachelor’s degrees conferred in ELECTRICAL ENGINEERING to Native Hawaiian/Pacific Islander graduates, by institution: 2015-16
Degrees Conferred Institution
2 University of Illinois at Chicago*
2 University of Washington, Bothell Campus
2 Old Dominion University
Note: ° are Land-grant universities; * are Hispanic Serving Institutions; + are Historically Black Colleges and Universities.
PHOTO COURTESY OF STONY BROOK UNIVERSITY
SOURCE: U.S. Department of Education, National Center for Education Statistics, Integrated Postsecondary Education Data System (IPEDS), Fall 2011 and Fall 2016, Completions component. (This table was prepared May 2018).

77
DEGREES CONFERRED TO MULTI-RACIAL GRADUATESTOP PRODUCERS OVERALL
In 2016, half of the top ten institutions in conferring undergraduate engineering awards to Multi-Racial students were on the West Coast and Hawaii and half located in the Midwest and South. California Polytechnic State University, San Luis Obispo awarded the most undergraduate engineering awards to Multi-Racial graduates (94 degrees), see table 35.
Table 35. Number and percentage of bachelor’s degrees conferred in engineering to Multi-racial graduates, by institution: 2015-16
Degrees Conferred
Multi-racial
Degrees Conferred
All
Pct of Degrees Conferred to Multi-racial Institution
94 1,242 7.6% California Polytechnic State University, San Luis Obispo
74 250 29.6% University of Hawaii at Manoa °
65 2,141 3.0% Georgia Institute of Technology
60 1,408 4.3% Virginia Polytechnic Institute and State University °
56 1,061 5.3% University of California, San Diego
51 783 6.5% University of Washington, Seattle Campus
49 858 5.7% University of California, Davis °
47 1,659 2.8% University of Illinois at Urbana, Champaign °
46 1,115 4.1% Arizona State University, Tempe
46 1,500 3.1% Ohio State University °
Note: ° are Land-grant universities; * are Hispanic Serving Institutions; + are Historically Black Colleges and Universities.
SOURCE: U.S. Department of Education, National Center for Education Statistics, Integrated Postsecondary Education Data System (IPEDS), Fall 2011 and Fall 2016, Completions component. (This table was prepared May 2018).
There are also noteworthy examples of smaller engineering programs graduating many Multi-Racial students.
Seven of the top ten medium-sized engineering programs graduating Multi-Racial students are located on the West Coast and Hawaii, see table 36.

THE 2018 STATUS REPORT ON ENGINEERING EDUCATION78
Table 36. Number and percentage of bachelor’s degrees conferred in engineering to Multi-racial graduates, by medium sized engineering program: 2015-16
Degrees Conferred
Multi-racial
Degrees Conferred
All
Pct of Degrees Conferred to Multi-racial Institution
74 250 29.6% University of Hawaii at Manoa °
46 360 12.8% Stanford University
41 544 7.5% University of Oklahoma, Norman Campus
35 598 5.9% Washington State University °
32 533 6.0% University of California, Los Angeles
30 429 7.0% United States Naval Academy
28 407 6.9% Oklahoma State University °
26 391 6.6% University of California, Riverside* °
25 475 5.3% San Diego State University*
24 555 4.3% University of Southern California
Note: ° are Land-grant universities; * are Hispanic Serving Institutions; + are Historically Black Colleges and Universities.
Medium size programs awarded 200-600 bachelor’s degrees in engineering to all students.
Table 37. Number and percentage of bachelor’s degrees conferred in engineering to Multi-racial graduates, by small sized engineering program: 2015-16
Degrees Conferred
Multi-racial
Degrees Conferred
All
Pct of Degrees Conferred to Multi-racial Institution
25 186 13.4% University of North Texas
14 198 7.1% University of California, Merced*
11 142 7.7% The University of Tennessee, Chattanooga °
10 179 5.6% California State University, Fresno*
10 104 9.6% Seattle University
10 92 10.9% Cooper Union for the Advancement of Science and Art
9 175 5.1% Tufts University
9 113 8.0% Yale University
9 96 9.4% The University of Texas at Tyler
9 91 9.9% James Madison University
Note: ° are Land-grant universities; * are Hispanic Serving Institutions; + are Historically Black Colleges and Universities.
Small size programs awarded fewer than 200 bachelor’s degrees in engineering to all students.
SOURCE: U.S. Department of Education, National Center for Education Statistics, Integrated Postsecondary Education Data System (IPEDS), Fall 2011 and Fall 2016, Completions component. (This table was prepared May 2018).
Smaller engineering programs with the most Multi-Racial graduates are more disperse across the U.S. with universities in Texas, California and Tennessee rounding out the top three, see table 37.
SOURCE: U.S. Department of Education, National Center for Education Statistics, Integrated Postsecondary Education Data System (IPEDS), Fall 2011 and Fall 2016, Completions component. (This table was prepared May 2018).

79
TOP PRODUCERS FOR LARGEST SUBDISCIPLINES
The following tables show the top institutions for each of the three largest engineering subdisciplines among Multi-Racial students in 2016.
The University of Hawaii at Mānoa was the top university for awarding bachelor’s degrees in mechanical engineering to Multi-Racial students, 28 degrees, see table 38. The twelve top institutions are spread across the U.S.
The University of California, Berkeley and the University of Hawaii at Mānoa were the top two institutions in conferring bachelor’s degrees in electrical engineering to Multi-Racial students in 2016, see table 39. These two schools awarded 7.1 percent of all degrees to Multi-Racial students in this subdiscipline.
The two schools that conferred the most bachelor’s degrees in civil engineering to Multi-Racial students (University of Hawaii at Mānoa and University of Washington, Seattle Campus) conferred nearly 10 percent of degrees in this subdiscipline, see table 40.
University of California System institutions made up three of the top four spots on the list of top producers of chemical, biochemical, biomolecular engineering bachelor’s degrees to Multi-Racial students (UC, San Diego, UC, Davis and UC, Riverside). The top 11 schools awarded 29 percent of all chemical, biochemical, biomolecular engi-neering degrees earned by Multi-Racial students, see table 41.
Table 38. Number of bachelor’s degrees conferred in MECHANICAL ENGINEERING to Multi-racial graduates, by institution: 2015-16
Degrees Conferred Institution
28 University of Hawaii at Manoa °
17 California Polytechnic State University, San Luis Obispo
17 University of California, Davis °
16 Washington State University °
16 Virginia Polytechnic Institute and State University °
14 Georgia Institute of Technology
13 Stanford University
13 University of Maryland, College Park °
12 Texas Tech University*
12 Arizona State University, Tempe
12 University of North Texas
12 The University of Texas at Austin
Note: ° are Land-grant universities; * are Hispanic Serving Institutions;+ are Historically Black Colleges and Universities.
SOURCE: U.S. Department of Education, National Center for Education Statistics, Integrated Postsecondary Education Data System (IPEDS), Fall 2011 and Fall 2016, Completions component. (This table was prepared May 2018).

THE 2018 STATUS REPORT ON ENGINEERING EDUCATION80
Table 39. Number of bachelor’s degrees conferred in ELECTRICAL ENGINEERING to Multi-racial graduates, by institution: 2015-16
Degrees Conferred Institution
17 University of California, Berkeley
15 University of Hawaii at Manoa °
10 University of California, San Diego
10 Georgia Institute of Technology
9 California Polytechnic State University, San Luis Obispo
8 University of Maryland, College Park °
8 Pennsylvania State University °
8 Texas A & M University, College Station °
7 Ohio State University °
7 Rutgers University, New Brunswick °
Note: ° are Land-grant universities; * are Hispanic Serving Institutions;+ are Historically Black Colleges and Universities.
Table 40. Number of bachelor’s degrees conferred in CIVIL ENGINEERING to Multi-racial graduates,by institution: 2015-16
Degrees Conferred Institution
24 University of Hawaii at Manoa °
11 University of Washington, Seattle Campus
8 Washington State University °
7 The University of Texas at Austin
7 California Polytechnic State University, San Luis Obispo
7 University of Nevada, Reno °
7 Kennesaw State University
6 San Diego State University*
6 San Jose State University *
6 Oregon State University °
6 University of Kansas
6 California State Polytechnic University, Pomona *
6 University of California, San Diego
Note: ° are Land-grant universities; * are Hispanic Serving Institutions; + are Historically Black Colleges and Universities.
SOURCE: U.S. Department of Education, National Center for Education Statistics, Integrated Postsecondary Education Data System (IPEDS), Fall 2011 and Fall 2016, Completions component. (This table was prepared May 2018).
SOURCE: U.S. Department of Education, National Center for Education Statistics, Integrated Postsecondary Education Data System (IPEDS), Fall 2011 and Fall 2016, Completions component. (This table was prepared May 2018).
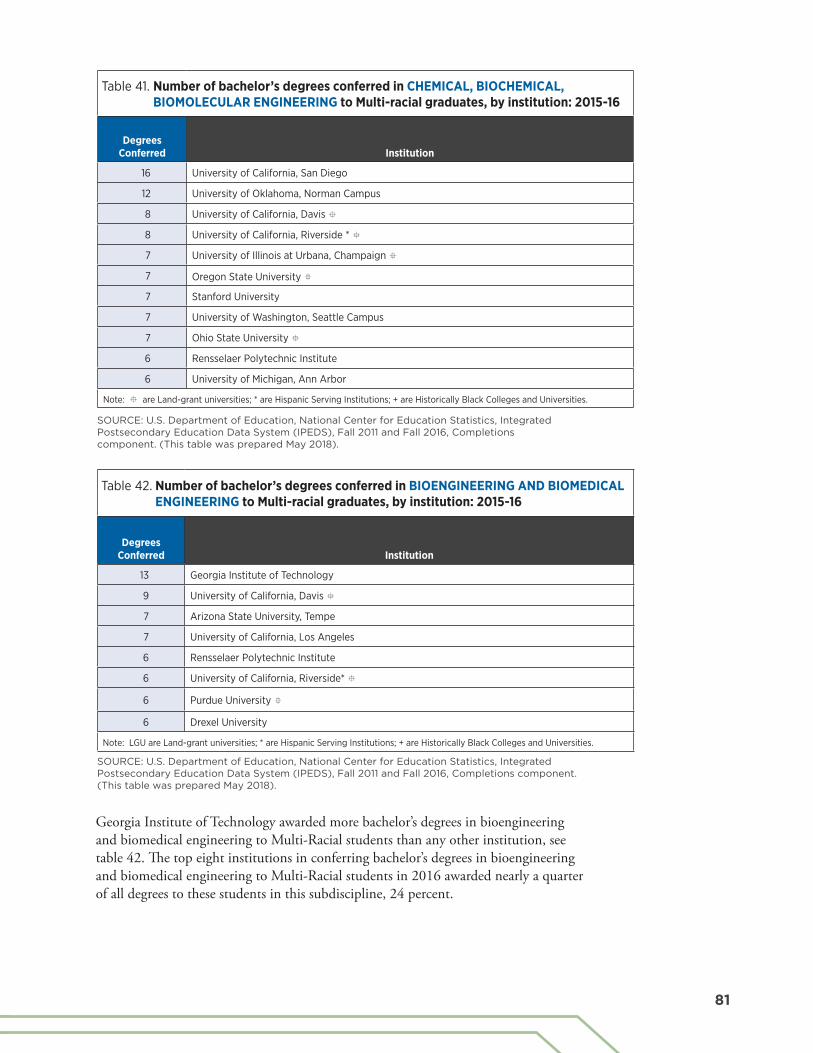
81
Table 41. Number of bachelor’s degrees conferred in CHEMICAL, BIOCHEMICAL, BIOMOLECULAR ENGINEERING to Multi-racial graduates, by institution: 2015-16
Degrees Conferred Institution
16 University of California, San Diego
12 University of Oklahoma, Norman Campus
8 University of California, Davis °
8 University of California, Riverside * °
7 University of Illinois at Urbana, Champaign °
7 Oregon State University °
7 Stanford University
7 University of Washington, Seattle Campus
7 Ohio State University °
6 Rensselaer Polytechnic Institute
6 University of Michigan, Ann Arbor
Note: ° are Land-grant universities; * are Hispanic Serving Institutions; + are Historically Black Colleges and Universities.
Table 42. Number of bachelor’s degrees conferred in BIOENGINEERING AND BIOMEDICAL ENGINEERING to Multi-racial graduates, by institution: 2015-16
Degrees Conferred Institution
13 Georgia Institute of Technology
9 University of California, Davis °
7 Arizona State University, Tempe
7 University of California, Los Angeles
6 Rensselaer Polytechnic Institute
6 University of California, Riverside* °
6 Purdue University °
6 Drexel University
Note: LGU are Land-grant universities; * are Hispanic Serving Institutions; + are Historically Black Colleges and Universities.
SOURCE: U.S. Department of Education, National Center for Education Statistics, Integrated Postsecondary Education Data System (IPEDS), Fall 2011 and Fall 2016, Completions component. (This table was prepared May 2018).
SOURCE: U.S. Department of Education, National Center for Education Statistics, Integrated Postsecondary Education Data System (IPEDS), Fall 2011 and Fall 2016, Completions component. (This table was prepared May 2018).
Georgia Institute of Technology awarded more bachelor’s degrees in bioengineering and biomedical engineering to Multi-Racial students than any other institution, see table 42. The top eight institutions in conferring bachelor’s degrees in bioengineering and biomedical engineering to Multi-Racial students in 2016 awarded nearly a quarter of all degrees to these students in this subdiscipline, 24 percent.

THE 2018 STATUS REPORT ON ENGINEERING EDUCATION82
SECTION 2 SUMMARYENGINEERING TOP PRODUCERS FOR UNDERREPRESENTED RACIAL AND ETHNIC GROUPS BY INSTITUTION
An analysis of colleges and universities that confer the most engineering bachelor’s degrees to each URG and Multi-Racial students shows a high concentration of degrees earned for these groups in a very small number of institutions. It is important to note that not every college and university in the United States has an engineering program. In 2015-16, 433 colleges and universities conferred at least 10 bachelor’s degrees in engineering. However, among URGs and Multi-Racial students, a small fraction of these institutions conferred a disproportionate majority share of bachelor’s degrees in engineering. The top 10 producers of engineering bachelor’s degrees to Hispanic students also conferred 25 percent of all engineering bachelor’s degrees to all Hispanic graduates. Among Black students, the top 10 producers conferred one out of five engineering bachelor’s degrees to all Black graduates. The top nine producers of engineering bachelor’s degrees conferred to American Indian/Alaska Native (AIAN) students conferred 26.8 percent of all engineering bachelor’s degrees to all AIAN graduates. Among Native Hawaiian/Pacific Islander (NHPI) students, 16 top producers conferred 37.1 percent of engineering bachelor’s degrees to all NHPI graduates. As noted previously, the concentration of URG degree earners at the top producer schools is significantly higher than the overall percentage in certain top subdisciplines.
The proportion of degrees Minority Serving Institutions (MSIs) award to Hispanic and Black graduates shows their significance. Six of the top 10 producers are HSIs, seven of the top 10 medium sized engineering programs are HSIs, and seven of the top 10 small sized engineering programs are HSIs. Among Black engineering graduates, the role of HBCUs cannot be overstated. Despite making up a fraction of the engineering programs at large public universities, four HBCUs were among the top 10 producers of bachelor’s degrees to Black graduates. Seven of the top 10 producers among small sized engineering programs are HBCUs. The importance of HSIs and HBCUs as top producers is also noted among various engineering subdisciplines.
Opposite the high concentration of URG students graduating from MSIs and a small number of large predominantly white institutions (PWIs) are a significant number of colleges and universities with little to no diversity among their engineering degree earners at the undergraduate level. As table 43 shows, 156 colleges and universities conferred less than 5 percent of their bachelor’s degrees in engineering to URG students in 2016. Five percent was selected as a benchmark because it is below the halfway mark of the median for most of this size groups.
Table 43. Colleges/Universities by number of engineering bachelor’s degrees conferred and level of racial and ethnic diversity indicators: 2015-16
Number of Engineering
Bachelor’s Degrees Conferred to All
Students: 2015-16
Number of Colleges/
Universities
Average Number of Engineering
Bachelor’s Degrees
Conferred to URG Students
Median Percentage of Engineering
Bachelor’s Degrees Conferred to URG
Students
Number of Colleges/Universities that
conferred less than 5 percent of their
Engineering Bachelor’s Degrees to URG Students
1,000 to 2,141 16 institutions 152 10% 0 institutions
600 to 999 28 institutions 85 8% 2 institutions
200 to 599 130 institutions 60 11% 13 institutions
100 to 199 80 institutions 22 11% 14 institutions
10 to 99 179 institutions 8 10% 49 institutions
Less than 10 121 institutions 1 0% 78 institutions

83
Many colleges and universities with engineering programs do not confer any degrees to AIAN and NHPI students. Out of 433 colleges and universities with a reasonable size engineering program, 68 percent did not confer any bachelor’s degrees in engineering to AIAN students. The numbers for NHPI students are even worse. Seventy-eight percent of schools with a reasonable size engineering program did not confer any bachelor’s degrees in engineering to NHPI students in 2015-16.
The analysis of the top and low producers of engineering bachelor’s degrees for URG students points to dual narratives about the impact of both national and local efforts to broaden participation in engineering. HBCUs and HSIs are responsible for a disproportionate majority share of engineering bachelor’s degrees conferred to Black and Hispanic students. The data analysis concludes that efforts to broaden participation have minimal impact on non-MSIs. These finding are not to suggest that all previous efforts to increase participation have been ineffective. Many of these efforts are likely to have directly or indirectly contributed to the large number of Hispanic and Black engineering graduates from HSIs and HBCUs. However, the data reveals that the impact on non-MSIs may be isolated to a small number of colleges and universities. Based on these findings, future efforts at the postsecondary level to increase diversity in engineering should be better structured to address specific issues and challenges; such as increased funding to HBCUs and HSIs to allow them to further expand upon their success in graduating engineers from URGs and a greater focus upon and effort at the colleges and universities that graduate almost no URG students in engineering.
Most of these schools are smaller engineering schools or programs that awarded less than 100 degrees to all groups combined. Therefore, any increase in the diversity at these schools would have a minimal impact on the overall number of engineering degrees earned by URM students. Nevertheless, understanding both the concentration of URM students in a small number of schools and the extremely low representation of URM students in a significant number of schools provides important details to understanding the problem of low representation of URM students in engineering nationally and where the opportuni-ties exist to broaden participation in engineering.
Table 43. Colleges/Universities by number of engineering bachelor’s degrees conferred and level of racial and ethnic diversity indicators: 2015-16
Number of Engineering
Bachelor’s Degrees Conferred to All
Students: 2015-16
Number of Colleges/
Universities
Average Number of Engineering
Bachelor’s Degrees
Conferred to URG Students
Median Percentage of Engineering
Bachelor’s Degrees Conferred to URG
Students
Number of Colleges/Universities that
conferred less than 5 percent of their
Engineering Bachelor’s Degrees to URG Students
1,000 to 2,141 16 institutions 152 10% 0 institutions
600 to 999 28 institutions 85 8% 2 institutions
200 to 599 130 institutions 60 11% 13 institutions
100 to 199 80 institutions 22 11% 14 institutions
10 to 99 179 institutions 8 10% 49 institutions
Less than 10 121 institutions 1 0% 78 institutions

THE 2018 STATUS REPORT ON ENGINEERING EDUCATION84
LEFT: PHOTO COURTESY OF THE UNIVERSITY OF TEXAS AT EL PASO
ABOVE: PHOTO COURTESY OF THE UNIVERSITY OF MINNESOTA

85A Snapshot of Diversity in Degrees Conferred in Engineering
This section provides a detailed examination of undergraduate
engineering outcomes for students from underrepresented
groups by state. Comparing the percentage of college age
population in a state to the percentage of the same group
earning bachelor’s degrees in engineering provides context for the data. Parity is
neither a legal or informal goal, simply a way to provide context and examine how
each state stands in comparison to other states that have different demographics
and population numbers.
SECTION 3:DIVERSITY AND EQUITY IN ENGINEERING BY STATE
Although the issue of diversity in higher education, engineering, and the tech work-force are often discussed and analyzed at the national level, it is important to under-stand the local dynamics of the national demographics. This is extremely important because of the concentration of certain racial and ethnic groups in specific states and regions of the U.S. In the context of access to higher education and engineering pro-grams, state demographics and the size, affordability, and accessibility to local colleges and universities is important to understand because of the tendency of students to enroll within their state of residence.

THE 2018 STATUS REPORT ON ENGINEERING EDUCATION86
Table 44. Among Hispanic 18-24-year-olds who earned bachelor’s degrees, percentage of all Hispanic graduates, percentage of all engineering degrees conferred to Hispanic graduates, and percentage of gap difference, by state: 2015-16
State
Percentage of Hispanic 18-24 year-olds
Percentage of All Engineering Bachelors’ Degrees Awarded to Hispanic Students
Percentage of All Bachelors’ Degrees Awarded to Hispanic Students
Percentage Point Difference Between Columns B and C
A B C D EFirst Quartile
California 47% 19% 27% 28
New Mexico 56% 31% 45% 25
Arizona 40% 18% 16% 23
Nevada 38% 16% 18% 22
Texas 45% 25% 28% 20
Colorado 27% 8% 12% 19
New York 22% 8% 13% 14
New Jersey 24% 10% 15% 14
Illinois 21% 8% 11% 13
Hawaii 17% 4% 9% 13
Connecticut 20% 7% 9% 12
Oregon 18% 6% 9% 12
Utah 16% 4% 6% 11
Idaho 17% 6% 7% 11
Washington 17% 6% 9% 11
Second QuartileRhode Island 19% 8% 9% 10
Nebraska 13% 3% 7% 10
Kansas 14% 5% 6% 9
Massachusetts 15% 7% 8% 8
Wyoming 13% 5% 6% 8
North Carolina 11% 4% 5% 8
Delaware 11% 5% 5% 6
Oklahoma 13% 7% 6% 6
Georgia 11% 5% 6% 5
Minnesota 7% 2% 3% 5
Pennsylvania 10% 5% 5% 5
Maryland 11% 6% 7% 5
Virginia 11% 6% 6% 5
District of Columbia 10% 5% 7% 5
Florida 29% 24% 23% 5
Wisconsin 8% 4% 4% 5
Third QuartileIndiana 8% 4% 5% 4
Montana 6% 2% 4% 4
Michigan 7% 3% 4% 4
Alaska 10% 6% 6% 4
Iowa 8% 4% 5% 4
South Carolina 7% 3% 4% 4
Tennessee 6% 3% 3% 3
North Dakota 5% 2% 2% 3
Fourth QuartileKentucky 4% 2% 2% 2
Missouri 6% 3% 4% 2
Alabama 5% 3% 3% 2
South Dakota 5% 3% 3% 2
Ohio 5% 3% 3% 2
Vermont 3% 2% 4% 2
Louisiana 6% 4% 5% 1
Maine 3% 1% 3% 1
Mississippi 4% 3% 2% 1
West Virginia 2% 2% 5% 0
New Hampshire 5% 6% 3% 0Note: The states are grouped into quartiles based on column E.

87
California had the greatest inequity levels in share of engineering degrees to Hispanic graduates compared to the racial/ethnic demographics among the college age popu-lation of 18 to 24-year-olds in the state, see table 43. In 2015-16, New Mexico had the largest percentage of all bachelor’s degrees conferred to Hispanic students (44.6 percent) but only 31 percent of all engineering bachelor’s degrees in 2015-16 were conferred to Hispanic students. At the bottom end, with the smallest gap between Hispanic college age population and Hispanic graduates in engineering, are the states in the fourth quartile. Each of these eleven states have a small percentage of Hispanic students, but the gap between college age students and engineering degree graduates is only 2 percentage points or less. Florida is noteworthy as one of the few states with a large Hispanic population and nearly equitable distribution of engineering bachelor’s degrees; Hispanic graduates make up 28.7 percent of 18 to 24-year-olds and earned 23.9 percent of engineering bachelor’s degrees.
PHOTO COURTESY OF THE UNIVERSITY OF TEXAS AT EL PASO
TABLE 43 SOURCE: U.S. Census Bureau, Population Division. Annual Estimates of the Resident Population by Sex, Age, Race Alone or in Combination, and Hispanic Origin for the United States and States: April 1, 2010 to July 1, 2017. U.S. Department of Education, National Center for Education Statistics, Integrated Postsecondary Education Data System (IPEDS), Fall 2016, Completions component. (This table was prepared June 2018).

THE 2018 STATUS REPORT ON ENGINEERING EDUCATION88
Table 45. Among Black 18-24-year-olds who earned bachelor’s degrees, percentage of all Black graduates, percentage of all engineering degrees conferred to Black graduates, and percentage of gap difference, by state: 2015-16
State Percentage of Black 18-24 year-olds
Percentage of All Engineering Bachelors’ Degrees Awarded to Black Students
Percentage of All Bachelors’ Degrees Awarded to Black Students
Percentage Point Difference Between Columns B and C
A B C D EFirst Quartile
Mississippi 44% 11% 29% 33Louisiana 39% 8% 21% 30Georgia 36% 8% 25% 28Delaware 28% 2% 15% 26South Carolina 32% 6% 18% 26District of Columbia 45% 20% 21% 25Maryland 33% 9% 20% 24Alabama 32% 11% 20% 21Virginia 23% 6% 14% 17Arkansas 20% 3% 12% 17North Carolina 26% 10% 18% 15Tennessee 22% 7% 14% 15Florida 21% 7% 14% 15Michigan 17% 3% 7% 15
Second QuartileIllinois 18% 3% 10% 14Ohio 16% 3% 7% 13New York 17% 4% 10% 13New Jersey 16% 4% 10% 12Missouri 15% 3% 9% 12Pennsylvania 15% 3% 7% 11Kentucky 12% 2% 7% 10Indiana 12% 2% 6% 10Texas 14% 4% 10% 9Connecticut 13% 4% 8% 9Nevada 12% 3% 6% 9Oklahoma 11% 2% 7% 8Wisconsin 9% 1% 3% 8
Third QuartileMinnesota 9% 2% 5% 7Kansas 9% 2% 5% 7Nebraska 7% 1% 3% 6Massachusetts 9% 4% 6% 6California 7% 2% 5% 5Iowa 6% 1% 6% 5Alaska 6% 1% 3% 5Colorado 6% 1% 5% 5Arizona 6% 2% 9% 4Washington 6% 2% 3% 4Hawaii 4% 0% 2% 4Rhode Island 8% 5% 5% 3Oregon 4% 0% 2% 3West Virginia 6% 4% 8% 3Maine 3% 1% 2% 3South Dakota 3% 1% 2% 3
Fourth QuartileWyoming 3% 0% 1% 2Vermont 3% 1% 2% 2
North Dakota 4% 3% 2% 2
Utah 2% 0% 3% 2
Montana 2% 0% 1% 1
Idaho 2% 1% 1% 1
New Mexico 3% 2% 3% 1
New Hampshire 3% 2% 3% 1
Note: The states are grouped into quartiles based on column E.

89
Two Southern states, Mississippi and Georgia led the nation in the percentage of bachelor’s degrees in all fields of study conferred to Black graduates in 2015-16, 29.4 and 24.6 percent respectively. However, even in these states with a large share of Black graduates, representation of Black students in engineering was significantly low (10.5 percent in Mississippi and 8.4 percent in Georgia). All 10 states with the greatest ineq-uity between state population (18 to 24-year-olds) and share of engineering bachelor’s degrees are in the South, led by Mississippi and Louisiana (33 and 30 percentage point gaps, respectively) see table 44. There can be few conclusions made regarding the lack of diversity in engineering degrees for states within the fourth quartile. The fourth quartile states have only 3 or 2 percent Black individuals making up their college age population. Most of the states in the third quartile have more than 3 percent Black persons among their college age population and a smaller gap in college age population and engineering degrees than states in the first and second quartile.
PHOTO COURTESY OF SACRAMENTO STATE
TABLE 44 SOURCE: U.S. Census Bureau, Population Division. Annual Estimates of the Resident Population by Sex, Age, Race Alone or in Combination, and Hispanic Origin for the United States and States: April 1, 2010 to July 1, 2017. U.S. Department of Education, National Center for Education Statistics, Integrated Postsecondary Education Data System (IPEDS), Fall 2016, Completions component. (This table was prepared June 2018).
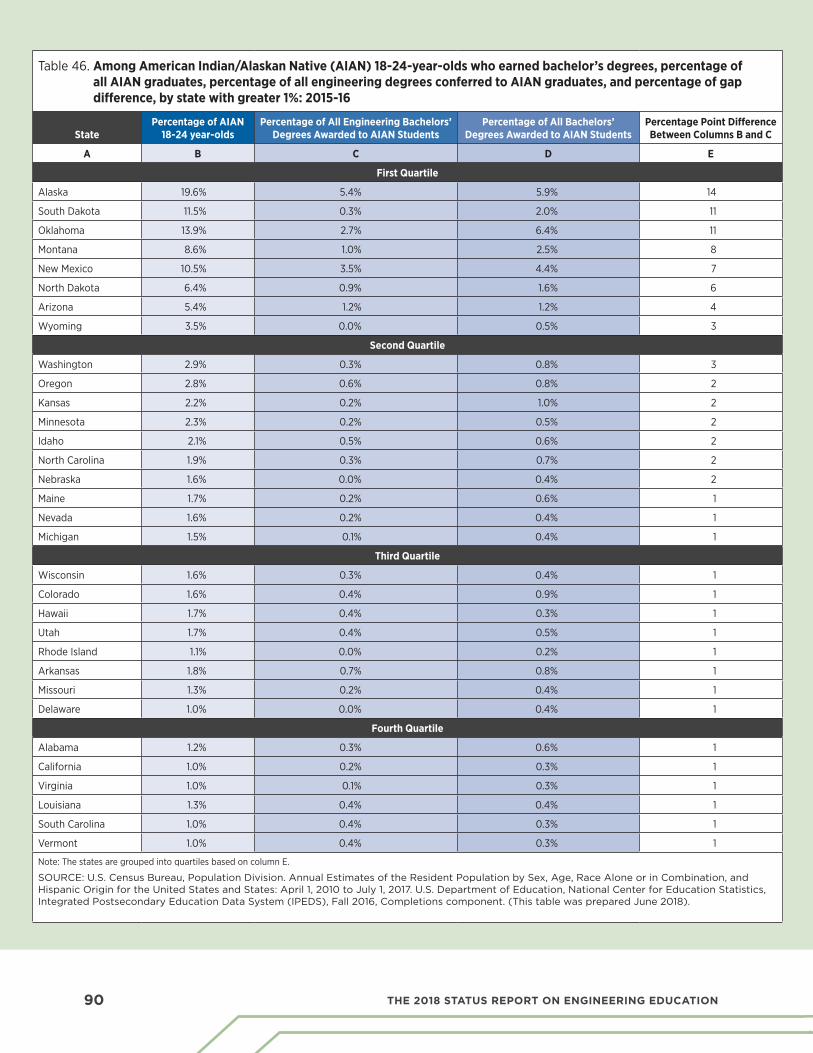
THE 2018 STATUS REPORT ON ENGINEERING EDUCATION90
Table 46. Among American Indian/Alaskan Native (AIAN) 18-24-year-olds who earned bachelor’s degrees, percentage of all AIAN graduates, percentage of all engineering degrees conferred to AIAN graduates, and percentage of gap difference, by state with greater 1%: 2015-16
StatePercentage of AIAN
18-24 year-oldsPercentage of All Engineering Bachelors’
Degrees Awarded to AIAN StudentsPercentage of All Bachelors’
Degrees Awarded to AIAN StudentsPercentage Point Difference Between Columns B and C
A B C D E
First Quartile
Alaska 19.6% 5.4% 5.9% 14
South Dakota 11.5% 0.3% 2.0% 11
Oklahoma 13.9% 2.7% 6.4% 11
Montana 8.6% 1.0% 2.5% 8
New Mexico 10.5% 3.5% 4.4% 7
North Dakota 6.4% 0.9% 1.6% 6
Arizona 5.4% 1.2% 1.2% 4
Wyoming 3.5% 0.0% 0.5% 3
Second Quartile
Washington 2.9% 0.3% 0.8% 3
Oregon 2.8% 0.6% 0.8% 2
Kansas 2.2% 0.2% 1.0% 2
Minnesota 2.3% 0.2% 0.5% 2
Idaho 2.1% 0.5% 0.6% 2
North Carolina 1.9% 0.3% 0.7% 2
Nebraska 1.6% 0.0% 0.4% 2
Maine 1.7% 0.2% 0.6% 1
Nevada 1.6% 0.2% 0.4% 1
Michigan 1.5% 0.1% 0.4% 1
Third Quartile
Wisconsin 1.6% 0.3% 0.4% 1
Colorado 1.6% 0.4% 0.9% 1
Hawaii 1.7% 0.4% 0.3% 1
Utah 1.7% 0.4% 0.5% 1
Rhode Island 1.1% 0.0% 0.2% 1
Arkansas 1.8% 0.7% 0.8% 1
Missouri 1.3% 0.2% 0.4% 1
Delaware 1.0% 0.0% 0.4% 1
Fourth Quartile
Alabama 1.2% 0.3% 0.6% 1
California 1.0% 0.2% 0.3% 1
Virginia 1.0% 0.1% 0.3% 1
Louisiana 1.3% 0.4% 0.4% 1
South Carolina 1.0% 0.4% 0.3% 1
Vermont 1.0% 0.4% 0.3% 1
Note: The states are grouped into quartiles based on column E.
SOURCE: U.S. Census Bureau, Population Division. Annual Estimates of the Resident Population by Sex, Age, Race Alone or in Combination, and Hispanic Origin for the United States and States: April 1, 2010 to July 1, 2017. U.S. Department of Education, National Center for Education Statistics, Integrated Postsecondary Education Data System (IPEDS), Fall 2016, Completions component. (This table was prepared June 2018).

91
As stated earlier, in 2015-16, approximately 1 percent of the total population in the U.S. were American Indian/Alaska Native (AIAN) graduates. A closer examination of the college age population at the state level shows that only 32 states have at least 1 percent of American Indians among their 18 to 24-year-old residents. In these states the representation of AIAN graduates among both all fields of study and engineering is extremely low compared to their share of the college age population. Oklahoma and Alaska led the nation with the highest proportion of AIAN graduates among its 2015-16 bachelor’s degree earners, 6.4 and 4.9 percent respectively. Alaska also led the nation in the proportion AIAN graduates among its 2015-16 engineering bachelor’s degree earners, 5.4 percent. Despite leading the nation in the number of bachelor’s engineering degrees conferred to AIAN graduates, Oklahoma, Arizona, and New Mexico (34 degrees, 27 degrees, and 26 degrees, respectively), are among the top 10 states with the greatest inequity in engineering degrees to college age population among AIAN students, see table 45. The fourth quartile, the states with the smallest gap between college age population and engineering degrees earned by AIAN graduates, are also the states shown with the smallest percentage of AIAN 18 to 24-year-olds, therefore any conclusion about the smaller gap may be invalid.
Only six states have at least 1 percent of Native Hawaiian/Pacific Islanders (NHPI) among their 18-24-year-old residents. In these states the representation of NHPI students among both engineering graduates and graduates in all fields of study is extremely low compared to their share of the college age population. Hawaii had the largest share of bachelor’s degrees in all fields awarded to NHPI graduates in 2016 (6.4 percent), yet that was significantly lower than their share of the Hawaiian college age population, 18.3 percent. The share of engineering bachelor’s degrees earned by NHPI graduates in Hawaii was even lower, 2.4 percent, see table 46.
Table 47. Among Native Hawaiian/Pacific Islander (NHPI) 18-24-year-olds who earned bachelor’s degrees, percentage of all NHPI graduates, percentage of all engineering degrees conferred to NHPI graduates, and percentage of gap difference, by state with greater 1%: Academic year 2015-16
State Percentage of NHPI 18-24 year-olds
Percentage of All Engineering Bachelors’ Degrees Awarded to NHPI Students
Percentage of All Bachelors’ Degrees Awarded to NPHI Students
Percentage Point Difference Between Columns B and C
A B C D E
Hawaii 18.3% 2.4% 6.4% 16
Alaska 1.9% 0.6% 0.5% 1
Utah 1.6% 0.4% 0.5% 1
Washington 1.4% 0.4% 0.5% 1
Nevada 1.3% 0.4% 0.8% 1
Oregon 1.1% 0.3% 0.5% 1
SOURCE: U.S. Census Bureau, Population Division. Annual Estimates of the Resident Population by Sex, Age, Race Alone or in Combination, and Hispanic Origin for the United States and States: April 1, 2010 to July 1, 2017. U.S. Department of Education, National Center for Education Statistics, Integrated Postsecondary Education Data System (IPEDS), Fall 2016, Completions component. (This table was prepared June 2018).

THE 2018 STATUS REPORT ON ENGINEERING EDUCATION92
SECTION 3 SUMMARYDIVERSITY AND EQUITY IN ENGINEERING BY STATE -SUMMARY
As referenced in the earlier chapters of this report, an examination of diversity in conferred engineering bachelor’s degrees by state provides greater insight into frequently held discussions at the national or institutional level. The range of inequity across nearly every state demonstrates the lack of underrepresented groups in engineering is an alarming problem throughout the country but the implications may vary. States in the first and second quartiles, where the gaps are the greatest, may experience stifled economic growth and innovation due to the lack of diversity in engineering bachelor’s degrees and the college age population (18 to 24-year-olds). Closer analysis reveals several states where demographic shifts and limited diversity in graduating engineers will lead to an insufficient supply of engineers which will prevent these states from meeting labor demands in fast-growing technology industries and non-technology industries desiring engineering skills.
Led by New Mexico there are seven states (including the District of Columbia) where a majority of 18 to 24-year-olds are URGs: New Mexico (70 percent), Texas (60 percent), California (56 percent), District of Columbia (55 percent), Nevada (53 percent), Arizona (52 percent), and Florida (51 percent). The gap between URG college age population and URG graduates in engineering ranges from 30 to34 percentage points for each of these states except Florida (20 percentage point gap). The economic implications for these states could be devastating in the coming years as a majority of those entering the workforce do not have degrees in a field that is key to economic growth and innovation.
There should also be a similar concern for the following seventeen states where approximately one-third to just under half of all 18 to 24-year-olds are URGs: Mississippi (48 percent), Georgia (48 percent), Louisiana (46 percent), Maryland (46 percent), New Jersey (41 percent), Delaware (41 percent), Hawaii (40 percent), New York (40 percent), South Carolina (40 percent), Illinois (39 percent), North Carolina (39 percent), Alabama (38 percent), Oklahoma (38 percent), Alaska (37 percent), Virginia (35 percent), Colorado (34 percent), and Connecticut (34 percent). Although these states have a very large share of URGs, on average only 12 percent of engineering graduates in 2015-16 were URGs. The gap between URG college age population and URGs graduates in engineering ranges from 21 to 34 percentage points.

93
These states are not devoid of institutions with considerable numbers of URG engineering graduates. On the contrary, a comparison of these high URG states to top producers of engineering graduates shows a direct correlation between URG college age population and URG engineering graduates (chapter 2). The data analysis shows that states with high URG populations are also likely to have institutions with a large number of URGs earning bachelor’s degrees in engineering. However, the contributions of a small number of top producers in each state cannot make up for the widespread underrepresentation of URGs in engineering programs. The state analysis moves beyond a focus on single institutions to reveal that the severe underrepresentation of most minority groups is a result of issues at every level of education. This fact is not simply an issue of equity and fairness, but one of economic viability for state and local economies and ultimately for the nation as the changing nature of the U.S. economy demands a workforce with technology skills. If the new majority population in these states are not academically prepared to enter college and study engineering, and if they are not recruited and retained in engineering programs, then the economic impact to the state and nation will be extreme and detrimental.
PHOTO COURTESY OF THE UNIVERSITY OF WYOMING

THE 2018 STATUS REPORT ON ENGINEERING EDUCATION94
CONCLUSION
As this report has documented, the overall number of engineering degrees conferred from 2011 to 2016 at each degree level continues to increase, with major increases for Hispanic and Black students. However, the increases in engineering degrees among URM groups is not enough to close the gap in nearly every state between the share of engineering degrees and their representation in the college-age population of the state. What once was primarily an issue of equity and equal opportunity is now an issue of economic vitality and national security. Broadening diversity in engineering is necessary to meet the demands by employers for more workers in the U.S. with the scientific and innovation skills necessary for the tech-sectors driving economic growth. The goal is not to redistribute engineering degrees to better reflect the demographics of the nation. Rather the goal is to produce enough graduates to fill the expanding needs of employers for a high-skill workforce. The only way to reach that goal is to increase the number of women and URM students in engineering at a significantly higher rate than recent years.
As discussed in Section 1 of this report, a 30 percent increase in the number of bachelor’s degrees in engineering earned by White students from 2011 to 2016 accounted for about half of the overall growth in bachelor’s degrees in engineering (14,769 out of 30,864). In 2016, White males earned half of the bachelor’s degrees in engineering conferred by U.S. colleges and universities. Continued growth in the number of engineering degrees conferred in the U.S. can no longer rely on continued growth in the number of White students because of declines in the number of White students at the K-12 level. The impact of the decline in White students graduating from high school is already being felt in higher education overall. As noted earlier, since 2010, the number of White students enrolled in four-year colleges and universities has declined by 8 percent.
If the current five-year trend in the increase of engineering bachelor’s degrees remained the same for each group, by 2026, about 223,000 bachelor’s degrees in engineering would be conferred to U.S. residents from all groups, more than doubling the total conferred in 2016. However, if the number of White students earning bachelor’s degrees in engineering stops increasing over the next decade, like the current trend among all non-engineering degrees, the number of engineering bachelor’s degrees conferred to U.S. residents will only increase by 44,000 degrees. Depending on how the growth in engineering degrees is distributed across the high demand engineering subdisciplines, the potentially low supply of engineers will be detrimental at both the local and national level.
This study does not recommend specific strategies for increasing the number of engineering degrees conferred to URGs because the report does not examine the impact of various URG-focused recruitment and retention efforts. However, the national, state and institutional analysis in this report provides a better understanding of where to focus efforts based on the recent trends in degrees conferred. For maximum impact on the number of engineering degrees conferred to URGs, efforts should be focused on two specific groups of institutions: 1) HBCUs and HSIs and 2) universities with large engineering schools (primarily land-grant universities and large public universities).

95
HBCUs and HSIs show an impact on the diversity of engineering that far exceeds the number of institutions that are HBCUs and HSIs. Additional support and attention should be pointed toward these colleges and universities that are succeeding in graduating many students from URGs. The majority of HBCUs and some HSIs are majority-minority institutions that have a majority of students from lower socioeconomic status. Increased financial and institutional support from both government and industry will allow these institutions to enroll and graduate more URG students in engineering.
At universities with large engineering schools, a small percentage increase in URG graduates will have a major impact on the overall number URG engineering graduates. Most of these universities have significant URG enrollment outside of engineering. Among White, Hispanic and African American females, engineering was the eighteenth largest field of study, based on bachelor’s degrees conferred in 2016. Among Hispanic males, engineering was the fourth largest field of study and it was ranked tenth among African American males. Engineering was the second largest field of study among White and Asian American males. We see that even when URG students are on a campus they are less likely to major in engineering. Strategies and initiatives must be implemented to increase enrollment, retention and graduation of URGs in engineering.
Although the needs vary, evidence-based and innovative strategies are needed to assist both HBCUs, MSIs and universities with large engineering schools in significantly increasing their engineering graduates from URGs. In fall 2018, APLU launched two initiatives that are examples of how some broader focused efforts can also impact diversity in engineering. Funded by NSF, the ASPIRE Alliance is aimed at diversifying the nation’s STEM college educators and grounding them in inclusive teaching practices. The ultimate goal in diversifying STEM faculty is to attract more URG students into STEM fields and help them graduate and be successful in the STEM workforce.
The second initiative is APLU's Powered by Publics, which is convening 130 change-ready institutions within 16 “transformation clusters.” Each cluster will focus on solving different pieces of the student success puzzle as public universities work together to tear down long-standing barriers, eliminate the achievement gap, and produce hundreds of thousands of additional degrees. The focus is university-wide and not discipline specific, but strategic efforts to improve retention across each institution should also impact retention gaps that exist within engineering.
Higher education must also collaborate with various stakeholders who can provide a greater reach into URG communities. One example involving several organizations is the 50K Coalition, which was launched by the National Society of Black Engineers (NSBE) and includes partnerships with other engineering organizations such as the American Indian Science & Engineering Society (AISES), the Society of Hispanic Professional Engineers (SHPE) and the Society of Women Engineers (SWE). NSBE set a goal of 50,000 diverse engineering graduates by 2025. In 2016, nearly 28,500 bachelor’s degrees in engineering were conferred to URM students and White females, an increase of 10,000 degrees over the previous five years. To reach the 50,000 goal by 2025, the rate of growth must increase significantly. Like the 50K Coalition, efforts are needed to address academic and financial factors for both K-12 and higher education.

THE 2018 STATUS REPORT ON ENGINEERING EDUCATION96
REFERENCESEXECUTIVE SUMMARY
i(Jones, 2002; Sargent, 2014; Kumar 2011).
ii(Xue and Larson, 2015).
iiiCarnevale, Anthony P., Nicole Smith, and Michelle Milton. 2011. (STEM) Science, Technology, Engineering, and Mathematics. Washington, DC: Georgetown University, Center on Education and the Workforce. https://cew.georgetown.edu/cew-reports/stem/#full-report
INTRODUCTION
1Blau, D. M., & Weinberg, B. A. (2017). Why the US science and engineering workforce is aging rapidly. Proceedings of the National Academy of Sciences, 114(15), 3879-3884.
2Carter-Johnson, F., Inniss, T., & Lee, M. E. (2018). HBCUs’ Relevance in Diversifying the STEM Workforce. Diverse Issues in Higher Education, 35(2), 32-32.
3Cousins, M., DeMont, B., Suggs, L., & Markey, M. K. (2018). Coordinating Summer Undergraduate Research Programs for Expanding Diversity and Impact: Opportunities and Challenges. Proceedings of the 2018 ASEE Gulf-Southwest Section Annual Conference The University of Texas at Austin.
4Cross, K. J., Mendenhal, R., Clancy, K. B. H., & Amos, J. R. (2017, June). The Double Bind of Race and Gender: A Look into the Experiences of Women of Color in Engineering. In Proceedings–American Society of Engineering Education Annual Conference & Exposition (ASEE), Columbus, OH. June 24-28, 2017.
5Douglas, E., Ilumoka, A., & Watson, H. (2017, October). Engineering education funding at the National Science Foundation. In Frontiers in Education Conference (FIE) (pp. 1-4). IEEE.
6Jones, J., Williams, A., Whitaker, S., Yingling, S., Inkelas, K., & Gates, J. (2018). Call to Action: Data, Diversity, and STEM Education. Change: The Magazine of Higher Learning, 50(2), 40-47.
7Passel, J., & Cohn, D. V. (2017). Immigration projected to drive growth in US working-age population through at least 2035. Factank: News in the Numbers, 8.
8Vue, R., Haslerig, S. J., & Allen, W. R. (2017). Affirming race, diversity, and equity through black and latinx students’ lived experiences. American Educational Research Journal, 54(5), 868-903.
SECTION 1
1U.S. Department of Education, National Center for Education Statistics, Higher Education General Information Survey (HEGIS), “Degrees and Other Formal Awards Conferred” surveys, 1976-77 and 1980-81; Integrated Postsecondary Education Data System (IPEDS), “Completions Survey” (IPEDS-C:90-99); and IPEDS Fall 2000 through Fall 2016, Completions component. (This table was prepared August 2017).

97
2https://nces.ed.gov/programs/digest/d17/tables/dt17_322.30.asp?current=yes
3https://nces.ed.gov/programs/digest/d17/tables/dt17_306.10.asp
4U.S. Department of Education, National Center for Education Statistics, Higher Education General Information Survey (HEGIS), “Degrees and Other Formal Awards Conferred” surveys, 1976-77 and 1980-81; Integrated Postsecondary Education Data System (IPEDS), “Completions Survey” (IPEDS-C:90-99); and IPEDS Fall 2000 through Fall 2016, Completions component. (This table was prepared August 2017.)
5Annual Estimates of the Resident Population by Sex, Age, Race Alone or in Combination, and Hispanic Origin for the United States and States: April 1, 2010 to July 1, 2016. Source: U.S. Census Bureau, Population Division.
6U.S. Department of Education, National Center for Education Statistics, Higher Education General Information Survey (HEGIS), “Degrees and Other Formal Awards Conferred” surveys, 1976-77 and 1980-81; Integrated Postsecondary Education Data System (IPEDS), “Completions Survey” (IPEDS-C:90-99); and IPEDS Fall 2000 through Fall 2016, Completions component. (This table was prepared August 2017.).
7U.S. Department of Education, National Center for Education Statistics, Higher Education General Information Survey (HEGIS), “Degrees and Other Formal Awards Conferred” surveys, 1976-77 and 1980-81; Integrated Postsecondary Education Data System (IPEDS), “Completions Survey” (IPEDS-C:90-99); and IPEDS Fall 2000 through Fall 2016, Completions component. (This table was prepared August 2017.).
8https://nces.ed.gov/programs/digest/d17/tables/dt17_322.30.asp?current=yes
9https://nces.ed.gov/programs/digest/d17/tables/dt17_306.10.asp
10U.S. Department of Education, National Center for Education Statistics, Higher Education General Information Survey (HEGIS), “Degrees and Other Formal Awards Conferred” surveys, 1976-77 and 1980-81; Integrated Postsecondary Education Data System (IPEDS), “Completions Survey” (IPEDS-C:90-99); and IPEDS Fall 2000 through Fall 2016, Completions component. (This table was prepared August 2017.).
11U.S. Department of Education, National Center for Education Statistics, Higher Education General Information Survey (HEGIS), “Degrees and Other Formal Awards Conferred” surveys, 1976-77 and 1980-81; Integrated Postsecondary Education Data System (IPEDS), “Completions Survey” (IPEDS-C:90-99); and IPEDS Fall 2000 through Fall 2016, Completions component. (This table was prepared August 2017.).
12https://nces.ed.gov/programs/digest/d17/tables/dt17_323.30.asp?current=yes
13https://nces.ed.gov/programs/digest/d17/tables/dt17_324.20.asp?current=yes
14U.S. Department of Education, National Center for Education Statistics, Higher Education General Information Survey (HEGIS), “Degrees and Other Formal Awards Conferred” surveys, 1976-77 and 1980-81; Integrated Postsecondary Education Data System (IPEDS), “Completions Survey” (IPEDS-C:90-99); and IPEDS Fall 2000 through Fall 2016, Completions component. (This table was prepared August 2017.).
15U.S. Department of Education, National Center for Education Statistics, Common Core of Data (CCD), “State Nonfiscal Survey of Public Elementary/Secondary Education,” 1981-82 through 2005-06; “State Dropout and Completion Data File,” 2005-06 through 2012-13; and National Public High School Graduates by Race/Ethnicity Projections Model, 1995-96 through 2027-28. (This table was prepared May 2018.).

THE 2018 STATUS REPORT ON ENGINEERING EDUCATION98
16U.S. Department of Education, National Center for Education Statistics, Higher Education General Information Survey (HEGIS), “Fall Enrollment in Colleges and Universities” surveys, 1976 and 1980; Integrated Postsecondary Education Data System (IPEDS), “Fall Enrollment Survey” (IPEDS-EF:90); and IPEDS Spring 2001 through Spring 2017, Fall Enrollment component. (This table was prepared December 2017.).
17U.S. Department of Education, National Center for Education Statistics, Higher Education General Information Survey (HEGIS), “Degrees and Other Formal Awards Conferred” surveys, 1976-77 and 1980-81; Integrated Postsecondary Education Data System (IPEDS), “Completions Survey” (IPEDS-C:90-99); and IPEDS Fall 2000 through Fall 2016, Completions component. (This table was prepared August 2017).
18U.S. Department of Education, National Center for Education Statistics, Higher Education General Information Survey (HEGIS), “Degrees and Other Formal Awards Conferred” surveys, 1976-77 and 1980-81; Integrated Postsecondary Education Data System (IPEDS), “Completions Survey” (IPEDS-C:90-99); and IPEDS Fall 2000 through Fall 2016, Completions component. (This table was prepared August 2017.).
19U.S. Department of Education, National Center for Education Statistics, Higher Education General Information Survey (HEGIS), “Degrees and Other Formal Awards Conferred” surveys, 1976-77 and 1980-81; Integrated Postsecondary Education Data System (IPEDS), “Completions Survey” (IPEDS-C:90-99); and IPEDS Fall 2000 through Fall 2016, Completions component. (This table was prepared August 2017.).
20Annual Estimates of the Resident Population by Sex, Single Year of Age, Race, and Hispanic Origin for the United States: April 1, 2010 to July 1, 2016; Source: U.S. Census Bureau, Population Division; Release Date: June 2017.
21U.S. Department of Education, National Center for Education Statistics, Higher Education General Information Survey (HEGIS), “Fall Enrollment in Colleges and Universities” surveys, 1976 and 1980; Integrated Postsecondary Education Data System (IPEDS), “Fall Enrollment Survey” (IPEDS-EF:90); and IPEDS Spring 2001 through Spring 2017, Fall Enrollment component. (This table was prepared December 2017.).
22U.S. Department of Education, National Center for Education Statistics, Common Core of Data (CCD), “State Nonfiscal Survey of Public Elementary/Secondary Education,” 1981-82 through 2005-06; “State Dropout and Completion Data File,” 2005-06 through 2012-13; and National Public High School Graduates by Race/Ethnicity Projections Model, 1995-96 through 2027-28. (This table was prepared May 2018.).
23U.S. Department of Education, National Center for Education Statistics, Higher Education General Information Survey (HEGIS), “Degrees and Other Formal Awards Conferred” surveys, 1976-77 and 1980-81; Integrated Postsecondary Education Data System (IPEDS), “Completions Survey” (IPEDS-C:90-99); and IPEDS Fall 2000 through Fall 2016, Completions component. (This table was prepared August 2017).
24https://nces.ed.gov/programs/digest/d17/tables/dt17_322.30.asp?current=yes.
25https://www.census.gov/quickfacts/fact/table/US/PST045217.
26U.S. Department of Education, National Center for Education Statistics, Higher Education General Information Survey (HEGIS), “Degrees and Other Formal Awards Conferred” surveys, 1976-77 and 1980-81; Integrated Postsecondary Education Data System (IPEDS), “Completions Survey” (IPEDS-C:90-99); and IPEDS Fall 2000 through Fall 2016, Completions component. (This table was prepared August 2017.).

99
27U.S. Department of Education, National Center for Education Statistics, Higher Education General Information Survey (HEGIS), “Degrees and Other Formal Awards Conferred” surveys, 1976-77 and 1980-81; Integrated Postsecondary Education Data System (IPEDS), “Completions Survey” (IPEDS-C:90-99); and IPEDS Fall 2000 through Fall 2016, Completions component. (This table was prepared August 2017.).
28U.S. Department of Education, National Center for Education Statistics, Higher Education General Information Survey (HEGIS), “Degrees and Other Formal Awards Conferred” surveys, 1976-77 and 1980-81; Integrated Postsecondary Education Data System (IPEDS), “Completions Survey” (IPEDS-C:90-99); and IPEDS Fall 2000 through Fall 2016, Completions component. (This table was prepared August 2017).
29https://nces.ed.gov/programs/digest/d17/tables/dt17_322.30.asp?current=yes.
30U.S. Department of Education, National Center for Education Statistics, Higher Education General Information Survey (HEGIS), “Degrees and Other Formal Awards Conferred” surveys, 1976-77 and 1980-81; Integrated Postsecondary Education Data System (IPEDS), “Completions Survey” (IPEDS-C:90-99); and IPEDS Fall 2000 through Fall 2016, Completions component. (This table was prepared August 2017.).
31https://nces.ed.gov/programs/digest/d17/tables/dt17_324.25.asp.
32U.S. Department of Education, National Center for Education Statistics, Higher Education General Information Survey (HEGIS), “Degrees and Other Formal Awards Conferred” surveys, 1976-77 and 1980-81; Integrated Postsecondary Education Data System (IPEDS), “Completions Survey” (IPEDS-C:90-99); and IPEDS Fall 2000 through Fall 2016, Completions component. (This table was prepared August 2017).
33https://nces.ed.gov/programs/digest/d17/tables/dt17_322.30.asp?current=yes.
34U.S. Department of Education, National Center for Education Statistics, Higher Education General Information Survey (HEGIS), “Degrees and Other Formal Awards Conferred” surveys, 1976-77 and 1980-81; Integrated Postsecondary Education Data System (IPEDS), “Completions Survey” (IPEDS-C:90-99); and IPEDS Fall 2000 through Fall 2016, Completions component. (This table was prepared August 2017.).
35U.S. Department of Education, National Center for Education Statistics, Higher Education General Information Survey (HEGIS), “Degrees and Other Formal Awards Conferred” surveys, 1976-77 and 1980-81; Integrated Postsecondary Education Data System (IPEDS), “Completions Survey” (IPEDS-C:90-99); and IPEDS Fall 2000 through Fall 2016, Completions component. (This table was prepared August 2017.).
36https://www.census.gov/prod/cen2010/briefs/c2010br-13.pdf.
37http://www.pewsocialtrends.org/2015/06/11/multiracial-in-america/
38http://www.pewsocialtrends.org/2015/06/11/chapter-1-race-and-multiracial-americans-in-the-u-s-census/#fn-20523-13.
39https://nces.ed.gov/programs/digest/d17/tables/dt17_322.30.asp?current=yes.
40U.S. Department of Education, National Center for Education Statistics, Higher Education General Information Survey (HEGIS), “Degrees and Other Formal Awards Conferred” surveys, 1976-77 and 1980-81; Integrated Postsecondary Education Data System (IPEDS), “Completions Survey” (IPEDS-C:90-99); and IPEDS Fall 2000 through Fall 2016, Completions component. (This table was prepared August 2017.).
41https://nces.ed.gov/programs/digest/d17/tables/dt17_323.30.asp?current=yes.

THE 2018 STATUS REPORT ON ENGINEERING EDUCATION100
SECTION 1 SUMMARY
1Carnevale, Anthony P., Nicole Smith, and Michelle Milton. 2011. (STEM) Science, Technology, Engineering, and Mathematics. Washington, DC: Georgetown University, Center on Education and the Workforce. https://cew.georgetown.edu/cew-reports/stem/#full-report
SECTION 2
1Table 21 shows only the top 9 institutions in chemical, biochemical, biomolecular engineering degrees to Black students because four schools awarded 6 degrees each.
2Table 22 shows only the top 8 institutions in computer engineering degrees to Black students because four schools awarded 6 degrees each.
3Table 23 shows only the top 9 institutions in engineering degrees to AIAN students because four schools awarded 5 degrees each.
APPENDIX A
ihttps://nces.ed.gov/ipeds/about-ipedsiihttps://nces.ed.gov/ipeds/use-the-data/survey-componentsiiihttps://nces.ed.gov/ipeds/cipcode/Default.aspx?y=55ivhttps://nces.ed.gov/ipeds/report-your-data/race-ethnicity-definitionsvAgresti & Finlay, 2014. Statistical Methods for the Social Sciences, 4th Edition.
PHOTO COURTESY OF THE UNIVERSITY OF NORTH TEXAS

101
APPENDIX ADATA SOURCES AND METHODOLOGY
This study uses data from the Integrated Postsecondary Education Data System (IPEDS)—an interrelated system of surveys comprised of institution-level data. As required by the amended Higher Education Act of 1965, these data include information about student enrollment, degree completion, faculty and staff outcomes and finances for every college, university, technical and vocational institution that participates in federal student aid programs.i The US Department of Education National Center for Education Statistics collects IPEDS data annually during three collection periods (Fall, Winter and Spring). IPEDS consists of a number of survey components—12-month Enrollment, Academic Libraries, Admissions, Completions, Fall Enrollment, Finance, Graduation Rates, Human Resources, Institutional Characteristics, Outcome Measures and Student Financial Aid.ii The data for this study are primarily from the IPEDS completion survey which provides information about degree completions, including degrees awarded by race, gender, field of study and award level. The IPEDS field of study information is based upon the Classification of Instructional Programs (CIP) Codes—a taxonomy used to identify field of study and program completion information.iii Because the IPEDS completion survey does not include data about institution names or location, this information was retrieved from the Institutional Characteristics component and merged with the Completion Data. Data from 2011 to 2016—the most recent year available—are the foci of these analyses and the IPEDS Completion Survey data from each of these years were merged into one file. These analyses only utilize the final release version of the data from each of these years. Furthermore, the following award levels were considered: Bachelor’s degrees, Master’s degrees, and Doctoral degrees (research/scholarship, professional practice and other).
This study also uses data from the U.S. Census Bureau, Population Division. Annual Estimates of the Resident Population by Sex, Age, Race Alone or in Combination, and Hispanic Origin for the United States and States: April 1, 2010 to July 1, 2017.
According to the U.S. Census Bureau, “Each year, the United States Census Bureau produces and publishes estimates of the population for the nation, states, counties, state/county equivalents, and Puerto Rico. We estimate the resident population for each year since the most recent decennial census [2010] by using measures of population change. The resident population includes all people currently residing in the United States.”
The field of engineering is further disaggregated by NCES into forty subdisciplines, which are referred to as having 4-digit CIP Codes. In addition to 4-digit CIP Codes, IPEDS provides details at the 6-digit CIP Code level. These are more narrowly defined subdisciplines; e.g., Civil Engineering is a subfield of Engineering and under Civil Engineering there are several more narrowly defined fields such as Transportation and Highway Engineering. To ensure that our analyses are relevant to the engineering profession and reflective of the current structure of engineering subfields, we consulted with engineering experts about the appropriate grouping of existing IPEDS completion data to better represent the current structure of engineering programs and subfields. As part of this process, we reviewed documentation from the Accreditation Board for Engineering and Technology (ABET) concerning engineering programs and criteria for accreditation. ABET is a nonprofit accrediting agency for post-secondary programs in applied and natural science, computing, engineering and engineering technology. By reviewing the ABET documentation, we were able to gain insight concerning the different engineering subdisciplines currently recognized within the field and guidance about the engineering focal areas that fall within each subdiscipline. In addition, we also reviews reports from the American Society

THE 2018 STATUS REPORT ON ENGINEERING EDUCATION102
for Engineering Education (ASEE) for additional information regarding the appropriate categorization of engineering subfields. Based upon the guidance from ABET and ASEE, we developed the engineering categories for this report by grouping various CIP codes from IPEDS that reflect a specific engineering content area. We shared this categorization scheme with the advisory committee to verify it relevance and accuracy. Information regarding these final engineering subfield categories are included.
PHOTO COURTESY OF THE TEMPLE UNIVERSITY

103
APLU Engineering Categorization Scheme
1 Aerospace Engineering
IPEDS CIP Code(s) 14.0201 Aerospace, Aeronautical and Astronautical/Space Engineering
Similar to: Abet & ASEE Aerospace Engineering
2 Agricultural Engineering
IPEDS CIP Code(s) 14.0301 Agricultural Engineering
14.3401 Forest Engineering
Similar to: Abet Agricultural Engineering
ASEE Biological & Agricultural Engineering
3 Architectural Engineering
IPEDS CIP Code(s) 14.0401 Architectural Engineering
Similar to: Abet & ASEE Architectural Engineering
4 Bioengineering and Biomedical Engineering
IPEDS CIP Code(s) 14.0501 Bioengineering and Biomedical Engineering
Similar to: Abet Bioengineering and Biomedical Engineering
ASEE Biomedical Engineering
5 Biological Engineering
IPEDS CIP Code(s) 14.4501 Biological/Biosystems Engineering
Similar to: Abet Biological Engineering
6 Chemical, Biochemical, Biomolecular Engineering
IPEDS CIP Code(s) 14.0701 Chemical Engineering
14.0702 Chemical and Biomolecular Engineering
14.0799 Chemical Engineering, Other
14.4301 Biochemical Engineering
14.4401 Engineering Chemistry
14.4001 Paper Science and Engineering
Similar to: Abet Chemical, Biochemical, Biomolecular Engineering
ASEE Chemical Engineering
7 Civil Engineering
IPEDS CIP Code(s) 14.0801 Civil Engineering, General
14.0899 Civil Engineering, Other
14.0803 Structural Engineering
14.0804 Transportation and Highway Engineering
Similar to: Abet Civil Engineering
ASEE Civil/Environmental Engineering
8 Computer Engineering
IPEDS CIP Code(s) 14.0901 Computer Engineering, General
14.0902 Computer Hardware Engineering
14.0999 Computer Engineering, Other
Similar to: ASEE Computer Engineering
9 Construction Engineering
IPEDS CIP Code(s) 14.3301 Construction Engineering
Similar to: Abet Construction Engineering

THE 2018 STATUS REPORT ON ENGINEERING EDUCATION104
APLU Engineering Categorization Scheme continued
10 Electrical Engineering
IPEDS CIP Code(s) 14.1001 Electrical and Electronic Engineering
Similar to: ASEE Electrical Engineering
11 Electrical/ Computer Engineering
IPEDS CIP Code(s) 14.1004 Telecommunications Engineering
14.1099 Electrical, Electronics and Communications Engineering, Other
Similar to: ASEE Electrical/ Computer Engineering
12 Engineering Mechanics
IPEDS CIP Code(s) 14.1101 Engineering Mechanics
Similar to: Abet Engineering Mechanics
13 Engineering, General Engineering, Engineering Physics, Engineering Science
IPEDS CIP Code(s) 14.0101 Engineering, General
14.1201 Engineering Physics/Applied Physics
14.1301 Engineering Science
Similar to: Abet Engineering, General Engineering, Engineering Physics,
Engineering Science
ASEE Engineering General
ASEE Eng. Science & Eng. Physics
14 Environmental Engineering
IPEDS CIP Code(s) 14.1401 Environmental/Environmental Health Engineering
14.0805 Water Resources Engineering
Similar to: Abet & ASEE Environmental Engineering
15 Geological Engineering
IPEDS CIP Code(s) 14.3901 Geological/Geophysical Engineering
Similar to: Abet Geological Engineering
16 Industrial Engineering
IPEDS CIP Code(s) 14.3501 Industrial Engineering
14.3701 Operations Research
Similar to: Abet Industrial Engineering
ASEE Industrial/Manufacturing/Systems Engineering
17 Manufacturing Engineering
IPEDS CIP Code(s) 14.3601 Manufacturing Engineering
Similar to: Abet Manufacturing Engineering
18 Materials, Metallurgical and Ceramics Engineering
IPEDS CIP Code(s) 14.0601 Ceramic Sciences and Engineering
14.1801 Materials Engineering
14.2001 Metallurgical Engineering
14.3201 Polymer/Plastics Engineering
14.2801 Textile Sciences and Engineering
Similar to: Abet Materials, Metallurgical and Ceramics Engineering
ASEE Metallurgical and Materials

105
APLU Engineering Categorization Scheme continued
19 Mechanical Engineering
IPEDS CIP Code(s) 14.1901 Mechanical Engineering
14.4101 Electromechanical Engineering
14.4201 Mechatronics, Robotics, and Automation Engineering
Similar to: Abet & ASEE Mechanical Engineering
20 Mining Engineering
IPEDS CIP Code(s) 14.2101 Mining and Mineral Engineering
Similar to: Abet & ASEE Mining Engineering
21 Naval Architecture and Marine Engineering
IPEDS CIP Code(s) 14.2201 Naval Architecture and Marine Engineering
Similar to: Abet Naval Architecture and Marine Engineering
22 Nuclear and Radiological Engineering
IPEDS CIP Code(s) 14.2301 Nuclear Engineering
Similar to: Abet Nuclear and Radiological Engineering
ASEE Nuclear Engineering
23 Ocean Engineering
IPEDS CIP Code(s) 14.2401 Ocean Engineering
Similar to: Abet Ocean Engineering
24 Optics and Phototonics
IPEDS CIP Code(s) 14.1003 Laser and Optical Engineering
Similar to: Abet Optics and Phototonics
25 Other
IPEDS CIP Code(s) 14.9999 Other
14.0102 Pre-Engineering
Similar to: IPEDS Other
26 Petroleum Engineering
IPEDS CIP Code(s) 14.2501 Petroleum Engineering
Similar to: Abet & ASEE Petroleum Engineering
27 Software Engineering
IPEDS CIP Code(s) 14.0903 Computer Software Engineering
Similar to: Abet Software Engineering
28 Surveying Engineering
IPEDS CIP Code(s) 14.3801 Surveying Engineering
Similar to: Abet Surveying Engineering
29 Systems Engineering
IPEDS CIP Code(s) 14.2701 Systems Engineering
Similar to: Abet Systems Engineering

THE 2018 STATUS REPORT ON ENGINEERING EDUCATION106
In addition to engineering subdisciplines, the other important categorization in this report is racial and ethnic groups and residency. Because the data for this study is from U.S. Department of Education’s IPEDS we follow their format and rules for racial and ethnic classification and reporting. The study focused on the following groups: Hispanic, American Indian or Alaska Native, Asian, Black or African American, Native Hawaiian or Other Pacific Islander, White, Multi-Racial and Non-U.S. Resident. A few critical points to understand when reviewing these categories. Hispanic or Latino is considered an ethnicity and categorized separately from the other racial groups. Therefore, a person can be both of Hispanic ethnic/origin and a member of one or more racial groups. A person listed as Hispanic ethnic/origin is always listed as Hispanic only regardless of any racial category they might select. In other words, a person identified as Hispanic and a racial category is always listed as Hispanic and never included in Multi-Racial. However, persons who are not listed as Hispanic or Latino are counted under a single racial category if only one category is selected (or chosen). If a non-Hispanic person is listed as more than one race, i.e., Asian and White, they are listed as Multi-Racial. In addition to analyzing engineering degrees for racial and ethnic groups the report examines Non-U.S. Resident graduates.
NCES defines this group as, “A person who is not a citizen or national of the United States and who is in this country on a visa or temporary basis and does not have the right to remain indefinitely.” Because IPEDS does not specifically track undocumented students (e.g. DACA) how they are reported is based on an individual college or university’s policy. As such some schools may include undocumented students in their race and ethnicity reporting while others may include them in the Non-U.S. Resident graduate category. Because of these guidelines for collecting and reporting race and ethnicity data perceptions about the diversity of any engineering program may differ from reality. For example, an engineering program may be diverse and appear to have several Black students. But, the Black students may be Non-U.S. Residents (from foreign countries). In this example, the program can accurately describe its student body as diverse, but they cannot accurately claim diversity based on enrolling underrepresented groups, such as Black students who are U.S. citizens.
Because the analyses in this report seek to provide information about:
1) undergraduate and graduate engineering outcomes for students in different racial and ethnic categories;
2) undergraduate engineering outcomes for students from underrepresented groups in larger engineering subdisciplines; and
3) undergraduate engineering outcomes for students from underrepresented groups by state, descriptive statistics were an appropriate analytical technique.

107

1307 New York Avenue, NW, Suite 400Washington, DC 20005
202-478-6040 • www.aplu.org