the college payoff
DESCRIPTION
Data and charts about how much more college graduates makeTRANSCRIPT

Education, Occupations, Lifetime Earnings
The College Payoff
E x E C u t i v E s u m m a r y
anthony P. Carnevale, stephen J. rose and Ban CheahThe GeorGeTown UniversiTy CenTer on edUCaTion and The workforCe
65097_Summary.indd 1 7/13/11 8:00 PM

Education and earnings interact in complex and often unexpected ways — but there are rules to the game. The College Payoff, a new paper from the Georgetown university Center on Education and the Workforce, uses in-depth data analysis to identify, illuminate and elucidate those rules.
This executive summary provides a glimpse of the education and earnings game, and cracks open the rule book for examination.
65097_Summary.indd 2 7/13/11 8:00 PM

The Rule Book
Rule No.1:Degree Level Matters.
But
Rule No.2:Occupational choice can trump degree level. People with less education in high-paying occupations can out-earn people with more education in less remunerative occupations.
But
Rule No.3:While occupation can sometimes trump education, degree level still matters most within individual occupations.
But
Rule No.4:Race/ethnicity and gender are wild cards that matter more than education or occupation in determining earnings.
For further detail on these rules, read on.
1
65097_Summary.indd 3 7/13/11 8:00 PM

Obtaining a postsecondary credential is almost always worth it, as evidenced by higher earnings over a lifetime. The higher the level of educational attainment, the higher the payoff. What’s more, the gap is widening. In 2002, a Bachelor’s degree-holder could expect to earn 75 percent more over a lifetime than someone with only a high school diploma. Today, that premium is 84 percent.
On average:• A high school dropout can expect to earn $973,000 over a lifetime.• Someone with a high school diploma can expect to earn $1.3 million over a lifetime.• A worker with some college but no degree earns $1.5 million over a lifetime.• An Associate’s degree-holder earns $1.7 million over a lifetime.• A worker with a Bachelor’s degree will earn $2.3 million over a lifetime.
Graduate degrees confer even higher earnings: • A Master’s degree-holder earns $2.7 million over a lifetime.• A Doctoral degree-holder earns $3.3 million over a lifetime.• A Professional degree-holder earns $3.6 million over a lifetime.
Rule No.1: Degree Level Matters. On average, people with more education make more than those with less.
Figure 1: Lifetime Earnings by Educational Attainment.
Less than High
School
High School
Diploma
Some College/
No Degree
Associ-ate’s
degree
Bachelor’s degree
Master’s degree
Doctoral degree
Profes-sional degree
$973,000
$1,304,000
$1,547,000$1,727,000
$2,268,000
$2,671,000
$3,252,000
$3,648,000
2
65097_Summary_X.indd 4 7/15/11 6:43 PM

There are significant earnings variations between different levels of educational attainment. • 31% of high school dropouts earn more than the median earnings of workers with high school diplomas.• 37% of those with a high school diploma make more than the median earnings of workers with
some college/no degree. • 42% of people with some college/no degree earn more than the median earnings of workers with an
associate’s degree.• 28% of people with an Associate’s degree make more than the median of workers with a Bachelor’s degree.• 40% of people with a Bachelor’s degree earn more than the median of workers with a Master’s degree.• 36% of people with a Master’s degree make more than the median of workers with a Doctoral degree.• 37% of people with a Doctoral degree make more than the median of workers with a Professional degree.
These figures reflect a critical aspect of the education and earnings game: the actual job that someone does — the work they perform — has a significant effect on earnings. today, careers follow occupational paths. These occupations — engineering or accounting for example — can be found in any number of industries (you can be an accountant for a bakery or for an airplane manufacturer). as a result, today’s workers are more attached to the occupations they fill than to the industries in which they work.
Earnings today, then, are driven by a combination of educational attainment and occupation. some occupational clusters pay better than others — for example, the stEm occupations earn much more than teachers, regardless of educational attainment. in fact, an engineer with some college/no degree or a postsecondary certificate can earn more than a teacher with a Bachelor’s degree.
Less than High
School
High School
Diploma
Some College/No
DegreeAssociate’s
Degree
Bachelor’s
DegreeMaster’sDegree
DoctoralDegree
Professional
Doctoral
Master’s
Bachelor’s
Associate’s
Some College/ No Degree
High School Diploma
1.3% 2.4% 4.8% 4.9% 17.2% 24.2% 36.9%
2.3% 4.6% 8.6% 9.5% 26.7% 35.5% .
4.6% 9.2% 15.9% 19.2% 39.9% . .
7.3% 14.3% 23.1% 28.2% . . .
16.3% 29.8% 41.9% . . . .
21.3% 36.6% . . . . .
31.4% . . . . . .
How to read this chart: Taking the less than high school column and reading down, it shows that 1.3% of people with less than a high school education make the same amount or more as the median earnings of someone with a Professional degree. 2.3% of people with less than high school make the same amount or more as the median for someone with a Doctoral degree, 4.6% of people with less than a high school education make the same amount or more than someone with a Master’s degree, and so on.
Rule No.2 Occupations can trump degree levels. People with less education can sometimes out-earn people with more, principally because of occupational differences.
Figure 2: There are many people who make more than their more highly-educated counterparts.
3
65097_Summary.indd 5 7/13/11 8:00 PM

61%Master’s
73%Doctoral
83%Professional
28.2%Associate’s
7.3%Less than
High School
14.3% High School
Diploma
23.1%Some College/No Degree
Bachelor’sDegreeMedianLifetime
Earnings
How to read this chart: This graphic shows the amount of earnings overlap based on educational attainment. The red dotted line represents the median earnings of Bachelor’s degree-holders. The size of the each circle represents the number of people with each credential, and the amount that the circle is crossing the line represents the percentage of people with each credential that earn more than the median earnings for Bachelor’s degree-holders. Therefore, about 7 percent of the less than high school circle is crossing the line, meaning that about 7 percent of people with less than a high school diploma earn more than the median for Bachelor’s degree-holders.
4
Earnings Overlapin a surprising number of cases, people with less educational attainment earn more than those with more. This graphic represents just how much earnings overlap there is, relative to workers with a Bachelor’s degree.
7.3% of those with less than High School earn more than the median Bachelor’s degree-holder
14.3% of High School Graduates earn more than the median Bachelor’s degree-holder
23.1% percent of those with Some College earn more than the median Bachelor’s degree-holder
65097_Summary.indd 6 7/13/11 8:00 PM

61%Master’s
73%Doctoral
83%Professional
28.2%Associate’s
7.3%Less than
High School
14.3% High School
Diploma
23.1%Some College/No Degree
Bachelor’sDegreeMedianLifetime
Earnings
5
28.2% of those with Associate’s degrees earn more than the median Bachelor’s degree-holder
61% of those with Master’s degrees earn more than the median Bachelor’s degree-holder
73% of those with Doctoral degrees earn more than the median Bachelor’s degree-holder
83% of those with Professional degrees earn more than the median Bachelor’s degree-holder
65097_Summary.indd 7 7/13/11 8:00 PM

Within an occupation, workers with higher educational attainment almost always make more than those with less, rewarding employees who continue their studies, even when they keep the same job. For example, accoun-tants and auditors with a high school diploma make $1.5 million over a lifetime, compared with $1.7 million for accountants and auditors with some college, $2.4 million for accountants and auditors with a Bachelor’s degree, and $3 million for accountants and auditors with a graduate degree. The same pattern generally holds within all occupations.
at the highest end of the education and earnings scale, the picture gets fuzzier, though. in some occupations, such as STEM, Doctoral degree-holders earn more than their Professional degree-holding counterparts. In others, notably Healthcare, where Professional degree-holders are doctors and dentists, those with Professional degrees make more than their Doctoral degree counterparts.
Rule No.3 While occupation can sometimes trump education, degree level still matters most within individual occupations1.
1 Undergraduate major, because of its linkages to occupations, also matters. See Carnevale, Anthony, Jeff Strohl, and Michelle Melton. “What’s it Worth?: The Economic Value of College Majors.” Washington, DC: Georgetown University Center on Education and the Workforce, 2011.
Figure 3: Lifetime earnings by education and occupation, 2009 dollars.
Less than High School
Bachelor’s
High School Diploma
Master’s
Some College/No Degree
Doctoral
Associate’s
Professional
Health Professionals
Managerial and
Professional
Community Service and Arts
Education Blue CollarSales and Office
Health Support
Personal Services
STEM
$5,000,000
$4,500,000
$4,000,000
$3,500,000
$3,000,000
$2,500,000
$2,000,000
$1,500,000
$1,000,000
$500,000
$0
6
Occupation
65097_Summary.indd 8 7/13/11 8:00 PM

Women earn less than men, even when they work the same number of hours — a gap that persists across all levels of educational attainment. in fact, women with a Bachelor’s degree earn about as much as men with some college education but no degree. On average, to earn as much as men with a Bachelor’s degree, women must obtain a Doctoral degree.
similar gaps also exist by race and ethnicity. african-americans and Latinos earn less than their White counter-parts, even among the most highly-educated workers. african-americans and Latinos with master’s degrees don’t exceed the median lifetime earnings of Whites with Bachelor’s degrees. However, at the graduate degree level, asians make more than all other races/ethnicities, including Whites.
Master’s
Some College/No Degree
DoctoralMale $3,466,000
Female $2,857,000
ProfessionalMale $4,033,000
Female $3,010,000
Male $3,145,000Female $2,321,000
Male $2,593,000Female $1,939,000
Male $1,933,000Female $1,544,000
Female $1,327,000
Male $1,500,000Female $1,117,000
Male $1,103,000Female $797,000
Male $1,802,000
High SchoolDiploma
Less thanHigh School
MaleFemale
Women have to have a PhD to make as much as men with a Bachelor’s degree
Men with some college but no degree earn about the same as women with a Bachelor’s degree
$0 $1,500,000$1,000,000$50,000 $2,000,000 $2,500,000 $3,000,000 $3,500,000 $4,000,000 $4,500,000
Bachelor’s
Associate’s
Lifetime Earnings
$0
Lifetime Earnings
$1,000,000 $2,000,000 $3,000,000 $4,000,000
Professional
Doctoral
Master’s
Bachelor’s
Associate’s
Some College/No Degree
High SchoolDiploma
Less thanHigh School
Other
Asian
Latino
African-American
White
Rule No.4 Race/ethnicity and gender are wild cards that can trump everything else in determining earnings.
Figure 4: Women make less than men at every level of educational attainment.
Figure 5: African-Americans and Latinos lag behind Whites and Asians at all levels of educational attainment.
7
65097_Summary.indd 9 7/13/11 8:00 PM
Keeping these rules in mind will help readers as they delve deeper into The College Payoff, and start to make sense of the game of education and earnings that plays such a pivotal role in the U.S. economy — and the lives of American workers.
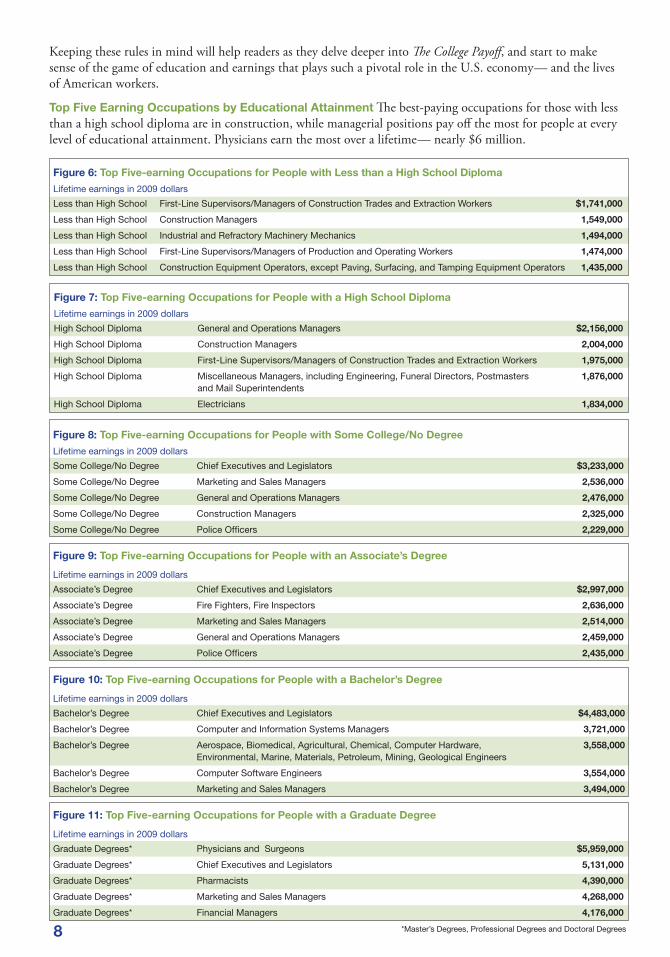
Top Five Earning Occupations by Educational Attainment The best-paying occupations for those with less than a high school diploma are in construction, while managerial positions pay off the most for people at every level of educational attainment. Physicians earn the most over a lifetime — nearly $6 million.
Figure 6: Top Five-earning Occupations for People with Less than a High School Diploma
Lifetime earnings in 2009 dollars Less than High School First-Line Supervisors/Managers of Construction Trades and Extraction Workers $1,741,000
Less than High School Construction Managers 1,549,000
Less than High School Industrial and Refractory Machinery Mechanics 1,494,000
Less than High School First-Line Supervisors/Managers of Production and Operating Workers 1,474,000
Less than High School Construction Equipment Operators, except Paving, Surfacing, and Tamping Equipment Operators 1,435,000
Figure 7: Top Five-earning Occupations for People with a High School Diploma
Lifetime earnings in 2009 dollars High School Diploma General and Operations Managers $2,156,000
High School Diploma Construction Managers 2,004,000
High School Diploma First-Line Supervisors/Managers of Construction Trades and Extraction Workers 1,975,000
High School Diploma Miscellaneous Managers, including Engineering, Funeral Directors, Postmasters 1,876,000 and Mail Superintendents
High School Diploma Electricians 1,834,000
Figure 8: Top Five-earning Occupations for People with Some College/No Degree
Lifetime earnings in 2009 dollars
Some College/No Degree Chief Executives and Legislators $3,233,000
Some College/No Degree Marketing and Sales Managers 2,536,000
Some College/No Degree General and Operations Managers 2,476,000
Some College/No Degree Construction Managers 2,325,000
Some College/No Degree Police Officers 2,229,000
Figure 9: Top Five-earning Occupations for People with an Associate’s Degree
Lifetime earnings in 2009 dollars Associate’s Degree Chief Executives and Legislators $2,997,000
Associate’s Degree Fire Fighters, Fire Inspectors 2,636,000
Associate’s Degree Marketing and Sales Managers 2,514,000
Associate’s Degree General and Operations Managers 2,459,000
Associate’s Degree Police Officers 2,435,000
Figure 11: Top Five-earning Occupations for People with a Graduate Degree
Lifetime earnings in 2009 dollars
Graduate Degrees* Physicians and Surgeons $5,959,000
Graduate Degrees* Chief Executives and Legislators 5,131,000
Graduate Degrees* Pharmacists 4,390,000
Graduate Degrees* Marketing and Sales Managers 4,268,000
Graduate Degrees* Financial Managers 4,176,000
*Master’s Degrees, Professional Degrees and Doctoral Degrees
Figure 10: Top Five-earning Occupations for People with a Bachelor’s Degree
Lifetime earnings in 2009 dollars Bachelor’s Degree Chief Executives and Legislators $4,483,000
Bachelor’s Degree Computer and Information Systems Managers 3,721,000
Bachelor’s Degree Aerospace, Biomedical, Agricultural, Chemical, Computer Hardware, 3,558,000 Environmental, Marine, Materials, Petroleum, Mining, Geological Engineers
Bachelor’s Degree Computer Software Engineers 3,554,000
Bachelor’s Degree Marketing and Sales Managers 3,494,000
8
65097_Summary_X.indd 10 7/15/11 6:43 PM

Figure 12: Bottom Five-earning Occupations for People with Less than a High School Diploma
Lifetime earnings in 2009 dollars Less than High School Maids and Housekeeping Cleaners $663,000
Less than High School Personal and Home Care Aides 678,000
Less than High School Sewing Machine Operators 692,000
Less than High School Food Preparation Workers 709,000
Less than High School Cashiers 713,000
Figure 13: Bottom Five-earning Occupations for People with a High School Diploma
Lifetime earnings in 2009 dollars
High School Diploma Barbers, Hairdressers, Hairstylists, and Cosmetologists $592,000
High School Diploma Maids and Housekeeping Cleaners 727,000
High School Diploma Hosts and Hostesses, Restaurant, Lounge, and Coffee Shop, Waiters and Waitresses 775,000
High School Diploma Personal and Home Care Aides 786,000
High School Diploma Cooks 789,000
Figure 14: Bottom Five-earning Occupations for People with Some College/No Degree
Lifetime earnings in 2009 dollars
Some College/No Degree Barbers, Hairdressers, Hairstylists, and Cosmetologists $485,000
Some College/No Degree Teacher Assistants 752,000
Some College/No Degree Cashiers 919,000
Some College/No Degree Nursing, Psychiatric, and Home Health Aides 1,030,000
Some College/No Degree Real Estate Brokers and Sales Agents 1,070,000
Figure 17: Bottom Five-earning Occupations for People with a Graduate Degree
Lifetime earnings in 2009 dollars
Graduate Degrees* Secretaries and Administrative Assistants $1,597,000
Graduate Degrees* Clergy 1,799,000
Graduate Degrees* Retail Salespersons 1,885,000
Graduate Degrees* Counselors 1,955,000
Graduate Degrees* First-Line Supervisors/Managers of Retail Sales Workers 1,970,000
*Master’s Degrees, Professional Degrees and Doctoral Degrees
Figure 15: Bottom Five-earning Occupations for People with an Associate’s Degree Lifetime earnings in 2009 dollars
Associate’s Degree Teacher Assistants $782,000
Associate’s Degree Cashiers 899,000
Associate’s Degree Nursing, Psychiatric, and Home Health Aides 1,101,000
Associate’s Degree Receptionists and Information Clerks 1,117,000
Associate’s Degree Janitors and Building Cleaners 1,179,000
Figure 16: Bottom Five-earning Occupations for People with a Bachelor’s Degree
Lifetime earnings in 2009 dollars Bachelor’s Degree Real Estate Brokers and Sales Agents $1,477,000
Bachelor’s Degree Bookkeeping, Accounting, and Auditing Clerks 1,481,000
Bachelor’s Degree Secretaries and Administrative Assistants 1,520,000
Bachelor’s Degree Counselors 1,521,000
Bachelor’s Degree Social Workers 1,571,000
Bottom Five Earning Occupations by Educational Attainment at the high school or below level, the lowest-earning occupations are in food and personal services. at all levels of educational attainment, however, those who make a career out of helping others earn very little financial reward.
9
65097_Summary.indd 11 7/13/11 8:00 PM

Education, Occupations, Lifetime Earnings
The College PayoffE x E C u t i v E s u m m a r y
3300 Whitehaven Street, NW, Suite 5000 Washington, DC 20007
Mail: Campus Box 571444, Washington, DC 20057
cew.georgetown.edu
The College Payoff is comprised of an executive summary and a full report. Both can be accessed online at
cew.georgetown.edu/collegepayoff
65097_Summary.indd 12 7/13/11 8:00 PM