the complement of the absorbed light gets transmitted. the ......©gary christian, analytical...
TRANSCRIPT

The complement of the absorbed light gets transmitted.
The color of an object we see is due to the wavelengths transmitted or reflected.
Other wavelengths are absorbed.
The more absorbed, the darker the color (the more concentrated the solution).
In spectrochemical methods, we measure the absorbed radiation.
©Gary Christian, Analytical Chemistry, 6th Ed. (Wiley)

Fig. 16.1. Wave motion of electromagnetic radiation.
The distance of one cycle is the wavelength (l).
The frequency (n) is the number of cycles passing a fixed point per unit time.
l = c/n (c = velocity of light, 3 x 1010 cm s-1).
The shorter the wavelength, the higher the energy: E = hn
This is why UV radiation from the sun burns you.
©Gary Christian, Analytical Chemistry, 6th Ed. (Wiley)

Visible
Fig. 16.2. Electromagnetic spectrum.
We see only a very small portion of the electromagnetic spectrum .
In spectrochemical methods, we measure the absorption of UV to far IR radiation.
UV = 200-380 nm
VIS = 280-780 nm
IR = 0.78 mm-300 mm
©Gary Christian, Analytical Chemistry, 6th Ed. (Wiley)
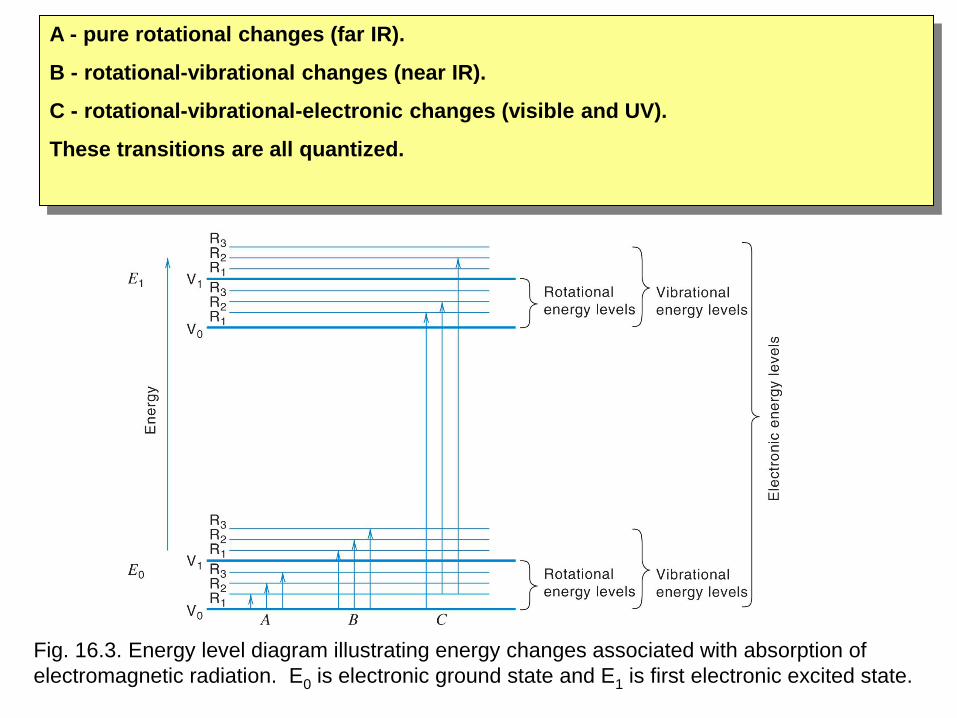
Fig. 16.3. Energy level diagram illustrating energy changes associated with absorption of
electromagnetic radiation. E0 is electronic ground state and E1 is first electronic excited state.
A - pure rotational changes (far IR).
B - rotational-vibrational changes (near IR).
C - rotational-vibrational-electronic changes (visible and UV).
These transitions are all quantized.

Fig. 16.4. Typical infrared spectra.
The peaks are associated with vibrational modes within the molecule.
(More in Fig. 16.8 on types of bonds that give peaks.)
©Gary Christian,
Analytical Chemistry,
6th Ed. (Wiley)

Fig. 16.5. Typical visible absorption spectrum. 1, Sample; 2, blank.
Electronic transitions (at higher energy – shorter wavelengths) are superimposed on
rotational and vibrational trasitions.
These many discrete transitions result in a broad band of unresolved fine structure.
p (double or triple bonds) and n (outer shell) electrons are responsible for most UV and
Vis electronic transitions.
©Gary Christian, Analytical Chemistry, 6th Ed. (Wiley)

Fig. 16.6. Typical ultraviolet spectrum.
These are similar in structure to visible spectra.
©Gary Christian, Analytical Chemistry, 6th Ed. (Wiley)

These groups absorb in the UV or visible regions.
©Gary Christian,
Analytical Chemistry,
6th Ed. (Wiley)

Fig. 16.7. Ultraviolet spectrum of benzene.
Aromatic compounds are good absorbers of UV radiation.
©Gary Christian,
Analytical Chemistry,
6th Ed. (Wiley)

Fig. 16.8. Simple correlation of group vibrations to regions of
infrared absorption.
Absorption in the 6- to 15-mm region is very dependent on the molecular environment.
This is called the fingerprint region.
©Gary Christian, Analytical Chemistry, 6th Ed. (Wiley)