the iem pilot speech database - kug · this document is as well a technical report as a short...
TRANSCRIPT

IEM Report 45/11
The IEM Pilot Speech Database
On the Creation of a
Author Johannes Luig
Project Manager Alois Sontacchi
Cooperation Partner EUROCONTROL Experim
IEM Pilot Speech Database
of a Speech Database for Stress Monitoring
EUROCONTROL Experimental Centre, Brétigny-sur-Orge,
December, 2011
Institut für Elektronische Musik und Akustik
Inffeldgasse 10/3, A-8010 GrazTel.: +43 316 389-3170
Web: http://iem.at/ Mail: [email protected]
IEM Pilot Speech Database
onitoring
Orge, France
December, 2011
Institut für Elektronische Musik und Akustik
8010 Graz3170
Web: http://iem.at/Mail: [email protected]

IEM Report 45/11: The IEM Pilot Speech Database Page 2
Zusammenfassung
Der IEM-Report 45/11 beschreibt die Konzeption und die Erstellung der IEM Pilot Speech Database. Diese Sprachdatenbank bildet eine wichtige Grundlage zur Untersuchung der Zusammenhänge von Sprache und kognitivem Stress im Bereich „Flugsicherung“. Die Datenbank enthält mehr als 7.000 einzelne Äußerungen (über 7 Stunden reine Aufnahmezeit) von Linienpiloten, die ein anspruchsvolles Flugprogramm in einem Flugsimulator absolvieren. Zusätzlich wurde die Herzrate der Piloten als physiologische Referenz für das Stresslevel aufgezeichnet. Dieses Dokument wurde auf Englisch verfasst und soll sowohl technischer Report, als auch eine kurze Einführung in den Umgang mit der Datenbank sein. Die Datenbankerstellung wurde von der Europäischen Organisation für Sicherheit in der Luftfahrt (EUROCONTROL) unter dem Schema Graz/08-120918-C unterstützt.
Abstract
The IEM Pilot Speech Database has been created to provide a valid basis for research on the relationship between cognitive stress and speech in the specific area of air traffic control. It provides more than 7,000 speech samples with a net length of over 7 hours, which have been recorded during the completion of demanding flight simulator scenarios, along with physiological reference data from heart rate measurements. This document is as well a technical report as a short tutorial on the database itself and how to use it for scientific research. The creation of this database was kindly supported by a Research Grant from the European Organization for the Safety of Air Navigation (EUROCONTROL) under Scheme Graz/08-120918-C.
IEM Report 45/11: The IEM Pilot Speech Database Page 3
Contents Quick Start Guide ............................................................................................. 4
Database Structure and Organization ......................................................................... 4 Navigating Through the Database .............................................................................. 5
Background ...................................................................................................... 6
A Short Introduction .................................................................................................. 6 Why another speech database? ................................................................................... 6
Database Creation ............................................................................................ 8
The Concept .............................................................................................................. 8 Recording Environment .............................................................................................. 8 Test Subjects ............................................................................................................. 9 Recording Setup ........................................................................................................ 9 Sound Quality .......................................................................................................... 11 Training Program .................................................................................................... 11 Physiological Recordings .......................................................................................... 12 Subjective Mood Evaluation ..................................................................................... 14
Time Grids ..................................................................................................... 15
Physiological Parameters ................................................................................. 16
Data Analysis .......................................................................................................... 16 Results: Heart Rate .................................................................................................. 17 Results: Heart Rate Variability (HRV) and Derived Parameters ................................. 19
References ...................................................................................................... 20
IEM Report 45/11: The IEM Pilot Speech Database
Figure
Quick Start Guide
Database Structure and Organization
The database consists of eight directories (one per speaker), content. As sketched in Fig. 1
chunk. Each text file provides physiological reference data, that is, the speaker’s heart rate (equally sampled in intervals of 250 ms) and derived parameters (averaged over 5minute time windows). Finally, the WAV directory contains the speech data in Windows Wa44.1 kHz). Alongside these four directories, three text filesdirectories (Fig. 2). These are:
(a) The MDMQ questionnaire results. Note that the German abbreviation “(Mehrdimensionaler Befindlichkeit
(b) A PhysStats text file, providing statistical information on the physiological parameters, including
� Result of Shapiro� Minimum and maximum values (� Mean value and stand� Median and 25%/75% quartile values (
(c) A SpeechStats text file, providing information on the number of speech files as well as total session time and net speech time.
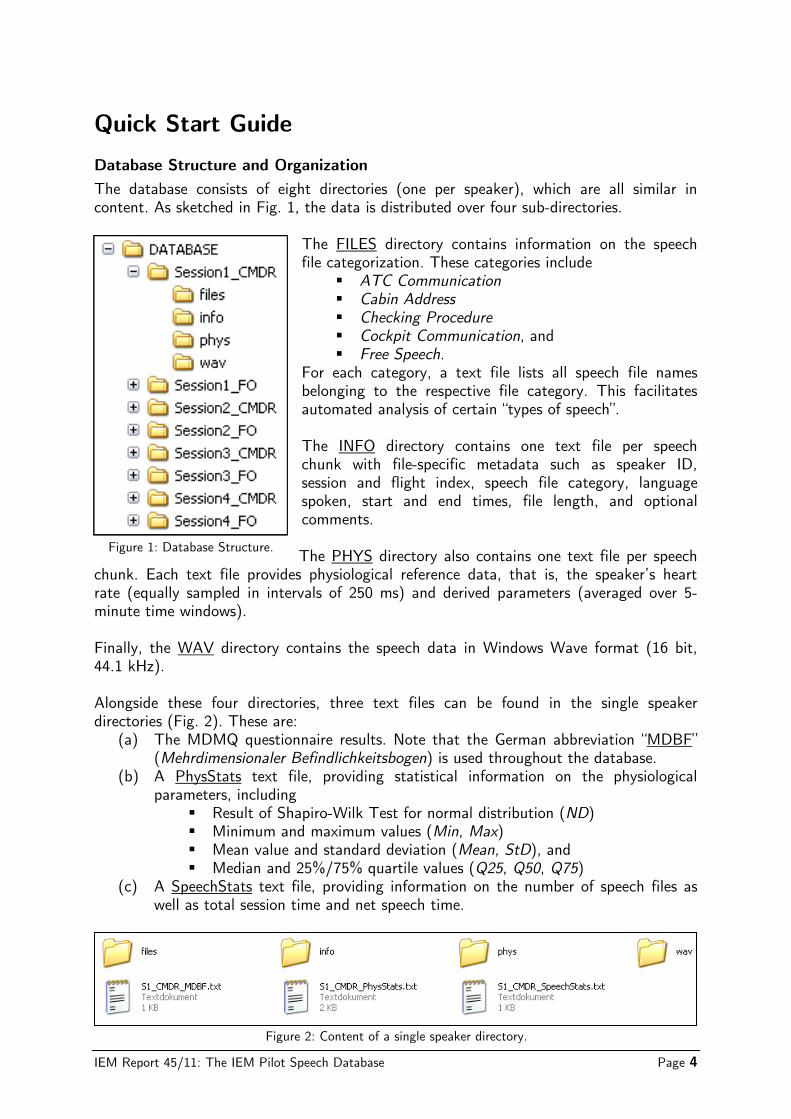
Figure 1: Database Structure.
The IEM Pilot Speech Database
Figure 2: Content of a single speaker directory.
Quick Start Guide
Database Structure and Organization
The database consists of eight directories (one per speaker), which are all similar in in Fig. 1, the data is distributed over four sub-directories.
The FILES directory contains information on the speech file categorization. These categories include
� ATC Communication � Cabin Address � Checking Procedure � Cockpit Communication, and � Free Speech.
For each category, a text file lists all belonging to the respective file category. This facilitates automated analysis of certain “types of speech”. The INFO directory contains one text filechunk with file-specific metadata such as speaker ID, session and flight index, speech file category, language spoken, start and end times, file length, and optional comments. The PHYS directory also contains one text file per speech
ach text file provides physiological reference data, that is, the speaker’s heart rate (equally sampled in intervals of 250 ms) and derived parameters (averaged over 5
directory contains the speech data in Windows Wa
Alongside these four directories, three text files can be found in the single speaker . These are:
The MDMQ questionnaire results. Note that the German abbreviation “Mehrdimensionaler Befindlichkeitsbogen) is used throughout the database.
text file, providing statistical information on the physiological parameters, including
Shapiro-Wilk Test for normal distribution (NDMinimum and maximum values (Min, Max) Mean value and standard deviation (Mean, StD), and Median and 25%/75% quartile values (Q25, Q50, Q75
text file, providing information on the number of speech files as well as total session time and net speech time.
Page 4
which are all similar in directories.
information on the speech file categorization. These categories include
For each category, a text file lists all speech file names belonging to the respective file category. This facilitates automated analysis of certain “types of speech”.
directory contains one text file per speech specific metadata such as speaker ID,
session and flight index, speech file category, language spoken, start and end times, file length, and optional
directory also contains one text file per speech ach text file provides physiological reference data, that is, the speaker’s heart
rate (equally sampled in intervals of 250 ms) and derived parameters (averaged over 5-
directory contains the speech data in Windows Wave format (16 bit,
can be found in the single speaker
The MDMQ questionnaire results. Note that the German abbreviation “MDBF” ) is used throughout the database.
text file, providing statistical information on the physiological
ND)
Q75)
text file, providing information on the number of speech files as

IEM Report 45/11: The IEM Pilot Speech Database Page 5
Navigating Through the Database
The continuous “voice stream” recorded over the whole recording session has been segmented into single utterances. The naming convention is as follows: file names indicate the respective session, flight, and the speaker’s function (Commander vs. First Officer) plus an additional index number. For example, the file S1F2_CMDR_459.wav in the WAV directory was recorded in session 1 during the performance of flight no. 2; the speaker is the commander of this flight and the speech chunk index is 459 (out of 919, in this case). As already mentioned, the INFO and PHYS directories each contain a corresponding text file for this speech chunk. These metadata files both are named S1F2_CMDR_459.txt and are exemplarily shown in Fig. 3 and 4, respectively.
// Metadata for Audio Chunk S1F2_CMDR_459.WAV
// Part of IEM Pilot Speech Database
// Created on 07-Mar-2011 10:57:19
Session: 1
Flight: 2
Pilot: CMDR
Type: Checking Procedure
Language: English
Start: 1:35:03 h
End: 1:35:03 h
Length: 1.20 s
Comment:
// Physiological Parameters for Audio Chunk S1F2_CMDR_459.WAV
// Part of IEM Pilot Speech Database
// Created on 17-Jun-2011 13:09:39
// Heart Rate
Time [s] HR [bpm]
5703.15 63.76
5703.40 64.55
5703.65 65.31
5703.90 66.03
5704.15 66.71
// Derived Parameters (5 min. Time Window)
RR: 870.5 ms
logRSArr: 1.31571 ms
SDNN: 119.295 ms
QPArsa: 6.17461
lnVLFrr: 8.82767 ms^2
lnLFrr: 8.34113 ms^2
lnHFrr: 6.86744 ms^2
VQrr: 1.47368
pp8: 2.44478
Figure 3: Example for a metadata file from the INFO sub-directory.
Figure 4: Example for a metadata file from the PHYS sub-directory.

IEM Report 45/11: The IEM Pilot Speech Database Page 6
Background
A Short Introduction
Human factors in Air Traffic Control (ATC) are often referred to as being the bottleneck in a highly automated environment. Since safety is of the essence, decision-making and reasoning have not yet been trusted solely to a computer algorithm. At the same time, an individual’s response capacity is limited and dependent on a variety of environmental factors. A high level of safety can only be ensured if a low error rate of both air traffic control operators (ATCOs) and pilots is guaranteed. This is important, since the implementation of a monitoring system that evaluates stress will predict fatigue, leading to immediate intervention by monitors. In this way, catastrophes can be avoided. For monitoring purposes, the human voice is a promising signal source for several reasons. First, it can be captured in a non-intrusive way, as the communication channel already exists. Second, it produces a complex signal which carries a multitude of information, so a variety of different features can be extracted. Third, stress is a manifold phenomenon, so it is likely that different kinds and qualities of stress will be reflected in different features of the speech signal. Provided that correlations between certain value regions of speech features and manifestations of stress can be made reliably, a monitoring system based on speech analysis will fulfill the two most important selection criteria of a measurement technique; limited intrusiveness and global sensitivity [1].
Why another speech database?
For the evaluation of such a stress monitoring system, speech data is needed which (a) is ATC-specific, and (b) provides reliable additional indicators of the speaker’s actual stress level as a reference. Unfortunately, none such databases have been available so far. A high-quality database of speech under stress has to meet three main requirements: scope, naturalness, and context [3]. 1) Scope: Scope refers to the number of speakers as well as to the number of different stress types, the number of tokens per stress type, and the gender of speakers. Age, professional experience and native language contribute as well. In most cases, available speech databases aspire to the ideal of covering the whole domain of emotions and stress, rather than focusing on a specific sub-domain. This leads to a natural complexity which is out of all proportion to the number of speakers featured. 2) Naturalness: The majority of available speech data has not been recorded in real-life situations [3], [4]. Although acted emotional speech can be reliably classified by listeners, there are still systematic differences between acted and natural emotional speech. Acted speech is often read instead of being spoken freely, which introduces distinctive “reading characteristics” [5]. Besides, inter-personal effects are not represented in acted speech, as it is often produced in non-interactive monologues [3].

IEM Report 45/11: The IEM Pilot Speech Database Page 7
3) Context: Sample length is a crucial parameter for the applicability of speech features [2]. Especially the widely-used SUSAS database1 [6] is limited to single-word utterances; which is a very strong constraint, since “the way we say something” can hardly be recorded without any context. Potential features including prosodic parameters as speech melody (which is more than just the fundamental frequency) or speech rhythm imply a certain amount of context and thus may not be investigated due to limitations introduced by the data itself. The above-mentioned limitations of available speech databases necessitate the creation of specific databases for both air traffic control operators and pilots, which
(a) contain “spontaneous”, i.e., unprompted speech; (b) have been recorded in a realistic environment and during the completion of
demanding tasks; and (c) provide reliable additional indicators of stress as a reference.
The IEM Pilot Speech Database meets all these demands by providing recorded speech data as well as corresponding heart rate measurements and evaluated mood questionnaire results.
1 This acronym stands for “Speech Under Simulated and Actual Stress”.

IEM Report 45/11: The IEM Pilot Speech Database Page 8
Database Creation
The Concept
Presence of stress is reflected in physiological and in speech signal parameters. This allows us to scan, for example, the test subject’s heart rate for changes and to check selected speech features for similar behavior. The experimental setup is aimed at exposing the pilots to a defined demand at a certain point in time. The training program was designed by professional flight instructors, who graded the expected quality and level of stress by experience. During the experiments, the pilots were monitored by a mobile device; this data was afterwards synchronized in time with the recorded speech. The aim is to look for correlations between psycho-physiological parameters and extracted speech features in order to identify those features which indicate the presence of stress [7]. This approach is visualized in Fig. 5.
Figure 5: Speech data evaluation using physiological measures as a reference
(here for the case of an air traffic controller being monitored).
Recording Environment
The Fokker F70/100 series full flight simulator at Aviation Academy Austria (Fig. 6) is a glass cockpit simulator. All instruments and controls in the cockpit are original; the motion base system simulates real flight characteristics. The simulator is equipped with a high-quality vision and a 3-D sound system. All audio channels (headsets and push-to-talk devices in the cockpit, flight instructor’s voice) are digitally accessible in a server room outside the simulator, and can thus be captured in a completely “invisible” way. One thus may state that the recording environment chosen showed the highest degree of realism possible (with the exception of a real aircraft, of course).
IEM Report 45/11: The IEM Pilot Speech Database Page 9
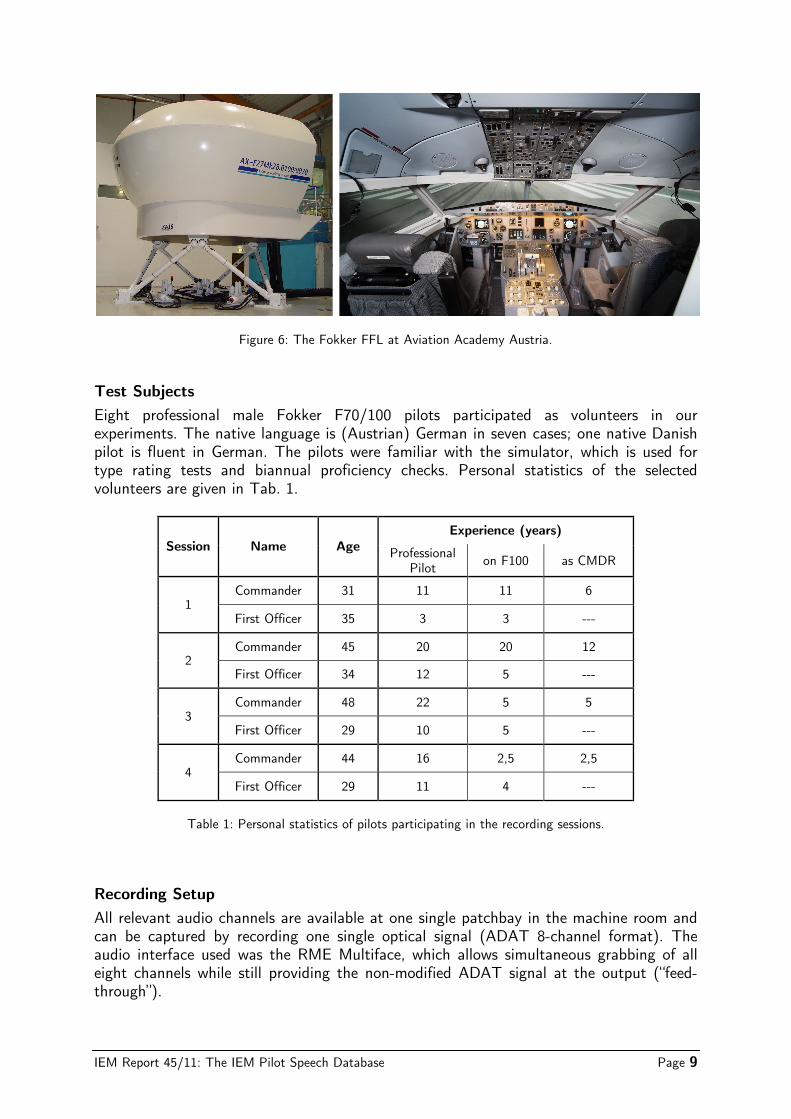
Figure 6: The Fokker FFL at Aviation Academy Austria.
Test Subjects
Eight professional male Fokker F70/100 pilots participated as volunteers in our experiments. The native language is (Austrian) German in seven cases; one native Danish pilot is fluent in German. The pilots were familiar with the simulator, which is used for type rating tests and biannual proficiency checks. Personal statistics of the selected volunteers are given in Tab. 1.
Session Name Age Experience (years)
Professional Pilot
on F100 as CMDR
1 Commander 31 11 11 6
First Officer 35 3 3 ---
2 Commander 45 20 20 12
First Officer 34 12 5 ---
3 Commander 48 22 5 5
First Officer 29 10 5 ---
4 Commander 44 16 2,5 2,5
First Officer 29 11 4 ---
Table 1: Personal statistics of pilots participating in the recording sessions.
Recording Setup
All relevant audio channels are available at one single patchbay in the machine room and can be captured by recording one single optical signal (ADAT 8-channel format). The audio interface used was the RME Multiface, which allows simultaneous grabbing of all eight channels while still providing the non-modified ADAT signal at the output (“feed-through”).

IEM Report 45/11: The IEM Pilot Speech Database
As sketched in Fig. 7, single channels were recorded using a mobile PC connected to the audio interface. In addition,received the summed channels from both
The graphical programming language PureData (pd) channels to hard disk and to create speech activity information data at the same time.
Figure 8: Screenshot of
The IEM Pilot Speech Database
, single channels were recorded using a mobile PC connected to the . In addition, a stereo recording device serving as a “backup recorder”
received the summed channels from both pilots, respectively.
Figure 7: Audio flow diagram.
The graphical programming language PureData (pd) was used to record all relevant channels to hard disk and to create speech activity information data at the same time.
Screenshot of the PureData patch for audio stream capturing.
Page 10
, single channels were recorded using a mobile PC connected to the serving as a “backup recorder”
was used to record all relevant channels to hard disk and to create speech activity information data at the same time.
the PureData patch for audio stream capturing.

IEM Report 45/11: The IEM Pilot Speech Database
The WAV file format does not allow file sizes greater than 2 GB, so that a new file had to be created each 100 minutes.
Figure 9: Speech data segmentation due to WAV file specifications
This task, visualized in Fig. 9 In the simulator machine room, incoming speech signals are prebefore being multiplexed into ADAT format. The ADAT signal is an optical signal transmitted via glass fiber. The recording devices logged on the simulator signal flow are thus able to feed the audio signal through without any loss of quality; that is, the signal is not altered in any way.
Sound Quality
The speech data were recorded in the standard, uncompressesampling rate of 44100 Hz and a resolution of 16 bit. The “perceived quality” of the speech recordings may, however, be lowered by the fact that the pilots spoke through standard headset microphones which they were allowed to adjust at artifacts thus include sound level variability and distortion of consonants (especially plosives as “p” and “t” or fricatives as “f” and “s”). There is audible crosstalk (speaker B recorded through speaker A’s microphone), but at a sufficiently lower level compared to the primary source (speaker A). Again, the main objective for creating this database was the maximum degree of reality rather than making studio-quality speech recordings.
Training Program
One single recording session consist“reference flight” (without additional challenge)for two reasons: first, from a psychological point of view, the pilots and acclimatized to the simulator again. Second, theythree main flight phases of interest; (a) takeoff and initial climb, (b) en route flight, and(c) approach and landing. The whole scenario subjects knew in advance that nothingflight. A strain trajectory was sketched by the instructors forIt visualizes the effective strain on the pilots as intended by the lesson plan; thatimetable of occurring events and malfunctions. For details, These four scenarios were implemented as a Lineis a “full mission” simulation
The IEM Pilot Speech Database
The WAV file format does not allow file sizes greater than 2 GB, so that a new file had to be created each 100 minutes.
Speech data segmentation due to WAV file specifications
9, was also controlled by the PureData patch.
In the simulator machine room, incoming speech signals are pre-amplified and compressed into ADAT format. The ADAT signal is an optical signal . The recording devices logged on the simulator signal flow are
thus able to feed the audio signal through without any loss of quality; that is, the signal
The speech data were recorded in the standard, uncompressed WAV format with a sampling rate of 44100 Hz and a resolution of 16 bit. The “perceived quality” of the speech recordings may, however, be lowered by the fact that the pilots spoke through standard headset microphones which they were allowed to adjust at
thus include sound level variability and distortion of consonants (especially plosives as “p” and “t” or fricatives as “f” and “s”).
There is audible crosstalk (speaker B recorded through speaker A’s microphone), but at a ly lower level compared to the primary source (speaker A). Again, the main
objective for creating this database was the maximum degree of reality rather than quality speech recordings.
recording session consisted of four different challenging scenarios plus one “reference flight” (without additional challenge) at the very beginning [8]
from a psychological point of view, the pilots hadsimulator again. Second, they provided reference values for the
interest; (a) takeoff and initial climb, (b) en route flight, and(c) approach and landing. The whole scenario took about 20 minutes, and the test
advance that nothing exceptional would be happening during this first
sketched by the instructors for each of the four “stress” scenarios. strain on the pilots as intended by the lesson plan; tha
events and malfunctions. For details, see Fig. 11
implemented as a Line-Oriented Flight Training (LOFT), which of scheduled flights. This includes a full cockpit preparation
Page 11
The WAV file format does not allow file sizes greater than 2 GB, so that a new file had
Speech data segmentation due to WAV file specifications.
, was also controlled by the PureData patch.
amplified and compressed into ADAT format. The ADAT signal is an optical signal . The recording devices logged on the simulator signal flow are
thus able to feed the audio signal through without any loss of quality; that is, the signal
d WAV format with a sampling rate of 44100 Hz and a resolution of 16 bit. The “perceived quality” of the speech recordings may, however, be lowered by the fact that the pilots spoke through standard headset microphones which they were allowed to adjust at will. Common
thus include sound level variability and distortion of consonants (especially
There is audible crosstalk (speaker B recorded through speaker A’s microphone), but at a ly lower level compared to the primary source (speaker A). Again, the main
objective for creating this database was the maximum degree of reality rather than
scenarios plus one [8]. This was done
had a warm-up flight reference values for the
interest; (a) takeoff and initial climb, (b) en route flight, and minutes, and the test
be happening during this first
each of the four “stress” scenarios. strain on the pilots as intended by the lesson plan; that is, the
(on page 12).
Flight Training (LOFT), which ll cockpit preparation

IEM Report 45/11: The IEM Pilot Speech Database
during the first scenario (“first flight of the day”), as well ascrew communication during the flight.ensured that the test subjects had a sufficient amoufollowing four flights were simulated in one
(a) from a temporal point of view; i.e., there are for a short break to fill out the MDMQ
(b) from a local point of view; meat which the previous one ended.
Physiological Recordings
The test subjects’ beat-to-beat heart rate signal mobile measurement device, the can be derived from the recorded heartbeats, such as the breathing cyclepressure4. The information was stored on a flash card and analyzed offline.rate and speech data was marker button at the same time.
Figure
2 8 kHz sampling rate, 16 bit resolution.3 Heart rate increases during inhalation and decreases during exhalation.4 Low-frequency heart rate variation is ass
The IEM Pilot Speech Database
during the first scenario (“first flight of the day”), as well as intensive ATC and cabin crew communication during the flight. A five-minute rest period after the reference flight
that the test subjects had a sufficient amount of time to simulated in one stretch:
from a temporal point of view; i.e., there are were pauses infor a short break to fill out the MDMQ questionnaires); and from a local point of view; meaning that a scenario started at the same airport at which the previous one ended.
beat heart rate signal was recorded with a highe measurement device, the HeartMan (Fig. 10). A variety of additional parameters
from the recorded heartbeats, such as the breathing cycle
stored on a flash card and analyzed offline. Synchronization of heart achieved by setting an “acoustical marker”
button at the same time.
Figure 10: The HeartMan measurement device.
8 kHz sampling rate, 16 bit resolution. Heart rate increases during inhalation and decreases during exhalation.
frequency heart rate variation is associated with the Mayer waves of blood pressure
Page 12
intensive ATC and cabin minute rest period after the reference flight
fully recover. The
pauses in between (except at the same airport
with a high-precision2 of additional parameters
from the recorded heartbeats, such as the breathing cycle3 or arterial blood
ynchronization of heart etting an “acoustical marker” and pushing a
blood pressure.

IEM Report 45/11: The IEM Pilot Speech Database
Figure 11: Strain trajectories for ea
The IEM Pilot Speech Database
Strain trajectories for each of the four stress sessions.
Page 13
ch of the four stress sessions.

IEM Report 45/11: The IEM Pilot Speech Database Page 14
Subjective Mood Evaluation
In addition to the physiological measures, the German version of the Multidimensional Mood State Questionnaire (MDMQ) [9] was employed to assess the current mood. The MDMQ contains 24 items in three dimensions – good/bad, awake/tired, and calm/nervous – which can be evaluated using a simple coding scheme. This questionnaire asks the test subjects to complete the sentence Right now, I feel... using a five-point scale from 1 (“definitely not”) to 5 (“very much”). An example is shown in Fig. 12.
Im Moment fühle ich mich…
1. zufrieden [ 1 ] --- [ 2 ] --- [ 3 ] --- [ 4 ] --- [ 5 ]
2. ausgeruht [ 1 ] --- [ 2 ] --- [ 3 ] --- [ 4 ] --- [ 5 ]
3. ruhelos [ 1 ] --- [ 2 ] --- [ 3 ] --- [ 4 ] --- [ 5 ]
4. schlecht [ 1 ] --- [ 2 ] --- [ 3 ] --- [ 4 ] --- [ 5 ]
5. schlapp [ 1 ] --- [ 2 ] --- [ 3 ] --- [ 4 ] --- [ 5 ]
6. gelassen [ 1 ] --- [ 2 ] --- [ 3 ] --- [ 4 ] --- [ 5 ]
7. müde [ 1 ] --- [ 2 ] --- [ 3 ] --- [ 4 ] --- [ 5 ]
8. gut [ 1 ] --- [ 2 ] --- [ 3 ] --- [ 4 ] --- [ 5 ]
9. unruhig [ 1 ] --- [ 2 ] --- [ 3 ] --- [ 4 ] --- [ 5 ]
10. munter [ 1 ] --- [ 2 ] --- [ 3 ] --- [ 4 ] --- [ 5 ]
11. unwohl [ 1 ] --- [ 2 ] --- [ 3 ] --- [ 4 ] --- [ 5 ]
12. entspannt [ 1 ] --- [ 2 ] --- [ 3 ] --- [ 4 ] --- [ 5 ]
13. schläfrig [ 1 ] --- [ 2 ] --- [ 3 ] --- [ 4 ] --- [ 5 ]
14. wohl [ 1 ] --- [ 2 ] --- [ 3 ] --- [ 4 ] --- [ 5 ]
15. ausgeglichen [ 1 ] --- [ 2 ] --- [ 3 ] --- [ 4 ] --- [ 5 ]
16. unglücklich [ 1 ] --- [ 2 ] --- [ 3 ] --- [ 4 ] --- [ 5 ]
17. wach [ 1 ] --- [ 2 ] --- [ 3 ] --- [ 4 ] --- [ 5 ]
18. unzufrieden [ 1 ] --- [ 2 ] --- [ 3 ] --- [ 4 ] --- [ 5 ]
19. angespannt [ 1 ] --- [ 2 ] --- [ 3 ] --- [ 4 ] --- [ 5 ]
20. frisch [ 1 ] --- [ 2 ] --- [ 3 ] --- [ 4 ] --- [ 5 ]
21. glücklich [ 1 ] --- [ 2 ] --- [ 3 ] --- [ 4 ] --- [ 5 ]
22. nervös [ 1 ] --- [ 2 ] --- [ 3 ] --- [ 4 ] --- [ 5 ]
23. ermattet [ 1 ] --- [ 2 ] --- [ 3 ] --- [ 4 ] --- [ 5 ]
24. ruhig [ 1 ] --- [ 2 ] --- [ 3 ] --- [ 4 ] --- [ 5 ]
Figure 12: The German Mehrdimensionaler Befindlichkeitsbogen.
überhaupt nicht
sehr

IEM Report 45/11: The IEM Pilot Speech Database Page 15
Time Grids To ensure the highest possible degree of realism, the pilots were completely free in their course of action. As a consequence, the “unexpected” events and malfunctions occurred at different points in time (relative to the session start time), as they were triggered by a supervisor sitting in the back of the cockpit. Tab. 2 lists all times of relevant events (which are also marked in Fig. 11).
Event Session 1 Session 2 Session 3 Session 4
Reference Flight Start 0:00:00 0:00:00 0:00:00 0:00:00
Takeoff 0:00:38 0:05:31 0:01:36 0:00:25
Landing 0:12:37 0:19:01 0:17:01 0:13:07
Reference Flight End 0:14:02 0:19:57 0:18:34 0:13:42
Flight #1 Start 0:25:56 0:24:35 0:24:20 0:18:51
APU fails 0:34:57 0:37:11 0:31:21 0:32:52
Runway change during taxi 0:43:57 0:55:11 0:45:01 0:46:00
Engine 2 hot start trial 0:45:07 0:56:21 0:52:16 0:56:05
Takeoff 0:53:57 1:07:51 0:58:26 1:03:15
TCAS alert 0:58:07 1:14:56 1:04:58 1:08:01
Engine 1 flame out 0:59:37 1:16:04 1:06:01 1:10:38
Engine 1 restart fails 1:05:37 1:24:11 (no info) 1:17:05
Engine 2 fire 1:19:57 1:35:26 1:25:26 1:28:35
Landing 1:20:35 1:36:25 1:26:03 1:28:35
Stop on RWY, emergency evacuation 1:20:59 1:36:41 1:26:21 1:29:30
Flight #1 End 1:22:06 1:38:10 1:28:04 1:30:58
Flight #2 Start 1:25:57 1:42:30 1:32:20 1:41:22
APU still inoperative 1:33:47 1:51:21 (no info) 1:47:15
Takeoff 1:36:57 1:58:01 1:44:31 1:52:22
NAV system failure 1:39:37 2:01:41 1:41:01 1:53:25
Engine 1 seizure 1:41:17 2:01:21 1:47:16 1:54:30
Generator 2 failure 1:50:57 2:07:54 1:52:01 1:57:45
Landing, gear collapse 2:04:17 2:29:05 2:06:28 2:21:00
Stop on RWY, emergency evacuation 2:04:44 2:29:30 2:06:53 2:22:20
Flight #2 End 2:05:48 2:30:40 2:08:45 2:23:17
Flight #3 Start 2:09:42 2:33:21 2:16:16 2:29:14
Takeoff 2:16:27 2:45:46 2:20:46 2:36:30
Engine 1 flame out, takeoff abortion 2:16:46 2:46:16 2:21:15 2:36:56
Engine 1 fire 2:19:36 2:48:55 2:22:23 2:38:09
Emergency evacuation 2:21:07 2:49:41 2:22:23 2:38:37
Flight #3 End 2:22:10 2:51:06 2:23:44 2:39:39
Flight #4 Start 2:24:57 2:54:24 2:25:53 2:41:15
Takeoff 2:41:37 3:08:01 2:37:46 2:55:37
Engine flame out 2:42:07 3:08:45 2:38:19 2:57:25
Landing 3:12:37 3:30:09 3:04:34 3:17:50
Flight #4 End 3:21:54 3:31:37 3:05:21 3:18:37
Table 2: Times of relevant events for all recording sessions (cp. Fig. 11).

IEM Report 45/11: The IEM Pilot Speech Database Page 16
Physiological Parameters
Data Analysis
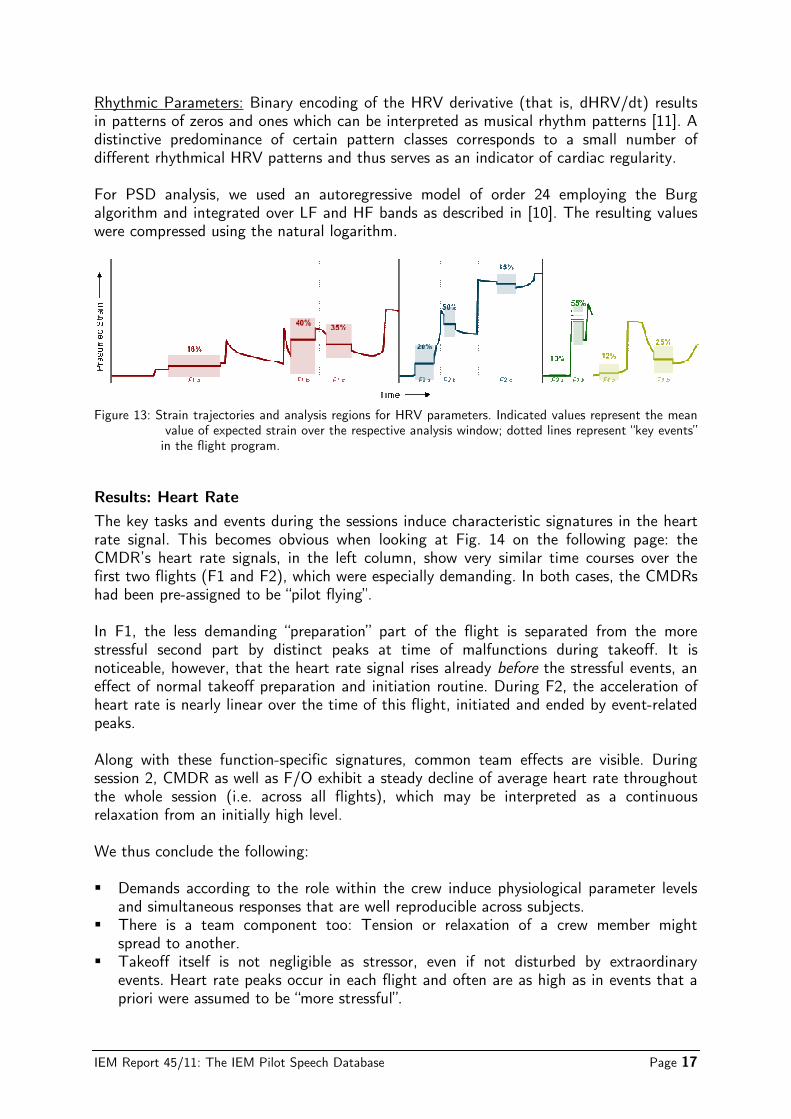
The raw data obtained by the HeartMan measurement device have been pre-processed and analyzed by professional physiologists5. Pre-processing steps include outlier detection and correction, and data re-sampling on a regular time grid. As an indicator for the significance of the recorded heart rate signals, the reproducibility of event responses across subjects was evaluated as well as characteristic heart rate profiles for Commanders (CMDR) and First Officers (F/O)6, and team effects between crew members. While heart rate itself is a good indicator of how an individual reacts to a certain event in time, heart rate variability (HRV) parameters are more meaningful as measures of autonomic balance, in the sense of an indicator for stress and tension. HRV parameters, however, must be averaged over time windows of a certain length to achieve wide-sense stationarity. For spectral HRV components, window lengths of 2-5 minutes are common [10], which is a very long time compared to common analysis window lengths in speech processing (where we have several hundreds of milliseconds). This poor temporal resolution prevents us from simply “mapping” the values of a certain parameter to some level of cognitive stress. To get a first impression of how well different HRV parameters may correlate with the intended strain trajectories as sketched by the instructors (Fig. 11), a fairly stationary part of the signal between consecutive “key events” was chosen by hand, as visualized in Fig. 13. The following HRV parameters were calculated as potential indicators of cognitive stress. Variance Parameters: The standard deviation of normal-to-normal intervals over 5 minutes of artifact-adjusted RR interval sequences (SDNN) is a widely-used statistical variability measure. RSA-Derived Parameters: The heart rate increases during inspiration and decreases during expiration. This respiratory sinus arrhythmia (RSA) facilitates the recording of respiratory rate from the HRV signal and the calculation of several physiologically meaningful parameters such as the respiratory rate itself, the degree of modulation, and the pulse/respiration ratio. Spectral Parameters: Power spectral density (PSD) analysis reveals how the variability in heart rate is distributed over frequency. Two characteristic frequency bands are analyzed in order to measure the balance between the sympathetic and the parasympathetic nervous system, the low-frequency band (LF, [0.04 .. 0.15 Hz]) and the high-frequency band (HF, [0.15 .. 0.4 Hz]). The LF/HF ratio is a measure for the vegetative activation level.
5 Data analysis was performed by HUMAN RESEARCH Institute, Weiz, Austria (www.humanresearch.at). 6 “CMDR vs. F/O” equals, in this case, “pilot flying vs. pilot non-flying” for single flights.
IEM Report 45/11: The IEM Pilot Speech Database
Rhythmic Parameters: Binary encoding oin patterns of zeros and ones which can be interpreted as musical rhythm patterns distinctive predominance of certain pattern classes corresponds to a small number of different rhythmical HRV patterns and thus serves as an indicator of cardiac regularity. For PSD analysis, we used an autoregressive model of order 24 employing the Burg algorithm and integrated over LF and HF bands as described were compressed using the natural logarithm.
Figure 13: Strain trajectories and analysis regions for HRV parameters. Indi value of expected strain over the respective analysis w in the flight program.
Results: Heart Rate
The key tasks and events during the rate signal. This becomes obvious when looking atCMDR’s heart rate signals, in the left column, show first two flights (F1 and F2), which were especially demandinghad been pre-assigned to be “pilot flying” In F1, the less demanding “preparatiostressful second part by distinct peaks at time of malfunctions during takeoff. It is noticeable, however, that the heart rate signal rises already effect of normal takeoff preparation and initiation routine. During F2, theart rate is nearly linear over the time of this flight, initiated anpeaks. Along with these function-specific signatures, common team effects are visible. During session 2, CMDR as well as F/O exhibit a steady decline of average heart rate throughout the whole session (i.e. across all flights), which may be interpreted as a continuous relaxation from an initially high level. We thus conclude the following: � Demands according to the role within the crew induce physiological parameter levels
and simultaneous responses that are well reproducible across subjects.� There is a team component too: Tension or relaxation of a crew member might
spread to another. � Takeoff itself is not negl
events. Heart rate peaks occur in each flight and often are as high as in events that a priori were assumed to be “more stressful”.
The IEM Pilot Speech Database
Binary encoding of the HRV derivative (that is, s which can be interpreted as musical rhythm patterns
distinctive predominance of certain pattern classes corresponds to a small number of different rhythmical HRV patterns and thus serves as an indicator of cardiac regularity.
For PSD analysis, we used an autoregressive model of order 24 employing the Burg algorithm and integrated over LF and HF bands as described in [10]. The resulting values were compressed using the natural logarithm.
and analysis regions for HRV parameters. Indicated values represent alue of expected strain over the respective analysis window; dotted lines represent
during the sessions induce characteristic signatureThis becomes obvious when looking at Fig. 14 on the following page
MDR’s heart rate signals, in the left column, show very similar time course, which were especially demanding. In both cases, the CMDRs
assigned to be “pilot flying”.
In F1, the less demanding “preparation” part of the flight is separated from the more stressful second part by distinct peaks at time of malfunctions during takeoff. It is noticeable, however, that the heart rate signal rises already before the stressful events, an
eparation and initiation routine. During F2, theart rate is nearly linear over the time of this flight, initiated and ended by event
specific signatures, common team effects are visible. During session 2, CMDR as well as F/O exhibit a steady decline of average heart rate throughout the whole session (i.e. across all flights), which may be interpreted as a continuous relaxation from an initially high level.
lowing:
Demands according to the role within the crew induce physiological parameter levels and simultaneous responses that are well reproducible across subjects.There is a team component too: Tension or relaxation of a crew member might
Takeoff itself is not negligible as stressor, even if not disturbed by extraordinary events. Heart rate peaks occur in each flight and often are as high as in events that a priori were assumed to be “more stressful”.
Page 17
f the HRV derivative (that is, dHRV/dt) results s which can be interpreted as musical rhythm patterns [11]. A
distinctive predominance of certain pattern classes corresponds to a small number of different rhythmical HRV patterns and thus serves as an indicator of cardiac regularity.
For PSD analysis, we used an autoregressive model of order 24 employing the Burg . The resulting values
cated values represent the mean
indow; dotted lines represent “key events”
signatures in the heart on the following page: the
very similar time courses over the . In both cases, the CMDRs
n” part of the flight is separated from the more stressful second part by distinct peaks at time of malfunctions during takeoff. It is
the stressful events, an eparation and initiation routine. During F2, the acceleration of
d ended by event-related
specific signatures, common team effects are visible. During session 2, CMDR as well as F/O exhibit a steady decline of average heart rate throughout the whole session (i.e. across all flights), which may be interpreted as a continuous
Demands according to the role within the crew induce physiological parameter levels and simultaneous responses that are well reproducible across subjects. There is a team component too: Tension or relaxation of a crew member might
as stressor, even if not disturbed by extraordinary events. Heart rate peaks occur in each flight and often are as high as in events that a

IEM Report 45/11: The IEM Pilot Speech Database Page 18
<<<
Figure 14
: Heart rate sign
als over tim
e (in second
s). Left colum
n: Com
man
ders. Right colum
n: First O
fficers. Single fligh
ts are m
arked by straigh
t lin
es.

IEM Report 45/11: The IEM Pilot Speech Database Page 19
Results: Heart Rate Variability (HRV) Parameters
Several HRV parameters as well suggest significance regarding cognitive stress and/or fatigue at first view. Fig. 15 exemplarily shows median values and total ranges of the parameters respiratory rate, pulse/respiration ratio, LF/HF ratio, and pattern predominance, respectively, for the four Commanders. As physiological parameters may depend on several factors, these values have been normalized to individual median values during a selected part of the reference flight F0.
Figure 15: Median values and total ranges of selected HRV parameters for Commanders, normalized to individual values during reference Flight F0. Analysis regions as indicated in Fig.13. Due to the small number of test persons, statistical descriptors such as inter-quartile ranges or confidence intervals are not appropriate. The aim here is to identify obvious trends with respect to the intended strain trajectories and to select promising parameters for further detailed evaluation. For the current HRV analysis, physiologists were asked to specify points in time between successive “key events” where wide-sense stationarity of the heart rate signal is given. From a physiological point of view, it is desirable to extend the analysis region as much as possible, whereas speech analysis requires high temporal resolution, as oversized analysis windows cause “smearing” of parameter values. As a consequence, future work will include event-based HRV parameter evaluation, using analysis windows with the shortest physiologically reasonable length.

IEM Report 45/11: The IEM Pilot Speech Database Page 20
References [1] W. Wierwille and F. Eggemeier, “Recommendations for mental workload measurement in a test and evaluation environment”, Human Factors, vol. 35, no. 2, pp. 263–281, 1993. [2] J. Luig, “Speech Features for Stress Recognition: Universal Applicability of State-of-the-Art Methods”, VDM Verlag, 2010. [3] E. Douglas-Cowie, N. Campbell, R. Cowie, and P. Roach, “Emotional speech: Towards a new generation of databases”, Speech Communication, Jan 2003. [4] D. Ververidis and C. Kotropoulos, “Emotional speech recognition: Resources, features, and methods”, Speech Communication, vol. 48, no. 9, pp. 1162–1181, Sep 2006. [5] C. Johns-Lewis, “Prosodic differentiation of discourse modes”, Intonation in discourse, pp. 199–220, 1986. [6] J. Hansen and S. Bou-Ghazale, “Getting started with SUSAS: A speech under simulated and actual stress database”, Fifth European Conference on Speech Communication and Technology (Eurospeech ’97), Jan 1997. [7] J. Luig and A. Sontacchi, “Workload Monitoring Through Speech Analysis: Towards a System for Air Traffic Control”, 27th Congress of The International Council of Aeronautical Sciences, 2010. [8] J. Luig, A. Sontacchi, N. Goswami, M. Moser and C. Shaw, “Conception and Realization of Speech Recordings for Instantaneous Stress Level Assessment”, 9th EUROCONTROL Innovative Research Workshop and Exhibition, 2010. [9] R. Steyer, P. Schwenkmezger, P. Notz, and M. Eid, „Der Mehrdimensionale Befindlichkeitsfragebogen“, Hogrefe, Verl. für Psychologie, 1997. [10] M. Malik, J. Bigger, A. Camm, R. Kleiger, A. Malliani, A. Moss and others, “Guidelines: Heart Rate Variability, Standards of measurement, physiological interpretation, and clinical use”, European Heart Journal 17, 354-381, 1996. [11] H. Bettermann, D. Amponsah, D. Cysarz, and P. Van Leeuwen. “Musical Rhythms In Heart Period Dynamics: A Cross-cultural And Interdisciplinary Approach To Cardiac Rhythms”, American Journal of Physiology-Heart and Circulatory Physiology, 277(5):H1762, 1999.