the illiterate of the 21st century will not be those who...
TRANSCRIPT

The illiterate of the 21st century will not be those who cannot read and write, but thosewho cannot learn, unlearn, and re-learn.
– Alvin Toffler

University of Alberta
The Baseline Approach to Agent Evaluation
by
Joshua Davidson
A thesis submitted to the Faculty of Graduate Studies and Researchin partial fulfillment of the requirements for the degree of
Master of Science
Department of Computing Science
c©Joshua DavidsonSpring 2014
Edmonton, Alberta
Permission is hereby granted to the University of Alberta Libraries to reproduce single copies ofthis thesis and to lend or sell such copies for private, scholarly or scientific research purposes only.
Where the thesis is converted to, or otherwise made available in digital form, the University ofAlberta will advise potential users of the thesis of these terms.
The author reserves all other publication and other rights in association with the copyright in thethesis, and except as herein before provided, neither the thesis nor any substantial portion thereofmay be printed or otherwise reproduced in any material form whatever without the author’s prior
written permission.

To KimMy co-author in life

Abstract
Efficient, unbiased estimation of agent performance is essential for drawing statistically sig-
nificant conclusions in multi-agent domains with high outcome variance. Naıve Monte Carlo
estimation is often insufficient, as it can require a prohibitive number of samples, especially
when evaluating slow-acting agents. Classical variance reduction techniques typically re-
quire careful encoding of domain knowledge or are intrinsically complex. In this work, we
introduce the baseline method of creating unbiased estimators for zero-sum, multi-agent
high-variance domains. We provide two examples of estimators created using this approach,
one that leverages computer agents in self-play, and another that utilizes existing player
data. We show empirically that these baseline estimators are competitive with state-of-
the-art techniques for efficient evaluation in variants of computer poker, a zero-sum domain
with notably high outcome variance. Additionally, we demonstrate how simple, yet effec-
tive, baseline estimators can be created and deployed in domains where efficient evaluation
techniques are currently non-existent.

Acknowledgements
First and foremost, I would like to thank my beautiful and loving wife Kim, whose support
throughout this academic pursuit has been unwavering and crucial. I could not have com-
pleted this work without her by my side. I also cannot thank my supervisors, Dr. Michael
Bowling and Dr. Christopher Archibald, enough for the profound influence they have had
on me over the last few years. Not only have they taught me how to be a successful re-
searcher and writer, but they have taught me how to approach all problems from a critical
and scientific perspective. Truly inspiring is how they both maintain a balance between
their pursuit of knowledge and their dedication to their family. I am truly blessed to have
these three amazing people in my life.
I initially pursued this endeavour due to the amazing work being done by the Computer
Poker Research Group at the University of Alberta by its creative, intellectual members -
past and present. In particular, I would like to thank Nolan Bard, Neil Burch, Richard
Gibson, John Hawkin and Michael Johanson for all of their help answering my questions
and teaching me how to be a successful graduate student. I would also like to thank Dr.
Duane Szafron and Dr. Robert Holte for their insightful and critical analysis of my work
during group meetings.
I would also like to thank all of my friends and family, without whom I would not have
been able to retain sanity throughout this process. Specifically, Kevin Waugh for being the
scientist and programmer whose success I aspire to, my best friend Luke St. John for all of
the day-to-day conversations which kept my spirits up and, Megan Evans for so graciously
volunteering to help edit this work. Lastly, a large thank you goes out to my parents, Lloyd
and Kathy and my brother Matt, for understanding my lack of communication over these
last few years.

Contents
1 Introduction 1
2 Background and Related Work 3
2.1 Extensive Games With Imperfect Information . . . . . . . . . . . . . . . . . . 3
2.2 Monte Carlo Estimation . . . . . . . . . . . . . . . . . . . . . . . . . . . . . . 4
2.3 Efficient Estimation . . . . . . . . . . . . . . . . . . . . . . . . . . . . . . . . 5
2.3.1 Antithetic Variates . . . . . . . . . . . . . . . . . . . . . . . . . . . . . 5
2.3.2 Control Variates . . . . . . . . . . . . . . . . . . . . . . . . . . . . . . 7
2.3.3 Advantage Sum Estimators . . . . . . . . . . . . . . . . . . . . . . . . 8
2.3.4 Importance Sampling . . . . . . . . . . . . . . . . . . . . . . . . . . . 10
2.3.5 Additional Applied Statistical Estimators . . . . . . . . . . . . . . . . 13
2.4 Evaluation Domains . . . . . . . . . . . . . . . . . . . . . . . . . . . . . . . . 15
2.4.1 Texas Hold ’em Poker . . . . . . . . . . . . . . . . . . . . . . . . . . . 16
2.4.2 Trading Agent Competition . . . . . . . . . . . . . . . . . . . . . . . . 17
3 The Baseline Approach 20
3.1 Creating Baseline Estimators . . . . . . . . . . . . . . . . . . . . . . . . . . . 20
3.2 The Expected Value of Y β in Zero-Sum Domains . . . . . . . . . . . . . . . . 21
4 Agent Baseline 23
4.1 Motivation . . . . . . . . . . . . . . . . . . . . . . . . . . . . . . . . . . . . . 23
4.2 Creating the Baseline Estimator . . . . . . . . . . . . . . . . . . . . . . . . . 24
4.2.1 Comparisons to DIVAT . . . . . . . . . . . . . . . . . . . . . . . . . . 24
4.3 Proof of Unbiasedness for Zero-Sum Domains . . . . . . . . . . . . . . . . . . 25
4.4 Implementation Details . . . . . . . . . . . . . . . . . . . . . . . . . . . . . . 25
4.4.1 Strategy Sampling . . . . . . . . . . . . . . . . . . . . . . . . . . . . . 26
4.4.2 Random Completion . . . . . . . . . . . . . . . . . . . . . . . . . . . . 26
4.4.3 Use With Importance Sampling . . . . . . . . . . . . . . . . . . . . . . 27
4.5 Evaluation . . . . . . . . . . . . . . . . . . . . . . . . . . . . . . . . . . . . . . 27
4.5.1 Texas Hold ’em Poker . . . . . . . . . . . . . . . . . . . . . . . . . . . 28
4.5.2 Trading Agent Competition: Ad Auctions . . . . . . . . . . . . . . . . 35
5 Data Baseline 37
5.1 Motivation . . . . . . . . . . . . . . . . . . . . . . . . . . . . . . . . . . . . . 37
5.2 Creating the Baseline Estimator . . . . . . . . . . . . . . . . . . . . . . . . . 38
5.2.1 Perfect Matching . . . . . . . . . . . . . . . . . . . . . . . . . . . . . . 38
5.2.2 Nearest Neighbour . . . . . . . . . . . . . . . . . . . . . . . . . . . . . 39
5.2.3 k-Nearest Neighbour . . . . . . . . . . . . . . . . . . . . . . . . . . . . 39
5.2.4 Comparisons to MIVAT . . . . . . . . . . . . . . . . . . . . . . . . . . 40
5.3 Proof of Unbiasedness for Zero-Sum Domains . . . . . . . . . . . . . . . . . . 40
5.4 Implementation Details . . . . . . . . . . . . . . . . . . . . . . . . . . . . . . 41
5.4.1 Storage . . . . . . . . . . . . . . . . . . . . . . . . . . . . . . . . . . . 41
5.4.2 Feature Representation . . . . . . . . . . . . . . . . . . . . . . . . . . 41
5.4.3 Sensitivity of k . . . . . . . . . . . . . . . . . . . . . . . . . . . . . . . 42
5.4.4 Dataset Size . . . . . . . . . . . . . . . . . . . . . . . . . . . . . . . . . 42
5.5 Evaluation . . . . . . . . . . . . . . . . . . . . . . . . . . . . . . . . . . . . . . 44
5.5.1 ACPC Texas Hold ’em Poker . . . . . . . . . . . . . . . . . . . . . . . 44
5.5.2 Human Texas Hold ’em Poker . . . . . . . . . . . . . . . . . . . . . . . 48

6 Conclusions 51
6.1 Agent Baseline . . . . . . . . . . . . . . . . . . . . . . . . . . . . . . . . . . . 51
6.2 Data Baseline . . . . . . . . . . . . . . . . . . . . . . . . . . . . . . . . . . . . 52
Bibliography 53
A 2013 ACPC Baseline Full Results 55
A.1 Two Player Limit . . . . . . . . . . . . . . . . . . . . . . . . . . . . . . . . . . 55
A.2 Three Player Limit . . . . . . . . . . . . . . . . . . . . . . . . . . . . . . . . . 58
A.3 Two Player No-Limit . . . . . . . . . . . . . . . . . . . . . . . . . . . . . . . . 58

List of Tables
4.1 2013 ACPC Two-Player Limit Top-Competitors Results . . . . . . . . . . . . 31
4.2 2013 ACPC Three-Player Limit Top-Competitors Results . . . . . . . . . . . 33
4.3 2013 ACPC Two-Player No-Limit Top-Competitors Results . . . . . . . . . . 34
4.4 Two-Player No-Limit Human vs Computer-Agent Results (1000-Hand Matches) 35
4.5 TAC-AA Tournament (100 Ten-Day Matches) . . . . . . . . . . . . . . . . . . 36
5.1 Two-Player No-Limit Human vs Computer-Agent Results (1000-Hand Matches) 50
5.2 Six-Player No-Limit Human Tournament (144-Hand Matches) . . . . . . . . . 50
A.1 2013 Two-Player Limit ACPC Full Results . . . . . . . . . . . . . . . . . . . 57
A.2 2013 Three-Player Limit ACPC Full Results . . . . . . . . . . . . . . . . . . . 58
A.3 2013 Two-Player No-Limit ACPC Full Results . . . . . . . . . . . . . . . . . 61
List of Figures
4.1 2013 ACPC Two-Player Limit Average Estimator Performance . . . . . . . . 31
4.2 2013 ACPC Three-Player Limit Average Estimator Performance . . . . . . . 32
4.3 2013 ACPC Two-Player No-Limit Average Estimator Performance . . . . . . 34
5.1 Sensitivity of k for k-NN Search . . . . . . . . . . . . . . . . . . . . . . . . . 43
5.2 Performance for Varying Sizes of the Baseline Dataset . . . . . . . . . . . . . 43
5.3 2013 ACPC Two-Player Limit Average Estimator Performance . . . . . . . . 46
5.4 2013 ACPC Three-Player Limit Average Estimator Performance . . . . . . . 47
5.5 2013 ACPC Two-Player No-Limit Average Estimator Performance . . . . . . 48

Chapter 1
Introduction
Efficiently evaluating agent performance is an important problem for many highly stochastic
artificial intelligence domains. An agent’s performance in this context is often measured as
the agent’s expected value given a particular environmental configuration. Measuring this
performance is typically achieved by averaging the values of the observed outcomes from
random samples of the agent and the environment. This process, referred to as Monte Carlo
estimation, provides an unbiased estimate of an agent’s true performance and is probably
the most common approach to evaluation given its simplicity.
Since the Monte Carlo approach only provides an estimate for the expected value of an
agent, the statistical confidence of this estimate must also be taken into consideration when
making claims regarding the agent’s true performance. In order to increase the level of
statistical significance when using Monte Carlo estimation, one can simply increase the
number of random samples being used in the evaluation. While not problematic when
the stochasticity of the agents or the environment is low, as the entropy in the system
increases, so does the number of samples required by Monte Carlo estimation in order to
produce statistically significant estimates. This problem is further compounded when the
costs associated with generating samples is high, such as when evaluating human agents or
slow-acting computer agents. In order to make such costs manageable, more sophisticated
evaluation techniques must be put to use in any high variance domain.
The main focus of this work explores a new approach to evaluating agent performance in
multi-agent, zero-sum domains. Entitled the baseline approach, this method is designed to
be an effective framework for creating low-variance, unbiased estimators that is as simple as
Monte Carlo estimation in agent evaluation settings. This work also provides two practical
implementations of the baseline approach designed for use in two different agent evaluation
1

scenarios. The first application of the baseline approach is designed for situations where
access to competent computer agents for the evaluation domain exist and are easily acces-
sible. We call estimators created in this manner agent baseline estimators and show results
of their effectiveness in the domains of Texas hold ’em poker and Ad Auctions [22]. The
second application of our approach is targeted at a more general case of the agent evaluation
problem, one in which competent computer agents who can act in the evaluation domain
may not exist. In this case, creation of the baseline estimator relies on the existence of
player data for the domain of interest, which is often much more plentiful than competent
computer agents. We refer to estimators created using player data as data baseline estima-
tors, and we analyze their performance by experimenting in the domain of Texas hold ’em
poker on a mixture of human and computer agent data.
The overall goal for the analysis of both applications of the baseline approach is to show
that estimators of this nature are simple to implement, effective in their use, and should be
considered for many agent evaluation scenarios.
2

Chapter 2
Background and Related Work
This chapter provides an overview of the core concepts regarding the problem of efficiently
evaluating agents in zero-sum domains. We begin with the definition of extensive form games
with imperfect information as a way of introducing some of the notation and terminology
used throughout the body of this work. Following this, we give the definition of Monte
Carlo estimation, since it is the method we will use as a base comparison for all of the
evaluation techniques explored in this work. The remainder of the chapter is then dedicated
to introducing various techniques for creating low-variance, unbiased estimators, which are
often referred to as variance reduction techniques. For each variance reduction technique,
we will describe its general formulation and when applicable, give examples of the technique
applied to the problem of agent evaluation. This chapter concludes with a brief description
of the various domains used in the empirical analysis of our approach.
2.1 Extensive Games With Imperfect Information
Extensive games provide a framework for describing multi-agent interaction in sequential
decision making problems. Agents in an extensive game are able to choose policies that can
reason about their plan of action whenever they are required to make a decision. Typically,
the agents and chance alternate acting within the game until some terminal history is
reached, upon which the players each receive some reward. In cases where an agent is
unable to observe other agents’ actions or the actions of chance, indistinguishable sequences
of events can be created from the point of view of the observing agent. Games with this
property are referred to as games with imperfect information and can be defined as follows:
Definition 1 (Extensive Game) [[16], p. 200] A finite extensive game with imperfect
information has the following properties and components:
3

• A finite set of N players.
• A finite set H of sequences, the possible histories of actions such that the empty
sequence is in H and every prefix of a sequence in H is also in H. Z ⊆ H is the
set of terminal histories. A(h) = {a : (h, a) ∈ H} are the actions available after a
nonterminal history h ∈ H\Z.
• A player function P that assigns each nonterminal history to a member of N ∪ {c}
where c represents chance. P (h) is the player who takes an action after history h.
If P (h) = c, then chance determines the action after history h. Let Hi = {h ∈ H :
P (h) = i} be the set of histories where player i is next to act.
• A function σc that associates with every history h for which P (h) = c a probability
measure σc(·|h) on A(h) where each such probability measure is independent from one
another. Let σc(a|h) be the probability that action a occurs after history h.
• For each player i ∈ N , a partition Ii of Hi is the information partition for player
i with the property that A(h) = A(h′) whenever h and h′ are in the same member of
the partition. Ii ∈ Ii is an information set for player i.
• For each player i ∈ N , a utility function ui : Z → R that maps each of the the terminal
histories in Z to some real value, i.e.: ui(z) is the reward that player i receives when
reaching terminal history z. If∑i∈N
ui(z) = 0 for all z ∈ Z then the game is said to be
zero-sum.
Empirical analysis of the contributions presented in this work is performed in domains that
can all be represented by extensive form games of imperfect information that exhibit the
zero-sum constraint, although they need not necessarily be two-player .
2.2 Monte Carlo Estimation
In the context of agent evaluation, Monte Carlo estimation refers to the method of gen-
erating random repeated samples of agents interacting within a specific environment in
order to compute their relative performance to one another. By simply sampling outcomes
from the agents and the environment, the Monte Carlo method provides a naıve mechanism
for computing the performance of the agents when the samples are drawn in an identi-
cally and independently distributed (i.i.d.) fashion [12]. The volume of samples needed to
make statistically significant claims regarding an agent’s performance depends highly on the
stochasticity of the agent’s policies and of the environment itself.
4

Formally, let X = (X1, . . . , Xn) be the random variable corresponding to the observed
outcomes of an agent whose expected value we are trying to estimate. The Monte Carlo
approach then averages together all of the samples of X in order to create an unbiased
estimator of E[X]. This average, denoted as X, is computed as
X =1
n
n∑i=1
Xi (2.1)
where Xi is the outcome of a single sample of the agent’s behaviour and n is the number of
observed samples. It is clear from this that as we provide more samples, the variance of X
decreases by the following:
Var[X] = Var
[1
n
n∑i=1
Xi
]=
1
n2
n∑i=1
Var[Xi] =Var[X]
n(2.2)
Often the biggest problem with using the Monte Carlo method to estimate E[X] is that the
number of samples required to achieve some fixed level of accuracy may be arbitrarily large
for a given domain, as it is directly related to the variance of X [12].
2.3 Efficient Estimation
The goal of efficient estimation techniques is to increase the efficiency of the Monte Carlo
method when estimating E[X] by reducing the variance of the estimate. This can be done
by either reducing the number of samples required to compute an accurate estimate or by
increasing each sample’s quality without adding bias.
2.3.1 Antithetic Variates
Antithetic variates are one common approach to reducing the variance of an observed ran-
dom variable by generating antitheses to the statistic being estimated [12]. These antitheses
are produced by introducing negative dependancies between the observed variable, X, and
the corresponding antithetic variable, Y . The antithetic unbiased estimator, Z, is then
constructed by averaging the values of X and Y
Zi =Xi + Yi
2(2.3)
Given that X and Y have the same expected value, the expected value of Z is
E[Z] =1
2(E[X] + E[Y ])
E[Z] = E[X] (2.4)
5

which shows that the antithetic estimator Z is an unbiased estimator of X. Seeing that
X and Y have the same distribution and therefore the same variance, the variance of Z is
computed as
Var[Z] =Var[X] + Var[Y ] + 2Cov[X,Y ]
4
Var[Z] =Var[X] + Cov[X,Y ]
2(2.5)
From the reduced variance equation, it is clear that antithetic variate estimators rely on
Cov[X,Y ] < 0 in order to be more efficient than simple Monte Carlo estimation [12]. This
of course assumes that the effort required to create instances of Y is roughly equal to that
of generating samples of X.
The biggest drawback of using antithetic variates comes from the complications associated
with guaranteeing the negative covariance when generating the antithetic pairs. In the
context of agent evaluation, some solutions to this problem can have undesirable side effects,
such as introducing the inability to evaluate an individual agent’s skill [11].
Duplicate
Duplicate is a technique for producing antithetic pairs in multi-agent games. The duplicate
approach has been used successfully in bridge [26] and computer poker [1, 13, 19] and is a
potentially effective approach to variance reduction in scrabble-like games [21]. Duplicate
methods create antithetic pairs by replicating the starting and future chance events of a
game for each configuration of the players. For scrabble-like games, this is done by setting
the order in which the tiles will be drawn and in card games, it is achieved by fixing the
order of the cards in the deck. The score for each player is their average score across all
the permutations that were sampled. The intuition behind the duplicate approach is that
the variance associated with a particularly good or bad starting position will be reduced by
scoring each instance in this way.
Using the duplicate approach for agent evaluation can create logistical problems, particu-
larly when evaluating human agents. Since duplicate requires each player to play the same
sequence of random events multiple times, the players are required to forget all past knowl-
edge from previous replications. While not particularly problematic for many computer-
agent scenarios, this restriction essentially makes it impossible to evaluate human agents.
For instance, duplicate bridge is typically scored in a very different manner than the du-
plicate approach would suggest due to this problem [26] and using duplicate in computer
poker requires the use of teams, forgoing any attempt at evaluating the performance of
6

individual players [19]. Combined with the potentially laborious and error-prone task of
creating each duplicate replication, the usefulness of using the duplicate approach to create
efficient, unbiased estimators is questionable for many agent evaluation scenarios.
2.3.2 Control Variates
Control variates provide another way of creating unbiased estimators with reduced sample
variance. The control variate approach is similar to that of antithetic variates in that it
attempts to exploit certain properties of the observed random variable X [12]. In particular
given the variable whose quantity is being estimated, X = (X1, . . . , Xi), the control variate
approach is to generate a correlated control variable, Y = (Y1, . . . , Yi), whose expected
value, E[Y ], is a known quantity. Given that every (Xi, Yi) pair is i.i.d, the control variate
estimator, Z, is defined such that each Zi is computed as
Zi = Xi − c(Yi − E[Y ]) (2.6)
The sample mean of the estimator, denoted as Z, is then equal to
Z =1
n
n∑i=1
(Xi − c(Yi − E[Y ])) (2.7)
For any c ∈ R, Z is an unbiased estimator of E[X] since
E[Z] = E[X − c(Y − E[Y ])]
= E[X]− E[c(Y − E[Y ])]
= E[X]− c(E[Y ]− E[Y ])
= E[X] (2.8)
and the variance of each Zi is equal to
Var[Zi] = Var[Xi − c(Yi − E[Y ])]
= Var[X] + c2Var[Y ]− 2cCov[X,Y ] (2.9)
From these equations, it follows that Z has lower variance than the Monte Carlo estimate
when
c2Var[Y ] < 2cCov[X,Y ] (2.10)
This shows that the optimal choice of coefficient, c∗, is the one that minimizes the variance
of the estimator and is equal to
c∗ = −Cov[X,Y ]
Var[Y ](2.11)
7

Thus, when using the optimal coefficient c∗, the resulting variance of Z is
Var[Z] = Var[X − c∗(Y − E[Y ])]Var[Y ]
= 1− ρ2X,Y (2.12)
where ρX,Y is the correlation between X and Y and 1−ρ2X,Y corresponds to the magnitude of
the resulting variance reduction. Essentially, the more the control variable and the observed
random variable co-vary, the less variance there will be in the resulting estimator.
The difficulty in practice when trying to use c∗ comes from the observation that if E[X]
is unknown, Var[X] and ρX,Y are likely to be unknown as well. In this situation, we
can estimate the optimal coefficient, c, by replacing Var[X] and ρX,Y with their sample
counterparts. Let Z be the estimator computed using the estimated optimal coefficient
c. Note that by applying the strong law of large numbers, as the sample size n → ∞, c
converges to c∗ with probability 1 [12]. This estimation introduces some bias, precisely, the
bias of Z is equal to
Bias(Z) = E[Z]− E[X]
= −E[c(Y − E[Y ])] (2.13)
This bias is not necessarily zero since c and Y are not independent in this setting. However
the bias is typically on the order of O(1/n) and the standard error being of O(1/√
(n)) [12].
Some of the same problems that arise with antithetic variates are also true of control variates.
While the samples generated for use in the control do not have to be strictly negatively
correlated, they do require a high degree of correlation in order to make the resulting
estimator effective. Additionally, the fact that E[Y ] needs to be a known value is often
problematic. Control variates have, however, been used with success in agent evaluation [11]
and as a method of reducing variance in Monte Carlo Tree Search techniques [15, 23]. Since
the majority of this work is based off of this approach, we will describe an application of
control variates in Chapter 3.
2.3.3 Advantage Sum Estimators
Zinkevich et al. provided a general framework for creating unbiased estimators for agent
evaluation in stochastic domains, which are known as advantage sum estimators [27]. Ad-
vantage sum estimators are created by separating out the effects of skill, luck and positional
advantage for each decision an agent makes. Let H be the set of all reachable histories,
Z ⊆ H be the subset of all terminal histories and the utility function u : Z → R be the
8
function that maps terminal histories to real values. The goal of the advantage sum estima-
tor is then to provide a low-variance, unbiased estimate for E[u] given the dynamics of the
system [27].
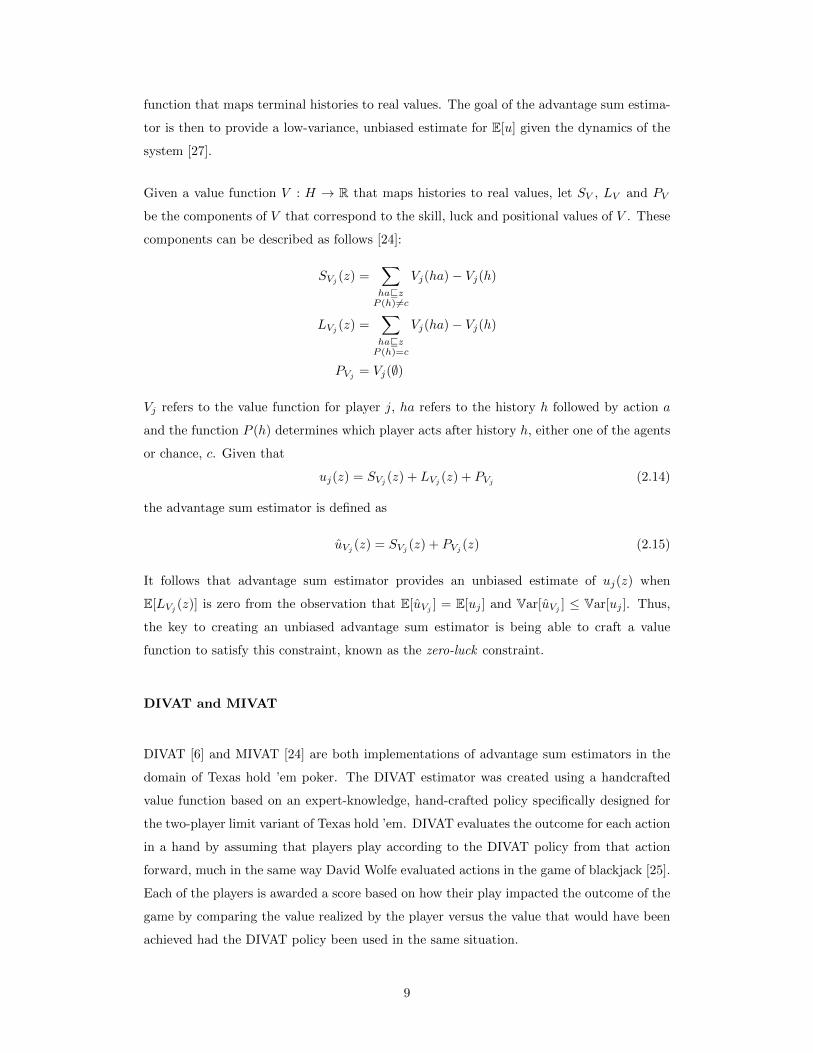
Given a value function V : H → R that maps histories to real values, let SV , LV and PV
be the components of V that correspond to the skill, luck and positional values of V . These
components can be described as follows [24]:
SVj(z) =
∑havzP (h)6=c
Vj(ha)− Vj(h)
LVj (z) =∑havzP (h)=c
Vj(ha)− Vj(h)
PVj= Vj(∅)
Vj refers to the value function for player j, ha refers to the history h followed by action a
and the function P (h) determines which player acts after history h, either one of the agents
or chance, c. Given that
uj(z) = SVj(z) + LVj
(z) + PVj(2.14)
the advantage sum estimator is defined as
uVj (z) = SVj (z) + PVj (z) (2.15)
It follows that advantage sum estimator provides an unbiased estimate of uj(z) when
E[LVj (z)] is zero from the observation that E[uVj ] = E[uj ] and Var[uVj ] ≤ Var[uj ]. Thus,
the key to creating an unbiased advantage sum estimator is being able to craft a value
function to satisfy this constraint, known as the zero-luck constraint.
DIVAT and MIVAT
DIVAT [6] and MIVAT [24] are both implementations of advantage sum estimators in the
domain of Texas hold ’em poker. The DIVAT estimator was created using a handcrafted
value function based on an expert-knowledge, hand-crafted policy specifically designed for
the two-player limit variant of Texas hold ’em. DIVAT evaluates the outcome for each action
in a hand by assuming that players play according to the DIVAT policy from that action
forward, much in the same way David Wolfe evaluated actions in the game of blackjack [25].
Each of the players is awarded a score based on how their play impacted the outcome of the
game by comparing the value realized by the player versus the value that would have been
achieved had the DIVAT policy been used in the same situation.
9
This type of evaluation was proven to be unbiased by Zinkevich et al. [27] and the empirical
results showed that the DIVAT estimator was able to achieve a 75% to 85% reduction in
the variance over that of Monte Carlo estimation when evaluating agents in two-player limit
Texas hold ’em. Since the DIVAT estimator’s value function is based on a hand-coded
policy, its use is very limited outside the domain of two-player limit Texas hold ’em. Other
simpler, more generic policies have been experimented with using this framework, such as
always-call and always-raise, but these policies tend to underestimate or overestimate the
values of hands and produce much weaker low-variance estimators.
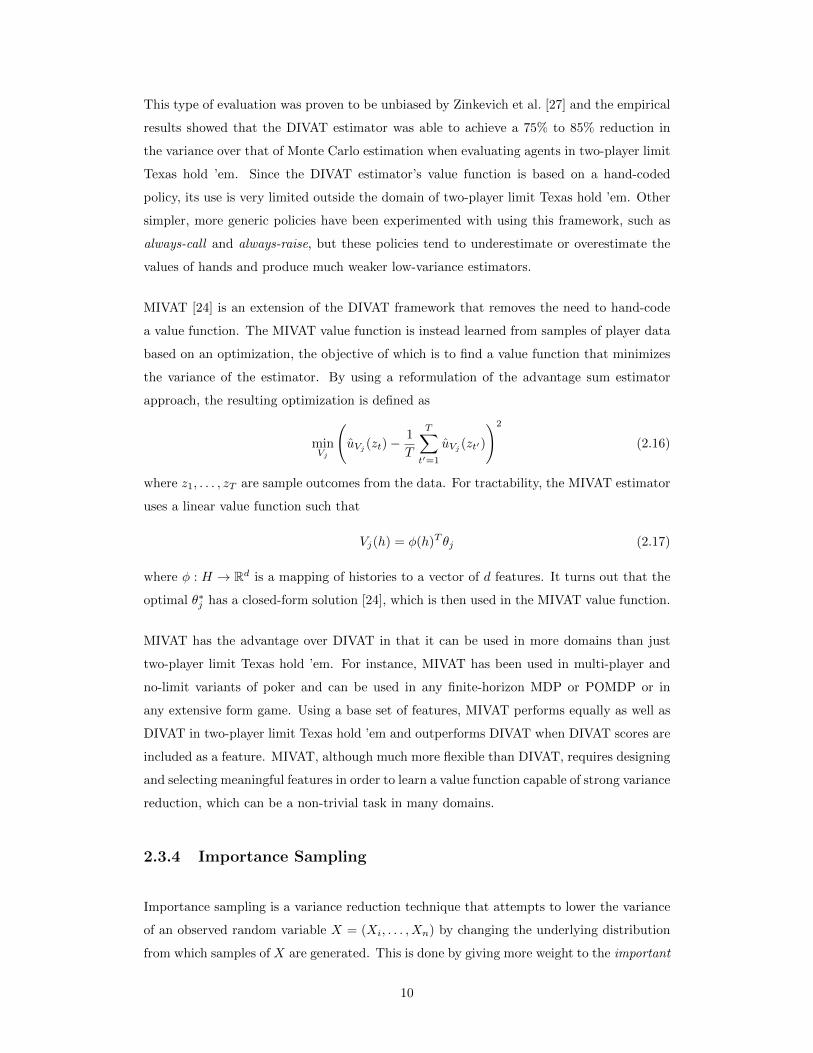
MIVAT [24] is an extension of the DIVAT framework that removes the need to hand-code
a value function. The MIVAT value function is instead learned from samples of player data
based on an optimization, the objective of which is to find a value function that minimizes
the variance of the estimator. By using a reformulation of the advantage sum estimator
approach, the resulting optimization is defined as
minVj
(uVj (zt)−
1
T
T∑t′=1
uVj (zt′)
)2
(2.16)
where z1, . . . , zT are sample outcomes from the data. For tractability, the MIVAT estimator
uses a linear value function such that
Vj(h) = φ(h)T θj (2.17)
where φ : H → Rd is a mapping of histories to a vector of d features. It turns out that the
optimal θ∗j has a closed-form solution [24], which is then used in the MIVAT value function.
MIVAT has the advantage over DIVAT in that it can be used in more domains than just
two-player limit Texas hold ’em. For instance, MIVAT has been used in multi-player and
no-limit variants of poker and can be used in any finite-horizon MDP or POMDP or in
any extensive form game. Using a base set of features, MIVAT performs equally as well as
DIVAT in two-player limit Texas hold ’em and outperforms DIVAT when DIVAT scores are
included as a feature. MIVAT, although much more flexible than DIVAT, requires designing
and selecting meaningful features in order to learn a value function capable of strong variance
reduction, which can be a non-trivial task in many domains.
2.3.4 Importance Sampling
Importance sampling is a variance reduction technique that attempts to lower the variance
of an observed random variable X = (Xi, . . . , Xn) by changing the underlying distribution
from which samples of X are generated. This is done by giving more weight to the important
10
samples of X in order to increase sampling efficiency of Monte Carlo estimation [12]. More
specifically, assume that the random variable X has probability density f , and that each
Xi ∈ X is drawn according to f . Importance sampling states that instead of drawing
the samples Xi, . . . , Xn from the distribution f , they are drawn according to some other
probability density, g, that satisfies the equation
f(x) > 0⇒ g(x) > 0 (2.18)
This introduces bias into the sampling of X, however the bias can be accounted for by
weighting the terms properly when estimating E[X]. The weighting factor, w, is then done
according the likelihood ratio between f and g where
w(Xi) =f(Xi)
g(Xi)(2.19)
Let Z be the estimator such that
Zi = w(Xi)Xi (2.20)
The sample mean of the estimator, Z, is then
Z =1
n
n∑i=1
Zi (2.21)
By ensuring that the weighting is done according to Equation 2.19, Z is a provably unbiased
estimator of X [12].
Comparing the variance when estimating E[X] with and without importance sampling de-
pends entirely on the choice of g. Given that the variance of Z is
Var[Z] = E[Z2]− (E[Z])2 (2.22)
we only need to consider the E[Z2] term when comparing the Var[X] to the Var[Z]. If we
expand this term out, we get
E[Z2] = w(X)X2 (2.23)
Comparing E[Z2] and E[X2] shows that an arbitrary choice of g could lead to an infinitely
larger or smaller variance in the importance sampling estimator. Unfortunately there is no
general rule for choosing g, thus choosing an effective importance sampling density is often
referred to as an “art” [12].
Importance Sampling and Poker
Importance sampling techniques have been used with success in the domain of computer
poker for both agent evaluation and policy selection [4, 7]. Bowling et al. [7] applied the
11

importance sampling technique in the domain of Texas hold ’em poker as a way of creating
low-variance, unbiased estimators for post-game analysis. Although their work describes how
to apply importance sampling for different on-policy and off-policy cases, we will summarize
the off-policy full-information usage, as it is the most applicable to agent evaluation. Agent
evaluation in this setting refers to the situation where, given a function that maps terminal
histories to real values, V : Z → R, we would like to estimate Ez|σ[V (z)] where σ is the
policy we are creating the estimator for. The terms off-policy and full-information are used
to describe how the outcomes are generated and evaluated. In the off-policy scenario, the
outcomes are generated according to some distribution πσ, where σ differs only for player i
from σ and the goal of the evaluation is to assess how well a different strategy would perform
in place of player i. Full-information in this context merely states that all of the information
for every outcome is observable, including all of the private information for each player.
The off-policy importance sampling estimator is constructed by examining the subset of
terminal histories U(z′) ⊆ Z such that z′ ∈ Z and z′ ∈ U(z′), where U(z′ ∈ Z) ⊆ Z is
a mapping of terminal histories to a set of terminal histories. In this mapping, z′ ∈ U(z′)
and an unbiased estimator is constructed by considering the history z′ whenever a history
from the set U(z′) is observed. Alternatively, the set of synthetic histories considered when
observing z can be denoted as the set U−1(z). The importance sampling estimator, VU (z),
is then
VU (z) =∑
z′∈U−1(z)
V (z′)πσ(z′)
πσ(U(z′))(2.24)
The estimator weights the value of every z′ by the probability of reaching z′ according to
both πσ(z′) and πσ(U(z′)). Note that VU (z) is not an estimate of V (z), rather they have
the same expected value and good choices of U can be constructed to only consider known
strategies σi and σi. Also, as long as πσi (z) is non-zero for all z ∈ Z then VU is unbiased [7]
Ez|σ[VU (z)] = Ez|σ[V (z)] (2.25)
The simplest choice for U is simply U(z) = {z}, which is simply known as basic importance
sampling, where if σi = σi, the weighting is 1 and is equal to simple Monte Carlo estimation.
Two other choices for U that only depend on σi and σi are game ending actions and private
information importance sampling [7]. Importance sampling with game ending actions only
considers prefixes of z where the remaining decisions are for player i or chance. This allows
for the importance sampling estimator to evaluate actions that could have been made by
player i earlier in the sequence that would have ended the game early, such as folding in
Texas hold’ em poker. Importance sampling with private information considers the histories
where player i had differing private information as these histories are indistinguishable from
12
the perspective of the other players. An example of this in Texas hold ’em would be the
situations where player i held different private cards. These two choices can also be combined
together and the value function V can also be replaced with any unbiased estimate of V ,
such as values from a duplicate estimator. Importance sampling in this manner only works
when the full strategy is known, which means it is limited to evaluating the performance of
accessible computer agents.
2.3.5 Additional Applied Statistical Estimators
In addition to the applications of efficient estimators previously described, this section sum-
marizes a collection of other work that does not specifically fall into any of the aforemen-
tioned general categories.
Monte Carlo Estimation in Blackjack
In the game of blackjack, David Wolfe explored the problem of evaluating how well an
agent performs with respect to an optimal policy [3, 25]. Since a good blackjack player
may have to play upwards of 1.2 million hands in order to get an accurate estimate of their
own skill [25], Wolfe used a form of Monte Carlo estimation based on the control variate
approach to reduce the variance for any given hand.
Wolfe’s method first involved creating a base oracle or near-oracle policy, denoted as σ.
This policy was then used to evaluate the performance of an agent, P , by comparing the
winnings of the agent, w(P ), to the winnings of base policy, w(σ), for a given state of the
deck. The estimated expected winnings of the agent then becomes
E[w(P )] = E[w(σ)] + E[w(P )− w(σ)] (2.26)
Seeing that the strategy of the agent being evaluated may not be known for every possible
deck configuration, Wolfe creates an estimator by assuming that after the agent acts, all
following actions will be according to that of σ. Scores are then assigned to the agent based
on the difference in the expected value it would have received for the actions in the agent’s
strategy that differ from σ. Formally, let Pi,j denote using the agent’s strategy for the
sequence of actions from i → j and σi,j be the sequence of actions from i → j according
to the policy σ. The expected value for the player then is the sum of these differences for
every action made in a given hand,
E[w(P )] = E[w(σ)] +
n∑i=1
E[w(P0,i, σi+1,n)− w(P0,i−1, σi,n)] (2.27)
13

Wolfe evaluated agents using a high-low counting strategy and observed that his evaluation
technique converged anywhere from 100 to 2500 times faster than that of pure Monte Carlo
estimation depending on the number of decks and the shuffling policy of the shoe. This
approach proved to be a powerful technique for agent evaluation and the basis for techniques
such as DIVAT. Unfortunately, Wolfe’s approach may not be tractable for many domains
as it requires creating a near oracle policy and computing the expected value of that policy
for all possible instances of the domain.
Monte Carlo Rollouts in Backgammon
In the game of backgammon, Gerald Tesauro considered the the task of computing the near-
oracle policy necessary to evaluate agent decisions using Wolfe’s approach highly impractical
for evaluating the play of backgammon agents [17]. When building his TD-Gammon agent,
he instead tackled this problem by using a form of Monte Carlo estimation, called rollouts,
to evaluate each action in the game. The Monte Carlo rollout approach estimates the score
of each action by randomly assigning future chance events to the game and playing the rest
of the moves out according to some fixed rollout policy, σ. This is then repeated multiple
times and the best play is recorded as the rollout that achieved the highest equity. The
difference between each rollout and the best one observed provides a score for the action
being evaluated and the average score for all of the rollouts provides a low-variance, unbiased
estimate for the value of that action. While the rollout policy may not be optimal, Tesauro
observed that the same policy tends to lose roughly equal amounts on either side of the
match when used to decide actions for both players during the rollouts. This means that
in backgammon, even intermediate policies tend to be sufficient in estimating the equity of
many of the actions.
Tesauro and Galperin also surmised that if the rollouts could be performed in real-time,
they could be used to provide low-variance estimates for action selection during play [18].
The main disadvantage to this approach comes from the speed at which the rollouts are
computed, which can be very slow for deep searches and uninformative if the depth is too
shallow.
Variance Reduction in Monte Carlo Tree Search
Recent work has been done using variance reduction methods in Monte Carlo Tree Search [23].
Monte Carlo Tree Search (MCTS) algorithms are methods of finding optimal decisions by
constructing search trees based on random samples for a given domain [8], a popular variant
14

being the Upper Confidence Bound for Trees (UCT) algorithm [15]. The UCT algorithm
builds a partial search tree by using UCB1 [2] as the tree policy, treating the value of each
child node as the expected value approximated by the Monte Carlo rollouts that occurred
from the child node. Since these values are being treated as random variables with un-
known distributions and are being sampled according to some stochastic process, they can
be subject to both error and bias.
While much work has been done on reducing the bias of these estimates, Veness et al. ap-
proached the problem of reducing their variance by leveraging the variance reduction tech-
niques of control variates and antithetic variates [23]. Although general in approach, their
work specifically focused on applying these techniques as modifications to the UCT algo-
rithm.
The control variate modification to the UCT algorithm replaces the value of state-acton pairs
by a control variate counterpart. That is, for every given state-action pair (s, a) ∈ SxA, the
value, Xs,a, is replaced by
Zs,a = Xs,a − cs,a(Ys,a − E[Y s, a]) (2.28)
Here Ys,a acts as the control variable and has a known expected value for all state-action
pairs. The controls were generated such that for a random trajectory, St = st, At =
at . . . Sn = sn, An = an,
Yst,at =
n−1∑i=t
E[I[b(Si+1]|Si = si, Ai = ai]− P[b(Si+1|Si = si, Ai = ai]) (2.29)
In this formulation, the function b : S → {true, false} acts as a boolean function applied
to the state S and I is the boolean indicator of that function. This simplifies the control
variate for any state-action pair since the expected value, E[Yst,at ], is zero [23].
The antithetic variates approach was applied to UCT by storing the realized trajectory
starting with si+1, ai+1 . . . sn, an for each state-action pair, si, ai, at each node in the tree.
This stored trajectory can then be used to create antithetic paths through the space on
future iterations and the values of the two outcomes are averaged together as per the stan-
dard antithetic variate approach. Veness et al. showed that using these variance reduction
techniques in UCT provided a significant reduction in the number of simulations required
to reach a desirable level of play in three different test domains [23].
2.4 Evaluation Domains
In this section we introduce the domains for which the agent evaluation approaches explored
in this work were evaluated with. For each domain, a brief overview of the rules and any
15
modifications that were made in the evaluation section are provided.
2.4.1 Texas Hold ’em Poker
Texas hold ’em is one of the most popular games in the family of poker card games. It has
appeared on television, in movies [10] and as a part of the World Series of Poker, a venue
where thousands of professionals compete every year for millions of dollars [20]. Texas hold
’em was also the variant of poker used for the Man versus Machine poker matches [19] and is
currently the variant of poker used by the Annual Computer Poker Competition (ACPC) [1].
These reasons, coupled with the intrinsically high outcome variance associated with poker
games, have made Texas hold ’em an enticing choice for benchmarking the performance of
agent evaluation techniques. In this section, we will outline the general rules common to all
forms of Texas Hold ’em poker, and describe the specific variants and rules used by the 2013
Annual Computer Poker Competition, with is the primary domain used in the evaluation
of our approach.
General Rules
Texas hold ’em poker is a card game played with anywhere from two to ten players using
the standard 52 card deck. Each hand of Texas hold ’em consists of four rounds, commonly
known as the pre-flop, flop, turn and river. Each round begins with a dealing phase, the
structure of which differs slightly between rounds. The dealing phase in the pre-flop has the
dealer deal every player two face-down hole cards, which is their private information for the
hand. In the remaining rounds, the dealer deals face-up cards which are shared between all
players, which are referred to as the board cards. Three board cards are dealt at the start of
the flop round and one more board card is dealt in each of the turn and river rounds. This
gives each player a maximum of seven cards from which to assemble their poker hand.
After the dealing phase in each round, a betting phase begins where the players are able to
take turns making one of three different actions. The players may place wagers, known as
bets, call a previously made bet, or fold their hand, forfeiting any wagers they have made
or called. The winner of a hand in Texas hold ’em is either the last player remaining if
everyone else folds, or the player with the best five card poker combination of their hole
cards and the board cards. The winner receives the other players’ wagers and the goal of
Texas hold ’em is to maximize one’s profit over many hands.
16
Betting Structures
The betting structure in Texas hold ’em defines what legal betting actions are available to
players for a given situation. The most common betting structures, and those of interest in
this work, are that of no-limit and fixed-limit. The no-limit betting structure allows players
to make any size of bet greater than or equal to some minimum value and less than or equal
to the total amount of chips they currently have available to them. With fixed-limit, the
betting actions are split into two different fixed bet sizes, known as the small bet and big
bet. The small bet is the size of bet a player may make in the pre-flop and flop rounds and
the big bet, which is typically twice the size of the small bet, is used in the turn and river
rounds. The fixed-limit betting structure also specifies a maximum number of bets in each
round. This maximum is commonly equal to three bets in the pre-flop round and four in
every other round.
In both betting structures, the players may also check the bet, which is to make a bet of
zero chips. Players may also call a bet larger than their remaining chips which allows them
to continue in the hand, however they can only win or lose an amount equal to their own
wager. Any player who has wagered all of their remaining chips is referred to as being all-in
and may no longer perform any actions for the remainder of the hand.
ACPC Rule Modifications
The ACPC uses what is known as Doyle’s game in order to circumvent issues that can arise
regarding the amount of chips available to the players throughout the course of a match.
In Doyle’s game, all of the players have their chips reset to some pre-defined number before
each hand begins. In this way, each hand is played for exactly the same value and can be
considered independent of every other hand.
2.4.2 Trading Agent Competition
The Trading Agent Competition (TAC) is an annual computer agent competition where
autonomous agents interact in various trading agent type problems. Typically, agents in
this domain act as the broker or seller of goods and services in a simulated consumer market.
The particular domain explored in this work is that of the TAC Ad Auctions (TAC-AA)
game [22].
17

TAC Ad Auctions
TAC-AA is a competition where the customers are simulated users of an internet search
engine and the agents must place bids for the placement of their advertisements in a home
entertainment market. The agents bids are in the form of the cost-per-click fee they are will-
ing to pay for a given advertisement with the highest bids receiving the best ad placement.
Simulated users in the system are then shown ads, which they may click on. Should the user
purchase the goods featured in the ad, revenue is generated for the agent who placed the
ad. The goal of the agents in this competition is to maximize their profit over the course of
a fixed number of days.
Customer Model
The customers in this environment are simulated users who act by querying a search engine,
clicking on advertisements and purchasing goods. Each user’s behaviour is decided by the
customer simulation model. The customer simulation model generates product and brand
dispositions for each user, which determine the queries that particular user will submit to
the search engine. Each query produces a ranked list of advertisements, called impressions,
from which the customer model provides transition probabilities for the user. These tran-
sition probabilities determine whether or not the user will click on an advertisement in the
impression, and whether or not the user will purchase a good once they have clicked on an
advertisement.
Agent Interaction
During each day of the simulation, the advertising agents simultaneously and secretively
place cost-per-click bids for the ads they wish to show given a particular user query. The
types of advertisements an agent may show are either generic or targeted, which effect a
user’s likelihood of viewing a particular ad. Each agent also has a product specialty which
impacts the likelihood of turning a product view into a sale. Agents may impose a spending
budget for the day, which forces the search engine to stop showing advertisements for the
agent once its budget is exhausted. At the end of each day, all of the agents receive a
general report which contains the average ranking of the agents and the type of ads each
agent chose to display for a random sample of user queries. Each agent also receives a report
containing information specific to their own advertisements, such as the average per-click
cost, the number of impressions that contained their advertisements, and the total number
of advertisement clicks they received.
18

TAC-AA Rule Modifications
The rules regarding the scoring of the TAC-AA competition were modified in order to create
a zero-sum environment. This was done by averaging the scores of all of the agents after
each match and subtracting the average from each individual agent’s score.
19

Chapter 3
The Baseline Approach
This chapter outlines a general approach for creating low-variance unbiased estimators based
on the control variate methods. We call this the baseline approach to variance reduction,
which provides a simple framework for creating control variable pairings in agent evaluation
scenarios. Estimators created using this framework are referred to as baseline estimators,
two different applications of which are detailed in Chapters 4 and 5.
3.1 Creating Baseline Estimators
The general baseline approach is mainly a reformulation of the control variate technique
described in Section 2.3.2. This reformulation facilitates easy control variable generation
when the environmental randomness in a domain is independent of the agents’ actions. In
this setting, we assume that the randomness of a domain can be represented as a single
random variable, Q, with q ∈ Q denoting the set of possible values for Q, and qi denoting
the i -th such instance drawn from Q. An example of this could be the seed of the random
number generator used to generate all of the stochastic events in the environment.
Let g : q → R be the function that specifies the performance of an agent for a particular
instance of the domain and X = g(Q) be the random variable whose expectation we are
estimating. In order to generate the control pairs for each instance in X, the baseline
approach utilizes a function β : q → R which we call the baseline scoring function. Applying
the baseline scoring function to an instance q ∈ Q produces a baseline score for the instance,
which can be seen as the expected level of performance for an agent given the random
instance. Creating the control variate for the observed instances is then achieved by creating
a baseline score for each qi instance.
20

It is possible that some of the instances in the observed data are incomplete, meaning that
the chance events may be unknown. The baseline scoring function must be able to handle
this case in an unbiased fashion in order to produce an unbiased estimator. One example of
this would be to randomly assign the future chance events during the computation of the
baseline score for the instance.
The control variable, Y β , used in the baseline estimator is computed simply as
Y β = β(Q) (3.1)
and the equation for the baseline estimator, Zβ , is written as
Zβi = Xi − c(Y βi − E[Y β ]) (3.2)
The sample mean of this estimator, Zβ , is then an unbiased estimator for X by Equation
2.8 and has lower variance than X when X and Y β are highly correlated.
3.2 The Expected Value of Y β in Zero-Sum Domains
So far, the baseline approach differs little from the underlying control variate approach,
and still suffers from the problem of using baseline scoring functions that have a known
E[Y β ]. One easy way to handle this problem is to produce a baseline scoring function
whose expected value is zero, the approach suggested by Veness et al. in their work on
using control variates in Monte Carlo Tree Search [23]. Imposing certain conditions on the
domain and the baseline scoring function ensures that E[Y β ] will be zero, resulting in the
baseline estimator being unbiased. The conditions are as follows:
1. The utility outcomes in the domain must be zero-sum.
2. The domain must be factorable into the environment structure itself and the assign-
ment of agents to possible positions within the environment. An example of environ-
ment positions would be the order that an agent must act in a game such as poker.
3. The agents are equally as often observed in each of the possible positions.
4. The β function must only depend on the environment structure, and not on any actions
of the participating agents, or on the configurations of specific agents to environment
positions.
5. The β function must return the same baseline scores for a given instance of the envi-
ronment.
21

Given these restrictions, we can examine how they impact the expected value of the baseline
scoring function, β(Q), and show that it is indeed zero.
The second and third points consider the situation where one is sampling the environment
and randomly assigning agents to positions within the environment. The fourth and fifth
points state that since the returned baseline utilities only depend on the environment struc-
ture, each positional assignment must map to the same vector of utilities. Combining the
second, third, fourth and fifth points show that because each agent has a probability of 1n
of being placed in each of the n environment positions, the expected baseline score is 1n
times the sum of the baseline utilities over all of the positions. This sum must be zero from
condition one, and thus, the expected baseline score must be zero.
By substituting E[Y β ] = 0 in Equation 3.2, we get a simplified equation for the baseline
estimator
Zβi = Xi − c(Y βi ) (3.3)
and the expected value of the resulting baseline estimator, Zβ , is equal to
E[Zβ ] = E[X − cY β ]
= E[X]− E[cY β ]
= E[X]− c(0)
= E[X] (3.4)
This shows that imposing these restrictions will guarantee that the baseline estimator will
be unbiased. While these restrictions are not required to produce baseline estimators, they
do provide a simple way of ensuring that a chosen baseline scoring function will produce
unbiased baseline estimators.
22

Chapter 4
Agent Baseline
The agent baseline1 approach is the first major contribution of this work to the field of
agent evaluation. Agent baseline is an application of the baseline approach from Chapter 3
designed to create high-quality unbiased estimators for use in zero-sum stochastic domains.
This is achieved by leveraging the self-play of agents that exists in the evaluation domain.
We begin with the motivation that led to this application of the baseline approach as well
as the general details on how to create the baseline scoring function using existing agents.
Additionally, we will walk through the implementation details and provide empirical results
showing the performance of agent baseline estimators when evaluating computer poker and
ad-auction agents.
4.1 Motivation
The agent baseline approach is specifically tailored for creating estimators in stochastic
domains where obtaining competent computer agents is simple. Since baseline estimators
rely on a baseline scoring function that provides a benchmark level of expected performance
of agents within a domain, a natural way to produce this would be to use the actual values
that agents obtain in the game itself. Although any agent could be used to provide a
score for each observed environmental instance, slow-acting agents or those whose play
is not indicative of the agents being evaluated will likely decrease the potential variance
reduction of the resulting baseline estimator. This suggests that using competent and fast-
acting computer agents are an ideal choice for creating the baseline scoring function when
1Portions of this chapter appeared in the Proceedings of the 11th International Conference on Au-tonomous Agents and Multi-agent Systems [11].
23

evaluating decently skilled agents. Luckily fast, skilled computer agents exist for many of
the domains that require efficient agent evaluation.
The domain of Texas hold ’em poker provides an excellent example of an evaluation scenario
that could benefit from the use of an agent baseline estimator. Evident from the volume of
matches needed to create significant results in the Annual Computer Poker Competition [1],
there exists a need for efficient agent evaluation due to the high outcome variance inherent
in the game. Texas hold ’em poker is also a domain where there are many fast-acting,
highly-skilled computer agents, some of which can outperform the best human players in
the world [19]. The hypothesis, then, is that by creating baseline estimators by using the
values of competitive computer agents as the baseline scores for the observed instances, the
resulting estimators will yield highly-efficient, unbiased estimates of agent performance.
4.2 Creating the Baseline Estimator
Creating agent baseline estimators involves using computer agents to generate the required
baseline scoring function, β(Q), for each stochastic instance present in the evaluation.
Specifically, the agent baseline approach is to choose a single agent, referred to as the
baseline agent, and create this function by using that agent’s self-play on the observed in-
stances. This requires that the baseline agent be able to generate outcomes in self-play
easily for every instance of the domain, which we will represent with the function s : q 7→ R.
For each qi in Q, the values of the control variable are computed such that Y βi = s(qi). The
equation representing the resulting agent baseline estimator, denoted as Aβ , is then
Aβi = Xi − c(Y βi − E[Y β ]) (4.1)
which is equal to the underlying baseline estimator function defined in Equation 3.2.
4.2.1 Comparisons to DIVAT
One might observe that the agent baseline approach closely resembles the DIVAT ap-
proach [6], since both techniques require an agent, or policy, in order to preform evaluation.
In fact, these two approaches can be thought of as nearly equivalent if we reformulate the
way that chance acts for the domain. By moving all of the chance events to the start of the
game, the DIVAT approach will then simply calculate one DIVAT score for the sequence of
player actions that occurred, much in the same way that the agent baseline approach creates
one baseline score for any given observation. In this setting, a simple implementation of
24
both techniques would be in fact equivalent if they shared the policy used for creating the
scores for each observation.
Although the agent baseline approach is similar to that of DIVAT, there exists a fundamental
difference in the necessary behaviour of the policy needed by each technique. While creating
an agent baseline estimator only requires that there exist some agent that can act within a
domain given some predefined set of chance outcomes, the types of policies that can be used
with the DIVAT approach are much more restrictive. DIVAT estimators require a strategy
that must be able to make reasonable decisions at all possible points in the game, even
those in which the strategy may never play itself. The baseline approach does not impose
this requirement and allows the strategy to play freely when evaluating each observation.
For instance, in the game of poker, the policy used for a DIVAT estimator must be able to
act for all possible sequences of actions for all possible card combinations, whereas an agent
baseline policy is allowed to never take certain actions with certain sets cards. Allowing
for the use of less restrictive policies can make the agent baseline approach both simpler to
implement as well as more applicable to a broader range of domains.
4.3 Proof of Unbiasedness for Zero-Sum Domains
Agent baseline estimators created using the aforementioned approach are provably unbiased
for zero-sum domains since the Y β term from Equation 4.1 satisfies the conditions provided
in Section 3.2. The first condition holds trivially by the zero-sum domain restriction. Fur-
ther, since the second and third conditions only depend upon the domain, we assume that
these properties hold for any application of the agent baseline approach. This is certainly
true for the domains used for the evaluation of the baseline approach in this work. The
fourth condition holds as the agent baseline scoring function, s, only considers the chance
events from the observed instances in Q. The fifth condition holds true since there is a
one-to-one mapping from baseline scores to observed instances under the agent baseline
approach.
4.4 Implementation Details
In this section, we introduce some of the implementation details that were used in the
empirical analysis portion of this work. The implementation choices were all made with
the goal of reducing the potential variance introduced into the estimator while creating the
baseline scores for each instance of the domain.
25

4.4.1 Strategy Sampling
While a single sample of the baseline agent in self-play can be used to create each Y βi , any
stochasticity inherent in the baseline agent can add variance to the resulting agent baseline
estimator, lowering its effectiveness. One way to overcome this variance would be to compute
the expected value of the baseline agent in self-play for each qi observed instance, effectively
reducing the variance of Y β to zero. This expected value computation may not be practical
in many domains, as it can be computationally expensive to perform an enumeration of all
possible self-play sequences for each qi. Instead of doing the full expected value computation,
multiple samples of the baseline agent’s self-play can be used to compute the values of Y β .
That is, for each observed instance, qi, we can compute Y βi as the average of m independent
samples of the baseline agent self-play. Each jth sample is computed by drawing different
self-play action sequences from the baseline agent, denoted as sj(qi). The new equation
used to create the control variable for the agent baseline estimator becomes
Y βi =1
m
m∑j=1
sj(qi) (4.2)
We refer to this technique as strategy sampling, which reduces the variance of the basic agent
baseline estimator and results in more accurate estimates.
The magnitude of this reduction depends on both m, the number of samples being averaged,
the amount of variance in the baseline agent’s policy used in creating the baseline scoring
function. Unfortunately this means that in order to set the value of m in a principled
manner for a particular domain, one must consider the costs of generating samples of the
baseline agent’s self-play scores and the variance inherent in the baseline agent’s policy.
4.4.2 Random Completion
Analogous to strategy sampling, one can also sample certain aspects of the environment
when creating the baseline scores. Similar to the private information importance sampling
approach [7], future chance events that were unobserved in each qi instance, can be randomly
sampled when computing the baseline score for qi, as long as they would have had no impact
on the values of Xi. For instance, in the game of poker, if one of the player folds before
the final round, the unobserved cards have no impact on the score of the hand, and thus
could have been any of valid remaining cards. Where the basic approach to creating agent
baseline estimators would assign the unobserved future chance events to a single instance,
the random completion method instead samples these unobserved future chance events,
using the average self-play score of these samples as the baseline score for the particular
26

instance. Let c : q → q′ denote the function that generates an instance of the domain, q′,
which shares a common chance prefix with q, but has randomly generated future chance
events. For example, if q represents a hand of Texas hold ’em poker that ended before all
five of the public cards were dealt, q′ represents the same hand of poker where any missing
board cards are randomly dealt from the deck.
Then, for each qi, the agent baseline estimator’s control is computed as the average over m
samples of c(qi). By combining this with the aforementioned strategy sampling approach,
the resulting equation for the control is then
Y βi =1
m
m∑j=1
sj(cj(qi)) (4.3)
The effectiveness of the random completion approach depends both on how much of the
variance in the agent baseline estimator was due to randomness in the environment and
how that randomness impacted the baseline score. A similar analysis to that of the strategy
sampling approach must be done in order to set the value of m effectively, taking into
consideration the costs associated with sampling the environment and the agents. This
method can also be combined with strategy sampling, and assigning the number of samples
to each technique depends on the amount of variance that is inherent in the environment
and the variance of the baseline agent’s policy.
4.4.3 Use With Importance Sampling
The importance sampling techniques introduced by Bowling et al. [7] can also be used in
conjunction with the agent baseline approach. By applying an importance sampling function
to the outcome of the agent baseline scoring function for each observed instance, we can
compute a lower variance control for use in the estimator. Given an importance sampling
function, I, the function that computes Yβ becomes
Y βi = I(s(qi)) (4.4)
Importance sampling can also be combined with the either the strategy sampling or random
completion agent baseline implementations.
4.5 Evaluation
The agent baseline approach was evaluated using the variants of Texas hold ’em poker from
the Annual Computer Poker Competition and the modified version of the Trading Agent
27
Ad-Auction Competition described in Section 2.4.2. For each of the evaluation domains,
the details of the evaluation methodology are provided first, and followed by the results
of the experimentation. In the poker domains, the agent baseline estimator was compared
to the duplicate estimator, denoted as DUP, when applicable. The duplicate approach
was chosen as the performance benchmark due to it’s comparable simplicity to the agent
baseline approach and the fact that it was the agent evaluation technique used to evaluate
the matches in the 2013 ACPC [1].
For all of the no-limit evaluation, the data was pre-processed using all-in equity, a technique
that adjusts the value of hands that went all-in to reflect the expected value given the cards
known to the players at the time of an all-in. The all-in equity technique tends to help reduce
variance since the range of payouts being evaluated becomes smaller after it is applied.
The performance of each estimator is measured as one minus the ratio between the standard
error of the mean (SE) when using the estimator versus the standard error of the mean when
using a pure Monte Carlo (MC) approach. This ratio is presented as a percentage value and
referred to as the reduction percentage for a given estimator. Higher percentages correspond
to better reductions in variance, with values of 100% translating to zero-variance estimators.
Conversely, a value of 0% means that the estimator did not reduce the variance of the Monte
Carlo estimation. Negative numbers are also possible, which would imply that the estimator
actually increased the variance of the estimate. The intuition behind using this measure is
that an estimator with lower standard error will have more accurate estimated confidence
intervals, which translates to a better estimate of the true performance of an agent.
The question of cost is also an important part of comparing evaluation techniques, and will
be discussed for the different estimators employed in each domain.
4.5.1 Texas Hold ’em Poker
Experimental Design
The agent baseline approach in the domain of Texas Hold ’em poker was predominately
evaluated using data from the 2013 Annual Computer Poker Competition (ACPC). In ad-
dition to the analysis performed on the ACPC dataset, the agent baseline approach was
evaluated using two 1000-hand human versus computer-agent matches and one 4500-hand
human versus computer-agent match in the domain of two-player no-limit Texas hold ’em.
The human competitors in these matches were all high-calibre poker players and the com-
puter agents were of the same quality as the top entries in the 2013 ACPC two-player
no-limit competition.
28
Evaluation of the ACPC matches was performed on two different datasets based on the
competition data, referred to as the top-competitors and all-competitors datasets. The top-
competitors dataset was a subset of the competition data that consisted of only the matches
between the best competitors for the given competition. The all-competitors dataset simply
contained all of the matches for the competition. Since there are two different ways winners
are decided in the ACPC competitions, the top-competitors dataset for each of the two-
player variants contained the five best agents as determined by each of the different winner
selection methods. This resulted in the dataset containing a total of eight different agents
for the two-player limit variant while there were only five in the two-player no-limit variant.
Due to the lack of entrants in the three-player limit competition, only the matches containing
two of the top three agents were included in the three-player top competitor dataset.
In order to fairly compare agent baseline estimators against duplicate and Monte Carlo
estimators, we treated the duplicate ACPC matches as independent samples in both the
Monte Carlo and agent baseline evaluations. As such, matches that did not contain a
corresponding duplicate entry were not included in the evaluation data.
The agent baseline estimators used in these experiments were implemented using the random
completion technique and setting m = 50. The choice of m was determined to be an
acceptable cost-performance trade-off for the evaluation of the agent baseline estimators.
The baseline agent for each estimator was chosen to be a fast-acting competition-grade
agent that did not appear in any of the evaluation data. The value of c from Equation 4.1
was chosen to be an estimate of c∗ by using Equation 2.11 on a 10% hold-out dataset for
each of the different agent match-ups.
Cost Analysis
The cost of estimation when using agent baseline estimators depends predominantly on
the time it takes to draw samples from the baseline agent in self-play. That is, if the
cost of drawing one self-play sample of a baseline agent is α, and the cost of drawing
one sample of two observed agents playing is γ, then the cost of the estimation is simply
α + γ. Comparing the cost of creating a random completion estimator with the cost of
creating a duplicate estimator means simply measuring the difference in mα to 2γ. That
is, when mα < 2γ, agent baseline estimation is more efficient than the duplicate equivalent.
This is almost always true when we are evaluating slow-acting computer agents or human
agents, since we typically have control over both α and m and not γ. Also, it may not be
possible to draw further samples of the agents interacting, for which γ is effectively infinite.
29
Furthermore, the cost of creating agent baseline estimators can also be reduced by reusing
the baseline score calculations when creating estimators for multiple matches that share the
same random seeds. For large competitions with many different competitor pairings that
share random seeds, such as the ACPC competitions, this amortization effectively makes
the cost of creating agent baseline estimators zero. All of this analysis assumes that the
resulting performance of each estimator is equal.
Two-Player Limit ACPC Results
A bar plot displaying the performance of the duplicate and agent baseline estimators, eval-
uating the agents from the 2013 ACPC two-player limit competition, is presented in Figure
4.1. This bar plot displays the average performance for each of the estimators when applied
to each of the matches in the top-competitors and all-competitors datasets. Also displayed in
this figure is an estimated 95% confidence interval for each estimator’s average performance
computed as 1.96 ∗ SE, where SE is the standard error of the mean for the estimators per-
formance on the dataset. A line denoting the value of the agent baseline’s lower confidence
interval in included to help visualize any claims of statistical significance.
Both of the bar plots show that the agent baseline estimators have a higher average per-
formance than the duplicate estimators, although not by a statistically significant margin.
Also clear is the higher average performance of both estimators when evaluating the top
echelon of competitors. The average performance of the agent baseline estimators increases
from 49.8% to 64.5% between these two datasets and the duplicate estimators have a nearly
identical increase.
A more in-depth look at the results of the estimators used to evaluate the agents in the top-
competitors dataset is shown in Table 4.1. Here we can see that when evaluating matches
containing the best agents in the competition, the agent baseline estimators are strictly
better than their duplicate counterparts. Appendix A, A.2, shows the full evaluation for
each of the estimators performed on the all-competitors dataset. This table shows that
agent baseline estimators outperform the duplicate estimators in 73.3% of the matches.
Considering that the cost of the agent baseline evaluation is amortized by the shared seeds
between each pairing of competitors in ACPC competitions, evaluation using agent baseline
estimators should be considered as a replacement for duplicate estimation in future two-
player limit ACPC tournaments.
30

Aβ DUPTop Competitors
0
10
20
30
40
50
60
70
Stan
dard
Err
or R
educ
tion
( % )
Aβ DUPAll Competitors
0
10
20
30
40
50
60
70
Stan
dard
Err
or R
educ
tion
( % )
Figure 4.1: 2013 ACPC Two-Player Limit Average Estimator Performance
Match Name MC SE DUP SE Aβ SE DUP % Aβ %
hyperborean iro/littlerock 9.42 3.56 3.26 62.25 65.33
hyperborean iro/marv 9.41 3.06 2.74 67.48 70.9
hyperborean iro/neopokerlab 10.22 3.5 3.28 65.76 67.94
hyperborean iro/zbot 6.49 2.33 2.15 64.03 66.78
hyperborean tbr/littlerock 9.8 4.17 4.07 57.47 58.5
hyperborean tbr/marv 10.51 4.05 3.96 61.43 62.29
hyperborean tbr/neopokerlab 10.64 4.35 4.28 59.15 59.82
hyperborean tbr/zbot 10.64 4.37 4.33 58.93 59.34
littlerock/marv 10.11 3.5 3.42 65.4 66.23
littlerock/neopokerlab 10.23 3.89 3.74 62.0 63.43
littlerock/zbot 10.26 4.01 3.87 60.95 62.29
marv/neopokerlab 10.14 3.35 3.22 66.96 68.2
marv/zbot 10.15 3.45 3.34 66.03 67.11
neopokerlab/zbot 10.27 3.73 3.67 63.7 64.22
Table 4.1: 2013 ACPC Two-Player Limit Top-Competitors Results
Three-Player Limit ACPC Results
The average performance of the duplicate and agent baseline estimators for the 2013 ACPC
three-player limit competition is displayed in Figure 4.2. Both estimators are not nearly
31

as strong in this poker variant as they are for two-player limit, with the agent baseline
estimators only achieving an average performance of 28.6% on the all-competitors dataset.
Once again, both duplicate and agent baseline estimators see a boost in their average per-
formance when evaluating agents in the top-competitors dataset. This gain is roughly 5%
for the agent baseline estimators and only 2% for the duplicate estimators. Similar to the
two-player limit analysis, the agent baseline estimators have a higher average performance
for both datasets, although the difference is still without statistical significance.
Aβ DUPTop Competitors
0
5
10
15
20
25
30
35
40
Stan
dard
Err
or R
educ
tion
( % )
Aβ DUPAll Competitors
0
5
10
15
20
25
30
35
40
Stan
dard
Err
or R
educ
tion
( % )
Figure 4.2: 2013 ACPC Three-Player Limit Average Estimator Performance
Table 4.2 provides a breakdown of the performance of both agent baseline and duplicate
estimators on the top-competitors dataset for this domain. This table shows that the agent
baseline estimators have better overall performance than the corresponding duplicate esti-
mators in all but two of the matches. Table A.2, presented in Appendix A, contains the
performance of the estimators on the all-competitors ACPC dataset, the results of which
show the agent baseline estimators outperforming the duplicate estimators in 63.3% of the
matches. The performance of agent baseline estimators, combined with the costs associated
with the six-way duplicate evaluation performed by the ACPC suggest that using duplicate
estimation in the three-player limit competition should be replaced by the agent baseline
approach for future competitions.
Two-Player No-Limit ACPC Results
Figure 4.3 shows the average performance of the agent baseline and duplicate estimators
for the 2013 ACPC two-player no-limit competition matches. The graphs in this figure
32

Match Name MC SE DUP SE Aβ SE DUP % Aβ %
HITSZ/littlerock/hyperborean iro 22.58 16.33 15.88 28.31 29.77
HITSZ/littlerock/hyperborean tbr 24.51 17.37 17.5 29.47 28.68
liacc/littlerock/hyperborean iro 26.41 21.36 18.01 20.3 31.93
liacc/littlerock/hyperborean tbr 27.75 21.41 19.0 23.59 31.62
littlerock/hyperborean iro/kempfer 17.85 11.41 10.93 35.84 38.64
littlerock/hyperborean tbr/kempfer 18.8 12.18 11.87 34.92 36.78
neopokerlab/HITSZ/hyperborean iro 22.51 16.42 16.03 27.65 28.88
neopokerlab/HITSZ/hyperborean tbr 24.61 17.53 17.77 29.06 27.84
neopokerlab/HITSZ/littlerock 22.16 16.32 15.95 26.95 28.09
neopokerlab/hyperborean iro/kempfer 17.38 11.7 10.98 32.55 36.75
neopokerlab/hyperborean tbr/kempfer 18.54 12.69 12.22 31.54 34.04
neopokerlab/liacc/hyperborean iro 26.43 22.07 18.98 17.52 28.26
neopokerlab/liacc/hyperborean tbr 27.74 22.29 19.99 20.3 27.93
neopokerlab/liacc/littlerock 26.3 22.25 19.18 16.51 27.12
neopokerlab/littlerock/hyperborean iro 13.04 7.16 6.56 45.05 49.64
neopokerlab/littlerock/hyperborean tbr 19.23 11.04 10.32 42.59 46.35
neopokerlab/littlerock/kempfer 17.36 11.7 11.23 32.54 35.25
Table 4.2: 2013 ACPC Three-Player Limit Top-Competitors Results
show that the duplicate and agent baseline estimators achieve a nearly identical average
performance of approximately 20% when evaluating the top-competitors dataset. When
comparing the estimators on the entire population of agents for this competition, the dupli-
cate estimators perform only slightly better on average, with a mean performance of around
15% compared to the 14% realized by the agent baseline estimators. Once again however,
these differences are not of statistical significance.
Analyzing the full top-competitor results from Table 4.3 further reinforces this equality. On
this dataset, the agent baseline estimators perform only slightly better that the duplicate
estimators on just over half of the matches. Table A.3 in Appendix A shows the results of
these estimators for the all-competitors dataset, from which the duplicate estimators achieve
a better average performance than the agent baseline estimators on just 55% of the matches.
These results show that both duplicate and agent baseline estimators perform equally well
in this domain.
33

Aβ DUPTop Competitors
0
5
10
15
20
25
Stan
dard
Err
or R
educ
tion
( % )
Aβ DUPAll Competitors
0
5
10
15
20
25
Stan
dard
Err
or R
educ
tion
( % )
Figure 4.3: 2013 ACPC Two-Player No-Limit Average Estimator Performance
Match Name MC SE DUP SE Aβ SE DUP % Aβ %
hyperborean iro/koypetition 50.26 41.27 40.19 17.88 20.04
hyperborean iro/nyx 27.63 22.13 22.14 19.91 19.86
hyperborean iro/slumbot 11.44 8.94 8.85 21.87 22.68
hyperborean iro/tartanian6 46.58 35.95 36.96 22.82 20.66
hyperborean tbr/koypetition 51.61 43.73 42.8 15.27 17.08
hyperborean tbr/nyx 37.81 31.03 31.49 17.93 16.73
hyperborean tbr/slumbot 34.55 28.24 28.02 18.27 18.89
hyperborean tbr/tartanian6 50.22 41.08 42.22 18.21 15.93
koypetition/nyx 45.17 35.7 35.21 20.97 22.06
koypetition/slumbot 46.59 37.02 35.9 20.54 22.95
koypetition/tartanian6 48.18 38.14 37.5 20.85 22.16
nyx/slumbot 22.14 17.16 17.13 22.52 22.63
nyx/tartanian6 39.56 30.93 31.35 21.8 20.75
slumbot/tartanian6 37.73 29.46 29.49 21.91 21.83
Table 4.3: 2013 ACPC Two-Player No-Limit Top-Competitors Results
Two-Player No-Limit Human vs Computer-Agent Results
Table 4.4 provides the results for the two 1000-hand human versus computer-agent matches
that were run using the duplicate-like approach previously executed in the two-player limit
34

man versus machine competitions [19]. The duplicate estimator in this approach is created
by having both human players play against the computer agent with their cards swapped.
Since this type of evaluation does not allow for individual skill to be assessed, the duplicate
estimator is left blank for these entries in the table.
Match MC MC SE Aβ SE DUP SE Aβ % DUP %
Match A Human 1 39.55 491.12 403.51 — 17.84 —
Match A Human 2 -1597.75 683.90 557.11 — 18.54 —
Match A Team -779.1 421.28 346.88 315.54 17.66 25.1
Match B Human 1 78.78 465.62 379.94 — 18.40 —
Match B Human 2 -146.63 442.31 287.99 — 34.89 —
Match B Team -33.93 321.04 239.49 239.52 25.40 24.39
Table 4.4: Two-Player No-Limit Human vs Computer-Agent Results (1000-Hand Matches)
In match A, the duplicate estimator achieves the best performance when evaluating the
team play, and both the agent baseline estimator and duplicate estimator are nearly equal
for match B’s team evaluation. TheMC column shows the win-rate for each of the players
or for the team, the units of which are in mili-big-blinds per hand (mbb/h), a standard unit
of measure for this domain. This is provided in order to demonstrate how using duplicate
estimators in the human versus computer-agent setting can be extremely misleading. When
combining the two human players’ scores and computing a 95% confidence interval, the
team loses with confidence in match A. This is solely due to the horrible performance of
Human 2 in this match. Given the choice, it is obvious that Human 1 would prefer to
be evaluated alone since the results show a statistical tie for this player. Being able to
individually evaluate players is one large advantage that agent baseline estimators have over
duplicate estimators when evaluating human players.
4.5.2 Trading Agent Competition: Ad Auctions
Experimental Design
In order to test the performance of agent baseline estimators in domains where no other
methods of efficient evaluation are typically performed, we evaluated agents in a mock
Trading Agent Ad Auction tournament [22]. This experiment involved using six open-
source agents and two random agents in order to create an eight-player tournament. The
two random agents were used due to a lack of available open source agents and the software
35

not supporting fewer than eight agent tournaments. The tournament consisted of 100 ten-
day matches, where each of the agents was assigned a random specialization before the
beginning of each match. This provided a mechanism for capturing the environmental
stochasticity needed to create the agent baseline estimators. Three different agent baseline
estimators were created using three of the six open-source agents from the tournament. For
practicality reasons surrounding the computational time required to run a tournament, only
one sample of each baseline agent’s self-play was used to create the corresponding baseline
estimator.
Results
Table 4.5 shows the resulting standard error reduction for each of the competitors when
being evaluated using the three agent baseline estimators based on the epfl, crocodile and
metroclick bots, respectively labeled Aβ1 ,Aβ2 and Aβ3 . The effects vary, ranging from a 0.1%
to a 53% reduction in the standard error, with the agent baseline estimator Aβ3 having the
best overall performance. As only one self-play sample was used in the calculation due to
the unavailability of a fast-acting baseline agent, additional performance gains are likely
to be realized by using the strategy sampling techniques. This experiment does however
show that agent baseline estimators should be considered for competitions of this nature,
especially in the absence of other efficient evaluation techniques.
Player MC SE Aβ1 SE Aβ2 SE Aβ3 SE Aβ1 % Aβ2 % Aβ3 %
tau 0.689 0.635 0.636 0.551 7.78 7.64 19.98
crocodile11 0.862 0.851 0.851 0.812 1.36 1.28 5.82
crocodile 1.01 0.825 0.953 0.805 18.30 5.65 20.31
epfl 1.245 1.217 1.210 1.178 2.26 2.80 5.34
metroclick 1.449 1.308 1.267 0.677 9.72 12.59 53.25
Schlemazl 0.923 0.922 0.923 0.922 0.12 0.01 0.17
Table 4.5: TAC-AA Tournament (100 Ten-Day Matches)
36

Chapter 5
Data Baseline
The data baseline approach is another application of the basic baseline approach from Chap-
ter 3 and marks the second major contribution of this work to the field of agent evaluation
techniques. Data baseline leverages the availability of large volumes of player data to create
the baseline scoring function for use in agent evaluation. In this chapter, we will describe
the motivation behind the data baseline approach, as well as the general approach to imple-
menting estimators of this nature. We will also provide the details of the empirical analysis
used to evaluate the performance of data baseline estimators in the domain of Texas hold
’em in addition to the specifics involved with the implementation of data baseline estimators
for this domain.
5.1 Motivation
The data baseline approach is designed to address the problems with the agent baseline
approach in situations where there are no readily available competent computer agents for
the evaluation domain. One possible solution to this problem would be to try and use simple
rule-based agents to create the necessary agent baseline scores. This solution is unlikely to
be effective since the power of agent baseline estimators comes from the correlation between
the baseline agent’s self-play and that of the agents being evaluated. Another solution would
be to simply create a competent agent to use as the baseline agent. This solution is also
problematic due to the large amount of effort involved with engineering an agent of the
required skill.
The data baseline approach solves this issue for domains where there are volumes of data
consisting of players competing with one another. Data baseline uses this existing player
37

data directly in the computation of the baseline scores, thus removing the need for an
underlying baseline agent. Fortunately, player data is often a much more abundant resource
than competitive computer agents in many domains, especially those for which there are
large communities of human players. Also potentially beneficial to using this type of data is
the likelihood of higher correlation when evaluating similar types of players. An example of
this would be to use human data when evaluating human players. In fact, we hypothesize
that using data baseline created with tailored data would produce highly efficient estimators
capable of better performance than agent baseline estimators in domains where both can
be created.
5.2 Creating the Baseline Estimator
In order to create a data baseline estimator, one must provide the necessary baseline scoring
function, β(Q), in order to create the control variable Y β . While there are conceptually
many different ways to create this mapping using existing player data, we will outline several
possible implementations, starting with the obvious mapping that assumes there is a perfect
match in the player data for each instance being evaluated. In what follows, it is assumed
that a dataset D = {(q1, u1), (q2, u2), . . . , (qn, un)} exists, and contains examples of agents
interacting on instances of the domain in question, qi, along with the utilities, ui, the agents
received on that domain instance.
5.2.1 Perfect Matching
One option for creating β(Q) is to simply find an exact match in the dataset for the domain
instance being evaluated, which we call q ∈ V al(Q). In other words, if the dataset D
contains instances where the exact environmental realization from the evaluation domain
instance occurred (q ∈ D), then the mapping simply returns the value obtained for each
agent on that instance from the dataset. If q /∈ D, we return zero for the instance. If
more than one instance in D corresponds to any given q, then the average utility values are
returned. Let D(q) ⊆ D be the set of instances (qi, ui) in the dataset D such that q = qi.We
can now define the Perfect Match function PMD : V al(Q)→ R as
PMD(q) =
{1
|D(q)|∑
(qi,ui)∈D(q) ui if |D(q)| > 0
0 otherwise(5.1)
A perfect matching implementation of data baseline is then created using β = PMD to
generate the values for Y β . The agent baseline approach is actually a special case of the
38

perfect matching implementation where the perfect matches are generated post-hoc using a
computer agent in self-play, either by sampling the agent once for each instance or multiple
times in the case of the strategy sampling technique.
5.2.2 Nearest Neighbour
Since in most domains it is unlikely that there exists an exact match in our dataset, D,
for every possible domain instance, q ∈ Q, another option is to instead return the value
of the nearest match. The hope here is that by choosing nearby matches, the values will
be very close to the values of an exact match if it were to exist. For some domains, the
notion of distance over domain instances may be ill-defined, leaving us with no explicit way
to return the nearest match. In these situations, the intuitive approach is to first map
domain instances to some d dimensional feature space, Rd, both when constructing D and
querying D for a match. By doing this, we can use a well-defined distance measure such
as Euclidean distance when searching D. Let φ : V al(Q) → Rd be the function that maps
domain instances to a d dimensional feature vector. We define the function NEL, which
returns the entry (qi, ui) in D, such that qi minimizes the L-distance in the feature space
to the input domain instance q.
NELD(q) = arg min(qi,ui)∈D
L(φ(q), φ(qi))
The Nearest Neighbour function NNLD : V al(Q)→ R then simply returns the utility value,
u, of nearest entry,
NNLD(q) = NELD(q)[2]
where the [i] operator returns the i-th element of a dataset entry, which in this case is the
utility value of the nearest database entry. The nearest neighbour data baseline approach
then proceeds by setting β = NND.
5.2.3 k-Nearest Neighbour
One possible shortcoming of the previous idea is that depending on a single returned entry
could lead to high variance in the control variate, which decreases the amount of variance
reduction that can be achieved by the resulting baseline estimator. Instead of returning a
single nearest entry, we can instead have the mapping function return the k nearest entries
in the dataset and average their values. We refer to this as the k-Nearest Neighbour mapping
function. More precisely, if we let k-NELD(q) return the k nearest entries from dataset D,
39

according to distance metric L in the feature space, then the k-Nearest Neighbour function
k-NNLD : V al(Q)→ R can be defined as
k-NNLD(q) =
1
k
∑(qi,ui)∈k-NEL
D(q)
ui
(5.2)
The k-Nearest Neighbour data baseline estimator is then created by setting β = k-NNLD.
In all cases, the resulting data baseline estimator, Dβ, is defined as
Dβi = Xi − c(Y βi − E[Y β ]) (5.3)
5.2.4 Comparisons to MIVAT
Much in the same ways that agent baseline approach is similar to DIVAT, the data baseline
approach also shares some properties with the MIVAT approach to agent evaluation. Both
the data baseline and MIVAT techniques require a pre-existing volume of player data in order
from which to create an estimator as well as a method of mapping player data to features
space. The main difference between these two techniques, aside from the way in which the
estimators are applied, revolves around the types of features required by each technique and
how the features are used. Since the MIVAT approach makes use of the player data as a
part of a closed-form optimization, in order for the optimization to be tractable, the value
function needs to be linear in the features imposed on the data [24]. The data baseline
approach however imposes no such restriction when using the proposed nearest-neighbour
method of searching for baseline scores. Although the use of non-linear features within the
data baseline approach is not explored in this work, removing such a restriction makes data
baseline a more flexible approach than MIVAT for creating estimators from existing player
data.
5.3 Proof of Unbiasedness for Zero-Sum Domains
Regardless of the chosen mapping from dataset instances to baseline scores, in order for the
resulting data baseline estimator to be unbiased, we either need to know the value of E[Y β ]
or show that it is zero. By assuming that the data baseline estimators are operating in zero-
sum domains, we can use the conditions outlined in Section 3.2 to prove that these mapping
functions produce an expected value of zero for the control variable Y β . The first of these
conditions is held trivially via our domain assumption. The second and third conditions
only depend on the environment, and as such the choice of the β baseline scoring function
40

does not impact this. The fourth and fifth conditions are satisfied directly for each of the
mapping functions we provided since none of them depend on the actions of the agents
for a given domain instance nor will they return a different set of values anytime they are
called for a given domain instance. Thus, any choice of mapping function that satisfies these
conditions in a zero-sum domain will produce an unbiased data baseline estimator, the three
aforementioned mapping functions being examples of this.
5.4 Implementation Details
In this section we introduce the data baseline implementation details that were used in the
evaluation. Specifically, we provide the details regarding the data structure used to store
the dataset and the choices involved when implementing the baseline scoring function. The
data baseline estimators used in the empirical analysis were all created using the k-Nearest
Neighbour (k-NN) baseline scoring function using Euclidean distance. Since all of the
evaluation was done using Texas hold ’em domains, many of the implementation choices are
specific to player data within this domain.
5.4.1 Storage
Recall that the k-Nearest Neighbour mapping function requires a search over the baseline
dataset, D, where each instance is mapped to a feature vector in Rd. A naıve search for
a nearest entry in our dataset could take O(n) time, which for large datasets would be
very costly. We instead use a kd-tree [5] data structure as a way to store the dataset while
allowing for efficient searches over the data. A kd-tree is essentially a multi-dimensional
binary search tree [9], where k refers to the dimensionality of the search space. Nearest
neighbour queries for a given point when using kd-trees are O(log n) as long as the tree
remains balanced, a condition that is fairly easy to enforce when no deletions or insertions
are performed after initial construction of the tree.
5.4.2 Feature Representation
The features chosen to represent the data are based on the notion of expected hand strength, a
function that maps poker hands to real numbers according to their likelihood of winning [14].
Each hand in the dataset is represented by an eight dimensional feature vector whose entries
correspond to the expected hand strength for each player, given their private cards and the
41

public cards available during each round of the game. For example, the hand Q♦J♠ vs
Q♥K♥ with the board cards J♦K♠8♥6♥2♣, has a corresponding feature vector of [0.581,
0.634, 0.784, 0.866, 0.776, 0.899, 0.794, 0.891]. If a hand is incomplete, meaning that it is
missing board cards due to players folding before the river round, random board cards are
used for these rounds when generating the feature vector. This was done to ensure that
information corresponding to the players’ actions is not unintentionally encoded into the
feature space representation for the hand, potentially biasing the estimation.
5.4.3 Sensitivity of k
The value of k used in the k-Nearest Neighbour data mapping for each of the different types
of Texas hold ’em was determined through a parameter study using past ACPC data. Data
baseline estimators were created using the past ACPC data for each of the ACPC poker
domains and evaluated using a small subset of holdout data. The average performance of
the resulting estimators was recorded for varying values of k, the results of which can be
seen in Figure 5.1. This graph shows that the best choice of k within each of the poker
variants was fairly robust to change with little variance in performance across k values.
The peak performance was around k = 16 for both two-player and three-player limit Texas
hold ’em and around k = 128 for two-player no-limit Texas hold ’em. We speculate that
the discrepancy between the optimal k values for no-limit and limit games centre around
the variance in the payouts between the two games coupled with the variance intrinsic
in the policies of the various agents. Given that the range of payouts for no-limit games
is much greater than their limit counterparts, it is very possible that any given hand may
realize a wide variety of payouts in both the evaluation and query datasets. While averaging
out the values of many near hands when creating the estimator helps to achieve a better
baseline score for each no-limit hand, a better solution would be to have many samples of
the stochastic agents playing the same hand and average the values of those samples. Based
on these results, we set k = 16 for the limit variants of poker and k = 128 for the no-limit
variants in our experimentation.
5.4.4 Dataset Size
In order to grasp the impact that the size of the data baseline dataset has on the performance
of the resulting baseline estimator, we experimented with datasets of different sizes in the
ACPC poker domains using random subsets drawn from the 2013 ACPC data. The graph in
Figure 5.2 shows the effect that varying the amount of available data has on the performance
42

20 21 22 23 24 25 26 27 28 29 210 211 212
k
0
5
10
15
20
25
30
Sta
ndard
Err
or
Reduct
ion (
% )
Two Player Limit
Three Player Limit
Two Player No-Limit
Figure 5.1: Sensitivity of k for k-NN Search
of the data baseline estimator for each of the domains. As expected, the performance of
the estimator increases as the number of hands contained in the dataset increases, with
somewhat diminishing returns. As suggested by these results, in order achieve the best
possible performance during the evaluation, we decided to include as much data as was
available when implementing each data baseline estimator.
102 103 104 105 106 107
Size of Dataset
0
10
20
30
40
50
Sta
ndard
Err
or
Reduct
ion (
% )
Two Player Limit
Three Player Limit
Two Player No-Limit
Figure 5.2: Performance for Varying Sizes of the Baseline Dataset
43

5.5 Evaluation
The data baseline approach was evaluated using the same three Texas hold ’em domains
that were used in the agent baseline evaluation. This was done in order to compare the
performance of data baseline estimators to agent baseline estimators in domains where
both can be used. However, in many applications, a competent agent may be unavailable,
making data baseline the only choice. In this evaluation, we explore how different datasets
impact the performance of the data baseline estimators when evaluating both human and
computer agents in order to test the hypothesis that using datasets representative of the
types of players being evaluated will increase the performance of the data baseline estimator.
Additionally, we also simulate the scenario of evaluating agents in domains where there are
no competitive agents by comparing the performance of data baseline estimators to agent
baseline estimators created using simple rule-based agents. As with the evaluation done
with the agent baseline estimators, the results are mainly reported as the reduction in
standard error between the various estimators and the Monte Carlo approach and presented
as percentage values. Once again, all of the no-limit evaluation, the data was pre-processed
using the all-in equity variance reduction technique.
5.5.1 ACPC Texas Hold ’em Poker
Experimental Design
Evaluation of the data baseline approach was performed using the ACPC match data from
each of the three 2013 competitions. For each of the different competitions, we compared
the performance of data baseline estimators to the performance of various agent baseline
estimators. Replicating the agent baseline experimentation, the estimators are evaluated
using the same top-competitor and all-competitor datasets for each of the competitions.
For all of the evaluation performed on the top-competitors and all-competitors ACPC
dataset, past ACPC data was used as the internal dataset for the baseline estimators. This
past data amounted to roughly two million unique hands for each of the the two-player games
and around three hundred thousand unique hands for three-player limit. In the two-player
limit analysis, data baseline estimators were also created using a dataset that consisted of
nearly five million hands of human players of varying skill playing against competition grade
computer agents.
As a benchmark, agent baseline estimators were created for each domain by using a com-
petition level agent that did not appear in the 2013 competitions. In order to simulate a
44

likely approach in a domain where this level of agent does not exist, we created three more
agent baseline estimators using simple rule based approaches: always-call, call-or-raise and
random. The always-call (AC) agent only performs the call action, which was shown by Kan
et al. to be an effective choice of policy for creating DIVAT estimators in two-player limit
games [6]. The call-or-raise (CR) agent chooses actions with a 50% chance of calling and a
50% chance of making any raise and the random (RAND) agent acts with equal probability
of performing any valid action.
Cost Analysis
The costs of creating data baseline estimators for use in this type of evaluation consist of
the cost required to populate the data structure used to store the estimator’s dataset and
the cost of generating the various baseline scores for each observed hand. This assumes
that there already exists a corpus of player data that can be used as the internal dataset.
Storing the data in a kd-tree, as per our implementation, requires O(rn log n) time to build
the tree, where r is the dimensionality of the feature representation of the data and n is
the number of data points being added to the tree. The dominating cost then comes from
creating the baseline scores for each observed hand. Unlike the agent baseline approach,
where generating a baseline score for an observed hand was O(1), the cost of generating
the baseline scores is on the order of O(k log n) (or in the worst case O(kn2)) for a fixed
choice of k when using the chosen k-Nearest Neighbours search to build the data baseline
estimator. Fortunately, the cost of using data baseline for the evaluation is still likely to be
lower than the cost of gathering additional samples from computer agents who are slow to
act. Once again these costs can also be amortized by reusing data baseline estimators when
evaluating competition data where matches share the same random seeds.
Two-Player Limit ACPC Results
Figure 5.3 shows the results of the different baseline estimators when evaluating the 2013
ACPC two-player limit competition data. The data baseline estimators built using the
past ACPC data and the human versus computer-agent data, Dβ(ACPC) and Dβ
(HUMAN),
achieve nearly equal performance in this analysis. Both estimators average a reduction in the
standard error of approximately 44% when evaluating the all-competitors dataset, and this
performance increases nearly 5% when evaluating the top-competitors dataset. The data
baseline estimators also outperform the simple rule-based agent baseline estimators, Aβ(AC),
Aβ(CR), and Aβ(RAND), with statistical significance, albeit by a small margin. Their average
performance is comparable to the competition level agent baseline estimators, Aβ(COMP ),
45

with only a 5% difference separating the two techniques. The fact that the data baseline
estimators built using human or ACPC data have almost identical performance in this
domain suggest that there is an advantage to using a tailored dataset when evaluating
agents, since the human dataset contained nearly 2.5 times as many entries as the ACPC
dataset. This analysis also suggests that the data baseline estimators are less sensitive to
the types of players being evaluated than agent baseline estimators, due to the significantly
smaller drop in performance between the top-competitor and all-competitor evaluations.
Aβ(COMP) D
β
(ACPC)D
β
(HUMAN)Aβ(AC) A
β(CR) A
β(RAND)
Top Competitors
0
10
20
30
40
50
60
70
Sta
ndard
Err
or
Reducti
on (
% )
Aβ(COMP) D
β
(ACPC)D
β
(HUMAN)Aβ(AC) A
β(CR) A
β(RAND)
All Competitors
0
10
20
30
40
50
60
70
Sta
ndard
Err
or
Reducti
on (
% )
Figure 5.3: 2013 ACPC Two-Player Limit Average Estimator Performance
Three-Player Limit ACPC Results
Consistent with the two-player limit ACPC evaluation, Figure 5.4 shows that the estimators
built using the data baseline approach perform better than all of the simple rule based agent
baseline estimators with 95% confidence. Also consistent with the two-player limit ACPC
evaluation is the 5% gap between the average performance of the competitive agent baseline
and data baseline estimators when evaluating the all-competitors dataset for this compe-
tition. The average performance of the data baseline estimators on the top-competitors
dataset is nearly identical to their performance on the all-competitors dataset, whereas the
estimators created with the agent baseline approach suffer nearly a 5% drop in average per-
formance between the two evaluation datasets. This further suggest that the performance
of data baseline estimators is not sensitive to the varying skill of the agents being evaluated.
46

Aβ(COMP) D
β
(ACPC)Aβ(AC) A
β(CR) A
β(RAND)
Top Competitors
0
5
10
15
20
25
30
35
40
Sta
ndard
Err
or
Reducti
on (
% )
Aβ(COMP) D
β
(ACPC)Aβ(AC) A
β(CR) A
β(RAND)
All Competitors
0
5
10
15
20
25
30
35
40
Sta
ndard
Err
or
Reducti
on (
% )
Figure 5.4: 2013 ACPC Three-Player Limit Average Estimator Performance
Two-Player No-Limit ACPC Results
The results for the evaluation of the 2013 ACPC two-player no-limit matches are presented
in Figure 5.5. The average performance of the data baseline estimators are once again
slightly better than all three of the rule-based agent baseline estimators with 95% confidence.
When evaluating the all-competitors dataset, the estimators created using the data baseline
approach are able to achieve an average reduction in the standard error of approximately 9%,
which is still only 5% lower than that of the competition grade agent baseline estimators
on the same data. It is worth noting that the lower overall performance of all of the
estimators for this domain is consistent with the results seen in the agent baseline analysis
from Chapter 4. Not obvious from the presentation of these results was the presence of two
abysmal agents in the competition, who each lost almost the maximum possible amount
in every match. The inclusion of these agents in the analysis helps to explain some of
the drop in average performance between the top-competitor and all-competitors datasets.
Once again however, the data baseline estimator suffers much less of a performance drop
between the two evaluation scenarios, reinforcing their robustness when evaluating agents
with varying levels of skill.
47

Aβ(COMP) D
β
(ACPC)Aβ(AC) A
β(CR) A
β(RAND)
Top Competitors
0
5
10
15
20
25
Sta
ndard
Err
or
Reducti
on (
% )
Aβ(COMP) D
β
(ACPC)Aβ(AC) A
β(CR) A
β(RAND)
All Competitors
0
5
10
15
20
25
Sta
ndard
Err
or
Reducti
on (
% )
Figure 5.5: 2013 ACPC Two-Player No-Limit Average Estimator Performance
5.5.2 Human Texas Hold ’em Poker
Experimental Design
For the task of evaluating human play, the data baseline approach was evaluated using
data gathered from four human versus computer-agent poker matches and one human ver-
sus human poker tournament. In the human versus computer-agent setting, data baseline
estimators were used to evaluate the human players in four different matches, each match
consisting of a different human player competing against a top-level computer agent in the
one thousand hands of two-player no-limit Texas hold ’em. Two different data baseline
estimators for this evaluation were created, one using a dataset of thirty thousand hands of
human versus computer-agent play and the other using the past ACPC data. Both of these
estimators were then compared to agent baseline estimators built using the same agent from
the two-player no-limit ACPC analysis.
The human versus human analysis was executed using data from a competition held by the
International Federation of Poker in 2011 [13]. This competition was a six-player no-limit
duplicate poker tournament similar in format to the competitions in the ACPC. Due to
the complexity of running their duplicate tournament, only 144 total unique hands were
played by the competitors. Unfortunately, since data in this domain is highly guarded by
both poker players and poker companies due to privacy concerns, we were forced to use
this small amount of data for both evaluation and building the estimator. This was done
48

using leave-one-out cross-validation on each of the six matches on the existing data. Two
different data baseline estimators were created using the remaining data by either including
or excluding the duplicate entries from the other matches. Including the duplicate entries
in the validation helps to give an idea of what an estimator in this domain would be capable
of, if it was built with a more sufficiently sized dataset. We compared the performance
of the two data baseline estimators to an agent baseline estimator created using a simple
always-call rule-based agent.
Cost Analysis
The experimentation involving human play used the exact same implementation choices
that were made in the ACPC experiments and thus the costs associated with the evaluation
are exactly the same as those in Section 5.5.1. The fact that gathering human samples can
be orders of magnitudes slower than sampling computer agents, the overall costs associated
with creating data baseline estimators have even less of an impact on the total evaluation
cost for this type of domain.
Two-Player No-Limit Human versus Computer-Agent Results
Table 5.1 shows the performance of the data baseline and agent baseline estimators for the
four different human versus computer-agent matches. In this domain, the data baseline
estimators outperform the agent baseline estimators in three of the four matches as well
as on average. Also suggested from these results is the presence of the same relationship
between the size of the baseline estimator dataset and the quality of the data being used
that was observed in the two-player limit ACPC analysis. Although the ACPC dataset is
almost 100 times larger than the human versus computer-agent dataset, the data baseline
estimators created with either dataset achieves similar performance in this domain. This
result, combined with the performance versus dataset size analysis, reinforces the observation
that using tailored datasets can increase overall performance in data baseline estimators.
Six-Player No-Limit Human versus Human Results
The cross-validation results for the six-player no-limit human tournament are shown in Table
5.2. Since a competition level agent from which to create an agent baseline estimator does
not exist in this domain, we compared the data baseline estimator to an agent baseline esti-
mator created using an always-call rule-based agent. Although the sample size is extremely
49

Match Reduction ( % )
Estimator 1 2 3 4 Avg
Aβ(COMP ) 1.37 10.91 8.62 0.79 5.42
Dβ(Human) 4.31 2.30 16.43 15.25 9.57
Dβ(ACPC) 5.53 10.66 15.71 10.61 10.63
Table 5.1: Two-Player No-Limit Human vs Computer-Agent Results (1000-Hand Matches)
small, the data baseline estimator created when leaving duplicate hands out of the dataset
is able to achieve some reduction of the standard error. This performance is also better than
that of the always-call agent baseline estimator in five of the six matches. The results are
much better in the idealistic case where we include the duplicate hands in the data baseline
estimator, gaining a substantial performance increase in five of the six matches. Although
further experimentation with larger sample sizes is needed, the results indicate that data
baseline estimators could be useful in these types of real world competitive human scenarios.
Match Avg Reduction ( % )
Estimator 1 2 3 4 5 6 Avg
Aβ(AC) 2.60 0.54 0.77 0.40 0.97 0.37 0.94
Dβ(No−Dup) 1.17 0.76 2.16 0.92 1.33 0.61 1.15
Dβ(Dup) 7.40 5.18 7.11 10.24 1.60 6.45 6.33
Table 5.2: Six-Player No-Limit Human Tournament (144-Hand Matches)
50

Chapter 6
Conclusions
This work has demonstrated that the baseline approach to agent evaluation provides a simple
method for creating efficient, unbiased estimators in highly stochastic multi-agent domains.
Applications of this approach are easily implemented by merely choosing unbiased baseline
scoring functions, two examples of which we have provided an in-depth analysis.
6.1 Agent Baseline
The agent baseline application of baseline estimators was shown to be a superior alternative
to the duplicate approach currently used in the domain of Texas hold ’em computer poker.
Not only is the agent baseline approach able to create unbiased estimators for computer
poker domains, but for any zero-sum domain where there is a similarly skilled computer
agent that can be used to create the necessary baseline scoring function, such as the Trading
Agent Ad Auction Competition. The agent baseline approach is also particularly useful for
evaluating computer-agent versus human scenarios where, unlike the duplicate approach,
individual skill assessments can be made. While it is conceivable that there are situations
where creating a duplicate estimator would be advantageous over agent baseline estimators,
such as situations where a the agents being evaluated behave drastically different than the
baseline agent, this scenario did not occur in any of the evaluation performed in this work.
Agent evaluation using agent baseline estimators should be a serious consideration for any
computer agent competition, human versus computer-agent competition or even human
versus human matches in domains where strong computer agents exist.
51

6.2 Data Baseline
Creating baseline estimators using the data baseline approach addresses one major short-
coming of the agent baseline approach: the situation where there are simply no available
competitive agents for the domain agent evaluation is being performed within. Data baseline
estimators leverage existing player data to overcome this limitation with the intuition that
for many domains, this data is much easier to obtain than competitive computer agents.
By using player data to generate the baseline estimators, we have shown that creating effi-
cient, unbiased estimators is possible for a much broader category of domains, and that the
penalty in performance when compared to agent baseline estimators is minor. Data baseline
estimators also outperform agent baseline estimators created with weak underlying baseline
agents, and are well suited for creating tailored estimation based on both agent skill and
style of play. This allows for efficient evaluation of a broader class of players. For domains
where the agent baseline approach cannot be deployed, the data baseline approach should
be strongly considered, especially if there is an abundance of player data for the domain.
52

Bibliography
[1] Annual Computer Poker Competition. http://www.computerpokercompetition.org.
[2] Peter Auer, N Cesa-Bianchi, and P Fischer. Finite-time Analysis of the Multi-ArmedBandit Problem. Machine learning, 47:235–256, 2002.
[3] Roger R. Baldwin, Wilbert E. Centey, Maisel Hebert, and James P. McDermott. TheOptimum Strategy in Blackjack. Journal of the American Statistical Association,51(275):429–439, 1956.
[4] Nolan Bard, Michael Johanson, Neil Burch, and Michael Bowling. Online implicit agentmodelling. In Proceedings of the 2013 International Conference on Autonomous Agentsand Multi-Agent Systems, pages 255–262. International Foundation for AutonomousAgents and Multiagent Systems, 2013.
[5] Jon Louis Bentley. Multidimensional Binary Search Trees Used for Associative Search-ing. Communications of the ACM, 18(9):509–517, September 1975.
[6] Darse Billings and Morgan Kan. A Tool for the Direct Assessment of Poker Decisions.The International Computer Games Association Journal,, 29(3):119–142, 2006.
[7] Michael Bowling, Michael Johanson, Neil Burch, and Duane Szafron. Strategy Evalua-tion in Extensive Games with Importance Sampling. In Proceedings of the 25th AnnualInternational Conference on Machine Learning (ICML), 2008.
[8] Cameron Browne, Edward Powley, Daniel Whitehouse, Simon Lucas, Peter I Cowl-ing, Philipp Rohlfshagen, Stephen Tavener, Diego Perez, Spyridon Samothrakis, andSimon Colton. A Survey of Monte Carlo Tree Search Methods. IEEE Transactions onComputational Intelligence and AI in Games, 4(1):1–49, 2012.
[9] T.H. Cormen. Introduction to Algorithms. Mit Press, 2009.
[10] John Dahl. Rounders. Miramax Films, 1998.
[11] Joshua Davidson, Christopher Archibald, and Michael Bowling. Baseline: PracticalControl Variates for Agent Evaluation in Zero-Sum Domains. In AAMAS ’13 Pro-ceedings of the 2013 International Conference on Autonomous Agents and Multi-AgentSystems, pages 1005–1012, 2013.
[12] Paul Glasserman. Monte Carlo Methods in Financial Engineering. Springer, 2003.
[13] International Federation of Poker. http://www.pokerfed.org/.
[14] Michael Johanson, Neil Burch, Richard Valenzano, and Michael Bowling. EvaluatingState-Space Abstractions in Extensive-Form Games. In Proceedings of the TwelfthInternational Conference on Autonomous Agents and Multi-Agent Systems (AAMAS),pages 271–278, 2013.
[15] Levente Kocsis and C Szepesvari. Bandit Based Monte-Carlo Planning. In The 17thEuropean Conference on Machine Learning: ECML 2006, pages 282–293, 2006.
[16] MJ Osborne and Ariel Rubinstein. A Course in Game Theory. MIT Press, 1994.
[17] Gerald Tesauro. Programming Backgammon Using Self-Teaching Neural Nets. ArtificialIntelligence, 134(1-2):181–199, January 2002.
53

[18] Gerald Tesauro and GR Galperin. On-line Policy Improvement Using Monte-CarloSearch. In Advances in Neural Information Processing Systems 9, NIPS, 1996.
[19] The Second Man-Machine Poker Competition. http://webdocs.cs.ualberta.ca/
~games/poker/man-machine/Press/PR-05-10-2008/.
[20] The World Series of Poker. http://www.wsop.com/.
[21] A. C. Thomas. Variance Decomposition and Replication In Scrabble: When Can YouBlame Your Tiles? ArXiv e-prints, July 2011.
[22] Trading Agent Competition Ad Auctions. http://aa.tradingagents.org/.
[23] Joel Veness, Marc Lanctot, and Michael Bowling. Variance Reduction in Monte-CarloTree Search. Advances in Neural Information Processing Systems 24, pages 1836–1844,2011.
[24] Martha White and Michael Bowling. Learning a Value Analysis Tool for Agent Eval-uation. Proceedings of the Twenty-First International Joint Conference on ArtificialIntelligence (IJCAI), pages 1976 – 1981, 2009.
[25] D Wolfe. Distinguishing Gamblers from Investors at the Blackjack Table. In Computersand Games 2002, LNCS 2883, pages 1–10. Springer-Verlag, 2002.
[26] World Bridge Federation. http://www.worldbridge.org/home.asp.
[27] Martin Zinkevich, Michael Bowling, and Nolan Bard. Optimal Unbiased Estimators forEvaluating Agent Performance. In Proceedings of the Twenty-First National Conferenceon Artificial Intelligence (AAAI), pages 573–578, 2006.
54

Appendix A
2013 ACPC Baseline FullResults
A.1 Two Player Limit
Match Name MC SE DUP SE Aβ SE Dβ SE DUP % Aβ % Dβ %
HITSZ/chump1 13.26 7.96 8.81 8.81 40.0 33.61 33.58
HITSZ/chump12 9.73 5.86 6.21 6.61 39.76 36.15 32.07
HITSZ/hyperborean iro 9.92 5.04 4.89 5.09 49.16 50.7 48.71
HITSZ/hyperborean tbr 10.42 5.34 5.51 5.6 48.76 47.16 46.22
HITSZ/liacc 15.88 7.56 9.23 8.93 52.39 41.86 43.75
HITSZ/littlerock 9.85 5.01 4.97 5.15 49.09 49.56 47.7
HITSZ/marv 9.57 4.72 4.52 4.81 50.68 52.75 49.75
HITSZ/neopokerlab 9.91 5.1 4.97 5.12 48.58 49.83 48.36
HITSZ/propokertools 9.92 5.0 5.03 5.19 49.64 49.25 47.7
HITSZ/slugathorus 13.6 9.02 9.33 9.13 33.71 31.42 32.85
HITSZ/unamur iro 9.63 5.26 5.4 5.38 45.33 43.93 44.1
HITSZ/unamur tbr 10.28 5.44 5.87 5.74 47.05 42.88 44.13
HITSZ/zbot 10.02 5.09 5.0 5.16 49.16 50.13 48.46
chump1/chump12 11.32 7.32 6.88 7.22 35.34 39.22 36.28
feste iro/HITSZ 10.02 4.98 5.43 5.51 50.26 45.79 44.99
feste iro/hyperborean iro 9.2 4.13 3.72 4.18 55.1 59.5 54.57
feste iro/liacc 14.9 8.42 8.51 8.24 43.53 42.9 44.74
feste iro/littlerock 9.51 4.21 4.1 4.42 55.72 56.94 53.58
feste iro/marv 10.19 4.31 4.01 4.46 57.71 60.67 56.25
feste iro/neopokerlab 10.28 4.66 4.32 4.74 54.64 57.96 53.93
feste iro/propokertools 10.32 4.52 4.45 4.77 56.2 56.85 53.74
feste iro/slugathorus 12.57 8.04 8.04 7.99 36.03 36.03 36.42
. . . continued on next page
55

Match Name MC SE DUP SE Aβ SE Dβ SE DUP % Aβ % Dβ %
feste iro/unamur iro 9.26 4.52 4.62 4.68 51.2 50.18 49.46
feste iro/zbot 10.32 4.68 4.38 4.77 54.7 57.54 53.84
feste tbr/HITSZ 10.22 4.97 5.68 5.76 51.32 44.44 43.62
feste tbr/chump1 12.29 6.98 7.58 7.52 43.23 38.32 38.82
feste tbr/chump12 9.36 5.72 4.71 5.59 38.88 49.68 40.28
feste tbr/hyperborean tbr 9.73 4.41 4.5 4.56 54.69 53.73 53.15
feste tbr/liacc 15.32 7.74 8.45 7.91 49.44 44.82 48.35
feste tbr/littlerock 9.36 4.21 4.11 4.35 55.03 56.07 53.51
feste tbr/marv 10.31 4.44 4.19 4.55 56.93 59.39 55.86
feste tbr/neopokerlab 10.43 4.82 4.52 4.85 53.82 56.66 53.52
feste tbr/propokertools 10.46 4.66 4.6 4.87 55.44 56.01 53.43
feste tbr/slugathorus 14.41 9.04 9.28 9.06 37.25 35.63 37.12
feste tbr/unamur tbr 9.87 4.8 5.16 5.05 51.39 47.71 48.77
feste tbr/zbot 10.48 4.8 4.55 4.86 54.18 56.57 53.64
hyperborean iro/liacc 14.04 8.28 7.94 7.91 41.03 43.44 43.64
hyperborean iro/littlerock 9.42 3.56 3.26 4.16 62.25 65.33 55.77
hyperborean iro/marv 9.41 3.06 2.74 3.9 67.48 70.9 58.55
hyperborean iro/neopokerlab 10.22 3.5 3.28 4.43 65.76 67.94 56.68
hyperborean iro/propokertools 10.22 3.79 3.55 4.5 62.88 65.29 55.94
hyperborean iro/slugathorus 12.35 7.91 7.66 7.83 35.97 37.98 36.63
hyperborean iro/unamur iro 9.16 4.39 4.09 4.47 52.09 55.39 51.2
hyperborean iro/zbot 6.49 2.33 2.15 2.84 64.03 66.78 56.2
hyperborean tbr/chump1 12.31 7.45 7.41 7.46 39.48 39.81 39.39
hyperborean tbr/chump12 9.3 5.81 4.36 5.51 37.54 53.16 40.78
hyperborean tbr/liacc 14.58 8.26 8.45 8.09 43.32 42.06 44.49
hyperborean tbr/littlerock 9.8 4.17 4.07 4.46 57.47 58.5 54.46
hyperborean tbr/marv 10.51 4.05 3.96 4.49 61.43 62.29 57.3
hyperborean tbr/neopokerlab 10.64 4.35 4.28 4.78 59.15 59.82 55.12
hyperborean tbr/propokertools 10.63 4.49 4.42 4.81 57.79 58.45 54.73
hyperborean tbr/slugathorus 12.78 8.18 8.11 8.09 36.01 36.58 36.69
hyperborean tbr/unamur tbr 9.89 4.66 4.97 4.93 52.92 49.77 50.2
hyperborean tbr/zbot 10.64 4.37 4.33 4.8 58.93 59.34 54.91
liacc/chump1 17.6 9.46 11.13 11.0 46.23 36.74 37.47
liacc/chump12 13.02 8.74 7.13 8.2 32.89 45.24 37.03
liacc/littlerock 14.17 8.42 8.14 8.06 40.58 42.6 43.17
liacc/marv 13.14 6.54 6.4 6.25 50.18 51.25 52.43
liacc/neopokerlab 14.02 8.47 8.23 8.15 39.58 41.3 41.86
liacc/propokertools 14.3 8.59 8.31 8.24 39.91 41.86 42.35
liacc/slugathorus 19.28 11.28 12.31 11.89 41.51 36.14 38.31
liacc/unamur iro 13.92 8.06 8.34 8.13 42.05 40.06 41.57
liacc/unamur tbr 14.31 7.63 8.3 7.93 46.67 42.02 44.58
liacc/zbot 14.21 8.44 8.16 8.08 40.6 42.59 43.14
. . . continued on next page
56

Match Name MC SE DUP SE Aβ SE Dβ SE DUP % Aβ % Dβ %
littlerock/chump1 11.52 7.0 6.87 6.95 39.27 40.32 39.67
littlerock/chump12 8.61 5.3 3.82 5.1 38.43 55.66 40.81
littlerock/marv 10.11 3.5 3.42 4.3 65.4 66.23 57.47
littlerock/neopokerlab 10.23 3.89 3.74 4.55 62.0 63.43 55.48
littlerock/propokertools 10.25 3.95 3.94 4.63 61.48 61.57 54.77
littlerock/slugathorus 12.37 7.89 7.72 7.83 36.2 37.58 36.68
littlerock/unamur iro 9.17 4.44 4.25 4.52 51.6 53.63 50.71
littlerock/unamur tbr 9.86 4.79 4.73 4.88 51.43 52.06 50.5
littlerock/zbot 10.26 4.01 3.87 4.62 60.95 62.29 54.97
marv/chump1 11.08 6.38 6.25 6.31 42.44 43.58 43.01
marv/chump12 8.57 5.21 3.54 4.97 39.27 58.65 42.03
marv/neopokerlab 10.14 3.35 3.22 4.25 66.96 68.2 58.09
marv/propokertools 10.13 3.51 3.45 4.3 65.37 65.94 57.52
marv/slugathorus 12.03 7.13 6.91 7.05 40.71 42.55 41.38
marv/unamur iro 10.15 4.6 4.32 4.73 54.7 57.41 53.42
marv/unamur tbr 10.47 4.72 4.6 4.86 54.87 56.07 53.55
marv/zbot 10.15 3.45 3.34 4.3 66.03 67.11 57.68
neopokerlab/chump1 15.85 9.66 9.43 9.51 39.05 40.52 39.97
neopokerlab/chump12 11.89 7.37 5.21 7.02 38.02 56.2 40.92
neopokerlab/propokertools 10.25 3.92 3.8 4.59 61.77 62.96 55.18
neopokerlab/slugathorus 12.32 7.96 7.76 7.88 35.37 36.99 36.07
neopokerlab/unamur iro 10.21 4.89 4.64 5.0 52.14 54.55 51.07
neopokerlab/unamur tbr 10.52 5.04 4.99 5.2 52.05 52.58 50.53
neopokerlab/zbot 10.27 3.73 3.67 4.57 63.7 64.22 55.53
propokertools/chump1 11.52 6.95 6.9 6.98 39.65 40.13 39.43
propokertools/chump12 8.64 5.34 3.82 5.11 38.15 55.81 40.78
propokertools/slugathorus 12.42 7.96 7.79 7.9 35.94 37.25 36.44
propokertools/unamur iro 10.25 4.91 4.74 5.04 52.1 53.77 50.89
propokertools/unamur tbr 10.59 5.13 5.09 5.27 51.51 51.89 50.24
propokertools/zbot 10.27 4.01 3.88 4.61 60.98 62.21 55.1
slugathorus/chump1 15.45 10.44 11.08 11.15 32.38 28.23 27.8
slugathorus/chump12 11.34 8.04 7.27 7.79 29.05 35.89 31.26
slugathorus/unamur iro 10.85 6.92 7.07 7.05 36.23 34.82 35.01
slugathorus/unamur tbr 12.91 8.2 8.47 8.36 36.49 34.36 35.23
slugathorus/zbot 12.47 7.96 7.77 7.88 36.15 37.69 36.8
unamur iro/zbot 10.28 4.94 4.73 5.07 51.96 53.99 50.65
unamur tbr/chump1 11.46 6.98 7.31 7.33 39.12 36.22 36.01
unamur tbr/chump12 8.99 5.71 4.78 5.46 36.51 46.85 39.3
unamur tbr/zbot 10.62 5.08 5.07 5.27 52.16 52.29 50.43
zbot/chump1 11.64 7.06 6.87 6.95 39.4 41.03 40.28
zbot/chump12 8.66 5.37 3.82 5.15 37.99 55.9 40.57
Table A.1: 2013 Two-Player Limit ACPC Full Results
57

A.2 Three Player Limit
Match Name MC SE DUP SE Aβ SE Dβ SE DUP % Aβ % Dβ %
HITSZ/hyper iro/kempfer 21.72 16.44 16.6 16.53 24.5 23.52 23.82
HITSZ/hyper tbr/kempfer 23.55 16.98 18.14 17.85 27.79 22.86 24.05
HITSZ/liacc/hyper iro 35.7 25.8 27.91 27.14 26.65 21.84 23.8
HITSZ/liacc/hyper tbr 38.07 26.69 29.43 28.47 29.42 22.71 25.14
HITSZ/liacc/kempfer 35.16 24.08 28.5 27.41 30.45 18.69 21.67
HITSZ/liacc/littlerock 35.34 25.63 27.86 27.12 26.2 21.12 23.01
HITSZ/littlerock/hyper iro 22.58 16.33 15.88 16.19 28.31 29.77 28.33
HITSZ/littlerock/hyper tbr 24.51 17.37 17.5 17.6 29.47 28.68 28.19
HITSZ/littlerock/kempfer 21.54 16.2 16.65 16.5 25.02 22.7 23.37
liacc/hyper iro/kempfer 25.72 20.92 19.44 19.46 18.96 24.29 24.23
liacc/hyper tbr/kempfer 27.25 21.13 20.47 20.33 22.43 24.71 25.22
liacc/littlerock/hyper iro 26.41 21.36 18.01 18.46 20.3 31.93 30.13
liacc/littlerock/hyper tbr 27.75 21.41 19.0 19.2 23.59 31.62 30.8
liacc/littlerock/kempfer 25.45 20.85 19.34 19.34 18.49 23.9 23.89
littlerock/hyper iro/kempfer 17.85 11.41 10.93 11.98 35.84 38.64 32.79
littlerock/hyper tbr/kempfer 18.8 12.18 11.87 12.72 34.92 36.78 32.27
neopoker/HITSZ/hyper iro 22.51 16.42 16.03 16.24 27.65 28.88 27.89
neopoker/HITSZ/hyper tbr 24.61 17.53 17.77 17.75 29.06 27.84 27.87
neopoker/HITSZ/kempfer 21.17 15.87 16.38 16.24 25.27 22.64 23.27
neopoker/HITSZ/liacc 35.7 25.89 28.43 27.48 26.24 20.28 22.8
neopoker/HITSZ/littlerock 22.16 16.32 15.95 16.12 26.95 28.09 27.23
neopoker/hyper iro/kempfer 17.38 11.7 10.98 11.91 32.55 36.75 31.42
neopoker/hyper tbr/kempfer 18.54 12.69 12.22 12.89 31.54 34.04 30.45
neopoker/liacc/hyper iro 26.43 22.07 18.98 19.15 17.52 28.26 27.55
neopoker/liacc/hyper tbr 27.74 22.29 19.99 19.96 20.3 27.93 27.98
neopoker/liacc/kempfer 25.95 21.59 20.25 20.19 17.27 21.9 22.11
neopoker/liacc/littlerock 26.3 22.25 19.18 19.31 16.51 27.12 26.56
neopoker/littlerock/hyper iro 13.04 7.16 6.56 7.99 45.05 49.64 38.68
neopoker/littlerock/hyper tbr 19.23 11.04 10.32 11.84 42.59 46.35 38.4
neopoker/littlerock/kempfer 17.36 11.7 11.23 12.07 32.54 35.25 30.47
Table A.2: 2013 Three-Player Limit ACPC Full Results
A.3 Two Player No-Limit
58

Match Name MC SE DUP SE Aβ SE Dβ SE DUP % Aβ % Dβ %
HITSZ/Sartre 31.9 30.97 31.32 31.06 2.92 1.8 2.63
HITSZ/entropy 41.92 36.73 38.39 36.8 12.37 8.42 12.21
HITSZ/hugh 22.06 15.7 19.38 17.99 28.82 12.14 18.47
HITSZ/hyperborean iro 33.4 30.61 31.3 30.74 8.35 6.28 7.96
HITSZ/hyperborean tbr 86.78 77.5 82.97 80.96 10.7 4.4 6.7
HITSZ/kempfer 35.41 24.86 30.72 27.9 29.78 13.22 21.2
HITSZ/koypetition 20.06 17.01 17.95 17.29 15.2 10.53 13.81
HITSZ/liacc 228.45 139.88 212.17 199.17 38.77 7.13 12.82
HITSZ/littlerock 27.42 25.71 26.28 25.97 6.24 4.16 5.31
HITSZ/neopokerlab 35.26 25.31 30.17 28.03 28.22 14.45 20.5
HITSZ/nyx 22.16 19.66 20.55 20.07 11.27 7.26 9.43
HITSZ/slumbot 26.69 24.14 24.96 24.49 9.57 6.49 8.25
HITSZ/tartanian6 47.85 44.0 45.13 44.2 8.05 5.69 7.63
Sartre/entropy 37.92 31.35 31.93 32.65 17.33 15.79 13.91
Sartre/hugh 34.81 30.07 29.47 30.39 13.62 15.35 12.7
Sartre/hyperborean iro 29.79 24.18 24.36 25.3 18.84 18.24 15.07
Sartre/hyperborean tbr 53.17 48.18 48.64 48.51 9.4 8.53 8.76
Sartre/kempfer 46.42 40.61 40.57 40.66 12.52 12.6 12.4
Sartre/koypetition 44.44 35.91 35.42 37.52 19.2 20.3 15.57
Sartre/liacc 84.07 78.78 81.58 81.37 6.29 2.96 3.22
Sartre/littlerock 26.26 22.33 22.34 23.2 14.94 14.92 11.64
Sartre/neopokerlab 42.4 33.76 34.69 35.95 20.38 18.19 15.21
Sartre/nyx 26.82 21.18 21.51 22.71 21.02 19.79 15.32
Sartre/slumbot 23.53 19.3 19.37 20.2 17.96 17.68 14.14
Sartre/tartanian6 43.34 35.39 36.25 37.21 18.33 16.34 14.14
entropy/hugh 30.9 27.2 27.33 28.36 11.97 11.53 8.22
entropy/hyperborean iro 34.36 28.81 28.51 30.45 16.14 17.01 11.38
entropy/hyperborean tbr 50.5 43.96 46.08 46.25 12.94 8.76 8.41
entropy/kempfer 56.08 49.31 48.66 50.67 12.08 13.24 9.65
entropy/koypetition 51.1 42.36 42.64 45.22 17.1 16.56 11.52
entropy/liacc 71.08 68.47 69.66 69.6 3.67 1.99 2.08
entropy/littlerock 32.75 28.2 27.99 29.19 13.9 14.54 10.88
entropy/neopokerlab 41.58 36.7 36.38 37.92 11.73 12.52 8.81
entropy/nyx 33.2 27.89 27.79 29.12 15.99 16.28 12.26
entropy/slumbot 29.68 25.03 24.46 26.16 15.67 17.61 11.86
entropy/tartanian6 50.67 42.72 42.87 44.56 15.68 15.38 12.06
hugh/hyperborean iro 34.32 29.26 28.11 29.96 14.74 18.1 12.71
hugh/hyperborean tbr 38.84 34.5 33.23 34.66 11.17 14.43 10.75
hugh/kempfer 56.77 47.96 48.98 51.03 15.53 13.72 10.11
hugh/koypetition 61.01 51.32 50.73 53.1 15.88 16.85 12.97
hugh/liacc 118.07 110.7 115.76 115.13 6.24 1.96 2.49
hugh/littlerock 36.37 31.58 30.99 32.35 13.19 14.81 11.07
. . . continued on next page
59

Match Name MC SE DUP SE Aβ SE Dβ SE DUP % Aβ % Dβ %
hugh/neopokerlab 51.43 44.45 44.61 46.76 13.57 13.25 9.08
hugh/nyx 31.95 27.73 26.55 28.31 13.21 16.92 11.4
hugh/slumbot 27.99 24.59 23.19 24.94 12.13 17.15 10.91
hugh/tartanian6 54.0 46.23 45.14 46.74 14.38 16.41 13.45
hyperborean iro/kempfer 41.44 35.4 34.23 36.1 14.56 17.39 12.87
hyperborean iro/koypetition 50.26 41.27 40.19 43.37 17.88 20.04 13.71
hyperborean iro/liacc 56.28 54.4 54.98 55.16 3.34 2.31 1.98
hyperborean iro/littlerock 26.77 22.03 21.87 23.5 17.7 18.29 12.21
hyperborean iro/neopokerlab 44.44 37.15 36.0 38.52 16.41 18.98 13.31
hyperborean iro/nyx 27.63 22.13 22.14 24.01 19.91 19.86 13.08
hyperborean iro/slumbot 11.44 8.94 8.85 9.75 21.87 22.68 14.8
hyperborean iro/tartanian6 46.58 35.95 36.96 39.06 22.82 20.66 16.14
hyperborean tbr/kempfer 86.9 75.61 76.39 75.97 12.99 12.09 12.58
hyperborean tbr/koypetition 51.61 43.73 42.8 45.09 15.27 17.08 12.64
hyperborean tbr/liacc 69.8 65.86 68.17 68.16 5.65 2.33 2.35
hyperborean tbr/littlerock 34.82 30.14 29.81 31.07 13.42 14.39 10.75
hyperborean tbr/neopokerlab 54.62 45.54 46.44 47.89 16.63 14.98 12.32
hyperborean tbr/nyx 37.81 31.03 31.49 33.24 17.93 16.73 12.1
hyperborean tbr/slumbot 34.55 28.24 28.02 30.33 18.27 18.89 12.21
hyperborean tbr/tartanian6 50.22 41.08 42.22 43.58 18.21 15.93 13.22
kempfer/koypetition 74.23 61.89 62.16 64.0 16.63 16.27 13.79
kempfer/liacc 132.17 120.57 127.32 126.35 8.78 3.67 4.4
kempfer/littlerock 31.68 28.33 26.41 28.29 10.58 16.61 10.69
kempfer/neopokerlab 49.96 43.93 41.0 44.26 12.08 17.93 11.4
kempfer/nyx 37.8 32.23 31.16 32.84 14.74 17.57 13.12
kempfer/slumbot 33.9 29.44 28.06 29.83 13.15 17.21 11.98
kempfer/tartanian6 64.82 54.73 54.31 55.47 15.57 16.22 14.43
koypetition/liacc 116.74 113.05 113.83 113.9 3.16 2.49 2.44
koypetition/littlerock 47.57 38.14 37.97 40.97 19.83 20.19 13.87
koypetition/neopokerlab 50.12 41.1 40.1 42.96 18.0 19.99 14.28
koypetition/nyx 45.17 35.7 35.21 38.3 20.97 22.06 15.21
koypetition/slumbot 46.59 37.02 35.9 39.53 20.54 22.95 15.16
koypetition/tartanian6 48.18 38.14 37.5 40.26 20.85 22.16 16.45
liacc/littlerock 58.82 57.46 57.45 57.66 2.31 2.33 1.97
liacc/neopokerlab 89.71 84.31 87.85 87.72 6.03 2.07 2.22
liacc/nyx 55.92 54.46 54.34 54.63 2.62 2.83 2.31
liacc/slumbot 49.18 48.03 48.04 48.24 2.34 2.32 1.91
liacc/tartanian6 71.77 69.31 70.34 70.5 3.44 2.0 1.77
littlerock/neopokerlab 38.71 31.84 31.68 33.97 17.75 18.16 12.24
littlerock/nyx 25.87 20.91 21.41 22.8 19.17 17.23 11.86
littlerock/slumbot 22.52 18.42 18.2 19.73 18.24 19.2 12.41
littlerock/tartanian6 38.7 30.58 31.39 33.13 20.99 18.9 14.39
. . . continued on next page
60

Match Name MC SE DUP SE Aβ SE Dβ SE DUP % Aβ % Dβ %
neopokerlab/nyx 41.42 33.99 33.5 35.84 17.92 19.12 13.47
neopokerlab/slumbot 36.98 30.7 29.67 32.44 16.99 19.78 12.29
neopokerlab/tartanian6 47.78 38.83 39.29 41.16 18.74 17.77 13.87
nyx/slumbot 22.14 17.16 17.13 18.9 22.52 22.63 14.67
nyx/tartanian6 39.56 30.93 31.35 33.38 21.8 20.75 15.62
slumbot/tartanian6 37.73 29.46 29.49 31.42 21.91 21.83 16.74
Table A.3: 2013 Two-Player No-Limit ACPC Full Results
61