the impact of covid-19 on global supply chains and the transport … · the impact of covid-19 on...
TRANSCRIPT

The impact of COVID-19 on global supply chains and thetransport sector*
– an initial assessment with some conceptual tools andindicative policy recommendations
UPDATE 30 March 2020
(Previous versions: 27 March and 29 March 2020)
Professor Lauri Ojala
Operations & Supply Chain Management, University of Turku, Finland
*) This presentation can be freely disseminatedIf cited or re-used, please, provide the appropriate references to the original sources!
1

The largest help packages since mid-March 2020• On Thu, 26 March 2020, G20 economies announced to pump US$5,000 billion
into the world economy as part of a joint pledge to use all policy tools available to cushion the impacts of the global COVID-19 pandemic
• IMF stands ready to deploy US$1,000 billion in lending capacity
• On 25 March 2020, IMF launched a Tracker of fiscal, monetary or macro-financial policies Governments are taking in response to COVID-19• As of end-March 2020, the tracker includes 186 economies
• On 17 March 2020, World Bank Group Increases COVID-19 Response to US$14 Billion To Help Sustain Economies and Protect Jobs
• Macroeconomic (country) estimates based on COVID-19 impacts*:• The World Bank; OECD; ASEAN• Fitch ratings; Standard & Poors; McKinsey 25 March 2020
2*) Open access, but some may require registration

How does COVID-19 impact on tradeand supply chains look like now*?
*) March 2020
3

Coronavirus outbreak has cost global value chains $50 billion in exports by February 2020
4
According to UNCTAD estimates on 8
March 2020, the most affected
sectors include precision
instruments, machinery, automotive and communication equipment.

UNCTAD estimates released on 26 March 2020• A new UNCTAD analysis of how the coronavirus pandemic will affect global foreign
direct investment (FDI) prospects shows that the negative impact will be worse than previously projected on 8 March.
• Updated estimates of COVID-19’s economic impact and revisions of earnings of the largest multinational enterprises (MNEs) now suggest that the downward pressure on FDI flows could range from -30% to -40% during 2020-2021, much more than previous projections of -5% to -15%.
• Since then, 61% of the top 100 MNEs that UNCTAD tracks have issued earnings revisions that confirm the rapid deterioration of global prospects. And 57% have warned of the global demand shock’s impact on sales, showing that COVID-19 is causing problems beyond supply chain disruptions after a production slowdown in parts of China.
• In addition, the top 5,000 MNEs, which account for a significant share of global FDI, have now seen downward revisions of 30% on average for 2020 earnings estimates. And the trend is likely to continue.
• The hardest-hit sectors are the energy and basic materials industries (-208% for energy, with the additional shock caused by the recent drop in oil prices), airlines (-116%) and the automotive industry (-47%).
See also UNCTAD’s Investment Monitor, March 2020 here 5

IHS Markit Eurozone PMI®: COVID-19 outbreak leads to largest collapse in business activity ever recorded
6
Key findings:
• Flash Eurozone PMI Composite Output Index(1) at 31.4 (51.6 in February). Record low (since July 1998).
• Flash Eurozone Services PMI Activity Index(2) at 28.4 (52.6 in February). Record low (since July 1998).
• Flash Eurozone Manufacturing PMI Output Index(4) at 39.5 (48.7 in February). 131-month low.
• Flash Eurozone Manufacturing PMI(3) at 44.8 (49.2 in February). 92-month low.

Source: WTO 2020
Crude oil & gas
Commodities:minerals, crops
Manufacturing: e.g. electronics, textile & apparel, mechanical engineering
Backward GVC participation: Import of inputs to produce the goods
and services the economy exports.
Forward GVC participation: Export of domestically produced
inputs to partners involved in the later stages of production.
Supply value chains cannot be established overnight. It takes time and effort to qualify potential
suppliers in areas of manufacturing quality, capacity, delivery, cost and their ability to respond
to engineering or demand changes.
Thus, supply value chains are designed for longer-term needs. Once they are established, it can be difficult
to change them quickly to adapt to unpredictable disruptions.
Backward and Forward Global Value Chain (GVC) participation, selected developing economies, 2015 (% in total gross exports)
7
Explanation:30 % to 45 % of the
export value from these countries is first
imported as inputs

Backward and forward Global Value Chain (GVC) participation, selected developing economies, 2015 (% in total gross exports)
Source: WTO 2020
Crude oil & gas
Commodities:minerals, crops
Vulnerable to bothsupply and demand
disruptions
Vulnerable mainly to demand disruptions
Backward GVC participation: Import of inputs to produce the goods
and services the economy exports.
Forward GVC participation: Export of domestically produced
inputs to partners involved in the later stages of production.
Manufacturing: e.g. electronics, textile & apparel, mechanical engineering
The COVID-19 crisis has intensified the competition for valuable supply sources in
several industrial sectors, such as in electronics and mechanical manufacturing
This has shifted the bargaining
power from Original
Equipment Manufacturers
(OEMs) to suppliers.
This means that countries with
a high share of Backward
Global Value Chain
participation tend to be hit
hard by trade disruptions.
8

OECD estimates on 2 March 2020 on the impact of COVID-19 on GDP for years 2020 and 2021
OECD Base scenario: temporary blow• Severe, short-lived downturn in China, where GDP growth falls below 5% in 2020
after 6.1% in 2019, but recovering to 6.4% in 2021.• In Japan, Korea, Australia, growth also hit hard then gradual recovery.• Impact less severe in other economies but still hit by drop in confidence and supply
chain disruption.
Domino scenario: broader contagion• Intensity of China impact repeated in northern advanced economies severely hitting
confidence, travel, and spending.• Global growth could drop to 1.5 per cent in 2020, half the rate projected before the
virus outbreak.• Recovery much more gradual through 2021.
9

10
OECD estimates on 2 March 2020 on the impact of COVID-19 on GDP for years 2020 and 2021

How do transport and supply chainsmeet the impactof COVID-19 in
general?
12Source: WEF 2020

The COVID-19 pandemic has reminded
corporate decision-makers that there is a need
to develop new business strategies in their
future supply chain designs.
The KPIs to be considered for future supply
value chain designs will likely contain both
traditional metrics such as:
• cost,
• quality and
• delivery,
and new performance measures including (also
known as the 3Rs):
• resilience,
• responsiveness, and
• reconfigurability.
Source: WEF 202013
The COVID-19 crisis has
intensified the competition for
valuable supply sources in
several industrial sectors, such
as in electronics and mechanical
manufacturing.
This has shifted the bargaining
power from Original Equipment
Manufacturers (OEMs) to
suppliers.
This means that countries with a
high share of Backward Global
Value Chain participation tend to
be hit hard by such a disruption.

Supply Risk and Recovery: The frequency and severity of supply chain disruptions are steadily increasing
Supply chains (SC) are vulnerable to a broad range of threats, including pandemics, extreme weather, cyberattack, andpolitical crises.
The vulnerability of SCs has been highlighted by major incidents (COVID-19, the Petya cyberattack in 2017) and thehurricanes that hit the US in 2017 with estimated $200 billion in damage.
Ironically, the susceptibility of supply chains has been heightened by business practices, such as single-sourcing ofsupplies, inventory centralization, just-in-time replenishment, and the concentration of freight traffic at hubs. Theseimprove economic performance, but also create greater risk exposure and lower resilience.
As a result of the globalization of SCs and a tighter coupling of logistical processes, the damaging effects of disruptionsnow spread much further and faster, and have a broader impact.
The human cost of SC disruption can also be high, as with the tsunami that hit Indonesia in 2018. In addition to the directloss of life during natural disasters and military conflicts, death and suffering can occur when SCs relied upon to delivermedical and essential supplies are fractured.
The impact of COVID-19 on the functioning of GVCs encouraged SC professionals to seek out more robust supplier-monitoring systems that may help build resilience. In the corporate world, the management of SC risk is being givengreater priority; risk auditing and business continuity planning are now widespread, particularly among larger companies.
However, strategic risk is not always adequately addressed at an operational level - and there is little evidence thatcompanies are effectively reversing the long-term trends that have made their supply chains more vulnerable.
Source: WEF 2020 14

Insights from McKinsey* on howCOVID-19 affects supply chains
and on how firms could try to cope withthe consequences
*) 16 and 25 March 2020
15

16Source: McKinsey Update 25 March 2020 Report

17Source: McKinsey COVID-19 Briefing Note
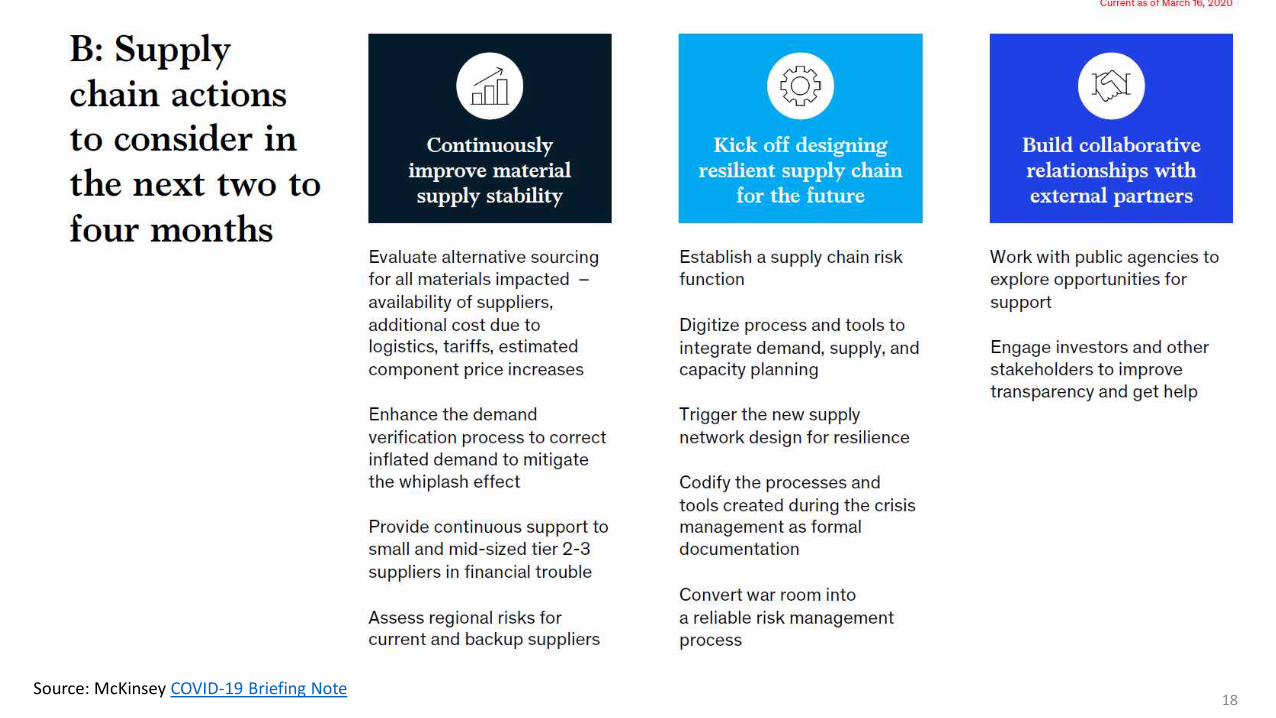
Source: McKinsey COVID-19 Briefing Note18

Example of market informationon COVID-19
in the public domain
March 2020
19

20
The Observatory was opened on 26 March 2020; find it HERE
Supported by the:
UNECLAC, United Nations Economic Commission for Latin America and the Caribbean
UNESCAP, United Nations Economic and Social Commission for Asia and the Pacific
UN ESCWA, United Nations Economic and Social Commission for Western Asia
ECO Secretariat, the Economic Cooperation Organization
IRU, the International Road Transport Union

Ex. of market intelligence gathering on COVID-19 in the public domain: DHL Ocean freight market update, March 2020
• Global supply chains integrities under pressure as the Coronavirus outbreaks increase and extendbeyond China with large reported increases in Korea and Italy Overall port operations in China remainnormal, exception being Wuhan’s barge service. All carriers report reefer plug shortages in Shanghai,Tianjin and Ningbo.
• Local Chinese governments have restricted truck operations and imposed a 14 day self-quarantine forthose crossing city or province boarders, impacting capacity and rates. Globally normal port operationsincluding Korea and Italy.
• Carriers have announced blank sailings to counter the resulting cargo supply/demand imbalances. Newcancellations are announced by the carriers without the usual notice periods. This in turn has createdequipment imbalances now impacting the global capacity.
• DHL Global Freight (DGF) has declared “Force Majeure” for the Europe-Asia trade lanes with immediateeffect as the situation is unforeseeable and beyond our reasonable control. We will continuously reviewthis positon and will communicate any updates, including a potential widening of the “Force Majeure”scope as deemed appropriate.
• Any carrier imposed surcharges (with different naming conventions) will be communicated pro-activelyand with full transparency and billed forward as Emergency Cost Recovery Surcharges.
• Return of normal post-Lunar New Year cargo flows not foreseen until March/April [2020] 21
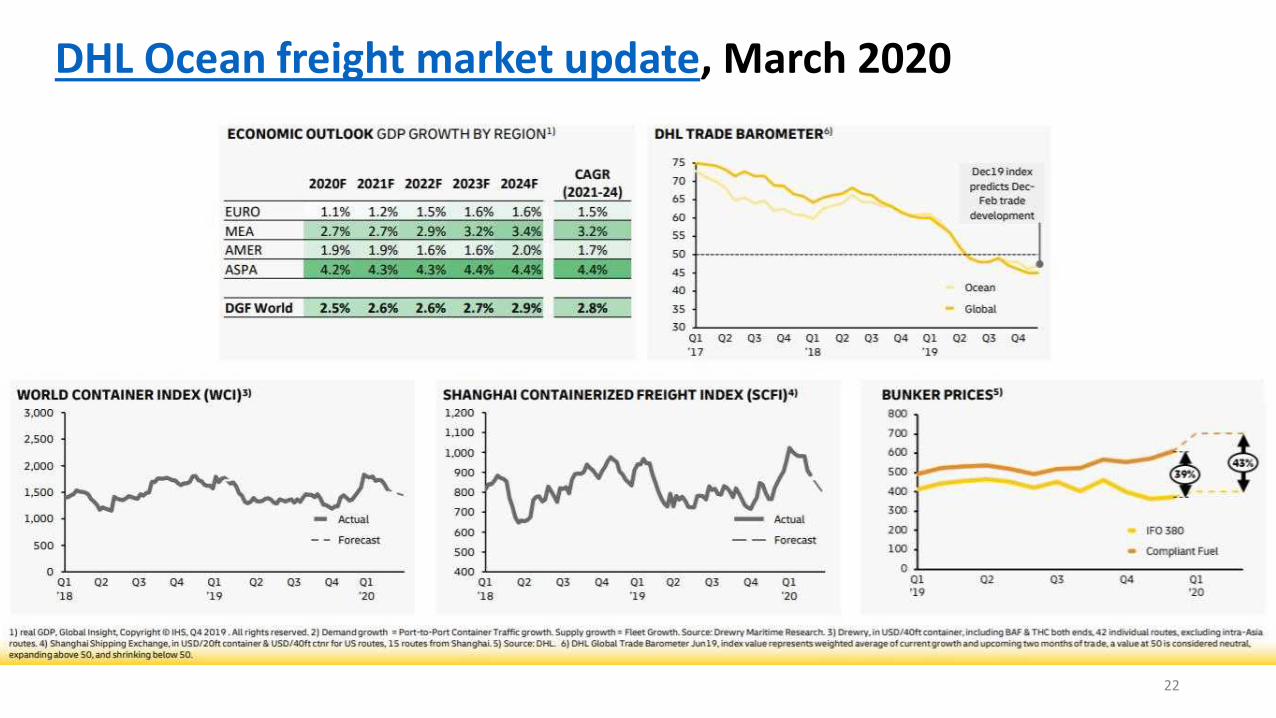
DHL Ocean freight market update, March 2020
22

IATA’s assessment (24 March 2020)• The International Air Transport Association (IATA) updated its analysis of the revenue
impact of the COVID-19 pandemic on the global air transport industry.
• Owing to the severity of travel restrictions and the expected global recession, IATA now estimates that industry passenger revenues could plummet $252 billion or 44% below 2019’s figure. This is in a scenario in which severe travel restrictions last for up to three months, followed by a gradual economic recovery later this year.
• IATA’s previous analysis of up to a $113 billion revenue loss was made on 5 March 2020, before the countries around the world introduced sweeping travel restrictions that largely eliminated the international air travel market.
• “The airline industry faces its gravest crisis. Within a matter of a few weeks, our previous worst case scenario is looking better than our latest estimates. But without immediate government relief measures, there will not be an industry left standing. Airlines need $200 billion in liquidity support simply to make it through. Some governments have already stepped forward, but many more need to follow suit,” said IATA’s Director General and CEO, Alexandre de Juniac.
• See also IATA’s briefing• https://www.iata.org/en/iata-repository/publications/economic-reports/third-impact-
assessment/23

Source: IATA 24

25https://covid-19.sixfold.com/
In road freight transport, most European borders are currently free of major slow-downs,
with some exceptions that you can find on the map. Situation as at Sun 29 Mar 2020 18:00 (CET)
Real-time updatesavailable at
(public domain):
Luxemburg GermanySpain FranceApprox. 1 hour Romania Hungary
Hungary RomaniaApprox. 4 km queues
Bulgaria GreeceApprox. 1 hour

How do various type of majordisruptions affect the transport sector?
Some simplified and generic illustrations
26

A generic illustration of thedemand & composition dynamics
upon disruptions in freight & logisticsand passenger transport
The type of disruption or disaster isdecisive on what type of and how severe
the impacts will be (see next slide).
E.g. COVID-19 has caused a simultaneous andan almost global drop in both
(industrial or mobility) demand and supply.
As transport demand for passengers and freight is derived from the underlying mobility needs, the
change in transport services is typically muchbigger than the change in the underlying
demand.
COVID-19 has certainly proved this true especiallyin air travel, passenger shipping and long-
distance bus and rail as well as in commutertraffic – not to speak of cruise shipping.
Demand
Significant Somewhat About the same Somewhat Significant
Remain the
same
Overcapacity,
service level
deterioration,
financial strain
Capacity, service
and freight level
adjustments
No change
Capacity, service
and freight level
adjustments
Significant capacity
and freight
increases, service
level deterioration
Change
somewhat
Severe
overcapacity,
financial and
service level
deterioration
Overcapacity and
service
deterioration
Slight adjustments
under market
conditions
Undercapacity,
service level
deterioration,
freight level rises
Significant capacity
and freight
increases, service
level deterioration
Change
significantly
Extreme
overcapacity,
financial strain
and service
deterioration
Severe
simultaneous
over- and under-
capacity, service
deterioration
Severe supply and
demand imbalance of
vehicles,units, staff
and infrastructure
Severe
simultaneous
over- and under-
capacity, service
deterioration
Extreme capacity
constraints and
management &
cost implications
Demand
Significant Somewhat About the same Somewhat Significant
Remain the
same
Change
somewhat
Change
significantly
Traf
fic
mo
de
s
Freight transport
and logistics
services
<-- Decrease Increase -->
Car
go t
ype
s a
nd
/or
tran
spo
rt m
od
es
Passenger
transport and
traffic
Decrease Increase
27Source: Lauri Ojala 2020

Demand
Significant Somewhat About the same Somewhat Significant
Remain the
same
Overcapacity,
service level
deterioration,
financial strain
Capacity, service
and freight level
adjustments
No change
Capacity, service
and freight level
adjustments
Significant capacity
and freight
increases, service
level deterioration
Change
somewhat
Severe
overcapacity,
financial and
service level
deterioration
Overcapacity and
service
deterioration
Slight adjustments
under market
conditions
Undercapacity,
service level
deterioration,
freight level rises
Significant capacity
and freight
increases, service
level deterioration
Change
significantly
Extreme
overcapacity,
financial strain
and service
deterioration
Severe
simultaneous
over- and under-
capacity, service
deterioration
Severe supply and
demand imbalance of
vehicles,units, staff
and infrastructure
Severe
simultaneous
over- and under-
capacity, service
deterioration
Extreme capacity
constraints and
management &
cost implications
Demand
Significant Somewhat About the same Somewhat Significant
Remain the
same
Change
somewhat
Change
significantly
Traf
fic
mo
de
s
Freight transport
and logistics
services
<-- Decrease Increase -->
Car
go t
ype
s a
nd
/or
tran
spo
rt m
od
es
Passenger
transport and
traffic
Decrease Increase
Armed conflict
Severe overcapacity of infrastructure,vehicles, units and staff Signifigantly less services offered Severe financial losses, bankcrupties Large-scale lay-offs
Infra & equipment largely intact
Demand for capacity increases Mobilization of troops
Changed infrastructure priorities Modal and cargo type changes Displacement of civilians
Armed conflict
Pandemia;severe naturalcatastrophe or
severe economicslowdown
Pandemia;severe naturalcatastrophe or
severe economicslowdown
The impact (of COVID-19)will be different for each transport
mode, and differs also betweendomestic and internationaltransport/logistics services.
E.g. in scheduled air traffic up to 90 % or moreof flights have been cancelled in many parts of
East and South Asia and Europe.
40 % to 50 % of air freight volumese.g. in Asia has been so-called belly cargo. Nowpassenger aircraft have been refitted to freightfor longhaul routes b/w U.S., Europe and Asia.
In early March 2020, 2M empty containers arestuck in China, and container shipping capacity
substantially lower than in December 2019.
Ferry operations have practically lost allpassengers, freight operations maintained.
Long-distance as well as local bus and rail traveldeclined over 50 %, in many cases over 90 %
28Source: Lauri Ojala 2020
Logistics impact of the
disruptionAbundant Constrained Not available
Transport distances may grow, while
modes & types remain the same
Regular freight
levels and other
logistics costs
More expensive
freight or other
logistics costs
Transport distances grow, more
expensive modes & types required
Transport distances and/or times
grow signifcantly, much more
expensive modes & types required
No transport options available, or
they are extremely expensive
Costs of available
logistics options
extremely high
Unbearably high
logistics costs;
substitutes are
needed
Availability of suitable transport and logistics capacity
(incl. warehousing and materials management)A
vaila
ble
mo
des
an
d/o
r ro
ute
s
Depending on the
severity and
duration of the
disruption,
substituting
products needed
and/or creating
own transport or
logistics capacity.
Government
intervention and
ransoning required.
Market-based
freights; logistics
cost grows by
distance and/or
more expensive
modes/types
Significantly higher
logistics costs
compared to a
normal situation
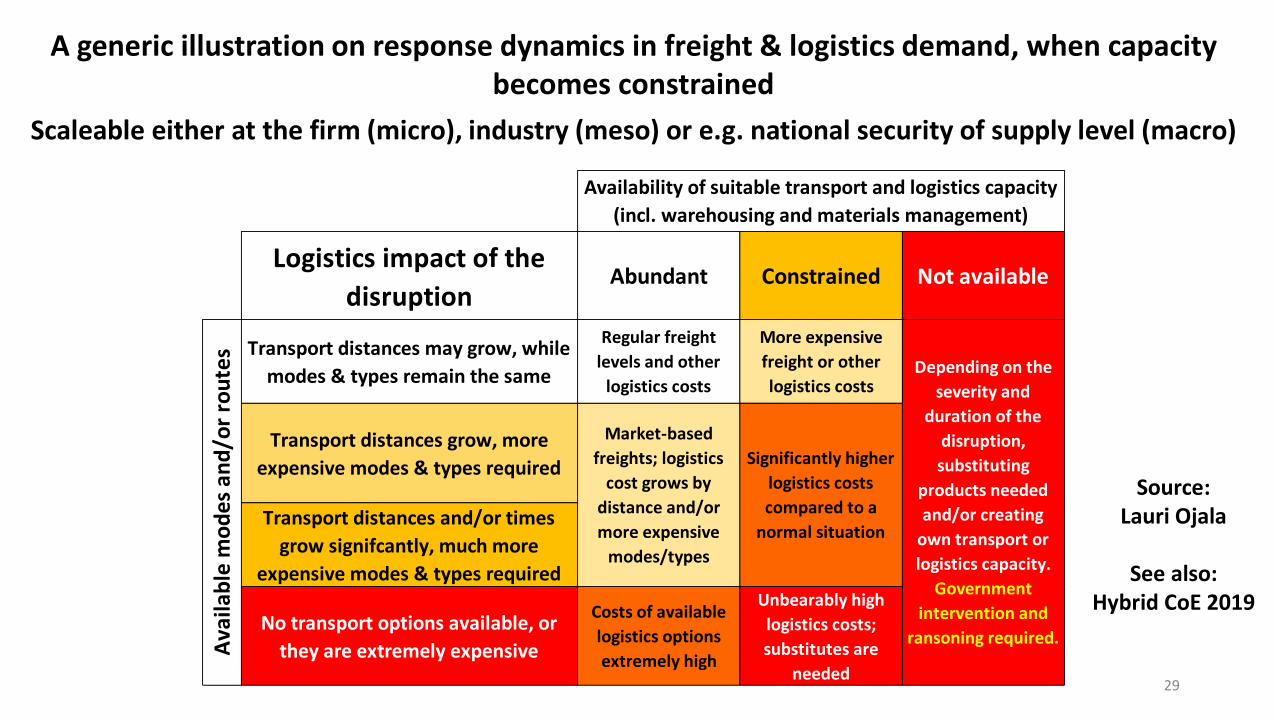
A generic illustration on response dynamics in freight & logistics demand, when capacitybecomes constrained
Scaleable either at the firm (micro), industry (meso) or e.g. national security of supply level (macro)
Source:Lauri Ojala
See also:Hybrid CoE 2019
29

How long will this last ?
– well, too early to say:
nobody seems to have the answer right now, onlygood or less good guesses…
30

0
1
2
3
4
5
6
7
8
9
10
ST (Jan.-Feb.) MT (Mar-Aug) LT (Sep - 2021->)
Economic Human Environmental Social Political
0 =
no
imp
act
10
= e
xtre
me
imp
act
*) N.B. This is purely for illustration purposes, and reflects the Author’s personal ”questimate” in end-March 2020
Almost exclusivelynegative impacts
Predominantlypositive impacts
A back-of-the-envelope ”questimate”* of the Short, Medium and Long termbroader impacts of COVID-19 on e.g. most EU countries as well as those
with a high Backwards GVC participation
31
Source: Lauri Ojala 2020

Some indicative policy actions
32

COVID-19: Severity of impacts and policy responses exemplified in the transport sector
33Source: Lauri Ojala, Update 29 March 2020
ModeVehicle /
serviceMobility Financial
Social
inclusion
Cruise
shipping
Policy responses exemplifiedR
oad
tran
spo
rt Very negativeFinancial assistance to service providers: loan guarantees, loans, tax cuts or payment deferrals, cash
handouts as a last resort.
Ensure speedy authority operations especially for border-crossing traffic. Taking care of road safety
issues for freight and passenger car movements.
Rail transport
Very negative for
passengers; mixed to
negative for freight
Rapid need of financial assistance to service providers: loan guarantees, tax cuts, payment deferrals
and/or cash handouts. If there is Government ownership in rail or air transport operations, eligible
subsidies or capital endownments to operators. Also government purchases of air transport capacity
e.g. for repatriation of nationals, supply of emergency and medical products. Very large lay-offs to be
excpected especially in airlines but also in rail passenger operations. Significant impact also on air
trafiic control capacity, where large lay-offs already taking place. This may also partly happen in rail
network management. It is extremely important not to compromise safety and security in these.Air
tra
nsp
ort
Mar
itim
e tr
ansp
ort
Catastrophic
Cruise shipping is commercial recreational business without national Security of Supply potential, so
new government bail-outs unlikely. However, substantial financial (Gov:t) guarantees to shipyards
and cruise operators exist, which may materialize. For flag states the impact is likely to be very
negative. For Port-of-Call states, not much to be done, as shipping companies need to survive first.
PAX &
cargo
With or without a national merchant fleet, every effort needs to be made to ensure the functionality
of the Sea Lines of Communications, and the commercial viabilty of services. Gov:t purchases of cargo
space to secure national supplies already in use e.g. in Finland. The part of merchant fleet and crew
in a country's ship register that serves national supply needs may require financial support or
relaxation of some fees or taxes, i.e. fiscal implications highly likely. Ensure speedy rotation of ships
and enable necessary crew changes at ports. Ensuring safety and security in shipping by maintaining
operational Vessel Traffic Management services, and viable operations in main seaports.
Cargo only
Bus, Taxi,
Minivans
COVID-19 impacts
Positive to Mixed
Negative to
mixed due to
cargo type &
route
Very negative for
passengers
Negative on cargo
n.a.
PAX &
belly cargo
Catastrophic for
passengers and belly cargo
Cargo only n.a.
Road
haulageNegative to Mixed n.a.
Passenger or freight

COVID-19: Severity of impactsand policy responses
exemplifiedin the transport sector
- A more fine-grained illustration of Slide 27
34
Source: Lauri OjalaUpdate 29 March 2020
Mode PAX Freight Type or speed of impact Mobility FinancialSocial
inclusion
Parcels and courier
shipments possible
Local Seldom
IntercityWidely used: parcels
and special goods
Immediate on passenger mobility,
parcel logistics
International Seldom Immediate on passenger mobility
Light vehicles
Negative to Mixed: overcapacity in
city logistics; undercapacity in
home deliveriesDomestic
heavy vehicles
International
heavy vehicles
LocalImmediate on intracity and
commuter traffic
IntercityInternational
DomesticMail, parcels &
courier
Dramatically decreased demand of
domestic and transfer travel and of
mail & parcel servicesShort haulLong haul
Charter Belly cargo
ScheduledMail, parcels &
courier
Increased demand due to rapid
loss of belly cargo capacity
Heavy lift Special cargoes Mixed: due to cargo type
Exclusive Immediate and devastating
Passenger
cruise ferriesPrimary
Immediate on passenger mobility
& loss of belly cargo capacity
Ro-ro shipping SomeDecreased demand on most short
sea shipping routes
Container
shippingContainers
Rapid decrease in volumes; large
backlog of empty boxes in China
Dry bulkLiquid bulk
Other Special cargoes
COVID-19 impacts
Negative to Mixed impacts due to
the industry they serve; despite
border closures
n.a.
n.a.
n.a.
Very negative
Negative to Mixed
Very negative to catast-
rophic for passengers.
Negative for freight;
exception: China-Europe
Very negative to
catastrophic for passengers
and for belly cargo freight
Positive
Mixed
Catastrophic
Very negative to
catastrophic
Negative
MixedNegative to Mixed: due to cargo
type
Mar
itim
e tr
ansp
ort
Roll on- roll off cargo
Mail, belly cargo (high
unit value)Immediate on passenger mobility
& loss of belly cargo capacity
Air
tra
nsp
ort
Cargo
Primary
Cruise shipping
PAX &
cargo
Large bulk shipmentsCargo
Immediate on passenger mobility
Rail transport
Pas
sen
ger
rou
tes
ExclusiveExclusive freight
trains
Ro
ad t
ran
spo
rt
Taxis and minivans
Vehicle type
Bus
Primary
use
Immediate on intracity and
commuter traffic
Road
haulage
(Light <
3.5 ton;
Heavy >
3.5 ton)
Exclusive use
Type and mode of passenger or freight transport

Some useful sites to follow
35

Some useful sites to follow:• EU Mobility and Transport
• IMO on COVID-10
• UNECE Observatory on Border Crossings due to COVID-19
• European Maritime Safety Agency EMSA listings on MS actions
• Global COVID-19 impacts on road haulage by IRU
• Aviation industry by IATA: https://www.iata.org/en/
• Logistics firms updates:• Wilhelmsen COVID-19 Global Port Restrictions Map (a very good one!)
• Bolloré COVID-19 IMPACT UPDATE March 27th, 2020
• DB Schenker
• DHL
• DSV
• Kuehne & Nagel https://www.kn-portal.com/updates_on_coronavirus
• Maersk: https://www.maersk.com/stay-ahead
• Ti Coronavirus March 2020 updates
• Zipline Logistics, 2020 Q2 Freight Market Update, 24 March 2020 36

Selected sources
• DHL Ocean freight market update (March 2020)
• Hybrid CoE (2019) HANDBOOK ON MARITIME HYBRID THREATS — 10 Scenarios and Legal Scans
• IATA (24 March 2020) Deeper Revenue Hit from COVID-19
• McKinsey (25 March 2020)
• McKinsey (16 March 2020) COVID-19 Briefing Note
• UNCTAD (26 March 2020) Coronavirus could cut global investment by 40%
• WEF a) (March 2020) , World Economic Forum
• WEF b) (23 March 2020) , How China can rebuild global supply chain resilience after COVID-19
• WTO (2020) World Trade Statistical Review 2019
Selected Video presentations:
• MIT video briefing “A Coronavirus Briefing - The Impact of COVID-19 on Business and Supply Chain”, 16 March 2020, 56 minutes
37
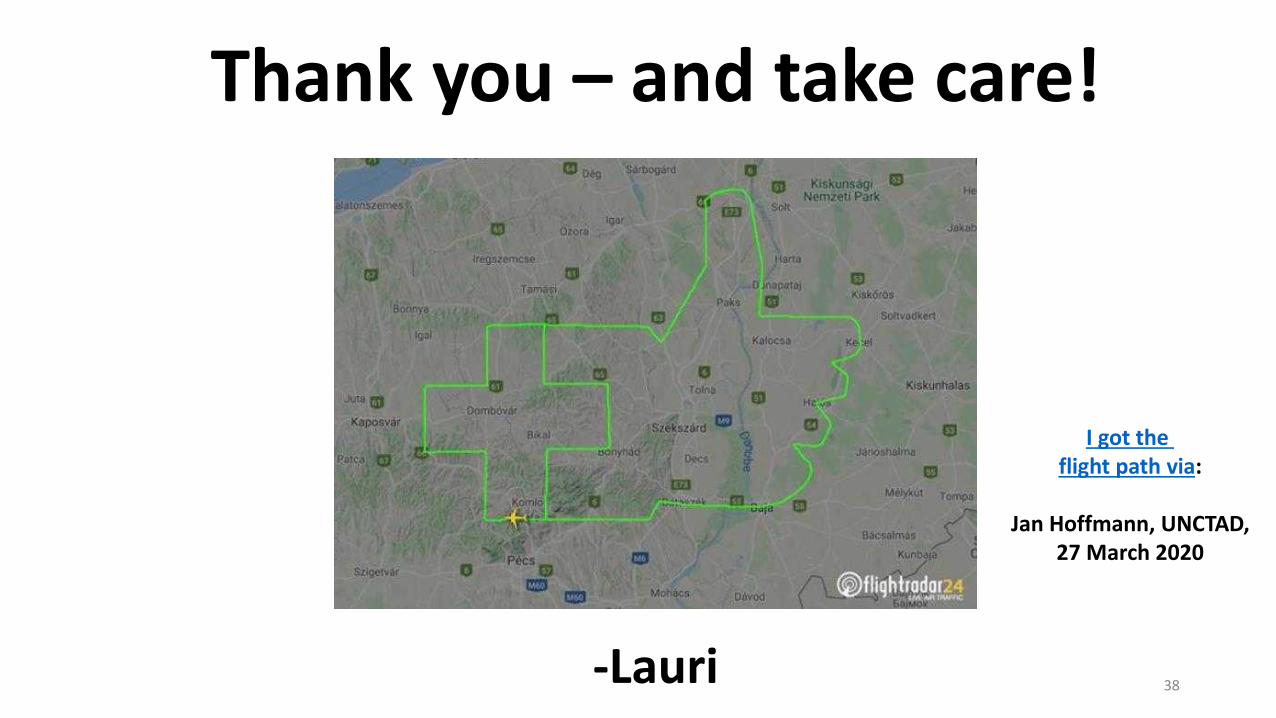
Thank you – and take care!
-Lauri
I got theflight path via:
Jan Hoffmann, UNCTAD,27 March 2020
38