the impact of the adoption of cgiar’s improved varieties
TRANSCRIPT

byAlessandra GarberoPierre MarionValentina Brailovskaya
The impact of the adoption of CGIAR’s improved varieties on poverty and welfare outcomesA systematic review
IFAD RESEARCHSERIES
33

The opinions expressed in this publication are those of the authors and do not necessarily represent
those of the International Fund for Agricultural Development (IFAD). The designations employed and the
presentation of material in this publication do not imply the expression of any opinion whatsoever on
the part of IFAD concerning the legal status of any country, territory, city or area or of its authorities, or
concerning the delimitation of its frontiers or boundaries. The designations “developed” and “developing”
countries are intended for statistical convenience and do not necessarily express a judgement about the
stage reached in the development process by a particular country or area.
This publication or any part thereof may be reproduced for non-commercial purposes without prior
permission from IFAD, provided that the publication or extract therefrom reproduced is attributed to IFAD
and the title of this publication is stated in any publication and that a copy thereof is sent to IFAD.
Authors:
Alessandra Garbero, Pierre Marion, Valentina Brailovskaya
© IFAD 2018
All rights reserved
ISBN 978-92-9072-864-1
Printed December 2018
The IFAD Research Series has been initiated by the Strategy and Knowledge Department in order to bring
together cutting-edge thinking and research on smallholder agriculture, rural development and related
themes. As a global organization with an exclusive mandate to promote rural smallholder development,
IFAD seeks to present diverse viewpoints from across the development arena in order to stimulate
knowledge exchange, innovation, and commitment to investing in rural people.

IFAD RESEARCHSERIES
33
by
Alessandra Garbero
Pierre Marion
Valentina Brailovskaya
The impact of the adoption of CGIAR’s improved varieties on poverty and welfare outcomes
A systematic review

2
We are thankful to Professor Melinda Smale for providing additional results from two studies included in this meta-analysis (Smale and Mason 2014, in Zambia, and Mathenge et al. 2014, in Kenya). The data source for the first study is a supplement to the Post-Harvest Survey designed by the Zambian Central Statistical Office and Michigan State University. The second study uses data from the TAPRA (Tegemeo Agricultural Policy Research and Analysis) panel dataset collected by the Tegemeo Institute of Agricultural Policy and Development, Egerton University, in collaboration with Michigan State University. We are also grateful to the research analyst, Giovanna Sartori, who reviewed and screened the studies for inclusion.
About the authors
Alessandra Garbero is Senior Econometrician in the Research and Impact Assessment Division, Strategy and Knowledge Department, International Fund for Agricultural Development (IFAD). Her work focuses on impact assessment methodologies and applied econometrics in developing regions. She obtained her PhD from the London School of Hygiene & Tropical Medicine. Her thesis, “Estimation of the impact of adult deaths on households’ welfare using panel data in KwaZulu-Natal, South Africa”, is a methodological assessment of the implications of different econometric methods used in the relevant literature to estimate the impact of adult deaths. Her first degree is in economics and she specialized in demography and research methods. Her prior work experience involved working at the United Nations Population Division on population projections and at the Food and Agriculture Organization of the United Nations (FAO) on the impact of HIV and AIDS on food security and agriculture, as well as on improving the collection, dissemination and use of gender-disaggregated data in agriculture and rural development. She also developed a methodology to evaluate the impact of HIV and AIDS on the agricultural labour force. Before joining IFAD, she was a research scholar at the International Institute for Applied Systems Analysis, where she was part of a team of analysts working on analytical, methodological and modelling research.
Pierre Marion is a consultant/research analyst at the World Bank, Poverty and Equity Global Practice. He was a research analyst at the University of Oxford, working on the Young Lives study (Oxford Department of International Development). Previously, he worked in the Research and Impact Assessment Division, Strategy and Knowledge Department, IFAD. He specializes in impact assessments and agricultural research. His research interests are in the areas of poverty, vulnerability, food security, agriculture and rural development. He has worked on impact assessments in Chad, Ethiopia, Senegal, Tanzania and Uganda. Before joining IFAD, he was part of the Statistics Division at FAO. He completed an MSc in development economics at the University of Sussex, United Kingdom.
Acknowledgements

3
Oversight: Paul Winters, Associate Vice-President.
Advisory Board: Fabrizio Bresciani, Shirley Chinien, Edward Heinemann, Bruce Murphy, Richard Pelrine, Lauren Phillips, Paolo Silveri and Abdelkarim Sma.
Editorial Management Team: Rui Benfica, Helen Gillman, Anja Lesa and Marina Izzo.
Valentina Brailovskaya is a PhD candidate in economics at the University of California, Santa Cruz. Her main area of research is development economics. Her current work focuses on quantifying the effects of unreliable electricity on microentrepreneurs in Malawi and the application of mobile money technologies to address saving and credit constraints.

4
Table of contents
Acknowledgements ������������������������������������������������������������������������������������������������������������������� 2
Abstract ����������������������������������������������������������������������������������������������������������������������������������� 5
1 Introduction �������������������������������������������������������������������������������������������������������������������������� 6
2 Conceptual framework: agricultural research and poverty reduction ����������������������������������������� 9
Direct impacts ����������������������������������������������������������������������������������������������������������������� 11
Indirect impacts ��������������������������������������������������������������������������������������������������������������� 12
3 Literature review ������������������������������������������������������������������������������������������������������������������ 14
4 Methodology ����������������������������������������������������������������������������������������������������������������������� 16
Step 1: Study selection ����������������������������������������������������������������������������������������������������� 16
Step 2: Critical appraisal of selected studies ������������������������������������������������������������������������ 18
Step 3: Meta-analysis and weighting ����������������������������������������������������������������������������������� 19
Step 4: Meta-regression ��������������������������������������������������������������������������������������������������� 23
5 Results ������������������������������������������������������������������������������������������������������������������������������� 24
Step 1: Study selection ����������������������������������������������������������������������������������������������������� 24
Step 2: Critical appraisal of selected studies ������������������������������������������������������������������������ 28
Step 3: Meta-analysis results ��������������������������������������������������������������������������������������������� 34
Step 4: Meta-regression ��������������������������������������������������������������������������������������������������� 42
Heterogeneity of impacts within interventions ����������������������������������������������������������������������� 45
6 Conclusion �������������������������������������������������������������������������������������������������������������������������� 47
References ����������������������������������������������������������������������������������������������������������������������������� 51
Appendix I: Search strategy ����������������������������������������������������������������������������������������������������� 56
Appendix II: Bias assessment framework ���������������������������������������������������������������������������������� 58
Appendix III: References to excluded studies ���������������������������������������������������������������������������� 61
Appendix IV: Meta-analysis results stratified by crop type and quality of paper ��������������������������� 72
Appendix V: Meta-analysis with all papers �������������������������������������������������������������������������������� 78

5
This study assesses the impact of agricultural research on poverty and welfare by performing a systematic review of experimental and quasi-experimental impact evaluations of improved varieties interventions. The literature has not reached a firm conclusion on the impact of the adoption of improved seeds on poverty and welfare, primarily because, as is well acknowledged, this empirical literature is subject to multiple potential biases that tend to inflate the contribution of agricultural technologies to reducing poverty. The International Fund for Agricultural Development has funded many improved seeds interventions, led by the Consultative Group on International Agricultural Research (CGIAR) research centres, between 2007 and 2015. In this paper, we assess the overall impact of these CGIAR interventions over this period. After a systematic review of experimental and quasi-experimental impact evaluations was conducted, a random-effects meta-analysis was performed on seven papers on poverty, 12 papers on income, and eight papers on expenditure in relation to various food crops and included unpublished studies. Our major contribution is thus the systematic treatment of this imperfect literature, coding and classifying each study according to its risk of bias, and examining the correlation between bias scores and the outcomes of each study. Nevertheless, we found that improved varieties reduced poverty by 4 per cent (although this finding is not statistically significant), increased income by 35 per cent and increased expenditure by 14 per cent in adopting households in rural areas. In the meta-regression, welfare improvements associated with improved varieties uptake was found to be positively correlated with the studies’ risk of bias. These results point to the fact that, although agricultural research and improved varieties have been effectively contributing to welfare improvements through direct channels – that is, productivity gains – the quality of the counterfactual-based evaluative evidence remains remarkably low. Further efforts need to be made to improve the evidence base to validate the positive impacts and further encourage donors to invest in this area of agricultural research.
Abstract
6
It is widely acknowledged that agricultural research has played a key role in improving rural livelihoods in the developing world (Thirtle, Lin and Piesse 2003). Donors and governments have invested heavily in agricultural research through institutions engaged in agricultural science, particularly the Consultative Group on International Agricultural Research (CGIAR) and its network of research centres and partners. Specifically, the International Fund for Agricultural Development (IFAD) funded many CGIAR improved seeds interventions between 2007 and 2015 through its grant funding programme. However, in an era when the same donors are bringing increasing pressure to bear on development institutions to demonstrate evidence-based results, the causal linkages between agricultural research, poverty reduction and, more broadly, welfare and other development outcomes have not been sufficiently and convincingly demonstrated (Renkow and Byerlee 2010), casting doubt on the effectiveness of CGIAR’s investments and those of its donors.
A large literature has certainly documented the substantial pro-poor impact of international agricultural research and development (R&D) generally and CGIAR-led research in particular (Thirtle, Lin and Piesse 2003; Adato and Meinzen-Dick 2007). However, this “impact” literature has focused only on aggregate returns and on the efficiency of research investments, neglecting a thorough examination of the possible causal impacts stemming from the adoption of technologies on poverty reduction. To date, there have been two reviews, the Fan et al. (2007) study and the Alene et al. (2009) study, that have specifically tried to quantify the impact on poverty, and specifically movement out of poverty. The first study examined the macro-evidence of the impact of International Rice Research Institute (IRRI) modern varieties on poverty in China and India, and found that, between 1981 and 1999, more than 6.75 million Chinese were moved out of poverty because of IRRI’s research. In India, 14 million people exited poverty between 1991 and 1999. The Alene et al. (2009) study focuses on the impact of maize research in Western and Central Africa and estimates that maize adoption has moved 740,000 people out of poverty annually, with the rate of exit increasing over time.
Relative to global assessments, CGIAR system-level assessments date back to Anderson (1985). Nelson and Maredia (1999), Evenson and Gollin (2003), Maredia and Raitzer (2006), and Raitzer and Kelley (2008) have validated the “perception” that CGIAR has had, over its lifetime, a significant and sustainable impact on poor people by helping to develop technology options and agricultural management tools that have permitted increased food security and dramatic reductions in the costs of producing the major staple food crops of the world. This, in turn, has benefited both poor producers and poor consumers. However, this perception has not been demonstrated by a rigorous appraisal of the counterfactual-based evidence available to date – or, in other words, rigorous impact evaluations – from CGIAR centres.
1 Introduction

7
Our study aims to address this lack of evaluative evidence, at the aggregate level, of the impact of agricultural research on poverty reduction and, more broadly, welfare outcomes. To date, it represents the first attempt to systematically meta-analyse the impact of agricultural research on welfare outcomes. To this end, we conducted a systematic review of studies evaluating the poverty and welfare impact of the adoption of the improved varieties disseminated by CGIAR between 2007 and 2015 and performed a quantitative synthesis through a meta-analysis. The latter is defined as “the statistical combination of results from two or more separate studies” (Green et al. 2009); from the meta-analysis, we derived a global estimate of the impact of agricultural research on poverty reduction and intermediate outcomes such as income and expenditure. Compared with traditional ways of aggregating studies results, such as vote counting, which do not remove the risk of purposively selecting studies based on subjective criteria, meta-analyses are more scientific in the sense that they take into account precision, sample size, the magnitude of the effect or effect size and the research design. In addition, given that crop genetic improvement received the largest proportion of CGIAR funding, we specifically focused on the adoption of improved seeds, and specifically yield-increasing varieties, and examined their direct causal impact from uptake on crop productivity gains, increased income and poverty reduction.
The systematic review protocol encompasses a number of steps, starting with a comprehensive search of the relevant published and unpublished evidence. The search was conducted for the period from 2007 to 2015, the years during which investments were made by IFAD in CGIAR improved seeds interventions, to enable an assessment of the overall impact of these interventions during that period. The rationale for this study’s focus on CGIAR interventions developed and disseminated from 2007 to 2015 is justified by IFAD’s large investments in CGIAR improved seeds varieties interventions during that period. Specifically, a large number of IFAD’s grants targeted CGIAR research centres in the domain of improved seeds varieties between 2007 to 2015. Of the 95 grants provided to CGIAR (equivalent to US$96.4 million), 30 grants (amounting to US$40.5 million, or 42 per cent of total grants to CGIAR) were allocated to improved seeds varieties interventions.
After conducting the search for relevant studies, namely experimental and quasi-experimental impact evaluations, three reviewers assessed the papers against the inclusion criteria and two analysts extracted the data from the included studies. The papers were critically appraised and the final sample included seven papers with poverty outcomes, 12 papers with income indicators, eight papers with expenditure outcomes and two papers with asset-based indicators relating to various crops (rice, wheat, maize, bananas, chickpea, pigeon pea and groundnut). A random effects meta-analysis was performed on poverty, income and expenditure outcomes.
The results point to the fact that CGIAR investments in improved seeds have led to very strong welfare impacts (particularly on income and expenditure). Poverty was reduced by 4 per cent – although this finding is not significant – income increased by 35 per cent and expenditure increased 14 per cent in adopting households compared with non-adopting households.
Based on the studies included in our analysis, we argue that the diffusion of improved seeds should increase, given its effects on welfare outcomes. Greater efforts are needed to both increase adoption rates and provide systematic and rigorous evidence of the impact adopting such technologies has on welfare outcomes.

8
This paper is structured as follows: section 2 presents a conceptual framework illustrating the causal pathways through which agricultural research impacts on poverty and welfare outcomes. Section 3 introduces the past research conducted on the impact of improved seeds on well-being. Section 4 describes the methodological steps on which the systematic review is based, namely the study selection protocol, the critical appraisal of the selected studies, the meta-analysis and, finally, the meta-regression. Having presented the meta-analysis methodology and quantitative results, we qualitatively examine and discuss the findings of the meta-analysed studies in section 5. The paper concludes with key lessons and implications for policy and future research.

9
In this section, we discuss the mechanisms by which the adoption of improved varieties can lead to poverty reduction. A distinction should be made between direct and indirect impacts. Improved varieties can bring about crop productivity gains resulting in rises in farmers’ incomes and consequently poverty reduction (direct impacts). Improved varieties can also benefit both adopting and non-adopting households through increased employment opportunities, wage increases and lower food prices associated with the rise in agricultural production caused by improved varieties (indirect impacts). These impacts will have competing effects, as individuals are unlikely to be exclusively producers, consumers or wage earners. Direct and indirect impacts can be brought about only if these modern varieties are adopted. The introduction of improved varieties onto the market is often accompanied by interventions to increase adoption. Extension, subsidies and other promotional approaches are very common forms of encouraging developing countries to increase adoption rates. The reality is that adoption rates of modern varieties remain remarkably low to date.
2 Conceptual framework: agricultural research and poverty reduction

10
Figure 1 illustrates the potential impacts, both direct and indirect, of agricultural research on poverty. In this section, we discuss the conceptual framework and the assumptions behind each link in the causal chain.
Figure 1 Improved varieties and poverty reduction
Source: authors’ analysis.
Note: This paper performs a review of studies focusing on the direct effects of the adoption of modern food varieties (dark-blue pathway).

11
Direct impacts
In terms of direct effects, improved varieties have characteristics that can lead to greater agricultural production, on average, than traditional seeds. These seeds have higher yield potential, are more responsive to fertilizer and irrigation, have shorter maturation periods, have longer storage capabilities, are more tolerant of environmental stresses and/or have a higher nutrient content. In a post-Green Revolution period, Byerlee (1996) reports, yields from improved wheat seeds were 20 per cent higher than those from traditional wheat seeds. Similarly, in West Africa, the improved seed New Rice for Africa (NERICA) was found to mature more quickly and produce greater quantities of rice than traditional rice seeds in usual and drought conditions (Kijima, Sserunkuuma and Otsuka 2006). The International Maize and Wheat Improvement Center, a CGIAR centre, created and disseminated a drought-tolerant maize variety in East and Southern Africa, which has been shown to yield 20 per cent more on average under drought conditions than previous maize seeds (World Bank 2008). However, numerous external factors, such as political instability or extreme climate shocks, may eliminate productivity improvements. In addition, households may lack a sufficient level of education and experience to adequately cultivate these improved varieties. Becerril and Abdulai (2010) and Asfaw et al. (2012a) have found that more educated farmers may benefit more from improved varieties.
For households producing and selling on the local market, higher agricultural yields at a constant cost level may be associated with greater income and greater profits. Similarly, for self-subsistence households, assuming that the farmers purchase the quantity of food needed that is not met by own production, with higher yields farmers will benefit from a reduction in expenditure on food, leading to a reallocation of expenditure away from food to assets. In addition, with greater production, farmers can enter the local market selling excess production (Irz et al. 2001; de Janvry and Sadoulet 2002). Thus, improved varieties can reduce poverty through higher yields for adopting households, and the income gain may be sufficiently large to exit poverty. However, access to the market may be hindered by a rise in transaction costs associated with greater production, such as greater storage and transportation costs, preventing the sale of the agricultural production. Furthermore, prices and costs in the food market may change with the dissemination of improved varieties and may lead to indirect impacts on other markets. With the potential income gains, large land owners may have an incentive to increase rents or to expand their cropped area by cultivating land previously rented out, thereby eliminating income gains and increasing landlessness (Hazell and Haddad 2001). In addition, increased income may not translate into poverty reduction, as credit is often required to purchase improved varieties, and this could impose a significant financial burden on poor households. In the case of a negative shock, debt repayments could instead increase poverty (Diagne and Zeller 2001).
Additional income allows a household to invest in durable assets. Investing in productive assets such as land, machinery or livestock will further improve the productivity of the farmer and provide a higher and more stable income in the future. The accumulation of income-generating productive assets may enable farmers to pass the “Micawber” threshold (below which households lack sufficient assets to generate income levels above the poverty line in the absence of a positive shock) and end chronic poverty (Barrett and Carter 2006). Investing in non-productive durable assets such as home improvements, furniture or technology may serve as insurance against future income shocks.

12
These direct impacts of improved varieties benefit adopting households. However, access to improved varieties may be limited to certain households only. In fact, wealthier households may be more likely to adopt, for several reasons. First, these households have stronger connections with input suppliers and research institutions that provide information about such technology. Second, wealthier households have financial resources at their disposal or can access credit to purchase improved varieties, whereas other households often lack the secure ownership or tenancy rights that they would need to obtain credit. Households with a very limited asset base are also more likely to be risk averse than richer households, which may discourage adoption. Richer households with large asset bases are more capable of recovering from failed investments (Kerr and Kolavalli 1999). Improved varieties may thus be associated with greater inequality.
Indirect impacts
As far as the indirect effects are concerned, processing greater production associated with the productivity gains resulting from improved varieties requires more workers in the labour market, leading to a shift in the labour demand curve. For example, over 1 million seasonal migrants gained employment in Punjab and Haryana during the early stages of the Green Revolution (CGIAR 2013). These greater farm employment opportunities have varying effects on wages depending on the local environment. In areas with a highly inelastic labour supply, the wage gains may be substantial, but they may create an incentive for employers to switch to machines (Hazell and Haddad 2001). Demand for labour in non-farming sectors may be indirectly affected by increased farm economic activities (Irz et al. 2001). Improvements in the employment rate and wages in both farm and non-farm sectors may have positive long-lasting effects on poverty through greater investment in households’ assets and greater household income and consumption, as described above. However, for producers, hiring additional labour at higher wages increases the cost burden, eliminating the income gains resulting from the direct impacts of improved varieties described above. The income associated with the additional production needs to be greater than the additional labour costs to reduce poverty among producers.
A vast literature describes the reduction of food prices following a rise in productivity levels (Winters et al. 1998; Irz et al. 2001). Because the poor allocate a larger share of their budget to food, they benefit proportionally more than the non-poor, and this generates significant indirect impacts on poverty and welfare. Using an international multimarket model (the IMPACT model) developed by the International Food Policy Research Institute, Evenson and Rosegrant (2003) estimated that, without any CGIAR research, developing countries’ food and feed prices would have been 18 to 21 per cent higher across 37 countries and 18 agricultural commodities. Ruttan (1977) estimated that the lowest income quartile of Colombian households captured 28 per cent of the consumer benefits resulting from the increase in rice supply following the introduction of higher yield varieties between 1966 and 1974. The benefits are not restricted to rural households, as the urban poor also spend most of their budget on food (Fan, Fang and Zhang 2001). In the long term, lower prices in agriculture create a surplus that can then be extracted and invested in industrial growth, contributing to rapid poverty reduction and development (Winters et al. 1998). However, the effects of price reduction may be detrimental for both adopting and non-adopting net-selling households. Hazell and Haddad (2001) describe how net-selling farmers who did not receive the new agricultural technology were harmed by the reduction in food prices if they did not experience a reduction in the unit cost of production. The authors describe how these decreasing market prices may push out many non-adopting small farmers. This phenomenon is also relevant for adopting households.

13
With a sharp reduction in food prices, no income gain from greater production may occur (if the quantity effect is smaller than the price effect). The benefits of lower food prices may be eliminated by an increase in other prices due to real exchange rate appreciation associated with agricultural export growth (de Janvry and Sadoulet 2002).
Agricultural research can thus result in welfare improvements and poverty reduction. In this systematic review, we appraise and quantitatively synthesize the findings of previous studies assessing the direct impacts of improved varieties on the welfare and poverty of adopting households. It is important to note that the relative importance of direct and indirect impacts varies across regions. De Janvry and Sadoulet (2002) estimated that direct impacts were more significant in Africa than in Asia or Latin America, where reliance on the agricultural sector is much less. Direct impacts can be rigorously measured using experimental or quasi-experimental designs. Evaluating indirect impacts is more difficult, as they affect both adopting and non-adopting households and they depend on local market conditions. Doing so requires partial or general equilibrium models, which are associated with strong assumptions. Furthermore, the magnitude of the indirect impacts of improved varieties is highly dependent on the magnitude of the direct impacts.
By focusing on direct impacts, we can assess whether poorer households adopt improved varieties and the extent to which they benefit from productivity increases that translate into income growth and poverty reduction. Or do improved varieties lead to greater income inequality and impoverishment? We discuss the factors that explain the differences in poverty reduction resulting from improved seed interventions in the next section.

14
The empirical literature that explores the direct impacts of improved seeds in rural areas provides mixed evidence on the impact of cash crop improved seeds. Recent studies are divided between those showing positive large impacts and those finding minor impacts. Some of these studies have shown that introducing improved seeds can be very effective in increasing agricultural productivity, thus leading to a reduction in smallholder farmers’ poverty. For instance, Asfaw et al. (2012b) examined the direct impacts of improved legume technologies in rural Ethiopia and Tanzania between 1997 and 2008. The increase in consumption expenditure ranged from 18 to 28 per cent. The authors argued that the impact on expenditure decreased with farm size in both countries. Adoption of improved seeds was found to reduce adopting households’ likelihood of falling below the poverty line in the range of 12–13 per cent and to reduce the depth of poverty by 8–10 per cent. Similarly, Becerril and Abdulai (2010) studied the dissemination of improved maize seeds in Mexico between the 1970s and the early 2000s. Improved maize seeds reduced adopting households’ likelihood of falling below the poverty line by roughly 19–31 per cent.
Other studies showed less clear positive impacts. A study in Kenya showed that improved maize seeds (disseminated since 1992) had decreased adopting households’ likelihood of falling below the poverty line by 1.65 per cent and reduced the depth of poverty by an average of 2.9 per cent (Mathenge, Smale and Olwande 2014). Similarly, Smale and Mason (2014) found that households adopting improved maize seeds were 0.7 per cent less likely to fall below the poverty line in Zambia. In a study of the impacts of the dissemination of several improved vegetable seeds in central Bangladesh since 1987 (Hallman, Lewis and Begum 2007), the authors did not find any positive increase in income for adopters.
To obtain an overall estimate of the direct impacts of improved seeds, studies have aggregated country- or area-specific observations. Using a three-stage least-square model, Thirtle, Lin and Piesse (2003) estimated the impact of agricultural productivity growth resulting from improved seeds on poverty reduction at the macro level, with 108 observations for 48 countries in the 1980s and 1990s. In each stage, regional elasticities were estimated (first, elasticity of farm value added per unit of land with respect to agricultural research expenditures; second, elasticity of GDP per capita with respect to value added per unit of land; and, third, elasticity of poverty with respect to GDP per capita). The authors estimated that 6.24 million people were moved out of poverty. Poverty reduction was found to occur mainly in Africa and Asia. Similarly, Fan et al. (2007) provide macro-level evidence assessing the impact of IRRI research on poverty reduction in China and India. In India, the authors estimated, 2.73 million rural people exited poverty in 1991 and 0.56 million did so in 1999 as a result of IRRI’s interventions. Fan, Hazell and Thorat (2000) estimated that, for every 1 per cent increase in agricultural productivity, the total number of rural poor in India decreased by 0.241 per cent as a result of both indirect and direct effects. In Fan et al. (2007), the poverty elasticity with respect to agricultural productivity
3 Literature review
15
growth was multiplied by the estimated productivity gains from IRRI research to derive a total estimate for poverty reduction. Alene et al. (2009) used a similar structural model to that of Thirtle, Lin and Piesse (2003), with data from sub-Saharan Africa. The authors found that the introduction of improved maize seeds reduced poverty by 0.75 per cent annually between 1981 and 2004 in West and Central Africa. During this period, it was calculated, 740,000 people moved out of poverty. However, it is important to note that macro-level data result in estimates that are less precise than those informed by micro-level data. Specifically, the distributional effects of agricultural research are ignored.
Another portion of the literature has combined microeconomic studies to assess overall direct impacts. For example, Freebairn (1995) performed a systematic review of microeconomic studies relating to the impacts on inequality of improved seeds introduced during the Green Revolution between 1970 and 1989. The author performed a vote count of about 307 papers and found that 80 per cent of those studies had concluded that the introduction of higher yield varieties had increased income inequality, as improved seeds interventions had more limited benefits for poorer households than for their wealthier counterparts. Note that this method of evaluating the direct impact on poverty lacks quantitative analysis, and cannot be considered to constitute a robust assessment of the direct impacts of improved varieties.
Other studies have performed meta-analyses to quantify the direct impacts of agricultural research but have not focused on poverty or welfare as outcomes. Specifically, those available to date have assessed the impact on returns on and the efficiency of research investments. For instance, Alston et al. (2000) assembled 1,128 studies on returns on investments in agricultural R&D. The landmark study by Evenson and Gollin (2003) estimated the rates of return on CGIAR’s investments in crop genetic improvement, while Raitzer and Kelley (2008) performed a meta-analysis of all studies globally after 1989, evaluating the benefits and costs of CGIAR’s research investments since it started operations. Stewart et al. (2015) also performed a meta-analysis of the effects of innovation and new technology (fertilizers, new crops and more nutritious crops) on farmers’ food security, and, based on a rigorous screening that selected 14 eligible papers, found that these interventions had the potential to lead to improvements in farming households’ levels of food security in average terms. The authors also pointed out the paucity of quality evidence.
To further reduce the potential risk of bias, we have restricted our study sample to those providing counterfactual-based evaluative evidence, i.e. micro-level impact evaluations that have rigorous evaluation designs including a robust identification strategy with a statistically valid counterfactual and known sample separation between adopting and non-adopting households.

16
1. https://datahelpdesk.worldbank.org/knowledgebase/articles/906519-world-bank-country-and-lending-groups.
Systematic review and meta-analysis date back to the 1970s (Glass 1976) and have been widely used in the biomedical field. Thanks to groups such as the Campbell Collaboration, set up in 1999, the use of these tools has spread to the social sciences field, and they are now gaining prominence in international development (Waddington et al. 2014).
The term “systematic” underscores the difference between a systematic review and a standard literature review (Hedges and Cooper 1994). The important characteristics of the former are a clear protocol for systematically searching defined databases over a defined time period, transparent criteria for the inclusion or exclusion of studies, and an analysis and reporting of study findings. A systematic review of effects may also include a meta-analysis, that is, the appraisal and synthesis of the results of all comparable studies. A meta-analysis makes it possible to summarize the quantitative evidence on intervention effects from different environments in a comprehensive and unbiased way.
In this section, we present the methodology we used, namely the four steps required to perform a rigorous systematic review. This methodology follows Waddington et al. (2014).
First, a search for all relevant studies is conducted, following a strict selection protocol and a search strategy. Second, to determine the internal and external validity of the results, a critical appraisal of the selected studies is conducted. Third, a meta-analysis statistically combines the effect sizes of the individual studies to produce an overall aggregate estimate of the impact of exposure to improved varieties on poverty and welfare. Finally, an analysis of the drivers of the heterogeneity of the findings of selected studies is presented in a meta-regression. This last step aims to identify whether this heterogeneity is explained by the studies’ risk of bias or by other observed factors.
Step 1: Study selection
The study selection criteria were developed using the PICOS acronym (participants, interventions, comparison, outcomes and study design). Studies were included in the review when they satisfied the following criteria.
• Participants: participants are small farmers growing food crops and living in any country except in high-income economies as ranked in the World Bank classification.1 Small farmers are defined as farmers living close to the poverty line in poor countries. They do not own extensive areas of land (i.e. they own less than 2 hectares) and agriculture is their primary source of income. They also allocate a significant proportion of their land to the growth of food crops.
4 Methodology

17
• Interventions/exposure: the studies included examined the impact of the adoption of modern varieties on welfare outcomes. These modern varieties interventions had to be supported by CGIAR centres. However, we did not limit the search to specific food crops. Some studies also related to tissue culture, for example, the dissemination of improved banana varieties.
• Comparison: the counterfactual impact evaluation needed to be carried out through real or reconstructed control groups.
• Outcomes: outcomes needed to be either poverty impacts and/or estimates of intermediate monetary development outcomes, such as income, expenditure, assets or wages. We did not focus in this review on indirect effects (i.e. the impacts of the adoption of modern varieties on the larger population). The studies that include poverty outcomes used the Foster-Greer-Thorbecke (FGT) poverty indices. The FGT metrics are a class of poverty measure with the helpful properties of additive decomposability and subgroup consistency, which allow poverty to be measured across population subgroups in a coherent way (Foster, Greer and Thorbecke 2010). Although there are three FGT indexes, namely headcount ratio, poverty gap and severity of poverty, we focus only on the headcount ratio. The headcount ratio measures poverty incidence – that is, the proportion of the population that is considered poor – and was chosen because of its relative intuitiveness and ease of interpretation. In the majority of the studies, the poverty lines used were based on national thresholds. In most of the studies examining income as an outcome, figures were reported in local currencies.
• Study design: the studies included in this analysis used micro-level experimental designs (enabling random assignment of modern varieties), such as randomized controlled trials, and quasi-experimental designs. The latter include propensity score matching (PSM), instrumental variable (IV) approaches, endogenous switching regression models and differences in differences (DID). Studies of exposure were included if access to modern varieties was based on precise rules such as a threshold on a continuous variable (regression discontinuity design, RDD). Studies with no use of a comparison group were not included.
The review included only studies measuring the impact of adopting improved seeds and of the improvement of food crops on poverty, income, expenditure, assets and wages. The review excluded studies evaluating the projected impact of future seed provisions. Studies, published or unpublished, dating from between 2007 and 2015 were included, and specifically micro-level impact analyses conducted in areas where large-scale adoption of the agricultural technology had taken place. We estimated the average effect that technology adoption had on poverty or poverty-related outcomes. Only experimental or quasi-experimental studies with a statistically valid counterfactual were included, to identify studies with a robust identification strategy. The time frame for inclusion, 2007 to 2015, was the period during which IFAD invested significantly in CGIAR improved seeds varieties interventions. Specifically, a large number of IFAD’s grants targeted CGIAR research centres in the domain of improved seeds varieties between 2007 and 2015. Of the 95 grants provided to CGIAR (equivalent to US$96.4 million), 30 grants (amounting to US$40.5 million, or 42 per cent of total grants to CGIAR) were allocated to improved seeds varieties interventions. These nine years also represent three IFAD financial replenishment periods, with each period lasting three years. We considered only studies in English.

18
The PICOS study selection criteria are an effective tool for screening and selecting all the relevant studies eligible for inclusion in a systematic review. They also provide a study quality checklist and prevent the selection of studies with biased results. For example, the presence of a comparison group with similar characteristics to the participant group is essential if observed changes in poverty or welfare outcomes following the adoption of improved varieties are to be attributed accurately to the intervention. The extent to which studies were at risk of bias varied. In addition, identifying who exactly participated in the intervention limits the risk of including contaminated results.
The search was conducted in ScienceDirect, Google Scholar, the 3ie impact evaluation database, CGIAR Standing Panel on Impact Assessment (SPIA) publications and the CGIAR Library. ScienceDirect and Google Scholar are the largest databases gathering published and unpublished papers of varying quality across all topics and regions. The choice of the 3ie impact evaluation database was justified by the strict focus on micro-level impact evaluations. The CGIAR SPIA publications contain all the impact assessments conducted by SPIA. Finally, the CGIAR Library collects official CGIAR documentation.
The search strategy follows the methodology described by Waddington et al. (2014) and Stewart et al. (2015). Two analysts independently performed the search. A third analyst repeated the search at a later date to ensure that all relevant studies were included.2
Step 2: Critical appraisal of selected studies
The second step entailed an appraisal of the quality of estimates in each individual study. The framework summarized by Waddington et al. (2014) was used to structure the analysis.3 The studies were evaluated based on the likely risk of bias (internal validity or causal identification) and on external validity (generalizability). Each paper was assigned a bias score, a generalizability score and a total score.
This step is highly important as it involves assessing the reliability of the studies’ estimates and whether the estimates of the impacts of improved varieties should be considered to correctly reflect the actual causal impact. In addition, the selected estimates were modelled in a meta-regression (step 4), which sought to identify the presence of linear relationships between the magnitudes of the studies’ estimates and their characteristics (including the studies’ risk of bias and their generalizability).
The studies’ internal validity was critically appraised and a bias score consequently assigned based on a number of screening questions:
1. Attrition bias (only relevant for panel datasets): is there any evidence that there was systematic attrition between the survey rounds?4
2. Selection bias: was there a randomization factor or did participants self-select into the programmes?
3. Hawthorne effect bias: was there monitoring of the participants that might have changed their behaviours and the final outcomes?
2. For more detail about the search strategy, please see appendix I.
3. The framework is available in appendix II.
4. This criterion is relevant only for panel data studies and was not considered in the calculation of the final bias score for each study.

19
4. Spillover effects: was there a large geographical distance between treatment and control groups to guarantee that the benefits of the treatment were not received by the control groups?
5. Selective reporting bias: is there any evidence of selective reporting? Were there gaps in the analyses that seemed purposefully omitted?
6. If the authors used propensity score matching/instrumental variables, did they provide diagnostic statistics to ensure that the necessary assumptions were met?
The total generalizability score is based on the following factors:
1. Motivation of the research: was the context explained? Was there an adequate literature review?
2. Sampling descriptions: were the descriptive statistics provided? Was the data collection process described? Was the sampling strategy appropriate?
3. Completeness of analysis.
4. Presence of triangulation methods: did the authors use several robustness checks in the estimations?
5. Quality of conclusions and discussions.
Terciles of the bias score were constructed and each paper was assigned to a risk of bias category (with studies in the lowest tercile classified as “High risk of bias studies”, those in the second tercile as “Medium risk of bias studies” and those in the highest tercile as “Low risk of bias studies”. Most papers considered by this review were rated as at medium or high risk of bias for the following reasons: (1) no studies had a randomized component and, because of the nature of the evaluated programmes, some form of self-selection was present, and (2) none of the studies blindly compared adopters with non-adopters and all attempted to control for self-selection with appropriate econometric techniques.
Step 3: Meta-analysis and weighting
To perform the meta-analysis, standardized estimates for all included studies had to be computed. The final estimates of the meta-analysis are thus expressed in terms of effect sizes. The response ratio (RR) was chosen as the appropriate effect size metric. We chose to calculate effect sizes as RRs, as opposed to standardized mean differences (SMD), because of their greater ease of interpretation and comparability across different contexts.
The RR is defined as the ratio of the mean outcome for the treatment group divided by the mean outcome for the control group. It is interpreted in the same way as a risk ratio: 1 is the point of "no effect" and any movement above or below the "no effect" point represents a percentage change in the treatment group outcome compared with the control group outcome. For example, an RR of 1.3 translates into a 30 per cent increase in the outcome variable for the treatment group compared with the control group, while an RR of 0.70 translates into a 30 per cent reduction.
Following Waddington et al. (2014), the RRs and the corresponding standard errors were calculated differently depending on the specification provided in the study.

20
1. For studies using statistical matching-based analysis, the RR, and its standard error, SE(RR), were estimated using equations (1) and (2) (Borenstein et al. 2009):
(1)
(6)
(2)
(7)
(5)
(3)
where Yt is the mean outcome in the treatment group, Yc is the mean outcome in the comparison group, nt and nc are the sample sizes of the treatment and comparison groups, respectively, Sp is the pooled standard deviation and t is the t-test value.
When Sp is not reported, we calculated SE(RR) by rescaling the RR using information reporting on statistical significance, such as a t-statistic (equation 3):
2. For regression-based studies, the RR and its standard error were estimated using equations (4) and (5) (International Initiative for Impact Evaluation 2013):
where β is the coefficient on the treatment variable in the regression and Ys is pooled mean outcome.
3. For studies using probit or logit models, the RR and its standard error were estimated using equations (6) and (7) (International Initiative for Impact Evaluation 2013):
(4)
where Yc is the control group mean and ∆ is the marginal effect. For non-matched samples, Yc is replaced with Ys.
1
𝑅𝑅𝑅𝑅 = !!!!
(1)
SE RR = 𝑆𝑆!! ∗!
!!∗!!!+ !
!!∗!!! (2)
SE RR = 𝐸𝐸𝐸𝐸𝐸𝐸 !"(!!)!
(3)
𝑅𝑅𝑅𝑅 = !!!!!!
(4)
SE RR = 𝐸𝐸𝐸𝐸𝐸𝐸 !"(!!)!
(5)
𝑅𝑅𝑅𝑅 = !!!∆!!
(6)
SE RR = 𝐸𝐸𝐸𝐸𝐸𝐸 !"(!!)!
(7)
𝑆𝑆𝑆𝑆!"##$!%$& = 𝑆𝑆𝑆𝑆 ∗ 1 + 𝑚𝑚 − 1 ∗ 𝐼𝐼𝐼𝐼𝐼𝐼 (8)
𝑂𝑂𝑂𝑂𝑂𝑂𝑂𝑂𝑂𝑂𝑂𝑂𝑂𝑂 𝑜𝑜𝑜𝑜 𝑖𝑖𝑖𝑖𝑖𝑖𝑖𝑖𝑖𝑖𝑖𝑖𝑖𝑖𝑖𝑖! = 𝛽𝛽! + 𝛽𝛽!𝑠𝑠𝑠𝑠𝑠𝑠𝑠𝑠𝑠𝑠 𝑐𝑐ℎ𝑎𝑎𝑎𝑎𝑎𝑎𝑎𝑎𝑎𝑎𝑎𝑎𝑎𝑎𝑎𝑎𝑎𝑎𝑎𝑎𝑎𝑎𝑎𝑎𝑎𝑎! + 𝑒𝑒𝑒𝑒𝑒𝑒𝑒𝑒𝑒𝑒! (9)

21
The RR was calculated for both continuous outcomes, such as income and expenditure, and binary outcomes, such as poverty incidence.
Many studies provided several estimates from different specifications. To avoid double counting studies in the meta-analysis, a single estimate was derived for each study and the specification with the lowest risk of bias was chosen (Waddington et al. 2014). Some methods are considered unambiguously superior and the choice of the best estimate was straightforward. This methodology guided the selection of the estimates when multiple reports on studies existed (e.g. a working paper and a journal article on the same study with the same authors) or when multiple studies were based on the same dataset. Specifically, preference was given to estimates from regressions that included greater numbers of relevant covariates, included fixed effects or adjusted standard errors. The choice of the best estimate was especially relevant for papers that used propensity score matching, since the results may change a great deal depending on the matching algorithm used. The four most common matching techniques are nearest neighbour match (NNM) with replacement, NNM without replacement, kernel and caliper and radius matching. In each method, there is a trade-off between bias and variance. Some methods give more precise estimates but may be more biased; some are less biased but less precise. A brief description of each method is provided in table 1.
Table 1 Propensity score matching approaches
Method Description Bias Variance
NNM without replacement Each treated unit is matched with a single control unit and once the control unit is used it cannot be used again
Higher Lower
NNM with replacement Each treated unit is matched with a single control unit. A control unit can be used more than once
Lower Higher
Kernel matching A control group is constructed as a weighted average of all the control observations to construct a counterfactual
Higher Lower
Caliper and radius matching A tolerance level is imposed on the maximum propensity score distance. A disadvantage is that it is difficult to know what distance is appropriate
Lower Higher
Source: authors’ analysis.

22
In choosing the preferred matching algorithm in propensity score matching studies, NNM with replacement (preferred above all, since it involves less subjective judgement) and caliper and radius estimates were given preference, as both were considered to have a lower risk of bias. When single and multiple NNM with replacement specifications were used in the same study, we selected the estimate from the multiple NNM with replacement, as this specification reduces bias and increases variance compared with single NNM with replacement (Caliendo and Kopeinig 2005).
However, other specifications were harder to rank. Therefore, we constructed a “synthetic effect” to be used when the choice of the best estimate was ambiguous. This synthetic effect was based on the sample weighted average, using the procedure described in Borenstein et al. (2009), which calculates the variance and the standard error of the estimate.
For papers that reported results on several years of follow-up, we reported the results from the later years. For papers that reported subgroup results, estimates were combined into a single number (Waddington et al. 2014).5
In addition, unit of analysis error (UoA) should also be taken into account when computing effect sizes. This issue arises in impact evaluation studies where the project placement and analysis are conducted at different unit levels and the researcher does not account for within-cluster dependency (e.g. project placement occurs at cluster level and outcomes are analysed at household level). The consequences of UoA are false smaller variances and false narrower confidence intervals. Therefore, if a study did not use cluster robust standard errors, a correction was applied to the standard errors. Following Waddington et al. (2014), equation (8) was used to correct the error terms.
where m is the number of observations per cluster, and ICC is the intracluster correlation coefficient, which is assumed to be 0.025.6
After standardizing the effects as RRs and after corrections for UoA have been made, the summary statistics (impact estimates or effect sizes) for each study can be combined using a variety of meta-analytic methods, which are classified as fixed-effects models (where studies are weighted according to the amount of information they contain) or random-effects models (where an estimate of between-study variation is incorporated into the weighting). In a fixed-effects model, the main assumption is that the true effects are the same across studies. The only difference between the observed results and the true effects is due to the sampling error. Following this approach, larger studies are given more weight because of the greater likelihood of collecting a more representative sample. In a random-effects model, the true effects are assumed to differ across studies and the differences between the true effects and the observed effects are not only due to the sampling error but also due to differences in the true effects. The choice of model ultimately affects the distribution of weights given to studies. Following a random-effects model, each study presents a new piece of information that is equally important and therefore the weights are more balanced across studies of varying sample sizes. Given the fact that the adoption of improved varieties may have different impacts in different settings, a random-effects model was chosen to derive the final estimate.
(8)
5. All the calculations of the RR were done in Excel and can be provided upon request.
6. This number follows Waddington et al. (2014) on the ICC.
1
𝑅𝑅𝑅𝑅 = !!!!
(1)
SE RR = 𝑆𝑆!! ∗!
!!∗!!!+ !
!!∗!!! (2)
SE RR = 𝐸𝐸𝐸𝐸𝐸𝐸 !"(!!)!
(3)
𝑅𝑅𝑅𝑅 = !!!!!!
(4)
SE RR = 𝐸𝐸𝐸𝐸𝐸𝐸 !"(!!)!
(5)
𝑅𝑅𝑅𝑅 = !!!∆!!
(6)
SE RR = 𝐸𝐸𝐸𝐸𝐸𝐸 !"(!!)!
(7)
𝑆𝑆𝑆𝑆!"##$!%$& = 𝑆𝑆𝑆𝑆 ∗ 1 + 𝑚𝑚 − 1 ∗ 𝐼𝐼𝐼𝐼𝐼𝐼 (8)
𝑂𝑂𝑂𝑂𝑂𝑂𝑂𝑂𝑂𝑂𝑂𝑂𝑂𝑂 𝑜𝑜𝑜𝑜 𝑖𝑖𝑖𝑖𝑖𝑖𝑖𝑖𝑖𝑖𝑖𝑖𝑖𝑖𝑖𝑖! = 𝛽𝛽! + 𝛽𝛽!𝑠𝑠𝑠𝑠𝑠𝑠𝑠𝑠𝑠𝑠 𝑐𝑐ℎ𝑎𝑎𝑎𝑎𝑎𝑎𝑎𝑎𝑎𝑎𝑎𝑎𝑎𝑎𝑎𝑎𝑎𝑎𝑎𝑎𝑎𝑎𝑎𝑎𝑎𝑎! + 𝑒𝑒𝑒𝑒𝑒𝑒𝑒𝑒𝑒𝑒! (9)

23
The Stata package for meta-analysis (and specifically the “metan” command) was used with default weighting criteria based on the inverse of the variance (where estimates with smaller variance are given more weight). This approach is reasonable in a context where the estimates analysed are reliable and the standard errors provided are correct. In addition, a meta-regression was conducted to determine if the precision of the results systematically differed between studies with different bias scores.
Step 4: Meta-regression
A meta-regression is performed to determine the reason for the heterogeneity of estimates between studies. A meta-regression is simply a linear estimation of the outcome variable (effect sizes or the t-statistics of studies’ results) based on study characteristics (e.g. risk of bias, generalizability scores and other moderator variables such as whether the study was published or the region of analysis). This step makes it possible to identify whether or not there is a linear relationship between effect sizes and individual study characteristics. It can be expressed as in equation (9):
where i is an individual study, Outcome of interest is either the RR or the t-statistic of the results, and study characteristics are factors that we hypothesize may influence the results. We used inverse variance of the estimate to weight the observations.
The presence of statistically significant results in the meta-regression would indicate that the variation in results between studies could be explained by study characteristics.
This step can therefore be used to assess the influence of studies’ risk of bias on the results. For example, studies with a higher risk of bias may lead to estimates of greater magnitude. In addition, the meta-regression could distinguish the presence of publication bias if unpublished papers reported estimates of lesser magnitude than those reported in published papers. Alternatively, it could identify whether or not results varied by region or type of intervention. This analysis has the potential to highlight the main determinants that drive the magnitude of the impact of improved varieties interventions.
(9)
1
𝑅𝑅𝑅𝑅 = !!!!
(1)
SE RR = 𝑆𝑆!! ∗!
!!∗!!!+ !
!!∗!!! (2)
SE RR = 𝐸𝐸𝐸𝐸𝐸𝐸 !"(!!)!
(3)
𝑅𝑅𝑅𝑅 = !!!!!!
(4)
SE RR = 𝐸𝐸𝐸𝐸𝐸𝐸 !"(!!)!
(5)
𝑅𝑅𝑅𝑅 = !!!∆!!
(6)
SE RR = 𝐸𝐸𝐸𝐸𝐸𝐸 !"(!!)!
(7)
𝑆𝑆𝑆𝑆!"##$!%$& = 𝑆𝑆𝑆𝑆 ∗ 1 + 𝑚𝑚 − 1 ∗ 𝐼𝐼𝐼𝐼𝐼𝐼 (8)
𝑂𝑂𝑂𝑂𝑂𝑂𝑂𝑂𝑂𝑂𝑂𝑂𝑂𝑂 𝑜𝑜𝑜𝑜 𝑖𝑖𝑖𝑖𝑖𝑖𝑖𝑖𝑖𝑖𝑖𝑖𝑖𝑖𝑖𝑖! = 𝛽𝛽! + 𝛽𝛽!𝑠𝑠𝑠𝑠𝑠𝑠𝑠𝑠𝑠𝑠 𝑐𝑐ℎ𝑎𝑎𝑎𝑎𝑎𝑎𝑎𝑎𝑎𝑎𝑎𝑎𝑎𝑎𝑎𝑎𝑎𝑎𝑎𝑎𝑎𝑎𝑎𝑎𝑎𝑎! + 𝑒𝑒𝑒𝑒𝑒𝑒𝑒𝑒𝑒𝑒! (9)

24
Step 1: Study selection
The search identified 21 studies for inclusion in the systematic review. These studies met the criteria set out by the PICOS protocol described in section 4, step 1. The included studies all focused on small farmers growing food crops in countries other than high-income economies and assessed the impact of the adoption of improved varieties on poverty, income, expenditure or assets. Experimental and quasi-experimental evaluation designs were included. The studies span all continents and covered seven different food crops. A PRISMA flow diagram7 is presented in figure 2.
Sixteen studies were found in the search described in section 4, step 1. By screening the bibliographies of included studies and of existing systematic reviews, we identified five additional studies. Following the search strategy, we screened approximately 25,000 titles in the selected databases.8 Of the 78 studies that potentially met the search criteria, based on their titles, 21 were selected.9
Of these 21 studies, seven reported the effects on poverty, 12 on income, 2 on assets and 8 on expenditure. Table 2 sets out some of the characteristics of the studies included. The full list of study outcome variables is reported in table 3.
5 Results
7. A PRISMA (Preferred Reporting Items for Systematic Reviews and Meta-analyses) flow diagram depicts the flow of information through the phases of a systematic review. It maps the number of studies identified, included and excluded, and the reasons for exclusion.
8. The search was expanded to include 2015.
9. Appendix III lists the papers that were first considered during the search, based on their titles, but later excluded, as they did not meet the study selection criteria.

25
Figure 2 PRISMA flow diagram
Source: authors’ analysis.

26
Study Country Crop type Published Method Number of observations
Treatment Control Data type
Adekambi et al. 2009 Benin Rice No IV 268 50 218 Cross-sectional
Amare et al. 2012 Tanzania Maize, pigeon pea
Yes ESRM 586 256 330 Cross-sectional
Asfaw et al. 2012a Tanzania Pigeon pea Yes ESRM 613 202 411 Cross-sectional
Asfaw et al. 2012b Ethiopia Chickpea Yes ESRM 700 222 478 Cross-sectional
Audu et al. 2013 Nigeria Maize Yes PSM 122 50 72 Cross-sectional
Becerril et al. 2010 Mexico Maize Yes PSM 325 143 182 Cross-sectional
Bezu et al. 2014 Malawi Maize Yes IV 1,311 Panel
Debello et al. 2015 Ethiopia Maize No ESRM 1,761 571 1,190 Cross-sectional
Dibba et al. 2012 The Gambia
Rice Yes IV 600 237 363 Cross-sectional
Kassie et al. 2011 Uganda Groundnut Yes PSM 927 545 382 Cross-sectional
Khonje et al. 2015 Zambia Maize Yes PSM 800 545 382 Cross-sectional
Kikulwe et al. 2012 Kenya Banana No DID 353 208 145 Panel
Mathenge et al. 2014 Kenya Maize Yes IV 1,243 Panel
Mendola 2007 Bangladesh Rice Yes PSM 2,562 1,449 1,113 Cross-sectional
Nguezet et al. 2011 Nigeria Rice Yes IV 481 101 380 Cross-sectional
Rovere et al. 2009 Mexico Maize No PSM 120 33 87 Panel
Shiferaw et al. 2014 Ethiopia Wheat Yes ESRM 2,017 1,421 596 Cross-sectional
Simtowe et al. 2012 Malawi Groundnut No PSM 594 152 442 Cross-sectional
Smale et al. 2014 Zambia Maize Yes IV 6,462 Panel
Wiredu et al. 2014 Ghana Rice Yes IV 150 55 95 Cross-sectional
Wu et al. 2010 China Rice Yes PSM 473 190 283 Panel
Table 2 Characteristics of included studies
Source: authors’ analysis.

27
Table 3 Outcomes of included studies
Study Outcome variable
Adekambi et al. 2009 Expenditure (daily consumption expenditure per adult equivalent in local currency)
Amare et al. 2012 Income (annual total income per capita in local currency)a
Expenditure (annual consumption expenditure per capita in local currency)a
Asfaw et al. 2012a Poverty (poverty line is set on per capita consumption expenditure as a measure of poverty; 468 Tanzanian shillings per person per day is used as poverty line)
Expenditure (annual consumption expenditure per capita in local currency)
Asfaw et al. 2012bb Expenditure (annual consumption expenditure per adult equivalent in United States dollars)
Audu et al. 2013 Expenditure (weekly consumption expenditure per capita in local currency)
Becerril et al. 2010 Expenditure (monthly total expenditure per capita in local currency)a
Poverty (poverty line is set on per capita consumption expenditure as a measure of poverty; 332.52 Mexican pesos per person per month is used as poverty line)a
Bezu et al. 2014 Income (annual total income per adult equivalent in local currency)
Debello et al. 2015 Expenditure (annual food consumption expenditure per capita in local currency)
Dibba et al. 2012 Income (annual total income per household in United States dollars)
Kassie et al. 2011 Poverty (poverty line is set at international standard of US$1 per person per day; the authors rely on per capita-adjusted household income as a measure of poverty)
Income (seasonal net crop income per hectare in local currency)
Khonje et al. 2015 Poverty (poverty line is the US$1.25 per capita per day that was converted to 1.45 million Zambian kwacha per capita per year)
Income (seasonal consumption expenditure per capita in local currency)
Expenditure (seasonal net crop income per hectare in local currency)
Kikulwe et al. 2012 Income (annual gross margin per acre in local currency)
Mathenge et al. 2014 Poverty (the authors estimated poverty lines for each survey year by adjusting using the consumer price index the official rural poverty line for 2006 established by the Government of Kenya (1,562 Kenyan shillings per adult equivalent per month)
Income (monthly total income per adult equivalent in local currency)
Mendola 2007 Income (annual total income per capita in United States dollars)
Nguezet et al. 2011 Income (annual rice income in local currency)
Rovere et al. 2009 Income (monthly value of maize production in local currency)
Shiferaw et al. 2014 Expenditure (annual consumption expenditure per adult equivalent in local currency)
Simtowe et al. 2012 Poverty (the poverty line is a subsistence minimum expressed in Malawian kwacha based on the cost-of-basic-needs methodology)
Expenditure (annual consumption expenditure per capita in local currency)
Smale et al. 2014 Poverty (the authors use the current Zambia kwacha divided by the current international dollar (purchasing power parity), multiplied by the World Bank poverty rate (US$2.00 per capita per day), 365 days, and household size)Income (annual total income per household in local currency)
Wiredu et al. 2014 Income (annual total income per household in United States dollars)
Wu et al. 2010 Income (annual total income per capita in United States dollars)
Source: authors’ analysis.
a Dependent effect size. b The results for the expenditure outcome in Tanzania were not included, as Asfaw et al. (2012a) uses the same dataset
and the same methodology as in this study. The only difference in Asfaw et al. (2012a) is the unit of measurement used: in Asfaw et al. (2012b), expenditure is measured using annual consumption expenditure per adult equivalent, whereas Asfaw et al. (2012a) uses annual consumption expenditure per capita. The unit in Asfaw et al. (2012a) is more consistent with other units of measurements of expenditure, as indicated in this table. In Asfaw et al. (2012b), the expenditure variable for Ethiopia is included. This represents a new unique study outcome in Ethiopia across the included studies.

28
Some outcomes were dropped from the analysis, as the derived logarithmic standard errors of the RRs were negative (poverty for Becerril and Abdulai [2010], expenditure and income for Amare et al. [2012]). Insufficient information in the studies prevented the calculation of the RR and standard error for the poverty outcome from Rovere et al. (2009) and the expenditure outcome from Nguezet et al. (2011). The standard errors of the RRs were corrected for UoA in Mendola (2007), Adekambi et al. (2009), Dibba, Fialor and Diagne (2012), Kassi, Shiferaw and Muricho (2011), Nguezet et al. (2011), Amare, Asfaw and Shiferaw (2012), Asfaw et al. (2012a), Asfaw et al. (2012b), Simtowe et al. (2012), Wiredu et al. (2014) and Khonje et al. (2015). In addition, these papers showed a high risk of UoA.
Table 4 disaggregates studies included in the meta-analysis by region, outcome, data type, methods used, type of crop and whether the study was published or not. The most common methods of analysis were propensity score matching and instrumental variables. Cross-sectional datasets prevailed in the reviewed studies.
Step 2: Critical appraisal of selected studies
As described in section 4, each study was given three scores: one for bias, one for generalizability and a total score. Higher scores correspond to higher quality papers. The maximum scores were 14, 25 and 37 for bias, generalizability and total score, respectively. A bias score of 18 indicates that there is no bias in the study. The density plots of the bias and generalizability scores are displayed in figure 3 (top panel). The majority of papers were of average quality. The generalizability score is a measure of external validity and relates to questions on sampling design, literature review, depth of analysis and argument, methods of triangulation and quality of conclusions. Figure 3 (bottom panel) shows the distribution of the generalizability scores. No paper received the maximum score, and the majority of papers were in the range between 25 and 35. A total score was constructed to give each paper a single quality score. The forest plot results discussed below were disaggregated by overall paper quality, that is, the total score.
Table 4 Summary statistics of included studies
Region Outcome Data type Method Crop Published
Asia and the Pacific (2) Income (1) Cross-sectional(1) Panel
(2) PSM (2) Rice (2) Yes
East and Southern Africa
(6) Poverty(3) Income(2) Assets(5) Expenditure
(8) Cross-sectional(4) Panel
(3) IV(5) ESRM(3) PSM(1) DID
(5) Maize(2) Pigeon pea(2) Groundnut(1) Wheat(1) Banana(1) Chickpea
(9) Yes(3) No
Latin America (1) Income(1) Expenditure
(1) Cross-sectional(1) Panel
(2) PSM (2) Maize (1) Yes(1) No
West andCentral Africa
(1) Poverty(5) Income(3) Expenditure
(5) Cross-sectional (4) IV(1) PSM
(4) Rice(1) Maize
(4) Yes(1) No
Source: authors’ analysis.

29
Figure 3 Distribution of bias and generalizability scores
Bias scores
kernel = epanechnikov, bandwidth = 1.6571
kernel = epanechnikov, bandwidth = 2.0844
Generalizability scores
Source: authors’ analysis.
Bias scores

30
The overall risk of bias measure summarizes the risk of bias for each paper. Of the included studies, 40 per cent fell into the lowest tercile and presented a high risk of bias.
Figure 4 Bias scores
Figure 4 summarizes the frequencies of various biases across all the papers and examines the internal validity of each study. The majority of the studies suffered from selection bias, as most studies performed an ex post evaluation and a randomization component was missing. Many studies attempted to control for selection bias using PSM and IV; however, there were omitted variables that were not accounted for. Some papers used an IV approach, but the instruments were not fully exogenous and could be easily challenged. Many papers chose control groups geographically close to treatment groups, which may result in spillover bias. There was a subset of papers in which all the outcomes were not reported on and some required statistics were missing.
Source: authors’ analysis.
High risk of bias Medium risk of bias Low risk of bias
Summary of critical apprisal: Biases
Other bias
0% 10% 20% 30% 40% 50% 60% 70% 80% 90% 100%
29%
48%
29%
29%
33%
57%
57%
24%
48%
48%
5%
10%
14%
29%
14%
38%
38%
5%
33%
62%
52%
57%
43%
52%
5%
5%
71%
19%
52%
95%
Overall risk of bias
Attrition bias
Selection bias
Confounding
Hawthorne/Motivation
Spillover
Selective reporting
Bias in application of methodology
Excessively small sample
Unit of analysis error

31
Figure 5 Generalizability scores
Description of sampling procedures was adequate?
Are sample characteristics sufficiently reported?
Is it clear how the data were collected?
Methods of recording of data reported?
Methods of analysis explicitly stated?
Is there a clear link to relevant literature/theoretical framework?
Is the design appropriate to answer the research question?
Was the sampling strategy appropriate to the aims of the research?
Were the data collected in a way that addressed the research issue?
Was the data analysis sufficiently rigorous?
Has triangulation been applied?
Are the analysis and conclusions clearly presented?
Was the potential for conflict of interest considered and addressed?
Does the paper discuss ethical considerations related to the research?
0% 10% 20% 30% 40% 50% 60% 70% 80% 90% 100%
5%
5%
14%
14%
5%
10%
10%
33%
24%
33%
14%
67%
71%
33%
24%
43%
43%
38%
95%
38%
48%
14%
62%
81%
19%
14%
62%
67%
48%
24%
38%
5%
100%
62%
52%
86%
No Partially Yes
Summary of critical appraisal: Generalizability
Source: authors’ analysis.
Figure 5 summarizes the results of the critical appraisal of the studies’ external validity or generalizability: sample characteristics, data collection process, description of the context, analysis and conclusions. While most of the papers had an adequate literature review, a clear research question and a sampling description, many received lower scores when judged on rigour of analysis, context description and data collection method.

32
Table 5 Bias scores of included studies
Study Free
of
attr
itio
n
Sel
ecti
on
bia
s
Co
nfo
und
ing
Free
of
Haw
tho
rne
Free
of
spill
ove
r
Free
of
sele
ctiv
e re
po
rtin
g
Free
of
oth
er b
ias
Met
hod
jud
gem
ent
Sam
ple
siz
e la
rge
Uni
t o
f an
alys
is e
rro
r
Bia
s sc
ore
Ris
k o
f b
ias
Adekambi et al. 2009 2 0 0 2 1 0 2 0 0 0 5 High
Amare et al. 2012 2 1 1 2 0 2 0 1 2 0 9 High
Asfaw et al. 2012a 2 0 0 2 1 2 2 1 2 0 10 Medium
Asfaw et al. 2012b 2 0 0 2 1 2 2 0 2 0 9 Medium
Audu et al. 2013 2 0 0 2 0 1 1 0 0 2 6 High
Becerril et al. 2010 2 1 1 2 1 2 2 2 0 2 13 Low
Bezu et al. 2014 1 0 0 2 1 0 2 1 2 2 10 Medium
Debello et al. 2015 2 1 1 2 1 1 0 2 2 2 12 Low
Dibba et al. 2012 2 1 1 2 1 2 1 0 2 0 10 Medium
Kassie et al. 2011 2 1 1 2 0 2 2 2 2 2* 14 Low
Khonje et al. 2015 2 0 0 2 1 2 2 2 2 0 11 Medium
Kikulwe et al. 2012 0 1 1 2 1 2 2 2 0 2 13 Low
Mathenge et al. 2014 0 1 1 2 0 0 2 2 2 2 12 Low
Mendola 2007 2 0 0 2 0 1 0 1 1 0 5 High
Nguezet et al. 2011 2 0 0 2 1 0 0 0 2 0 5 High
Rovere et al. 2009 0 0 0 2 0 0 0 1 0 2 5 High
Shiferaw et al. 2014 2 0 0 2 0 2 2 2 2 2 12 Low
Simtowe et al. 2012 2 1 1 1 0 2 2 1 1 0 9 High
Smale et al. 2014 0 2 2 2 0 2 2 2 2 2 16 Low
Wiredu et al. 2014 2 0 0 2 1 0 2 0 0 0 5 High
Wu et al. 2010 0 0 0 2 0 0 0 2 1 2 7 High
Source: authors’ analysis.
Notes: A score of 0 is given when the answer is no, 1 is when it is not clear and 2 when the answer is yes to the question.
The question “Free of attrition” is relevant only for panel data studies and was not considered in the calculation of the final bias scores for each study.
* In the case of Kassie et al. (2011), the UoA correction was applied to the poverty outcome but not to the income outcome, as here the authors included a village dummy in the estimation.
Tables 5 and 6 show the breakdown of the bias scores and generalizability scores, respectively, for each of the included studies.

33
Table 6 Generalizability scores of included studies
Study Res
earc
h ai
m
Co
ntex
t
Sam
plin
g
Sam
plin
g c
hara
cter
isti
cs
Dat
a co
llect
ion
Dat
a re
cord
ing
Ana
lysi
s
Link
to
rel
evan
t lit
erat
ure/
theo
ry
Ap
pro
pri
ate
met
hod
olo
gy
Ap
pro
pri
ate
sam
plin
g
Ap
pro
pri
ate
met
hod
s o
f d
ata
colle
ctio
n
Ap
pro
pri
ate
anal
ysis
Tria
ngul
atio
n
Cla
rity
of
anal
ysis
and
co
nclu
sio
ns
Co
nflic
t o
f in
tere
st
cons
ider
ed a
nd a
dd
ress
ed
Eth
ical
co
nsid
erat
ions
Gen
eral
izab
ility
sco
re
Adekambi et al. 2009 2 2 1 1 1 1 1 1 1 1 1 0 2 0 0 0 15
Amare et al. 2012 2 2 2 2 2 1 2 2 2 2 1 1 2 2 0 0 25
Asfaw et al. 2012a 2 2 2 2 1 1 2 2 2 2 1 1 2 1 0 0 23
Asfaw et al. 2012b 2 1 2 2 2 1 1 2 2 2 2 2 0 2 0 0 23
Audu et al. 2013 2 1 1 1 1 1 1 2 1 2 2 0 0 0 0 0 15
Becerril et al. 2010 2 2 2 2 2 1 2 2 2 1 2 1 2 2 0 0 25
Bezu et al. 2014 2 2 2 2 1 1 1 2 2 0 1 1 0 2 0 0 19
Debello et al. 2015 2 2 2 2 0 2 2 2 2 1 1 2 2 2 0 0 24
Dibba et al. 2012 2 2 2 2 1 1 1 1 2 1 2 1 0 2 0 0 20
Kassie et al. 2011 2 2 2 2 1 1 2 2 2 2 1 2 2 2 0 0 25
Khonje et al. 2014 2 1 2 2 1 2 2 2 2 2 2 1 2 1 0 0 24
Kikulwe et al. 2012 2 2 1 2 2 0 2 2 2 1 2 1 2 1 0 0 22
Mathenge et al. 2014 2 1 2 2 1 1 2 2 1 2 2 1 0 1 0 0 20
Mendola 2007 2 1 1 1 0 0 2 2 2 1 1 0 2 1 0 0 16
Nguezet et al. 2011 2 1 2 2 1 1 1 2 1 1 1 0 2 0 0 0 17
Rovere et al. 2009 2 1 1 0 1 2 2 1 0 0 2 0 0 0 0 0 12
Shiferaw et al. 2014 2 2 2 2 1 1 2 2 2 2 1 2 2 1 0 0 24
Simtowe et al. 2012 2 1 2 2 1 0 2 2 2 2 2 1 2 1 0 0 22
Smale et al. 2014 2 2 1 2 1 1 2 2 2 2 2 2 0 2 0 0 23
Wiredu et al. 2014 2 1 1 2 0 1 0 2 1 1 1 0 0 0 1 0 13
Wu et al. 2010 2 1 0 2 1 1 1 2 0 1 2 0 2 1 0 0 16
Source: authors’ analysis.
34
Step 3: Meta-analysis results
This section reports the results of the meta-analysis. A final aggregate estimate was computed and indicates a weighted average of all the estimates, with each study weighted according to the variance of the estimate itself. Studies that reported a more precise estimate carry more weight than less precise studies. The precision of the study estimate reflects the sample size. However, it is important to note that the weight does not reflect the validity of the methodology presented in the paper. Therefore, to account for potential bias, a meta-regression is presented in the next section to control for internal and external validity through the bias scores. Owing to the limited number of papers reporting the effects on assets (only two), we excluded this outcome from both the meta-analysis and the meta-regression. Following Waddington et al. (2014), the results exclude papers with dependent effect sizes. Results for all the papers are presented in appendix V.
The meta-analysis results are stratified by region, crop type and overall quality of paper. Results stratified by region are presented immediately below.10
The results of the random-effects meta-analysis are presented in figure 6. The reported coefficients in the effect size (ES) column are the RRs and are interpreted as the percentage change between treatment and control groups. Figure 6 also reports the 95 per cent confidence interval (CI) of the estimate and the individual study weight. The 95 per cent confidence interval of both the subtotal and overall effect size is represented by the diamond. The I-squared statistics are reported, and describe the percentage of variation across studies that is due to heterogeneity. A higher I-squared suggests larger differences in effect sizes between studies. The p-value indicates the probability of not rejecting the null hypothesis that all studies in the meta-analysis are evaluating the same effect (i.e. the absence of heterogeneity of effect sizes between studies). The numbers on the horizontal axis simply delineate the range in which the confidence intervals are contained.
Figure 6 presents the results of the meta-analysis of papers that report poverty outcomes, disaggregated by region. The forest plots indicate that the adoption of improved varieties results in a 4 per cent decrease in poverty. This finding is, however, not significant, possibly owing to both the overall quality of the studies and the smallness of the sample. The studies that determined this result focused exclusively on East and Southern Africa, and Asia and the Pacific.
The effect size for income, by contrast, indicates a significant increase of about 35 per cent for participants compared with a comparison group of farmers, with the largest significant increase in West and Central Africa (50 per cent). The results are not significant for Latin America. The magnitude of the estimate is consistent across regions.
As far as the expenditure outcome is concerned, estimates exhibit a higher degree of variability across regions. The forest plot figure 6(iii) highlights that expenditure increased by 14 per cent on average (with the largest increase in West and Central Africa by 49 per cent). The I-squared statistics are high across the poverty and income outcomes and point towards a high degree of heterogeneity in the impacts of agricultural research across the selected studies.
10. Appendix IV presents the results by crop type and by quality of the paper. Terciles of the total scores were created separately for each outcome to ensure consistency. Based on the critical appraisal, a total score was generated (the sum of the study’s bias score and generalizability score) as indicated in section 4, step 2. Being classified in the higher tercile indicates higher study quality.

35
Figure 6 Forest plots - results disaggregated by region
.
Overall (I−squared = 83.9%, p = 0.000)
Khonje et al. 2014 − Zambia
Mendola 2007 − Nigeria
Subtotal (I−squared = 84.6%, p = 0.000)
Smale et al. 2014 − Zambia
Asia and the Paci�c
Simtowe et al. 2012 − Malawi
East and Southern Africa
Kassie et al. 2011 − Uganda
Mathenge et al. 2014 − Kenya
Asfaw et al. 2012 − Tanzania
Subtotal (I−squared = .%, p = .)
ID
Study
0.85 (0.50, 1.44)
0.97 (0.92, 1.02)
1.00 (1.00, 1.00)
0.83 (0.33, 2.08)
0.90 (0.29, 2.75)
0.94 (0.93, 0.96)
0.78 (0.31, 1.95)
1.03
0.99
99.01
50.04
0.34
0.23
47.02
0.35
0.99
%
Decrease Increase .292 3.42
Poverty, by Region
100.000.96 (0.91, 1.02)
0.55 (0.32, 0.94)
0.55 (0.32, 0.94)
Note: Based on inverse variance weighting/dependent effect sizes removed
WeightES (95% CI)
1
(i) Poverty, by Region
Note: Based on inverse variance weighting/dependent effect sizes removed

36
.
.
.
.
Overall (I−squared = 87.4%, p = 0.000)
Wu et al. 2010 − China
Rovere et al. 2009 − Mexico
Mendola 2007 − Nigeria
West and Central Africa
East and Southern Africa
Wiredu et al. 2014 − GhanaNguezet et al. 2011 − Nigeria
Mathenge et al. 2014 − Kenya
Subtotal (I−squared = 91.4%, p = 0.000)
Kikulwe et al. 2012 − Kenya
Dibba et al. 2012 − Gambia
Kassie et al. 2011 − Uganda
Latin America
Bezu et al. 2014 − Malawi
Subtotal (I−squared = 0.0%, p = 0.972)
Smale et al. 2014 − Zambia
Asia and the Paci�c
Subtotal (I−squared = .%, p = .)
Subtotal (I−squared = 0.0%, p = 0.938)
Khonje et al. 2014 − Zambia
Decrease Increase
.0322 31.1
Income, by Region
Note: Based on inverse variance weighting/dependent effect sizes removed
1.35 (1.19, 1.53)
1.34 (1.16, 1.55)
1.28 (0.99, 1.64)
1.32 (0.96, 1.82)
1.51 (1.13, 2.03)1.46 (0.60, 3.56)
1.07 (1.00, 1.14)
1.33 (1.14, 1.56)
2.38 (0.75, 7.61)
1.01 (0.03, 31.10)
1.47 (1.13, 1.90)1.62 (1.31, 2.00)
1.50 (1.14, 1.98)
1.01 (1.00, 1.01)
1.28 (0.99, 1.64)
1.34 (1.17, 1.53)
2.75 (1.86, 4.07)
100.00
13.11
9.80
7.82
8.531.78
15.25
58.83
1.10
0.13
9.4310.91
10.44
15.85
9.80
20.93
6.28
IDStudy
ES (95% CI) Weight%
1
Note: Based on inverse variance weighting/dependent effect sizes removed
(ii) Income, by Region

37
.
.
Overall (I−squared = 0.0%, p = 0.897)
Subtotal (I−squared = 0.0%, p = 0.994)
Asfaw et al. 2012 (2) − Ethiopia
East and Southern Africa
Debello et al. 2015 − Ethiopia
Adekambi et al. 2009 − Benin
Simtowe et al. 2012 − Malawi
Asfaw et al. 2012 − Tanzania
Khonje et al. 2014 − Zambia
Shiferaw et al. 2014 − Ethiopia
Audu & Aye 2014 − Nigeria
West and Central Africa
Subtotal (I−squared = 0.0%, p = 0.953)
Decrease Increase .112 8.89
Expenditure, by Region
Note: Based on inverse variance weighting/dependent effect sizes removed
1.14 (1.12, 1.16)
1.14 (1.12, 1.16)
1.25 (0.68, 2.28)
1.15 (1.09, 1.20)
1.41 (0.22, 8.89)
1.18 (0.47, 2.96)
1.36 (0.53, 3.53)
1.32 (0.66, 2.63)
1.14 (1.11, 1.16)
1.50 (1.06, 2.12)
1.49 (1.06, 2.10)
100.00
99.66
0.11
17.24
0.01
0.05
0.04
0.08
82.14
0.33
0.34
ID
Study
ES (95% CI) Weight
%
1
Source: authors’ analysis.
Note: Based on inverse variance weighting/dependent effect sizes removed
(iii) Expenditure, by Region

38
Table 7 shows the summarized results of the meta-analysis across welfare outcomes, excluding papers with dependent effect sizes.
Given the high degree of heterogeneity, we conducted a meta-regression, which was particularly relevant for the income outcome. Furthermore, we conduct additional tests to examine the presence of publication bias. It is possible to test for publication bias using a funnel plot. This plot shows the relationship between the standard errors of the RR and the RR for each included study (including published and unpublished studies). The less precise effect sizes will be at the top of the funnel, and the more precise ones will be at the bottom. The contours of the plot highlight the regions of high statistical significance. The asymmetry of the points in the funnel plot can be interpreted as indicating the existence of publication bias. Studies are more likely to be published if they have effect sizes with a high level of statistical significance (low significance level). So in the case of income and expenditure, a funnel plot with all the studies on the right-hand side near the contours could be interpreted as indicating the presence of publication bias. For poverty, we observe similar asymmetry. However, this asymmetry could be caused by other factors, such as small-study effects or other confounding factors. Based on figure 7, this analysis may be subject to publication bias, as the funnels appear to be asymmetrical. Points representing included studies are missing in areas of low statistical significance.11
Table 7 Summary of results
11. In the absence of publication bias, the funnel plot assumes that studies with high precision will be plotted near the average, and studies with low precision will be spread evenly on both sides of the average, creating a roughly funnel-shaped distribution. Deviation from this shape can indicate publication bias. In our case (figure 7(ii), for example), the points in the plot are mainly near the contours of the plot (top right). These are the areas of high statistical significance (low significance level). We do not see many studies in the bottom middle of the plot (area of low statistical significance, high significance level) and on the left side of the plot showing the presence of asymmetry, which means that there could be publication bias. Only two studies are in the middle of the plot and none are on the left out of the 12 studies.
Outcomes Number of studies
Relative effect size (95% CI)
Percentage change compared with the control group
I-squared (%) Tau-squared Quality of evidence
Poverty 7 0.96 (0.91 to 1.02)
4 0.0 0.00 1 H, 2 M and 4 L
Income 12 1.35 (1.19 to 1.53)
35 87.4 0.0262 5 H, 3 M and 4 L
Expenditure 8 1.14 (1.12 to 1.16)
14 0.0 0.00 4 H, 2 M and 2 L
Source: authors’ analysis.
Note: L, low risk of bias studies; M, medium risk of bias studies; H, high risk of bias studies.

39
Figure 7 Funnels by indicator
(i) Poverty
0
.2
.4
.6
−2 −1 0 1 2
Studies
1%
5%
10%
Poverty
Effect estimate
Sta
ndar
d e
rro
r
0
.5
1
1.5
2
−4 −2 0 2 4
Effect estimate
Studies
1%
5%
10%
Income
Sta
ndar
d e
rro
r
(ii) Income

40
We also conducted the Egger test to assess the presence of small-study effects. This test performs a linear regression of the RR estimates on their standard errors, weighting by 1 divided by the variance of the intervention effect estimate. Under the null hypothesis of no small-study effects, the line showing the relationship between the RRs and their standard errors would be vertical on these funnel plots. Figure 8 indicates that the study is subject to small-size effects. The slopes in the figure 8 are statistically significant with high p-values (for poverty, p-value=0.864, for income, p-value=0.467, and for expenditure, p-value=0.292). These tests thus provide evidence for the presence of small-study effects.
Studies
1%
5%
10%
Expenditure0
.2
.4
.6
.8
1
Sta
ndar
d e
rro
r
−2 −1 0 1 2
Effect estimate
Source: authors’ analysis.
−2
02
SN
D o
f ef
fect
est
imat
e
0 .2 .4 .6 .8 1Precision
Study regression line 95% CI for intercept
Poverty
Figure 8 Test for small-study effects by indicator
(iii) Expenditure
(i) Poverty

41
−2
02
SN
D o
f ef
fect
est
imat
e
0 .2 .4 .6 .8 1Precision
Study regression line95% CI for intercept
Income(ii) Income−
20
2S
ND
of
effe
ct e
stim
ate
0 .2 .4 .6 .8 1Precision
Study regression line 95% CI for intercept
Expenditure
Source: authors’ analysis.
(iii) Expenditure

42
Step 4: Meta-regression
In this section, we report the results of the meta-regression. We discuss only the results for the income outcome, given the high degree of heterogeneity found for that outcome. Results on the expenditure and poverty outcomes are also reported in the tables, but they are not significant. This analysis attempts to explain the heterogeneity and examines if there are any systematic differences between the individual study effects and the biases associated with each study. The dependent variables in all the following specifications are the RRs, and a separate regression was run for each reported outcome. The independent variables are the bias and generalizability scores. The higher the bias and generalizability scores, the better the paper meets the internal and external validity criteria, respectively. Table 8 presents the results. They are statistically significant for income but not for expenditure or poverty, suggesting that the variation in the RRs is partly explained by the quality of the paper, particularly for the income outcome. The results indicate that increasing the bias score (the higher the better) reduces the magnitude of the RR for the income outcome. This essentially implies that bias can inflate the estimates and lower bias deflates the effect size. On the other hand, improving the external validity (e.g. through large sample sizes), that is, the generalizability score, positively increases the magnitude of the RR.
Table 8 Study assessment and effect size (excluded dependent effect sizes)
Income Expenditure Poverty
VARIABLES (1) (2) (3) (1) (2) (3) (1) (2) (3)
Bias score –0.01 –0.12*** –0.12*** –0.04 –0.04 –0.04 0.03 0.04 0.05
(0.02) (0.03) (0.03) (0.03) (0.11) (0.11) (0.02) (0.03) (0.04)
Generalizability score 0.10*** 0.11*** –0.00 –0.00 –0.01 –0.01
(0.03) (0.03) (0.08) (0.08) (0.05) (0.05)
Published –0.19 –0.01 –0.09
(0.21) (0.03) (0.52)
Constant 0.44* –0.48 –0.49 0.66* 0.69 0.70 –0.52 –0.37 –0.30
(0.22) (0.32) (0.33) (0.32) (0.67) (0.67) (0.27) (0.73) (1.02)
I-squared (%) 73.16 79.38 74.92 0 0 0 0 0 0
Observations 12 12 12 8 8 8 7 7 7
Source: authors’ analysis.
Notes: *** p<0.01, ** p<0.05, * p<0.1. Standard errors in parentheses. Only studies with t-statistics < 50 are included. Meta-regressions are estimated using logged RR and logged standard errors; exponentiated coefficients reported.
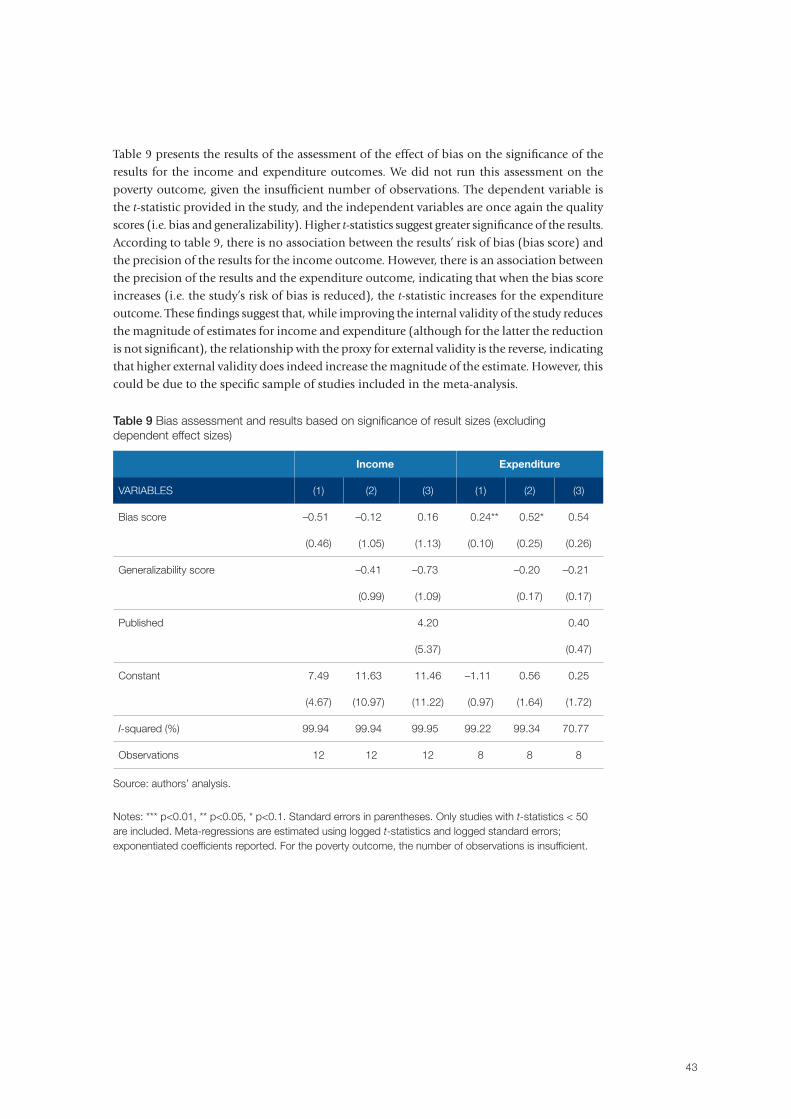
43
Table 9 Bias assessment and results based on significance of result sizes (excluding dependent effect sizes)
Table 9 presents the results of the assessment of the effect of bias on the significance of the results for the income and expenditure outcomes. We did not run this assessment on the poverty outcome, given the insufficient number of observations. The dependent variable is the t-statistic provided in the study, and the independent variables are once again the quality scores (i.e. bias and generalizability). Higher t-statistics suggest greater significance of the results. According to table 9, there is no association between the results’ risk of bias (bias score) and the precision of the results for the income outcome. However, there is an association between the precision of the results and the expenditure outcome, indicating that when the bias score increases (i.e. the study’s risk of bias is reduced), the t-statistic increases for the expenditure outcome. These findings suggest that, while improving the internal validity of the study reduces the magnitude of estimates for income and expenditure (although for the latter the reduction is not significant), the relationship with the proxy for external validity is the reverse, indicating that higher external validity does indeed increase the magnitude of the estimate. However, this could be due to the specific sample of studies included in the meta-analysis.
Income Expenditure
VARIABLES (1) (2) (3) (1) (2) (3)
Bias score –0.51 –0.12 0.16 0.24** 0.52* 0.54
(0.46) (1.05) (1.13) (0.10) (0.25) (0.26)
Generalizability score –0.41 –0.73 –0.20 –0.21
(0.99) (1.09) (0.17) (0.17)
Published 4.20 0.40
(5.37) (0.47)
Constant 7.49 11.63 11.46 –1.11 0.56 0.25
(4.67) (10.97) (11.22) (0.97) (1.64) (1.72)
I-squared (%) 99.94 99.94 99.95 99.22 99.34 70.77
Observations 12 12 12 8 8 8
Source: authors’ analysis.
Notes: *** p<0.01, ** p<0.05, * p<0.1. Standard errors in parentheses. Only studies with t-statistics < 50are included. Meta-regressions are estimated using logged t-statistics and logged standard errors; exponentiated coefficients reported. For the poverty outcome, the number of observations is insufficient.

44
Table 10 presents the results of the bias assessment with regard to effect sizes for the income outcome. Specification (1) includes only regional fixed effects, specification (2) includes regional and crop fixed effects and specification (3) includes all regional, crop and data-type fixed effects. The preferred specification is the second, since it controls for more variation in the estimates. The results are significant across these additional regressions. For the poverty and expenditure outcome, the number of observations is insufficient.
Table 10 Study assessment and effect size for income with additional independent variables (excluded dependent effect sizes)
Income
VARIABLES (1) (2) (3)
Bias score –0.14** –0.15** –0.16
(0.04) (0.05) (0.09)
Generalizability score 0.11 0.12 0.13
(0.04) (0.06) (0.10)
Published –0.58 –0.70 –0.15
(0.62) (0.67) (0.47)
region==East and Southern Africa 0.31 0.14 0.19
(0.30) (0.51) (0.61)
region==West and Central Africa 0.18 0.21 0.25
(0.25) (0.28) (0.45)
croptype==maize 0.15 0.12
(0.31) (0.38)
croptype==other 0.50
(1.00)
datatype==panel 0.07
(0.41)
region==Latin America –0.38 –0.59
(0.68) (0.82)
Constant 0.06 –0.03 –0.71
(0.86) (0.93) (1.30)
I-squared (%) 62.41 66.10 69.56
Observations 12 12 12
Source: authors’ analysis.
Notes: *** p<0.01, ** p<0.05, * p<0.1. Standard errors in parentheses. The Asia and the Pacific region is the reference group for the region dummy variables. The crop type legume is the reference group for the crop type dummy variables. For the poverty and expenditure outcome, the number of observations is insufficient. Only studies with t-statistics < 50 are included.

45
Heterogeneity of impacts within interventions
Going beyond the meta-analysis, we now examine how the welfare impacts of improved varieties may vary across individual interventions and what the key factors are that explain these impact differentials. We have thoroughly reviewed the included studies with regard to these issues and provide a short discussion here.
The results presented in our meta-analysis provide only an indication of the average welfare effects and do not reflect distributional impacts or identify the impact of heterogeneity across the lower quintiles of the income distribution. It is important to note that the introduction of improved varieties may benefit only the transient poor, or those who are relatively close to the poverty threshold. The literature has found that adoption rates of improved varieties are much higher among households with more education, less risk aversion and greater access to information. Thus, the poorest households may not fully benefit from the direct impacts of technologies, and this could lead to greater income inequality. However, we found that several of these studies had performed supplementary analyses to find additional evidence regarding the heterogeneity of improved varieties’ effects. For instance, Bezu et al. (2014) found that the welfare impacts are greater for poorer producing households (households in the lowest asset quartile). Mendola (2007) disaggregated results in a Bangladesh project by farm size. The author showed that gains from agricultural technology are smaller for near-landless people than for small- and medium-scale farmers. Similarly, in both Ethiopia and Tanzania, Asfaw et al. (2012b) found that the impact of improved agricultural technologies on expenditure decreases with farm size in both countries. Becerril and Abdulai (2010) found the same results in their study of improved maize seeds in Mexico, as did Kassie, Shiferaw and Muricho (2011) in their study in Uganda.
We turn, then, to the factors explaining the differential welfare impacts of improved varieties. First, poorer households may be less likely to adopt improved varieties. Ding et al. (2011) estimated the Gini coefficient in a scenario where improved rice seeds had not been introduced and compared it with the actual Gini coefficient, measured in a scenario allowing for the introduction of improved varieties. It was found that income inequality did not increase as anticipated, as the same rate of adoption was observed between farmers at the extremes of the income distribution.
Second, gender differentials across adoption impacts may also be an important factor. Dibba et al. (2012) found that the positive welfare impacts of improved rice seeds were greater for women than men in The Gambia. Evidence for the opposite situation was found in Nigeria, by Nguezet et al. (2011), in relation to the adoption of the same seeds.
Based on the individual studies, we now present qualitative evidence on the possible reasons for differences in the effectiveness of improved seeds interventions.

46
Welfare impacts are most likely to be larger when improved varieties are made available for crops that represent a very large share of farmers’ income source. For example, maize fits this characteristic. According to Mathenge Smale and Olwande (2014), maize represents a very significant share of farmers’ income in Kenya. Maize accounts for 61 per cent of crop income in Zambia (Khonje et al. 2015). An increase in productivity associated with improved maize seeds is therefore likely to generate much larger income increases than would an increase in productivity associated with less prevalent crops such as legumes or groundnuts. Bezu et al. (2014) found that the dependence on maize production was greater for female-headed households than male-headed households and resulted in greater welfare impacts for female-headed households. Furthermore, rice has a very important role in production and consumption in West Africa, South Asia and South-East Asia. The NERICA improved rice seeds initiative has been analysed by numerous papers in relation to different countries (Adekambi et al. 2009, in Benin; Dibba et al. 2011, in The Gambia; Nguezet et al. 2011, in Nigeria; Wiredu et al. 2014, in Ghana). According to Wiredu et al. (2014), production originating from NERICA improved varieties was a hugely important livelihood activity, as it represented 55 per cent of households’ income in the authors’ northern Ghana sample. It is important to stress that such a sizeable impact was estimated on a very small sample of the population, among whom the adoption rate was striking (37 per cent).
Costs incurred by adopting farmers are also an important factor in explaining the differences in the magnitude of impacts. For example, depending on various contextual factors, farmers may have to hire a larger number of workers to process higher production levels. Higher costs may reduce expected impacts, as many analyses do not factor in cost concerns and ignore any potential indirect effect. Nguezet et al. (2011) argue that improved varieties increase the labour requirements for processing crops, inducing households to pay additional costs that can be borne only by larger households. Smaller and poorer households have to employ outside workers, which in turn may reduce income gains.
Several studies highlight the importance of education and experience in explaining the differential in welfare impacts. In Becerril and Abdulai (2010), Kassie et al. (2011) and Asfaw et al. (2012b), results were disaggregated by the level of educational attainment of the household head. They all found that positive impacts were greatest for the middle educational quintiles. Educated and more experienced farmers can take advantage of their knowledge to maximize productivity gains from the improved varieties. The study by Nguezet et al. (2011) also reveals that elderly people generate more income than younger farmers from improved varieties.
Impacts from improved varieties are also highly dependent on access to markets. Increases in agricultural yields resulting from improved varieties will not reduce poverty if production cannot be sold on the market at a low cost.

47
This paper contributes to the literature on the impacts of agricultural research, as it first outlines the multiple pathways that conceptually link the adoption of research-derived technologies to poverty, and then focuses on a systematic and critical review of the empirical evidence relating to the direct impacts (i.e. benefits that accrue to the adopters themselves) of improved varieties. Although there is only a moderate-sized literature on this topic, when taken across crops and countries it warrants the use of the systematic review methodology for the period between 2007 and 2015.
It is well acknowledged that this empirical literature is subject to multiple potential biases that tend to inflate the contribution of agricultural technologies to reducing poverty and improving welfare in general. The major contribution of this paper is thus the systematic treatment of this imperfect literature, coding and classifying each study according to its risk of bias, and examining the correlation between bias scores and the outcomes of each study.
A growing literature has attempted to evaluate the impacts of improved varieties interventions on productivity leading to poverty reduction. In this systematic review,12 we identify the overall aggregate direct impact on welfare across all regions of the world and over several food crops for adopting households compared with non-adopters, through an appraisal of counterfactual evaluative evidence. The statistical synthesis conducted through the meta-analysis has many advantages; in particular, it rigorously produces an aggregate estimate across similar quantitative analyses. The selection protocol and the rigorous standards minimize the risk of purposively selecting studies based on subjective criteria, leading to the exclusion of potential file drawer effects. Furthermore, unlike traditional ways of appraising and synthesizing evidence, such as vote counting, which are not scientific, meta-analysis takes into account considerations related to power, effect size, and the internal and external validity of the estimates provided. Our study further reduces the risk of bias by specifically limiting the selection of studies to micro-level impact evaluations with valid identification strategies and a counterfactual. According to Renkow and Byerlee (2010), a meta-analysis of this kind has not yet been conducted in this area.
6 Conclusion
12. This systematic review did not look at “intervention” studies of CGIAR’s improved varieties. These are projects aimed at encouraging the adoption of improved varieties through standard policy channels (extension, field schools, subsidies, etc.). It is likely that this analysis itself is subject to publication bias and small-study effects.
48
The analysis started by reviewing all possible channels of impacts of improved varieties interventions on poverty and welfare outcomes described in the literature, and distinguished between direct and indirect effects. The systematic review protocol as described in Waddington et al. (2014) was then followed to appraise and quantify the direct aggregate impact of improved varieties. This methodology was divided into four steps: (1) the search for relevant studies, (2) the critical appraisal of the selected studies, (3) the meta-analysis and (4) the meta-regression. A comprehensive search was therefore conducted across several databases covering the period from 2007 to 2015, using a strict search strategy; the ultimate sample analysed included seven papers on poverty, 12 papers on income and eight papers on expenditure in relation to various crops (rice, wheat, maize, bananas, chickpea, pigeon pea and groundnut), and it included unpublished papers. In the critical appraisal, in which criteria related to both internal and external validity were assessed, we found that the reviewed studies suffered from biases relating to programme placement (i.e. selection bias) and other confounding factors, which might indicate that the results were not precisely representative of actual impacts. The findings show that CGIAR-led improved varieties interventions reduced poverty by 4 per cent, increased income by 35 per cent and increased expenditure by 14 per cent in adopting households compared with a valid comparison group. Results for the poverty outcome are, however, not significant, possibly owing to the small number of rigorous studies included in the sample, along with the lack of precision in the studies’ estimates. Results were also stratified by region, crop type and study quality to gain a better understanding of the relationship between the magnitude of the effect size and these moderator variables.
In this regard, the meta-regression analysis, which was performed to examine the determinants of heterogeneity, for example the role of a number of moderator variables such as the study characteristics and confounding factors linked to internal and external validity biases, made an important finding, notably that bias indeed influences the magnitude of the estimates. Specifically, we found that income gains associated with the dissemination of improved seeds are positively correlated with the studies’ risk of bias, indicating that greater internal validity leads to less clear or smaller impacts. In other words, there is a statistically significant relationship between the magnitude of the estimates and some of the moderator variables, precisely those that proxy for internal and external study validity, particularly in relation to the income outcome. A lower risk of bias deflates the magnitude of the effect size, while higher external validity (possibly linked to factors related to generalizability) positively increases the magnitude of the effect size. On the other hand, the precision of the effect size is only positively related to a lower risk of bias for the expenditure outcome (statistically significant). Note that the meta-regression could only be meaningfully performed for the income outcome, given the relatively small number of observations for the poverty outcome and the low degree of heterogeneity found for the expenditure outcome.
These results lead us to some important reflections. The most salient is that a scenario of a 35 per cent increase in income, as found in this meta-analysis, would require the crop in question to dominate crop income for the household, for crop income to dominate household income and for the impact on productivity to be very large, a set of conditions that are unlikely to hold across the crops and countries for these studies, despite the preponderance of maize-focused studies. Therefore, it is the finding that 40 per cent of the studies are at high risk of bias that is remarkable and may call into question the veracity of that figure for the impact on income. However, the added value of the meta-regression precisely qualifies this result, by adjusting, or controlling, for the factors that might “inflate” or “deflate” the magnitudes of the effect sizes, notably the risk of bias. In fact, a unit increase in the risk of bias score (towards less bias) would deflate the estimate for income by 12 per cent.

49
It is therefore possible to conclude that results may not be representative of actual impacts and that, if anything, effect sizes are subject to measurement error and selection bias, noting also the reality that most of the studies included in the review are ex post assessments that use observational data. Although selection or placement bias seems to be carefully taken into account in the papers reviewed, only one third of the studies have panel data, making it possible to account for selection on unobservables (see Wu et al. 2010; Kassie, Shiferaw and Muricho 2011; Kikulwe, Kabunga and Qaim 2012; Bezu et al. 2014; and Mathenge, Smale and Olwande 2014, for instance). This points us to the important conclusion that rigorous ex ante assessments with experimental designs can add value and possibly lead to more robust estimates of impact. Therefore, a larger number of impact assessments with quasi- or fully experimental evaluation designs is needed to fully appraise the magnitude of impacts in a context where selection bias is fully accounted for.
Concerning the poverty reduction finding, even leaving aside the small study sample, results also may be less clear because of the period analysed in some of the included impact evaluations. The studies’ timespans may be too short to fully capture the poverty or welfare impacts of improved varieties or agricultural research in general, given that on average such impacts could take place over 10 years or more (World Development Report 2008). Notably, in this systematic review, 11 of the included papers study the impacts of improved varieties over a period of less than 10 years. For example, the period analysed in Adekambi et al. (2009) extends from 2000 (the year of the introduction of the NERICA rice varieties to Benin) to 2004 (the year of the data collection). Other studies perform an evaluation that covers a much longer period.
In terms of lessons learned, besides the obvious recommendation to increasing the number of rigorous impact assessments using experimental or quasi-experimental designs over longer periods that could truly highlight the significant welfare effects of improved varieties and consequently encourage donors to invest in this area of agricultural research, we recommend the inclusion of qualitative analyses to supplement quantitative results. Such an analysis was rarely included, although it did appear in the studies by Rovere et al. (2009), Kassie, Shiferaw and Muricho (2011), Asfaw et al. (2012a) and Khonje et al. (2015). A systematic review of qualitative studies should also be conducted to bring to light more evidence on the intended and unintended impacts as well as the direct and indirect effects of agricultural research on non-adopters. Another interesting avenue for research would be conducting a systematic review or meta-analysis on the impact of improved varieties on nutrition or soil conditions. Our final recommendation points to the need to conduct an appraisal of the impacts of improved varieties on welfare through indirect channels (those also affecting non-adopters) in different environments. Non-adopters are also affected by improved varieties through increases in agricultural employment opportunities and agricultural wages and reductions in food prices. A systematic review of this kind would complete an assessment of the magnitude of welfare improvements attributable to improved seeds varieties.
Finally, we can derive some policy implications from this study. Barriers to access to improved varieties exist and prevent farmers at the lower end of the income distribution from fully benefiting from the potential of such technologies. Therefore, economic incentives to encourage the use of improved varieties should always accompany CGIAR-led interventions. In the analysis of the determinants of adoption of improved varieties presented by Becerril and Abdulai (2010), Wu et al. (2010), Asfaw et al. (2012b), Mulugeta and Hundie (2012), Kikulwe, Kabunga and Qaim (2012), Audu and Aye (2014), Bezu et al. (2014), Shiferaw et al. (2014), and Khonje et al. (2015), the same structural and contextual constraints emerge and can therefore be summarized in terms

50
of human capital endowments (education and experience of household head); factors related to access to knowledge and information asymmetries (e.g. proximity to the extension offices and to markets, and access to information about the technology in general); financial and physical capital endowments (initial assets, farm size, livestock holdings; off-farm income sources); social capital endowments (group membership); and behavioural aspects such as risk aversion. Given the potentially strong welfare benefits for smallholder farmers, policies should aim to reduce the many constraints that households face in the adoption of improved varieties. The studies included in this analysis also suggest greater investments in the development of local markets and road infrastructures to facilitate diffusion, a problem that lies at the core of the adoption puzzle.
Although the welfare benefits can be significant, adoption rates continue to be low, especially in sub-Saharan Africa. The adoption puzzle has therefore not been fully understood and warrants further research, as recommended by several scholars. Policies interventions need to be specifically targeted towards increasing adoption rates and removing the barriers and constraints that hinder uptake, as highlighted above. Studies included in this analysis suggest that improvements in the scale and efficiency of agricultural extension services and input supply systems, along with additional investments in market and transport infrastructures, might be potential solutions, coupled with economic incentives aimed at encouraging potential adopters to purchase the technology. Therefore, greater efforts should be made to increase the scale and efficiency of agricultural extension services, input supply systems and investments in markets.
Nevertheless, CGIAR should continue to invest in crop genetic improvement and facilitate the diffusion of such technologies.

51
Adato, M. and Meinzen-Dick, R. (eds) (2007) Agricultural Research, Livelihoods, and Poverty: Studies
of Economic and Social Impacts in Six Countries (Baltimore: Johns Hopkins University Press).
Adekambi, S. A., Diagne, A. Simtowe, F. and Biaou, G. (2009) The impact of agricultural technology adoption on poverty: The case of NERICA rice varieties in Benin. International Association of Agricultural Economists’ 2009 Conference, 16–22 August, Beijing, China.
Alene, A. D., Menkir, A., Ajala, S. O., Badu-Apraku, B., Olanrewaju, A. S., Manyong, V. M. and Ndiaye, A. (2009) The economic and poverty impacts of maize research in West and Central Africa. Agricultural Economics 40, pp. 535–550.
Alston, J., Marra, M. C., Pardey, P. G. and Wyatt, T. J. (2000) Research returns redux: A meta-analysis of the returns to agricultural R&D. Australian Journal of Agricultural and Resource
Economics 44(2), pp. 185–215.
Amare, M., Asfaw, S. and Shiferaw, B. (2012) Welfare impacts of maize–pigeonpea intensification in Tanzania. Agricultural Economics 43(1), pp. 27–43.
Anderson, J. R. (1985) Assessing the impact of farming systems research: Framework and problems. Agricultural Administration 20(4), pp. 225–235.
Asfaw, S., Kassie, M., Simtowe, F. and Lipper, L. (2012a) Poverty reduction effects of agricultural technology adoption: A micro-evidence from rural Tanzania. Journal of Development Studies
48(9), pp. 1288–1305.
Asfaw, S., Shiferaw, B., Simtowe, F. and Lipper, L. (2012b) Impact of modern agricultural technologies on smallholder welfare: Evidence from Tanzania and Ethiopia. Food Policy 37(3), pp. 283–295.
Audu, V. I. and Aye, G. C. (2014) The effects of improved maize technology on household welfare in Buruku, Benue State, Nigeria. Cogent Economics and Finance 2(1), pp. 1–10.
Barrett, C. B. and Carter, M. R. (2006) The economics of poverty traps and persistent poverty: An asset-based approach. Journal of Development Studies 42(2), pp. 178–199.
Becerril, J. and Abdulai, A. (2010) The impact of improved maize varieties on poverty in Mexico: A propensity score-matching approach. World Development 38(7), pp. 1024–1035.
Bezu, S., Kassie, G. T., Shiferaw, B. and Ricker-Gilbert, J. (2014) Impact of improved maize adoption on welfare of farm households in Malawi: A panel data analysis. World Development
59, pp. 120–131.
Borenstein, M., Hedges, L. V., Higgins, J. P. T. and Rothstein, H. R. (2009) Introduction to Meta-
Analysis (Chichester, United Kingdom: John Wiley & Sons Ltd).
References

52
Byerlee, D. (1996) Modern varieties, productivity and sustainability. World Development 24(4), pp. 697–718.
Caliendo, M. and Kopeinig, S. (2005) Some Practical Guidance for the Implementation of Propensity Score Matching. Paper 1588, Institute for the Study of Labor (IZA), Bonn, Germany.
CGIAR (Consultative Group on International Agricultural Research) (2010) CGIAR Strategy
and Results Framework 2016–2030: Redefining How CGIAR Does Business until 2030. Accessed March 2016, available at https://library.cgiar.org/bitstream/handle/10947/3865/CGIAR%20Strategy%20and%20Results%20Framework.pdf?sequence=3
CGIAR (Consultative Group on International Agricultural Research) (2013) System-level outcomes, their impact pathways and inter-linkages. ISPC White Paper. Accessed March 2016, available at http://ispc.cgiar.org/sites/default/files/ISPC_WhitePaper_SLOsIPs.pdf
Dercon, S. and Christiaensen, L. (2011) Consumption risk, technology adoption and poverty traps: Evidence from Ethiopia. Journal of Development Economics 96(2), pp. 159–173.
Diagne, A. and Zeller, M. (2001) Access to credit and its impact on welfare in Malawi. Research Report No 116 (Washington, D.C.: International Food Policy Research Institute).
Dibba, L., Fialor, S. C. and Diagne, A. (2012) The impact of NERICA adoption on productivity and poverty of the small-scale rice farmers in the Gambia. Food Security 4(2), pp. 253–265.
Ding, S., Meriluoto, L., Reed, W. R., Tao, D., & Wu, H. (2011) The impact of agricultural technology adoption on income inequality in rural China: Evidence from southern Yunnan Province. China Economic Review, 22(3), pp. 344–356.
Evenson, R. E. and Gollin, D. (2003) Crop Variety Improvement and its Effect on Productivity: The
Impact of International Agricultural Research (Wallingford, United Kingdom: CABI Publishing).
Evenson, R. E. and Rosegrant, M. (2003) The economic consequences of crop genetic improvement programmes, in: R. E. Evenson and D. Gollin (eds), Crop Variety Improvement
and its Effect on Productivity: The Impact of International Research (Wallingford, United Kingdom: CABI Publishing), pp. 473–497.
Fan, S., Fang, Z. and Zhang, X. (2001) How agricultural research affects urban poverty in developing countries: The case of China. (Washington, D.C.: Environment and Production Technology Division, International Food Policy Research Institute).
Fan, S., Hazell, P. and Thorat, S. (2000) Government spending, growth and poverty in rural India. American Journal of Agricultural Economics 82(4), pp. 1038–1051.
Fan, S., Chan-Kang, C., Qian, K. and Krishnaiah, K. (2007) National and international research and rural poverty: The case of rice research in India and China, in: M. Adato and R. Meinzen-Dick (eds), Agricultural Research, Livelihoods, and Poverty: Studies of Economic and Social Impacts
in Six Countries? (Baltimore: Johns Hopkins University Press), pp. 285–305.
Foster, J., Greer, J. and Thorbecke, E. (2010) The Foster-Greer-Thorbecke (FGT) poverty measures: 25 years later. The Journal of Economic Inequality 8(4), pp. 491–524.
Freebairn, D. K. (1995) Did the Green Revolution concentrate incomes? A quantitative study of research reports. World Development 23(2), pp. 265–279.

53
Glass, G. V. (1976) Primary, secondary, and meta-analysis of research. Educational researcher, 5(10), pp. 3–8.
Green, S. and Higgins, J. P. T. (2009) Preparing a Cochrane review, in: J. P. T. Higgins and S. Green (eds), Cochrane Handbook for Systematic Reviews of Interventions Vol. 5 (Chichester: Wiley-Blackwell), pp. 11–30.
Hallman, K., Lewis, D. and Begum, S. (2007) Assessing the impact of vegetable and fishpond technologies on poverty in rural Bangladesh, in: M. Adato and R. Meinzen-Dick (eds), Agricultural
Research, Livelihoods, and Poverty: Studies of Economic and Social Impacts in Six Countries (Baltimore: Johns Hopkins University Press), pp. 103–148.
Hazell, P. and Haddad, L. (2001) Agricultural research and poverty reduction. IFPRI 2020 Discussion Paper (Washington, D.C.: International Food Policy Research Institute).
Hedges, L. V. and Cooper, H. M. (eds). (1994) The Handbook of Research Synthesis (New York: Russell Sage Foundation).
International Initiative for Impact Evaluation (3ie) (2013) Effect size calculation for experimental and quasi-experimental methods. [PowerPoint slides.] Accessed March 2016, available at http://www.3ieimpact.org/media/filer_public/2012/12/24/jorge_garcia_hombrados-hugh_waddignton_3ie_dhaka_colloquium.pdf
Irz, X., Lin, L., Thirtle, C. and Wiggins, S. (2001) Agricultural productivity growth and poverty alleviation. Development Policy Review 19, pp. 449–466.
Jaleta, M., Kassie, M. and Marenya, P. (2015). Impact of improved maize variety adoption on household food security in Ethiopia: An endogenous switching regression approach, in: Paper presented at the International Conference of Agricultural Economists, Milan, Italy (Vol. 29).
de Janvry, A. and Sadoulet, E. (2002) World poverty and the role of agricultural technology: Direct and indirect effects. Journal of Development Studies 38(4), pp. 1–26.
Kassie, M., Shiferaw, B. and Muricho, G. (2011) Agricultural technology, crop income, and poverty alleviation in Uganda. World Development 39(10), pp. 1784–1795.
Kerr, J. M. and Kolavalli, S. (1999) Impact of agricultural research on poverty alleviation: Conceptual framework with illustrations from the literature. EPTD Discussion Paper No 56 (Washington, D.C.: International Food Policy Research Institute).
Kelley, T., Ryan, J. and Gregersen, H. (2008) Enhancing ex post impact assessment of agricultural research: The CGIAR experience. Research Evaluation 17(3), pp. 201–212.
Khonje, M., Manda, J., Alene, A. D. and Kassie, M. (2015) Analysis of adoption and impacts of improved maize varieties in eastern Zambia. World Development 66, pp. 695–706.
Kijima, Y., Sserunkuuma, D. and Otsuka, K. (2006) How revolutionary is the “NERICA revolution”? Evidence from Uganda. Developing Economies 44(2), pp. 232–251.
Kikulwe, E. M., Kabunga, N. and Qaim, M. (2012) Impact of tissue culture banana technology in Kenya: A difference-in-difference estimation approach. Discussion Paper No 117 (Göttingen, Germany: Courant Research Centre: Poverty, Equity and Growth, University of Göttingen).
Koundouri, P., Nauges, C. and Tzouvelekas, V. (2006) Technology adoption under production uncertainty: Theory and application to irrigation technology. American Journal of Agricultural
Economics 88, pp. 657–670.

54
Maredia, M. K. and Raitzer, D. A. (2006) CGIAR and NARS partner research in sub-Saharan Africa: Evidence of impact to date (Rome: CGIAR Science Council Secretariat, Food and Agriculture Organization of the United Nations).
Mathenge, M. K., Smale, M. and Olwande, J. (2014) The impacts of hybrid maize seed on the welfare of farming households in Kenya. Food Policy 44, pp. 262–271.
Mendola, M. (2007) Agricultural technology adoption and poverty reduction: A propensity-score matching analysis for rural Bangladesh. Food Policy 32(3), pp. 372–393.
Mulugeta, T. and Hundie, B. (2012) Impacts of adoption of improved wheat technologies on households’ food consumption in South Eastern Ethiopia. Selected poster prepared for presentation at the International Association of Agricultural Economists Triennial Conference, Foz do Iguacu, Brazil. Accessed March 2016, available at http://ageconsearch.umn.edu/bitstream/126766/2/Mulugeta.pdf
Nelson, M. and Maredia, M. (1999) Environmental impacts of the CGIAR: An initial assessment. (Washington D.C.: CGIAR Technical Advisory Committee Secretariat, Food and Agriculture Organization of the United Nations).
Nguezet, P. M. D., Diagne, A., Okoruwa, V. O. and Ojehomon, V. (2011) Impact of improved rice technology (NERICA varieties) on income and poverty among rice farming households in Nigeria: A local average treatment effect (LATE) approach. Quarterly Journal of International
Agriculture 50(3), pp. 267–92.
Raitzer, D. A. and Kelley, T. G. (2008) Benefit-cost meta-analysis of investment in the international agricultural research centers of the CGIAR. Agricultural Systems 96(1–3), pp. 108–123.
Renkow M. and Byerlee, D. (2010) The impacts of CGIAR research: A review of recent evidence. Food Policy 35, pp. 391–402.
Rovere, L. R., Sudarshan, M., Mercado, J., Aquino, P. and Kamala, G. (2009) Assessing impacts of maize research through a livelihoods lens: findings and lessons from the hill regions of Mexico and Nepal. Impact Assessment and Project Appraisal 27(3), pp. 233–245.
Ruttan, V. (1977) The Green Revolution: Seven generalizations. International Development
Review 19(4), pp. 16–23.
Shiferaw, B., Kassie, M., Jaleta, M. and Yirga, C. (2014) Adoption of improved wheat varieties and impacts on household food security in Ethiopia. Food Policy 44, pp. 272–284.
Simtowe, F., Kassie, M., Asfaw, S., Shiferaw, B., Monyo, E. and Siambi, M. (2012) Welfare effects of agricultural technology adoption: The case of improved groundnut varieties in rural Malawi. Selected paper prepared for presentation at the International Association of Agricultural Economists Triennial Conference, Foz do Iguaçu, Brazil. Accessed March 2016, available at http://ageconsearch.umn.edu/bitstream/126761/2/Simtowe2.pdf
Smale, M. and Mason, N. (2014) Hybrid seed and the economic well-being of smallholder maize farmers in Zambia. Journal of Development Studies 50(5), pp. 680–695.
Stewart, R., Langer, L., Rebelo Da Silva N., Muchiri, E., Zaranyika, H., Erasmus, Y., Randall, N., Rafferty, S., Korth, M., Madinga, N. and de Wet, T. (2015) The Effects of Training, Innovation and
New Technology on African Smallholder Farmers’ Economic Outcomes and Food Security: A Systematic
Review. 3ie Grantee Final Review (London: International Initiative for Impact Evaluation [3ie]).

55
Thirtle, C., Lin, L. and Piesse, J. (2003) The impact of research-led agricultural productivity growth on poverty reduction in Africa, Asia and Latin America. World Development 31(12), pp. 1959–1975.
Waddington, H., Snilstveit, B., Hombrados, J. G., Vojtkova, M., Anderson, J. and White, H. (2014) Farmer Field Schools for Improving Farming Practices and Farmer Outcomes in Low- and
Middle-income Countries: A Systematic Review (London: International Initiative for Impact Evaluation [3ie]).
Winters, P., de Janvry, A., Sadoulet, E. and Stamoulis, K. (1998) The role of agriculture in economic development: Visible and invisible surplus transfers. Journal of Development Studies 35(5), pp. 71–97.
Wiredu, A. N., Asante, B. O., Diagne, A. and Dogbe, W. (2014) Impact of NERICA adoption on incomes of rice-producing households in Northern Ghana. Journal of Sustainable Development
7(1), pp. 167–178.
World Bank. (2008) World Development Report (2008): Agriculture for Development (Washington, D.C.: World Bank).
Wu, H., Ding, S., Pandey, S. and Tao, D. (2010) Assessing the impact of agricultural technology adoption on farmers’ well-being using propensity-score matching analysis in rural China. Asian
Economic Journal 24(2), pp. 141–160.

56
Appendix I: Search strategy
The search strategy follows the methodology indicated by Waddington et al. (2014) and Stewart et al. (2015). Two analysts performed the search independently. A third analyst repeated it at a later date to ensure that all relevant studies were included.
• For participants: farm, smallholder, agricultural producer, subsistence, small scale, the poor, rural.
• For intervention: improved varieties, agricultural research, agricultural innovation, agricultural technology.
• For comparison: impact, evaluation, effect, comparison study, quasi-experiment.
• For outcome: poverty, income, asset, profit, wealth, welfare, well-being, livelihood.
• For study design: experimental design, randomized control trials, quasi-experimental design, propensity score matching, IV approaches, endogenous switching regression models (ESRMs), differences in differences, RDD.
Each search term from the “intervention” category was input into the database search and was combined with a search term of one or more categories (“participants”, “comparison”, “outcome” and “study design”). In this way, the search strings captured all possible search terms from each category. The search strategy was adapted to each database. In each individual combination of search terms, the titles of the papers were explored from the first 20 pages of results ordered by relevance (which is equivalent to 500 titles per search in ScienceDirect and 200 titles per search in Google Scholar). In the search of CGIAR SPIA publications, the abstracts of the studies resulting from the search also appeared with the title, enabling the analysts undertaking the search to review both the title and the abstracts. In the other databases, the abstracts were not immediately visible in the search results. When the title of a study did not clearly identify the area of research, the analysts reviewed the abstract of the study. We present here the strategy used for ScienceDirect, as it was the largest database used for this systematic review:
1. “improved varieties” OR “agricultural research” OR “agricultural innovation” OR “agricultural technology”.
2. “improved varieties” OR “agricultural research” OR “agricultural innovation” OR “agricultural technology” AND “farm” OR “smallholder” OR “agricultural producer” OR “subsistence” OR “small scale” OR “the poor” OR “rural”.
3. 2 repeated.
4. 2 repeated.

57
5. “improved varieties” OR “agricultural research” OR “agricultural innovation” OR “agricultural technology” AND “farm” OR “smallholder” OR “agricultural producer” OR “subsistence” OR “small scale” OR “the poor” OR “rural” AND “impact” OR “evaluation” OR “effect” OR “comparison study” OR “quasi-experiment”.
6. 5 repeated.
7. 5 repeated.
8. 5 repeated.
9. 5 Repeated.
10. “improved varieties” OR “agricultural research” OR “agricultural innovation” OR “agricultural technology” AND “farm” OR “smallholder” OR “agricultural producer” OR “subsistence” OR “small scale” OR “the poor” OR “rural” AND “impact” OR “evaluation” OR “effect” OR “comparison study” OR “quasi-experiment” AND “poverty” OR “income” OR “asset” OR “profit” OR “wealth” OR “welfare” OR “wellbeing” OR “livelihood”.
11. 10 repeated.
12. 10 repeated.
13. 10 repeated.
14. 10 repeated.
15. 10 repeated.
The bibliographies of included studies and of existing systematic reviews on related topics were also screened for completeness. Finally, key researchers from the eligible studies and colleagues working on impact evaluation initiatives were contacted for additional published and unpublished studies and to verify missing information.

58
Appendix II: Bias assessment framework
Table A1 Bias assessment questions
Bias
ID Question Code
Free of attrition Was the paper free of attrition? Yes = 2 Unclear = 1 No = 0
Selection bias Did the paper control for selection bias? Yes = 2 Unclear = 1 No = 0
Confounding Was the paper able to control for confounding? Yes = 2 Unclear = 1 No = 0
Free of Hawthorne Was the study free of Hawthorne/motivation bias? Yes = 2 Unclear = 1 No = 0
Free of spillover Spillovers: was the study adequately protected against performance bias?
Yes = 2 Unclear = 1 No = 0
Free of selective reporting Selective reporting: was the study free from outcome and analysis reporting biases (selection of outcomes)?
Yes = 2 Unclear = 1 No = 0
Free of other bias Other: was the study free of other sources of bias? (bias through self-reporting; concerns about coherence of results, for example between descriptive statistics and outcome questions; data on the baseline collected retrospectively; information collected using an inappropriate instrument).
Yes = 2 Unclear = 1 No = 0
Method judgement Particular methodology (yes – good; no – bad)
PSM: 10 per cent fail to be matched, sensitivity analysis present
IV: Hausman test for exogeneity p < 0.05, p < 0.05, rho (p < 0.05).
Yes = 2 Unclear = 1 No = 0
Sample size large Is the sample size large enough? Are the effects large but with low precision? (Yes if the sample size is large enough.)
Yes = 2 Unclear = 1 No = 0
Unit of analysis error Unit of analysis error: the analysis is carried out at the relevant unit of treatment level (or errors are clustered). Yes – good.
Yes = 2 Unclear = 1 No = 0
Unit of analysis error comments
Unit of analysis error: the analysis is carried out at the relevant unit of treatment level (or errors are clustered). Yes – good.
Comments

59
Generalizability
ID Question Code
Research aim Is the research aim clearly stated? Yes = 2 Unclear = 1 No = 0
Context Is there a description of the context? Yes = 2 Unclear = 1 No = 0
Sampling Description of sampling procedures – how were participants selected and were they the most appropriate procedures?
Yes = 2 Unclear = 1 No = 0
Sampling description Please describe sampling procedures. Free answer
Sampling characteristics Are sample characteristics sufficiently reported (sample size, location and at least one additional characteristic)?
Yes = 2 Unclear = 1 No = 0
Data collection Is it clear how the data were collected; for example, for interviews, is there an indication of how interviews were conducted?
Yes = 2 Unclear = 1 No = 0
Data collection description Please describe data collection methods. Free answer
Data recording Are the methods of recording data reported? Yes = 2 Unclear = 1 No = 0
Data recording description Please describe methods of recording data. Free answer
Analysis Are the methods of analysis explicitly stated? Yes = 2 Unclear = 1 No = 0
Analysis description Please describe methods of analysis. Free answer
Link to relevant literature/theory
Is there a clear link to relevant literature/theoretical framework?
Yes = 2 Unclear = 1 No = 0
Appropriate methodology Is the design appropriate to answer the research question? Has the researcher justified the research design?
Yes = 2 Unclear = 1 No = 0
Methodology comment If the answer to previous question is no or partially, justify. Free answer
Appropriate sampling Was the sampling strategy appropriate to the aims of the research? Have the researchers explained how the participants were selected? Have the researchers explained why the participants they selected were the most appropriate to provide access to the type of knowledge sought by the study? Have the researchers discussed issues around recruitment (e.g. why some people chose not to take part)?
Yes = 2 Unclear = 1 No = 0
Sampling comment If the answer to previous question is no or partially, justify. Free answer
Appropriate methods of data collection
Were the data collected in a way that addressed the research issue? Were the methods used appropriate and justified? Did the researcher discuss saturation of data?
Yes = 2 Unclear = 1 No = 0
Data collection comment If the answer to previous question is no or partially, justify. Free answer

60
Appropriate analysis Was the data analysis sufficiently rigorous? Is there a detailed description of the analysis process? Do the data support the findings? Is the relationship between the researcher and the participants adequately considered? To what extent are contradictory data taken into account? If the findings are based on quantitative analysis of survey data, are multivariate techniques used to control for potential confounding variables?
Yes = 2 Unclear = 1 No = 0
Analysis comment If the answer to previous question is no, partially or unclear, justify.
Free answer
Triangulation Has triangulation been applied?
Data triangulation (location, time and participants)
Investigator triangulation
Theory triangulation (several theories)
Methodological triangulation
Yes = 2 Unclear = 1 No = 0
Triangulation description Describe the triangulation methods employed. Free answer
Clarity of analysis and conclusions
Are the analysis and conclusions clearly presented? Have the researchers discussed the credibility of their findings (e.g. triangulation, respondent validation, more than one analyst)? Is there adequate discussion of the evidence both for and against the researcher’s arguments? Are the findings explicit? Are the findings discussed in relation to the original research question?
Yes = 2 Unclear = 1 No = 0
Conclusions comment If the answer to previous question is no or partially, justify. Free answer
Conflict of interest considered and addressed
Was the potential for conflict of interest considered and addressed?
Yes = 2 Unclear = 1 No = 0
Ethical considerations Does the paper discuss ethical considerations related to the research?
Yes = 2 Unclear = 1 No = 0
Comments/justification Comments/justification about overall reporting and methodology.
Free answer
Source: Waddington et al. (2014).
Notes: The question “Free of attrition” is relevant only for panel data studies and was not considered in the calculation of the final bias scores for each study.
Papers were assigned a score of 0, 1 or 2 for each of the criteria for both the risk of bias and the generalizability criteria. The final (bias or generalizability) score was obtained by summing the individual scores (between 0 and 2) across the criteria.
ID Question Code

61
Appendix III: References to excluded studies
Table A2 List of excluded studies
Excluded studies Source Search terms Reasons for exclusion
Kathage, J., Qaim, M., Kassie, M. and Shiferaw, B. A. (2012) Seed market liberalization, hybrid maize adoption, and impacts on smallholder farmers in Tanzania. Global Food Discussion PapersNo. 12. Accessed March 2016, available at http://ageconsearch.umn.edu/handle/131756.
Google Scholar
Impact of improved varieties on small farmers’ welfare
Study design: this study uses an ordinary least squares (OLS) model.
Wambugu, F. M., Njuguna, M. M., Acharya, S. S. and Mackey, M. A. (2008) Socio-economic impact of tissue culture banana (Musa spp.) in Kenya through the whole value chain approach. Acta Horticulturae 879,pp. 77–86.
Google Scholar
Impact of improved varieties on small farmers’ welfare
Improved seeds intervention was not led by a CGIAR institute.
Krishna, V. V. and Qaim, M. (2007) Estimating the adoption of Bt eggplant in India: who benefits from public–private partnership? Food Policy 32(5),pp. 523–543.
ScienceDirect Impact of improved varieties on small farmers’ welfare
This study estimates farmers’ willingness to pay for exposure to improved varieties.
Minten, B. and Barrett, C. B. (2008) Agricultural technology, productivity, and poverty in Madagascar. World Development 36(5), pp. 797–822.
ScienceDirect Impact of improved varieties on small farmers’ welfare
Different outcomes: food security.
Shiferaw, B. A., Kebede, T. A. and You, L. (2008) Technology adoption under seed access constraints and the economic impacts of improved pigeonpea varieties in Tanzania. Agricultural Economics 39(3),pp. 309–323.
Google Scholar
Impact of agricultural research on smallholder income
Improved seed access was analysed using the extended economic surplus method (DREAM model).

62
Asfaw, S. (2010) Estimating welfare effect of modern agricultural technologies: A micro-perspective from Tanzania and Ethiopia (Nairobi: International Crops Research Institute for the Semi-Arid Tropics [ICRISAT]). Accessed March 2016, available at http://www.chronicpoverty.org/uploads/publication_files/asfaw_agricultural_technologies.pdf.
Google Scholar
Impact of agricultural technology on smallholder welfare
This study is simply an earlier version of Asfaw et al. (2012b), which is included in the meta-analysis. This paper is not included in the meta-analysis because it most likely has estimates with more bias than Asfaw et al. (2012b). This paper uses PSM to estimate the impact of improved varieties, whereas Asfaw et al. (2012b) uses an ESRM.
Asfaw, S. and Shiferaw, B. (2010) Agricultural technology adoption and rural poverty: Application of an endogenous switching regression for selected East African countries. Poster presented at the Joint Third African Association of Agricultural Economists. Accessed March 2016, available at http://ageconsearch.umn.edu/bitstream/97049/2/77.%20Technology%20adoption%20and%20poverty%20in%20East%20Africa.pdf.
Google Scholar
Impact of agricultural technology on smallholder welfare
This study is simply an earlier version of Asfaw et al. (2012b), which is included in the meta-analysis. This paper is not included in the meta-analysis because it most likely has estimates with more bias than Asfaw et al. (2012b). This paper uses PSM to estimate the impact of improved varieties whereas Asfaw et al. (2012b) uses an ESRM.
Smale, M. (2007) Assessing the impact of technical innovations in African agriculture, in: M. Smale and W. K. Tushemereirwe (eds), An Economic Assessment of Banana Genetic Improvement and Innovation in the Lake Victoria Region of Uganda and Tanzania. Research Report No 155 (Washington, D.C.: International Food Policy Research Institute).
Google Scholar
Impact of agricultural technology on smallholder welfare
This study focuses on the adoption of improved varieties.
Kassie, M., Jaleta, M. and Mattei, A. (2014) Evaluating the impact of improved maize varieties on food security in rural Tanzania: Evidence from a continuous treatment approach. Food Security 6(2), pp. 217–230.
Google Scholar
Impact of improved varieties on smallholder welfare
This study examines the impacts of improved varieties on food security.
Joshua Udoh, E. and Titus Omonona, B. (2008) Improved rice variety adoption and its welfare impact on rural farming households in Akwa Ibom State of Nigeria. Journal of New Seeds 9(2), pp. 156–173.
Google Scholar
Impact of improved varieties on smallholder welfare
Study design: it uses a Tobit regression model.
Excluded studies Source Search terms Reasons for exclusion

63
Macharia, I., Orr, A., Simtowe, F. and Asfaw, S. (2012) Potential economic and poverty impact of improved chickpea technologies in Ethiopia. Paper presented at the IAAE Triennial Conference, 18–24 August 2012, Rafain Convention Center, Foz do Iguaçu, Brazil. Accessed March 2016, available at http://oar.icrisat.org/6121/1/IAAE_18-24_2012_Triennial_conf_Brazil.pdf.
Google Scholar
Impact of improved varieties on smallholder welfare
Improved seed access was analysed using the extended economic surplus method (DREAM model).
Chisi, M. (2007) Impact assessment of sorghum research in Zambia, in: P. Anandajayasekeram, M. Rukuni, S. Babu, F. Liebenberg and C. L., Keswani (eds), Impact of Science on African Agriculture and Food Security, CABI.
Google Scholar
Impact of improved varieties on smallholder welfare
This study examines the rate of return of sorghum research.
Carter, M. R. Laajaj, R., and Yang, D. (2013) The impact of voucher coupons on the uptake of fertiliser and improved seeds: evidence from a randomised trial in Mozambique. American Journal of Agricultural Economics 95(5), 1345-1351.
3ie Agricultural research Study design: This study calculates average intention to treat effects.
Kumar, N. and Quisumbing, A. R. (2011) Access, adoption, and diffusion: understanding the long-term impacts of improved vegetable and fish technologies in Bangladesh. Journal of Development Effectiveness 3(2), pp. 193-219.
3ie Agricultural technology
This study does not evaluate the effect of solely improved varieties.
Douthwaite, B., Schulz, S., Olanrewaju, A. S. and Ellis-Jones, J. (2007) Impact pathway evaluation of an integrated Striga hermonthica control project in Northern Nigeria. Agricultural Systems 92(1), pp. 201-222.
ScienceDirect Impact of improved varieties on farmer poverty
This study evaluates the effects of improved varieties on different outcomes.
Afidchao, M. M., Musters, C. J. M., Wossink, A., Balderama, O. F. and de Snoo, G. R. (2014) Analyzing the farm level economic impact of GM corn in the Philippines. NJAS-Wageningen Journal of Life Sciences 70, pp. 113-121.
ScienceDirect Impact of improved varieties on smallholder welfare
This study examines the rate of return of research.
Qaim, M. (2010) Benefits of genetically modified crops for the poor: household income, nutrition, and health. New Biotechnology 27(5), pp. 552-557.
ScienceDirect Impact of improved varieties on smallholder welfare
This paper focuses on improved cotton seeds.
Pauw, K. and Thurlow, J. (2011) Agricultural growth, poverty, and nutrition in Tanzania. Food Policy 36(6), 795-804.
ScienceDirect Impact of agricultural research on smallholder welfare
Study design: it uses a general equilibrium model.
Benin, S., Nkonya, E., Okecho, G., Pender, J., Nahdy, S. and Mugarura, S. (2007) Assessing the impact of the National Agricultural Advisory Services (NAADS) in the Uganda rural livelihoods. International Food Policy Research Institute (IFPRI).
Stewart et al. 2015
In the reference section
This study does not evaluate the effect of solely improved varieties.
Matuschke, I., Mishra, R. R. and Qaim, M. (2007) Adoption and impact of hybrid wheat in India. World Development 35(8), pp. 1422-1435.
Stewart et al. 2015
In the reference section
The study estimates the willingness to pay off farmers for exposure to improved varieties.
Excluded studies Source Search terms Reasons for exclusion

64
Smale, M., Mathenge, M. K., Jayne, T. S., Magalhaes, E. C., Olwande, J., Kirimi, L. and Githuku, J. (2012) Income and Poverty Impacts of USAID-Funded Programs to Promote Maize, Horticulture, and Dairy Enterprises in Kenya, 2004-2010 (No. 121864). Michigan State University, Department of Agricultural, Food, and Resource Economics. Accessed March 2016, available at http://ageconsearch.umn.edu/bitstream/121864/2/idwp122.pdf.
Stewart et al. 2015
In the reference section
This study does not evaluate the effect of solely improved varieties.
Singh, B. B. and Ajeigbe, H. (2007) Improved cowpea-cereals-based cropping systems for household food security and poverty reduction in West Africa. Journal of Crop Improvement 19(1-2), pp. 157-172.
Stewart et al. 2015
In the reference section
This study evaluates the effect of improved varieties on different outcomes.
Moyo, S., Norton, G. W., Alwang, J., Rhinehart, I. and Deom, C. M. (2007) Peanut research and poverty reduction: Impacts of variety improvement to control peanut viruses in Uganda. American Journal of Agricultural Economics 89(2), pp. 448–460.
Nguezet et al. 2011
In the reference section
Study design: this paper predicts the impact of improved varieties before the project took place based on economic surplus analysis.
Diagne, A., Dontsop-Nguezet, P. M., Kinkingninhoun-Medgabé, F. M., Alia, D., Adégbola, P. Y., Coulibaly, M., Diawara, S., Dibba, L., Mahamood, N., Mendy, M. and Ojehomon, V. T. (2012) The impact of adoption of NERICA rice varieties in West Africa. SPIA Pre-conference workshop (Vol. 28). Accessed March 2016, available at https://www.researchgate.net/publication/280943528_The_impact_of_adoption_of_NERICA_rice_varieties_in_West_Africa.
ScienceDirect Impact of agricultural research on smallholder welfare
This evaluation was performed over seven countries. Other evaluations included in the meta-analysis assess the impacts of improved varieties in countries mentioned in this excluded study.
Afidchao, M. M., Musters, C. J. M., Wossink, A., Balderama, O. F. and de Snoo, G. R. (2014) Analysing the farm level economic impact of GM corn in the Philippines. NJAS-Wageningen Journal of Life Sciences 70, pp. 113–121.
ScienceDirect Impact of agricultural technology on smallholder welfare
This study examines the rate of return of research.
Qaim, M. (2010) Benefits of genetically modified crops for the poor: Household income, nutrition, and health. New Biotechnology 27(5), pp. 552–557.
ScienceDirect Impact of agricultural technology on smallholder welfare
This paper focuses on improved cotton seeds.
Excluded studies Source Search terms Reasons for exclusion

65
Adato, M. and Meinzen-Dick, R. (2007) Agricultural Research, Livelihoods, and Poverty: Studies of Economic and Social Impacts in Six Countries (Baltimore: Johns Hopkins University Press).
ScienceDirect Effect of agricultural research on poverty
This document contains six impact evaluations:(1) Adato et al: study design – this is not a quasi-experimental analysis.(2) Hossain et al.: study design – the authors conduct an intention-to-treat analysis.(3) Hallman et al.: this evaluation does not focus on improved varieties.(4) Bourdillon et al.: this study looks at the impact of improved varieties on child nutrition outcomes.(5) Bellon et al.: study design – this is not a quasi-experimental analysis.(6) Fan et al.: this study calculates poverty elasticity R&D, which are then applied to calculate the number of people moved out of poverty.
Awotide, B. A., Wiredu, A. N., Diagne, A. and Ojehomon, V. E. (2012) Wealth status and improved rice varieties adoption among smallholder farmers in Nigeria. OIDA International Journal of Sustainable Development 5(9), pp. 11–27.
Google Scholar
Intervention of improved varieties on smallholder welfare
This study evaluates the effects of improved varieties on different outcomes.
Awotide, B. A., Alene, A. D., Abdoulaye, T. and Manyong, V. M. (2015). Impact of agricultural technology adoption on asset ownership: The case of improved cassava varieties in Nigeria. Food Security 7(6), pp. 1239–1258.
Google Scholar
Intervention of improved varieties on smallholder welfare
This study evaluates the effects of improved varieties on different outcomes.
Mason, N. and Smale, M. (2013) Impacts of subsidised hybrid seed on indicators of economic well‐being among smallholder maize growers in Zambia. Agricultural Economics 44(6), pp. 659–670.
Google Scholar
Intervention of improved varieties on smallholder welfare
This paper estimates the impact of improved varieties on poverty gap.
Excluded studies Source Search terms Reasons for exclusion

66
Smale, M. and Mason, N. M. (2013) Hybrid seed, income, and inequality among smallholder maize farmers in Zambia. Accessed March 2016, available at http://ageconsearch.umn.edu/bitstream/146929/2/wp72.pdf.
Google Scholar
Randomized controlled trial of improved varieties on smallholder welfare
This is the same paper as another paper included in this analysis: Smale, M. and Mason, N., 2014. Hybrid seed and the economic well-being of smallholder maize farmers in Zambia. Journal of Development Studies 50.5, 680-695. Only the p-values are provided (and not the t-statistics and the standard errors).
Hamazakaza, P., Smale, M. and Kasalu, H. (2013) The impact of hybrid maize on smallholder livelihoods in Zambia: Findings of a household survey in Katete, Mkushi, and Sinazongwe Districts. Accessed March 2016, available at http://ageconsearch.umn.edu/bitstream/148808/2/wp73.pdf.
Google Scholar
Impact of hybrid seeds on farmer welfare
This study assesses the impact of improved maize seeds as Smale et al. (2014), which was included in the analysis. However, this paper does not use panel data and the data sample is smaller than that in Smale et al. (2014).
Omilola, B. (2009) Estimating the impact of agricultural technology on poverty reduction in rural Nigeria. IFPRI Discussion Paper No 901. (Washington, D.C.: International Food Policy Research Institute).
3ie Agricultural producer The impact of improved varieties is not analysed.
Obisesan, A. A., Omonona, B. T., Yusuf, S. A. and Oni, O. A. (2012) Technology adoption and poverty alleviation among cassava-based farming households in Southwest, Nigeria: Case of RTEP production technology. World Rural Observation 4(4), pp. 76–81.
Google Scholar
Impact of hybrid seeds on farmer welfare
The t-statistics or standard errors of the expenditure estimates are not displayed in the results table. The authors of this study were contacted to obtain this information, but they did not respond.
Excluded studies Source Search terms Reasons for exclusion

67
Kabunga, N. S., Dubois, T. and Qaim, M. (2014) Impact of tissue culture banana technology on farm household income and food security in Kenya. Food Policy 45, pp. 25-34.
Google Scholar
Impact of hybrid seeds on farmer welfare
This paper evaluates the impact of tissue culture banana technology on farm household income in Kenya over the period from 2003 to 2009. The project, outcome and period are identical to Kikulwe et al. (2012), which was included in the analysis. This paper is not included in the meta-analysis because it most likely has estimates with more bias than Kikulwe et al. (2012). This paper uses only cross-sectional data and OLS, whereas Kikulwe et al. (2012) has panel data and uses a DID model.
Zeng, D., Alwang, J., Norton, G. W., Shiferaw, B., Jaleta, M. and Yirga, C. (2015) Ex post impacts of improved maize varieties on poverty in rural Ethiopia. Agricultural Economics 46(4), pp. 515–526.
Google Scholar
Impact of hybrid seeds on farmer welfare
The t-statistics or standard errors of the poverty reduction estimates are not displayed in the results table. The authors of this study were contacted to obtain this information, but they did not respond.
Cunguara, B. and Darnhofer, I. (2011) Assessing the impact of improved agricultural technologies on household income in rural Mozambique. Food Policy 36(3), pp. 378–390.
Google Scholar
Impact of agricultural research on smallholder income
The t-statistics or standard errors of the poverty reduction estimates are not displayed in the results table. The authors of this study were contacted to obtain this information, but they did not respond.
Excluded studies Source Search terms Reasons for exclusion

68
Nguezet, P. D., Diagne, A., Okoruwa, V. O. and Ojehomon, V. (2011) Impact of improved rice technology (NERICA varieties) on income and poverty among rice farming households in Nigeria: A local average treatment effect (LATE) approach. Quarterly Journal of International Agriculture 50(3), pp. 267–292.
Google Scholar
Impact of agricultural research on smallholder income
The t-statistics or standard errors of the per capita expenditure estimates are not displayed in the results table. The authors of this study were contacted to obtain this information, but they did not respond.
Ding, S., Meriluoto, L., Reed, W. R, Tao, D. and Wu, H. (2011) The impact of agricultural technology adoption on income inequality in rural China: Evidence from southern Yunnan Province. China Economic Review 22(3), pp. 344–356.
Google Scholar
Impact of agricultural research on smallholder income
Only z-scores are provided. Insufficient data are available to derive the standard errors or the t-statistics. We tried to contact the authors, but we were not able to reach them using the contact information in the paper.
De Groote, H., Gitonga, Z., Mugo, S. and Walker, T. S. (2015) Assessing the effectiveness of maize and wheat improvement from the perspectives of varietal output and adoption in East and Southern Africa, in: T. S. Walker and J. Alwang (eds), Crop Improvement: Adoption and Impact of Improved Varieties in Food Crops in Sub-Saharan Africa (Wallingford, United Kingdom: CABI Publishing), pp. 206–227.
Google Scholar
Impact of improved varieties on welfare
This study evaluates the effects of improved varieties on different outcomes.
Afolami, C. A., Obayelu, A. E. and Vaughan, I. I. (2015) Welfare impact of adoption of improved cassava varieties by rural households in South Western Nigeria. Agricultural and Food Economics 3(1), pp. 1–17.
Google Scholar
Impact of improved varieties on welfare
The t-statistics or standard errors of the estimates are not displayed in the results table.
Ghimire, R. and Huang, W. C. (2015) Household wealth and adoption of improved maize varieties in Nepal: A double-hurdle approach. Food Security 7(6), pp. 1321–1335.
Google Scholar
Impact of improved varieties on livelihood
The study design is not experimental or quasi-experimental. This study uses a double-hurdle model but does not employ an IV approach.
Kleinwechter, U., Hareau, G., Bonierbale, M., Gastelo, M. and Harahagazwe, D. (2015) Ex-ante evaluation of improved potato varieties for sub-Saharan Africa, in: Low et al (eds), Potato and Sweetpotato in Africa: Transforming the Value Chains for Food and Nutrition Security (Wallingford, United Kingdom: CABI Publishing), pp. 110-123.
Google Scholar
Evaluation of improved varieties
Study design: it uses a partial equilibrium model.
Excluded studies Source Search terms Reasons for exclusion

69
Mazid, A., Keser, M., Amegbeto, K. N., Morgounov, A., Bagci, A., Peker, K., Akin, M., Kucukcongar, M., Kan, M., Semerci, A. and Karabak, S. (2015) Measuring the impact of agricultural research: The case of new wheat varieties in Turkey. Experimental Agriculture 51(02), pp. 161–178.
Google Scholar
Impact of agricultural research on livelihood
The study design is not experimental or quasi-experimental.
Rimal, N. S., Kumar, S., Chahal, V. P. and Singh, V. (2015) Impact of adoption of improved varieties of chickpea (Cicer arietinum) on yield and income in Madhya Pradesh. The Indian Journal of Agricultural Sciences 85(4), pp. 555–560.
Google Scholar
Impact of improved varieties on income
The study design is not experimental or quasi-experimental.
Kotu, B. and Admassie, A. (2015) Potential impact of improved varieties on poverty reduction: A case study of selected cereal crops in two districts of Ethiopia. Paper presented at the International Association of Agricultural Economists Conference, 9–14 August 2015, Milan, Italy.
Google Scholar
Impact of improved varieties on poverty
The study design is not experimental or quasi-experimental.
Kumara Charyulu, D., Shyam, D. M., Bantilan, C., Rao, K. P. C., Borikar, S. T., Rao, Y. M., Rai, K. N. and Gupta, S. K. (2015) Pearl millet technology adoption and impact study in Maharashtra. Research Report No 71, Research Program on Markets, Institutions and Policies (Patancheru, Hyderabad: International Crops Research Institute for the Semi-Arid Tropics).
Google Scholar
Impact of improved varieties on welfare
The study design is not experimental or quasi-experimental. The welfare benefits were measured through the increase in consumer surplus and producer surplus.
Diiro, G. M. and Sam, A. G. (2015) Agricultural technology adoption and nonfarm earnings in Uganda: A semiparametric analysis. The Journal of Developing Areas 49(2), pp. 145–162.
Google Scholar
Impact of improved varieties on welfare
This study looks at the effects of non-farm income on farm-level adoption of improved maize seed varieties in Uganda.
Walker, T. S. and Alwang, J. (eds) (2015) Crop Improvement: Adoption and Impact of Improved Varieties in Food Crops in Sub-Saharan Africa (Wallingford, United Kingdom: CABI Publishing).
Google Scholar
Impact of improved varieties
The chapters in this book were reviewed to identify whether impact assessments of improved varieties on welfare indicators were included. Chapters 15 and 16 relate to this analysis.Chapter 15 is a study by Zeng et al. (2015). The explanation for excluding this study is provided in the next row.For chapter 16 (Larochelle et al. 2015), the explanation for excluding this study is also provided below.
Excluded studies Source Search terms Reasons for exclusion

70
Huang, W., Zeng, D. and Zhou, S. (2015) Welfare impacts of modern peanut varieties in China. Quarterly Journal of International Agriculture 54(3), pp. 221–238.
Google Scholar
Impact of improved varieties
The mean outcome in the treatment group and the mean outcome in the comparison group after matching were not provided. It was not possible to generate the RR for this study.
Larochelle, C., Alwang, J., Norton, G. W., Katungi, E. and Labarta, R. A. (2015) Sixteen impacts of improved bean varieties on poverty and food security in Uganda and Rwanda, in: T. S. Walker and J. Alwang (eds), Crop Improvement: Adoption and Impact of Improved Varieties in Food Crops in Sub-Saharan Africa, (Wallingford, United Kingdom: CABI Publishing), pp. 314 - 338.
Google Scholar
Impact of improved varieties on income
The study design is not experimental or quasi-experimental.
Acheampong, P. P. and Owusu, V. (2015) Impact of improved cassava varieties’ adoption on farmers’ incomes in rural Ghana. Paper presented at the International Association of Agricultural Economists Conference, 9–14 August 2015, Milan, Italy.
Google Scholar
Impact of improved varieties
The mean outcome in the treatment group and the mean outcome in the comparison group after matching were not provided. It was not possible to generate the RR for this study.
Muyanga, M. (2009) Smallholder adoption and economic impacts of tissue culture banana in Kenya. African Journal of Biotechnology 8(23), pp. 6549 - 6557.
Google Scholar
Impact of improved varieties on income
The study design is not experimental or quasi-experimental.
Tambo, J. and Wunscher, T. (2015) Beyond adoption: the welfare effects of farmer innovation in rural Ghana. Paper presented at the International Association of Agricultural Economists Conference, 9–14 August 2015, Milan, Italy.
Google Scholar
Impact of improved varieties on welfare
This study does not evaluate the effects of improved varieties only. It evaluates the impact of different types of innovations: seed and agronomic innovations, mechanical innovations, institutional innovations, biotechnological innovations, informational innovations and innovations developed by farmers.
Excluded studies Source Search terms Reasons for exclusion

71
Coromaldi, M., Pallante, G. and Savastano, S. (2015) Adoption of modern varieties, farmers’ welfare and crop biodiversity: Evidence from Uganda. Ecological Economics 119, pp. 346–358.
Google Scholar
Impact of improved varieties on welfare
The t-statistics or standard errors of the average treatment effect for the food per capita consumption expenditure outcome variable are not displayed in the results table.
Ndaghu, N. N., Abdulsalam, Z., Rahman, S. A. and Abdoulaye, T. (2015) Adoption and impact of early maturing maize varieties on farmers’ income in Safana Local Government Area of Katsina, Nigeria. African Journal of Agricultural Research, 10(34), pp. 3374–3381.
Google Scholar
Impact of improved varieties on income
The t-statistics or standard errors of the average treatment effect for the farmers’ income outcome variable are not displayed in the results table.
Excluded studies Source Search terms Reasons for exclusion
Source: authors’ analysis.

72
Appendix IV: Meta-analysis results stratified by crop type and quality of paper
Figure A3 presents the results of the meta-analysis, stratified this time by type of improved crop. The magnitude of the effect across crop types and outcomes does not vary extensively. As with the disaggregation by region, the I-squared value is very high. The subtotal effect size for legumes is statistically significant for the poverty outcome. For the income outcome, all types of crops (except for “other”) are statistically significant at 5 per cent. Improved legume seeds are associated with the greatest impact on income, as highlighted in Figure A3(ii). Improved maize seeds bring the largest increase in expenditure.
Figure A3 Forest plots – results disaggregated by crop type
.
.
.
Overall (I−squared = 83.9%, p = 0.000)
Smale et al. 2014 − Zambia
Study
maize
Khonje et al. 2014 − Zambia
legumes
Subtotal (I−squared = 0.0%, p = 0.982)
Subtotal (I−squared = 93.8%, p = 0.000)
Kassie et al. 2011 − Uganda
Mendola 2007 − Nigeria
rice/wheat
Subtotal (I−squared = .%, p = .)
Simtowe et al. 2012 − Malawi
Asfaw et al. 2012 − Tanzania
Mathenge et al. 2014 − Kenya
ID
%
Weight
Decrease Increase 1.292 3.42
Note: Based on inverse variance weighting/dependent effect sizes removed
0.96 (0.91, 1.02)
1.00 (1.00, 1.00)
0.85 (0.50, 1.44)
0.83 (0.47, 1.45)
0.97 (0.92, 1.02)
0.90 (0.29, 2.75)
0.55 (0.32, 0.94)
0.55 (0.32, 0.94)
0.83 (0.33, 2.08)
0.78 (0.31, 1.95)
0.94 (0.93, 0.96)
100.00
50.04
1.03
0.92
98.09
0.23
0.99
0.99
0.34
0.35
47.02
ES (95% CI)
Poverty, by Crop Type(i) Poverty, by Crop Type
Note: Based on inverse variance weighting/dependent effect sizes removed

73
(ii) Income, by Crop Type
Note: Based on inverse variance weighting/dependent effect sizes removed
.
.
.
.
Overall (I−squared = 87.4%, p = 0.000)
rice/wheat
Mathenge et al. 2014 − Kenya
legumes
Subtotal (I−squared = 92.2%, p = 0.000)
Mendola 2007 − Nigeria
Kassie et al. 2011 − Uganda
Rovere et al. 2009 − Mexico
Khonje et al. 2014 − Zambia
Subtotal (I−squared = 0.0%, p = 0.962)
Dibba et al. 2012 − Gambia
Kikulwe et al. 2012 − Kenya
maize
Wiredu et al. 2014 − Ghana
Subtotal (I−squared = .%, p = .)
Bezu et al. 2014 − Malawi
ID
Subtotal (I−squared = .%, p = .)
Smale et al. 2014 − Zambia
other
Nguezet et al. 2011 − NigeriaWu et al. 2010 − China
Study
1.35 (1.19, 1.53)
1.07 (1.00, 1.14)
1.28 (1.10, 1.49)
1.32 (0.96, 1.82)
1.47 (1.13, 1.90)
1.28 (0.99, 1.64)
2.75 (1.86, 4.07)
1.37 (1.21, 1.54)
1.01 (0.03, 31.10)
2.38 (0.75, 7.61)
1.51 (1.13, 2.03)
2.38 (0.75, 7.61)
1.62 (1.31, 2.00)
ES (95% CI )
1.47 (1.13, 1.90)
1.01 (1.00, 1.01)
1.46 (0.60, 3.56)1.34 (1.16, 1.55)
100.00
15.25
58.09
7.82
9.43
9.80
6.28
31.37
0.13
1.10
8.53
1.10
10.91
Weight
9.43
15.85
1.7813.11
%
Decrease Increase
1.0322 31.1
Income, by Crop Type
Note: Based on inverse variance weighting/dependent effect sizes removed
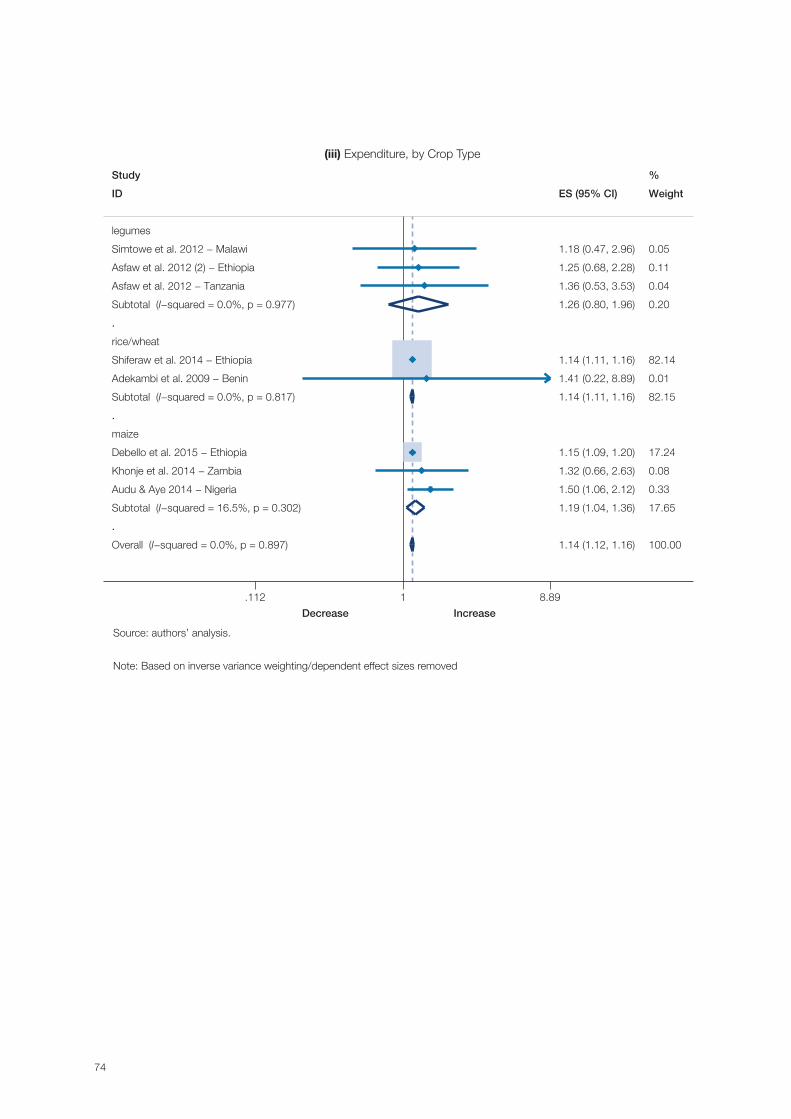
74
(iii) Expenditure, by Crop Type
Source: authors’ analysis.
Note: Based on inverse variance weighting/dependent effect sizes removed
.
.
.Overall (I−squared = 0.0%, p = 0.897)
Subtotal (I−squared = 0.0%, p = 0.977)
Simtowe et al. 2012 − Malawi
Asfaw et al. 2012 (2) − Ethiopia
Study
ID
legumes
Asfaw et al. 2012 − Tanzania
Subtotal (I−squared = 0.0%, p = 0.817)
Adekambi et al. 2009 − Benin
maize
Shiferaw et al. 2014 − Ethiopia
rice/wheat
Audu & Aye 2014 − Nigeria
Debello et al. 2015 − Ethiopia
Khonje et al. 2014 − Zambia
Subtotal (I−squared = 16.5%, p = 0.302)
1.14 (1.12, 1.16)
1.26 (0.80, 1.96)
1.18 (0.47, 2.96)
1.25 (0.68, 2.28)
ES (95% CI)
1.36 (0.53, 3.53)
1.14 (1.11, 1.16)
1.41 (0.22, 8.89)
1.14 (1.11, 1.16)
1.50 (1.06, 2.12)
1.15 (1.09, 1.20)
1.32 (0.66, 2.63)
1.19 (1.04, 1.36)
100.00
0.20
0.05
0.11
%
Weight
0.04
82.15
0.01
82.14
0.33
17.24
0.08
17.65
Decrease Increase
1.112 8.89
Expenditure, by Crop Type
Note: Based on inverse variance weighting/dependent effect sizes removed

75
Figure 4 disaggregates the results by quality of the study. There does not seem to be a linear relationship between the poverty estimate and the quality of the study, with high- and low-quality studies reporting similar estimates. There is no linear relationship between effect size and quality of study across the poverty, income and expenditure outcomes either.
Figure A4 Forest plots – results disaggregated by study quality
.
.
.
Overall (I−squared = 83.9%, p = 0.000)
Subtotal (I−squared = 49.6%, p = 0.138)
2
Mathenge et al. 2014 − Kenya
Study
Simtowe et al. 2012 − Malawi
1
Subtotal (I−squared = 0.0%, p = 0.980)
Kassie et al. 2011 − Uganda
Khonje et al. 2014 − Zambia
Smale et al. 2014 − Zambia
Subtotal (I−squared = .%, p = .)
3
ID
Mendola 2007 − Nigeria
Asfaw et al. 2012 − Tanzania
0.96 (0.91, 1.02)
0.81 (0.56, 1.16)
0.94 (0.93, 0.96)
0.83 (0.33, 2.08)
0.84 (0.55, 1.28)
0.90 (0.29, 2.75)
0.85 (0.50, 1.44)
1.00 (1.00, 1.00)
1.00 (1.00, 1.00)
ES (95% CI)
0.55 (0.32, 0.94)
0.78 (0.31, 1.95)
100.00
48.35
47.02
%
0.34
1.61
0.23
1.03
50.04
50.04
Weight
0.99
0.35
Decrease Increase
1.292 3.42
Poverty, by Total Quality Terciles
Note: Based on inverse variance weighting/dependent effect sizes removed
(i) Poverty, by Total Quality Terciles
Note: Based on inverse variance weighting/dependent effect sizes removed

76
(ii) Income, by Total Quality Terciles
Note: Based on inverse variance weighting/dependent effect sizes removed
.
.
.Overall (I−squared = 87.4%, p = 0.000)
Smale et al. 2014 − Zambia
Rovere et al. 2009 − Mexico
Wiredu et al. 2014 − Ghana
Nguezet et al. 2011 − Nigeria
Kikulwe et al. 2012 − Kenya
Kassie et al. 2011 − Uganda
Mendola 2007 − Nigeria
Subtotal (I−squared = 91.5%, p = 0.000)
Wu et al. 2010 − China
Bezu et al. 2014 − Malawi
ID
3
Subtotal (I−squared = 0.0%, p = 0.935)
Study
Mathenge et al. 2014 − Kenya
Dibba et al. 2012 − Gambia
2
Khonje et al. 2014 − Zambia
1
Subtotal (I−squared = 84.8%, p = 0.001)
1.35 (1.19, 1.53)
1.01 (1.00, 1.01)
1.28 (0.99, 1.64)
1.51 (1.13, 2.03)
1.46 (0.60, 3.56)
2.38 (0.75, 7.61)
1.47 (1.13, 1.90)
1.32 (0.96, 1.82)
1.62 (1.00, 2.65)
1.34 (1.16, 1.55)
1.62 (1.31, 2.00)
ES (95% CI)
1.35 (1.21, 1.50)
1.07 (1.00, 1.14)
1.01 (0.03, 31.10)
2.75 (1.86, 4.07)
1.29 (0.88, 1.90)
100.00
15.85
9.80
8.53
1.78
1.10
9.43
7.82
32.67
13.11
10.91
Weight
41.04
%
15.25
0.13
6.28
26.29
Decrease Increase
1.0322 31.1
Income, by Total Quality Terciles
Note: Based on inverse variance weighting/dependent effect sizes removed

77
Source: authors’ analysis.
Note: Based on inverse variance weighting/dependent effect sizes removed
.
.
.
Overall (I−squared = 0.0%, p = 0.897)
Asfaw et al. 2012 (2) − Ethiopia
Audu & Aye 2014 − Nigeria
Simtowe et al. 2012 − Malawi
1
Shiferaw et al. 2014 − Ethiopia
3
Debello et al. 2015 − Ethiopia
Asfaw et al. 2012 − Tanzania
2
Subtotal (I−squared = 0.0%, p = 0.816)
Adekambi et al. 2009 − Benin
Subtotal (I−squared = 0.0%, p = 0.956)
Subtotal (I−squared = 0.0%, p = 0.937)
ID
Khonje et al. 2014 − Zambia
Study
1.14 (1.12, 1.16)
1.25 (0.68, 2.28)
1.50 (1.06, 2.12)
1.18 (0.47, 2.96)
1.14 (1.11, 1.16)
1.15 (1.09, 1.20)
1.36 (0.53, 3.53)
1.14 (1.12, 1.16)
1.41 (0.22, 8.89)
1.33 (0.76, 2.33)
1.40 (1.06, 1.86)
ES (95% CI)
1.32 (0.66, 2.63)
100.00
0.11
0.33
0.05
82.14
17.24
0.04
99.38
0.01
0.13
0.49
Weight
0.08
%
Decrease Increase
1.112 8.89
Expenditure, by Total Quality Terciles
Note: Based on inverse variance weighting/dependent effect sizes removed
(iii) Expenditure, by Total Quality Terciles

78
Appendix V: Meta-analysis with all papers
Figure A5 Meta-analysis with dependent effect sizes
(i) Poverty, by Region
.
.
Overall (I−squared = 83.9%, p = 0.000)
Khonje et al. 2014 − Zambia
Mendola 2007 − Nigeria
Simtowe et al. 2012 − Malawi
Subtotal (I−squared = 84.6%, p = 0.000)
Mathenge et al. 2014 − Kenya
Study
Asia and the Paci�c
ID
Asfaw et al. 2012 − Tanzania
Smale et al. 2014 − Zambia
Subtotal (I−squared = .%, p = .)
Kassie et al. 2011 − Uganda
East and Southern Africa
0.96 (0.91, 1.02)
0.85 (0.50, 1.44)
0.55 (0.32, 0.94)
0.83 (0.33, 2.08)
0.97 (0.92, 1.02)
0.94 (0.93, 0.96)
ES (95% CI)
0.78 (0.31, 1.95)
1.00 (1.00, 1.00)
0.55 (0.32, 0.94)
0.90 (0.29, 2.75)
100.00
1.03
0.99
0.34
99.01
47.02
%
Weight
0.35
50.04
0.99
0.23
Decrease Increase 1.292 3.42
Poverty, by Region
Note: Based on inverse variance weightingNote: Based on inverse variance weighting/ dependent effect sizes removed

79
.
.
.
.Overall (I−squared = 87.4%, p = 0.000)
Dibba et al. 2012 − Gambia
Subtotal (I−squared = 0.0%, p = 0.938)
Wiredu et al. 2014 − Ghana
Kikulwe et al. 2012 − Kenya
Study
Subtotal (I−squared = .%, p = .)
Wu et al. 2010 − China
Rovere et al. 2009 − Mexico
Subtotal (I−squared = 91.4%, p = 0.000)
Mathenge et al. 2014 − Kenya
East and Southern Africa
West and Central Africa
Khonje et al. 2014 − Zambia
Bezu et al. 2014 − Malawi
Subtotal (I−squared = 0.0%, p = 0.972)
ID
Smale et al. 2014 − Zambia
Latin America
Kassie et al. 2011 − Uganda
Mendola 2007 − NigeriaAsia and the Paci�c
Nguezet et al. 2011 − Nigeria
1.35 (1.19, 1.53)
1.01 (0.03, 31.10)
1.34 (1.17, 1.53)
1.51 (1.13, 2.03)
2.38 (0.75, 7.61)
1.28 (0.99, 1.64)
1.34 (1.16, 1.55)
1.28 (0.99, 1.64)
1.33 (1.14, 1.56)
1.07 (1.00, 1.14)
2.75 (1.86, 4.07)
1.62 (1.31, 2.00)
1.50 (1.14, 1.98)
ES (95% CI)
1.01 (1.00, 1.01)
1.47 (1.13, 1.90)
1.32 (0.96, 1.82)
1.46 (0.60, 3.56)
100.00
0.13
20.93
8.53
1.10
%
9.80
13.11
9.80
58.83
15.25
6.28
10.91
10.44
Weight
15.85
9.43
7.82
1.78
Decrease Increase
1.0322 31.1
Income, by Region
Note: Based on inverse variance weighting
(ii) Income, by Region
Note: Based on inverse variance weighting

80
Source: authors’ analysis.
Note: Based on inverse variance weighting
(iii) Expenditure, by Region
.
.
.Overall (I−squared = 0.0%, p = 0.942)
ID
Debello et al. 2015 − Ethiopia
Subtotal (I−squared = .%, p = .)
Audu & Aye 2014 − Nigeria
Khonje et al. 2014 − Zambia
East and Southern Africa
Asfaw et al. 2012 − Tanzania
West and Central Africa
Subtotal (I−squared = 0.0%, p = 0.994)
Simtowe et al. 2012 − Malawi
Asfaw et al. 2012 (2) − Ethiopia
Subtotal (I−squared = 0.0%, p = 0.953)
Study
Becerril & Abdulai 2010 − Mexico
Shiferaw et al. 2014 − Ethiopia
Latin America
Adekambi et al. 2009 − Benin
1.14 (1.12, 1.16)
ES (95% CI)
1.15 (1.09, 1.20)
1.48 (0.00, 11279.35)
1.50 (1.06, 2.12)
1.32 (0.66, 2.63)
1.36 (0.53, 3.53)
1.14 (1.12, 1.16)
1.18 (0.47, 2.96)
1.25 (0.68, 2.28)
1.49 (1.06, 2.10)
1.48 (0.00, 11279.36)
1.14 (1.11, 1.16)
1.41 (0.22, 8.89)
100.00
Weight
17.24
0.00
0.33
0.08
0.04
99.66
0.05
0.11
0.34
%
0.00
82.14
0.01
Decrease Increase 18.9e−05 11279
Expenditure, by Region
Note: Based on inverse variance weighting

81
The IFAD Research Series
01. Agricultural and rural development reconsidered
A guide to issues and debates
By Steve Wiggins
02. Migration and transformative pathways
A rural perspective
By David Suttie, Rosemary Vargas-Lundius
03. Fostering inclusive outcomes in sub-Saharan African agriculture
Improving agricultural productivity and expanding agribusiness opportunities
By David Suttie, Rui Benfica
04. The effects of smallholder agricultural involvement on household food consumption and
dietary diversity
Evidence from Malawi
By Rui Benfica, Talip Kilic
05. Rural-urban linkages and food systems in sub-Saharan Africa
The rural dimension
By Karim Hussein, David Suttie
06. Why food and nutrition security matters for inclusive structural and rural transformation
By Steven Were Omamo
07. Measuring IFAD’s impact
Background paper to the IFAD9 Impact Assessment Initiative
By Alessandra Garbero
08. Fostering inclusive rural transformation in fragile states and situations
By Karim Hussein
09. Social protection and inclusive rural transformation
By Carolina Trivelli, Silvana Vargas, Jhonatan Clausen
10. Inclusive Finance and Inclusive Rural Transformation
By Calum G. Turvey
11. Food safety, trade, standards and the integration of smallholders into value chains
A review of the literature
By John Humphrey
12. An evidence-based assessment of IFAD’s end of project reporting
By Bia Carneiro, Alessandra Garbero
13. Graduation models for rural financial inclusion
By Khalid El Harizi, Xinjia Yan
14. Disbursement performance of the International Fund for Agricultural Development (IFAD)
An in-depth analysis of drivers and trends
By Tim Balint, Daniel Higgins, Paola Mallia, Silvana Scalzo, Paul Winters
15. Remittances, growth and poverty reduction in Asia
A critical review of the literature and new evidence from cross-country panel data
By Katsushi S. Imai, Bilal Malaeb, Fabrizio Bresciani
16. Getting the most out of impact evaluation for learning, reporting and influence
Insights from piloting a Participatory Impact Assessment and Learning Approach (PIALA) with IFAD
By Edward Heinemann, Adinda Van Hemelrijck, Irene Guijt
17. Population age structure and sex composition in sub-Saharan Africa
A rural-urban perspective
By Ashira Menashe-Oren, Guy Stecklov

82
18. Do agricultural support and cash transfer programmes improve nutritional status?
By Seth R. Gitter, James Manley, Jill Bernstein, Paul Winters
19. Measuring women’s empowerment in agriculture
A streamlined approach
By Alessandra Garbero, Emilie Perge
20. Transformation and diversification of the rural economy in Asia
By Roehlano M. Briones
21. Does relative deprivation induce migration?
Evidence from sub-Saharan Africa
By Kashi Kafle, Rui Benfica, Paul Winters
22. Poverty reduction during the rural-urban transformation
Rural development is still more important than urbanization
By Katsushi S. Imai, Raghav Gaiha, Alessandra Garbero
23. The effect of the sectoral composition of economic growth on rural and urban poverty
By Rui Benfica, Heath Henderson
24. Influence of nutrition-sensitive interventions on dietary profiles of smallholder farming
households in East and Southern Africa
By Marian Amaka Odenigbo, Patience Elabor-Idemudia, Nigatu Regassa Geda
25. Structural transformation and poverty in Malawi
Decomposing the effects of occupational and spatial mobility
By Rui Benfica, Margherita Squarcina, Alejandro de la Fuente
26. Exploration of a methodology for assessing the impact of policy engagement
What impact and how to assess it?
By Anna McCord, Ed Heinemann, Lauren Phillips
27. Asia’s rural-urban disparity in the context of growing inequality
By Katsushi S. Imai, Bilal Malaeb
28. Understanding the dynamics of adoption decisions and their poverty impacts
The case of improved maize seeds in Uganda
By Alessandra Garbero, Pierre Marion
29. Empowering through collective action
By Pierre-Marie Bosc
30. Nutrition-sensitive value chains from a smallholder perspective
A framework for project design
By Isabel de la Peña, James Garrett, Aulo Gelli
31. Impact of modern irrigation on household production and welfare outcomes
Evidence from the Participatory Small-Scale Irrigation Development Programme (PASIDP)
project in Ethiopia
By Alessandra Garbero and Tisorn Songsermsawas
32. Developing country-wide farming system typologies
An analysis of Ethiopian smallholders’ income and food security
By Esther Boere, Aline Mosnier, Géraldine Bocquého, Alessandra Garbero, Tamás Krisztin,
Petr Havlík, Thomas Elhaut
33. The impact of the adoption of CGIAR’s improved varieties on poverty and welfare outcomes
A systematic review
By Alessandra Garbero, Pierre Marion and Valentina Brailovskaya


International Fund for Agricultural Development
Via Paolo di Dono, 44 - 00142 Rome, Italy
Tel: +39 06 54591 - Fax: +39 06 5043463
Email: [email protected]
www.ifad.org
www.facebook.com/ifad
instagram.com/ifadnews
www.twitter.com/ifad
www.youtube.com/user/ifadTV