the influence of employer branding on employee performance
TRANSCRIPT

THE INFLUENCE OF EMPLOYER BRANDING
ON EMPLOYEE PERFORMANCE
A thesis submitted to The University of Manchester for the degree of
Doctor of Business Administration
In the Faculty of Humanities
2014
HENDRIATTA WONG
Manchester Business School

2
TABLE OF CONTENTS
TABLE OF CONTENTS ................................................................................................................ 2
ABSTRACT ................................................................................................................................ 8
DECLARATION .......................................................................................................................... 9
COPYRIGHT STATEMENT ........................................................................................................... 9
ACKNOWLEDGEMENTS ............................................................................................................ 10
CHAPTER 1: INTRODUCTION ................................................................................................... 11
Problem Overview: Limited Empirical Evidence of a Link between Employer Branding and
Employee Performance..................................................................................................... 11
Employer Branding is Here to Stay .................................................................................... 14
Employer Branding and Employee Performance - Recognizing the End Goal and the Need for
Further Investigation ........................................................................................................ 16
Research Objectives, Questions, and Activities ................................................................... 17
Pilot Study ................................................................................................................. 17
Main Research ........................................................................................................... 18
Choosing to Explore the Employer Branding Practices of a `Best Employer’ ......................... 18
Organization of Dissertation.............................................................................................. 24
CHAPTER 2: REVIEW OF LITERATURE ...................................................................................... 27
Employer Branding: A Still-Evolving Concept ......................................................................... 27
Definitions and Value Propositions of the Employer Brand .................................................. 27
Definitions, Components, and Process of Employer Branding .............................................. 31
Research on Employer Branding ....................................................................................... 32
Yet Unproven Assumptions on the Relationship Between Employer Branding and Employee
Performance .................................................................................................................... 34
Employee Performance ........................................................................................................ 37
Definitions and Dimensions of Task and Organizational Citizenship Performances ................ 37
Employee Engagement: Linking Employer Branding with Employee Performance ................. 39
Verifying employee engagement in this doctoral research ............................................. 41
CHAPTER 3: PILOT STUDY ...................................................................................................... 43
Pilot Study Objectives and Research Questions .................................................................. 45
Methodology ....................................................................................................................... 45
Sample Selection ............................................................................................................. 46
Interview Process and Questionnaire ................................................................................. 48
Analysis, Results, and Discussions ........................................................................................ 50
Themes in the definition of employer branding .................................................................. 50
Discussion ................................................................................................................. 51
Themes in the elements used by employers to brand and distinguish themselves ................ 52

3
Employee-oriented Element: Employment Benefits ....................................................... 52
Organization-oriented Elements: Activities and Controls ............................................... 53
Discussion ................................................................................................................. 55
Themes in targeted work behaviours and the employer branding elements used by employers
to shape and maintain them ............................................................................................. 55
Discussion ................................................................................................................. 58
Limitations of Pilot Study ...................................................................................................... 61
Conclusion and Moving Forward to Main Doctoral Research.................................................... 62
CHAPTER 4: MAIN RESEARCH PROJECT METHODOLOGY .......................................................... 64
Research Paradigm Considerations and Influences ................................................................. 66
Paradigmatic foundation of this doctoral research .............................................................. 68
Context, Content, and Process Considerations ....................................................................... 71
Using a Mixed-method Case Study ........................................................................................ 76
Complexity of phenomenon ........................................................................................ 76
Triangulation of data .................................................................................................. 77
The use of a single case ............................................................................................. 79
Case Selection ................................................................................................................. 80
Profile of Chosen Case Organization and Research Sites ..................................................... 81
Rationale for choosing an employer from the service sector ................................................ 83
Data Collection .................................................................................................................... 84
Materials Review .............................................................................................................. 84
Managers’ Interviews ....................................................................................................... 85
Paradigmatic influence on the view of interview and data handling in this doctoral
research .................................................................................................................... 86
Sampling for the Managers Interviews ........................................................................ 90
Interview Questionnaire Design, Development, Validity Assurance, and Execution ......... 92
Employee Survey ............................................................................................................. 94
Sampling for Employee Survey ................................................................................... 95
Employee Survey Design, Development, Validity Assurance, and Execution ................... 95
Qualitative and Quantitative Data Analysis .......................................................................... 101
Qualitative Data Analysis .......................................................................................... 101
Quantitative data analysis ........................................................................................ 102
Data Conversion ...................................................................................................... 104
CHAPTER 5: QUALITATIVE RESULTS AND ANALYSIS –RELATING EMPLOYEE PERFORMANCE TO
EMPLOYER BRANDING .......................................................................................................... 107
Employment Benefits Reframed: Employee Need-centred Perspective ................................... 108
Looking at employment benefits from an employee need-centred perspective ................... 111
Employment Benefit Content Factors ......................................................................... 113
Organizational process plays a role in ensuring effective delivery of employment benefits .. 114
Employment Benefit Materialization Factors ............................................................... 114

4
Employment Benefit Content Factors .................................................................................. 115
Factor of Personal Sustainability ..................................................................................... 117
Challenges encountered in fulfilling the factor of employees’ personal sustainability ..... 123
Factor of Connectedness and Belonging .......................................................................... 124
Factor of Opportunities and Growth ................................................................................ 129
Challenges encountered in fulfilling the factor of opportunities and growth for employees
.............................................................................................................................. 134
Factor of Personal Stake and Influence ........................................................................... 136
Challenges encountered in fulfilling the factor of employees’ personal stake and influence
.............................................................................................................................. 143
Factor of Significance and Esteem ................................................................................... 146
Challenges encountered in fulfilling the factor of work significance and esteem ........... 150
Employment Benefit Materialization Factors ......................................................................... 151
Factor of Brand Championship ........................................................................................ 151
Factor of Branding Control .............................................................................................. 153
Factor of Stakeholder Selection and Interaction ............................................................... 155
External communication and interactions ................................................................... 155
Internal communication and interactions ................................................................... 158
Verifying the desirability of provisions offered ............................................................ 159
Seeking and branding to the right candidates ............................................................ 161
Proposed Employer Branding Process Model ........................................................................ 164
Summary of Results and Analysis of Performance Enhancement Factors of Employer Branding
........................................................................................................................................ 165
Acknowledging the Challenge of Linking Process to Outcome ............................................... 169
CHAPTER 6: QUANTITATIVE RESULTS AND ANALYSIS – DETERMINING THE RELATIONSHIP
BETWEEN EMPLOYER BRAND PROMISE FULFILLMENT AND EMPLOYEE PERFORMANCE ............ 170
Examining the extent of employer brand promise fulfillment ................................................ 173
Difference in perception of employer brand promise fulfilment among different classes of
employees ..................................................................................................................... 177
Examining the correlation between employees’ perceived level of employer brand promise
fulfilment and their level of organizational citizenship and task performances ........................ 181
Examining the influence that employees’ perceived level of employer brand promise expectation
fulfilment has on their level of organizational citizenship and task performances .................... 185
The influence of employees’ perceived fulfilment of employment benefit content factor
clusters on their organizational citizenship and task performances .................................... 186
Influence of the factor of personal sustainability on employee performance ................. 186
Influence of the factor of Connectedness and Belonging on employee performance ..... 187
Influence of the factor of Opportunities and Growth on employee performance ........... 189
Influence of the factor of Personal Stake and Influence on employee performance ...... 191
Influence of the factor of Significance and Esteem on employee performance ............. 192
5
The influence of employees’ perceived fulfilment of specific employer brand promises on their
Organizational Citizenship Performance ........................................................................... 194
No Yield Influencer .................................................................................................. 195
Low Yield Influencers ............................................................................................... 197
High Yield Influencers .............................................................................................. 200
Moderate Yield Influencers ....................................................................................... 204
The influence of employees’ perceived fulfilment of specific employer brand promises on their
Task Performance .......................................................................................................... 208
Overall results on the influence of employer brand promises on employees’ Organizational
Citizenship and task Performances .................................................................................. 211
Examining the influence that employees’ perceived level of employer brand promise expectation
fulfilment has on their perception of having of a desirable and distinctive experience, a great
workplace, a desire to spend the rest of their career with their organization as well as non-
presence of frequent thoughts of leaving their organization ................................................. 215
Examining the influence that employees’ perceived presence of a desirable and distinctive
experience, a great workplace, a desire to spend the rest of their career with their organization
as well as non-presence of frequent thoughts of leaving their organization, has on their level of
organizational citizenship and task performances ................................................................. 218
Summary of Quantitative Results ........................................................................................ 227
CHAPTER 7: DISCUSSIONS, IMPLICATIONS, AND CONCLUSIONS ............................................ 232
Answers, Discussions, and Contribution to Knowledge ......................................................... 232
What influence does employees’ perceived level of employer brand promise fulfilment by their
organization have on their level of organizational citizenship and task performances? ........ 232
Possible reasons for the findings of weak influence .................................................... 233
Possible reasons for the noticeable disparity in results between organizational citizenship
performance and task performance ........................................................................... 235
Likely mediator of performance in this case ............................................................... 236
What are the factors present in the content and delivery of employer brand promises and how
might they influence employee performance? .................................................................. 238
The view of employee performance enhancement as a holistic, continuous, inter-
connected endeavour ............................................................................................... 239
The intentional incorporation of the element of employee performance enhancement in
the design and fulfillment of employer brand promises ............................................... 241
The recognition of the need to be authentic, selective, and not be the best employer to all
people ..................................................................................................................... 241
The leveraging of its 100% employee-owned organizational structure and Principals and
Associates system to layer and inter-connect its employer brand promises to intensify
employee commitment, engagement, and performance over time .............................. 243
Distinction versus legitimacy – how this shapes the organization’s employer branding actions
.................................................................................................................................... 245
Relevance and Contribution of Findings to Existing Knowledge/Literature .............................. 248
Implications for Practice ..................................................................................................... 252
Limitations ........................................................................................................................ 254
Factors that might affect validity of results ................................................................ 254

6
Factors that might affect the transferability of the results ........................................... 256
Transferability of Results is Possible In Some Aspects ................................................ 258
Recommendations for Future Research ............................................................................... 260
Overall Conclusion ............................................................................................................. 261
REFERENCES ........................................................................................................................ 262
APPENDICES ......................................................................................................................... 287
1. Abbreviations Used in this Dissertation ................................................................. 289
2. Employer Brand Promises .................................................................................... 290
3. Organizational Citizenship Performance Scale ....................................................... 291
4. Task Performance Scale ...................................................................................... 292
5. Gallup Q12 Workplace Audit Questions ................................................................. 293
6. Management Interview Questionnaire .................................................................. 294
7. Table C5-3. Comparisons of the overall Organizational Citizenship Performance (OCP)
as well as overall Task Performance (TP) mean scores between Employer Brand Promise
(EBP) Expectation Fulfilment groups within each benefit-content oriented performance
enhancement cluster ................................................................................................... 297
8. Table C5-4. Correlations between the expectation fulfillment of Employer Brand
Promises (EBP) within each benefit-content oriented performance enhancement cluster and
the demonstrated level of overall Organizational Citizenship Performance (OCP) as well as
overall Task Performance (TP) ..................................................................................... 298
9. Table C5-5. Summary of Responses to the Question on Employees’ Employer Brand
Promise Expectation Fulfillment .................................................................................... 299
10. Table C5-6. Summary of Responses by Employee Group to the Question on
Employees’ Employer Brand Promise Expectation Fulfillment .......................................... 300
11. Table H1-1. Pearson’s Correlation matrix – Employer Brand Promise (EBP) Expectation
Fulfilment vs. Organizational Citizenship Performance Behaviours (OCP) and Task
Performance Actions (TP) ............................................................................................ 301
12. Table H2-1. Comparison between the mean scores of Employer Brand Promise (EBP)
Expectation Fulfilment groups for Employees’ Organizational Citizenship Performance (OCP):
Results of ANOVA and Scheffe Post-Hoc test ................................................................. 302
13. Table H2-2. Comparison between the mean scores of the LEAST influential Employer
Brand Promise (EBP) expectation fulfilment category for employees’ Organizational
Citizenship Performance (OCP): Results of ANOVA and Scheffe Post-Hoc test ................. 304
14. Table H2-3. Comparison between the mean scores of the MOST influential Employer
Brand Promise (EBP) expectation fulfilment category for employees’ Organizational
Citizenship Performance (OCP): Results of ANOVA and Scheffe Post-Hoc test ................. 305
15. Table H2-4. Comparison between the mean scores of the MODERATELY influential
Employer Brand Promise (EBP) expectation fulfilment groups for employees’ Organizational
Citizenship Performance (OCP): Results of ANOVA and Scheffe Post-Hoc test ................. 306
16. Table H2-5. Comparison between the mean scores of Employer Brand Promise (EBP)
expectation fulfilment groups for employees’ Task Performance (TP): Results of ANOVA and
Scheffe Post-Hoc test .................................................................................................. 307
17. Table H2-6. Stepwise multiple regression results for the most influential Employer
Brand Promises (EBP): only significant results shown .................................................... 309

7
18. Table H2-7. Stepwise multiple regression results for the moderately influential
Employer Brand Promises (EBP): only significant results shown ...................................... 310
19. Table H3-1 Comparison between the Mean Scores of the High Fulfilment, Low
Fulfilment, and No Expectation groups for employees’ Level of Concurrence for the Following
Notions: ..................................................................................................................... 312
i. Their employment experience at the organization is both desirable and distinctive
(DDEE). ...................................................................................................................... 312
ii. Their organization is a great place to work (GPTW). .............................................. 312
iii. They would be happy to spend the rest of their career with the organization (HSCO).
312
iv. They DO NOT frequently think of leaving the employment at the organization (NFTL)
312
20. Table H3-2. Correlation between the Expectation Fulfillment of Individual Employer
Brand Promise (EBP) Items and Employees’ Level of Concurrence for Perceiving That: .... 313
i. Their employment experience at the organization is both desirable and distinctive
(DDEE). ...................................................................................................................... 313
ii. Their Organization is a Great Place to Work (GPTW). ............................................ 313
iii. They are Happy to Spend the Rest of Their Career with the Organization (HSCO). .. 313
iv. They DO NOT Frequently Consider Leaving Their Employment at the Organization
(NFTL). ....................................................................................................................... 313
21. Table H4-1. Comparison of Organizational Citizenship Performance (OCP) and Task
Performance (TP) Between the Group that Concurs (CC) and the Group that Does Not
Concur (DNC) with the Following Notions: .................................................................... 314
i. Their employment experience at the organization is both desirable and distinctive
(DDEE). ...................................................................................................................... 314
ii. Their organization is a great place to work (GPTW). .............................................. 314
iii. They would be happy to spend the rest of their career with the organization (HSCO).
314
iv. They DO NOT frequently think of leaving the employment at the organization (NFTL).
314
Total word count for main body, including footnotes and table of content: 96040

8
ABSTRACT
University of Manchester
Hendriatta Wong
Doctor of Business Administration
The Influence of Employer Branding on Employee Performance
November 22nd, 2014
In order to understand if and how employer branding influences employees’ work
behaviours and enhances employees’ ability to contribute to organizational productivity,
effectiveness, and competitiveness, one needs to examine its functionality and capacities
beyond that of employee attraction and retention to that of employee development,
engagement, and performance. This research aims to do that by answering the following
questions:
1. What are the factors present in the content and delivery of employer brand
promises and how might they influence employee performance?
2. What influence does employees’ perceived level of employer brand promise
fulfilment by their organization have on their level of organizational citizenship and task performances?
A mix method case study was conducted on one of Canada’s best-of-the-best employers.
In total, 19 managers were interviewed and 316 employees were surveyed.
Five themes emerged to reflect the employer brand promise content factors that could
influence performance. They are the factors of personal sustainability, personal
connectedness and belonging, opportunities and growth, personal stake and influence, as
well as significance and esteem. Three themes emerged to reflect the employment
benefit materialization factors. They are brand championship, branding control, and
stakeholder selection and interaction.
Quantitative results suggest that as a whole, statistically significant, positive, and
generally weak to moderate influence exists between employees’ perceived level of
employer brand promise fulfillment and their organizational citizenship performance. The
influence on task performance is much weaker. However, there is stronger indication that
employees’ perceived fulfillment of employer brand promises positively influences their
perception of 1) their employment experience as being desirable and distinctive, 2) their
organization as being a great place to work, 3) their happiness to spend the rest of their
career at the organization, and 4) their lack of frequency in thinking of leaving the
organization, and these positive perceptions, in turn, further influence employees’
organizational citizenship and task performances.

9
DECLARATION
I declare that that no portion of the work referred to in the thesis has been submitted in
support of an application for another degree or qualification of this or any other university
or other institute of learning.
COPYRIGHT STATEMENT
i. The author of this thesis (including any appendices and/or schedules to this thesis) owns
certain copyright or related rights in it (the “Copyright”) and s/he has given The University
of Manchester certain rights to use such Copyright, including for administrative purposes.
ii. Copies of this thesis, either in full or in extracts and whether in hard or electronic copy,
may be made only in accordance with the Copyright, Designs and Patents Act 1988 (as
amended) and regulations issued under it or, where appropriate, in accordance with
licensing agreements which the University has from time to time. This page must form part
of any such copies made.
iii. The ownership of certain Copyright, patents, designs, trade marks and other
intellectual property (the “Intellectual Property”) and any reproductions of copyright works
in the thesis, for example graphs and tables (“Reproductions”), which may be described in
this thesis, may not be owned by the author and may be owned by third parties. Such
Intellectual Property and Reproductions cannot and must not be made available for use
without the prior written permission of the owner(s) of the relevant Intellectual Property
and/or Reproductions.
iv. Further information on the conditions under which disclosure, publication and
commercialisation of this thesis, the Copyright and any Intellectual Property and/or
Reproductions described in it may take place is available in the University IP Policy (see
http://www.campus.manchester.ac.uk/medialibrary/policies/intellectual-property.pdf), in
any relevant Thesis restriction declarations deposited in the University Library, The
University Library’s regulations, (see http://www.campus.manchester.ac.uk/library/about
us/regulations) and in the University’s Guidance for the Presentation of Dissertations.

10
ACKNOWLEDGEMENTS
I extend my sincere and deepest gratitude to the following individuals:
Professor Stuart Roper
For all his guidance, encouragement, and support to complete the research
project and dissertation
Professor Graeme Martin and Dr. Anthony Grimes
For their valuable feedback
DBA Administrators at Manchester Business Schools
For their outstanding student service and support
My Family, Friends, and Colleagues
For cheering me on, helping me in various ways, and accommodating my many
demands
My Parents
For their love and prayers
My Beautiful Boys, Ethan and Evan
For grounding me and making my life meaningful
And Finally, My Rock, My Love, My Husband, Cory
Without whose love and unwavering support, I would have never made it this far

11
CHAPTER 1: INTRODUCTION
Problem Overview: Limited Empirical Evidence of a Link between
Employer Branding and Employee Performance
Several years after the term “Employer Branding” was introduced by Ambler and Barrow in 1996,
the concept caught the attention of those in the world of human capital management and much
was made of it (Lievens, Van Hoye & Anseel, 2007; Moroko & Uncles, 2008). It was hailed as “the
hottest strategy in employment” (Sullivan, 1999, no page #) and “the most significant
development in recent times” (Thorne, 2004, p. 18). Business and practitioner articles (e.g.
Thorne, 2004; Hunt & Landry, 2005; Smedley, 2007; Sharma, 2008), conferences around the
world1, consulting firm studies (e.g. Bernard Hodes, 2006; Robert Half, 2007i & ii; Nigel Wright,
2008; Employer Brand Institute, 2009), and management consulting service entities (e.g. The
Employer Branding Consultancy, Employer Brand International, People In Business) centred on
employer branding have mushroomed (Martin et al., 2005). Without a doubt, the concept of
“Employer Branding” gained popularity and momentum among employers as the human capital
management strategy of choice (Backhaus and Tikoo, 2004; Thorne, 2004; Aurand et al. 2005;
Robert Half, 2007ii).
Nearly two decades after the concept was introduced, there is no sign to indicate that Employer
Branding is just a passing fad. A 20122 Google search on the exact phrase “Employer Branding”
yielded 4,440,000 hits, up significantly from the 3,000 hits yielded in a 2003 search3 by the
researcher. In fact, there are continuous indications4 (Robert Half, 2007i and 2007ii; Employer
Brand Institute, 2009 and 2011; Manpower, 2009a; TMP Worldwide, 2011; LinkedIn, 2012) that
the interest as well as organizational investment in employer branding is strong and will remain so
in the foreseeable future. According to the employer branding global research study conducted by
the Employer Brand International (formerly Employer Brand Institute) in 20095 and then again in
2011, employer branding is moving rapidly from being mainly an interest and responsibility of
those in human resources and marketing departments to a key organizational objective that
influences the direction of executive officer6 and corporate-level strategic efforts. Over 80% of
employers7 surveyed indicated that they either have a clear employer branding strategy in place,
are improving on what they have, or are working on creating a strategy. Over 60% of employers8
1 For example: Employer Branding Summits around the world by Collective Learning Australia; Employer Branding Conferences by The Sunday Times, Chartered Institute of Personnel and Development, The Employer Branding Consultancy, and many more. 2 April 2012 3 Up from over 237,000 hits in July 2007 and over 3,000 hits in 2003 (Backhaus and Tikoo, 2004) 4 A 2007 survey conducted by leading financial recruitment firm Robert Half (2007i and 2007ii) with over 2,200 finance managers across 17 countries yielded the following statistics on the adoption of employer branding strategies by organizations: 32% of companies globally, 49% in Australia, 44% in UK, 42% in Japan, 42% (awareness) in Asia Pacific, estimated 38% in USA, and estimated 32% in Canada. 5 Involving over 2,000 different sector employers from Africa, Asia, Australia, Europe/United Kingdom, New Zealand, United Arab Emirates, and United States/Canada. 6 The study found only 2% executive officers were in their organizations’ employer branding strategies in 2009 and the number jumped to 15% in 2011. On the contrary, 43% of organizations indicated that employer branding was primarily the responsibility of the HR department in 2009 and the number dropped to 31% in 2011. 7 In both 2009 and 2011 studies. 8 In both 2009 and 2011 studies.

12
surveyed indicated that they would either maintain or increase the allocation of resources to
employer branding initiatives. LinkedIn’s most recent survey (2012) of over 3,000 recruitment
professionals across the globe reveals that over 90% of those surveyed indicated that they were
spending more in 2012 than they did the year before (2011) on employer branding initiatives.
Many vendors as well as some scholars and subscribers of employer branding claim that effective
employer branding will [in addition to improving recruitment and retention] enhance employee
satisfaction, commitment, engagement and ultimately, employee performance, which in turn
strengthens organizational performance and competitiveness (e.g. Ambler and Barrow, 1996-ii;
Ainspan et al., 2001; Fulmer et al., 2003; Harding, 2003; Backhaus and Tikoo, 2004; Barrow and
Mosley, 2006; Sartain and Schumman, 2006). Ainspan et al. went further and asserted in their
Conference Board 2001 research report entitled, Engaging Employees Through Your Brand, that
“Ultimately, employer branding can be a stimulus to improvement of all the people-related
processes that create organizational excellence.” (pg. 10)
Such claim is undoubtedly powerful and enticing to employers. Many had struggled to compete for
and retain good employees during the economic boom in the early 2000s when there was a sharp,
thus unmet, demand for not only high-skill labour but also mid and low-skill labour (as per
Hoffman, 1999; Mahroum, 2000; Brent, 2003; Universum Survey in Melin, 2005) that worked in
industries such as production, hospitality, and construction. The struggle continued even with the
subsequent global recession caused by the financial crisis in 2007-2008 and still so today, with the
slow economic recovery in the majority of countries. Now, employers have to be extra financially
prudent and be able to do more with less, including less employees. Employers have to generate
more productivity and innovation from fewer employees and to do so, they have to find, retain,
engage, and invest in the development of the “right” individuals for each position
(ManpowerGroup, 2011).
Failure by organizations to attract and/or retain their targeted workforce has caused various
hardships for organizations, from loss of investment (Becker, 1962) and ballooning replacement
and retraining costs (Abelson & Baysinger, 1984; Phelan, 1991) to inability to execute
organizational strategies, regular operational shutdowns or, worse, increase in hazards and risks to
individuals served by the organizations, if poor attraction and/or low retention problems are
evident in essential service fields such as healthcare (Hunt, 2009) and law enforcement (Phelan,
1991).
Caught up in the hype of such ‘war for talent’ (Martin, 2007) and eager to implement a human
capital management solution that would provide one’s organization with an edge over its
competitors in the recruitment and retention of skilled, value-adding employees, many employers

13
might not have scrutinized the outcomes of employer branding beyond employee attraction and
retention9 (Carrington, 2007).
While the assumption of a positive relationship between effective employer branding and employee
or organizational performance is well-publicized by employer branding vendors and well-received
by employer branding subscribers, there is actually very little unbiased, empirically-based evidence
currently in place to confirm the reality of this assumption as well as to offer insight into the
intricate nature of employer branding that might make this assumption a reality.
Are employers actually getting satisfactory returns for their employer branding investment when it
comes to employee and organizational performance (Martin, 2007; Rosethorn and Mensink, 2007)?
Is there actual evidence to suggest a strong positive relationship between employer branding and
employee performance? If so, how is this relationship formed and preserved? Are some
employment benefits or factors of employer branding more influential on employee performance
than others? What are the mitigating factors or variables that would enhance or threaten this
relationship? For now, these questions have not been adequately answered. Very little relevant
academic research can be found on the specific matter.
Considering the major assumption that is widely publicized about employer branding’s ultimate
contribution to employee performance, organizational performance, and overall organizational
competitiveness as well as considering the noticeable investment (Sullivan, 2007; Employer Brand
International, 2011; LinkedIn, 2012) that employers have and intend to continue to putt into the
development and execution of employer branding to gain the assumed results, it is both significant
and timely to acquire more empirically-based insight into the relationship between employer
branding and employee or organizational performance.
With this understanding and in response to the existing knowledge gap in the area, this doctoral
research will proceed to investigate the influence of employer branding on employee job
performance. More specifically, the study aims to examine in depth the factors that might be
present in the employer branding efforts of a recognized best-of-the-best employer and employer
of choice in Canada that have influenced its employees’ performance. In doing so, the study will
explore the intricacies and challenges of fulfilling one’s employer brand promises as well as the
influence that employer brand promise fulfillment has on employees’ level of job performance. It is
proposed that follow-up research be undertaken in the future to further examine the influence of
employer branding on organizational performance.
9 As indicated by the results of “most frequent employer branding expectations” identified by employers in the 2006 Bernard Hodes Global Employer Brand Study.
14
Employer Branding is Here to Stay
The accelerated interest in the concept of Employer Branding which began in the early 2000s when
organizations experienced what was considered an intense ‘war for talent’ (Michaels et al., 1997;
Cairncross, 2003) continues to remain strong today as a result of various factors including some
overlapping conditions in the work market, as presented below.
First, the industrial economy shifted very rapidly into a knowledge economy. Unprecedented
evolution in technology has affected many fields and industries (e.g. communication, health,
education, etc.), causing an increased need for a workforce that is skilled, value-adding (Moroko &
Uncles, 2008), and competent not only from a technical perspective but also from an innovation
and problem-solving perspective (Mouritsen, 2000). More globalized operations and constant
change has made the mobile and flexible human-intellectual capital (instead of the immobile and
inflexible equipment and machines of the industrial economy) the principal determinant of business
value and the dominant factor in organizational survival (Leonard, 1998; Conference Board of
Canada, 2004). The real source of competitive advantage is now seen as people and their
capabilities (Prahalad and Hamel, 1990) and organizations recognize the significance as well as
urgency to recruit and retain skilled, talented, value-adding employees that could enhance their
overall performance and competitive advantage (Chambers et.al., 1998; Zivnuska, Ketchen, &
Snow, 2001; Martin, 2008; Moroko & Uncles, 2008).
The global financial crisis in 2007-2008 followed by the worldwide economic recession and sluggish
recovery has weakened the employment outlook in many industrialized nations (Manpower, 2009a)
but it has not eased the scarcity of talents in specific fields (Martin, 2008). A 2009(b) Global Talent
Shortage Survey involving 39,000 employers in 33 countries conducted by the leading employment
services firm, ManpowerGroup, revealed that globally, 30% of employers were having difficulty
filling positions, most prominently those of skilled trade workers, sales representatives, engineers,
technicians, production operators, accounting and finance personnel, drivers, administrative
support personnel, and management/executive personnel - partly due to the lack of qualified
people in these specific areas and partly due to employers’ inability to find people of the “perfect
fit”, which was defined as people with “the precise combination of skills and experience - for those
roles” (p. 1). Such difficulty has proven to be a noticeable barrier to the achievement of
organizations’ business goals.
As mentioned before, the global recession has actually forced employers to generate more
productivity and innovation with fewer employees and to do so through the procurement and
investment in the “right” individuals for each position (ManpowerGroup, 2011). Presently, the
deficit is not as much in the number of available bodies to work (Lenaghan & Eisner, 2005) as it is
in the knowledge, skills, and ultimately the “perfect fit” sought by employers for their vacant
positions and their organizations as a whole. Some experts predict this knowledge and skill
shortage to be long term (Clarke, 2001; Ewing et al. 2002) and see the ability to hire, retain, and

15
effectively engage employees with the right skill and fit to be critical to business success and to the
ability to survive the onslaught of an economic downturn (Sutherland, Torricelli, & Karg, 2002;
Mamarchev, 2004; TMP Worldwide, 2011).
With economic recovery underway in key developed nations, there is indication of a re-emerging
threat of skill shortage. The latest 2013 Global Talent Shortage Survey by ManpowerGroup reveals
that the percentage of employers having difficulty filling their positions has risen to 35% globally.
The areas that are most difficult to fill remain almost the same as those reported in the 2009
research report. In Canada, where this dissertation research is conducted, the figure looms at
34%. Occupations consistently exhibiting signs of labour shortage, with unemployment rate of just
over 1% and an average annual wage increase of 3.9% - more than double the rate seen in
Canada’s economy as a whole – are the skilled professionals and some less skilled workers in the
fields of health-care and medicine, human resources and business services, finance and
accounting, social and community service management, engineering, oil and gas, mining, as well
as in natural, applied, physical and life sciences. These occupations account for 21% of total
employment in Canada (CIBC World Markets Inc., 2012 – p. 2).
Adding to the labour and skill shortage concern is the anticipated mass exits of baby boomers from
the workforce within the next 5 to 10 years without the assurance that there would be an
adequate number of generation X’ers and Y’ers available to fill their and other emerging positions10
(Gandossy & Kao, 2004; Melin, 2005; Martin, 2008). A report by the Organization for Economic
Cooperation and Development (2006) indicates that over the next 50 years, there will be a sharp
increase in the share of elderly persons and a sharp decrease in the share of prime working-age
persons in the population of all OECD countries11 (p 9). It is estimated that the number of workers
retiring each year in many countries will eventually exceed the number of workers entering the
work force, causing the ratio of older inactive persons per active worker to potentially reach over
70% (0.7:1) in 2050 and in some European nations, it may reach 100% (1:1) (p. 9).
As a whole, the outlook for labour supply, particularly skilled and knowledge workers, is worrisome
for the new knowledge-intensive economy (Mahroum, 2000; Thibodeau, 2000; ManpowerGroup,
2012) where it is increasingly unavoidable for organizations to use more human-generated
competitive differentiators and advantages to survive or stay ahead (Cairncross, 2000; Ewing et al.
2002). Consequently, the ‘war for talent’ will continue and distinguishing one’s organization as “the
employer of choice” to attract and retain competent, value-adding people that could help their
employer secure ongoing success will remain a top priority for organizations (Pfeffer, 1998; Stein,
2000; Ewing et al. 2002; Brewster, Sparrow & Harris, 2005).
10 For employment growth trends, see Statistics Canada, 2006; UK National Statistics, 2006; and US Bureau of Labour Statistics, 2005 11 The 30 member countries of OECD are: Australia, Austria, Belgium, Canada, Czech Republic, Denmark, Finland, France, Germany, Greece, Hungary, Iceland, Ireland, Italy, Japan, Korea, Luxembourg, Mexico, the Netherlands, New Zealand, Norway, Poland, Portugal, Slovak Republic, Spain, Sweden, Switzerland, Turkey, United Kingdom, United States (Accessed on OECD website on August 14th, 2009)

16
Employer Branding and Employee Performance - Recognizing the End
Goal and the Need for Further Investigation
While some employer branding literatures do emphasize the ultimate goal of producing enhanced
workforce capacity to deliver the organization’s product or service promises to customers and other
stakeholders (Farrell, 2002; Backhaus and Tikoo, 2004; Miles and Mangold, 2005; Ogilvie, 2006),
most employer branding studies and literatures (e.g. McKenzie and Glynn, 2001; Berthon et al.,
2005) focus almost exclusively on the end goal of yielding employment applications from qualified
applicants and employment retention from existing employees.
From a management perspective, recognizing which end goal to pursue in employer branding is
critical to corporate decision-making and resource allocation. If the end goal of employer branding
is primarily to attract qualified applicants and retain existing employees, less or no effort would
have to be placed on coordinating processes, activities and incentives that would specifically result
in the shaping and maintenance of behaviours that support the delivery of the organization’s
performance objectives. An organization can be highly successful in becoming an employer of
choice by providing the prescribed employer brand package “of functional, economic, and
psychological benefits” (Ambler & Barrow, 1996) that meet or surpass employees’ personal needs.
None of the benefits need to be aligned with the corporate strategies or performance objectives in
order for the organization to entice many qualified applicants to apply or to motivate the majority
of good employees to stay. On the other hand, if the end goal is to ensure employees’ ability to
deliver the organization’s corporate strategies, superior service, or other performance objectives,
then employer branding processes, activities and incentives must not only result in the successful
attraction and retention of desired employees but more importantly, must result in employees’
sustained delivery of targeted performance expectations.
To determine what end goal an organization should achieve, one may ask, “Ultimately, why do
organizations want to recruit, develop, engage, and retain people?” The answer would likely not be
“To meet people’s personal needs and satisfaction.” It would likely also not be as simple as “To
attract them and retain them.” If it is, then we have failed to ask the important subsequent
question of “For what reason or purpose?” Attracting and retaining employees as well as meeting
their needs and satisfaction are in fact the decent, necessary, and effective means to the end.
They are not, however the end goal or purpose. Human resource management scholars and
researchers (for example: Schuler and Huber, 1990; Armstrong, 2000; Schwind et al. 2002;
Bratton & Gold, 2003; Dessler et al. 2004) agree that the ultimate goal of human resource
management strategies and initiatives is to maximize employees’ contribution to the organization’s
productivity, effectiveness, and sustained competitiveness (while simultaneously attempting to
attain other individual and societal objectives). While successful attraction and retention is
essential for maintaining operational stability and may be a pre-requisite to improving
organizational performance, it, on its own, does not necessarily transpire to improved performance

17
(Martin, 2007) or increased ability to contribute to organizational productivity, effectiveness, and
competitiveness.
At this time of clear economic fragility and slow recovery, performance and productivity rather than
simply recruitment and retention would likely be employers’ primary human capital management
focus. With the need to contain or cut costs and at the same time maintain competitiveness and
viability, managers must demonstrate real value in the human capital management initiatives in
which they have invested or in which they plan to invest (Martin et al., 2005; Manpower 2009b).
Success in recruitment and retention alone would not deliver this value (Martin, 2007). Instead,
such value would come from employees’ strengthened commitment and engagement, better
performance, increased productivity, and ultimately, enhanced capacity to provide real competitive
advantage to their organizations. As such, the demand for stronger accountability in organizational
spending would compel managers to demonstrate noticeable bottom-line return on the investment
made on an organization’s employer branding activities.
In order to understand if and how employer branding influences employees’ work behaviours and
enhances employees’ ability to contribute to organizational productivity, effectiveness, and
competitiveness, one needs to examine its functionality and capacities beyond that of employee
attraction and retention to that of employee development, motivation, and performance. Without
recognizing and incorporating these aspects, an organization’s employer branding program may
only be partially developed, partially used, and partially effective.
Research Objectives, Questions, and Activities
In response to existing knowledge gap on the subject of employer branding, this study proceeded
to examine how employer branding might influence employee performance. In order to do so, the
study first explores the intricacies involved in employer branding and the factors that might exist to
enable it to affect the enhancement of employee performance or of mediators of employee
performance such as satisfaction, commitment, and engagement.
Pilot Study
The investigation begins with a preliminary small-scale pilot study, of which the main aim was to
explore if recognized ‘best employers’ in Canada used different types of employment benefits and
other possible elements to attract and retain employees when compared to employers that had
never been recognized as best employers and, if so, what those differences might be. From there,
the study examines the types of employment benefits used by these best and non-best employers
to enhance expected employee behaviours.

18
The pilot study provides a preliminary insight into other elements that might be used in employer
branding aside from employment benefits and the sort of work behaviours that employers aim to
strengthen with each identified type of employment benefits.
In order to achieve this aim, the pilot proceeded to answer the following research questions:
1. How do best employers and non-best employers differ in terms of the types of employment
benefits and other possible elements used in their employer branding efforts?
2. What employment benefits and other possible elements are used by organizations to enhance
expected employee behaviours?
Main Research
The investigation then proceeds to the main research, which looks at the relationship between
elements of employer branding and employee performance in depth. The investigation consists of
a mixed-method single case study of the employer branding strategies and activities at an
organization deemed to be one of the ‘best-of-the-best’ employers in Canada. The main objective
of the case study is to uncover information and evidence to answer the following research
questions:
1. What are the factors present in the content and delivery of employer brand promises and how
might they influence employee performance?
2. What influence does employees’ perceived level of employer brand promise fulfilment by their
organization have on their level of organizational citizenship and task performances?
Choosing to Explore the Employer Branding Practices of a `Best
Employer’
The investigations for both the pilot study and the main research for this dissertation will involve
the examination of the employer branding practices of employers that have been recognized as
Canada’s top or best employers by two respectable Canadian employer competitions – Canada’s
Top 100 Employers, as compiled and presented by Mediacorp Canada Inc. and 50 Best Employers
In Canada, as compiled and presented by Aon Hewitt (formerly Hewitt Associates) and Maclean’s.
Canada’s Top 100 Employers is the most recognized and prestigious employer award in Canada
(Winnipeg Free Press, San Francisco Chronicle, La Presse, Brandon Sun, and more - Mediacorp
Press Review, 2013), where winners are "the best in their classes" (as quoted by The Lawyers
Weekly – Mediacorp Press Review, 2013) and seen as demonstrating the "the gold standard for
best practices in recruitment and retention" (as quoted by The Western Producer – Mediacorp

19
Press Review, 2013). While a space on the 50 Best Employers in Canada list is not as coveted, it is
still a competition that is well-respected in Canada as it is presented by the leading global human
resources consulting firm, Aon Hewitt.
The question is, what would be the value in examining the employer branding practices of a best
employer and the value in comparing the employer branding practices of random organizations to
those of best employers?
The best employer competitions associated with this study employ rigorous screening and selection
processes12. Both also involve comprehensive survey responses from participating organizations’
existing employees and leaders as well as a review and comparison of the organizations’
employment provisions and human resource (HR) practices. In the case of Canada’s Top 100
Employers, winners are derived from a preliminary group of 75,000 organizations across industries,
throughout Canada. Shortlisted employers are evaluated using eight criteria established by a blue-
ribbon Academic Advisory Board. They are: (1) Physical Workplace, (2) Work Atmosphere & Social,
(3) Health, Financial & Family Benefits, (4) Vacation & Time Off, (5) Employee Communications,
(6) Performance Management, (7) Training & Skills Development, and (8) Community Involvement
(Mediacorp, 2013). In the case of 50 Best Employers In Canada, winners are chosen among 280
organizations upon an assessment of each organization’s level of employee engagement and its
performance across more than 20 HR factors that drive engagement, specifically in the areas of (1)
Leadership, (2) Work processes and policies, (3) Performance management, (4) Recognition, and
(5) Opportunities (Aon Hewitt, 2013).
Most organizations being assessed for a spot on either Mediacorp Inc.’s Canada’s Top 100
Employers list or Aon Hewitt’s 50 Best Employers In Canada list do not actually make the list.
Employers that made the list were those that achieved the highest scores in the combination of
number and level of employment provisions as well as in the evaluated human resources practices.
One may assume that those few that do make the list are the ones that have outperformed their
competitors in overall human capital management competencies, provisions, and/or activities
(Boyd & Sutherland, 2006). In comparison to their competitors, one may perceive these best
employers to have a noticeably stronger employer brand, much more relevant and appealing
employment value propositions, proven commitment and trustworthiness in fulfilling their
psychological contracts with employees. Whether such assumptions are true or not is still up for
debate and there is great value in more empirical investigations to determine which assumptions
might be true and which might not be so.
12 Rigorous selection process was employed by both sponsors of the studies/competitions. Details of the research process
for Canada’s Top 100 Employers can be accessed at: http://www.canadastop100.com/research.html (Mediacorp Inc.,
2013). Details of the research process for 50 Best Employers In Canada can be accessed at:
http://was2.hewitt.com/bestemployers/canada/pdfs/bestemployer.pdf (Hewitt Associates, 2004) and
http://www.aon.com/canada/products-services/human-capital-consulting/consulting/best_employers/index.html (Aon
Hewitt, 2013).

20
Regardless of the truth, there has been much emphasis in employer branding as well as human
resource management literature (e.g. Pfeffer, 1998; Martin et al., 2005) on the importance of
gaining the ‘employer of choice’ recognition. In order to build a lastingly positive employer brand,
the organization needs to not only establish but actually maintain the good reputation among its
internal and external stakeholders of being a distinguishably great place to work. According to
Fombrun (1996), an organization’s reputation is “a collective representation of a firm's past actions
and results that describes the firm's ability to deliver valued outcomes to multiple stakeholders”.
From an employer branding perspective, one may say that an organization’s reputation as a best
employer, a great place to work, or as an employer of choice is built on the organization’s ability to
continuously and consistently fulfil its employer brand promises as well as administer innovative
and compelling practices that make it a distinguishably great place to work. However, as
summarized by the globally respected Reputation Institute (in Schulte, 2010, p. 30), “A company
owns its brand, but stakeholders own its reputation” which suggests that an organization would
likely need to ensure that its ability to fulfil promises or to execute compelling practices that make
it a distinguishably great place to work is not only consistently experienced by stakeholders but is
also regularly acknowledged and, better yet, shared with others by the stakeholders in order for
the reputation be established and sustained. Since the best employer competitions such as
Mediacorp Inc.’s Canada’s Top 100 Employers and Aon Hewitt’s 50 Best Employers In Canada both
confirm and recognize the presence of this capacity, most notably by employees with direct
experience working in the organizations, many organizations may consider winning a spot on these
respectable, celebrated, and well-publicized best employer lists, especially if it occurs year after
year, as one effective means to create and maintain their reputation as a distinguishably great
place to work. Ultimately, a best employer is an organization that is already accepted as the
employer of choice by its existing employees, so when an organization builds and maintains a
reputation as being a best employer, it is also simultaneously building and maintaining a reputation
as being an employer of choice.
In the study of employer branding, there would be strong value in understanding the strategies
that these best employers might have used, challenges they might have overcome, and processes
they might have engaged to become and remain an employer of choice.
Some research has shown that an organization’s good reputation as a best employer or an
employer of choice plays a role in attracting not just more but also a higher quality workforce
(Fombrun and Shanley, 1990; Rindova et al. 2005). A sustained reputation as a best employer or
an employer of choice would also be a source of competitive advantage when it comes to
establishing good public relations, enhancing positive corporate/customer image (Ainspan et al.,
2001; Lenaghan & Eisner, 2005), and ultimately leveraging these positive effects to secure more
business opportunities and achieve other sustainable business results (Hewitt, 2004; Manpower
Inc., 2009b, p. 2). There is also some evidence that best employers are able to yield better

21
financial performance than their ‘non-recognized’ employer counterparts (Fulmer et al., 2003;
Hewitt, 2004).
With all the perceived advantages, it is not surprising that some organizations would consider
achieving the best employer or employer of choice recognition as an intentional business objective
(Ashby & Pell, 2001). However, initiatives to achieve this recognition could cost as high as US$50
million in advertising and promotional activities alone (Walsh, 2001). It would also require a
significant investment of human effort and time to coordinate materials and activities for the
selection process (Lenaghan & Eisner, 2005). If an organization attempts to improve its chances of
being recognized by enhancing or changing its existing human capital management programs,
more direct as well as indirect human and financial costs will be incurred.
In the end, is the financial and human investment justified when it comes to producing better
employee and organizational performance? Can an employer of choice expect a higher level of
performance from all or a majority of their employees? How do their results compare to those
organizations that have never been recognized as an employer of choice? Such questions have yet
to be answered.
Phil Rosenzweig (2007i, 2007ii) has cautioned against the issue of ‘Halo Effect’ which was
described by psychologist, Edward Thorndike (1920), as the tendency to make specific inferences
on the basis of a general impression. Professor Rosenzweig asserts that there is tendency for the
public and critics alike to perceive an organization’s specific strategy, leadership, culture, and so on
based on their overall impression of its economic and market performance. In short, when an
organization achieves economic and market success, we perceive it to have great strategy,
leadership, culture, and so on and when an organization experiences financial failure, we perceive
it to have poor strategy, leadership, culture, and so on. To emphasize his point, Rosenzweig
(2007i) offered examples of organizations such as Cisco Systems, ABB, General Motors, and Dell
(2007ii), that were first hailed as having great strategy, leadership, culture, non-monetary
capabilities, etc. when they were posting great financial returns and later, the same organizations
were criticized for having poor strategy, leadership, culture, non-monetary capabilities, etc. when
their financial and market performance declined - even when their strategy, leadership, culture,
non-monetary capabilities, etc. improved or remained relatively unchanged. His conclusion is that
ambiguous and hard-to-define items such as strategy, leadership, culture, etc. which we deem to
be drivers (contributions) of a company’s strong financial performance are in fact results
(attributions) of the company’s strong financial performance (2007i, p. 79 and 2007ii p. 8).
Rosenzweig’s opinion is that when one conducts a research by first gathering a list “successful”
organizations (which he specified as organizations that have outperformed the market, 2007i, p.
81) and then tries to determine what traits, principles, or formulas they share in common that
would result in them being successful, one is using data contaminated by halo effect. The primary
flaw, according to Rosenzweig (2009), lies in researchers interpreting data that are shaped by an

22
organization’s single known performance as data that drives the organization’s overall enduring
performance and reporting it as such in their research findings.
On the surface, this doctoral study appears to be gathering and analyzing its data in the same
manner as those studies criticized by Rosenzweig. After all, this study did collect draw data from a
list of “successful” organizations. However, based on Rosenzweig’s explanation of what constitutes
contaminated data, one could argue that the situation in this study is not the same and that its
data does not fit Rosenzweig’s interpretation of contaminated data.
First of all, this study did not seek and find the best employers from a list of market leaders,
financial leaders, or a list of generally successful organizations as was done by the studies
highlighted by Rosenzweig.
Secondly, based on Joo’s and McLean’s (2006) explanation below of the aim of best employer
competitions, these organizations were labeled as successful only and specifically for their ability to
offer and deliver on the types of employer branding practices and provisions examined by this
study.
Joo and McLean (2006) quoted in their article, Best employer studies: A conceptual model from a
literature review and a case study, that best employer studies (such as Mediacorp Inc.’s Canada’s
Top 100 Employers and Aon Hewitt’s 50 Best Employers In Canada) “aims at identifying employers
of choice from voluntarily participating organizations for the purpose of employer branding, using
tools such as human resource practices inventory and employee opinion surveys that are geared
toward measuring employees’ perceptions of human resource practices, culture, leadership,
personal and professional growth opportunities, pride in work and/or company, fairness, work-life
integration, compensation (pay/benefits), and so on” (pg. 234).
In short, these organizations’ employer branding provisions and practices contributed to their
employer branding success and achievement as best employers and employers of choice.
Thirdly, evidence on these organizations’ employer branding practices and provisions were
collected and put through the initial examination and verification in the best employer competitions
before they were labeled as successful in this specific area. They were named best employers and
employers of choice only after their employer branding practices and provisions had been
investigated, corroborated and verified through multiple means as being in place as claimed, and
as having higher quantity and/or quality than those of the thousands of other contenders. One key
aspect of employer branding is the offer and fulfillment of employment value propositions by an
employer. In this study, data on employer branding practices were gathered from organizations
that had been 1) confirmed by the majority of their employees as being organizations that did
provide or deliver on the identified employment values and 2) verified as having in place a higher
number and/or level (compared to thousands of other organizations in the competition) of

23
employment provisions desired by employees and used by employees to gauge the organization’s
potential as their employer of choice. Types of organizations that scored high and recognized as
best employers were diverse, with some being non-profit organizations, government entities, small
organizations, or organizations that few have heard of in the world of business.
Essentially, the doctoral study proceeded to a second level of investigation by taking the data from
these organizations that had been verified for their employer branding success and assessing
whether such successful employer branding practices and provisions would have any influence on
employee performance.
Rosenzweig’s concern is with studies that took organizations that were first known to be a financial
and/or market success and then attempted to identify universally applicable, non-financial
performance-specific formulas, principles, or traits that these organizations shared, which the
researchers then concluded and declared without sufficient evidence and measures, to have
contributed to the organizations’ successful financial or market performance.
Another important distinction between this study and those identified by Rosenzweig is the fact
that there was no pre-assumption made by the researcher that just because these employers had
more superior employer branding practices and provisions, their employees would perform at a
high level in general or at a higher level than those of organizations that were not considered as
best employers. In fact, the uncertainty and interest in finding out whether deemed-successful
employer brand practices have any noticeable influence on employee performance was the
instigator and basis of this doctoral investigation.
While the general assertion of the positive relationship between employer branding and employee
performance has been consistent, the empirical studies and evidence for this have been noticeably
lacking. Hence, in addition to examining how best employers brand themselves as employers of
choice, there is an even more important need to explore if and what performance enhancing
factors might be present in their employer branding efforts, and how these factors actually
influence employee performance.
The differences in the situation of this study as well as in how the sources of the data and the data
itself were treated would reduce the possibility of this study being contaminated by halo effect.
There are, however, other issues brought forward by Rosenzweig that would prompt questions on
the long-term merit and/or value of findings on drivers of organizational performance. Such issues
include the predictability of performance strategies or formulas and the notion of enduring success.
In other words, can the employer branding strategies and practices of the best employers in this
study be transferred and used in other organizations to achieve the same level of employer
branding performance? If so, can enduring employer branding success be ensured if the strategies
and practices be continually applied by these other organizations? These questions are further
explored in the Discussions and Conclusions chapter (Chapter 7) of this dissertation.

24
As this study focuses its investigation on only one type of employer, “best employers”, it has taken
into account the matter of one-direction bias as data errors would not be randomly distributed but
rather would be systematically in one direction. However, this does not mean that results found
would not be meaningful or valid but rather could be limited to the situation of this type of
employer.
As a whole, no clear indication was found in extant literature on whether best or non-best
employers should be researched for the subject of employer branding. Arguments can be made for
the investigation of random organizations, organizations that have been identified as undesirable
employers, pairs of deemed-opposite employers, organizations in a specific sector, or any other
combinations. Ultimately, there are many options as there are many types and sizes of employers
still unexamined in the field of employer branding. This doctoral research will highlight and try to
put together some pieces of the large employer branding puzzle by first comparing the elements
used by recognized best-employers and those that have not been recognized as such. Then, it will
take an in-depth look at how a deemed best-of-the-best employer brands itself as well as attempts
to influence employee performance through its employer branding practices. It is recognized that
there are many more pieces to the employer branding puzzle and that more research involving
many other types of organizations as well as many other dimensions of employer branding would
be needed in order to gain a complete picture of employer branding and its relationship with
employee or organizational performance.
Future research to determine whether there is significant difference in employee performance of
best employers versus those of non-best employers as influenced by employer branding activities
would certainly clarify many more questions and add further to the knowledge in this critical area
of employer branding.
Organization of Dissertation
This dissertation is divided into 7 chapters:
Chapter 1: This chapter offers an overview of the research problem, the factors that have
contributed to the heavy interest in employer branding, the lack of research and empirical
knowledge on the relationship between employer branding and employee performance, and the
rationales for why this is a relevant and important issue for further research. This chapter will also
outline the research objectives and questions. In addition, it will introduce the fact that the study
intends to look at the employer branding practices of one of Canada’s deemed best-of-the-best
employers and offer rationales for doing so.

25
Chapter 2: This chapter is divided into two parts. Part one presents literature and research on the
subject of employer branding, starting with definitions, followed by the processes of employer
branding, particularly in terms of employer brand promise fulfilment. The review then proceeds
with examining some key research that currently exists and issues still outstanding for further
investigation, with an emphasis on the relationship between employer branding and employee
performance. Part two of the chapter presents literature and research on the subject of employee
performance, starting with definitions and dimensions of employee performance followed by a
review of the performance mediator of engagement, how it affects employee performance, and
how it employer branding and employee performance together.
Chapter 3: This chapter will present a small-scale pilot study that was conducted to explore if and
what difference exists in the employment benefits and other possible elements used in the
employer branding efforts of seven recognized best-employers in Canada and those of eight
employers that have never been recognized as best employers. The pilot study also examines the
employment benefits and other possible organization-oriented elements used by organizations to
enhance expected employee behaviours.
Chapter 4: This chapter outlines the objectives of the main doctoral research and explains the case
method chosen for the research. It also offers a profile of the chosen case organization and an
explanation of how the case was selected. It proceeds to identify and explain the design and
facilitation of each data collection tool and exercise, which consists of materials review, managers
interview and employee survey. Explanations on qualitative and quantitative data analysis as well
as steps to enhance validities are also included in this chapter.
Chapter 5: This chapter presents the results, analysis, and discussion of the qualitative component
as well as a small portion of the quantitative component of the research. The focus of the
investigation is on examining the possible performance enhancement factors that are present in
the case organization’s employer branding efforts. More specifically, the study explores the
presence of these factors within the content of employment benefits offered as well as within the
process of fulfilling these promised employment benefits. From the qualitative analysis, five
themes for performance enhancement factors emerged within the content of employment benefits
offered and three themes emerged within the process of fulfilling these promised employment
benefits. The chapter also explores the challenges experienced by the case-organization in its
efforts to fulfill these promised employment benefits.
Chapter 6: This chapter presents the results, analysis, and discussion of the quantitative
component of the study. The focus of the investigation is on exploring the relationship between
employer branding and employee job performance, and more specifically between employees’
perceived level of employer brand promises fulfilment by the employer and their reported level of
organizational citizenship and task performances. Also examined were the relationships between
employees’ perceived level of employer brand promises fulfillment and their perception of 1) the

26
distinctness and desirability of their employment experience, 2) whether the organization is a great
place to work, 3) whether they would be happy to spend the rest of their career at the
organization and 4) the frequency of their consideration of leaving the organization. Analyses
includes looking at the performance results from the fulfilment of different clusters of employment
benefits. Differences are present in the results of these clusters and groups. The chapter ends with
a discussion of the quantitative results found.
Chapter 7: This is the final chapter and it presents a discussion and conclusion of the findings and
discusses the implications for practice as well as the contribution to both practical application and
knowledge and theory building. The chapter also discusses some of the limitations of study. This
chapter ends with recommendations for future research.

27
CHAPTER 2: REVIEW OF LITERATURE
Employer Branding: A Still-Evolving Concept
In spite of it being an increasingly influential human capital management approach (CIPD, 2007)
with strong employer buy-in, published academic literature and research on employer branding is
still noticeably limited (Ewing et al. 2002; Backhaus and Tikoo, 2004; Melin, 2005; Lievens, Van
Hoye & Anseel, 2007). There is still a lack of clarity and common understanding among
practitioners and management scholars on the definition (Sullivan, 2007; Martin, 2007), underlying
theoretical foundation/assumptions (Backhaus and Tikoo, 2004; Carrington, 2007; Martin, 2007),
purpose, framework13, elements, processes (Moroko and Uncles, 2005; Sullivan, 2007) and
deliverables of employer branding. Fundamental questions on employer branding that have not
been satisfactorily answered include but are not limited to: How is employer branding supposed to
work in theory or practice (Martin, 2007)? What are all the aspects of workforce management that
employer branding should address? How does it address them? What organizational, people, or
process elements should make up the framework of employer branding? What outcomes can be
expected of employer branding? How are the outcomes measured?
Definitions and Value Propositions of the Employer Brand
Earlier cluster of academic literature on employer brand and branding focused on defining and
conceptualizing the terms ‘employer brand’ and ‘employer branding’ (Ambler and Barrow, 1996;
Ainspan et al., 2001; Ewing et al. 2002; Backhaus and Tikoo, 2004). The most commonly cited
definition for employer brand is the original one provided by Ambler and Barrow (1996) as “the
package of functional, economic, and psychological benefits provided by employment, and
identified with the employing company” (pg. 8). This definition has prompted many further studies
and discussions on the question of what is represented by or inherent in an employer brand.
Since the initial package of offerings or benefits introduced by Ambler and Barrow, other
researchers and scholars have expanded on the descriptions of these offerings as well as added
new types of offerings. The following chart shows some key developments to the original definition
and offerings of the employer brand presented by Ambler and Barrow.
13 Indication lies in the many frameworks that currently exists – e.g. McKenzie and Glynn, 2001; Backhaus and Tikoo, 2004; Mosley, 2004

28
Values/Benefits Contributing Literature and Descriptions
Economic/Instrumental
(Ambler and Barrow, 1996; Backhaus and Tikoo, 2004; Barrow and
Mosley, 2005; Berthon et al., 2005)
o Ambler and Barrow, 1996 (Economic Benefits)
Material or monetary rewards
o Corporate Leadership Council, 1999 in Melin 2005
(Compensation and Benefits)
Salary, external equity, internal equity, bonus, stock
options, retirement contributions, health benefits (pg.
25)
o Lievens and Highhouse, 2003 (Instrumental Attributes)
Pay, bonus, benefits (pg. 80)
o Berthon et al., 2005 (Economic Value)
Above-average salary, attractive overall compensation
package, job security and promotional opportunities
within organization (pgs. 159 & 162).
Functional or
Development and
Application
(Ambler and Barrow, 1996; Barrow and Mosley, 2005; Berthon et
al., 2005)
o Ambler and Barrow, 1996 (Functional Benefits)
Developmental and/or useful activities
o Corporate Leadership Council, 1999 in Melin 2005 (Work
Environment)
Work challenge, cutting edge work, international
mobility, role clarity, project responsibility (pg. 25)
o Berthon et al. 2005 (Developmental and Applications Values)
Developmental Value: recognition/appreciation from
management, feeling of self-worth and confidence (as a
result of working for the org.), a career-enhancing
experience, and a springboard to future employment
(pgs. 161 & 162)

29
Application Value: opportunity to apply what was
learned from school, opportunity to teach others what
one has learned, org. is customer-oriented,
humanitarian organization – gives back to society (pgs.
161 & 162)
Social, Interest or
Psychological Values
(Ambler and Barrow, 1996; Cable and Judge, 1996; Backhaus and
Tikoo, 2004; Barrow and Mosley, 2005; Berthon et al., 2005)
o Ambler and Barrow, 1996 (Psychological Benefits)
Feelings such as belonging, direction and purpose;
general corporate reputation – prestige and standing of
the company; sense of job satisfaction and job security;
elevated personal status, lifestyle, and prospect due to
association with the organization; feeling honoured to
be working for the organization.
o Corporate Leadership Council, 1999 in Melin 2005 (Work
Environment)
Manager quality, co-worker quality, recognition,
empowerment (pg. 25)
o Berthon et al., 2005 (Social and Interest Values)
Interest Value: an exciting work environment, novel
work practices / forward thinking, org. values and
makes use of its employee’s creativity (to produce
innovative and high-quality products and services), org.
produces high quality as well as innovative products
and services, working in an exciting environment (pgs.
159 & 160)
Social Value: good working relationship with colleagues,
good working relationship with superiors, supportive
and encouraging colleagues, fun and happy working
environment, a team atmosphere (pgs. 159 & 160).
Symbolic
o Ambler and Barrow, 1996
Employer brand personality
o Cable and Judge, 1996 (Symbolic)
Self-identity fit

30
o Corporate Leadership Council, 1999 in Melin 2005 (Company
Brand Strength)
Reputation (pg. 25)
o Lievens and Highhouse, 2003 (Symbolic Attributes)
Self-identifiable organizational traits – similarity/fit (pg.
81)
o Backhaus and Tikoo, 2004 (Symbolic)
Prestige of organization, social approval
Work-life
(Barrow and Mosley, 2005; Corporate Leadership Council, 1999 in
Melin, 2005)
Corporate Leadership Council, 1999 in Melin 2005 (Work-life
Balance)
Business travel, location, flex-time, childcare, work
hours, vacation, telecommunication (pg. 25)
Organizational Culture
and Environment
Corporate Leadership Council, 1999 in Melin 2005
(Organizational Culture and Environment)
Senior team quality, development reputation,
technology level, risk-taking environment, company fit,
company size (pg. 25)
Scholars (e.g. Michaels et al., 1997; Backhaus and Tikoo, 2004; Heger, 2007; Rosenthorn, 2009)
have indicated that these offerings represent the organization’s ‘employee value proposition’, a
term used to describe the set of attributes and benefits, like those identified above, that actual and
potential employees perceive they would gain through their employment with a particular
organization (Corporate Leadership Council, 2006). In order to establish a strong and successful
employer brand, however, an organization’s employee value proposition needs to be distinct,
relevant, and compelling (Minchington, 2006; Moroko & Uncles, 2008). Sustained ability to attract
prospective employees as well as retain and engage existing employees is more likely if the value
proposition resonates with employees (Moroko & Uncles, 2008), in response to their own
worldviews, beliefs, priorities and/or needs, as well as uniquely characterizes the employer and
distinguishes it from its competitors (Corporate Leadership Council, 2006). An article entitled
Employee Value Propositions: A Key Marketing Tool for Talent Management, by Brand Learning (no
date) further elaborates on this concept of distinction by asserting that an employee value
proposition “captures the essence of what a company wants to stand for in candidates’ and

31
employees’ minds relative to competing employers” and as such, it is “a vital first step in the
development of a compelling employer brand.” (pg. 1)
Ultimately, it is the organization’s ability to deliver on their employee value proposition that will
form the true employee experience at the organization (Rosenthorn, 2009) as well as the
foundation of the organization’s employer brand image (Corporate Leadership Council, 1999).
Consistent and realistic messaging of those distinct and relevant values as conveyed by the
employer brand coupled with consistent delivery of those values will solidify the organization’s
positive reputation as an employer (Eisenberg et al., 2001; Corporate Leadership Council, 2006).
One of the recent definitions of employer brand presented by Martin, Golan, and Grigg (2011)
reflects a similar understanding of the notion above. They describe the employer brand as “a
generalised recognition for being known among key stakeholders for providing a high quality
employment experience, and a distinctive organisational identity which employees value, engage
with and feel confident and happy to promote to others.”
Scholars’ and subscribers’ interest in gaining a deeper understanding of how to effectively convey
and deliver on the employee value proposition to create a unique and engaging work experience
for employees has expanded research in this domain from the initial discovery and categorization
of the contents of employer brand to now include the exploration of the mechanisms of employer
branding.
Definitions, Components, and Process of Employer Branding
In a most fundamental sense, employer branding differs from employer brand in that it refers to
elements, methods, and processes to: 1) develop compelling and relevant value proposition, 2) the
value proposition to employees and targeted job seekers, and 3) on the value proposition made
(Backhaus and Tikoo’s, 2004). Such elements, methods, and processes may be similar to or
directly adapted from those used in marketing, branding, communications, and human resources
management (Martin, Golan, & Grigg, 2011).
Some experts still see employer branding as a “slippery concept” (CIPD, 2007, p 7). Due to the
lack of common consensus on and understanding of the framework, elements, and deliverables for
employer branding, different definitional emphases, models, and formulations can be found for
employer branding (CIPD, 2007). There is no single consistently cited or used definition, although
some more commonly referred to include Lloyd’s (2002) “sum of a company’s efforts to
communicate to existing and prospective staff that it is a desirable place to work”, Backhaus and
Tikoo’s (2004) “the process of building an identifiable and unique employer identity” and Sullivan’s
(2004) “a targeted, long-term strategy to manage awareness and perceptions of employees,

32
potential employees, and related stakeholders with regards to a particular firm” and more recently,
Martin, Golan, and Grigg’s (2011) “the process by which branding concepts and marketing,
communications and HR techniques are applied to create an employer brand”.
The key difference in definition between employer brand and employer branding appears to be
that employer brand focuses on the content and targeted impact of promised employment values
or offerings while employer branding focuses on the process or aspects related to the process of
establishing, communicating, and delivering the content and targeted impact of promised
employment values or offerings.
Many existing definitions, some from scholars (e.g. Ewing et al., 2002) and mostly from
consultants (Minchington, 2006; CIPD, 2007; Robert Half 2007ii), like Lloyds, focus primarily on the
functions of communication, messaging, and image building (D’Arcy, 2003; Kateon & Macioschek,
2007), with little or no reference to promise delivery.
While there are variations to the definitions, models, and formulations for employer branding, there
are some aspects of employer branding that seem to be quite consistently highlighted in extant
literature. The first being that employer branding is holistic by nature (Ainspan et al., 2001;
Ambler, n.d.; Gaddam, 2008), aimed at creating and maintaining a ‘total work experience’ that is
distinctive and desirable for employees (Ewing et al. 2002; Ruch, 2002; Lloyd, 2002; Mosley, 2004;
Robert Half 2007ii). The second aspect consistently highlighted is the 1) incorporation of the
organization’s core ‘brand essence’ (Mosley, 2004) into relevant work activities and identifiers for
existing employees (Barrow and Mosley, 2005) and 2) alignment of this core brand essence as
experienced internally by employees with the external brand image and/or message that is
disseminated to job seekers and other stakeholders (Ambler and Barrow, 1996; Thorne, 2004;
Martin et al., 2005; Knox & Freeman, 2006; Moroko & Uncles, 2008). An organization’s core brand
essence includes its values, culture (Mosley, 2004; Martin, 2007), and defining attributes that
signify “what it [really] is” and “the way things are done around here [in the organization]”
(Martin, 2007, p. 19). An organization’s core brand essence can be interpreted as its ‘identity’
(Kateon & Macioschek, 2007, p. 24).
Research on Employer Branding
From the introductory definitions and conceptual frameworks, research in the subject expanded to
the exploration of the relationship between employer branding and employee attraction and
retention. Issues examined included: employer and employment features that applicants find
attractive (McKenzie and Glynn, 2001; Berthon et al., 2005); brand equity approach to recruitment
(Collins and Stevens, 2002); comparisons of external and internal employer brand images (Melin,
2005); effects of employer brand image on candidates’ job application intentions and decisions

33
(Collins and Stevens, 2002; Knox and Freeman, 2006), improving recruitment through employer
branding (Kateon & Macioschek, 2007; Bhatnagar & Srivastava, 2008), and employer’s 14
instrumental and symbolic attributes and their importance to applicant attraction and employees
identification with the organization (Lievens & Highhouse, 2003; Lievens, Van Hoye & Anseel,
2007).
The increasing popularity of the employer branding concept has generated more interest and need
to understand other aspects about it (Ainspan et al., 2001) such as environmental change effects
(Backhaus and Tikoo, 2004), cross-cultural effects, post-employment dissonance (Berthon et al.,
2005), integration of cross-functional processes and activities in employer branding efforts
(Backhaus and Tikoo, 2004; Aurand et al. 2005; Moroko & Uncles, 2005), and extending the
employee as customer (McLaren, 2011). One aspect brought forward by a number of employer
branding literature as deserving of attention and further investigation is that of the influence of
employer branding on employee and organizational performance (e.g. Ambler and Barrow, 1996;
Backhaus and Tikoo, 2004; Ogilvie, 2006, McLaren, 2011). In spite of the calls for further
investigation on this aspect, very little relevant academic research has been found on the subject
thus far. There are a couple of studies that are related to, but not directly on, the effects of
employer branding on employee performance. The first by Fulmer, Gerhart, and Scott (2003)
examined the relationship between employees’ sustained positive attitudes towards their
organization (due to it being “a great place to work”) and the organization’s financial
performance15. They compared the results of organizations on the 1998 list of 100 Best Companies
to Work for in America and those in a match comparison group consisting of organizations that are
not on the list. Their results indicate that there is a positive relationship between employee
attitudes and organizational-level financial performance. They found that the organizations on the
Best 100 list both 1) retain stable and positive employee attitudes and 2) maintain a better
financial performance than the organizations of the matched comparison group. These Best 100
organizations outperform the broad market when it comes to cumulative (long-term) returns.
The second by Davies (2007) examined the influence of employer branding on what may be
interpreted as the psychological mediators (differentiation, affinity, satisfaction, and loyalty) of
employee performance. In this case, it reflects management performance as all respondents were
managers. Davies found that satisfaction was predicted by agreeableness and affinity by a
combination of agreeableness and interestingly, ruthlessness, which reflects characteristics such as
aggressiveness, arrogance, and controllingness. Surprisingly, he also found that managers’ sense
of loyalty, job satisfaction or affinity was not influenced by their perception of their organization’s
competence.
14 In this case, it is the Belgian Army. 15 In this case, they are the organizations’ return on assets ratio, market-to-book ratio as well as annual and multiyear cumulative shareholder returns.

34
Yet Unproven Assumptions on the Relationship Between Employer
Branding and Employee Performance
There are some anecdotal reports (such as those presented by Ainspan et al., 2001 and Barrow
and Mosley, 2006) on the positive influence of employer branding on employee performance.
However, these cases are few in number and, more importantly, their positive outcomes are
mainly self-reported by the organizations’ representatives without any/adequate verification
(Martin, 2007). As employer branding consultants continue to sell the ‘stronger commitment -
higher engagement - better performance’ assurance (e.g. Nigel Wright, 2008; Lombardi for
Aberdeen Group, 2009) and many organizations around the globe continue to buy it, management
scholars, researchers, and likely also some current subscribers of employer branding have begun to
question the assumption that employer branding will indeed deliver better results – be it in
recruitment and retention (Moroko & Uncles, 2005), cost savings (Carrington, 2007), or employee
and organizational performance (Martin, 2007; Rosethorn and Mensink, 2007).
There is certainly good rationale for the call and response to investigate in more depth, the
influence of employer branding on employee performance.
The first rationale would be that the assumption of influence does not necessarily equate to the
reality of influence; thus, more unbiased, empirically-base evidence is necessary to offer a clearer
picture of reality. In their paper, Conceptualizing and researching employer branding, Backhaus
and Tikoo (2004) express a view shared by many other scholars and subscribers of employer
branding, and that is, “the practice of employer branding is predicated on the assumption that
human capital brings value to the firm, and through skillful investment in human capital, firm
performance can be enhanced.” (p. 503). Most of the existing employer branding literature (e.g.
Ambler and Barrow, 1996; Ainspan et al., 2001; Backhaus and Tikoo, 2004; Miles and Mangold,
2005; Barrow and Mosley, 2006; Sartain and Schumman, 2006) theorize that employee
performance will be improved with employees’ enhanced sense of satisfaction, commitment, and
engagement developed through effective employer branding. It is worth noting here that the
assumption of a positive relationship between effective employer branding and
employee/organizational performance is indirect rather than direct. Effective employer branding
initiatives might not directly affect employee or organizational performance; rather, they might
affect mediators of employee performance such as satisfaction, commitment, and engagement,
which is assumed to then positively influence employees’ work efforts, behaviours, and overall
performance. Since many also conclude that an organization's performance is the aggregate
attitudes and/or performance of its employees (e.g. Ostroff, 1992; Fulmer, Gerhart, and Scott,
2003), it would be natural to assume that improvement in the performance of the majority of its
employees would strengthen an organization’s performance and competitiveness.
Such assumptions are not surprising as there have been countless discussions and research over
the years in the field of human resource management that support the notions that 1) effective

35
human resource strategies enhance employee performance and productivity as well as
organizational performance, productivity, and competitive advantage (e.g. Milkovich et al.,1988;
Boxall, 1998; Heneman et al., 1989; Priem and Butler, 2001) and 2) strengthened mediators such
as employee satisfaction, commitment, and engagement would yield higher employee performance
(for satisfaction: e.g. Herzberg et al., 1957; Motowidlo, 1984; for general or affective commitment:
e.g. Mowday et al., 1974; Brett et al., 1995; Bauer & Green, 1998; for engagement: Morgan, 2004;
Watson Wyatt, 2008/09). However, one should also not disregard the presence of arguments and
research that offer evidence to the contrary and find that aspects such as higher employer
satisfaction or loyalty do not actually bring about better employee or organizational performance
(for satisfaction: e.g. Iaffaldano and Muchinsky, 1985; Weiss & Cropanzano, 1996; Cote, 1999; for
satisfaction and loyalty: Silvestro, 2002; for general or continuance commitment: Meyer et al.,
1989).
With regard to the specific assumption of the positive influence of employer branding on employee
performance, Martin (2007) questioned the definitiveness of such assumption by pointing out cases
and studies16 that showed a decrease in employee and organizational performance for
organizations that focused on hiring and developing ‘stars’ and on investing in individual human
capital without other complementary capital investments. Martin alludes to the fact that in order to
yield strong employee and organizational performance, much more is involved than just acquiring
great employees.
Should we accept the assumption that effective employer branding would strengthen employee
performance through the enhancement of performance mediators such as satisfaction,
commitment, and engagement, the questions of what effective employer branding looks like in
practice and how it actually strengthens these mediators remain unclear. What conditions or
factors need to exist in employer branding to enable it to consistently attract its targeted job
candidates as well as successfully foster employee satisfaction, commitment, and engagement? If
employers offer many types of employment benefits or a higher degree of specific kinds of
benefits, would that be enough to make it happen or would some other factors need to exist in the
materialization of these employment benefits before they could effect change? Are these factors or
conditions generalizable or organization-specific? What sort of challenges can an organization
anticipate? Such questions are unanswered and should obviously be explored.
Another rationale for investigating the relationship between employer branding and employee
performance would be the essential need to clarify the ultimate deliverable of employer branding.
As indicated in an earlier chapter of this dissertation, most existing employer branding studies and
literature (e.g. McKenzie and Glynn, 2001; Berthon et al., 2005) focus quite exclusively on the end
goal of job seeker attraction and employee retention.
16 Martin provided examples of Enron and two unnamed studies.

36
The lack of consensus and common understanding of the end goal of employer branding can be
partly attributable to the origin of the term of “employer branding”. While employer branding is
intended to be a human resource management concept, it did not originate from the field of
Human Resource Management. Instead, it is a creative transfer of knowledge and application from
the field of Marketing-Branding (Backhaus and Tikoo, 2004; Berthon et al., 2005) to address
contemporary human resource management issues. Since the knowledge and application is
transferred from another field, one may argue that there is inadequate understanding of the
intricate and interrelated nature of the human resource functions and of their linkages to
marketing activities such as brand building and reputation management (Kateon and Macioschek,
2007, pg. 16). One can also speculate that there is a difference in interpretation between
Marketing-Branding experts and Human Resource Management experts on who or what the
employee is to an organization and on how the employee affects his/her organization’s bottom line.
Is the employee the end target or a mean to the end target?
When it comes to the enhancement of corporate performance and bottom line, can an employee
be seen as the same as a customer? According to the Compact Oxford English Dictionary
(AskOxford, 2008), a ‘customer’ is “a person who buys goods or services from a shop or business”.
One may conclude from this definition that an organization’s newly attracted customers are those
that have just bought from the organization, and its retained customers are those that continue to
buy (repeat purchases) from the organization (Stone & Liyanearachchi, 2007). When a person
buys a product or service from an organization, the organization from which the purchase is made
will automatically experience an improvement in its sales and revenue performance, and possibly
also some other measures of performance. On a basic level, customers are automatic and
confirmed contributors to corporate bottom line. Hence, when an organization is successful in
attracting new customers and retaining existing customers, it is also successful, without exerting
any additional effort, in increasing revenue and sales performance. As such, organizations can
reasonably expect to address the issue of performance (at least for revenue and sales
performance) by addressing the issue of customer attraction or retention. The resources from the
improvement of this major performance will then enable the organization to address other
resource-demanding concerns and performances.
If one concludes that customer retention will improve an organization’s sales performance and
financial success (Storbacka et al 1994; Reichheld 1996), one may assume that the same
conclusion can be applied to employee retention – that it will ultimately improve organizational
performance and competiveness. With deeper observation, however, one may realize that while
retained customers can literally translate to better performance for an organization (repeat
purchases over an extended period of time equates to better revenue and sales performance), the
same cannot be said about retained employees. When a person is employed by a company, the
company at which the employment is activated will not automatically experience an improvement
in its sales or other performances. That is because there are many personal (e.g. health and family
issues, personal motivation, etc.), professional (e.g. skills and knowledge issues), and

37
organizational (e.g. systems and leadership issues) inhibitors that can negatively affect an
employee’s performance in spite of his/her successful retention. Hence, when an organization is
successful in attracting new employees and retaining existing employees, it is not necessarily also
successful, without exerting any additional effort, in increasing revenue, sales, or other
performance. As such, organizations cannot expect to address the issue of performance by simply
addressing the issue of employee attraction or retention. Organizations that wish to address the
aspect of employee and organizational performance need to do so in addition to addressing the
aspect of recruitment and retention.
Employee Performance
Definitions and Dimensions of Task and Organizational Citizenship
Performances
Quite a few definitions exist for employee job performance (e.g. Campbell, 1990; Deadrick &
Gardner, 2000; Viswesvaran & Ones, 2000). For the purpose of this research, job performance is
defined as measurable17 actions and behaviours that are within employees’ control, in which they
engage, and that are linked with, contribute to, or detract from organizational goals and their
attainment (Viswesvaran & Ones, 2000, p. 216; Rotundo & Sackett, 2002, p. 66). Many existing
job performance discussions and research (e.g. Poropat, 2002; Parker, 2008) have been predicated
on these definitional pillars. In addition to the multiple descriptions to define job performance are
the many dimensions18 to categorize and measure job performance. However, in spite of the many
dimensions that exist, there is a commonly held view (e.g. Viswesvaran & Ones, 2000; Rotundo &
Sackett, 2002; Halldorsson, 2008) that job performance can actually be categorized in three broad
dimensions that are generalizable across jobs and industries. They are task performance,
citizenship performance, and counterproductive performance.
Borman and Motowidlo (1997) defined ‘task performance’ as the “effectiveness with which job
incumbents perform activities that contribute to the organization’s technical core either directly by
implementing a part of its technological process19, or indirectly by providing it with needed
materials or services20” (p. 99). Williams and Anderson (1991) described it as in-role performance
where employees perform the required duties and responsibilities of his/her job description.
Task-performance is role-prescribed and may vary from job to job (Motowidlo & Van Scotter,
1994). As such, this research will not assess employees’ job-specific behaviours; rather, it will
assess employees’ perception of their job task performance.
17 E.g. observable, scorable, etc. (Poropat, 2002) 18 See Viswesvaran & Ones, 2000, and Rotundo & Sackett, 2002, for the list and descriptions of different job dimensions. 19 According to Motowidlo and Van Scotter (1994, p. 476), this involves transforming raw materials into goods and services in which the organization specializes: e.g. selling, machine operation, teaching, counter-service, etc. 20 According to Poropat (2002), this involves activities which support the core: e.g. supply, planning & coordination, maintenance, development.

38
In contrast to task performance is citizenship performance (Borman et al., 2001). Formerly known
as contextual performance (Borman & Motowidlo, 1993), this dimension involves what Motowidlo &
Van Scotter (1994) described as behaviours and activities that “support the organizational, social,
and psychological environment within which the technical core of the organization must function”
(p. 476). It is seen as extra-role performance, undertaken at the employee’s discretion, outside of
one’s formal job requirements (George and Brief, 1992). It is interpret by many as “going the extra
mile” or “above and beyond what is required in one’s job”.
According to Poropat (2002), citizenship behaviours and activities are common to most if not all
jobs. They may or may not be role-prescribed and may or may not be rewarded by the
organization (Schmidt, 1993; Organ, 1997) but they do, according to evidence, contribute
meaningfully to organizational effectiveness (George & Bettenhausen, 1990; Podsakoff &
Mackenzie, 1994; Organ, 1997; Borman et al., 2001).
Almost thirty (30) behavioural categories have been introduced by various scholars21 for citizenship
related performance; however, there is a great deal of conceptual overlap between these
categories (Podsakoff et al., 2000, p. 516). Podsakoff et al., (2000) organized these categories into
seven common themes: (1) Helping Behavior, (2) Sportsmanship, (3) Organizational Loyalty, (4)
Organizational Compliance, (5) Individual Initiative, (6) Civic Virtue, and (7) Self Development. The
original five (5) categories22 established by Borman & Motowidlo (1993) specifically for
contextual/citizenship performances are included in these seven (7) categorical themes established
by Podsakoff et al. It is argued that citizenship performance is of particular importance for
customer-contact employees and employees in a service-producing organization (Bettencourt &
Brown, 1997) due to the very reasons outlined in the Rationale for choosing an employer from the
service sector paragraph of this paper.
Managers have reported to take both types of performances into consideration when assessing
employees (Orr et al., 1989; Van Scotter et al., 2000). As a whole, it is both necessary and prudent
to examine both dimensions of performance in one’s attempt to understand the influences of
employee performance. This doctoral research have attempted to do just that.
21 See Podsakoff et al. (2000) for the list of scholars and descriptions of different behavioural categories. 22 The five (5) contextual/citizenship performance categories are: (a) volunteering to carry out task activities that are not
formally part of the job; (b) persisting with extra enthusiasm when necessary to complete own task activities successfully;
(c) helping and cooperating with others; (d) following organizational rules and procedures even when it is personally
inconvenient; and (e) endorsing, supporting, and defending organizational objectives.

39
Employee Engagement: Linking Employer Branding with Employee
Performance
Many studies over the years have highlighted the positive relationship between employee
performance, particularly organizational citizenship performance, and deemed mediators and
predictors of performance such as satisfaction and commitment (e.g. William and Anderson, 1991;
Moorman et al., 1993; Organ and Ryan, 1995; Biswas, 2011). In recent years, attention has shifted
to the relationship between employee engagement and both employee and organizational
performance (Medlin and Green, 2008; Markos and Sridevi, 2010; Rashid et al., 2011) as it is
considered as the much more superior predictor of employee performance (Erickson, 2005; Heger
2007). Research has consistently shown that engaged employees are more productive in various
aspects (Richman, 2006; Harter et al., 2002; Shuck and Wollard, 2010)
The shift in interest and focus from employee satisfaction and/or commitment to employee
engagement as a mediator and predictor of employee performance appears to be grounded on the
notion that: 1) criteria of engagement not only includes the presence of both satisfaction and
commitment but it also includes the presence of actual effort from employees to help their
organization succeed, and 2) it is a two-way mutual process between the employee and the
organization (Rafferty et al, 2005) whereas satisfaction and commitment could be a one-way
process.
Researchers (Kahn, 1990; Erickson, 2005; Fernandez, 2007; Heger, 2007) argued that satisfaction
is not a sufficiently strong predictor of performance. While one may gain confirmation of
employees’ perception of their work experience and level of needs fulfillment through the measure
of their satisfaction, it in no way gives us insight into if and how they apply themselves
intellectually and emotional in their daily work or in their efforts to advance the organization. Heger
(2007) gave an example of the New Employer/Employee Equation Study which found that “while
45 percent of employees feel satisfied with their jobs, fewer of them are engaged. In particular,
only 31 percent feel that their employer inspires the best in them, still fewer (20 percent) feel
passionate about their jobs, and less than 15 percent feel energized by their work” (p. 122).
Engagement, on the hand, goes beyond employees’ satisfaction with what they experience or
receive at their place of employment. It is, according to Erickson (2005), “about passion and
commitment - the willingness to invest oneself and expand one’s discretionary effort to help the
employer succeed” (p. 14). As the emphasis is employees’ discretionary effort, recent research has
not surprisingly included the presence of organizational citizenship behaviours as part of employee
engagement.
Like employer branding, there are varying versions of definitions for employee engagement,
though as a whole, researchers appear agree with Kahn’s (1990) characterization of employee
engagement as involving the interplay of three dimensions or measures: physical (energy),
cognitive (absorption), and emotional (dedication). Hence, when employees are engaged, they
40
gain fulfillment by expressing themselves physically, cognitively, as well as emotionally in their
work and in their place of work (May et. al., 2004). With these elements taken into consideration,
The Conference Board (2006) offered a composite definition of employee engagement as “a
heightened emotional and intellectual connection that an employee has for his/her job,
organization, manager, or co-workers that, in turn, influences him/her to apply additional
discretionary effort to his/her work.” (p. 5).
Robinson et al. (2004) went further and asserted a view shared by other researchers,
“The organization must develop and nurture engagement, which is a two-way relationship between
employer and employee" (p. 2). The two-way relation eludes to the fact that when an employer
effectively engages its employees, its employees reciprocate by exerting extra discretionary effort
to build the organization’s success.
One aspect of employee engagement that is still encountering much debate and no consensus is
that of how it is measured (Meyer and Gagne, 2008; Newman and Harrison, 2008). Some more
commonly used measures include employees’ intention to remain with the organization, pride for
being associated with the organization, satisfaction, and the highly popular engagement conditions
introduced by Gallup in their Gallup Q12 Workplace Audit (See Appendix 5), which has been
administered to 22 million employees in 189 countries (Harter et. al, 2013).
Another aspect that has received more consensus among researchers are some of the main drivers
of employee engagement. Most of them are non-monetary in nature, as listed below:
Sustained opportunities to develop and grow professional and intellectually – which would
include but are not limited to career opportunities, challenging work, proper training
(Towers Perrin, 2003; Penna Research, 2007; Markos and Sridevi, 2010)
Supportive work relationships, teamwork, and collaborations (May et. al, 2004; Penna
Research, 2007)
Relationship with supervisor and organization – psychologically safe (Kahn, 1990), trusting,
and supportive (May et. al, 2004; Olivier and Rothmann, 2007)
Being valued and involved in decision making (Tower Perrin, 2003; Institute of
Employment Studies in Robinson et al., 2004)
Psychological meaningfulness - alignment of own values/goals and work values/goals,
significance and purposefulness of task (May et. al, 2004; Rothmann and Rothmann) and
how individual contribution impacts organizational performance (The Conference Board,
2006)

41
Presence of necessary and adequate physical, emotional and cognitive resources to do
work (Tower Perrin, 2003; Olivier and Rothmann, 2007; Markos and Sridevi, 2010)
Pride about the organization – improved self-esteem from being associated with his/her
company (Tower Perrin, 2003; The Conference Board, 2006)
Clarity in performance expectations (Mone et. al, 2011)
Overall perceived organizational support (Saks, 2006) – such as “having access to useful
training on the job, providing rewards, considering the goals and values of employees,
showing concern for employees, caring about the employees’ opinions, being willing to
help the employees when they experience problems, and not taking advantage of them”
(Rothmann and Welsh, 2013, p. 17-18)
Recent studies on employer branding have highlighted the significance of employee engagement
as a mediator and predictor of both employer branding effectiveness and enhanced employee
performance. Moroko (2009) found in her research on the characteristics of successful employer
brands that high level of employee engagement, combined with a low level of unplanned turnover,
reflected employees’ conclusion that their employment experience is desirable and their
psychological contract is fulfilled (p. 51). Moroko further concluded that employees’ engagement
deteriorates when their organizations’ fail to deliver on its functional and psychological benefits.
In his research on espoused and experienced employer brand congruency, McLaren (2011) offered
evidence to show that employer brand gap negatively affected the level of employees’ engagement
and that reducing the gap between espoused and experienced employer brand would increase
employee engagement. Both researchers also highlighted, as have many other researchers (see
former paragraphs), the role of employee engagement in mediating and predicting employee
performance as well as organizational performance.
Ultimately, this leads to the inference that the improvement of employer branding, particularly in
employer brand promise fulfillment, would increase engagement and increasing engagement would
then improve employee as well as organizational performance.
Verifying employee engagement in this doctoral research
The quantitative component of this doctoral research would verify the influence of brand promise
fulfillment on employees’ organizational citizenship and task performances rather than on a
predictor of performance such as employee engagement. However, as employee engagement also
consists of the presences of some organizational citizenship behaviours, particularly those reflective
of organizational loyalty, individual initiative, and helping others (Markos and Sridevi, 2010), the
quantitative investigation would in fact verify the influence of brand promise fulfillment on both

42
performance and engagement, as they relate to these organizational citizenship performance
behaviours.
As the qualitative component of the doctoral research would identify the case organization’s key
employer brand promises as well as examine the intricate nature of employer brand promise
fulfillment and how employee performance might be influenced, it would offer a clear indication on
whether drivers of employee engagement as identified in list above were in fact present in the
organization. The presence or absence of these employee engagement drivers could possibly
explain some of the outcomes of the quantitative results.

43
CHAPTER 3: PILOT STUDY
Prior to undertaking a more substantial investigation on the relationship between employer
branding and employee performance, a small scale exploratory pilot study was conducted to
identify the employment benefits and other possible elements used in the employer branding
efforts of some of Canada’s recognized best employers and employers that have never been
recognized as best employers. The study also examined the types of employment benefits used by
these best and non-best employers to enhance expected employee behaviours.
In spite of the fact that scholars and consultants have offered us various definitions on the term
employer branding, we do not have much empirical information on how most professionals
responsible for developing and executing the employer branding strategies within their respective
organizations actually interpret or define the term employer branding. Some may not even
recognize the term. How they interpret or define employer branding would directly influence what
they would include in terms of employer branding objectives, activities, and targeted deliverables
within their organizations. As well, while there have been studies on the types of employment
benefits offered by specific organizations, little empirical evidence can be found on what
employment benefits or other possible elements are actually employed by most employers and
whether there are any similarities or differences between those used by recognized best employers
and those used by employers that have never been recognized as best employers.
Do best employers offer more or different types of employment benefits to their employees
compared to non-best employers? Do best employers use other elements aside from employment
benefits? If these two groups of employers are found to be providing primarily the same types of
employment offerings or applying primarily the same forms of employer branding elements, what
could have made a difference that would result in a group of employers being recognized as best
employers (or more specifically related to employer branding – being employers of choice) while
the other group was not? These questions have not been adequately answered by existing studies.
A number of studies, as identified in Chapter 1, have already been conducted on the types or
categories of employment benefits provided or could be provided by employers. Some also
identified what candidates find appealing and seek out in employers. What is unclear is whether
such employment benefits, once adopted, are enough to enable an employer to create a desired
and unique experience for its employees, distinguish itself from other employers as an employer of
choice or best employer, and shape targeted work behaviours? What would happen when,
hypothetically, all competing employers in an industry adopt these employment offerings? Would
their distinguishing characteristics or abilities diminish? If so, would employees’ performance be
affected? Much is still not known about the specific employer branding factors or configuration of
factors that solidify an employer’s uniqueness and sustainability as an employer of choice as well
as enhance their employees’ performance.

44
While an organization’s competitive advantage is increasingly reliant on the presence of a stable
and superior workforce (Herman and Gioia, 2001), the inhibitive issue of recruitment and retention
of the right, best, or perfect fit employees to produce this competitive advantage remains in the
forefront of organizational concerns. With that, the well-hyped idea of employer branding as a
solution continues to become more mainstream among organizations of all shapes and sizes across
various industries. More consultants (Minchington, 2006) are emerging to offer prescriptions and
services to organizations on the development of their employer brands and more employers are
either starting or continuing to place valuable and finite resources into their employer branding
efforts.
It is likely that effective employer branding is not gained through any one-size-fits-all set of
employment offerings or employer branding approach due to the many differences that exist in a
multitude of organizational aspects that may influence an organization’s employer branding efforts.
These include but are certainly not limited to organizational culture, structure, leadership, and
resources. As such, it is not only for theoretical interest but also for real-world necessity to
investigate the specific factors of employer branding that might enhance an organization’s capacity
to become an employer of choice as well as strengthen its employee and organizational
performance. In practice, such knowledge would offer organizations insight into the intricate
nature of employer branding and the possibly multi-layered hidden as well as obvious factors that
they have to consider and coordinate or integrate into the development and execution of effective
employer branding strategies for their specific organizations. To explore this matter in depth,
multiple investigations of different forms with various organizations would likely be needed.
This small scale pilot study would not be able to clarify all the outstanding questions on what truly
makes an employer an employer of choice or how employer branding may affect employee
performance. However, it is a viable start towards finding answers to what truly makes an
employer a best employer and thus, also an employer of choice. In order to do so, the researcher
sought to uncover how professionals responsible for the employer branding activities within their
organizations actually viewed and defined employer branding. This was followed up with an
exploration of what employment benefits and other possible elements were used in their
organizations’ efforts to deliver their employer branding strategies as well as to enhance expected
employee behaviours. Participation were sought from two groups of professionals, those who, at
the time of the data gathering for this pilot study, were working for best employer organizations
and those who were working for organizations that were not best employers.

45
Pilot Study Objectives and Research Questions
The subject of employer branding, while still possessing many areas that are not fully explored or
confirmed, is not so completely unfamiliar and without any theoretical reference. There are in fact
overlapping theories from Marketing, Communication, Organizational Behaviour, and Human
Resources Management that are in place to explain or predict some of the components,
phenomena, and outcomes of employer branding. As such, the goal of this pilot study was not to
form new theoretical models. However, it was intended to uncover information that could add to
existing knowledge regarding the elements of employer branding and the types of employment
benefits used by organization that were best employers and that were not best employers.
Specifically, the pilot study attempted to answer the following research questions:
1. How do best employers and non-best employers differ in terms of the employment benefits and
other possible elements used in their employer branding efforts?
2. What employment benefits and other possible elements are used by organizations to enhance
expected employee behaviours?
Methodology
This pilot study attempted to uncover common and different themes in the data yielded from
recognized best employers and those yielded from employers that had never been recognized as
best employers. Braun and Clarke (2006) defined a theme as information that “captures something
important about the data in relation to the research question and represents some level of
patterned response or meaning within the data set.” (pg. 82). With the knowledge gained,
hypotheses for further testing could be generated and valuable insight could be derived to serve as
a reference for organizations in their consideration of the employment provisions and elements to
use in their own employer branding strategies. In order to achieve these goals, this pilot study
employed an exploratory qualitative investigation using the approach of thematic analysis.
Braun and Clarke (2006) described thematic analysis as a method for “identifying, analysing, and
reporting patterns (themes) within data.” (pg. 79). Guest, Namey and Mitchell (2013) further
explained the process of thematic analysis as consisting of “reading through textual data,
identifying themes in the data, coding those themes, and then interpreting the structure and
content of the themes.” (pg. 13). Such data could come in texts of different forms and lengths,
from a single-word response to an open-ended question on a survey to an interview transcript
consisting of many thousands of words (Guest, MacQueen, & Namey, 2012). The ultimate priority
was to present research participants’ stories and experiences thoroughly and accurately regardless
of the theoretical and methodological perspectives from which the method might have drawn

46
(Guest et al., 2012, pg. 15–16). In this pilot study, data for analysis was gathered from an expert
sample using the method of structured electronic and telephone interviews.
Unlike Grounded Theory that has a prescribed end goal of forming and presenting theoretical
models from the analysis of the data, the output of data analysis from the thematic analysis
approach is not confined to such a requirement (Braun and Clarke, 2006). Output may be used to
build theoretical models or to generate some specific hypotheses for testing or to provide
evidence-based reference or recommendations for the development of organizational policies and
programs (Guest et al., 2013). As such, it is appropriate for the purpose of this small-scale pilot
study.
Sample Selection
An expert sample consisting of human resources management professionals, marketing and
communications management professionals, and general or operational management professionals
who had direct knowledge and/or experience in developing and/or implementing the employer
branding measures in their existing and former organizations were sought for participation in
electronic and telephone interviews.
Expert samples have been used in past research to gain valuable insights for the advancement of
knowledge and development of new theories (Grove et al., 2003; Melewar & Karaosmanoglu,
2006) and it makes logical sense that in a preliminary investigation to answer an exploratory
research question as the one that is presented in this pilot study, perspectives be first gained from
people who know the matter or phenomenon the best, as they have been part of the creation and
materialization of the matter or phenomenon. In the case of employer branding, individuals who
had no direct knowledge and/or experience in developing and/or implementing the employer
branding measures within their organizations might not have sufficient awareness of all the
employment benefits provided by their organizations or sufficient understanding of all the elements
employed by their organizations in their employer branding efforts. In short, these individuals have
a higher likelihood of not being able to provide as comprehensive and as accurate an account of
their organizations’ employer branding strategies and initiatives compared to the individuals with
knowledge or direct experience in developing and/or implementing their organizations’ employer
branding measures. Practitioners with different functional expertise were sought in the hope that
this would offer a more well-rounded, multi-angled insight into the matters being investigated.
The researcher sought out personnel from two groups of employers. The first group consisted of
employers that had been publicly recognized as either one of Canada’s Top 100 Employers as
compiled and presented by Mediacorp Canada Inc. or one of 50 Best Employers In Canada as
compiled and presented by Aon Hewitt (formerly Hewitt Associates) and Maclean’s. To allow for a

47
more objective comparison of information as well as to increase the opportunity for new insight,
sample was also drawn from a second group of employers that had never won any best employer
awards and had never been recognized by Mediacorp Canada Inc. or Aon Hewitt as one of
Canada’s or any other country’s top or best employers.
The targeted sample size for this pilot study was set at 12 functional experts, with six from each
group of employers - consisting of two human resource management professionals, two
marketing/communication management professionals, and two general/operational management
professionals.
Even though “theoretical saturation” (Glaser and Strauss, 1967) remains the guiding principle
(Guest, Bunce, and Johnson, 2006) for determining the appropriate sample size for a qualitative
investigation, the actual number of participants deemed appropriate continues to be debated by
various researchers. The size may depend on various aspects such as type of research, the use of
the data and the objectives of the analysis, sample homogeneity, and more (Guest, Bunce, and
Johnson, 2006). A deemed appropriate range for the sample size of a phenomenological study has
been identified to be between five (5) and twenty-five (25) (Morse, 1994; Creswell, 1998; Guest,
Bunce, and Johnson, 2006). Guest, Bunce, and Johnson (2006) found in their study, How many
interviews are enough? An experiment with data saturation and variability, that data saturation had
for the most part occurred within twelve (12) interviews. They found that 94% of codes they
categorized as high-frequency were identified within the first six (6) interviews and 97% were
identified after twelve (12) interviews in their dual country, sixty-interview study. As a whole, they
found 92% of the total number of codes for one country and 88% of the total number of codes for
both countries after twelve (12) interviews. With reference to this finding, the researcher
concluded that a sample size of 12 interview participants would be reasonable and appropriate for
this pilot study.
Due to issues of feasibility and accessibility, functional experts were drawn from 380 organizations
listed in a provincial human resource professional membership listing to which the researcher had
access. The organizations spanned across industries and government departments in the Canadian
province of Alberta. Over 2,700 certified human resources professionals were listed as employees
or affiliates of these organizations and government departments. To identify the participants, the
list of alphabetized organizational names was sorted in random order using Excel Random Formula.
The first 10 organizational names on the resorted list confirmed to be best employers and the first
10 organizational names on the resorted list confirmed to be non-best employers were extracted
for contact. While individual names of non-human resources professionals (such as Marketing,
communication, etc.) were not on the database, identifying them was not difficult once their
organizations were selected.
In total, 24 functional experts were invited to participate in the pilot study, 20 agreed to
participate, and 15 responses were received by the researcher, as shown in Table C3-1 below:

48
Table C3-1
Types of Organizations Best Employers Non-best Employers
HR M/C G/O HR M/C G/O
Financial Consulting Service 1
Retail 1
Banking 1
Engineering 1
Environmental Engineering 1
IT Solutions 1
Software Development 1
Management Consulting Service 1
Municipal Government 1
IT Solutions 1
Academic Institution 1
Health Care Services 1
Grocery Chain 1
Hotel Chain 1
Industry Advisory Services 1
HR M/C G/O HR M/C G/O
TOTAL 3 1 3 4 1 3
HR = Human Resource Management Professionals
M/C = Marketing/Communication Management Professionals
G/O = General/Operations Management Professionals
As this was an exploratory study to capture the employer branding practices of various
organizations within various industries, the researcher did not seek to match best-employers
organizations with the exact kind or size of non-best employers. Future follow-up studies can be
refined to compare characteristically matching best and non-best organizations.
Interview Process and Questionnaire
Upon identifying the organizations for contact, initial telephone contacts were made to seek
participation. All individuals that agreed to participate were briefed over the telephone on the
nature of the research project and on the researcher’s expectations of their participation. They
were then sent a set of interview questions by e-mail and asked to provide an electronic response
within one week. Upon receiving responses, some participants were contacted by telephone for the
purpose of clarifying answers that were vague and/or too brief.

49
Before the interview questionnaire was distributed to the research participants, it was first pre-
tested for clarity and flow with two faculty members from the Commerce and Management
Department at the researcher’s academic institution. Suggestions were given on the order of the
questions as well as on the approach of some questions. Adjustments were made in response to
the feedback.
Only five questions were presented in the questionnaire:
1a. Based on your own professional experience and observations, how would you define employer
branding?
1b. How does your current organization define employer branding?
2. What employment provisions and/or organizational activities, programs is your organization
using to brand and distinguish itself as an employer of choice?
3. Is your organization using employment provisions and/or organizational activities, programs
you have identified for question 2 to shape employees’ work behaviours? If yes:
a. What are the employment provisions and/or organizational activities, programs used
for this purpose?
b. What employee work behaviours have the organization expected to shape and/or
maintained?
Individual observations and experiences gained over years of employment with various
organizations would likely have more variations, breadth, and possibly even depth than the
observations and experiences gained from one single existing place of employment. For question
1a, respondents were asked to draw references from their professional experience gained
throughout their career and answer the question as an experienced practitioner in their field. This
would allow us to examine the cumulative observations and experiences of each functional
management group in the matter of employer branding. For question 1b, each respondent was
asked to draw references from only his/her current organization and answer the question as a
representative of the organization, which would be either a best employer or non-best employer
organization. In combination, the dual perspectives would enhance the breadth, depth, relevance,
and significance of information gained.

50
Analysis, Results, and Discussions
The researcher analyzed the interview responses using qualitative analysis software, QDA Miner
version 2.0 from Provalis Research and proceeded to explore, identify, and categorize common
themes that emerged from the data.
Variables for analysis were set as follows:
Employer Status – Best Employers (BE) and Non-best Employers (Non-BE)
Respondent Function - Human Resource Management, Marketing/Communication
Management, and General/Operational Management
Type of feedback - Functional Experts, Employer
Industry/Business Type
Results were analyzed and presented for the following issues:
a. Themes in the definition of employer branding.
b. Elements used by best-employers and non-best employers to brand and distinguish
themselves as employers of choice.
Themes in the definition of employer branding
Themes that emerged for the definition of employer branding were as follows:
Actions/Functions Across the Organization - to achieve targeted objectives
Behaviours – expectations and portrayal of desired work behaviours
Benefits – for employees
Differentiation/Distinction – of the organization from other organizations as a workplace
of choice
Marketing and Communication – of the organization’s intended messages
Policies and Procedures – to achieve targeted objectives
Promise to Employees – pledging of promises
Public Image, Identity and Reputation of the Organization – development, maintenance
and communication of image, identity and reputation
Values/Moral Standing of the Organization – communication and demonstration of
values and moral standing
Of the themes above, Marketing and Communication as well as Public Image, Identity and
Reputation and Benefits received the most recognition from employers as well as from functional
experts. The themes of Actions/Functions Across the Organization and Promise to Employees were
identified by a couple of functional experts but not by any employers.

51
Some similarities were found in the definition of employer brand and branding presented by the
three different groups of functional experts. Over half of human resource management
professionals as well as the general/operational management professionals interviewed identified
Marketing and Communication as a theme in their definition of employer brand and branding. The
two themes, Benefits and Public Image, Identity and Reputation, were identified by all three
groups of functional experts in their definition of employer brand and branding.
Discussion
From the responses of the interview, it would appear that many employers and functional experts
still primarily associated employer brand and branding with marketing and communication of the
organization’s public image/identity. Added to that was the theme of differentiation. It was not
surprising to uncover these themes since the original and long held definition of the term ‘Brand’
endorsed by The American Marketing Association (in Keller, 2003) was “a name, term, sign,
symbol, or design, or a combination of them intended to identify the goods and services of one
seller or group of sellers and to differentiate them from those of competition” (pg. 7). While this
relatively superficial definition had been dissected, refined, and elaborated upon by various
marketing experts since then (Aaker, 2004; De Chernatony and Christodoulides, 2004), the basic
concept of identification and differentiation appeared to be firmly held by many employers that
would still see employer branding as a practice of marketing and communicating the organization’s
public image/identity to distinguish themselves from other employers as the ‘employer of choice’.
These findings support some pre-existing definitions of employer branding. For example, Backhaus
and Tikoo (2004) defined employer brand as “a concept of the firm that differentiates it from its
competitors” (pg. 502) and employer branding as “the process of building an identifiable and
unique employer identity”.
Many employers that responded to the interview also identified employer brand and branding with
benefits for employees. This is in line with the pioneer definition of employer brand provided by
Ambler and Barrow (1996). They defined employer brand as “the package of functional, economic,
and psychological benefits provided by employment, and identified with the employing company”
(p. 8).
The identified themes of Values/Moral Standing of the Organization, Policies and Procedures and
Behaviours were supportive of the content of employer brand provided by Ainspan and Dell (2001).
They asserted that the employer brand “encompasses the firm's value system, policies and
behaviors toward the objectives of attracting, motivating, and retaining the firm's current and
potential employees". In this pilot study, however, the interview respondents did not express that
these items were specifically geared towards the objectives of “attracting, motivating, and
retaining the firm's current and potential employees". We could only assume that this is the case.

52
One noteworthy finding of this component of the study was that while some functional experts
identified the themes of Actions/Functions Across the Organization and Promise to Employees in
their description of employer brand and branding, no employers did. One might speculate that
while employers initiated actions to brand their organizations as a workplace of choice, they saw it
as a single-function assignment (e.g. that of human resource or marketing) rather than a broad,
cross-functional, organization wide mission. The non-identification of Promise to Employees, on the
other hand, could be attributed to the possibility that employers still considerrd employer branding
as primarily an act of marketing and communicating the organization’s public image. Here the
focus was on cultivating and presenting an intended perception rather than on delivering the
substance of the perception. A “promise” indicates an expectation “to fulfill” while the marketing
and communication of a perception does not indicate similar expectation. This could be due to the
assumption that the organization’s image/identity was made up of matters already in place or
promises already fulfilled, thus there was no need to re-pledge the fulfilled promise.
Of the three functional expert groups, the human resource management professionals were most
diverse in their definition of employer brand and branding. They identified the most variety of
themes. As the concept of branding did not originate in the field of human resources management
and human resource management professionals were only beginning to explore the integration of
the concept in their professional practices, the result of such diversity likely signaled a lack of
common understanding among human resource management professionals of the concept of
employer branding.
Themes in the elements used by employers to brand and distinguish
themselves
Aside from employment benefits identified in extant literature, additional elements were used by
employers to brand and distinguish themselves as employers of choice. These consisted of
communication, corporate direction and control, and performance management. Categories, as
follows, were established to represent the specific items, provisions, and activities identified:
Employee-oriented Element: Employment Benefits
Monetary
o Bonus programs, company stock ownership program, profit sharing program,
competitive salaries, competitive retirement matching or contributory plan, competitive
health benefits, life insurance plan, disability plan, employee discount program,
employee loan program.

53
Professional Development and Application
o Work improvement incentives, monthly staff meetings, employee training programs,
coaching and mentorship program, team building programs, interesting international
assignments, inter-branch transfer program, internship programs, educational
subsidies.
Social and Psychological
o Employee events, informal celebrations (birthday celebrations, achievements in one
job, etc.), formal employee recognition programs, work culture desired and valued by
employees, respectful work relationships, fun and creative work environment, caring
and supportive workmates, promote-from-within program, team decision-making.
Work-life
o Esthetically pleasing and comfortable work environment, flexible work schedule or
telecommuting option, flexible paid personal days off, fitness facility or subsidy,
wellness programs, free items (food, beverages, clothing, etc.), employee and family
friendly policies (casual wear days, etc.), childcare support or subsidy, retreats,
company owned recreational facilities accessible by employees and their families,
transit program, family vacation programs, entertainment tickets/passes.
Symbolic
o Association with successful company – wearing company gears and logo, promotion of
company achievements and awards to external parties.
Personal Influence and Involvement
o Employee referral incentive program (referring new employees to their companies),
employee committees.
Organization-oriented Elements: Activities and Controls
Organizational Communication
o Communication, Advertising and Promotion
Consistent messaging in promotional materials, advertising in targeted
mediums, promotion of company achievements and awards.
Public Engagement
o Community Involvement/Event Sponsorship
Sponsoring public and community events, locating branches in every
community being served.

54
Organizational Direction and Control
o Organizational Standards, Policies and Procedures
Using codes of conducts, standards, and policies to regulate practices.
Performance Management
o Competitive Analyses and Actions
Benchmarking one’s employee programs and provisions with those of other
companies, reviewing and participating in employer surveys.
o Performance Management Programs
Client service teams.
The number of Best Employers (BE) and Non-Best employers (Non-BE) that confirmed using the
employment benefits as well as organization-oriented elements in their employer branding efforts
were as shown in Table C3-2 below:
Table C3-2
Employment Benefits BE
n=7
Non-BE
n=8
Total
n=15
Monetary 4 5 9
Professional Development and Applications 5 5 10
Social and Psychological 5 6 11
Work-life 2 4 6
Symbolic 2 3 5
Personal Influence and Involvement 1 3 4
Corporate Activities and Controls BE Non-BE Total
Organizational Communication 3 0 3
Public Engagement 3 0 3
Organizational Direction and Control 2 0 2
Competitive Analyses and Actions 2 0 2
Performance Management Programs 1 0 1
The results indicated that there was a comparable, and in some cases, higher number and
percentage of Non-BE than there were BE that used each of the employment benefit categories
above.
None of the Non-BE interviewed identified the use of organization-oriented elements to brand or
distinguish themselves as employers. This was in contrast to the result that all of the BE
interviewed confirmed using one or more organization-oriented elements to brand or distinguish
themselves as employers.

55
Discussion
It was not surprising that employment benefits was the primary change-affecting tool used in
employer branding efforts. While the term and concept of employer branding was relatively new,
many of its existing practices and provisions were those that had already been long-recognized in
standard human resource management (Harding, 2003). Since the main focus of employer
branding has thus far been workforce attraction and retention, the long-prescribed approach has
been to offer desirable employment benefits.
Interestingly, when compared to BE, just as high a number of Non-BE used just as many
categories of benefits in their efforts to brand and distinguish themselves as employers of choice.
If this result is representative of the larger employer population, what could be the differentiating
factor(s) between BE and Non-BE? A clue may lie in another set of results from this study. As
revealed, none of the Non-BE interviewed identified the use of organization-oriented elements to
brand or distinguish themselves. On the contrary, all of the BE interviewed confirmed using one or
more categories of organization-oriented elements to brand or distinguish themselves as
employers. In other words, BE used organization-oriented elements as well as the employee-
oriented element of employee benefits to brand and distinguish themselves as employers of choice
while Non-BE used only the employee-oriented element of employee benefits. If a much larger
sample was used, one would likely find Non-BE that employed both the employee-oriented element
of employee benefits and other organization-oriented elements to brand and distinguish
themselves as employers. However, the disparity in the percentage of BE that use organization-
oriented elements and the percentage of Non-BE that do the same may remain noticeably large, as
suggested by the results of this pilot project.
Themes in targeted work behaviours and the employer branding
elements used by employers to shape and maintain them
Themes that emerged for the employee work behaviours that employers most wish to shape and
maintain were shown in Table C3-3 below. The table also showed the number of employers that
identified each of the behaviour. Only behaviours identified by more than one employer were
presented here.

56
Table C3-3
Most Identified Behavioural Themes BE
n=7
Non-BE
n=8
Total
n=15
Adherence to corporate values and standards of behaviours 3 1 4
Community engagement 2 1 3
Superior customer service and relationship building 1 2 3
Business Planning and/or strategy execution involvement 1 1 2
Demonstrated pride in working for the organization 1 1 2
Demonstrated passion for the employer’s business 1 1 2
Results indicated that both BE and Non-BE identified similar work behaviours they wished to
generate among employees, though more noticeable number of BE appeared to place emphasis on
Adherence to corporate values and standards of behaviours than Non-BE.
The employment benefits and organization-elements of employer branding used by employers to
shape and maintain these targeted behaviours were identified in following Table C3-4:
Table C3-4
Participant
Number
Profession
Code Org. Profile Behaviours MN PD SP WL SB PI
org.-
oriented
elements
5 Non-BE: HR Grocery Chain
Adherence to
corporate
values and
standards of
behaviours
1
11 BE: HR IT Solutions 1 = OSP
12 BE:M/C Environmental
Engineering 1
15 BE: HR Software
Development 1 = OSP
6 Non-BE:M/C Academic
Institution
Community
engagement
1
8 BE: HR
Financial
Consulting
Service
1 = Office
location
11 BE: HR IT Solutions 1
13 Non-BE:
G/O
Management
Consulting
Service
Superior
customer
service and
1 1 = OSP

57
Notes:
MN = Monetary PD = Professional development & applications
SP = Social & psychological WL = Work-life
SB = Symbolic PI = Personal Influence & Involvement
OSP = Organizational standards, policies, and procedures
Results in Table C3-4 showed that in majority of the 16 cases, Non-Be as well as BE only identified
one mean to shape and maintain the desired work behaviour, be it an employment benefit or an
organization-oriented element. The use of more than one benefit or a combination of employment
benefits and organization-oriented elements was evident in only three (two BE and one Non-BE)
cases. Interestingly, different employers from varied industries, regardless of whether they were
BE or Non-Be, used different means to shape and maintain the same desired work behaviour, with
exception to superior customer service and relationship building, where professional development
and applications was the only mean used by all three employers, and demonstrated pride in
working for the organization where symbolic benefits were used by both employers. For each of
14 Non-BE: HR Health Care
Services
relationship
building 1
8 BE: G/O
Financial
Consulting
Service
1
3 Non-BE: HR Hotel Chain Business
Planning
and/or
strategy
execution
involvement
1
11 BE: HR IT Solutions 1
3 Non-BE: HR Hotel Chain Demonstrated
pride in
working for
the
organization
1
11 BE: HR IT Solutions 1 1
1 =
Communication
& Advertising
5 Non-BE: HR Grocery Chain Demonstrated
passion for
the
employer’s
business
1
7 BE: G/O Retail 1 1
TOTAL 2 4 3 0 3 3

58
these two behaviours, an employer augmented their use of benefit with another organization-
oriented element.
The results showed that all types of benefits identified in extant literature, except for work-life
benefits were used to shape and maintain desired wok behaviours. As well, the use of each
employment benefit, in this this case, also specific organization-oriented elements, was not limited
to best employers. Non-best employers also used the same benefits to employees’ work
behaviours. Once again, the usage of employment benefits was hard to distinguished between best
employers and non-best employers.
From the above results, one could also see that of all five types of employment benefits used to
shape and maintain desired work behaviours, monetary was the least used by employers. Three
identified types of organization-oriented elements were used to support the development or
maintenance of desired work behaviours, with organizational standards, policies, and procedures
being the most used.
As a whole, the results reflected the likelihood that each targeted work behaviour could in fact be
shaped and maintained using more than one employment benefit and/or organization-oriented
element.
Discussion
While the specific work behaviours that an organization wishes to shape and maintain could be
different than that of another organization, this pilot study offered an indication of some of the
behaviours that employers appear to commonly desire. Further research in the future could
uncover more common work behaviours that employers would wish to create and maintain among
employees.
Other desired work behaviours identified by interview respondents but not examined in detail
were: innovativeness, drive for advancement, loyalty, respect, and teamwork. Each of these
behaviours were identified by only respondent.
One interesting question from the results is why some behaviours were more identified than
others. Can one consider the more identified behaviours as more corporate brand-projective
compared to those that were less or not identified? While most employee behaviours could in one
way or another affect organizational performance and brand, some behaviours would have a more
immediate and direct effect on fulfilling the organization’ performance goals and on strengthening
the organization’s brand(s), be that the service brand, employer brand, or overall corporate brand.
Behaviours such as innovativeness, drive for advancement, loyalty, respect, and teamwork might
ultimately enhance organizational performance but such effect and that on the organization’s
corporate, service, and employer brand might not be direct or immediate. An employee’s
59
innovativeness could result in the generation of new products or new processes. However, the
duration and timing for that result to materialize would be unpredictable. It could happen a few
months after the employee starts his/her employment or it might not happen for a few years. An
employee’s drive for advancement might or might not even result in positive organizational
performance depending on the means the individual takes to achieve his/her advancement. Many
organizational brands and reputations have in fact been damaged by employees’ zeal for
advancement as they start behaving in unethical or even illegal manner to get ahead. Loyalty could
result in stronger commitment and possibly better performance but again, such result could be
long to come by. In terms of brand enhancement, unless they actively share their positive
experiences with customers or job applicants as well as be able to turn that loyalty into engaging
behaviours towards customers and job applicants, such loyalty might not contribute at all to the
enhancement of service or employer brand. Similarly, respect and teamwork may improve work
relations but again, may or may not have any immediate and obvious effect on improving the
organization’s brand or on fulfilling organizational performance goals, particularly as they relate to
the common goals of increasing sales or improving service.
On the contrary, behaviours that demonstrate adherence to corporate values and standards of
behaviour, superior customer service and relationship building, community engagement, business
planning and/or strategy execution involvement, pride in working for the organization, and passion
for the employer’s business might have more immediate and obvious effect on increasing sales,
improving service, and strengthening organization’s service, employer and overall corporate brand.
For example:
When an employee adheres to a set of prescribed corporate values and standards of
behaviour, be they in sales, service, job applicant engagement, or other general practices -
he/she would be directly displaying to co-workers, customers, potential job applicants, and
the public, behaviours that characterize the organizational expectations and/or the
organizational brand values and pledges.
When an employee provides superior customer service and demonstrates superior
relationship building abilities, he/she would be personally delivering the pledges of the
organization's service brand and this will likely have a direct effect on customer satisfaction
and sales. Such superior customer service and relationship building abilities, when
observed or personally experienced by job applicants will very likely strengthen their
positive view of the organization as a whole, including as a potential employer. As such,
the demonstration of superior customer service and relationship building abilities
strengthens the organization’s service brand, employer brand and ultimately also the
overall corporate brand.
When an employee engages the community by participating in community projects and
events, he/she would be directly exhibiting or promoting the values, essence, and message
of his/her organization and its brand. Such engagements speak louder than advertised

60
words when it comes to demonstrating that the organization/employer is part of the
community, is investing in members of the community, and is supporting causes that are
important to the community. Such efforts would undoubted increase the community’s
goodwill towards the organization as well as strengthen its perception of the organization
as a business and as an employer.
When an employee shows his/her pride in working for the organization by talking positively
about his/her organization to others or simply by wearing clothing that displays the
company logo and motto, he/she would be immediately and directly shaping the public’s
perception of the organization, its products or services, and its viability as an employer of
choice.
When an employee demonstrates passion for his/her employer’s business and participates
in the planning and execution of business strategies for the organization, he/she is directly
involved in shaping, improving, transforming and/or delivering the values and pledges of
the organization’s brand, be they service, product, employer, or overall corporate brand.
Compared to innovativeness, drive for advancement, loyalty, respect, and teamwork, the
demonstration of behaviours above by employees appear to elicit more immediate and direct
positive effect on employee’s performance and/or brand enhancement. As such, it make sense
they are identified by more employers as work behaviours they wish to shape and maintain.
Having an insight into some of the common work behaviours that employers appeared to want to
shape and maintain among employees, it would be logical to explore the types of employment
benefits and/or organization-oriented elements that could be used to holistically and effectively
shape as well as maintain these behaviours. It is likely that more than one employment benefit or
organization-oriented element can be or even should be used to shape or maintain each targeted
work behaviour. For example, improving or maintaining superior customer service and relationship
building could likely be done through more than just professional development and application
activities. For the three cases in this pilot study, all employers quoted “coaching” as their mean.
Aside from coaching, customer service could be enhance through other means including but not
limited to:
Monetary mean - bonus in making sales to the customer or in presenting a customer
service idea that has been adopted.
Social and psychological mean – publisizing positive comments from customers about the
employee’s service, praises, and public acknowledgement or award for excellent service.
Personal influence and involvement – opportunities to offer input and to implement input
on how to improve customer service.
The fact that most employers only reported one mean could indicate that these were their most
obvious and immediate mean but upon a deeper look, not the only mean.

61
Limitations of Pilot Study
By interviewing a small and localized sample, the results in this pilot project were intended to be
qualitatively informative but not quantitatively confirmatory. Any statistical results presented would
be helpful in 1) offering more insight into the functional and employer perspectives in employer
branding, 2) providing a general indication of the direction or emphases in present day employer
branding activities, and 3) set specific hypotheses for further testing. However, due to the small
sample size, the results might not be adequately representative of the actual employer branding
practices in organizations as a whole or of the observations/experiences of the larger groups of
functional experts in the general workforce. This is especially true for the results of the
marketing/communication management professionals group as they were derived from the
responses of only two participants.
The answers of the individual respondents might also not always be representative of the reality in
their organizations. As well, only the views of employers (their representatives) were sought in this
study. Had employees or job applicants be interviewed as well, it was realistic to assume that one
might gain different results or different degrees of the same results.
Aside from concerns with the small and localized sample, there was always the possibility of
making mistakes in the coding and interpretation of data. While subjectivity might be reduced with
the use of tools like surveys with fixed choice answers, interview answers are derived from more
free-flowing personal observations and opinions. Here, subjectivity is more likely to exist with both
the respondent who offers the personal observations and opinions as well as the researcher who
has to use his/her own personal understanding and judgment to code and interpret the
respondent’s personal observations and opinions.
The interview component of the study was limited to Alberta employers, hence, the findings might
not be representative or transferable to employers in other parts of Canada or in other countries.
Alberta’s economic status, work culture, government incentives, and other characteristics might
cause Alberta employers to behave differently than employers of other regions and countries when
it comes to the activities of workforce recruitment and retention. As a whole, Alberta employers
might have more resources to deliver more comprehensive employer branding initiatives than
employers in New Brunswick, Florida, Wales, Tasmania, or Sumatra. What was found to be
effective in Alberta might also not be effective in Singapore or even realistic in Hunan. Each
organization’s characteristics might also make the results of the study not highly transferable. Each
might possess unique organizational conditions that were not shared by other organizations. In
short, the results of the study might be transferable only to organizations that shared similar
characteristics to those of the samples used here.

62
Conclusion and Moving Forward to Main Doctoral Research
As highlighted in the Chapter 2 of this document, there has been much discussion in extant
literature on the types of value proposition or employment benefits extended by employers to
potential and actual employees. However, there has been extremely few comparisons between the
benefits offered by best employers and those offered by non-best employers. This pilot study took
on the challenge of comparing the two groups, in a small scale, and offered a valuable preliminary
insight into the likelihood that best and non-best employers actually used the same variety of
employment benefits to brand themselves as employers of choice as well to shape and maintain
desired employee work behaviours that impact performance. Such results led to the question, “If it
is not the variety of employment benefits used, what therefore, truly differentiates best employers
from non-best employers when it comes to delivering effective employer branding and shaping
employee performance?” One revelation was the intentional use of other organization-oriented
elements by best-employers to augment or support the fulfillment of their promised employment
benefits. Are there any other factors, such as the manner in which promised employment benefits
are coordinated and delivered, or the culture within the organization, or the segmentation of job
applicants, or something else that make best-employers more successful in not only attracting and
retaining employees but most importantly, in enhancing employee performance?
In order to answer the questions above, more in depth investigation needs to be done. It is not
sufficient to simply verify on a superficial level if other elements or factors are present even if a
larger sample is employed as that would not explain how differentiation is achieved or how
performance behaviours are shaped or maintained by these different elements and factors. In fact,
to get a true sense of what other possible elements or factors might be present (aside from those
identified in this pilot study) to influence employee performance there is good reason at this
exploratory stage to conduct detail case studies of organizations that have not only consistently
proven themselves as employers of choice for their targeted workforce but have also distinguished
themselves as leaders or winners in their respective industries in terms of performance, which
depending of the types of business and industries they are in, could include but not be limited to:
service superiority, product quality, innovation, profit margin and stakeholder return, organizational
reputation as well as growth and long-term sustainability.
Consistent ability to maintain such achievements would serve as an indication of the organizations’
proven success in differentiating themselves as the best among many, as both an employer and a
highly productive organization. Uncovering the true elements or factors that make them continually
successful would bring genuine value to the understanding of employer branding, particularly in
how it is used by distinguished employers of choice to shape and maintain employee performance,
which ultimately impacts the broader organizational performance.
With this understanding, the researcher proceeded to complete her doctoral research by seeking
such an elite organization and conducting a comprehensive case study on its employer branding
practices, specifically as they related to the shaping and maintenance of employee performance.

63
The case study also went on further to verify whether a positive relationship was in fact present
between these winning employer branding strategies and employee performance.
64
CHAPTER 4: MAIN RESEARCH PROJECT METHODOLOGY
While the pilot study offered a preliminary glimpse into the use of employment benefits and other
organization-oriented elements to shape employees’ targeted work behaviour, the main research
project went further to explore if and how employee performance, specifically organizational
citizenship and task performances, was influenced by employer branding, particularly the
fulfillment of employer brand promises. The investigation was focused on answering the following
key questions:
1. What are the factors present in the content and delivery of employer brand promises and
how might they influence employee performance?
2. What influence does employees’ perceived level of employer brand promise fulfilment by
their organization have on their level of organizational citizenship and task performances?
Data to answer question # 1 on the factors present in the content and delivery of employer brand
promises that might influence employees’ performance was gained using the qualitative method of
material analysis as well as in-depth interviews of managers to explore the factors and intricacies
of the organization’s employer branding exercise and its association with employee performance
enhancement.
Data to answer question # 2 on the influence of employees’ perceived level of employer brand
promise fulfilment on their level of organizational citizenship and task performances was gathered
using the quantitative method of employee survey and statistically analyzed to determine the
influences that the fulfillment of different types of employer brand promises might have on
employees’ organizational citizenship and task performances. The key hypotheses tested in the
quantitative component were:
Hypotheses 1a and b:
Employees’ reported level of a. overall organizational citizenship performance (OCP) and b.
overall task performance is positively co-related with their perceived level of overall employer
brand promise (EBP) expectation fulfilment by their employer.
Hypotheses 2a to j:
Employees who perceive a high level of expectation fulfilment by their employer of the
promises in the following employment benefit content factor clusters will report a higher level
of a/c/e/g/i. organizational citizenship performance and b/d/f/h/j. task performance than
employees who either perceive a low level of expectation fulfilment by their employer in this
factor cluster or who have no expectation for the promises in this factor cluster:
i. Factor of personal sustainability
ii. Factor of connectedness and belonging
65
iii. Factor of opportunities and growth
iv. Factor of personal stake and influence
v. Factor of significance and esteem
Hypotheses 2k and l:
As a whole, employees who perceive a high level of employer brand promise expectation
fulfilment by their employer will report a higher level of k. organizational citizenship
performance and l. task performance than employees who have no expectation for the
employer brand promises or who perceive a low level of employer brand promise expectation
fulfilment by their employer.
Hypothesis 3:
Employees who perceive a high level of employer brand promise expectation fulfilment by their
employer will concur more strongly with each four of the following notions when compared to
employees who have no expectation for the employer brand promises or who perceive a low
level of employer brand promise expectation fulfilment by their employer:
a. Their employment experience at the organization was both desirable and distinctive
(DDEE).
b. Their organization is a great place to work (GPTW).
c. They would be very happy to spend the rest of their career with the organization
(HSCO).
d. They DO NOT frequently think of leaving the employment at the organization (NFTL).
Hypotheses 4a and b:
Employees who concur (CC) with each of the four notions below will demonstrate a higher
level of a. organizational citizenship performance (OCP) and b. task performance when
compared to employees who do not concur (DNC) with the notions:
a. Their employment experience at the organization was both desirable and
distinctive (DDEE).
b. Their organization is a great place to work (GPTW).
c. They would be very happy to spend the rest of their career with the organization
(HSCO).
d. They DO NOT frequently think of leaving the employment at the organization
(NFTL).

66
Research Paradigm Considerations and Influences
A researcher’s paradigm or basic set of beliefs on the nature of reality (ontology) as well as on the
types of knowledge that can be generated from this reality and on the relational intervention that
exists in the generation of the knowledge (epistemology) will unavoidably influence the research
methodology that he/she uses to uncover or generate the knowledge (Willis, 2007; Roulston,
2010; Tuli, 2010; Ciao, 2011). The methodology in turn affects what and how data is collected,
managed, and interpreted (Lowe, 2001; Buchanan and Bryman, 2007; Roulston, 2010) and as
whole, the researcher’s position can have a significant bearing on the outcome of the investigation
(Wiersma, 2000). Without exception, the design of this doctoral research is influenced by the
research paradigm of its researcher.
Extant literature indicates that there are two oppositional paradigms that dominate the research
field. They are those of positivism and interpretivism. Other noted variations and/or deviations that
have evolved from these two main paradigms include post-positivism, critical theory, and idealism.
Positivism is underpinned by a realist ontology where the reality or facts exist apart from personal
thoughts and are observable, stable as well as verifiable through conventional scientific means
(Bassey, 1995; Lincoln & Guba 2000, 2005; Neuman, 2003; Rhein, 2013; Taylor and Medina,
2013). In this case, the epistemology would be objectivity and empiricism, hence, conventional
scientific methodology would mainly involve quantitative methods (Cohen, Manion and Morrison,
2000; Pring, 2000; Tuli, 2010; Ciao, 2011; Taylor and Medina, 2013) such as experiment, where
the goal is to i. test hypotheses for causal links, ii. measure effects, and iii. uncover or verify
“truth” (Neuman, 2003; Sarantakos, 2005; Marczyk, DeMatteo and Festinger, 2005). The
researcher in such a setting would see him/herself as an objective controller of the research
process, which is separate and detached from what or who he/she is researching (Miles and
Huberman, 1994; Lincoln & Guba 2000, 2005; Brewerton and Millward, 2001; Tuli, 2010; Taylor
and Medina, 2013). When it comes to the study of social phenomena such as the one in this
doctoral research, positivists would see it as the same as natural phenomena and would see a
need to treat it as such, using the same scientific methods to verify or predict what would be
deemed stable, law-like patterns of behaviours and cause-and-effect relationships (Neuman, 2003;
Marczyk, DeMatteo and Festinger, 2005; Cioa, 2011; Taylor and Medina, 2013).
Growing disillusionment with the quantitative methodologies and limitations in studying social
phenomena led to the emergence of Interpretivism (Guba & Lincoln, 1994). Interpretivists felt that
there are clear differences between the natural world and the social world (Hitchcock & Hughes,
1989) and that quantitative approaches are inadequate for thoroughly and effectively examining
complex social phenomena (Scott and Usher, 1999) where human actions, motivations, and many
other variables may interact simultaneously and cannot be isolated or reduced to independent
components (Weirsma, 2000; Ciao, 2011). Contrary to Positivism, Interpretivism is underpinned by
a relativist ontology where there are multiple realities (Pring, 2000; Sale, et al, 2002; Rhein, 2013)

67
constructed and interpreted by individuals in a social context (Sale, et al, 2002) through their
observation of as well as interaction and experience with other individuals (Guba and Lincoln,
1985; Bogdan & Biklen, 1992; Pring, 2000; Maxwell, 2006; Tuli, 2010).
With a subjectivist epistemology, “reality” is therefore seen by interpretivists to exist not apart
from but solely within the subjective mind of the researcher (Miles and Huberman, 1994; Ciao,
2011) and that there is in fact no external reality outside of the researcher’s mind (Miles and
Huberman, 1994; Pring, 2000; Ciao, 2011) and no external reference to compare the researcher’s
claim of reality (Smith, 1983). In this case, the researcher is interactively engaged with the
subjects being researched and he/she cannot be independent of the research process or the
presentation of the “truth” (research findings) because such truth is in fact mutually and
subjectively created between the researcher and his/her research subjects within the social context
of the research (Denzin and Lincoln, 1994; Guba and Lincoln, 1994; Miles and Huberman, 1994;
Pring, 2000; Sale, et al, 2002; Buchanan and Bryman, 2007; Phiri, no date). As such truth is
subjective as well as context and human dependent, it changes over time and space (Pring, 2000;
Ciao, 2011) with different researchers and participants involved in the research.
Interpretivist researchers typically employed qualitative methodologies (Bassey, 1995; Cohen,
Manion & Morrison, 2000; Tuli, 2010; Rhein, 2013) such as unstructured interviews and
observations to conduct their investigations where the goal is to generate holistic, in-depth, and
rich local understanding of the social phenomena within the research context (Fincham, 2002;
Huxham & Vangen, 2003; Neuman, 2003; Taylor and Medina, 2013). Criticism in the research
community has always been that such finding is not generalizable to the broader population (Ciao,
2011), which interpretivist researchers appear to recognize and counter with their alternate
research goal above as well as with the suggestion that theoretical rather than statistical
generalization could be possible (Eisenhardt, 1989; Qu & Dumay, 2011).
In spite of the long-held debates among some scholars on the superiority of one paradigm over
another, there appears to be more consensus among present day researchers that no single
paradigm is in fact most ideal or superior over others and that each paradigm presents strengths
and limitations that might make it more applicable in certain types of investigations but not
necessarily in another type of investigation (Cohen, Manion & Morrison, 2000; Schulze, 2003;
Bryman, 2007; Taylor and Medina, 2013). As a result, there also appears to be more acceptance in
the research community for the incorporation of multiple perspectives (Lincoln and Guba, 2000)
and the use of methods from both paradigms in research studies (Guba & Lincoln, 2005; 2008;
Bryman, 2007; Denzin, 2008; Creswell, 2009), though this is not to suggest that paradigm
discourse and controversy no longer exists (Bryman, 2007).
68
Paradigmatic foundation of this doctoral research
The “paradigm wars” (Bryman, 2007, p. 14-15) highlighting the oppositional assumptions about
qualitative and quantitative research is not just a debate between researchers in each camp but
can often also be an internal struggle experienced by a researcher, particularly a doctoral student
and novice researcher who is still at the early stages of learning about the different paradigms and
of exploring how he/she truly sees the nature of reality and the procurement of knowledge. The
following questions by Ruto-Korir and Lubbe (2010, pg. 104-105) in their article, Locating the
doctoral study in the ‘paradigm skirmishes’: Challenges and prospects for adopting a paradigm
cradle, eloquently reflect the challenges faced by many doctoral students and novice researchers:
“Although researchers are invited to view “blurred” boundaries (Denzin, 2008:16) between
qualitative and quantitative approaches, I reflect on several questions: Does an idea hold
because it originates from an acclaimed identity? If that is the expectation, where does the
doctoral student’s originality fit? In the space of paradigm discourse, what are doctoral
students to do in the interim before such [paradigms] debates become conclusive? For
example, if their stance contrasts with that of the acclaimed identities in discourse, does the
academic community still sustain their contribution?”
Nonetheless, clarifying one’s research beliefs in a research project is essential regardless of the
researcher’s readiness to do so as such beliefs, conscious or otherwise, shape how he/she selects
his/her research methodology and methods for the project as well as influences how he/she treats
and interprets data and findings from the project.
Doing so is also in line with the practice of reflexivity advocated by many modern day researchers,
where a researcher is open about factors or positions that influence his/her methodological choices
and is also engaged in some critical degree of self-appraisal (Alvesson & Sköldberg, 2000;
Buchanan and Bryman, 2007; De Loo and Lowe, 2011). Green and Preston (2005) as well as De
Loo and Lowe (2011, pg. 28) caution that the engagement in reflexive practices would not
suddenly transform understanding to explaining social phenomena. However, it does provide an
understanding of why a researcher might have made the methodological choice he/she did and the
presumptions, suppositions, and/or interpretations that might have influenced the research
(Saunders et al., 2007). De Loo and Lowe (2011, pg. 29) argued that without reflexivity and
acknowledgement of one’s own role in affecting the research, we risk losing the possibility and
credibility of building a coherent and trustworthy knowledge base.
The methodology for this doctoral research project is informed by the following research beliefs:
1. The discovery of information and knowledge should not be restricted to the use of
methods prescribed by only one paradigm or another because the methods of each
paradigm have limitations that can be addressed by those of the other paradigm, and

69
together, they offer different, complementary, and comparably potent ways to examine
data from different angles, for different purposes.
2. As social science research such as this doctoral dissertation examines complex phenomena
within a unique real-life setting and context involving many human actors, it is very
difficult if not impossible to avoid human subjectivity and imprecision, especially in the
provision (by research participants) as well as analysis and interpretation (by the
researcher) of the qualitative data. However, there needs to be as much objectivity as
realistically possible in such a setting and that a researcher should not feel at liberty to
inject self-interpretation into the data without some noticeable and/or triangulated
evidence to support that interpretation. Where the procurement of evidence or additional
knowledge through quantitative analysis is possible, it should be sought for further
verification and/or support of any qualitative interpretations.
The research beliefs above lean closer to that of post-positivist. This research, like those based on
post-positivist view, still sees a need for the attempt to seek objective and generalizable knowledge
about social patterns (Trochim, no date) but at the same time recognizes the complexity of social
phenomena and the presence of subjectivity in the researchers, the research participants, and their
interpretations of the truth (Taylor and Medina, 2013). Post-positivists reject the notion of total
scientific objectivity and the pursuit of absolute truth devoid of context (Bohman, 1991; Eagleton,
2003). Instead, post-positivists see researchers as being able to observe only a limited amount of
evidence (Ciao, 2011) and that observations and measures are in fact fallible in deriving at theories
that can be revised (Allmendinger, 2002; Trochim, no date) when someone presents evidence that
are contrary to them (Ciao, 2011). Hence, there is a shift in the research emphasis among post-
positivists from that of causal reasoning to discovery and confirmation of meaning (Moore-Milroy,
1991).
Since post-positivists still aim to get at the truth in as objective a manner as possible within a
subjective setting where observations and measures are fallible, many: 1) see it as their
professional and ethical responsibility to recognize and put aside their own biases and beliefs
(Trochim, no date) and make every effort to objectively observe, extract, and present reality as is
present in the minds of research participants (Ritchie and Rigano, 2001) and in the phenomenon
being studied and 2) advocate for the use of multiple methods and measures to triangulate across
different sources to try and gain a clearer picture of the truth of the situation or phenomenon
(Trochim, no date). Such methods may be quantitative in nature or qualitative in nature and can
include quasi-experiment (Taylor and Medina, 2013), survey, interview, participant observation
(Creswell, 2008), and more.
As there is recognition that “truth” or “reality” is likely to be subjective and as argued by
interpretivists, to also be varied depending on the specific interpretation of the specific researcher
within the social context of the research, this doctoral research:

70
1) Sees truth or reality as information and assertion that is supported by reasonable and/or
verifiable evidence. In the case of this doctoral research, such evidence can be objective,
such as actual employment benefits given to employees, or can be subjective yet true in the
minds of employees, such as employees’ own experience and resultant motivation upon
receiving or not receiving a promised employment benefit. While there is merit in the
general argument that “reality” may not be true reality, there is certainly also merit in the
argument that reality is what one experiences. It is his/her very true reality, thus might have
very real impact on his/her motivation and actions. Such reality, along with those that are
verifiable, and the possible impact of these combined realities on employees’ performance, is
what was explored in this research.
2) Acknowledges that it is unlikely to be able to uncover the whole truth of what employees’
experiences or views may be with their organization and/or the organization’s employer
branding efforts and/or their actual performance in response to these employer branding
efforts. This is in recognition of the fact that many aspects could have influenced an
employee’s ability or desire to share the truth about his/her experience and observations,
and the fact that one might only be able to verify some information but not others.
3) Accepts that the interpretation of what would be deemed as truth or reality would be based
in part on evidence when it exists, and in part on logical deductions when strong evidence
does not exist.
4) Concedes that the interpretations of truth or reality might be applicable only within the
context of this research, within this or very alike organizations, within a specific point in
time, and maybe even only with this specific group of employees.
The philosophical leaning of the doctoral research has two key implications on the study, one is the
decision to apply a mixed-method case study where both quantitative and qualitative means are
used to collect, cross-verify, and analyze data, and second is the mixed view of interview and
treatment of data. The implications are explained in more detail in the subsequent sections of this
chapter.

71
Context, Content, and Process Considerations
In addition to ontological and epistemological views, the choices of one’s research methodology
and data collection methods are also determined by not only the research objectives but also by
the overall nature of the inquiry and phenomenon being investigated.
In social sciences, researchers have mainly presented their scientific explanations through one or
both of the core approaches of variance theory and process theory (Mohr, 1982), though there are
indications that variance theory is the dominant approach used (Mohr, 1982; Ledford, Jr., 1985;
Chiles, 2003; Langley et. al., 2013) due to the continuous calls for evidence-based management
decisions and actions (Pfeffer & Sutton, 2006; Rousseau, 2006).
Mohr (1982) describes variance theory as oriented towards explaining the variance of a dependent
variable (pg. 9) that resulted from its relationship with and thus variance of the independent
variable(s) (Langley, 1999; Chiles, 2003). He distinguishes variance theory from process theory by
describing the latter as a series of events in a sequence over time that explains how the
phenomenon or outcome materialized. Langley et. al. (2013) further explained that process studies
“address questions about how and why things emerge, develop, grow, or terminate over time,…
thus, focuses empirically on evolving phenomena and draws on theorizing that explicitly
incorporates temporal progressions of activities as elements of explanation and understanding.”
(pg. 1). Aside from temporal progression, Mohr (1982) and Langley et. al. (2013) also emphasize
the significance of probabilistic interaction between entities that leads up to the phenomenon or
outcome.
This doctoral study will call upon both variance theory and process theory to offer a more
comprehensive insight into the relationship between employer branding and employee
performance.
A key goal of this study is to determine if and in what manner influence exists between employer
branding, particularly the fulfillment of employer brand promises, and employee performance. The
mainly quantitative investigation to achieve this goal was grounded on the variance theory.
However, the revelations of such investigation would not be sufficiently meaningful without the
accompaniment of insight into how the organization actually attempts to link their employer
branding efforts to employee performance and how such attempts might in fact yield a direct or
indirect relationship between employer branding and employee performance. The investigation and
explanation of such know-how type knowledge (Langley et. al., 2013, pg. 4) consisting of the
sequence of employer branding activities as well as the interactions between different entities and
factors in the process that could lead to the anticipated outcome of better employer performance
is, in general, in line with that of the process theory.

72
While the variance of performances, resulted from the relationships and changes in employees’
perceived level of employer brand promise fulfillment, can be statistically tabulated in a relatively
black and white manner, the same cannot be said about the execution of employer branding itself
and how it might enhance employee performance.
Existing literature defines employer branding as a process or aspects related to a process of
establishing, communicating, and delivering the content and targeted impact of the employment
values promised by the organization to its potential and actual employees. The qualitative
component of this doctoral study will specifically examine what factors exist in the process of
delivering the content of the employment values promised by BOB to its employees and how these
factors and the process of employer branding itself might produce positive change in employees’
performance.
How a process or factors within a process influence performance can often be affected by forces
and conditions in which the process exists. Pre-existing forces or conditions in an organization’s
external and internal environment that impact the success or failure of an organization’s change
efforts (Johns, 2001) and performance (Al-Shahi, 2008) are called context (Walker, Armenakis, and
Bernerth, 2007) and much has been written about the impact of context on both the content and
process of change. External forces or conditions include governmental regulation or deregulation
(Kelly and Amburgey, 1991), competitive pressure (Meyer et al., 1990), technological innovations
(Haveman, 1992), or social expectations (Pettigrew, 1987), for which organizations often have little
control and must respond accordingly. Internal forces or conditions, on the other hand, include
managerial attitudes toward change, technical knowledge, and slack resources (Armenakis and
Bedeian, 1999), organizational strategy, structure, culture and management processes (Pettigrew,
1987) and experience with previous change (Armenakis and Bedeian, 1999).
In BOB’s case, there were various unique as well as less unique forces and conditions that had
likely shaped not only its employer branding process but also the management of human resources
as a whole. The first of this example being its 100% employee-owned structure, which was and
still is not the norm even among the variety of employee ownership structures. For one, being a
fully employee-owned organization could mean that power in decision making would be genuinely
rather than artificially more decentralized and dispersed, thus employees would have input on the
sort of employment benefits or services that the organization would offer its employees. This
appeared to be the situation at BOB. It would certainly mean that the organization could offer
shares as a benefit to employees while non-employee-owned organizations would not be able to
do so. Being members of a 100% employee-owned structure could mean that employees saw
themselves as full business owners and partners rather than employees and this could affect how
they viewed the contribution and outcome of their decisions and their work. It could mean that
employees would demand cost-consciousness on the part of the organization and in return would
be willing to take lower monetary benefits in exchange for some other non-monetary benefits. This

73
would likely not be the case with employee in non-employee-owned organizations or in a unionized
setting. It could also mean that employees expected specific programs to be in place to enhance
the development and productivity of everyone in the organization so that the organization (and
they as the owners of the organization) would do well as a whole. Its 100% employee-owned
structure had likely contributed to the high value the organization placed on maintaining a long
term relationship with its employees, as reflected by their “cradle to grave” philosophy to employee
relations management. Ultimately, the 100% employee-owned structure could shape many other
decisions and actions that employees in non-employee-owned or partially-employee-owned
organizations might experience differently.
Other conditions that could have affected how BOB designed and/or executed its employer
branding processes included:
The fact that around ¾ of its workforce came from an engineering, environmental, or
technical background, thus they might have very specific needs, particularly in
development.
The employees in this research were all located in the highly competitive and prosperous
energy-focused province of Alberta, Canada, thus competition for professionals with
engineering, environmental, or technical background would be particularly high. This would
increase the pressure for BOB to have effective mechanism to attract, retain, and develop
its human resources.
It had a strong culture of employee participation, likely due in large part to the fact that it
was 100% employee-owned and this resulted in consistently longer and more tedious
process of decision making.
The fact that at the time of data gathering, the organization was undergoing rapid growth
and had an incoming workforce in its Alberta sites that were young, educated, and
motivated. Rapid growth and change could have affected the time and ability the
organization had in adapting its programs, services, and resources to accommodate a
quick and large influx of new employees. As well, the age bracket of the new employees
were noticeably lower than existing long-time employees and such age or generation gap
could pose various issues in terms of differences in worldviews, work ethics, work attitude,
work-life needs, technical and technological abilities, leadership expectations, and more.
In combination, these and other less evident conditions could shape the types of employment
values BOB offered, the manner in which it saw and communicated about the sort of employer it
was, the manner in which it delivered its employer brand promises, and the manner in which it
developed and engaged its workforce. In terms of how or why these occurred was investigated in
the qualitative component of the study.

74
The organization’s context was rich, complex, and unique to itself and most importantly, the
conditions that formed the context could have either constrained or enabled the materialization of
the organization’s intended change and outcome through how and why they shaped the
organization’s decisions and actions (Pettigrew, 2012). Among these would be its human resources
management strategies and practices, including its employer branding strategies and practices.
This in turn would have likely affected in some manner and/or to some degree, the changes or
outcomes thought to be yielded by these strategies and practices, such as employee performance.
In this study, the examination of how change in employee performance could have occurred as a
result of factors in the employer branding process or of the process itself is one of a-slice-in-time
rather than longitudinal with time series data. As continued observations to record change in
employee performance was not possible, the focus turned to analyzing and interpreting how the
history, patterns, factors, and process identified at that slice-in-time could have likely enhanced
employee performance.
Aside from existing context, changing context would further affect processes such as the process
of employer branding. The interesting distinction among process scholars is that those who
subscribe to the Democritus ontology view organizations and the world as a whole as made of
stable substances and those who subscribe to the Heraclitus ontology view organizations and the
world as a whole as made of up of processes or a dynamic bundle of qualities (Rescher, 1996;
Tsoukas & Chia, 2002). One might interpret that in a Democritus view, an organization’s
performance is a stable substance impacted by the organization’s processes, entities, players, or
other performance relevant factors. When emerging external or internal forces disrupt or change
the original capacity of the processes, entities, players, or other relevant factors to shape the
organization’s performance, such organizational performance is then affected.
In a Heraclitus view, an organization’s performance is itself a series of activities and events
combined with regular interplay that exists among entities. Together, they bring reality into being
(Langley et. al., 2013).This series of activities and events as well as the entity interplay continually
morph and reconstitute over time through interactions with one another. Over time, some
qualities, which might include some part of the organization’s performance, endure longer than
others but none can remain unchanged forever (Langley et. al., 2013).
The view of changing processes due to imposing forces or through organic metamorphosis could
also apply to BOB’s case. Over time, BOB’s existing practices, processes, and relevant entities of
employer branding that one concludes, at the time of the research, to have a positive influence on
some employee performance, might naturally change, might no longer be effective, or might be
even more effective due to the gradual evolution or sudden change in its: targeted or entering

75
workforce and their needs; organizational priorities and corresponding performance expectations:
leadership personnel and direction; and many other reasons.
This leads to the recognition that whatever configuration of strategies, processes, and entities that
might work effectively at one point in time to yield an organization’s targeted outcome or reality
will likely not work the same sometime down the road due to the organization’s responses (or lack
thereof) to the external or internal forces that it will encounter over time as well as due to the
continuous interactions among the different entities, players, and factors within BOB’s existing
processes and systems.
As a whole, the context that affects the process and content of employer branding at BOB makes
the entire phenomenon of employer branding at BOB and its potential relationship with employee
performance a complex, intricate, and exciting case to study. A mix-method single case study was
deemed the appropriate methodology to frame and execute the investigation of this complex
phenomenon due to reasons explained in the next section of this chapter.

76
Using a Mixed-method Case Study
Kathy Eisenhardt (1989) defined a case study as “a research strategy that focuses on
understanding the dynamics present in a single setting” (pg. 536). This study intended to do just
that by exploring the “what” the “how” of employer branding and its relationship with employee
performance within the dynamic setting of one deemed best-of-the-best employer in Alberta,
Canada. The reasons for why and how this organization was chosen was already explored in depth
in Chapter 1 of this dissertation.
A case approach allows the researcher to take the necessary steps and pay the necessary attention
to explore in a flexible, in depth, and triangulated manner, the complex phenomenon of employer
branding and its relationship with employee performance, within a dynamic setting framed by a
unique context. Due to the intent to explore both the quantitative and qualitative asepcts of
employer branding and its relationship with employee performance, a case study using mixed
methods was deemed the appropriate choice for the investigation.
Complexity of phenomenon
Extant literature in employer branding and human resource management offers indication of the
complex, cross-functional, and mixed-element nature of employer branding. In addition to its own
complex nature, employer branding exists within an organic structure (the organization) with many
stakeholders and even more complex interactions. As discussed in the literature review section of
this proposal, current knowledge on employer branding is still superficial. Its elements, processes,
and deliverables or even its underlying theoretical foundation/assumptions, purpose, and
framework remain vague and open to a wide range of interpretations. The complex nature and
interactions of employer branding need to be understood before any viable theories of
relationships can be derived and further tested.
The case study was deemed an appropriate research method to investigate and offer empirical
insight into such complex phenomenon. According to Yin (2002, p. 4 and 2003, p. 13), the case
study method allows the researcher to investigate a contemporary phenomenon within its real-life
context where complex interactions occur between the phenomenon and its context, making the
boundaries between these two entities not readily evident. Anderson (1998) indicates that a case
study is concerned with why and how things happen. It allows for investigation of differences
between what was planned and what actually occurred. In this study, the researcher will be
examining the phenomenon of employer branding as it is executed within its real-life organizational
and human capital management context. It aims to explore if and how employer branding
influences employee performance. How does the employer link its employer branding efforts to
employee performance? How does influence occur? The research will attempt to answer these
questions.

77
One aspect that might have added to the complexity of the phenomenon was the unclear
contextual boundaries that exists. One of the primary outcomes to be derived from branding, be it
corporate, product, service or employer branding, is “distinction” and “differentiation from its
competitors” (Backhaus and Tikoo, 2004). In the case of employer branding, it is the distinction of
the organization as the employer of choice for applicants and employees, thus also the
differentiation of the organization from other employers. Each organization’s employer branding
efforts as well as employer brand values, identity, and image may differ greatly, in response to the
organization’s vision, mission, culture, human capital management philosophies and other
influential factors. The number of combinations of employment benefits, identity, image, and many
other values that make up an organization’s employer brand would be astronomical and every
organization may have its own unique combination.
While this situation does not prevent large scale confirmatory investigations to be carried out on
some aspects relevant to employer branding (e.g. finding out what most job seekers find attractive
in a workplace), it does make it very difficult to explore the complex nature of employer branding
and the relationships that are influenced by its many brand values, identity, or image, unless the
investigation of the phenomenon is done within a bounded context (Miles and Huberman, 1994)
such as a specific organization using its own specific set of employer brand values and promises,
identity and image. When repeated case studies are done across various types of organizations
over a reasonable period of time, patterns may emerge to confirm or refute proposed theories.
At this stage in the field of employer branding, no academic research has been found by the
researcher on the relationship between employer branding, as represented by employer brand
promise fulfilment, and employee performance, as represented by the dimensions of task
performance and organizational citizenship performance, although there are likely some related
human resource management studies. As such, it would be appropriate for the researcher to
initiate her exploratory investigation with a specific organization that meets the research criteria,
using the case study method.
Triangulation of data
The third reason why the case method was deemed an appropriate research method for this
project was that it allowed for triangulation of data through the use of a combination of
quantitative and qualitative methods. The main research project was done through a single case
study that used the following mixed-methods:
1. Qualitative method of in-depth interviews of managers to explore the intricacies of the
organization’s employer branding exercise and its association with employee performance
enhancement. It was used to answer research questions 1 and 2.
2. Material review to verify the presence of items or incidences asserted by managers in their
interviews as well as to corroborate assertions by managers regarding work practices.
78
3. Quantitative methods of employee survey to determine the types of relationships that
might exist between different aspects of employer brand promise fulfillment and
employees’ organizational citizenship and task performances. It was used to answer
research question 3.
In spite of the paradigm wars (Bryman, 2007, p. 14-15) that still exist between positivists and
intepretivists, many researchers today are more accepting of paradigmatic diversity (Buchanan and
Bryman, 2007) and contending that qualitative and quantitative methods can be combined and
used in a pragmatic and mutually-enhancing manner (Eisner and Peshkin, 1990; Phillips, 1990;
Schofield, 1990; Tashakkori and Teddlie, 1998; Johnson and Onwuegbuzie, 2004; Buchanan and
Bryman, 2007) to 1) triangulate data and offset the shortcomings of either paradigm (Tashakkori
and Teddlie, 1998) as well as strengthen the validity of research (Rhein, 2013), 2) allow for
“methodological pluralism or eclecticism, which frequently results in superior research” (Johnson
and Onwuegbuzie, 2004; p. 14), and 3) fulfill the mutual aim of better understanding of the realm
in which we function (Haase and Myers, 1988).
According to Buchanan and Bryman (2007), such increased openness to paradigmatic diversity and
methodological innovation is due to the fact that the field of social science (in which this doctoral
research is grounded) is a meeting point for numerous disciplines including psychology; social
psychology; sociology; economics; history; anthropology; and the business areas, and each of
these disciplines and related sub-disciplines brings its own distinct perspectives and traditions that
cannot be ignored (pg. 486). Ultimately, such mixed-methods “provides opportunities for greater
insight than can be achieved by one approach alone” (pg. 487).
In this study, the researcher will not simply attempt to determine if and to what extent
relationships exist between the studied dimensions of employer branding and the studied
dimensions of employee performance. She will also endeavour to uncover why and how the
relationships materialize and how they are preserved within its complex and organic environment.
The increased depth in the investigation will likely enhance both the scholarly insight and practical
use of the knowledge gained.
To gain the intended information, both quantitative and qualitative exercises have been used to
collect data from various sources in the organization. These sources consist of managers who
represent the organization and employees. Many employer branding studies thus far have been
done solely from the perspectives of the managers or personnel responsible for developing and
executing employer branding efforts in organizations. This is not surprising or unreasonable
considering that much is still unknown about different aspects of employer branding and that it
would make sense to first investigate these aspects (reference) with those who develop and/or
deliver employer branding. However, in a study to determine the relationship between employer
branding and employee performance, one would need the employees’ perspectives to generate a

79
more accurate, two-sided picture of this relationship. As such, this case study will seek responses
from both managers and employees for this component of the study.
A mixed-method case study method allows for multi-angle investigation with different methods and
sources. Yin (2003, p. 14) indicated that in a case study, the richness of the context may pose
more variables of interest than data points, making it necessary to use multiple sources of
evidence to seek converging data. There are certainly multiple variables of interest in this study,
thus a combination of qualitative (document/material review and management interviews) and
quantitative methods (employee survey) will be employed to 1) collect the information sought form
the different sources, 2) determine overarching themes and 3) enhance validity of results (Yin,
2003).
With a leaning towards a post-positivist view, the researcher recognizes that the rich, valuable, and
in depth information on the organization and its employer branding practices provided by the
research participants is likely highly subjective, hence, sees a need to counter-balance and reduce
this subjectivity through methods that would produce more objective evidence to verify, support,
and/or provide further indications of the supposed truths gathered from the research participants.
Rossman and Wilson (1985) indicate that the use of mixed methods would accomplish three critical
feats, first being corroboration or convergence of findings, second being elaboration or provision of
richness and detail, and third being initiation or prompting of new insight, interpretations, and
areas for further exploration. As a whole, the researcher sees the use of mixed-methods to gain
and analyze data from multiple relevant sources as a research approach that would allow the study
to a gain a more comprehensive and better substantiated insight into the matter under
investigation.
This acknowledgement is not an indication that the researcher sees her chosen methods as the
only methods that would accomplish the balancing act or that the mixed methods would eliminate
all subjectivity from the research process and findings. It does, however, explains the researcher’s
perceived need to counter-balance subjective thoughts with more objective measures and findings
in order to get closer to whatever truth that define the phenomenon under investigation.
The use of a single case
The study of a single case was deemed a suitable choice to frame and execute the quantitative
and qualitative methods. As identified in the literature review much is still unknown and need to be
explored in detail about the intricate nature of employer branding. Ultimately, the more cases of
employer branding that are examined, the richer and possibly more concrete the information one
would likely obtain. However, in order to allow for a proper and detailed exploration of such
phenomenon in a doctoral study, one has to take into consideration the limited resources,
restricted timeframe, novice research capacity, and academic-research boundaries that confines a
doctoral project. In an attempt to produce quality investigative work within the constraints of a
80
doctoral study, it is concluded that a thorough investigation of a single, purposefully chosen case
would be appropriate. This can be followed up in the future with broader investigations involving
more organizations, more research participants, and possibly more dimensions of employment
branding.
Case Selection
In order to allow for the testing of the assumption and to yield rich and meaningful information
that could truly enhance both theoretical and applications knowledge in the relationship between
employer branding and employee performance, the researcher set out to find a case organization
that has proven to have successfully branded itself as a great place to work, as confirmed year
after year by its employees and recognized publicly as such by prestigious national best employer
rankings and other media. As the number of such organizations was still considerable, the
researcher further refined the search by narrowing the criteria to the following:
1. Have been recognized at least seven times by either one or both of the two rankings,
Mediacorp Inc.’s Canada’s Top 100 Employers and Aon Hewitt’s 50 Best Employers in Canada,
for the seven year period from 2005, when both rankings began to exist simultaneously
(Canada’s Top 100 Employers existed before 50 Best Employers in Canada) to 2011, when
data collection for the case study began.
2. Have been recognized in other major Canadian national or provincial choice/top/best employer
rankings and/or have articles written about their success or innovativeness as an employer.
Have also won other awards for organizational, service, or operational excellence. These
additional recognitions will strengthen the confirmation of the organization being not only a
distinguished employer of choice but congruently also a distinguished organization in its
operation, service or as a whole.
3. Have confirmed that it currently has an employer branding strategy in place and, more
importantly, that it links its employer branding initiatives and activities to employee
performance.
4. Is a service-oriented organization. Rationale for this criterion is provided below.
Employers that met criteria 1 and 4 were shortlisted for consideration. A review of criterion 2 was
done on the shortlisted organizations. In the end, two organizations that also met criterion 2 as
well as have head offices within accessible distance by the researcher were contacted for
verification of criterion 3 and inquiry about participation in the research.

81
In the end, one organization was chosen due to meeting all criteria, willingness to participate, and
having had a history of supporting different human resource and operational research within their
organization.
In total, the search started with the consideration of 365 organizations that have won a ranking in
either Mediacorp Inc.’s Canada’s Top 100 Employers or Aon Hewitt’s 50 Best Employers in Canada
from the period 2005 to 2011. Then the list was reduced to 33 employers (9%) that had met
criterion 1 and further reduced until organizations that met all four criteria and were readily
accessible by the researcher were chosen.
The organization selected for the research not only met but actually surpassed the criteria set.
Well-respected and a multiple award winner in the environmental field in Canada and abroad, this
organization is known as an innovative, high performance, high integrity organization. It is not only
recognized as a great place to work but also as a great and trustworthy organization with which to
do business. The organization would have been an ideal case organization regardless of whether it
was or was not accessible by the researcher. The fact that it was accessible to the researcher was
an added advantage.
Profile of Chosen Case Organization and Research Sites
The chosen organization, herein known as BOB (Best of the Best) has achieved the following
recognitions:
Has been recognized for a combined total of 10 times by Canada’s Top 100 Employers and 50
Best Employers in Canada rankings between 2005 and 2011. Of the 365 employers that have
been recognized by either Canada’s Top 100 Employers and/or 50 Best Employers in Canada
from 2005 to 2011, only 23 have ever made both lists. Of those that have ever made both
lists, only five have made them for a combined total of 10 times of more. That puts BOB in the
top 1.37% of recognized best employers in Canada. BOB continues to remain on one or both
lists for 2012 and 2013. Ultimately, BOB is not just one of Canada’s best employers but is, in
this situation, one of the very, very small number of Canada’s best of the best employers.
In Canada, BOB has also been recognized as one of Canada’s Top Employers for Young
People, Canada’s Best Managed Companies, Province of British Columbia’s Top 55 Employers,
Alberta’s Top 60 Employers, and The Financial Post’s Ten Best Companies to Work For. Outside
of Canada, BOB has been recognized as one of Sunday Times’ 100 Best Companies to Work
For – United Kingdom, Deloitte Best Company to Work for – Africa, Hewitt’s Best Employer
Awards Finalist (for five consecutive years) – Australia, and CE News Best Environmental

82
Services Firms to Work for – United States. In addition, BOB has won numerous other business
and industry awards.
BOB’s ongoing and multiple recognitions as a great employer reflects not only the effectiveness of
its human resource management practices but also the success of its ability to strengthen and
maintain its employer brand through repeated participations in such competitions and then the
publicities of its many public recognitions. It is realistic and conceivable that employers that have
but do not publicly compare or confirm their effective and innovative human resource management
practices are not as well-known to the Canadian workforce as a whole or even to the workforce
within their own industries. The creation and maintenance of an employer brand requires the
organization’s conscious and continuous effort to not only build superior human resource programs
and practices but also to keep the organization and its practices known and relevant in the eyes of
job seekers and job holders. It appears that BOB has been able to do both very successfully,
making this best of the best Canadian organization a worthy case study.
BOB is a 100% employee-owned, global company that provides independent environmental
consulting, design, and construction services. Each year BOB manages over 30,000 projects for its
clients in various regions of the world. BOB was founded in 1960 by three partners and, according
to the organization’s most recent annual report (2012), it currently has over 9,000 employees in
180 sites in Africa, Asia, Australasia, Europe, North America and South America.
Over 90% of BOB’s workforce is full-time and the largest group of professionals, consisting of over
2,700 personnel, are engineers, followed by about 1,900 personnel in administration. The majority
of BOB’s workforce is between 20 to 50 years old, with the largest group between 30 to 40 years
old. As well, over 60% of BOB’s workforce is men. BOB has experienced a 76% employee growth
since 2007. BOB has between 400 and 800 job postings globally at any given time. In 2012, it
hired 1,200 new employees in Canada alone. In 2012, BOB’s Canadian operation also maintained a
retention rate of 88%, with the retention rates for its core group of 20 to 50 years old ranging
from 81% to 89%.
BOB has over 3,600 personnel in Canada, representing the largest percentage of its 9,000 strong
workforce. It was not feasible for the organization to coordinate the participation of all Canadian
sites for this case study, hence, the investigations for this case study were conducted at two of the
organization’s key Canadian sites, Calgary and Edmonton. Both sites are located in the province of
Alberta and are within 300 km of each other. Calgary, with 750 employees (2012), has the largest
workforce of all of its global sites, while Edmonton has 180 employees (2012). While BOB
considers itself as not having a specific global headquarters, Calgary was seen as the organization’s
unofficial global headquarters, with key leaders, including the CEO, located at that site. For this
specific case study, Calgary was an ideal site as it has served as the organization’s unofficial
incubation site for human resource management practices and initiatives. Various human resource
initiatives have been designed, developed, and trialed before being rolled out to other sites in

83
Canada and beyond. This site has also been instrumental in establishing and enhancing the
organization’s employer brand. Their employer brand communication and enhancement efforts
include ensuring the organization’s continual participation and recognition in Canada’s Top 100
Employers and 50 Best Employers in Canada rankings. Edmonton is the closest ‘large’ site to
Calgary and was approved by the organization as a second investigation site. Adding another key
site to the investigation was particularly useful in the researcher’s assessment of whether the
organization’s employer branding efforts and outcomes remain consistent outside of what might be
deemed as the nucleus site for the organization’s employer branding initiatives.
BOB conducts an annual employee engagement survey using the Gallup Q12 employee
engagement questionnaire. In 2012, its mean employee engagement score for the Edmonton and
Calgary sites, where the case study was conducted, was 80%, a score that had steadily gone up
from the previous years. The mean employee participation rate was at over 90%. BOB’s employer
branding and overall human resource practices that led to its best employer and employer of
choice status was explored and is discussed in detail in the results and analysis component of this
dissertation.
Rationale for choosing an employer from the service sector
While the pilot study that informed this research did not distinguish between service and other
sectors, this research will focus on an employer in the service sector. In Canada, where this
research was conducted, 75% of its workforce and 70% of its Gross Domestic Product is
attributable to the service sector (Industry Canada, Jul 2009 & Aug 2009). From extant branding
literature, one would conclude that the understanding and enhancement of employee performance
within the service sector is of major importance (Martin et al., 2005; Bodderas et al., 2011). That is
because a service-producing organization’s performance is mainly or solely affected by employee
performance, which is unlike a goods-producing organization, where performance is affected less
by people and more by products and their support systems such as delivery time, warranty, bundle
discounts, etc. (Zerbe et al., 1998).
For a service-producing organization, employees’ expressed views, behaviours and actions can 1)
be taken as a direct projection of the organization’s corporate/service brand values (Ind, 2001;
Nguyen & Leblanc, 2002; Punjaisri et al., 2008), 2) have significant influence on customers’
impression of the organization (de Chernatony, 1999), 3) directly impact customer satisfaction,
loyalty, and retention (Keaveney, 1995; Zeithaml et al., 2006), and 4) noticeably affect the
organization’s overall reputation (Lloyd, 1990, p. 182). As there may be little perceived difference
between service offerings (McDonald et al., 2001), employees’ performance would become the key
generator of distinction and value for their organization and its corporate or service brand (Pfeffer,
1994). Employees’ poor performances in such a setting can literally destroy their organizations’
84
reputation and/or brand image (McEwan & Buckingham, 2001) as well as bottom line. The direct
effects that employees’ performance have on the competitiveness and survival of service-producing
organizations combined with the significant numbers in employment and GDP attributable to this
sector makes a service-sector-focused research relevant, essential, and valuable.
Data Collection
Data for this case study was collected through multiple sources and activities, namely documents
and materials review, managers interviews, and employee survey. The value of having a chain or
multiple sources of evidence has been highlighted by a number of scholars (e.g. Yin, 1984; Miles
and Huberman, 1994). The researcher was able to verify both organizationally-written, and
interviewee-verbalized claims by cross-referencing documents and survey results throughout the
data collection and data analysis period. Such triangulation reduces bias (Miles and Huberman,
1994) and increases the reliability of information gained in the case study (Yin, 2003).
Materials Review
The data collection exercise began with the gathering and review of relevant organizational
documents and materials. Materials reviewed included:
Global and Canada Website Content
o Purpose, vision, and values; leadership structure, organizational foci (health and safety,
sustainable development), history; career information – recruitment programs,
compensation and benefits overview, job postings, highlights of being an award winning
workplace; types of services offered, featured clients and projects; news, awards listing,
newsletters, professional publications, annual reports, and fast fact sheet.
Intranet Content (the intranet is an employees-only site)
o Employee engagement survey reports, exit interview reports, training options and
schedule, internal occurrences, organizational updates.
BOB’s 50th Anniversary book
Organizational or service Promotion materials not on the website
Orientation materials
o Code of conduct, career pathing, organizational policies, benefits listing

85
Starting the investigation by reviewing the organization’s documents and materials provided the
researcher with a foundational understanding of some key aspects of the organization including its
governance structure, operational structure, history and evolution, types and magnitude of services
offered, employee activities, general characteristics of its workforce as well as its declared
organizational values and priorities. In addition, materials such as the code of conduct and
organizational policies provided the researcher with an awareness of the specific human resources
management processes and practices within the organization. Materials such as the group benefit
listing and the organization’s training options and schedule on its intranet were useful in confirming
the presence of specific employee provisions, and materials such as employee engagement reports
and exit interview reports allowed the researcher to get a sense of how engaged employees were
within their departments and the organization as a whole, reasons for employee exits, and issues
of concern to employees.
As a whole, information gained from the materials review had allowed the researcher to establish
an initial knowledge framework and preliminary themes that were used to inform the subsequent
managers interviews. The information provided a background understanding and context to certain
assertions made by interviewees as well as to the data gathered in the interview. The researcher
was also able to verify certain claims made by interviewees by referring back to the materials
present.
Managers’ Interviews
After the gathering and review of the organizations’ documents and materials, the data gathering
continued with one-on-one in-depth semi-structured interviews with:
Sample 1: Five managers who were responsible for designing, planning, developing,
implementing, and overseeing the employer branding efforts and initiatives in the
organization.
Sample 2: Fourteen managers who had no official responsibility for planning and overseeing
the organization’s employer branding efforts or initiatives but were involved in
delivering some of the initiatives, as directed.
The ultimate goal of this case study is to determine the extent of influence that employer branding
has on employee performance. However, prior to verifying the presence and extent of such a
relationship, the investigation started with the exploration of how this best-of-the-best employer in
Canada linked employee performance to employer branding and how it attempted to enhance its
employees’ performance through its employer branding efforts, particularly the delivery of its brand
promises. The complexities and challenges faced by the organization in its employer branding
efforts were also examined.

86
As much complexity is present in the consideration, selection, execution, and on-going
management of an organization’s employer branding strategies, an in-depth semi-structured
interview would allow the researcher to thoroughly probe the subject with the participants - delve
into perceptions that might not have been readily or easily shared, explore the basis for
unanticipated assumptions, seek evidence for claims, and ultimately extract information that might
not have been readily present and would otherwise not be extractable with a more restrictive
method like survey.
Along with existing literature as well as results of the pilot study and document/material review,
the insight gained from this exercise informed the development of the employee survey
questionnaire.
Paradigmatic influence on the view of interview and data handling in this doctoral
research
Corresponding to the main research paradigms of positivism and interpretivism are the neo-
positivist and romanticist views of interview. In line with the positivism, neo-positivists see
interview as a tool or a set of strict protocols used to establish context-free truth about reality in a
manner that minimizes the researcher’s influence and other biases (Alvesson, 2003; Alvesson,
2011; Qu and Dumay, 2011). Neo-positivists see interview participants as truth tellers and assume
that their interview responses mirror reality (Alvesson, 2003) and accurately reflect their
experiences as well as the observed condition of the phenomenon being studied (Alvesson, 2011;
Qu and Dumay, 2011). Hence, under this view, a researcher’s role is to be neutral (Qu and Dumay,
2011) and in some way detached, and to objectively use the interview process as a “pipeline for
transmitting knowledge" (Holstein and Gubrium, 1997, pg. 113). Neo-positivists prefer the use of
structured interview as it asks the same list and order of questions of each interview participants.
Such approach is assumed to minimize interviewer interference (Alvesson, 2003) as well as evoke
more rational (Qu and Dumay, 2011) and directly comparable interview responses (Berg, 1998).
Contrary to neo-positivist is the romanticist view of interview. Romanticists see the interviewer as
an empathetic listener (Qu and Dumay, 2011), treat the interviewer and interview participants as
equals and emphasize the “interactivity and closeness” to participants involving the development of
mutual trust and commitment (Alvesson, 2003, p. 16). Romanticists often use unstructured
interview, where there is no pre-set questions presented to each participant as such fixed set of
questions are seen as tainting or priming the participants’ minds. Instead, they try to make
participants feel relaxed and unassessed (Hannabuss, 1996) so that real conversation where “give
and take” and “emphatic understanding” can occur (Fontana and Frey, 1994). It is assumed that
this would make it possible for the interviewer to activate the participants’ interpretative
capabilities (Holstein & Gubrium, 1997), access the participants’ own non-interviewer-influenced
perspective on the phenomenon being studied (Green, 1998), and ultimately, as Miller and

87
Glassner (1997) put it, gain “deeper, fuller conceptualizations of those aspects of our subjects' lives
we are most interested in understanding” (pg. 103).
While neo-positivist and romanticists may differ greatly in their view of the roles of the interviewer
and the participant, or of how best to gain information from participants, they appear to share the
same perception that data they gain mirrors reality as well as share the same goal of getting the
“truth” from the interview participants. Both neo-positivistism and romanticism have been criticized
for: treating interview participants as passive vessels of answers; ignoring the subjective nature of
the social interactions between the interviewer, the participants, and other parties in picture such
as the employer; not taking into account power differentials and factors that might influence
interview responses such as the differences between the interviewers and the participants in terms
gender, age, professional status, ethnicity and appearance (Qu and Dumay, 2011). Both have been
faulted for likely producing superficial, cautious, and possibly even untruthful responses from
interview participants (Alvesson, 2003).
The management interview in this doctoral research is informed by the belief shared by many
researchers and that is, no matter how well-informed and substantiated one’s interpretation of
data and findings may be, it is still not possible to fully escape one’s own subjectivity (De Loo and
Lowe, 2011), be they resulted from the interviewer or the interview participants or as in most
cases, from both parties. In the case of this doctoral research, the researcher recognizes the
possibility that she had injected subjectivity into the interview, either during the development of
the interview protocol, selection of interview questions, delivery of the interview sessions, and/or
interpretation of the data and evidence. The researcher also recognizes the likelihood of
subjectivity in the responses provided by interview participants. In particular, an interview
participant’s account of his/her personal experience with the organization’s employer branding
efforts could be very different than that of another person. His/her own actual experience could in
fact be different than that which he/she described to the researcher. This could be due to various
factors (Lowe, 2001) including but not limited to: his/her personal desire or the organization’s
expectation for him/her to tow the party line (Covaleski et. al., 1998), his/her lack of personal
awareness of what he/she experienced or felt, his/her lack of organizational awareness of what
was really happening in the workplace, his/her interest to appear supportive of the organization’s
employer branding efforts, his/her distrust of the research motive, assurance of confidentiality (Qu
and Dumay, 2011), and/or of the consequences of telling the truth. Together with the interviews of
other participants, the recorded experiences could be a large or small variation of the facts (Lowe,
2001) in the organization’s overall situation or even in each participant’s own situation. They could
also be an indication of impression management (Alvesson, 2011; Qu and Dumay, 2011) or
indoctrination.
The recognition of the large amount of subjectivity that is possibly present in the interview process
and in the data it yields prompted the researcher of this doctoral research to be more skeptical but
at the same time not dismissive of the responses gained from interview participants. Where
88
possible, the researcher made effort to find evidence and/or counter-evidence to substantiate or
refute information gained. In spite of the effort, it was almost impossible to yield fully objective
conclusions about the phenomenon being studied. As stated by Riessman (1993), the best that one
can achieve is a “credible, trustworthy account of specific events or phenomena, occurring or
witnessed, in a particular context” (in De Loo and Lowe, 2011, pg. 25).
While the above might be true, the management interview in this doctoral research is also
informed by the belief that the there is great importance in ensuring that accounts presented by
researchers are in fact credible and trustworthy and that the recognition of the existence of
subjectivity in the interview process and/or responses does not give a researcher the liberty to
increase subjectivity by presenting his/her own interpretation without adequate reference or
counter-reference to the original materials gathered. Society has often considered research
conclusions as something that people can use as reliable references to guide their actions and
decisions. Such people might be corporate leaders, government officials, policy and law makers,
educators, physicians, scientists, parents, guardians, and many more. They regard, rightly or
wrongly, research as an exercise done by experts who would help to shine the light on the “truth”
– credible and trustworthy accounts of things and situations. Some of these actions and decisions
based on the reported findings of the research can have serious consequences on the lives of
those on the receiving end of the decisions and actions. As such, one can argue that researchers
have a professional and moral obligation to present to the best of their ability, interpretations and
conclusions supported by reasonable and verifiable evidence or counter-evidence. Doing so does
not inhibit researchers from presenting their opinions or speculations as just that - opinions or
speculations. In the case of this doctoral research, the truth is defined not as absolutely truth
independent of context but rather interpretations or accounts founded on evidence or counter-
evidence. Without evidence or counter-evidence, relevant and speculation forming accounts will
still be presented but they will be done so as participant assertions or speculations that are not
substantiated.
Thirdly, the management interview in this doctoral research is additionally informed by Mat
Alvesson’s (2003) explanation of the localist view in that interview statements need be examined
and understood in their social context and that interview should not be treated as just an
instrument for collecting data in some independent setting outside of the empirical situation.
Ultimately, the management interview in this doctoral research does not fully subscribe to any one
of the most common views of interview and instead, is informed by a combination of the
researcher’s own ontological-epistemological worldview and acknowledgement of some logical and
pragmatic operational and methodological tenets within each view of interview. In this, the
management interview in this doctoral research leans towards the reflexive view of interview
(Alvesson, 2003; Roulston, 2010; Alvesson, 2011; Qu and Dumay, 2011).

89
Alvesson (2003) explained in his article, Beyond neopositivisits, romantics and localists: a reflective
approach to interviews in organizational research:
A reflexive approach does not privilege a particular ontology but can in principle be
combined with various paradigms and specific theories, although reflexivity in action may
well mean that various “substantive approaches” are not left intact, since reflexivity means
challenging and reconsidering assumptions and beliefs of what data are all about.
(pg. 25-26)
Reflexivity operates with a framework that stimulates an interplay between producing
interpretations and challenging them. It includes opening up the phenomena through
exploring more than one set of meanings and acknowledging ambiguity in the phenomena
and the line(s) of inquiry favored, and it means bridging the gap between epistemological
concerns and method.
(pg. 17)
Alvesson (2003, pg. 27-30) explained that this would result in implications for:
Methodological practice: Recognizing the influence of organizational politics on interview
participants’ ability participate honestly or effectively; relying less on interview to be the
only or central form of data collection; and understanding the limited ability of the
interview to translate a theoretical understanding into a set of technical rules.
More rigorous and reflexive approach to the use of interview materials for conventional
purposes: Recognizing that the validity of interview responses may not be high, thus the
need to be skeptical and challenging but not rejecting of the responses; being more
modest about empirical claims; and using the interview materials for inspirational or
illustrative purposes instead of claiming them as basis for the truth and/or for development
of theory.
Novel research questions and new line of interpretation: Recognizing that the interview
itself aside from the documented interview responses as an empirical situation to be
studied, particularly in terms of organizational discourse – for example, understanding the
dynamics of the interview situation, the participant’s view of him/herself in the
organizational context, the forms of language used, and/or how stories can give deeper
insight into what participants may be truly thinking, feeling, and doing in comparison of
what he/she said, not said, or said in a redirected manner in the interview, of what he/she
is thinking, feeling, and doing.
As highlighted in earlier paragraphs in this section, the researcher of this doctoral study shares the
sentiments expressed by Alvesson regarding implications on methodological practice and the need
for more reflexive approach to the use of interview materials. In addition, the management

90
interview in this doctoral research took note of the need to be aware of the different factors that
can shape the answers of an interview participant and in response, incorporated where possible,
some of the proposed actions to gain a more accurate picture of the reality of the managers’
experiences and observations regarding their organization’s employer branding efforts.
Sampling for the Managers Interviews
The population of managers in two Alberta branches approved by the organization for this case
study consisted of 42 individuals, with 35 working in the Calgary branch and seven working in the
Edmonton branch. This number did not include the organization’s highest level (Global) of
executive officers.
Firstly, a purposive sample of managers who were responsible for planning, implementing, and
overseeing the organization’s employer branding efforts and initiatives were assembled for the
interview. The sample for this group was not drawn on a random basis. As the population was
expected to be small and the aim was to gain as much insight as possible into the organization’s
employer branding strategies and efforts, the researcher requested the assistance of the case
organization in identifying for the interview, individuals with the most significant involvement in the
planning, execution, and direction of the organization’s employer branding strategies and efforts.
In total, five managers were selected by the organization due to their direct involvement in
planning, implementing, and overseeing the organization’s employer branding strategies. They
included the Managing Principal of the Prairie Region, the Regional Human Resources Leader
(called Human Development Leader), The National Recruitment Leader, The Corporate
Communications Manager as well as the Corporate Marketing Manager. These five individuals
represented the entire population rather than a sample from the management group. All five
individuals were based in the Calgary branch.
The second sample of managers invited to participate in the interview consisted of individuals who
did not have any official responsibility for planning or overseeing the organization’s employer
branding efforts or initiatives but would, simply by the nature of their role as managers, be
involved in delivering and maintaining some of the initiatives. The sample from this group was
drawn randomly from a total population of 37 remaining managers (after five individuals were
drawn from the original total of 42 managers for the first purposive sample).
Using Excel Random Sort, the participants were drawn on a random basis from a list of managers
provided by the organization. In total 14 individuals were drawn, representing over 1/3 (38%) of
the 37 remaining managers. Ten (10) of the participants were drawn from the organization’s
largest branch in Alberta as well as Canada, which is their Calgary branch. The other four
participants were drawn from their second major office in Alberta, which is their Edmonton branch.

91
There were a couple of key reasons to include two different samples of managers in the interview
component of this investigation. First of all, in such an exploratory case study, it would be essential
to gain information and insight from individuals directly involved in creating and intensifying the
phenomenon being investigated. Such individuals would have firsthand knowledge of a majority, if
not all aspects of the phenomenon including goals and objectives, decisions that were made, the
rationale behind those decisions, actions that were taken, challenges that were encountered, and
outcomes of their efforts, etc. Individuals not directly involved might have some degree of
knowledge in one aspect or another of the phenomenon but they would likely not have the overall
picture and, in the case of employer branding, a lower level of understanding of the complexities
within the different elements and processes of employer branding. Some of these complexities
include challenges in materializing certain employer branding initiatives, efforts to effectively align
employer branding strategies to corporate values and strategies, ability to use employer branding
initiatives to shape employee performances, and so on. In order to explore the employer branding
efforts within a specific organization thoroughly, it would make logical sense to seek the insight of
those that know the most about the employer branding efforts within the organization.
On the other hand, there is also noticeable value in gathering information and insight from
individuals not directly involved in creating and intensifying the phenomenon being investigated
but who experienced as well as aiding in the intensification of the phenomenon. In this specific
case, the individuals would be managers, who, while not involved in planning, implementing, or
overseeing the organizations employer branding efforts, would be expected to deliver or maintain
established initiatives, simply by the nature of them being in a position where managing and
motivating employees was a daily part of their role. Most importantly, their reflections would allow
the researcher to assess the degree of consistency, in various aspects of employer branding being
investigated, between what was intended by the employer branding architects in sample 1 and
what was subscribed and delivered to employees by these managers in sample 2. Were there any
gaps between what was intended by the organization (as represented by sample 1) and what was
delivered to employees by this management group? If so, what might have contributed to the gaps
and how have these gaps impacted what was received by employees? In addition to secondary
data such as organizational materials and documents, information gained from this second sample
of managers also served as a source of triangulation for the data collected from sample 1.
The 19 participants in samples 1 and 2 spanned across technical and non-technical departments.
There were no participants from the same department. Eleven of the participants were males while
eight were females. Years of service range from two to 17, with the median being eight years. Five
of the participants were categorized as Associates (3 males and 2 females) while another two were
categorized as Principals (1 male and 1 female). The remaining 12 were managers but were
neither Associates nor Principals.

92
Interview Questionnaire Design, Development, Validity Assurance, and Execution
The format of the interview was semi-structured, with questions being open-ended, allowing
participants the opportunity to elaborate on their answers. Qu and Dumay (2011, pg. 246)
identified the semi-structured interview as involving “prepared questioning guided by identified
themes in a consistent and systematic manner interposed with probes designed to elicit more
elaborate responses”. Kvale and Brinkmann (2009) hailed it as the most effective and convenient
means of gathering information since it provides the interviewer with the flexibility to adjust
his/her style, pace, and ordering of questions. Such flexibility is believed to be crucial: 1) in giving
interview participants’ the autonomy to respond in their own terms and in the way that they think
and use language, 2) in generating the richest response from the interview participants, and 3) in
allowing the interviewer to better understand the way the interview participants perceive the
phenomenon being studied (Qu and Dumay, 2011, pg. 246).
Questions were designed to collect participants’ observation and perception of the following:
Departments and personnel involved in shaping, planning, developing, communicating,
implementing, and evaluating BOB’s employer brand and branding efforts.
The types and significance of employer brand promises extended by BOB to its employees.
Methods of verifying and communicating the attractiveness of the organization’s employer
brand promises.
The key goals that BOB wishes to achieve with its employer branding efforts and how the
results were measured.
How BOB links its employer branding efforts to employee performance and the creation of a
distinctive and desirable employment experience.
The means through which BOB fulfils its employer brand promises and how the processes or
outcomes influence performance mediators or actual performance of employees.
Managers’ perception of whether BOB’s overall work environment is distinctive and desirable
and, if so, how so and how that was materialized.
Barriers and challenges encountered by managers and/or the organization as a whole in their
employer branding efforts.
The Management Interview Questionnaire is included in this dissertation as Appendix 6.

93
The main questions to yield the information above were augmented by sub-questions that the
researcher would ask to probe for further and more detailed responses from a participant who had
not adequately answered the main questions.
The process to enhance the validity, clarity and comprehension of the interview questionnaire
started with the researcher’s discussion of appropriate interview content with her academic
supervisor, based on the research and interview objectives. The researcher added, deleted, and
revised the interview questions several times upon further review of literature, further discussions
with her academic supervisor, and a deeper consideration of the types of information that needed
to be gained in order to address the research objectives and questions. Once completed, the draft
of the interview questionnaire was then reviewed by the researcher’s academic supervisor and
tested by two of the researcher’s academic colleagues, both of whom have completed their own
doctoral dissertation and conducted regular research in their academic career, thus having a
firsthand understanding of some of the challenges involved in developing appropriate interview
questions and questionnaires. Clarity, validity as well as redundancy of questions were examined.
Ideas of how to ensure common operational understanding of critical but subjective terminologies
(such as the term ‘employer branding’) were also discussed. In response, some interview questions
were re-phrased to improve clarity and information-yielding intent.
A following draft of the questionnaire was tested by four of the researcher’s academic colleagues
from two academic institutions: 1 DBA, 2 MBA, 1 PHD – all from the fields of Business and
Management.
In addition to further refinement of the questions, an interview protocol was developed where
interviews would start off with a brief explanation by the researcher of the well-referenced
definitions for ‘employer brand’ and ‘employer branding’, as are found in extant literature. Other
definitions offered during interviews included ‘employer identity’ and ‘employer image’. In addition,
a list of examples of employment benefits or values, as are present in extant literature, was also
made available for participant reference. This list was prepared to accompany one of the main
questions to inquire about the employment benefits or values provided by the organization to its
job applicants and employees. In order to avoid leading or biasing participants, this list was only
offered when a participant appeared fully unknowing or unsure of the meaning of employment
benefits or values, as intended in the subject of employer branding.
The final draft of the questionnaire was sent to the researcher’s liaison at BOB, who was its
Regional Human Resources Lead Officer for a final review, testing and feedback. No further
revisions were made thereafter.
The interviews were carried out, first in the Calgary branch and then in the Edmonton branch,
within a one month duration. Each interview took 60 to 90 minutes to complete and were recorded
using a digital recorder. The interview protocol was used to facilitate the interviews. As the

94
interviews were semi-structured, some deeper probing of particular scenarios or questions as well
as some deviations from the main questions did occur. The purpose of doing so was to allow the
researcher to seek further insight that would otherwise not have been made readily available. This
was particularly true when a participant was explaining some intricate processes, successes,
frustrations, or challenges related to specific employer branding and/or employee engagement or
commitment enhancement activities. Probing further yielded explanations and examples that
served as further evidence to claims made or yielded reconsideration of statements made as no
sufficient explanation or examples could be provided.
Employee Survey
Following the management interviews, two surveys were conducted, one with employees at the
Calgary and Edmonton branches and another with individuals that applied for employment at BOB
though its web application system.
The employee survey was created to verify if and to what degree relationships exist between the
fulfilment of employer brand promises and employees’ organizational citizenship and task
performances. Employees from all levels and departments at the Calgary and Edmonton sites were
invited to participate in the survey.
The survey method was employed for this mission because it is versatile, inexpensive to
administer, and allows for consistency in the information sought and compared (Check and Schutt,
2012). In addition, the anonymous nature of the survey makes it easier for participants to answer
the questions honestly.
The survey was set up as a self-administered questionnaire on www.surveymonkey.com, a web-
based survey centre that is accessible 24 hours a day from almost anywhere around the world. As
applicants for jobs at BOB’s Calgary and Edmonton sites come from all parts of Canada and around
the world and as BOB’s workforce was geographically dispersed, either because they were at
different sites, out working on environmental projects in the field, or away from their sites for
business purposes, the web-based method would be ideal in that it would allow the researcher to
reach the sample with ease, regardless of an individual’s location (Kiesler and Sproull, 1986;
Sproull, 1986). When compared to the in-person pen-and-paper method, mail-out method, or
phone method, a web-based tool like Survey Monkey has several other key advantages. First of all,
there would not be any need for manual mail-out of the surveys or manual seeking-out of
participants as participants could directly access the survey online. Therefore, the researcher could
reach potential participants within a very short period of time. A web-based tool like Survey
Monkey is also relatively low-cost and time efficient to use (Kiesler and Sproull, 1986; Sproull,
1986; Goree and Marszalek, 1995; Schmidt, 1997). No additional mailing cost would be incurred

95
and no extra time would be needed to engage in phone or face-to-face interactions with
participants. One significant advantage of using a web-based tool like Survey Monkey is the
reduction or even elimination of the need for manual coding and entry of data (Zhang, 2000).
Reducing or eliminating this potential human error would have a direct impact on the accuracy of
data being analyzed.
In spite of many advantages of using a web-based system to administer the survey, there are also
disadvantages that need attention. In this case study, the researcher consulted with the
organization on the possibility of a web-based system biasing the sample and data collected
(Zhang, 2000). After all, participants had to be technologically and web proficient, be able to
access a tool where they could open up the survey online to participate, and be sufficiently
knowledgeable on how to fill out and submit an online form (Kiesler and Sproull, 1986; Sproull,
1986). Those with limitations might not want to or be able to participate in the survey and should
this be the case, their view would not be represented in the data collected for analysis (Zhang,
2000). BOB acknowledged that a very small number of employees might not be as technologically
or web savvy and an example of these would be employees for janitorial or cafeteria positions as
such abilities were not part of their job requirement. As such, it was possible that their views would
not be sufficiently captured in the surveys.
The concern regarding the time required to complete the web-based survey and the corresponding
risk of survey abandonment was also considered. This concern is addressed in subsequent
paragraphs of this dissertation.
Sampling for Employee Survey
The researcher received permission from BOB to survey its employees at the Calgary and
Edmonton sites. At the time that the survey was facilitated, BOB reported that it had 750
employees in Calgary and 180 employees in Edmonton, totaling 930 employees.
Based on a confidence level of 95%, margin of error of 5%, and degree of variability of 50%, it
was calculated that a minimum of 272 responses would be needed. When the employee survey
closed, 316 survey responses were received.
Employee Survey Design, Development, Validity Assurance, and Execution
The survey was designed to assess the relationship between employees’ perceived level of
expectation fulfillment by their employer for employment benefits or values promised to them and
their perceived level of frequency in their own demonstration of positive performance. Specific
types of performance chosen for evaluation in this case study were organizational citizenship
performance (Borman and Motowidlo, 1993) and task performance (Borman and Motowidlo, 1997).
96
In order to gain the data required for analysis, the employee survey questionnaire was broken
down into five sections of inquiry:
Section 1 - Employee demographics:
In this section, employees were asked for their gender, age bracket, highest level of
education, tenure bracket, branch and division in which they were employed (there were
two branches23 and eight divisions24 for selection) as well as their employment category25.
Section 2 - Employees’ perception of how well BOB had fulfilled their expectation for each of the
employment benefits or values promised:
A scale consisting of 20 employment benefits or values were listed for this section of inquiry.
These were the 20 employment benefits or values most cited by the 19 managers in the
management interviews as being BOB’s key offerings to employees. Every item included had
been cited by at least three interview respondents. For each employment benefit, employees
were asked to rate using a Likert-type response system, whether they had no expectation
for the benefit or whether their expectation for the benefit had been not at all, not
adequately, adequately, or more than adequately fulfilled by the employer.
Factor analysis was performed on this 20 item employer brand promise scale, which
revealed that the degree of common variance among the twenty variables was “marvelous”
(KMO (Kaiser-Meyer-Olkin Measure of Sampling Adequacy) = 0.923). Results of the Bartlett's
Test of Sphericity (χ2=2485.96; df=190; p<0.001) showed that the sample inter-correlation
matrix did not come from a population in which the inter-correlation matrix was an identity
matrix. As such, the factors extracted will account for substantial amount of variance.
Reliability analysis revealed the Cronbach's alpha to be 0.907, indicating a high level of
internal consistency for the employer brand promise scale with this sample. Specific items
for the scale are presented in Appendix 2: Employer Brand Promises.
Section 3 – Employees’ work experience and employment intention:
In this section, employees were asked how much they agree that BOB had provided them
with an employment experience that was both desirable and distinctive compared to what
they knew or had experienced with other similar organizations in the industry. They were
also asked how much they agreed that BOB was great place to work, a place in which they
would be happy to spend the rest of their career, and a place they would frequently think
of leaving.
There has not been any consensus on the definitive measures of employer branding
success. However, among those that have been proposed are recognition of the
23 Calgary and Edmonton 24 Environmental Project Management, Information Management, Corporate Services, and 4 technical, environmental, and engineering related divisions. These divisions are not specifically named in order to maintain BOB’s anonymity. 25 Principal/Associate vs. non-Principal/Associate and Manager vs. non-Manager.

97
organization as being a great place to work (McLaren, 2010), confirmation of the provision
of desirable and distinctive employment experience (Moroko, 2009), and to some degree,
also turnover intention. Employees’ confirmation of their presence offers an indication that
the employer has been successful in fulfilling its part of the psychological contract, thus
strengthening employee trust and engagement and these in turn affect performance. As
such, it would be appropriate to assess whether such is achieved by an employer that is
deemed to have a highly and consistently effective employer branding program. For each
expressed notion, employees were asked to rate using a Likert-type response system,
whether they strongly disagree, disagree, neither agree nor disagree, agree, or strongly
agree with the notion.
Section 4 – Employees’ acknowledgement of how frequently they have demonstrated ‘positive’
organizational citizenship performance behaviours as well as task performance actions in the last
12 months of their employment at BOB:
Existing studies on organizational citizenship performance have introduced several
organizational citizenship behavioural scales or expansions to the scales to capture the
performance (George and Brief, 1992; MacKenzie, Podsakoff, and Fetter, 1993; MacKenzie
and Podsakoff, 1994; Moorman and Blakely, 1995; Borman and Motowidlo, 1997;
Podsakoff et al., 2000; Lee and Allen, 2002; Vey and Campbell, 2004; and more). In
combination, these different scales introduced over 45 behavioural descriptors that
represent the seven common organizational citizenship performance themes highlighted by
Podsakoff and his colleagues (2002): (1) Helping Behavior, (2) Sportsmanship, (3)
Organizational Loyalty, (4) Organizational Compliance, (5) Individual Initiative, (6) Civic
Virtue, and (7) Self Development.
In order to have a scale that contains a reasonable but not excessive number of
behavioural descriptors that would capture all of the seven themes identified as well as be
relevant to BOB’s work setting, the researcher coordinated a scale for this survey that was
made up of 17 behavioural descriptors presented in different past studies, as outlined in
Table in Appendix 3: Organizational Citizenship Performance Scale
All of the behavioural descriptors used in this case study had been applied in previous
studies published in peer reviewed academic journals. Some descriptors had been applied
in more than one published study (see Table in Appendix 3: Organizational Citizenship
Performance Scale).
Factor analysis was performed on the 17 item organizational citizenship performance scale,
which revealed that the degree of common variance among the seventeen variables is
“meritorious” (KMO=0.859). Results of the Bartlett's Test of Sphericity (χ2=1582.24;
df=136; p<0.001) showed that the sample inter-correlation matrix here also did not come
from a population in which the inter-correlation matrix is an identity matrix. Reliability

98
analysis showed the Cronbach's alpha to be 0.862, indicating a high level of internal
consistency for the OCP scale with this specific sample.
The task performance scale used in this survey contained seven behavioural descriptors.
The scale was directly adopted from the in-role behaviour scale used by William and
Anderson in their 1991 study entitled Job satisfaction and organizational commitment as
predictors of organizational citizenship and in-role behaviours. The behavioural descriptors
used are as outlined in Table in Appendix 4: Task Performance Scale.
Factor analysis was also performed on this 7 item task performance scale, which revealed
that the degree of common variance among the 7 variables is “meritorious” (KMO=0.835).
Results of the Bartlett's Test of Sphericity (χ2=694.56; df=21; p<0.001) showed that the
sample inter-correlation matrix did not come from a population in which the inter-
correlation matrix is an identity matrix. As such, the factors extracted will account for
substantial amount of variance. Reliability analysis revealed the Cronbach's alpha to be
0.781, indicating an adequate level of internal consistency for the task performance scale
with this specific sample.
A Likert-type response system more akin to a Behaviour Observation Scale with a rating of
1 to 7, with 1 being Never engaged in the behaviour and 7 being Always engaged in the
behaviour was used in this section of the survey.
Similar to the process to enhance the validity, clarity and comprehension of the interview
questionnaire, the process for the survey started with the researcher’s discussion of appropriate
survey content with her academic supervisor as well as with her liaison at BOB, based on the
research and survey objectives. While the establishment of the employment promises scale was
relatively straightforward, the coordination of the organizational citizenship performance scale was
more complicated due to the large number of behavioural descriptors that were present for
consideration. Decision on which behavioural descriptors to use for the survey was based on these
criteria:
1. Representation of one of the seven performance themes identified by Podsakoff and his
colleagues (2000).
2. The description of the behaviour was not too vague that it would cause confusion or too
much subjective interpretation. An example of such vague behavioural description:
Help others who have been absent.
3. The description of the behaviour was not easily attributable to an employee’s position,
personality, or background as other employees not in those positions or do not have those
personalities or backgrounds might not be able to relate to the situation or have the
opportunity to respond to such situation. Examples of such behavioural descriptions:
99
For issues that may have serious consequences, I express my opinions honestly
even when others may disagree.
Turns in budget, sales projections, expense reports, etc. earlier than is required.
With the first example, many frontline employees might not be privy to or be in the
position to speak out about issues of serious consequences in their organization. With the
second example, many employees might not ever need to work on a budget or sales
projection in their job and might not ever have a requirement to submit expense claims.
4. The description of the behaviour was not highly leading and would therefore result in a
strong likelihood of participants responding to it biasly. Examples of such behavioural
descriptions:
I avoid making mountains out of molehills (making problems bigger than they really
are).
At work, I avoid complaining about trivial matters.
With both examples, it is very likely that most people would think of themselves positively
and thus would see themselves, rightly or wrongly, as not making mountains out of
molehills and not complaining about trivial matters. Such leading descriptors could yield
biased responses that would then distort the real picture of employees’ citizenship
performance.
In the end, behavioural descriptors chosen for this survey’s organizational citizenship performance
scale were the ones that:
1. Represented one of the seven performance themes identified by Podsakoff and his
colleagues (2000).
2. Clearly described the expected behaviour.
3. Offered a scenario that would realistically be encountered by an employee, regardless of
their position, personality, and background.
4. Neutral and non-leading.
There were noticeably less number and variation in the choice of task performance scales or
behaviour descriptors. Two were considered for this survey (Williams and Anderson, 1991 as well
as Bettencourt and Brown, 1997). As a whole, the behavioural descriptors for both scales seem
general and superficial. This might be due to the possibility that task performance is highly
position-specific. The behavioural descriptors for a universal task performance scale would have to
be general and superficial rather than specific and detailed as specifics might fit one position but
not another. Williams and Anderson’s seven-item scale offered descriptions that fit this criterion
and was therefore chosen for this case study.

100
Aside from ensuring clarity and accurate intent in the terminologies and language used in the
survey, another key challenge in the design of the survey was finding the right balance between
incorporating a sufficient number of appropriate questions in each section of the survey to yield
the necessary amount of research-worthy data and keeping the survey as concise as possible in
order to minimize fatigue and abandonment of the survey by participants. This balance was
enhanced through broad testing and refinement of the survey questionnaire. The survey was
tested by 11 of the researcher’s academic and professional colleagues: 2 DBA, 3 MBA, 1 MA, 3
PHD, 2 BA – from various fields including Business and Management, Environmental Science,
Theological Leadership, and Education. Feedbacks from the testers indicated a common concern
with the time needed to complete the questionnaire and this prompted the researcher to reduce
the number of items in certain scales as well as reduce the number of words in survey statements
where possible, divide questions into manageable sections, and improve the format of the
questionnaire for easy reading.
Upon making necessary adjustments, the link to the final draft of the employee survey
questionnaire was sent to the participants of the management interview for a final round of
testing. Feedbacks from three respondents were received. Minor changes were made to sentence
formats and certain words to improve clarity. No further changes were made thereafter.
As mentioned at the beginning of this section, the survey was set up as a self-administered
questionnaire on www.surveymonkey.com, a web-based survey centre that is accessible 24 hours
a day from almost anywhere around the world.
The organization sent out an initial invitation to all of its employees at its Calgary and Edmonton
sites to participate in the survey. In order to boost the response rate, a follow-up reminder of the
survey was also sent to the employees mid-way through the survey period. The invitation and
reminder were sent out via the organization’s group e-mail distribution process and the link to the
survey was directly present in the invitation as well as in the reminder e-mail.
The survey questionnaire took between 10 to 12 minutes to complete and was opened for
participation over an initial duration of two weeks, which was later extended for another two weeks
to allow for more participation. As indicated in an earlier paragraph, when the employee survey
closed, 316 survey responses were received.

101
Qualitative and Quantitative Data Analysis
Qualitative Data Analysis
The management interviews from all 19 participants were transcribed and, in total, 441 single
space pages (167,294 words) of verbatim interview transcripts were analyzed and coded by the
researcher using QDA Miner version 4.0.4.
To ensure accuracy of the interview content transcribed, the researcher conducted a verification
exercise, as follows, prior to the start of the data analysis:
1. Contacted each participant via e-mail to request permission to forward to the participant,
his/her interview transcript for content thoroughness and accuracy verification. Only two
participants responded to the request and neither directed for any changes to be made to their
interview transcripts. As these were verbatim interview transcripts instead of interview notes
from the researcher, one may conclude that the content accuracy of the transcripts is very
high as the likelihood of content and assertions being left out would be very small, though not
impossible, due to transcription error.
2. Selected three random transcripts for transcription accuracy verification.
The researcher started her analysis with a read through of each interview transcript to get a
general sense of the direction and themes for the research objectives, particularly in terms of how
employee performance or performance mediators were enhanced through the organization’s
employer brand promise fulfilment activities. Many of the answers to how this occurs is not very
direct or readily obvious, such as - we did this and it leads to the improvement of this employee
behaviour or to the enhancement of employee commitment in this way or employee engagement
in that way. As such, many inferences still had to be drawn and in some cases, from the
revelations of different aspects of a same activity from either different parts of an interview or
different interview participants altogether.
After a read through and taking of some conceptual notes of the transcripts, the transcripts were
loaded on to QDA Miner version 4.0.4. for analysis. Data was coded and analyzed for specific
themes as they relate to the research objectives of uncovering performance enhancing factors in
the content or delivery of the organization’s employer brand promises. Five (5) themes emerged
for employment benefit content factors and three themes emerged for employment benefit
materialization factors.
Detailed examination was done to determine specifically how employee performance or mediators
of performance were potentially enhanced by each of the factors, particularly employment benefit
content factors.

102
Quantitative data analysis
All data were directly downloaded from Survey Monkey to SPSS 17 for analysis. After collection,
data were first cleaned and edited in order to obtain accurate summary estimates of statistical
quantities. Further conversion of data was done in preparation of the analyses to be done to test
each of the hypothesis.
In order to determine the presence and size of effect or influence that the following independent
variables would have on the dependent variables of organizational citizenship performance and
task performance, a quasi-experiment was set up whereby employees who responded to the
research survey were divided into groups for each analysis, based solely on their reported ratings
for the following independent variables:
i. Employees’ perceived level of fulfilment of their employer brand promise expectations by
the employer.
ii. Employees’ perceived presence of a desirable and distinctive experience, a great
workplace, a desire to spend the rest of their career with their organization as well as non-
presence of frequent thoughts of leaving their employment at the organization.
For independent variable i. employees’ perceived level of fulfilment of their employer brand
promise expectations by the employer, employees were divided into two groups:
Group HF: High Fulfilment - Employees who perceived their employer brand promise
expectations as having been adequately or more than adequately fulfilled
by their employer.
Group LF/NE: Low Fulfilment or No Expectation – This is a group that combined
employees who perceived their employer brand promise expectations as
having been inadequately or not at all fulfilled and employees who had
no expectations for that the investigated employer brand promises. For
certain examinations, this employee group was further broken down into
two independent groups – Low Fulfilment group and No Expectation
group:
Group LF: Low Fulfilment - Employees who perceived their
employer brand promise expectations as having been
inadequately or not at all fulfilled.
Group NE: No Expectation - Employees who had no expectations
for that the investigated employer brand promises.
103
For independent variable ii. employees’ perceived presence of a desirable and distinctive
experience, a great workplace, and a desire to spend the rest of their career with their organization
as well as perceived non-presence of frequent thoughts of leaving their employment at the
organization, employees were also divided into two groups:
Group CC: Concur – This group consisted of employees who responded “agree” or
“strongly agree” when asked how much they agreed or disagreed with
each of the notions in hypotheses H4a and H4b.
Group NC: Do Not Concur – This group consisted of employees who responded
“neutral”, “disagree” or “strongly disagree” when asked how much they
agreed or disagreed with the notion above. While it was unclear as to
exactly how much employees who answered “Neutral” disagreed with the
statements in hypotheses H4a and H4b, it was clear that they could not
and did not confirm agreement with the notions. As such they were
placed in the Do Not Concur group.
Organizational citizenship performance mean scores as well as task performance mean scores of
these employee groups were then compared to determine statistically significant differences in
their reported levels of performance. The sizes of statistically significant effects were then also
examined.
In all cases, no other criteria was used in the division of employee groups except for the
respondents’ answers (ratings) to questions pertaining the independent variables identified above.
Each group contained employees from different ages, gender, education, tenure, divisions, branch,
and employment ranks.
The following tests and analyses were carried out to yield relevant results:
1. Testing for statistically significant differences in performance mean scores:
For hypotheses 2a to j, 2k and l as well as hypotheses 4a and b, t-test was used to
establish and compare the difference in mean scores between two employee groups (High
Employer Brand Promise Expectation Fulfilment versus Low Fulfilment/No Expectation and
Concur with notion versus Not Concur) for organizational citizenship performance and task
performance.
Some investigations where employee groups were further broken down into three groups
(Low Fulfilment/No Expectation group divided into Low Fulfilment group and No
Expectation group), one-way ANOVA was used to establish and compare the difference in
mean scores among the three groups.

104
Where differences existed between groups, Scheffe Post-Hoc test was then used to
ascertain the location of the difference between the groups.
For results where multiple employer brand promises were shown to have statistically
significant influence on employees’ organizational citizenship and/or task performance,
stepwise regression was conducted to determine the relative influence of each employer
brand promise.
Prior to analyses, required assumptions of data to qualify for the use of one-way ANOVA
were checked and verified. As part of the verification process, Levene's tests for
homogeneity of variances were conducted and in all cases, the assumption of equality of
variances was not violated.
1. Testing for sizes of influence as well as for strength of relationships:
Hypotheses 1a and b predicted a positive relationship between employees’ level of
organizational citizenship performance as well as task performance and their perceived
level of overall employer brand promise fulfilment by their employer. Pearson’s correlations
were conducted between the performance variables and the employer brand promise
variables to ascertain the direction and strength of relationships. Additionally, scatter-plots
were used to ensure that linearity was present.
Pearson’s correlation coefficient was also used in hypotheses 2a to j, 3, 4a and 4b to
assess the sizes of influence by the independent variables on the dependent variables.
Data Conversion
The following data collected were converted to allow for ease and clarity of one-way ANOVA and t-
test:
1. For employer brand promises (EBP), original responses were divided into five groups:
0 = You have no expectation for this promise
1 = BOB has not fulfilled your expectation at all
2 = BOB has partially but not adequately fulfilled your expectation
3 = BOB has adequately fulfilled your expectation
4 = BOB has more than adequately fulfilled your expectation
In preparation for ANOVA, the EBP responses were converted into the following groups:
0 = No Expectation (You have no expectation for this promise)
1 = Low Fulfillment (BOB has not fulfilled your expectation at all AND BOB has partially
but not adequately fulfilled your expectation)

105
3 = High Fulfillment (BOB has adequately fulfilled your expectation AND BOB has more
than adequately fulfilled your expectation)
In this case, code 0 was retained to represent the “No Expectation” responses instead of having
this group of responses lumped together with “Low Fulfillment” for analysis. This is due to the
fact that no expectation of an employment benefit is significantly different than having
expectation that is not at all or not adequately fulfilled. The researcher concluded that lumping
together the two groups of responses would yield less accurate results in the analysis. Instead,
the “No Expectation” responses were included in the analysis as an independent group. This
way, analysis could be done to determine if there were in fact significant differences in the
organizational citizenship performance and/or task performance levels between the three
groups and if so, where the significant differences would lie.
2. For organizational citizenship performance (OCP) and task performance (TP), original
responses were divided into seven groups. Using a Likert-type response system, rating went
from 1 to 7, with 1 being “Never” engaged in the specified organizational citizenship
performance behaviour or task performance action in the last 12 months and 7 being “Always”
engaged in the specified organizational citizenship performance behaviour or task performance
action in the last 12 months.
As the levels of performance were presented in the survey as frequencies of demonstrating
specified organizational citizenship performance behaviours or task performance actions, from
Never to Always, the term “high level of performance” would be taken in this case study to
mean high frequency of demonstrating specified organizational citizenship performance
behaviours or task performance actions, where as “low level of performance” would be taken
in this case study to mean low frequency of demonstrating specified organizational citizenship
performance behaviours or task performance actions.
In preparation for ANOVA, the OCP and TP responses were converted into 2 groups:
0 = Low Level of Performance (Ratings 1, 2, 3, and 4)
1 = High Level of Performance (Ratings 5, 6, 7)
In this case, the response of “Never” was lumped together with the first lower half of the
frequency ratings to form Low Level of Performance (essentially low frequency of
demonstrating specified OCP behaviours or TP actions).
3. The original responses to capture employees’ level of concurrence with the following notions
were divided into five groups.
i. Their employment experience at the organization was both desirable and distinctive.
ii. Their organization is a great place to work.
iii. They would be very happy to spend the rest of their career with the organization.

106
iv. They DO NOT frequently think of leaving the employment at the organization.
Original responses:
SD = Strongly Disagree
D = Disagree
N = Neutral / neither agree nor disagree
A = Agree
SA = Strongly Agree
In preparation for the t-test, responses for the level of concurrence were converted into two
groups:
0 = Do not concur (neutral, disagree, or strongly disagree)
1 = Concur (agree or strongly agree)
While it was unclear as to exactly how much employees who answered “Neutral” disagreed
with the each of the four statements, it was clear that they could not and did not confirm
agreement with the statements. As such they were placed in the Do Not Concur group.

107
CHAPTER 5: QUALITATIVE RESULTS AND ANALYSIS –RELATING EMPLOYEE PERFORMANCE TO EMPLOYER BRANDING
The key intent of the qualitative component of the research is explore the factors present with the
content or delivery of employer brand promises that could influence employee performance.
As is presented in the literature review, there have been studies and revelations on the types of
employment benefits or values that may be or have been offered by organizations in their
employer branding efforts. Confirming what a best-of-the-best employer in Canada offers would
add some value to practical knowledge. However, the value of simply confirming that BOB offers
competitive compensation, specific development and applications opportunities, or specific social
and psychological benefits would not be that significant. Instead, this case study will shed a
different light on how such employment benefits are viewed and presented to employees. There
are meanings and associations behind what is offered and such meanings and associations are
precisely the factors that appear to create significance for employees. This, combined with other
organizational elements that are present in the delivery of these employment benefits, appear to
have strengthened employees’ commitment as well as engagement with the organization. Such
commitment and engagement in turn appears to have influence on some employee performance.
The analysis of the qualitative data will offer an indication of what these factors would be.
Employment benefits or values and employer branding efforts will likely vary from one organization
to another due to many reasons, including but not limited to organizational context, available
resources, types of targeted workforce, competitive forces and so on. However, the conclusions in
this case study of the sequence of employer branding activities and events as well as of the entity
interplay and association that could lead to enhanced employee commitment, engagement, and
ultimately performance, would offer another set of revelations that organizations can take into
consideration in the planning of their own employer branding strategies and efforts.
The qualitative data and analysis will also offer insight into the challenges experienced by one of
the best-of-the-best employers in Canada in their efforts to fulfill their employer brand promises.
Employer branding is in fact a complex undertaking due to the various obvious and non-obvious
organizational, operational, and human aspects involved. It is likely that organizations would
encounter some if not lots of challenges in their efforts to deliver effective employer branding.
Recognizing the challenges would be of significant value to employers in terms of the anticipation
and preparation to effectively minimize, contain, or address them.

108
Employment Benefits Reframed: Employee Need-centred
Perspective
With reference to extant employer branding literature on the employment benefits, the following
figure shows the top 20 employment benefits that BOB had identified as its employer brand
promises. Each of these employment benefits were mentioned by at least three managers in the
management interview. The figure shows the number of managers out of 19 that identified each of
the employment benefit or value listed:
Figure C5-a. Top 20 Employment Benefits Identified
0 2 4 6 8 10 12 14 16
Peer nominated Principals and Associates System
An organization that values employee input
Opportunity to be part of a successful and highlyrespected organization
Organizational support for risk-taking and innovation
Organizational commitment to treat employees withhonesty, fairness, and respect
Organizational support for team work and/orcollaboration among colleagues
A supportive and caring work culture
Flexible work schedule or telecommuting option
Opportunity to be involved or contribute to theorganization's community building and engagement…
Organizational commitment to employee health andsafety
Fairly flat organizational structure with low hierarchy
Opportunities for international assignments or employeeexchanges
Competitive compensation and benefits
Organizational commitment to technical excellence
A work environment that supports work-life balance
Opportunities to take on varied/diverse projects or workactivities
Provision of challenging work
Comprehensive employee learning and developmentprograms
Opportunity for career growth
Opportunity to be a shareholder in a 100% employee-owned structure
Top 20 Employment Benefits Identified
Number of Cases

109
The following employment benefits were also identified but would not be included in the analysis
due to the fact that they were mentioned by only two or less management interview respondents:
Working with and learning from the best
Organizational commitment to sustainability
Organizational commitment to integrity in work and relationships
A fun work environment
Stability of organization
Work autonomy
The types of employment benefits identified by the managers did fall within the categories
identified in extant literature and research:
Table C5-1: Current view and categorization of employment values and benefits
Categories
Based on
Existing
Literature
Specific Employment Benefits Identified Number
of Cases
Combined
Number
of Cases
Functional or
Development
and
Applications
Opportunity for career growth 11
47
Comprehensive employee learning and
development programs 9
Opportunities to take on varied/diverse projects or
work activities 8
Provision of challenging work 8
Opportunities for international assignments or
employee exchanges 6
Opportunity to be involved or contribute to the
organization's community building and engagement
efforts
5
Interest
Value/
Organizational
Culture and
Environment
Organizational commitment to technical excellence 7
24
Organizational commitment to employee health and
safety 5
Fairly flat organizational structure with low
hierarchy 5
Organizational support for risk-taking and
innovation 4
Peer nominated Principals and Associates System 3
Economic/
Monetary
Opportunity to be a shareholder in a 100%
employee-owned structure 16
22
Competitive compensation and benefits 6

110
Some of the benefits, such as those in the Economic/Monetary category and also most of those in
the Functional or Development and Applications category could be quantified but most of the rest
were more subjective, psychological, and perception based, thus harder to quantify in terms of the
actual amount that was offered within each benefit.
Not unlike many employers, managers at BOB indicated that it offers various types of employment
benefits and multiple items within each type. On the surface, it is difficult to determine what is
inherent in the employment benefits offered or how they are delivered that would make them
significant to the targeted employees, create a distinctive and desirable work experience, and
ultimately make BOB an employer of choice. For example, if economic benefits are identified as
material rewards, attractive compensation, and stock options, what elements have to be present
within these economic provisions or the delivery of these economic provisions to make them
particularly desirable or worthwhile for employees? After all, from existing research as well as from
the pilot study, one can see that most organizations, regardless of whether they are best
employers or not, claim to offer this and other similar types of benefits as identified in Table C5-1
above.
The qualitative findings of this case study offer a deeper insight into the factors that exist in the
coordination, presentation, and delivery of the employment benefits that generate significance and
value to employees.
The challenge faced by many organizations in their employer branding efforts is not in announcing
or promising what employment benefits they have to offer, what employer values they hold dear,
or what organizational culture they have in place. It is more in ensuring that the promised benefits
are fully delivered to and meaningfully received by employees. This includes delivering on
promised employment benefits, demonstrating promised values or commitment in the
organization’s decisions and actions, and exemplifying the promised culture within the
organization’s interactions and operation.
Social/
Psychological
Organizational commitment to treat employees with
honesty, fairness, and respect 4
15 Organizational support for teamwork and/or
collaboration among colleagues 4
A supportive and caring work culture 4
An organization that values employee input 3
Work-life
Balance
A work environment that supports work-life balance 7 11
Flexible work schedule or telecommuting option 4
Symbolic Opportunity to be part of a successful and highly
respected organization 3 3

111
In fully and effectively delivering on one’s employer brand promises, an employer is in fact proving
its trustworthiness in fulfilling its part of the psychological contract that it has established with the
employee (Robinson,1996). Research and literature has presented strong evidence to show that
this act of trustworthiness would strengthen an employee’s commitment to its employer and
engagement with its employer, which in turn also strengthens their work performance, particularly
organizational citizenship performance (Coyle-Shapiro, J. and Keller, 2000).
Looking at employment benefits from an employee need-centred
perspective
Interview data suggested that leaders and managers at BOB did not see the employment benefits
BOB promised to employees simply as benefits that employees might desire. In reality, around ¾
of the employment benefits offered by BOB, while competitive, were not particularly distinct or
unique. However, BOB’s ability to establish purpose and meaning behind the employment benefits
that were offered and how they were fulfilled might be the reason why they were affirmed over
and over again by their employees as an employer of choice as well as repeated recognized in the
industry as an innovative, high performing organization.
As a whole, interview and material review evidence suggested that BOB’s leaders saw the content
and fulfilment of their promised employment benefits as channels to:
Engage employees in different and continuous ways.
Strengthen employees’ professional capacities and ability to deliver value to the
organization’s clients.
Strengthen employees’ identification with, commitment to, and preservation of BOB’s
values, standards, and culture.
Acknowledge and maintain employees’ influence on the organization’s decisions, actions,
and progress.
More interesting was the indication that these benefits worked inter-connectedly and in tandem to
both develop and engage employees.
Interview responses offered the indication that BOB saw the development and enhancement of
employee performance as a holistic and continuous endeavour. It did not see performance
enhancement as a stand-alone human resources management function geared towards the
achievement of specific performance targets. Instead, BOB saw its many employment benefits and
programs to continually engage and develop employees as the way to simultaneously enhance not
just employees’ work-specific performance but also their overall capability and commitment to the
organization.

112
Intentional efforts were made to both engage and develop employees from the day they started
work to the day they concluded their employment with BOB. According to interview respondents,
the organization’s engagement of employees would not end there. When employees left their
employment with the organization, BOB did not see that as an end to their relationship. Instead,
BOB saw that as an opportunity for the employees to further develop and advance themselves in a
manner that BOB might not be able to provide at that time. According to some interview
respondents, BOB actively encouraged employees to consider coming back to BOB if things did not
work out at their new place of employment or if they felt that they might want to come back to
work for BOB at a later point their career. BOB maintained a safe and open door for these
employees to remain in contact. In general, BOB was said to treat employee departure as a non-
permanent exit for further self-development. Should an employee returns to work for the
organization, BOB viewed it as a gain for the organization because the employee would be
returning with more and possibly different knowledge, skills, and experience.
BOB’s leaders called their continuous engagement and development of employees the “cradle to
grave” philosophy. In maintaining continuous engagement and development of employees, the
organization saw itself as building a committed, capable, flexible, and consistently high performing
workforce that would be ready to work competently and effectively with their colleagues to tackle
any emerging organizational challenges and achieve organizational goals.
While not articulated by BOB in any formal way, themes that emerged for BOB’s employer brand
promises put in place to continuous engage, develop, and enhance employee performance
appeared to have some semblance to the pillars in Maslow’s Hierarchy of Needs (1970). They
include factors of sustainable employment (safety), connectedness and belonging (Love/Belonging)
as well as development and growth, significance of work, and personal influence (Esteem). The
fulfillment of these employer brand promises was then predicted to bring about full engagement
and performance competency (self-actualization).
The search of extant literature revealed that such clustering, while not a standardized practice, is
not completely unknown. In his article, Psychological conditions of personal engagement and
disengagement at work, Kahn (1990) linked the factor of employee motivation and engagement
with the theory of needs fulfillment presented in Maslow’s Hierarchy of Needs. In its 2007 research
report on employee engagement entitled Meaning at Work Research, the global human resources
services group, Penna, actually adapted Maslow’s Hierarchy of Needs into a model of employee
engagement it called “Hierarchy of Engagement”, as shown below:

113
Figure C5-b: Penna’s Hierarchy of Engagement
The key intent with the use of hierarchy of needs or engagement appeared to the emphasis on the
need for employees’ basic needs to be fulfilled, before they could truly be ready for the provision of
other initiatives to enhance their motivation and engagement (Kahn, 1990; Markos and Sridevi,
2010)
Instead of looking and categorizing employment benefits in the more conventional forms of
economic, functional, interest value, organizational environment, social, psychological, and/or
symbolic offerings, the information gained in the qualitative component of this doctoral research
led to both the interpretation and proposal that they be examined and categorized in an employee
need-centred manner.
The researcher was able to divide the themes that emerged into categories, which the research
had labeled as Employment Benefit Content Factors:
Employment Benefit Content Factors
Factor of personal sustainability
Factor of connectedness and belonging
Factor of opportunities and growth
Factor of personal stake and influence
Factor of significance and esteem
These were factors that the organization saw as being personally important or meaningful in
addressing the needs of the employee as a whole human person, thus allowing the person to
develop in a holistic manner. This would include the enhancement of not only the employees’
work-specific performance but also their overall capability as well as commitment to and

114
engagement with the organization. As such, they should be present in the design and/or content of
employment benefits offered to employees. As subsequent quantitative analyses will show, these
factors, when materialized, appeared to have a positive association with employees’ performance
as well as with commitment and engagement, the mediators of performance.
Organizational process plays a role in ensuring effective delivery of
employment benefits
The offer and presence of employment benefits does not equate to the effective delivery or
provision of these benefits. Processes would have to be developed and executed in order to have
the offered employment benefits properly communicated and delivered to employees. Information
gained from the qualitative component of this doctoral research suggested the presence of factors
within the organization’s employer branding process that ensured the effective delivery of the
organization’s proposed employment values or benefits to its employees. The researcher was able
to divide the themes that emerged into categories, which the researcher had labeled as
Employment Benefit Materialization Factors:
Employment Benefit Materialization Factors
Factor of brand championship
Factor of branding control
Factor of stakeholder awareness, selection, consultation
These were factors that the organization deemed to be important to facilitate effective promotion
and delivery of its promised employment benefits and thus should be present in the design of its
employer branding process. These factors might or might not have a direct influence on employee
performance, however, their absence or inadequate presence would have a direct impact on BOB’s
ability to effectively fulfill its employer brand promises and this, in turn, would have a direct
influence on the enhancement of employee performance and mediators of performance.

115
Employment Benefit Content Factors
Themes that emerged with the content of BOB’s promised employment benefits are as shown
below in Table C5-2.
Table C5-2
Themes of
Factors
Employment Benefits that Contribute to
Theme
Number
of Cases
Combined
Number
of Cases
Personal
Sustainability
A work environment that supports work-life
balance 7
26
Competitive compensation and benefits 6
Organizational commitment to employee health
and safety 5
Flexible work schedule or telecommuting option 4
Organizational commitment to treat employees
with honesty, fairness, and respect 4
Connectedness
and Belonging
Organizational support for team work and/or
collaboration among colleagues 4
8
A supportive and caring work culture 4
Opportunities
and Growth
Opportunity for career growth 11
46
Comprehensive employee learning and
development programs 9
Opportunities to take on varied/diverse projects or
work activities 8
Provision of challenging work 8
Opportunities for international assignments or
employee exchanges 6
Organizational support for risk-taking and
innovation 4
Personal Stake
and Influence
Opportunity to be a shareholder in a 100%
employee-owned structure 16
27 Peer nominated Principals and Associates System 3
Fairly flat organizational structure with low
hierarchy 5
An organization that values employee input 3
Significance
and Esteem
Organizational commitment to technical
excellence 7 15

116
Opportunity to be involved or contribute to the
organization's community building and
engagement efforts
5
Opportunity to be part of a successful and highly
respected organization 3
Each factor was explored in the following parts of this chapter in terms of what the employment
benefits within each factor entail, how they were delivered by BOB to its employees, and how BOB
attempted to link each factor and its benefit contents to employee performance.
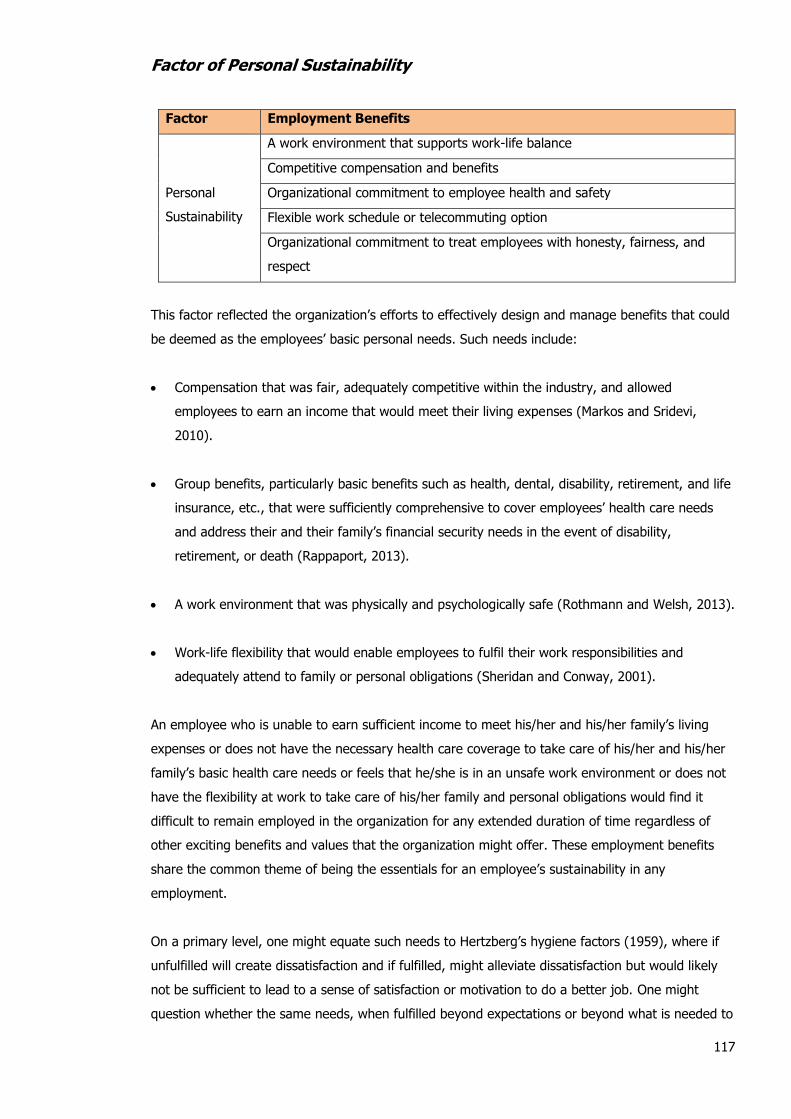
117
Factor of Personal Sustainability
Factor Employment Benefits
Personal
Sustainability
A work environment that supports work-life balance
Competitive compensation and benefits
Organizational commitment to employee health and safety
Flexible work schedule or telecommuting option
Organizational commitment to treat employees with honesty, fairness, and
respect
This factor reflected the organization’s efforts to effectively design and manage benefits that could
be deemed as the employees’ basic personal needs. Such needs include:
Compensation that was fair, adequately competitive within the industry, and allowed
employees to earn an income that would meet their living expenses (Markos and Sridevi,
2010).
Group benefits, particularly basic benefits such as health, dental, disability, retirement, and life
insurance, etc., that were sufficiently comprehensive to cover employees’ health care needs
and address their and their family’s financial security needs in the event of disability,
retirement, or death (Rappaport, 2013).
A work environment that was physically and psychologically safe (Rothmann and Welsh, 2013).
Work-life flexibility that would enable employees to fulfil their work responsibilities and
adequately attend to family or personal obligations (Sheridan and Conway, 2001).
An employee who is unable to earn sufficient income to meet his/her and his/her family’s living
expenses or does not have the necessary health care coverage to take care of his/her and his/her
family’s basic health care needs or feels that he/she is in an unsafe work environment or does not
have the flexibility at work to take care of his/her family and personal obligations would find it
difficult to remain employed in the organization for any extended duration of time regardless of
other exciting benefits and values that the organization might offer. These employment benefits
share the common theme of being the essentials for an employee’s sustainability in any
employment.
On a primary level, one might equate such needs to Hertzberg’s hygiene factors (1959), where if
unfulfilled will create dissatisfaction and if fulfilled, might alleviate dissatisfaction but would likely
not be sufficient to lead to a sense of satisfaction or motivation to do a better job. One might
question whether the same needs, when fulfilled beyond expectations or beyond what is needed to

118
meet one’s defined needs, could in fact lead to satisfaction even it does not generate motivation.
The adequate fulfilment of such needs is an antecedent to job satisfaction, which has been
repeatedly found in past research to be a mediator of employees’ job performance (Petty, McGee
and Cavender, 1984; Judge et al., 2001). As such, if an organization wants to strengthen its
employees’ job performance, it first needs to ensure that benefits that are deemed necessary for
meeting employees’ essential needs are adequately and effectively fulfilled. This section of the
dissertation will reveal how BOB attempts to do so.
The employment benefits identified above were relevant to this case organization. Research
involving more organizations might lead to the conclusion that there are more employment
benefits that could be deemed essential needs for employees.
In comparison to other Canada’s Top 100 Employers of 2012, Mediacorp Canada Inc. (2012) had
rated BOB’s compensation and financial benefits as above-average and its health and family-
friendly benefits as very good. The ratings for employers that have won a place on the Canada’s
Top 100 Employers’ list would typically be average, above-average, very good, or exceptional.
However, none of the six participants who identified competitive compensation as one of their
offerings indicated that they lead the industry in terms of salaries. All asserted that BOB offers
either competitive or fair compensation:
“We offer a competitive wage. I don't think we're the highest, I don't think that we lead,
but we certainly don't lag. And we do go out and assess the markets in that we are fair,
we pay at the fiftieth and above percentile, so I think knowing that, I mean, that's really
great.” (Participant # 11)
From the six managers’ responses, the fact that 13 of the 19 managers did not identify competitive
compensation as one of their offerings, as well as from a review of the organization’s career
promotion literature, one might speculate that while BOB offered fair compensation to ensure that
employees did not feel unfairly or inadequately paid compared to most of their peers in the
industry, compensation was not one of the organization’s primary tools or strategies for employee
attraction and retention or for performance enhancement.
One might assume that while BOB’s basic compensation and standard benefits provisions were not
exceptional, they were competitive, thus adequately satisfying employees’ sense that they had
been remunerated fairly compared to their peers in other organizations. This might in turn reduce
employees’ inclination to seek similar opportunities elsewhere for the reason of gaining better
compensation or benefits, especially if other provisions offered by BOB were highly appealing to
them.
Four of the managers interviewed did acknowledge that BOB had lost some employees, not to their
competitors but to their clients, which are mostly in the oil and gas industry, the highest paying

119
industry in Canada (Huffington Post Alberta, 2013), particularly for technical and engineering
positions. Interviewees felt that it would be difficult for BOB to compete directly in salaries but that
it could distinguish itself from these employers through the offer of other provisions and a more
desirable work environment.
“I think we do pay competitive salaries. We have good people in the organization and
they wouldn't be here if we weren't paying competitive salaries, but it's not just for
salaries, it's a very whole employment experience. And so we purposely don't try and
compete with the salaries at AA [client company] and BB [client company] and these other
guys, but then, again, we don't wear suits and we have a more relaxed working
environment. And we have maybe better work life balance and there are just cultural
differences that some people value.” (Participant # 10)
When it came to general wellness and work-life balance for employees, it appeared that BOB had
made efforts to foster not so much of an equal work and life balance but a healthy and sustainable
work and life integration.
Since many of BOB’s employees worked on projects, the demand for their time and attention
fluctuated with the type, duration, complexity, and even location of projects they were working on.
At times, they might be expected to work long hours to get a major project done on time while at
other times, they might be able to work less than a standard eight-hour workday. As well,
employees had different personal and family obligations that would affect the demands of their
time and attention. Recognizing these factors, BOB offered its employees flexible working hours as
well as the options of telecommuting, compressed work week, shortened work week, and phased-
in retirement. As long as employees were still available for contact, can get their work done on
time, and their requests did not pose undue hardship on their work coverage or operations, they
could readily access the options BOB has in place.
“You can come in to your manager and say, well, I'd like to work from home every second
Friday, it fits with my job and, you know, you can go and do that. I wanna change my
hours, I wanna work 7:30 to 4:00, or 7:30 to 5:00, okay, if it works with the team and,
you know, we don't have coverage on Tuesday, for sure you can do that it's a good thing,
that's a positive thing that they do follow through with.” (Participant # 1)
It was understood that positions that were schedule-bound, such as a receptionist that had to
make sure that the organization’s telephone lines were answered during the peak 9 am to 5 pm
work schedule or a cafeteria worker that had to make sure that the cafeteria in a particular BOB
location was open from 7 am to 3 pm for employees to access food, might not have the privilege
of flexible work hours or telecommuting. However, such employees might still be considered for
compressed work week, shortened work week, and phased-in retirement.

120
From the management interviews, it appeared that employees’ “work-life balance” was an area
that was being informally monitored and addressed by managers as well as being formally
discussed in employees’ annual performance review and goal-planning sessions. Managers used
the feedback to determine if intervention or motivation would be needed to ensure employees’
employment sustainability and success.
“We know who's overworked, who's overwhelmed, and we try to find, and it doesn't
always work, somebody to help them or help ease their workload or encourage them to
take vacation days as soon as they can. We do a lot of individual lunches. Managers will
take somebody out for lunch and find out how they are doing. We try to take someone
every couple of weeks. You know, how's it going? Are you happy? How's your workload?
You know, where do you see things going? So it's not a review per se, it's just where are
you at right now? Are you overworked, are you happy? Those types of things really, I
mean, it shows that we do care. We want you to stay at BOB, we want you to be happy
here.” (Participant # 15)
“I work way too much. And other places that I've worked at, they say, oh, yeah, you
know, we know that you work too much, but we need you to keep that up so, you know,
it's fine. But here, every year in my review, one of the things that they're trying to work
very hard with me on is improving my work life balance. One year, just doing a project, I
worked an insane amount to make a deadline and they ended up giving me a gift
certificate to a bike store because they knew that I was wanting to get back into biking
and that was one of the ways to kind of push me into, you know, getting back into
something that I liked that would improve my work life balance. If they see that I'm
working a ton, they'll sit down and we'll try to work out a solution. It doesn't always work
but they try.” (Participant # 19)
In addition to flexible work arrangement options, BOB provided employees with other health and
wellness enhancing benefits including an Employee and Family Assistance program and various on-
site provisions26 such as a gym, massage therapy, workout sessions and/or other wellness
programs. BOB also actively encourages its employees to participate in activities such as corporate
challenges, marathons, and various in-house competitions.
Aside from fostering personal wellness and sustainable work-life integration, there were strong
indications that BOB also paid much attention to occupational health and safety. BOB’s success in
becoming and being recognized as a safety conscious organization in derived from its efforts to
incorporate safety into every aspect of its operation as well as most aspects of its communication
to employees as well as to clients. It had become not just part of its regular practice but also part
26 On-site provisions are not available in all locations but program subsidies are provided instead.

121
of its organizational culture, thus ingraining the concept of safety, be it at work or at home, in
employees’ consciousness.
“They [BOB] really have taken seriously anything that can be implied as health and safety,
whether it's in the office or out in the field. Obviously, they do a lot of field work so that's
generally where people concentrate on because when you're going to a client’s worksite,
you need to make sure you're following exactly their guidelines. Here [BOB] they've made
a lot of changes, especially two, three years now, they really want to know anything and
everything that may or may not be safe. They want to know about it. They want it in
their database. They have people that review it, they give us updates once a month, they
find out what's been going on. Let's say, winter's coming up, they’ll send notice to beware
of the snow. There's going to be ice, this kind of stuff. It’s in our culture so that even
when we go home, we don't forget about it. (Participant # 4)
“Our health and safety motto, "work safe, home safe," applies to every employee,
regardless of job function and whether working in the office or the field. It reflects both
our strong culture of supporting and mentoring employees, and represents our high
expectations for safety at all times. BOB employees know they are expected to call the
company's attention to any potential health and safety concern and to do the right thing in
the face of health and safety breaches by clients or partners, no matter how difficult that
may feel.” (BOB Sustainable Development Report 2011)
As a whole, there was strong evidence to substantiate BOB’s success in creating an overall healthy
and safe work environment for their employees and in making health, safety, and wellness as part
of their brand, their daily operation, and their culture. This was verified through the results from
the interviews as well as a review of the organization’s health and safety policies and plan, sample
investigation and inspection records, safety committee meeting minutes, historical data as well as
established programs, controls, and processes. 13% of BOB’s offices around the world also had
health and safety systems accredited to OHSAS 18001. According to BOB’s 2011 Sustainable
Development Report, their injury and accident case rate was reduced by 26% in 2011 alone and
they reported an 83% health and safety engagement score from their 2011 global employee health
and safety survey. As well, a total of 14,565 health and safety learning sessions taking over 25,000
hours were facilitated in 2011. That year, BOB won six health and safety awards from different
parts of the world for their outstanding safety initiatives and record.
BOB’s occupational health and safety provisions did not appear to be limited to individuals’ physical
health and safety only. BOB also promoted itself as an employer that emphasized psychological
safety and treated employees with honesty, fairness, and respect.
“Making it a safe place to go and talk to your senior people. Making it, communicating
that it's okay if you have a problem to go and ask for help that's, yes, if you face-plant,

122
that happens and as long as you learn from it don't repeat the experience with the same
mistakes, you know. Yes, it's not very tangible but I think our leaders and our senior
people provide a safe environment for people to be able to come to them.” (Participant #
3)
“I often hear our very senior leaders state that, you know, it's okay to make a mistake
because that's how we learn. You're not criticized or reprimanded for it. It's more of what
did you learn from that. And I think that's an awesome learning environment, an
awesome environment to work in.” (Participant # 11)
When employees were asked in the employee survey how well BOB had fulfilled their expectation
for the statement, “Firm organizational commitment to its pledge of honest, fair, and respectful
treatment of employees” 83% of the 298 employees that responded to this question indicated that
their expectation had been adequately or more than adequately fulfilled.
The promise to treat employees with honesty, fairness, and respect appeared be fulfilled through
the organization’s: 1) emphasis on the importance of employee input, 2) highly consultative
approach to decision making, 3) multi-mode of organizational communication and employee
interaction, 4) relatively flat organizational structure and good access to senior managers, and 5)
the organization’s Principal and Associates structure, all of which will be explored in detail in a
latter part of this chapter.
While job security was not an employer brand provision directly identified by managers
interviewed, the issue was brought up by a manager in the discussion of how BOB provided a
distinctive and desirable work environment for its employees. Like satisfactory income and a safe
workplace, the issue of job security contributes equally to most employees’ sense of sustainability
in their existing employment. In this case, in spite of the fluctuating economy and the somewhat
cyclical nature of the business, at least in countries with snowy winters like most parts of Canada,
BOB appeared to have been able to maintain noticeable work stability and job security for its
employees:
“BOB values its employees and wants to see people through, you know, move them up
and keep them, we're not the kind of consulting firm that hires when we're busy and lays
off when we're slow. Like, we try to keep our employees and provide as much job security
as possible. A lot of the small consulting firms, if they're slow, they lay you off. There's a
high, really high turnover rate, whereas BOB is trying to really care about its employees
and, you know, hire to meet our needs and not do the mass hirings in the spring and then
layoffs in the fall, which happens a lot in the consulting business, especially with the
smaller firms.” (Participant # 15)

123
Challenges encountered in fulfilling the factor of employees’ personal sustainability
One challenge presented by two managers interviewed had been the organization’s difficulty in
maintaining consistency of practice across all eight divisions and many more groups within.
Employees in a small number of groups were expected to work consistently long hours and for
them, the promise of work-life balance or sustainable work-life integration had not been as
adequately fulfilled.
Another challenge presented had been the fluctuating project load. When the economy was
flourishing and the organization continued to procure a large number of projects, employees
needed to work long and hard for an extended period of time until such time that sufficient new
personnel were hired and deployed to offset the workload. Ironically, similar challenges also
occurred when the business was affected by an economic downturn and fewer employees were
needed and retained to work on existing projects. Those that remained would also need to work
long and hard for an extended period of time until such time that business improved and more
personnel could be hired. According to one manager, such challenges had resulted in some
employee departures from BOB.

124
Factor of Connectedness and Belonging
Factors Employment Benefits
Connectedness
and Belonging
Organizational support for team work and/or collaboration among colleagues
A supportive and caring work culture
This factor reflected the organization's emphasis on creating an environment where employees felt
they belong and connected with others and could see a possibility of a long-term, productive
relationship with their colleagues and the organization. Managers saw a strong sense of
connectedness and belonging as the glue that attached an employee to his/her co-workers, team,
and the organization as a whole. They felt that this fostered team work, collaboration, genuine
care for one another and willingness to go out of one’s way to help others succeed.
BOB’s efforts to create a sense of belonging for employees were not limited to the offering of a
100% employee ownership program, a highly consultative and community approach to decision
making, and its Principals and Associates system. On a day-to-day basis, such effort appeared to
involve the intentional creation of regular functions, consistent rituals, and common causes where
employees got to connect with one another and engaged one another in causes or activities of
mutual interests. For BOB, that included but was not limited to their community support and
engagement initiatives, corporate challenges, events surrounding the type of work they do, or their
bi-monthly ‘Weekend Attitude Adjustment Meetings’. BOB also encouraged informal employee
gatherings.
“It's really well attended, at least by my group, and I just see a lot of people doing things
like volunteering for the BOB Trust for Orphan events, volunteering at the corporate
challenge that we have here in Calgary, going to things like that. We have an employee
event where people in the company, in this office, get together and form bands and they
rent a bar on a Friday night and we go and we have the bar from, like, four in the
afternoon until eleven o'clock at night and the bands get on stage and play and people
come and have a couple of drinks and eat dinner and, you know, cheer the bands on and
those kinds of things are really well attended. And I think part of that is people really
buying into BOB. Like I look at attendance at those kinds of things and interest in the
sustainability committee and interest in Earth Day as evidence of the fact that clearly at
least some people are really enjoying what we're doing.” (Participant # 16)
“We have this thing called the WAAM - the Weekend Attitude Adjustment Meeting. We do
that every other month at the last Friday of the month and it's beer and appetizers and all
that. The entire office is invited, it's in the cafeteria over there and then we have a couple
of announcements that are light, fun and things about our involvement in the community
to share that with the staff. This is what we do, this is how we can get involved, you

125
know, fun stuff that's happening in the company and all that and that we're doing. And
it's a great place for the staff to be able to mingle and meet people that they wouldn't
otherwise necessarily because they're on different floors, different divisions, different
departments, so that gives them an opportunity to mingle and meet people that they
would not necessarily bump into at the coffee machine otherwise.” (Participant # 3)
The necessity as well as the opportunities for employees to work as a team with co-workers from
within one’s group or from other groups also increased the interaction among employees and likely
hasten the development of connections, bonds, and team spirit between co-workers.
“Even though we're a massive office, the groups are all fairly small. They are 12 to 20
people, so you really develop this little sense of community and you get to know each
other really well. You start to develop friendships and relationships and then we have all
these other groups that we start to work with on an interrelated basis, so you just kind of
start expanding, you know, expanding your network. But it's never overwhelming, like it
can be in other offices because you still have this base group that you get to come back
to.” (Participant # 16)
“The groundwater people having to work with the service water people and having to work
with the fish people and, you know, it doesn't become overwhelming because you're only
working with a couple people from those groups, but it forces you to start realizing how
your disciplines interrelate and interact and it expands your horizons to realize how what
you do is affecting other people.” (Participant # 16)
As well, BOB created physical work spaces that allowed for close-proximity interaction among
members of each group or department.
“We wanted to have a community. So you have, you know, close offices and then in the
middle you have work stations and we try to have the teams that work together to be in
this sort of community so that they can be close to the people they work with, it makes it
easier for them to share and exchange and work together and all that. So these are some
of the all sorts of different considerations or things that we would do concretely to try to
get them to have better teamwork.” (Participant # 3)
One aspect that might have eased the facilitation of relationship building at BOB was what had
been described by four managers as a more relaxed, open-door culture of interaction within the
organization. Another aspect would be the organization’s relatively flat organizational structure
with fewer hierarchal barriers to communication and interaction, as was highlighted by managers
in a former page of this report.

126
“I would say at times BOB feels like a very, very big mom and pop shop…It seems like
there's not a lot of companies that you can just, I don't know what's the right word, go see
their VP and kinda, I mean, sit down and just kinda chat about anything and everything.
It doesn't matter. Like, say, oh, did you see the hockey game? You know, be able to just
kinda be casual with no matter what layer of management you're talking to. Everyone,
there's a very friendly atmosphere, when it comes to that. So even though you're talking
to someone who's been here for thirty years, they'll still just hang out with you like you're
just the same as them, type of idea. So I find that a little bit different. That there's not all
this, a whole bunch of different layers of management and, well, if you're way up here
then you don't associate yourselves with the people that are one and two years, you know,
experience like I do. So it feels very comfortable.” (Participant # 4)
“We're very relaxed here. We're not a suit-and-tie kind, we allow you to be who you want
to be.” (Participant # 9).
As a whole, BOB appeared to foster an environment of a ‘tight-knit family’, where managers, as
parental figures, cared about and supported their employees and employees cared about one
another, and collectively, they wanted to do what was best for the family:
“I do feel that BOB does feel like a family. And people generally are interested in doing
the right things because they want to, not because they are asked to. It’s because they
want to improve the organization, they want to move things forward.” (Participant # 10)
“I think BOB's very much a family and we look after each other.” (Participant # 2)
For BOB, creating a sense of family and belonging appeared to start from the moment an
employee was hired. The following was one example.
“Even before starting in the company, my husband got a package that says, here's the
taxi numbers if you need a taxi, here's the train and the bus and how to get to the office if
you're coming from downtown. A lot of information, just to get them going and get them
comfortable coming to work and a lot of people are kinda saying, wow, the company really
cares about, you know, the employees that are starting, new employees, and probably
cares about the employees that are already there, which it does.” (Participant # 1)
There is evidence to indicate that BOB’s efforts to create a sense of belonging and connectedness
among employees is part of it broader strategy to establish and maintain a long term relationship
with its employees. The term "Cradle to Grave" was used by three managers to describe the way
BOB views its approach to employee relationship management:

127
"..employing the best and following them through their career until retirement."
(Participant # 5)
"Cradle to grave concept now is rallied out, it's active, it's a life process." (Participant # 17)
It reflected the organization's intentional efforts to support an employee's holistic development,
general well-being, and whole career progression, from the moment they were hired to the time
they fully concluded their employment at BOB and beyond. The intricate maintenance of such long-
term Cradle to Grave employment relationship was not identified by any manager as a specific
employment benefit or brand promise. However, it appeared to involve either creating or taking
advantage of opportunities throughout an employee’s life cycle at BOB for the organization to
demonstrate and provide the employees with the many employment benefits promised.
Seven managers interviewed also offered insight into two noteworthy unwritten policies that BOB
applied in its efforts to preserve these long-term employment relationships.
The first unwritten policy claimed by managers was selective hiring. This was to ensure that
candidates hired are those that subscribed to the organization’s values and priorities and would fit
in well within the BOB community.
"Because of our focus on people, we hire a lot of like-minded people with similar
values...... We hire people that care. And when they care, they care about the
environment, they care about the business, they care about work life balance, these are all
very important [to us at BOB] and that sort of comes back to that mutual respect, again,
the caring for one another....and I can say for the team that I've built, most of the people
on that team enjoy coming to work so that they can interact with the people." (Participant
# 17)
"We will recruit people that, I mean, people used to call it, or we still call it like that, or you
hear that, where someone fits or doesn't fit. So there's definitely some of that but you fit
in the culture and you fit in the values and all that or you won't last because you're going
to get frustrated and all that. So you attract people that are like-minded...... we've had
some troubles, we've made some mistakes in terms of hiring people that were not as
typical as we would've liked them to be. But we learn from that. " (Participant # 3)
The assumption here was that employees who shared or embraced the values and culture of the
organization and fit well with existing employees of BOB would likely have a better work
experience and higher chance of successful employment at BOB, which in turn would increase the
duration of their employment with BOB.

128
The second unwritten policy claimed by managers was their sincere support of the employees’
holistic development and overall career progression, regardless of whether such support would
yield direct or immediate benefits for BOB. Managers claimed that the focus was on the employee's
best interest. While 82% of employer survey respondents confirmed that their expectation for the
employer brand promise of a supportive and caring work culture was adequately or more than
adequately fulfilled, the researcher was unable to verify this specific claim.
"I think one of things I like about BOB is that BOB's not afraid to say, your career could
end at some point here and you could go off somewhere else and gain some better
experiences that you couldn't get here and then come back to BOB for a position. So you
could be an assistant and then work to a coordinator role and then, well, there's no
management role for you at that point, you hit a ceiling, but, you know, we still like you
and stuff like that. And, you know, if you want to go somewhere else, it's still a positive
thing. We don't look at it as negative. Maybe in a few years there's a management role
that suits you, that you've gained some experience, and you come back, right?"
(Participant # 1)
"...once somebody has someone good they want to hang on to them, but at the same
time, we, I think it's part of our values that we want to provide opportunities. I mean, I've
been in a situation where I've heard of an opportunity and I've told one of my staff
members, even though I would prefer that they just stay in our group and I'm fine with
that and I think people have to be provided an opportunity." (Participant # 2)
Managers’ view appeared to be that looking out first and foremost for the employee’s best interest
(instead of first and foremost for BOB’s best interest) would create long-term goodwill between the
employee and BOB and that such goodwill would eventually have a positive return for BOB. While
not mentioned, such return might include increased loyalty to the organization, tendency for re-
employment at the organization after the employees have gained more knowledge and skills
elsewhere, or positive word of mouth from the employees to others on BOB’s supportive work
environment.
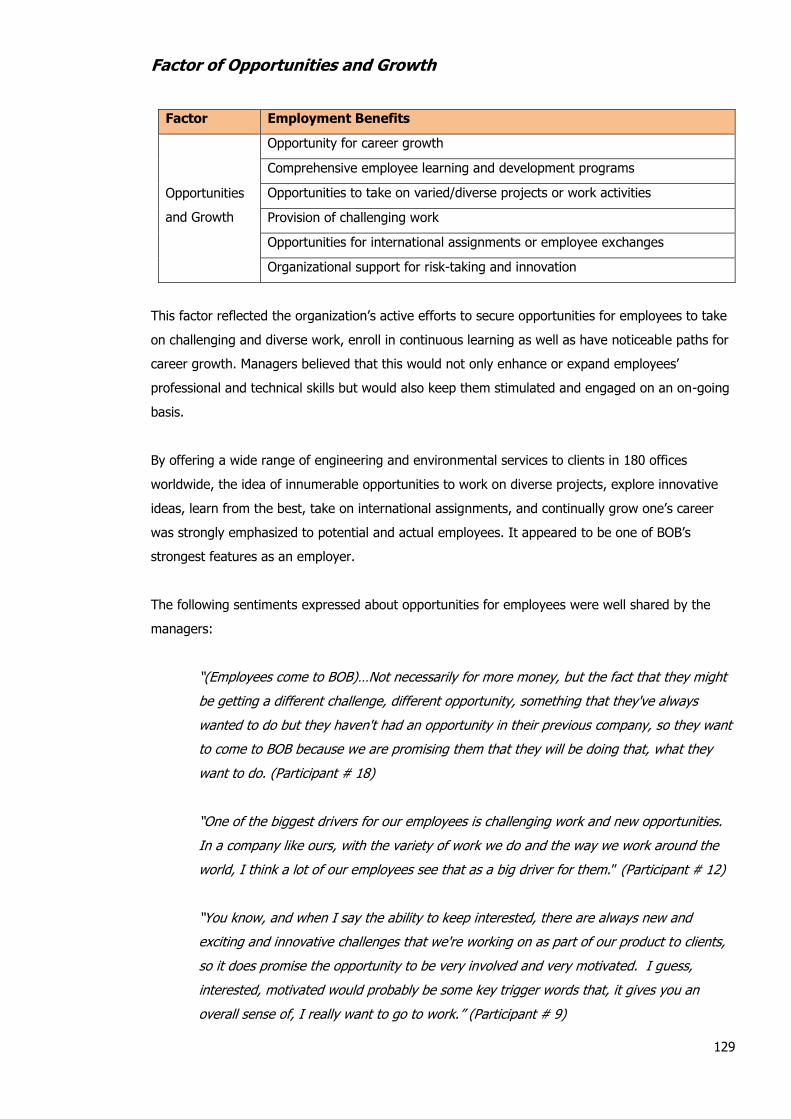
129
Factor of Opportunities and Growth
Factor Employment Benefits
Opportunities
and Growth
Opportunity for career growth
Comprehensive employee learning and development programs
Opportunities to take on varied/diverse projects or work activities
Provision of challenging work
Opportunities for international assignments or employee exchanges
Organizational support for risk-taking and innovation
This factor reflected the organization’s active efforts to secure opportunities for employees to take
on challenging and diverse work, enroll in continuous learning as well as have noticeable paths for
career growth. Managers believed that this would not only enhance or expand employees’
professional and technical skills but would also keep them stimulated and engaged on an on-going
basis.
By offering a wide range of engineering and environmental services to clients in 180 offices
worldwide, the idea of innumerable opportunities to work on diverse projects, explore innovative
ideas, learn from the best, take on international assignments, and continually grow one’s career
was strongly emphasized to potential and actual employees. It appeared to be one of BOB’s
strongest features as an employer.
The following sentiments expressed about opportunities for employees were well shared by the
managers:
“(Employees come to BOB)…Not necessarily for more money, but the fact that they might
be getting a different challenge, different opportunity, something that they've always
wanted to do but they haven't had an opportunity in their previous company, so they want
to come to BOB because we are promising them that they will be doing that, what they
want to do. (Participant # 18)
“One of the biggest drivers for our employees is challenging work and new opportunities.
In a company like ours, with the variety of work we do and the way we work around the
world, I think a lot of our employees see that as a big driver for them.” (Participant # 12)
“You know, and when I say the ability to keep interested, there are always new and
exciting and innovative challenges that we're working on as part of our product to clients,
so it does promise the opportunity to be very involved and very motivated. I guess,
interested, motivated would probably be some key trigger words that, it gives you an
overall sense of, I really want to go to work.” (Participant # 9)

130
As one of the larger and better resourced global players in the industry, BOB bid for and procured
bigger and more complex projects around the world. This offered their employees the
opportunities to not only work on diverse projects but also on big, complex, challenging, and
presumably more rewarding projects:
“Many people don't have the opportunity outside of a big consulting organization to be
able to work on large international projects, you know, oil sands projects, that kind of
thing, these multi-million dollar projects, which are our bread and butter, to some sense. I
mean, we've built a business around being able to service big clients, big projects, big
stuff, right? At the outset, that looks like a big and challenging, complex opportunity. And
certainly we promote that ..[to our employees].” (Participant # 6)
In its operational model, BOB’s employees worked on different projects at different times with
different team members and often also different departments. While employee participation in
projects were generally assigned by department and project managers based on the skills
necessary for the projects, the availability of employees, and also the consideration of development
opportunities for targeted employees, employees themselves were also encouraged to bring
forward ideas for projects or to seek participation in projects that are of interest to them, even for
the purpose of learning and apprenticing. In such cases, the employee’s supervisor and the project
manager27 would determine the feasibility of the employee’s request and, if deemed possible,
would work out a plan with the employee on how he/she might successfully participate in the
project without negatively impacting his/her existing work obligations. As BOB had eight divisions
and multiple groups within the divisions, there were opportunities for employees to learn different
jobs and tasks outside of one’s program and division:
“We have a technical staff whose role is to work under a certain person and assist him
with different projects. On the other hand, the tech is given opportunities to meet other
people so that he can work on their projects as well. And so then, which is what's
happening in our group, we have a tech who’s primarily supposed to be working on XX
[name of one group] stuff but he was interested in doing YY [name of another group]
work and so our project manager said, well, here's the project managers in the WW
[location] office that do the YY work. Call them, see if they have capacity to use you. So
he called them up and they did. So, yeah, we made allowances in his schedule so that he
could also do that work.” (Participant # 15)
“It was more, I think from the perspective of allowing people to branch into other groups,
like we will allow people to, if there is an opportunity to go work in another group, to help
with a different project in another group, they don't get much ties to that project, it seems
27 If he/she is not the supervisor

131
to some of our competitors, once you get a job, that's your job. There's very little leeway
to be involved in other groups or in other projects where with us, we will allow that.”
(Participant # 18)
BOB enhanced its menu of challenging work by adding the possibility for employees to pursue
international opportunities. In order to ensure that international opportunities were accessible to
employees, BOB operated an International Employee Exchange Program where employees could
apply for internal postings of employment or secondment opportunities at other BOB locations
around the world. Employees, particularly those with unique skills or experience could also be
offered opportunities to work on interesting and challenging projects at domestic or various
international BOB locations. Some also had the opportunity to assist in the start-up of new
branches:
“The prospect for those that are interested in international work. Because BOB is world-
wide and our projects are throughout the world as well. So a lot of engineers will come to
us because we have those projects and we have the exchange program between offices.”
(Participant # 5)
“You know, I don't, I'm not sure how many of our competitors in Canada have the foot
print that we have in Asia, Australia, we're pretty much, South Africa, every continent and
we have people who move and mobility is a big thing.” (Participant # 7)
BOB also had a comprehensive employee training and development program that was made up of
a combination of its internal “BOB University”, generous tuition subsidies of up to $6,000 per
employee for external courses related to one’s position, scholarships to help employees continue
their education, frequent lunch-and-learn sessions, a mentorship program, cross-training
opportunities, and career planning services. As a whole, BOB dedicated 1% of its net revenue to
employee training initiatives. Managers were particular proud of their BOB University, where
learning sessions were offered regularly on various targeted topics as indicated in the interview
statement below and as verified through their workshop calendar:
“Yeah, professional development is definitely something that is near and dear to
everybody's hearts here on the leadership teams that they're ready to grow people and
growth for each person is different. But we have BOB University here and we offer an
assorted training to our professionals. We have communications, we have project
management, we have manager excellence training, actually I just completed that on
Friday, it's an excellent course. We have a lot of managers that grow into these positions
and need these tools or resources because, you know, you don't know everything that a
manager should do or what they shouldn't do. There's technical writing, there's BOB 101
which is an introductory to how BOB became BOB, you know, and what consulting means
and how that ties into charging our clients. Everybody has a good understanding. Health

132
and safety is very big here, as well. But then there's, you know, throughout our
performance reviews with our employees, we also look at smaller goals than just
professional development on the BOB University track, but also helping them grow within
their own role and providing training and helping them look at career path options and
doing cross-training so that's starting to happen.” (Participant # 11)
Interview statements also suggested that managers saw their mentorship program as a successful
and highly valuable part of employee development and engagement. Aside from nurturing young
talents and contributing to the strengthening of organizational values and culture, the mentorship
program was also held in high regard due to the understanding that new or junior employees got
to work with and learn from some highly respected, world-renowned experts. The mentors and
mentees did not necessarily work in the same department or group. Such mentorship broadened
the new employees’ understanding of the operations of other departments and groups within BOB
and of how different departments and groups related to or impacted one another.
“We have an informal mentoring program here, which is another aspect, actually, that we
do talk to our candidates about because we have a lot of people here who mentors. We
don't say, okay, here you go, here's your mentor. Our managers all encourage their
employees to go and find a couple different mentors for different reasons. And they learn
from them, they have, you know, they talk about learning in the meetings, they do lunch
and learns, so that's them. And then we have the mentor appreciation program so that
they can also come and select a gift from human development at that point to recognize
their mentor… it's big. I think in terms of the technical side, they would be a part of a very
highly educated technical team with world-renowned skills, world-renowned reputations
and be privy to learning from these folks who, you know, we have XX [name withheld]
here, who is well known around the globe for his work. People would fall over themselves
to get time with him, to work with him and to learn from him.” (Participant # 11)
With repeated recognitions and multiple international awards28 to acknowledge its innovation,
excellence and effectiveness in services and solutions rendered, one might assume that BOB
operated an environment that encouraged a reasonable degree of calculated risk-taking and the
generation of new and innovative ideas from employees. Employees having a sense of
psychological safety that they were not only allowed but encouraged to generate, propose, and
test out new ideas would likely also strengthen their engagement and fostered their creativity,
learning, and growth. Such sentiments were in fact brought forward by four of the 19 managers
interviewed:
“It's part of someone's psychological contract here, they expect to be given the
opportunity to play to their strengths, if they see an area of business that they'd like to
28 BOB website, “Awards” webpage: htTP://www.BOB.com/global/en/modules.php?name=Pages&sp_id=210

133
innovate in or move in to or develop a service offering to our clients that we haven't done
before, I think BOB's reputation is that you have the ability within BOB to develop those
ideas and assume entrepreneurial initiatives.” (Participant # 10)
“Risk-taking, I often hear even our very senior leaders state that, you know, it's okay to
make a mistake because that's how we learn. You're not criticized or reprimanded for it.
It's more of what did you learn from that. And I think that's an awesome learning
environment, an awesome environment to work in.” (Participant # 11)
It was interesting to note that while managers expressed a commitment by BOB to procure, build,
and offer definite development and career growth opportunities for employees as well as to assist
and support them in acquiring those opportunities, most also emphasized the notion that
employees were the captains of their own future and destiny at BOB, thus are expected and
strongly encouraged to actively manage their own development and career growth:
”BOB is a place where everybody makes their own destiny. So if you are a person who is a
little bit more proactive, you want to take your career in your own hands, you will be much
more successful at fulfilling some of these promises by yourself.” (Participant # 18)
“With our culture being that very intimate structure, unique, people have that autonomy to
work but they also have that ability to improve themselves through the project work. That
support level is there when they need it. At the same time, our culture is very open in
terms of allowing people to take a path in their career that they want to choose. And I say
that to some of my team members on a regular basis. You have the ability to choose your
own career path. To develop in the way that you feel is best suited for you. I'm giving you
an example. One of my team member, after doing a 360 review, recently said that she
would have some interest in project management. In fact, I was the one who suggested
that project management might be an area that complemented her current skill set. So
after doing so, I set up a subsequent lunch with a project manager so they could learn
first-hand from a project manager what are some of the types of daily activities a project
manager engages in. After that luncheon, she took the time to follow up with some other
project managers and some other team leads and, as a result, now she's working towards
becoming a project manager. She's doing some of the courses necessary and she's doing
other shadowing activities so she can learn more about that activity so that when an
opportunity comes up, she could make a smooth transition into a new role.” (Participant #
17)
The organization’s multiple efforts to encourage and support employees’ development as well as
interest in pursuing diverse opportunities appeared to stem from the understanding that in a line of
business where the organization’s success was largely dependent on the ability, efficiency, and
agility of its people to handle different projects, possibly under unfamiliar environment or

134
circumstances, in various parts of the world, it was critical to ensure that the organization’s
workforce, particularly its core service delivery personnel, were regularly-trained, well-trained,
diversely-trained, and highly adaptable. Ultimately, the employees have to be able to wear
different hats at different times:
“The variety of work is very important because most of our opportunities as a consultant,
you have to wear many different hats to really function properly in these roles and I think
if you just wanna be a desk person, that's great, there are some opportunities for people
like that, but the majority really need to want to have their hand in and be a part of
everything.” (Participant # 11)
Managers believed that it was also precisely the presence of the many opportunities for employees
that created a distinctive and desirable work experience for them and that made BOB different
than its competitors:
“So, I think as far as consulting engineers go the ownership model, the variety of work
that we have, the variety of geographical locations, the ability to move within that. I think
we pretty much can distinguish ourselves from our competition on that.” (Participant # 7)
“In other organizations that I have worked for, you will only ever be this one thing. You
don't necessarily get a change to expand beyond that. But in this office, with the variety
of different projects and the variety of different groups and the interaction between the
groups, fairly often you're pushing the boundaries of your skill set a bit more and it keeps
people more engaged instead of doing the same thing day in and day out and getting
bored out of their minds.” (Participant # 16)
Such distinctness was well communicated by BOB’s recruiters to potential job applicants at
university recruitment and professional fairs, during job interviews, on the organization’s website
and whenever they did public presentations regarding the organizations. Employees present and
past also passed on word of mouth regarding what was offered by BOB. Data on this is presented
under the factor communication later in the chapter.
Challenges encountered in fulfilling the factor of opportunities and growth for
employees
Two main challenges were identified by managers within this factor. The first being the
organization’s ability to consistently and continually supply interesting and challenging projects to
as broad a population of their workforce as possible and the second being some employees’ lack of
realistic expectation in terms of the pace of their career growth or the lack of capacity to manage
their own professional development.

135
Unavoidably, the Canadian economy as well as the economic conditions of the countries in which
BOB operates has an impact on the quantity and size of projects that BOB can procure. Like many
in the industry, BOB and its workforce were, to some degree, impacted by the 2007-2008 global
financial crisis. As a result, BOB had, for a period of time, more challenges in procuring as many
large or complex projects during economic downturns. This in turn yielded less opportunity for
interesting or challenging projects for employees:
“You get a slowdown in the industries, you know, a lot of our bread and butter for a while
was the mining industry and when things slowed down, they hold off and it does create a
bit of a hole. So certainly a lot of it is driven by the markets and industry. If the industry
is not developing then a lot of the time we're not getting involved in the work. [Question
by researcher, “so what would that mean in terms of project variety for employees?”] So
that would mean less project variety and also less training as we have to cut back on
extras” (Participant # 8)
A total of six out of the 19 managers interviewed expressed some frustrations with the sense that
some employees are not as self-directed in steering the development of their careers or not as
realistic in their expectations, which then resulted in the employees’ disappointment for not getting
the opportunities they hoped or expected to get:
“Whether you're going to travel anywhere or whether you're going to change from a group
to group, it's up to you. If you express quite often your desire to go somewhere or where
you want your career to go, your career will go there, but if you are a quiet person who
sits and waits for somebody to come and say, okay, now, next step, you might not get
there. There's no other company where I have worked that does that for you. You have
to make your own career.” (Participant # 18)

136
Factor of Personal Stake and Influence
Factors Employment Benefits
Personal Stake
and Influence
Opportunity to be a shareholder in a 100% employee-owned structure
Peer nominated Principals and Associates System
Fairly flat organizational structure with low hierarchy
An organization that values employee input
This factor reflected the significance that BOB placed on employees’ collective ownership and voice
in maintaining the organization’s continued operation and brand success. In this collective
ownership model, employees not only owned company shares but also had a genuine and strong
influence on the direction and activities of the organization. Managers believed that having
personal stake and influence in the organization strongly strengthened employees’ commitment to
the organization, which in essence, was their organization. Managers also believed that with an
ownership mentality, employees were more motivated to not only work hard and produce great
work themselves but also saw to it that others gained the support, tools, resources, and abilities to
produce great work so that the organization as a whole might excel.
Of all the employment benefits identified by the managers interviewed, one that was of particular
pride to them, was the opportunity for all full-time employees to be a shareholder in their private,
100% employee-owned organization. A total of 16 out of the 19 managers interviewed identified
this and the accompanying Principal and Associates system as BOB’s key unique, signature
provisions. While thousands of organizations in Canada offered their employees some form of stock
ownership plan, the number of Canadian organizations that were 100% employee-owned was very
small and BOB was one of an extremely limited number of 100% employee-owned environmental
engineering and consulting organizations in Canada. Managers felt that this provision differentiated
BOB from other comparable organizations:
“We are an employee-owned business and we need employees to own shares in the
organization for the company to remain sustainable in this model. Share ownership is
available to everybody and that is a simple fact. It is an absolutely feature of our
employee brand. I mean, it's what this business is based upon and lots of people talk
about it outside of the organization….Lots of people, when they come here for jobs, they
already know that.” (Participant # 10)
While employee share ownership plan has been identified as a form of employment benefit in
existing literature, there has been almost no discussion on it. It has primarily been viewed as one
option of economic/monetary benefit that employers have offered to employees. In BOB’s case,
this structure was much less about economic gain than it was about the gain of individual
ownership and the right to participate in organizational decision making as an owner. In fact, none

137
of the managers interviewed stressed the financial return of owning company shares. The
emphases had been on being an owner of the company, having personal stakes in organizational
decisions and actions, and cultivating an ownership mentality:
“It's not just the monetary. It's the empowerment to become an owner. You can be an
accounting clerk and become an owner in our company. You don't have to be a very
senior engineer to start to become an owner in our company. We value all those positions
are very important and they play an integral role in each other to make BOB, the company,
work.” (Participant # 11)
“Employee ownership is definitely something they push, well, all the time, but they want
people to have the ownership mentality because, again, this is an employee-owned
company, right? So, I mean, just even from a shares perspective, they want you to be
invested in the company. They want to see that you want to purchase shares from BOB, I
mean it's all private shares, so they want to see that you're putting money into it which, of
course, makes you more invested in your own company, which makes you want to work
harder, of course. They want you to have the mentality of whatever decision you're
making that, don't forget, this is your company so. As an owner, would you be making that
choice? Is that the right decision, being an owner? So, yeah, that's definitely something
they very much push.” (Participant # 4)
Each full-time employee with three or more months of employment with BOB, regardless of rank,
was eligible to purchase company shares either through the annual general offering or through
enrolment in the organization’s payroll share purchase plan. At the close of 2012, 54% of BOB’s
full-time workforce owned BOB shares. According to managers, this provision created an
“ownership culture” where employees were:
Personally invested in the company and its progress.
Given the right to participate in collective decision making for most moderate to major issues.
Rewarded with more shares by the company as well as given the right to personally buy more
shares when they demonstrate good work performance as well as when they are inducted into
the Principals and Associates system.
Five of the managers interviewed also highlighted the notion that as a private, 100% employee-
owned organization, as opposed to a publicly-traded organization, BOB did not have and did not
need to have ‘profit maximization’ as its ultimate goal. It could make decisions that might yield
lower profit but higher client and employee satisfaction or lower environmental impact. Examples
of decisions provided include allocating a higher percentage of their profit to support employee
development programs, rejecting lucrative projects that might contradict the organization’s values,
and preserving a compensation structure that rewards employees for their participation and
accomplishments in areas other than the procurement of billable hours. These managers
emphasized the value of independent and flexible decision making, the creation of an organization
138
of which they were proud to be a part, and maintenance of BOB’s good reputation for the long
term.
“They're [a competitor] publicly-traded so they have a lot of external influences directing
business. They live by quarterly results, right? As do we, but owing shares in the
company allows us to be responsible for how the performance is, right?” (Participant # 9)
“.…the fact that we're not publicly traded, and so the decisions we make are tempered by
the fact that we are not only here to make some money for shareholders but we have to
work here every day.” (Participant # 12)
“..the other difference I see is we're not answering to shareholders in the same way that
our competitors are. So if we think something's important, like putting on some courses,
and we want to invest in that and make a little bit less profit, we can make that decision,
whereas our competitors who are publicly owned don't have as much freedom, I suspect.”
(Participant # 2)
BOB’s employee ownership structure was directly linked to its interesting peer-nominated Principals
and Associates system (PAS). While the PAS system was only mentioned by three managers in
their responses to the interview question, “What are the key employment promises reflected in
BOB’s employer brand?” it was actually mentioned or discussed in other parts of the interview by
every manager interviewed. In fact, managers interviewed shared the sense that this system was
highly unique and truly distinguisheed BOB from other employers within as well as outside of their
industry:
The principals and associates structure of BOB. That's one thing that truly distinguishes
BOB. (Participant # 5)
With this system, all employees could, in principle, aim to be an Associate and eventually a
Principal by fulfilling a set of criteria that had been established by BOB for its PAS nomination
process. Such criteria included having consistently exhibited BOB’s core values of integrity,
excellence, teamwork, caring, and ownership, as well as having demonstrated other abilities such
as strong business acumen, technical and professional excellence, leadership, etc. in their work.
The criteria also included the ownership of a specific number of shares. The performance and
abilities of employees that were in the early stages of their career at BOB would be monitored by
their respective managers, who would rate their performance as would be typical in most
organizations. Employees who performed well would be awarded with more shares as well as with
the right to buy more shares. Eventually, employees that had demonstrated strong performance
and the desired attributes as well as own a certain number of shares would be eligible for
nomination to become an Associate. It could take an employee several years to demonstrate
his/her performance and abilities before being eligible for nomination.
139
In order to become an Associate, the eligible employee had to be nominated by other Principals
and Associates. As this was a privately held firm, the minimum number of shares required to be
eligible for a PAS nomination as well as the specific PAS criteria were not shared with the
researcher. However, the following explanation provided by an interviewee who was part of the
Principal and Associate team would best summarize the foundation of the system:
“We have a document that describes the criteria that we are looking for and its hits
attributes like business acumen, leadership, health and safety, living our core values, those
kinds of things. When we go through the nomination process each year, we actually have
to write a detailed nomination paper that actually speaks to all those attributes and the
principal and associate body has to agree that that person meets those values to be
named an associate in the firm. They also need to have a minimum shareholding level.
But you can reach that level and never become an associate. You can't buy your way in.
You can't do it through years of experience. You have to live those attributes. And so
that, along with our shareholding model, is kind of the conveyor belt that constantly moves
the next generation into leadership positions and describes what's important to us as a
firm. That model was set up when the company was very young and has held true to
today, worldwide. So these conversations happen in South Africa, they happen in England,
they happen in the United States, and they follow the same attributes. So when you
become a principal in the firm, you are a principal in a global company, not just here.”
In order for an Associate to become a Principal, he/she had to be nominated by other Principals
and this might take some years of dedicated service and “living the BOB attributes” to achieve. As
mentioned by one of the participants, the Principals and Associates were the organization’s brand:
“They are the brand…..collective body that maintains that (the BOB attribute).” (Participant
# 12)
Approximately 12% of BOB’s workforce is either an Associate or a Principal. Some of them are
managers while others are not. While one does not have to be a manager in order to be an
Associate or a Principal, it does appear that almost all senior managers are either an Associate or a
Principal.
Any employee that met the PAS criteria was technically eligible to become an Associate and from
there, to be further considered for the rank of a Principal. However, the system’s formal annual
selection process and existing 12% ratio did indicate that it was still a selective and relatively
exclusive entity. In this case, relative exclusivity did not necessarily equate negativity. As BOB had
expressed in its 2011 Sustainable Development Report, BOB’s Principals and Associates are “the
guardians of the organization’s culture and are responsible for achieving their purpose, vision, and
strategic goals in keeping with their charter.” It further stressed that the Principal and Associate
community “provides valuable succession planning and reinforces the employee ownership

140
structure.” The intricate selection process allowed existing Principals and Associates to carefully
select individuals that they believed truly embrace and reflect BOB’s values as well as truly
possessed the abilities and attributes required to ensure the organization’s continued success. As
all members were owners of the organization, everyone’s stake was impacted by the selection
decisions and it would naturally be in everyone’s best interest to be diligent and selective in
choosing the right partners for this critical team of “guardians”.
In their role as the guardians of the organization’s culture, a manager had equated the Principals
and Associates as the brand of the organization (participant # 12). How then might the culture
change as long-term Principals retire or leave the organization? From responses directed to this
specific question as well as others related to the integrity and sustainability of the organization’s
values and practices, it appeares that the preservation of the organization’s core knowledge,
values, and culture over the years had been made possible by their consistent Principals and
Associates nomination criteria, active mentorship of employees, succession planning, shared
ownership, communal decision making approach as well as mutual accountability and peer
monitoring of one another’s behaviours and deliverables. As a result, BOB had been able to
maintain its core knowledge, values, and culture in spite of the exits of Principals over the years.
Question by Researcher: “If the P and A and senior leaders are the brand, in the event of
departures or retirement or something like that, what happens then to these attributes
that are associated with the person now, because they are the brand?” Answer by
Participant # 12: “When I say the attributes, I don't think they're associated with any one
person, they're emulated by those people but it's the collective body that maintains that.
So we've gone through several generations, or, the company was founded in 1960, those
original owners are not in the company any longer.”
As the Principals and Associates were deemed the guardians of the organization’s culture, another
question worth asking was how BOB would ensure that new senior managers hired or transitioned
over from an acquired or merged organization could be relied upon to effectively serve as a
guardian of a culture which they may not be familiar. A manager had shed some light on the
matter:
“On some occasions when they [BOB] actually bought and merged with a company, we
will take some of those senior owners straight into the P and A community, when we
believe and we are confident that they meet those attributes. But for somebody that just
joined, for example, if I was to just join the firm today, you know, during the interview it
would be described to me the process, the attributes, and often times I would be
mentored and guided by a principal in the office who had an interest in seeing me succeed
in an established community. They would help me build some of the networks and the
trust that I need to build because you have to be known by enough people that they can

141
stand and say, we trust this person, they would help me make those connections. And
generally, it would take a couple years.” (Participant # 12)
In short, BOB expected new senior managers to have met the established criteria for its Principal
and Associates model before being offered or nominated for the roles.
There appeared to be transparency and openness in the process of becoming an Associate or a
Principal. Employees who were interested could readily inquire about the process and criteria for
becoming an Associate as well as explored their prospect with a member of the Human Resources
Development team and/or another Principal or Associate. Those that showed interest and
initiatives were encouraged, mentored, as well as supported to work towards becoming an
Associate. For new employees, this served as a development and achievement goal that they could
realistically strive to attain.
Once attained, it appeared that one’s status as an Associate or Principal had to be maintained
through continual demonstration of attributes and delivery of performance outcomes expected of
an Associate and a Principal. While an Associate and a Principal who had failed to do so might not
be stripped of his/her status, his/her employment could be terminated:
“To become a principal or associate you're supposed to reflect all those values. But, you
know, people change as they get older, things happen in their personal lives that may
reflect that. I know one associate in the [location] office and one in the [location] office
that have been let go in their late years. From my understanding, there were committees
of principals and associates dealing with it and it [the attempt to work through the
concerns with the individual] went over a really long time.” (Participant # 15)
As indicated by the interview response above and verified by other managers interviewed, BOB
made extended efforts to work through concerns with Associates or Principals that were facing
challenges before resorting to termination of employment. Managers indicated that such practice
was also extended to employees who were not an Associate or a Principal, though it was unsure
whether the effort or time taken to address concerns with an employee who was not an Associate
or a Principal would be comparable to that received by an employee who was an Associate or a
Principal.
Collectively, Principals and Associates represent about 76% of BOB’s share ownership and in order
to ensure continual accessibility of shares by subsequent generations of Principals and Associates,
existing Principals and Associates were required to sell their shares at a certain age, as expressed
by an interviewee:
“We also have to sell our shares at a certain age. So that, again, I mean it doesn't maybe
speak to some of the employer branding, but what it says is, we are a multi-generational

142
firm and, as a senior person, I can't get in the way of the next generation. They will make
me sell my shares and those shares that I sell will become available to the next
generation. So we have principals who have sold all their shares, in some cases they've
retained the title of principal and work with us in retirement or in another fashion. But you
aren't allowed to say, you know what? I kinda want to stay until I'm 70 so I'll sell my
shares then. Because what happens is your shareholding and the ownership and control
of the company will stay high up in the organization with a handful of people. And so
requiring the shareholder to sell down ensures that those coming up will get access to
ownership in the company. And it self-perpetuates.”
As well, no employee, regardless of rank, could own more than 1% of the organization’s shares. As
of the end of 2011, BOB reported that no single shareholder owns more than 0.6% of its
outstanding shares. The following response from an interviewee explains the reason behind this
policy:
“Because no one person has an ideal majority so no one could influence decisions in an
ideal way.”
Aside from owning more shares, the strongest advantage of being a Principal or an Associate
appeared to be the right to have a formal voice on almost all levels and categories of
organizational decision making. Particularly for a Principal, that could range from the selection and
approval of new Principals and corporate partners to the selection and approval of individual
contracts and training programs.
The norm of collective decision making did not appear to be limited to those in the ranks of
Principals and Associates. While not identified as an employment benefit, seven (7) out of the 19
managers interviewed indicated that consultative and community decision making was an aspect
that made BOB’s work environment distinctive and desirable. Leaders wanted employees to share
in the decision making and to own the decisions they made. According to these managers, such
decision making approach was a result of their employee ownership structure and fairly flat
management structure:
“It comes back down to our corporate culture. We're very flat from a hierarchal, obviously
the principals and associates and the major shareholders in the company are the major
business decision-makers in the company, but there's transparency of flow of information
to the non-P's and A's ……it is a community decision that's helping us move our business.
And I think that is the corporate culture that works. Others may emulate it and say that
they're an employee-owned company but you still have five major shareholders or six
major shareholders, and then everyone else.” (Participant # 9)

143
“In my experience with people who have come from competitors, they tend to be a little
bit more authoritarian than we are, where, you know, we definitely, as managers or
project managers tell our employees what they need to do but it's generally not in the
same way. The typical style is well, okay, I need you to do this now go off and do it,
whereas we have more of a conversation. Okay, this is my problem and I need your help.
Do you think that you could do something like this? So the person actually owns that task
and agrees to it themselves. I've noticed that difference. It's very subtle but it's a
difference I've noticed because some of our competitors who are now employees from
competitors that are working for us tend to be more direct, like, I'm a higher level than
you therefore you do this for me and we don't really do that at BOB.” (Participant # 2)
Personal influence and involvement in decision making has been presented in multiple articles as
being one of the key drivers of employee engagement. In BOB’s case, employee collective decision
making and employee voice were indicated by some management interview participants as the
cornerstone of BOB’s approach to operation. A majority of 77% of employee survey respondents
indicated that their expectations for this employer brand promise was adequately or more than
adequately fulfilled. Quantitative results showed significant positive influence on this employer
brand promise on multiple organizational citizenship performance behaviours but not task
performance actions (results discussed in more detail in quantitative section).
Challenges encountered in fulfilling the factor of employees’ personal stake and
influence
At the same time that these managers were pleased with the organization’s consultative and
collective approach to decision making, they were also troubled by the time that it took for
decisions to be made through such approach.
“The only frustration with that is that BOB takes a very long time to process information
and make a decision. [Question by researcher: “When you say very long, is that longer
than other organizations in the industry?”] Absolutely. BOB's decision-making process is
very slow because we have ownership model the way we do. And because we don't have
a hierarchy.” (Participant # 10)
“…you get a sense that decisions are delayed because of interests of a few and we have to
get collective agreement or else the structure doesn't work…I think part of our success of
being a very flat organization and having a number of owners and voices also hinders us
from being able to make conclusive decisions in a timely fashion.” (Participant # 9)
Ultimately, as indicated by the following interviewee, BOB had continued to thrive for over 50 years
with such ownership and leadership structure along with its consultative and collective approach to
decision making. While quicker decisions might save the organization some opportunities and

144
expenses, the result of strong collective buy-in when decisions were made had served the
organization very well. As such, the structure and approach would be preserved for the
organization’s foreseeable future.
“And because we don't have a hierarchy. So everyone is empowered to have an opinion,
which is wonderful, and everyone has the perceived right to contribute…They believe they
have the right to contribute and what's more, their opinions will matter…Consulting every
possible stakeholder in every possible decision makes the decision-making cycle slow and
sluggish. But what I want to say is, once the decision is taken, wow, it's a good one. It's a
strong buy-in, and everything has been considered. It's been looked at from every
possible angle that it's a good one…Making autonomous decisions here is quite rare.
Everyone needs to be consulted. Unless there's a very short amount of time in which to
make a decision, and very defined, but you need to make sure you use the time you have
as effectively as possible still consulting people…I keep reminding myself that BOB has
been in business fifty years with these same systems and has got by very well. ……There is
maybe a greater expense of cost because we didn't make a decision quicker, but in the
grander scheme of things, I'm not going to challenge the company's culture just to make a
small incremental saving like that.” (Participant # 10)
Another interesting challenge presented by a manager about BOB’s Principals and Associates
program was the notion that a manager who was not or not yet an Associate or Principal could get
into a quandary when they were supervising non-managers who were Associates and Principals.
After all, their continued employment or potential to become an Associate or a Principal could be
impacted by the feedback provided by these subordinates to the manager’s superior(s) and other
Principals and Associates. In various organizations around the world, managers have made
decisions that are, for one reason or another, not supported by some of their employees or might
even cause anger among employees. As an individual’s view of his/her manager’s decision
contradicts that of his/her manager or an individual’s interest is infringed upon by a manager’s
decision, conflict could easily arise in that relationship. In the case of BOB, should a decision made
by a manager be contrary to that which was expected or desired by some Associates or Principals
in the manager’s group, how would these Associates or Principals view or respond to the decision?
Should a manager’s performance be contingent upon the successful execution of such a decision
and this was not possible due to the lack of support by these Associates and Principals, how would
the manager’s performance be evaluated? Most importantly, would such challenges bias the
Associates’ and Principals’ view of the manager’s judgment, ability and, ultimately, suitability to be
an Associate or a Principal? While such concerns had been expressed by the following participant
and there was a reasonable likelihood that biasness could materialize under such circumstance, the
actual situation at BOB was unknown.
“I'm the manager of my group, but the associate in my group carries more weight. So for
me to tell my associate [who is not a manager], hypothetically, that, you know, he's not

145
behaving the way he's supposed to? It's really awkward. Because he identifies how much
I make. And where my career goes. But because he's the associate that I work most
closely with, at that table, he's going to be listened to more than, say, the ones that don't
work with me closely. Or, take for example, [name of an employee] is our [particular
department/group] manager, right? The person also an associate. So then, technically,
the person is in charge of the whole [particular department/group]. The person got a few
principals in there. So for the person to tell them what to do, I mean, these people decide
the person’s career path. They will decide if the person becomes a principal. Right? So it's
kind of a bit circular, a bit awkward. I've always pushed that your group manager should
not actually belong to the group they're managing. So that, if they do burn some bridges
and, you know, have a few awkward positions, it doesn't really affect their career for a
long time.” (Participant # 15)

146
Factor of Significance and Esteem
Factors Employment Benefits
Significance
and Esteem
Organizational commitment to technical excellence
Opportunity to be involved or contribute to the organization's community
building and engagement efforts
Opportunity to be part of a successful and highly respected organization
This factor highlighted the sense of pride and esteem that BOB attempted to foster within its
workforce for their collective accomplishments as well as for their mutual efforts in creating
significant social and environmental impact beyond their organization and individual work.
In BOB’s case, their collective accomplishments would include being recognized and respected as
the group that provides technical excellence and ensures high integrity in their deliverables as well
as in their dealings with stakeholders. Their mutual efforts in creating significant impact beyond
their organization and individual work would entail generating outcomes that would have lasting
positive impact on society or the environment. Such outcomes could also be seen as collective
accomplishments. In BOB’s case, such outcomes would include large-scale community support and
engagement programs as well as sustainable environmental solutions in their deliverables to
clients. Through these committed efforts, the organization establishes its relevance and
significance to communities in which it operates as well as to the communities it serves and
impacts.
From an employee performance enhancement perspective, managers give the impression that this
sense of pride that employees feel for the great accomplishments they achieve collectively is
bolstered by the accompanying external recognition, admiration, and respect that comes with it. In
turn, employees’ bolstered pride intensifies their desire to continually deliver the standards,
innovation, or calibre of performance that would garner them further recognition, admiration, and
respect from within and outside of their industry.
One of BOB’s declared values was the pursuit of excellence in technical solutions and services.
Seven (7) of the managers interviewed identified the organization’s commitment to technical
excellence as both a corporate and employer brand promise.
“They [new employees] will work in a well-respected company when it comes to technical
skills.” (Participant # 18)
“Our technical skills and abilities. We're known for being very good at what we do.”
(Participant # 16)

147
In order to deliver on such a promise, BOB employed a consistent process of reviewing all final
work (e.g. workplan, reports, etc.), regardless of the producers’ ranks in the organization, before
they were released to clients. The final work was reviewed by a Principal and possibly also other
members not directly involved in the project. If the work is produced or led by a Principal, that
work would be reviewed by another Principal and possibly also by additional reviewers not directly
involved in the project:
“When it comes to technical quality, how do we fulfill that? We have a coach and a
practice of senior review so every employee's work is subject to review, even senior people
we hire. Nothing goes out without senior review. That sometimes can be very difficult,
especially for senior people who come to join us when they are used to being the people
who review. There is a process of senior review and the underlying principle of that it is a
quality assurance mechanism.” Follow-up question by researcher, “Who reviews the senior
people?” Answer from interviewee, “A peer. So if you are the most senior person, if you're
a principal, you will either have a peer and two or three subordinates who would look at it.
So there is always a mechanism for making sure of what goes out. Now, ultimately, the
project director, who is a principal, will have final signing off but there is this, it's more a
culture than a process.” (Participant # 7)
Another key organizational value declared by BOB was integrity, whereby BOB pledged to be
honest, reliable, ethical and trustworthy in its work and relationships.
While integrity in work and relationships had only been formally identified by two managers as an
employer brand promise, all managers interviewed have indicated at one point or another
throughout their interview that BOB was an organization that had integrity in its work and in its
relationships. The sentiment expressed by the interviewee below was reflective of how other
interviewees felt about their organization:
"Number one is integrity. We want to make sure that we are doing the very best work
possible in a very professional manner, in a manner that is compliant with local laws,
regulations and suits the client's needs. So, integrity is number one." (Participant # 17)
The reality of whether BOB had delivered on its commitment to technical excellence as well as
integrity in work and relationships could be more accurately verified through its actions and
outcomes. BOB has won multiple international awards29 for technical, engineering and overall
29 Including but not limited to: 2013 Project Awards of the South African Institution of Civil Engineering, Best Consulting Engineering Firm at the 2013 BRW Client Choice Awards, 2012 National Engineers Australia Award, 2012 AGC Pinnacle Awards, 2011 ACEC Engineering Excellence Silver Award, 2011 Ground Engineering (GE) Awards, and more.

148
excellence as well as had produced, presented30, published31 a significant number of technical
papers and articles. While evidence for integrity could not be as easily found without further
inquiry of BOB’s clients, one might assume that integrity would be present in its deliverables and
dealings in order for the organization to gain its positive reputation and long-standing success in
an industry that is both competitive and has stringent guidelines.
The opportunity to be part of such a successful and highly respected organization was one of the
employer brand promises identified by three managers interviewed.
“The company has a very positive reputation. One of the reasons they want to come here
is for the work atmosphere.” (Participant # 17)
While only five of the 19 managers interviewed mentioned “opportunity to be involved in
community building and engagement” as an employment benefit offered by BOB, there were in
fact noticeable indications that BOB payed much attention to community building and engagement
and that a large number of employees do get involved in the organization’s initiatives through
financial donations and/or volunteer services.
BOB built and engaged communities through four noticeable avenues: 1) a major Trust for capital
projects to benefit families and children orphaned or displaced by the AIDS pandemic in Africa, 2)
an employee-promoted charity program where employees take part in the selection of the
charitable organizations or initiatives to support each year, 3) a full commitment to find and hire
talent from local communities in which BOB operates, and 4) participation or leadership in
professional and industry-specific associations as well as partnerships with academic institutions for
the purpose of sharing knowledge and best practices.
Many employees not only made financial donations to BOB’s Trust for Orphans and their charities
or causes of choice, they also volunteered their time in the projects funded by the trust as well as
in other employee-chosen charitable projects or functions. BOB’s 2011 Sustainable Development
Report indicated that 1/3 of BOB’s employees have supported their Trust for Orphans since its
inception in 2003 and the Trust, in turn, had contributed USD$1,000,000 to 11 projects in Africa
since then. The report also highlighted other outcomes including the fact that BOB’s employee-
promoted charity program contributed close to USD$183,000 in 2011 to two global crises.
Managers made it possible for employees to participate by providing various internal
accommodations such as work schedule adjustments for volunteer activities, payroll deductions for
donations, time off to organize fundraising events or participate in charitable projects, and more.
30 At Ontario East Municipal Conference (OEMC) 2013, PASTE 2013 - 16th International Seminar on Paste and Thickened Tailings, 2012 Water Environment Federation Annual Technical Exhibition and Conference, 2011 American Society of Mining and Reclamation National Meeting, and more. 31 In Civil Engineering, Canadian Meat Business, Pipeline & Gas Journal, Inside Mining, International Water Power & Dam Magazine, RéSource, North American Clean Energy, Oil Review Africa, Climate Change Business Journal, and many more.

149
“People are encouraged to get involved in the community. It's one of our core values and
I think it's also in the code of conduct that we want to give back to the communities we
work in. So, in any given month, we have so many events which involve the community.
There's the kid's cancer care, Cancer Care Foundation of Alberta, which I think this is the
eleventh year our employees are shaving their heads to raise money. I know there was
one scientist who was sent to Afghanistan to give his skills to the people there in the
rebuilding effort and global farming part of it. So there's a community involvement
support program, CISP, which considers such requests. So if there's an organization in the
community that I think is worthwhile, I can recommend that to the CISP and they will
evaluate and see if it's aligned with BOB's values and, if so, they will donate part of their
resources.” Question by Researcher: “So employees can recommend your choice of non-
profit or special cause? Now, what about if you are participating, let's say you decided to
run for cure of cancer or something, what do they do to, would they readily say, okay,
we'll donate x dollars for your pledge?” Answer by Interviewee: “Yeah, they communicate
this internally so people have a chance to make their pledges online and in many cases,
the company matches it to a certain amount. That's done every year for the shave your
head event.” (Participant # 19)
As for BOB’s commitment to hire talent from local communities, the organization has reported that
97% of its 2,500 new employees that joined the organization in 2011 were for local positions in
locations where BOB operates and 71% of managers are from the region they actually lead.
BOB’s leadership and participation in professional and industry-specific associations was also quite
evident with its current involvement and support of over 100 industry associations globally. BOB’s
personnel led or participated in such associations as well as collaborated with academic institutions
to cultivate and share information on best practices in various domains including community
engagement.
As a whole, community building and engagement appeared to be an integral part of BOB’s
operation as well as strategy to engage its own employees. It was not an isolated or small program
to show that they practice some form of corporate social responsibility. Instead, it formed part of
the organization’s overall sustainable development plan, along with the core areas of human
capital, operations, client services, and governance.
From an employee performance mediator enhancement perspective, many employees’
identification and engagement with the organization was noticeably strengthened through their
direct involvement in what could be deemed as causes of mutual importance. This solidified the
employees’ commitment to the organization and the causes they mutually care about. Such
strengthened commitment, along with other factors that further enhance the employees’
identification and engagement with the organization would be predicted to influence the
employees’ overall job satisfaction and performance (Markos and Sridevi, 2010)

150
Challenges encountered in fulfilling the factor of work significance and esteem
It appeared that the organization’s strong commitment to technical excellence posed some
challenges, mainly when they tried to balance between ensuring superior technical quality and
delivering the finished product on schedule and within budget.
“When it comes to doing things on time and on budget, our culture of technical quality is
so strong that sometimes our people aren't as afraid or as enthusiastic of getting
something on time or for the right price, and saying, well, we need one more week to do
this so that it is, unmistakably technically brilliant.…It's just, you know, when you have two
beliefs that don't always coincide, one of them has to compromise a little bit and we tend
to compromise more on that side to keep our technical quality because that's a big part of
our brand. Now we want to do both and that's our big challenge. How can we have high
technical quality and deliver on time and on budget, not either.” (Participant # 7)

151
Employment Benefit Materialization Factors
Factors deemed essential to the effective materialization of the organization’s employer brand
promises have been found to be:
Factor of brand championship
Factor of branding control
Factor of stakeholder awareness, selection, consultation
The delivery of the Employment Benefit Content factors of employer branding appeared to have
been made possible largely through the presence of certain organizational activities and factors.
These activities include determining:
Who would be accountable for leading and managing the organization’s employer branding
initiatives.
What processes, policies, structures, rewards, and other possible mechanisms would need
to be put in place to facilitate the effective delivery of the organization’s employer brand
promises.
What approaches would need to be taken to ensure that the targeted potential and actual
employees are not only being made aware of the organization’s brand offerings but are also
being consulted for their improvement and changes.
The factors identified in this case study were relevant to BOB. It is likely that further studies of the
employer branding practices of more organizations will uncover more Employment Benefit
Materialization factors.
Factor of Brand Championship
This factor reflected the significance that BOB places on having its employer branding strategies
and initiatives led by its senior leaders.
A 2011 employer branding global study by Employer Brand International reported that an
organization’s Human Resources team is the key group responsible for delivering the organizations’
employer branding strategies. The study, conducted through a survey of 1789 respondents from
organizations worldwide reported that 31% of respondents identified their Human Resources
Department as responsible for managing their employer brand (2011b). This was followed by the
Marketing Department at 18%, executive team at 15%, and CEO alone at 13%. While both
USA/Canada (152 respondents) and Europe/United Kingdom (544 respondents) had the Human
Resources Department on top of their list of department(s) or group(s) responsible for managing

152
their employer brand, USA/Canada identified the executive team as second on their list while
Europe/United Kingdom identified the Marketing Department as second on their list. One
noteworthy aspect of this part of the report is that the percentage of executive team and CEO
responsible for managing their organizations’ employer brand had gone up from 2% and 1%
respectively from their 2009 Study.
When asked what departments or employee groups were involved in planning, developing, and
executing the employer branding strategies at BOB, all three major groups were identified by
managers interviewed – senior management, the Human Resources Department, and the
Marketing Department. All managers interviewed identified senior management and/or the
organization’s Principals and Associates, with 14 of those interviewed identifying both senior
management as well as Principals and Associates. These individuals were involved in developing
the organization’s employer branding through leading discussions on branding strategies and
offering feedback and guidance in the actual development and execution of the organizations’
employer branding efforts.
As noted earlier, while one did not have to be a manager in order to be an Associate or a Principal,
it did appear that almost all senior managers were either an Associate or a Principal. Managers felt
that these individuals directly delivered the organization’s employer brand by not only shaping the
provisions and work environment represented by the organization’s employer brand but also by
personally promoting and exemplifying the values projected by the organization’s employer as well
as corporate brand (which share the same key values).
“It is our partners, our senior partners and associates that tend to the face of BOB in those
instances. They're the ones projecting our services and our culture and our sustainable
programs. And so in short, our partners are the ones that promote our brand and our
marketing team support the activity but don't lead it.” (Participant # 10)
“It's through them [the Principals and senior leaders] that a lot of the culture of the firm
and the brand of the firm from an employee's perspective is felt.” (Participant # 12)
“Senior leaders absolutely play a significant role in shaping the organization's employer
brand.” Follow-up question by researcher, “How do they shape BOB's employer brand?”
Answer by interviewee, “One of the ways that they do is through our BOB University.
They are facilitators for the courses. We try to capture some of the most senior people to
come in and help with the BOB orientation, to tell stories about the history of BOB and talk
about some of the innovative solutions that we've come up with in the past, to allow their
persona to come across to the individuals in terms of creativity, how they've worked
independently, so that new recruits feel that they have that autonomy to follow the
examples of some of the senior leaders.” (Participant # 17)

153
Nine (9) of the managers also recognized the role of the Human Resources team (called Human
Development team at BOB) in working with the organization’s senior leadership team to develop
their employer branding strategies as well as their direct role in leading the actual execution of the
initiatives. The Marketing team’s role in ensuring consistent messaging in the communication and
promotion the organization’s employer brand as well as corporate brand in general was
acknowledged by seven of the managers interviewed.
The essential question here is whether there is value in having senior leaders play the leading or at
least a larger role in championing the organization’s employer brand strategy. There has been
ample research and literature that argue for the significance of senior leaders in championing
organizational initiatives.
Should employees truly see their senior leaders as representatives of the organization’s values,
then it would be even more important for them to champion the organization’s employer branding
strategies and initiatives to ensure that the values promised and communicated are in fact the
values that are demonstrated in the organization.
Factor of Branding Control
This factor reflected the organization’s use of structures, programs, policies, processes, and
defined practices to ensure the effective delivery of its promised employment benefits.
Many specific examples of the organizations’ existing structures, programs, policies, processes, and
defined practices were provided by interviewees in the employee-centred factors section of this
document to substantiate the presence of proper controls with which BOB’s employer brand
promises are delivered. Further verification of the presence of structures, programs, policies,
processes, and defined practices as indicated by the managers were done by the researcher
through the review of the following materials:
the organization’s policy and procedures manuals
organizational materials and documents on employee intranet
internal documents and reports provided by the organization’s Human Development team
fact checks with members of the Human Development team
organization’s public reports and promotional materials
Examples of the organization’s verifiable structures and programs to fulfil promised employment
benefits included:
Employee share ownership program
Principals and Associate System
BOB University and comprehensive training calendar
154
International Employee Exchange program
Mentor Appreciation program
Community engagement programs
Sustainable development plan, targets, and supporting resources
Examples of the organization’s verifiable policies, processes, and defined practices to fulfil
promised employment benefits included:
Varied mediums of employer brand communication and promotion
Flexible work schedule and work arrangement options
Comprehensive occupational health and safety policies and procedures
Highly consultative and community approach to decision making
Varied and regular employee social events and activities
Physical work space that allows for close-proximity interactions – verified only on the
locations approved for this case study.
Involvement and support of professional and industry associations.
Industry and client recognition for sustainable and innovative technical solutions.
Industry and client recognition for technical excellence as well as quality assurance policy
and procedures.
Detailed Code of Conduct to guide employee and organizational behaviours in work and
professional interactions.
Unverifiable claims from management interviewees of the presence of the following structures,
programs, policies, processes, and defined practices:
Criteria for Principal and Associate nomination.
Business development agenda and data – to verify claims that BOB procure or receive
challenging projects.
Managers do encourage or allow employees to work with members from other groups on
joint projects.
Employees receive coaching and learning from senior technical experts.
Employees are allowed to take risk in their work.
Competitive (at 50th percentile of industry rate for benchmark positions) base
compensation.
Work-life balance practices
Job security actions
Senior leaders’ open-door policy
Unwritten policy of selective hiring
Unwritten policy of supporting employees’ best interest in career progression
As a whole, much of the management interviewees’ claims of the presence of structures,
programs, policies, processes, and defined practices to materialize the organization’s promised
employment benefits were verifiable through materials outlined above. The claims that were not

155
verifiable are largely due to the fact that they are unwritten codes of practice or norms that the
researcher was not able to observe at the time of data collection. Another reason why some claims
were not verifiable by the researcher was because they would require the review of what the
organization deemed as sensitive documents such as the specific criteria for the nomination of
Principals and Associates, the organization’s business development agenda and data, and the
organization’s salary structures.
Factor of Stakeholder Selection and Interaction
This factor reflected the organization’s focus on stakeholder selection and interaction in its
employer branding efforts. BOB used various methods of communications and interactions with
stakeholders to promote the organization’s brand offerings as well as to seek their input on
different aspects of their employment offering. At the same time, BOB focused its efforts on
recruiting job applicants that not only have the technical and professional skills suited for the kind
of employment it had to offer but more importantly, were attracted to and aligned with the values,
culture, and priorities it held. BOB believed that such applicants, when hired, would be better
received by its existing employees and would also be able to integrate more smoothly into its
operation.
To actively communicate and interact with its stakeholders about its brand offerings, BOB used
both external and internal mediums.
External communication and interactions
Organizational materials and website review as well as the manager interviews revealed the
following mediums of communication and interactions used by BOB to promote its employer brand
to potential job applicants and/or to seek their feedback on the attractiveness of the organization’s
brand offerings.
Recruitment events: universities, career fairs, professional conferences and tradeshows
“I was just at the university career fair last week and a couple people specifically
came up because they had heard about BOB and they wanted, they were interested
in working for us when they're done school.” (Participant # 13)
Advertising and communication materials: organizational website, job posting, broader
organizational advertisements, news releases, professional magazine articles
“Let's assume that they're applying for an opportunity. Well, first thing, there's a
job posting. There's an advertisement. I mean, within the advertisements we have

156
our logo, we have some pieces of information on the company. The advertisement
would inspire people to visit our website and there's more information on the
website.” (Participant # 15)
“We have done some poster campaigns and depending on what we are trying to do, if
we're just advertising broadly our services, we'll have engineering, your future,
preserving the earth, integrity. So that will appeal to people who want to be involved
in resource management but also have a social conscience or environmental
conscience and we, I think we position ourselves as a company that is involved in
resource engineering, in getting oil out of the ground or gas, but we're also, we're
involved in that to the extent that we're trying to make sure that that happens in the
most environmentally sustainable way possible. And that is a brand, I think, that
appeals to a lot of our new employees.” (Participant # 7)
Selection activities: responses to job inquiries, interviews, job offer discussions
“When we're pre-screening our candidates, our recruiting team will actually talk
about these things [organizational provisions, values, etc.] in our pre-screening
portion of the recruitment process.” (Participant # 11)
Established organizational reputation and word-of-mouth: current and former
employees, members within the industry
“Probably one of our biggest ways right now in our group has been word of mouth
and colleagues. So, for example, we'll have an individual that started, somebody
that they knew in school situation, they're looking for work, they come in for an
interview, and, you know, if they have the skills that we're looking for, I'll get them
in on as well. One of our recent hires, she tried to get on with BOB out east,
thinking that there wasn't a big environmental employment out there and she was
kind of directed from our colleagues in the east to come out west. So she's tried to
get on with BOB before, so she's, you know, she's looked at the website, she's
talked to colleagues in the east, following up and was interested and joined us here
a couple of months ago. So I would say that's probably one of the biggest ways,
just that networking, that word of mouth type of thing. I would probably give it as
probably more effective than the website.” (Participant # 8)
“From my actual experience and from people who have worked here and have gone
elsewhere, have been, like, oooh, like it really was better there [BOB], type of thing.
Or maybe BOB, being a consulting firm, isn't able to pay, you know, what I can get
from a big oil and gas firm but look at the other benefits that I have, you know,
kinda that work/life balance, it's a little more comfortable, it's a little more thought-

157
out atmosphere, that sort of thing. So I hear it from departed employees and, you
know, like I said, I hear it from [someone the participant knows well] who works at
one of our competitors, I hear it from her all the time, right? Like, what she has to
go through, and I'm scratching my head, going, wow, you have to do that, that's
tough, right? (Participant # 1)
Publicity from community engagement activities and events
“Some of the things that we do in the community. We were just involved in a
legacy project here. Like that, you know, getting local news exposure and things like
that really do promote you well. And also some of the high profile projects that
we're involved in. Really goes to a lot of exposure, too. So when people do apply,
they've already had a lot of exposure, whether they know it or not. And they
recognize the BOB logo.” (Participant # 9)
Multiple and repeated recognitions for being one of Canada’s best employers
Of the mediums above, the three that were most mentioned by 19 respondents as being used by
BOB to communicate and promote its employer brand to potential job applicants were company
website (14), interviews (14) and word-of-mouth from current and former employees (9).
Aside from job advertisements and specific recruitment materials, BOB appeared to have also
begun using broader organizational advertisements to simultaneously promote its corporate and
employer brand. Anecdotally, this move appears to have yielded positive effects in terms of
generating public awareness and recognition of the organization.
“We work on a site and you'll never or rarely see the BOB name on a construction site,
even though we work there, which is something that we're doing more now than we used
to. We didn't, our marketing people have helped us get in that minBEt. We used to be a
very niche company, technical experts that, you know, word of mouth would be good
enough for us. And over the last couple of years, we started putting our names out there a
bit more and branding ourselves a bit differently. Tends to be a big sign on the building,
you know? ……….A couple years ago, in the boom of things here in Alberta, our marketing
staff said, I could get your name on the billboard at the airport. And then some of our
senior people asked why would we want do that. And we did it and what we did was we
wanted to brand ourselves as a health and safety focused company, so we had some of
our people that took the pictures in the field and what we do and all that, with the PPE
[personal protective equipment] and everything, and then we had this big billboard at the
airport that was saying, we're honoured at BOB. And that was quite interesting to see,
like, I had people after that saying, I saw your billboard. I didn't know, so what do you
do? And asking questions. Or we see new people, they say, where do you work, I say

158
BOB Associates, and they say, oh, isn't there something at the airport? So they noticed,
but oh my God, it took us all our energy to be convincing people [at BOB] that it was a
good idea at the time to do that. Well we do now Globalfest, they should also see our logo
will be on all sorts of different things associated with that so we do a bit more of that. Still
not in a big way, like if you look at some of our competitors, I mean, you see their names
all over the city, you see their names all over the place, we're still nowhere on those
billboards.” (Participant # 3)
Internal communication and interactions
Organizational materials and website review as well as the managers interviews revealed the
following mediums used by BOB to communicate and promote its employer brand to existing
employees.
Orientation
“I've seen people come in to the company as a new employee and they get this
amazing package of, here's the benefits, here's the dental and medical and contact
this person and contact that person. You know, I've just recently seen the new
employee package, and it's amazing. From where we've been to that and also the
presentation that's put on by the human development team, saying you're a new
employee and here's your career path, type of thing, and welcome to the company,
we're a family and we want you to be a part of our family, type of thing” (Participant
# 1)
Internal advertisements
“We have digital signage. I don't know if you've seen then when you've walked
around the elevator lobby, video screens.” (Participant # 19)
o Messages include upcoming events, fast facts about the organization, the
organization’s values, key projects, etc.
Face-to-face meetings and workshops
o Learning sessions through BOB University, mentoring sessions, staff meetings,
etc.
Employee events and activities
o Such as the Weekend Attitude Adjustment Meetings, community service
projects, Globalfest, corporate challenges, etc.
Employee intranet

159
o The intranet allows BOB to post messages, facilitate discussions, and share
information (e.g. employee engagement survey results, internal reports, benefits
plan) with employees. It also allows employees to access organizational
materials, forms, and resources.
In addition to the mediums above, employees were also exposed to many of the same mediums
used by the organization to communicate and promote its employer to external parties. These
included the organization’s website, job advertisements, broader organizational advertisements,
news releases or magazine articles, publicity from community engagement activities, and repeated
recognitions for being one of Canada’s best employers.
Verifying the desirability of provisions offered
Aside from creating employer brand awareness, one key purpose of BOB’s effort to communicate
and interact with its potential and actual employees is to seek their input on the desirability and
value of the employment provisions offered to them by BOB.
Managers interviewed provided several methods on how they extract such information:
Specific Methods Identified Number
of Cases
Annual internal employee engagement survey (BOB uses Gallup Q12) as well as
other surveys 10
Annual performance review and goal setting sessions with each employee 6
Face-to-face bi-weekly orientation, meetings, and workshops 5
Informal feedback (through casual conversations, mentorship sessions, and
messages relayed by third parties) 4
Selection Interviews 4
Exit interviews 3
Online blogs 1
Career fairs and conferences 1
While BOB did not directly list down the employment benefits offered or asked existing or potential
employees to rate each employment benefit, managers indicated that they did ask potential actual
and potential job applicants (in selection interviews and career fairs) and new employees (in
orientation) why they chose to work for BOB as well as what they were looking for in terms of
benefits and overall employment expectations. As for existing employees, managers inquired
(through casual conversations or through meetings and goal setting sessions) as well as monitored
their interest and responses to employment benefits offered. Managers also sought feedback on
new and different ideas through methods identified above. Whenever an employee exits the

160
organization, an exit interview is conducted. The following statement by a research participant
reflected the types of information sought in the exit interview:
“Whenever there is a person leaving the company, we do an exit interview with that
person, to find out why they are leaving the company. Was it something we could have
done more to improve the quality of their work experience? To improve how we treat
people? Has everything been the way we promised? That kind of stuff.” (Participant # 18)
While all managers interviewed confirmed that different methods were being used to seek
employees’ feedback on the desirability of the employment benefits offered, six of the 19
managers also stressed that BOB had a set of core values and employment benefits that were dear
to the organization. Instead of trying to discover and respond to what might be desirable to
potential or existing employees, managers were more concerned about finding out whether
potential and existing employees would embrace what BOB was already offering and would in fact
thrive in the environment BOB has already built:
“I don't think it's as conscious as us saying, this is a brand we want to be, so let's go and
try to be that brand. We have core values and things that guide us and ownership
structure that lives and breathes in the company and that is who we are and that would be
our brand. It's maybe a different way of looking at it, but I've never sat in a room and had
a conversation around, with senior owners, saying, what's our brand? To our employees.
We talk about what kind of company do we want to be. What's our values? Where are we
going? What are the things that are important to us, and I think that's what we focus on.
So the brand, maybe, is more of a lagging indicator of those conversations, I guess.”
(Participant # 12)
“So it's the other way around. Not so much as saying, okay, we're trying to see if you like
what we offer, but more to say, this is what we offer, is that what you're looking for?
Here's our environment. This is our working environment. Do you feel that you would be
compatible with that working environment? Would you excel in that environment?”
(Participant # 17)
The key inference of the sentiments above was the notion that BOB was not interested in only
hiring capable employees. It was interested in hiring and retaining capable employees that shared
BOB’s values and were welcoming of the employment benefits that BOB was already offering:
“It’s really our role to make sure that we protect the BOB brand. We don't bring people in
that don't align with our values and our brand and our promises.” (Participant # 11)
“I can't speak for anybody else's, is the person we're interviewing a fit for our team? Do
they have the same values that we have as a group or as an office? And that's really big,

161
because we promote the team thing so much, it's a really big deciding factor when we
hire. Does this person fit? Are they going to promote the things that we promote?”
(Participant # 15)
“We don't create the environment that everyone wants to come and join us because we
have pool teams everywhere or foosball teams everywhere, you know, we create a
working condition that that type of individuals can flourish and fit into.” (Participant # 10)
Seeking and branding to the right candidates
Being a specialized environmental engineering and consulting organization, a large majority of
BOB’s existing positions, employees, and job applicants were those with specific engineering and
technical background. An interviewee shared her observation that while BOB was a well-known
employer, it was mainly so to job applicants from the engineering and related technical fields.
“You wouldn't know of BOB if you weren't in the field. When I did my master's degree, I
was looking at who are the top firms that I would like to work for. Well, BOB was at the
top because, I'm a [name of profession] by training, and I do [name of a professional
field]. If you look at, so, okay, who are the firms that you would really want to work for?
BOB was at the, like, one of the top five. So in the field and all that, I would talk to my
teacher at University and then he would say, oh, yeah, BOB is a good firm and good
reputation and all that.” (Participant # 3)
It was likely that there were more opportunities for an environmental engineering and consulting
organization like BOB to directly or indirectly promote itself as an employer of choice to students
and members in the engineering and related technical fields. The following respondent provided an
example of how such promotion would take place in an academic institution even when the
respondent was not a member of BOB’s recruitment team and was not specifically going to the
institution for the purpose of promoting BOB or recruiting candidates.
“I'm going to give a talk at [name] college in February regarding careers for people with a
forestry biology background, so I'll be selling BOB there.” (Participant # 15)
As a whole, there might be some evidence to support the earlier respondent’s claim that BOB was
not as well-known to those outside of the engineering and related technical fields. In Canada, BOB
had repeatedly made the prestigious Mediacorp Canada’s list of Canada’s Top 100 Employers and
the well-recognized Aon Hewitt’s list of 50 Best Employers in Canada. The data collected by both
competitions for evaluation were from the organization’s employees, leaders, and the Human
Resources Department. Data for both rankings was collected from individuals who were already
employed at the organizations. It was assumed that this population would be able to offer direct
observation and confirmation of their organization’s practices and provisions as well as of their own

162
personal experience with the organization. These surveys did not, however, offer any revelation on
their perception of the organization before they were employed by the organization.
BOB had never made the list of Randstad Award for the 50 Most Attractive Employers in Canada.
Randstad was a global staffing and human resource service firm that claims to be the second
largest human resource service provider in the world with 90% of the global human resource
services market32. The first Randstad Award was launched in Belgium in 2000 but in Canada, the
Award started in 2011 and is therefore much newer that the other two Awards. Unlike the other
two surveys, the Randstad survey gathered data from 7,000 members of the general public, some
of whom might be looking for employment while others might be existing employees of various
organizations, possibly including organizations that had been shortlisted for the Award. Referring to
a shortlist of 150 organizations in Canada with 1,000 or more employees (a group in which BOB
belongs), the survey asked respondents the key question, “Would you like to work for this
company?” Respondents were also asked for their opinion on the main factors that define an
employer’s attractiveness as well as the top five factors that are most important them personally.
The factors presented for consideration are: (1) Financial health, (2) Good training opportunities,
(3) Long-term job security, (4) Opportunities for career advancement, (5) Strong management, (6)
Interesting job content, (7) Pleasant and stimulating working environment, (8) Competitive salaries
and employee benefits, (9) A good work-life balance, and (10) Progressive policies concerning the
environment and society.
Randstad’s website very clearly associated its Most Attractive Employers Award with the practice of
employer branding. Randstad provided the following elaboration33 on employer brand and
branding:
An ‘employer brand’ is a complex concept based on various intangible factors, including
perception, image versus identity, and the ability to differentiate between them. In a
nutshell: An employer brand represents the image a company projects as a potential
employer. If you have a strong employer brand, then your company is considered a
distinctive place to work, with attractive brand values and career prospects. …..Employer
branding is a crucial tool for attracting and retaining the right kind of talent. It helps you
recruit highly-skilled and promising new employees and it enhances their loyalty by
increasing their identification with the company. It also raises an organization’s visibility in
the job market and makes it stand out from the competition.
The fact that BOB had not made this list in spite of its year-after-year repeat placements on two
well-respected best Canadian employers lists above as well as its many other international
recognitions for being a best employer begs the question of “Why has BOB not made this list?” Is it
32 Randstad website, accessed on June 12, 2013: htTP://www.randstad.com/about-us/company-information 33 Randstad website, accessed on June 12, 2013: htTP://www.randstad.com/award/what-is-the-randstad-award/the-importance-of-employer-branding

163
true that BOB’s reputation as a great employer is known mainly to those in the engineering and
related technical fields but not so much to the broader job seeking public? If so, what would be the
implication of this to BOB’s efforts to attract and recruit suitable candidates?
It was very possible that due its highly technical and specialized business nature, the average job
seeker would not be paying attention to such an organization, be it BOB or some other similar
organization. Around 80% of BOB’s workforce was skilled technical or engineering professionals.
Only 20% were categorized as ‘Administration’ (2012) and a noticeable number of these personnel,
while taking on administrative roles, could in fact be a skilled technical or engineering professional
by trade. As such, the percentage of jobs within BOB that could accommodate applicants with a
more general and transferable skill set was small. BOB’s workforce consisted of 90% technical or
engineering professionals. In this situation, the fact that it was not known to the broader have not
appeared to have a negative consequence on its ability to recruit and retain targeted employees.
It should be noted that none of the other four employers that have won a total combined
placement of 10 or more times on the Mediacorp’s and Aon Hewitt’s best employer listings have
ever been on the Randstad Award list. These are employers that have been confirmed year-after-
year by their employees as great employers, yet none of them made it to the Randstat list of most
attractive employers in Canada. Of the organizations that have made the Randstat Award list, only
27% have ever made the Mediacorp’s and Aon Hewitt’s lists of Canada’s Top/Best Employers. This
observation is critical as it raises questions on several fronts including the merit of such surveys in
confirming an organization’s employer branding success. This will be explored in the discussion
section of this Chapter.

164
Proposed Employer Branding Process Model
The rich data and detail analysis led to the development of the following proposed process model
for employer branding. In this proposed model, factors work inter-connectedly and in tandem to
continually engage, bind as well as develop employees in order that enhancement occurred not
only with employees’ work-specific performance but also with their overall capability.
Connectedness
and Belonging
Opportunities
and Growth
Personal Stake
and
Influence
Significance
and
Esteem
Inter-connected and Executed In Tandem
Personal
Sustainability
Bro
ad
en
ing
an
d E
sca
lati
on
of
En
ga
ge
me
nt,
De
ve
lop
me
nt,
an
d B
ind
ing
Eff
ort
s
Sustained High Level of Performance and Capability
Intensified Employee Engagement, Development, and Binding
Continually Enhanced Mediators of Performance
Stakeholder Awareness Building,
Selection, and Consultation
Branding Control
Brand Championship

165
Summary of Results and Analysis of Performance
Enhancement Factors of Employer Branding
When asked if BOB had linked its employer branding efforts to employee performance and if so,
how so, respondents offer the following insight.
Thirteen (13) of the 19 respondents either answered a direct yes to the question above and
provided examples of how BOB links its employer branding efforts to employee performance or did
not answer a direct yes but provided examples of such. The remaining number of respondents had
indicated that they were not fully certain of whether BOB has linked its employer branding efforts
to employee performance. However, from the analysis provided, one could see that BOB had
clearly incorporated the element of employee performance as well as performance mediator
enhancement in almost every aspect of its efforts to develop and fulfil its employer brand
promises, as summarized below:
Ensuring that employees’ basic employment sustainability needs were met so that they
need not worry about these life essentials and instead could focus on other employment
and development priorities.
Expanding or improving employees’ work-related knowledge and skills through BOB
University learning sessions, on-the-job coaching and learning from top industry experts,
mentoring program, cross-training and inter-departmental project opportunities, and
international exchange opportunities.
It is predicted that expanded knowledge and skills would increase an employee’s ability to
perform their existing tasks better or perform more tasks and take on additional
responsibilities to those he/she was originally hired to do. Strengthening and increasing the
depth of existing knowledge and skills is predicted to enable an employee to be more
efficient, creative, and/or effective in doing their work. Research has shown that
broadening and deepening of work knowledge could improve employees’ and ultimately
also organizations’ performance (Arthur, Bennett, Edens, & Bell, 2003; Chiaburu and
Tekleab, 2005; Sultana, Irum, Ahmed, Mehmood, 2012). In addition, there is empirical
evidence to suggest that cross-training and completing diverse tasks increase employee
motivation and satisfaction (Gawali, 2009). Enhanced employee motivation and satisfaction
in turn has been found to improve employee and organizational performance.
Motivating stronger employee effort and performance yield through the following rewards
and recognition:
• More organizational shares

166
“If you are a high performer, you have more opportunity to buy shares than if
you're not a high performer. But any more than a hundred shares that you
want to purchase in a year, you've got to be a high performer and they have
to be offered to you because you're a high performer...We evaluate someone's
performance based on what we've seen over the last twelve months.”
(Participant # 10)
• Advancement into the Principals and Associates structure
“It's a very obvious one in, like you do want to achieve an associate status,
well, you'd better be working hard so that people offer you more shares and
you work your way up.” (Participant # 4)
• Peer recognition for employees’ mutual care and support of one another. This is
indicative of rewarding out-of-role or organizational citizenship performance.
“We have a reward and recognition program where a colleague can go and,
it's recognized that you're our colleague so, ROC program, we call it, so if one
of your colleagues does something to help you and you're really happy and
grateful and all that, you can go to HD [Human Development Office] and get a
card to say thank you for doing this for me and all that. And either you just
get the card or a little gift certificate for coffee at Starbuck's or whatever it is,
and then you give that to your colleague to say thank you and the company
pays for that.” (Participant # 3)
• Mentor Appreciation Program to recognize the efforts and value of the
organization’s mentors
“We have the mentor appreciation program so that they can also come and
select a gift from human development at that point to recognize their mentor…
it's big.” (Participant # 11)
Monitoring and verifying the delivery of promised employer values within employees’
performance - through observation, feedback as well as formal balance scorecard and 360
employee performance reviews. In this case, it appears that the organization makes effort
to verify whether managers and leaders are demonstrating the corporate values and
virtues as well as fostering the work environment that are reflected in their employer
brand. This forms part of their performance expectations.

167
“An example would be senior persons should be sharing their knowledge with people.
And they'd actually be rated on that. Either they're doing it or they're not or they're
doing it well, that type of thing. ” (Participant # 1)
“And I would say we do so through our feedback process, our 360 reviews. When we
do our reviews with individuals it can be part of a 360 review but it can also be
separate, we are specifically talking about some of our key core values, such as
integrity and innovation and sustainability. We're always referring back to those core
values.” (Participant # 17)
Strengthening employees’ sense of commitment and accountability to their work,
colleagues, shared values, chosen social and environmental causes, and ultimately to BOB
as a whole through BOB’s promoted and demonstrated corporate values as well as its
multiple employee and community engagement programs and activities. It is predicted that
when an employee shares the same values and priorities as his/her organization, he/she
would be more committed and accountable to these values, priorities, and the organization
as a whole. Increased commitment and accountability in turn is predicted to improve
employee productivity and performance.
“Where I've seen it is people who are involved in community projects, when they start
doing things like, you know, using the BOB system to apply for grants for that project,
then they seem to get really excited about it and they'll, we've had a couple people in
our group put on a lunch-and-learn. You know, people bring in their lunch and they
talk about the charity or the, not necessarily charity, but the organization that they're
involved with and what it means and supporting it and I think realizing that BOB will
help support their interests and community involvement, they really start to pick it up
and to really become more invested in BOB because they realize BOB's more invested
in them.” (Participant # 16)
• Strengthening employees’ sense of engagement with the organization, its priorities,
activities, and progress through active consultation with and participation by employees in
decision making. Employee engagement has been found to be a major mediator of
employee performance (Markos and Sridevi, 2010) and by strengthening employee
engagement, employees’ performance were very likely also affected.
Interview responses provided clearly indicated that the fulfillment of the organization’s employer
brand promises would be difficult without the facilitation of organizational factors such as brand
championship and support from the organization’s leaders, effective communication, and a host of
relevant controls.

168
BOB’s efforts to incorporate employee performance enhancement in its employer branding process
occurred in multiple ways, some of which were directly related to increasing employees’ work
abilities and performance while others are more indirect as they relate to the strengthening of
employee engagement, the key mediator of employee performance.
Quantitative results presented along with the qualitative data in this chapter support that as whole,
the organization’s efforts to deliver on its employer brand promises had in fact positively influenced
employee performance, though mainly on organizational citizenship performance and to a
noticeably lesser degree on task performance.

169
Acknowledging the Challenge of Linking Process to Outcome
Pettigrew (2012) suggests in his acclaimed article, Context and action in the transformation of the
firm: A reprise, that the biggest challenges and pay-offs come from our attempt to “carry out
process and outcome studies where there is an explicit attempt being made to explain the
determinants of outcome variation in context and process terms” (pg. 1309). He called this a
context–process–outcome study. Pettigrew acknowledges the difficulty of producing concrete and
convincing evidence to establish a causal link between the context, process, and outcome. While
this might be the case, the mixing of inductive and deductive work to produce theories and fulfill
the objectives of research that demand such investigations have been accepted by major process
scholars (e.g. Langley and Eisenhardt in Pettigrew, 2012).
For this specific doctoral study, the researcher sees great value in complementing the quantitative
results of the study with some viable interpretations and explanations of how and why those
results might have come about. Ultimately, to claim that the fulfillment of employer brand promises
has a positive or no influence on employee performance but not be able to offer any insight as to
how or why this might have happened would not be very useful in a theoretical or practical sense.
Recognizing the great difficulty in proving causal link, the researcher acknowledges the
presumptive nature of the reported process findings.
Educational process and system researcher, Dr. Don R. Morris (2005, pg. 3), sees such
presumptive nature as a part of reporting process findings:
In the process approach one observes an effect and identifies the suspected cause(s), but
does not have the option of manipulating the causal variable(s), and/or does not have
access to comparative data. Consequently, one draws instead on theory and/or experience
to describe the mechanism by which the effect is thought to be caused, emphasizing the
causal process.
In this case study, the qualitative analysis had identified the activities and events that occurred in
the employer branding-employee performance linking process as well as the interplay that existed
between the different entities, factors, and characters in the linking process. Such revelation
combined with findings from other relevant research would enable one to make educated
speculations of the influence that BOB’s strategies would likely have had on its employees’
performance and how or why that might be the case. However, the information gained could not
offer clear confirmation and/or definitive evidence of the actual influence or lack thereof that these
series of activities and events and/or entity interplay would have had on employee performance.

170
CHAPTER 6: QUANTITATIVE RESULTS AND ANALYSIS – DETERMINING THE RELATIONSHIP BETWEEN EMPLOYER BRAND PROMISE FULFILLMENT AND EMPLOYEE PERFORMANCE
This quantitative investigation was intended to determine the relationship between employer
branding and employee job performance, more specifically:
1. Assessing the direction and strength of relationship between employees’ perceived level of
employer brand promise expectation fulfilment by their employer and their reported level
of organizational citizenship and task performances.
2. Verifying the presence and sizes of influence that employees’ perceived fulfilment of their
employer brand promise expectations by the employer would have on their reported level
of organizational citizenship and task performances.
3. Verifying the presence and sizes of influence that employees’ perception of the greatness
of their workplace, the desirability and distinctness of their work experience, and their
intentions to leave, would have on their reported level of organizational citizenship and
task performances
In order to do so, specific hypotheses, as identified in the quantitative data analysis section of the
Methodology chapter and again in this chapter, were tested.
Prior to the testing of specific hypotheses, the quantitative investigation started off by examining
the employees’ overall perception of how well their organization had fulfilled their expectation for
each of the 20 employer brand promises identified in Chapter 5.
Following that, key hypotheses were tested:
Hypotheses 1a and b:
Employees’ reported level of a. overall organizational citizenship performance (OCP) and b.
overall task performance is positively co-related with their perceived level of overall employer
brand promise (EBP) expectation fulfilment by their employer.
Hypotheses 2a to j:
Employees who perceive a high level of expectation fulfilment by their employer of the
promises in the following employment benefit content factor clusters will report a higher level
of a/c/e/g/i. organizational citizenship performance and b/d/f/h/j. task performance than
employees who either perceive a low level of expectation fulfilment by their employer in this
factor cluster or who have no expectation for the promises in this factor cluster:
vi. Factor of personal sustainability

171
vii. Factor of connectedness and belonging
viii. Factor of opportunities and growth
ix. Factor of personal stake and influence
x. Factor of significance and esteem
Hypotheses 2k and l:
As a whole, employees who perceive a high level of employer brand promise expectation
fulfilment by their employer will report a higher level of k. organizational citizenship
performance and l. task performance than employees who have no expectation for the
employer brand promises or who perceive a low level of employer brand promise expectation
fulfilment by their employer.
Hypothesis 3:
Employees who perceive a high level of employer brand promise expectation fulfilment by their
employer will concur more strongly with each four of the following notions when compared to
employees who have no expectation for the employer brand promises or who perceive a low
level of employer brand promise expectation fulfilment by their employer:
e. Their employment experience at the organization was both desirable and distinctive
(DDEE).
f. Their organization is a great place to work (GPTW).
g. They would be very happy to spend the rest of their career with the organization
(HSCO).
h. They DO NOT frequently think of leaving the employment at the organization (NFTL).
Hypotheses 4a and b:
Employees who concur (CC) with each of the four notions below will demonstrate a higher
level of a. organizational citizenship performance (OCP) and b. task performance when
compared to employees who do not concur (DNC) with the notions:
e. Their employment experience at the organization was both desirable and
distinctive (DDEE).
f. Their organization is a great place to work (GPTW).
g. They would be very happy to spend the rest of their career with the organization
(HSCO).
h. They DO NOT frequently think of leaving the employment at the organization
(NFTL).
As mentioned in Methodology chapter, reliability analyses were conducted on the employer brand
promise scales, organizational citizenship performance scales, and task performance scales used
for the quantitative investigation. The results of these analyses were used in order to determine
the most appropriate method of incorporating these measures into the later analyses. Specifically,
a reliability of 0.70 was used as the standard to indicate acceptable reliability.

172
Reliability analysis performed for EBP scales revealed the Cronbach's alpha equal 0.907 indicating a
high level of internal consistency for our scale within our sample. Reliability analysis of OCP scales
showed the Cronbach's alpha is 0.862, which indicates a high level of internal consistency for our
scale with this specific sample. Reliability analysis performed for TPs scales revealed the
Cronbach's alpha is 0.781, which indicates an adequate level of internal consistency for our scale
with this specific sample.
Pearson’s correlation coefficient was used to measure the strength of relationship as well as the
size of effect between employees’ perceived level of employer brand promise expectation fulfilment
by their employer and their reported level of organizational citizenship and task performances.
Cohen’s (1988) commonly-referenced guide below (in Field 2009, pg. 57) was used to gauge these
relational strengths and effect sizes:
r = 0: Zero correlation/effect
r = .10: Small or Weak correlation /effect (range would be 0 < r < .30)
r = .30: Medium or Moderate correlation/effect (range would be .30 ≤ r < .50)
r = .50: Large correlation/effect (range would be .50 ≤ r < 1.0)
r = 1: Perfect correlation/effect

173
Examining the extent of employer brand promise fulfillment
In the employee survey, respondents were asked rate, using the Likert-response scale, how well
their organization had fulfilled their expectation for each of the 20 employer brand promises
identified. Chi-square analyses was done and Table C5-5 in Appendix 9 as well as the following
Figure C6-a provide a summary of the distributions out of 299 respondents who answered this
question.
Figure C6-a. Distribution of employee responses for employer brand promise
expectation fulfillment
If one considers the majority as being 50% + 1, then the results indicated the majority of 299
respondents had acknowledged that their expectations in all but one of the 20 employment
0% 10% 20% 30% 40% 50% 60% 70% 80% 90% 100%
Opportunities for international assignments or employeeexchanges
Organizational support for risk-taking and innovation
Fairly flat organizational structure with low hierarchy
Peer nominated Principals and Associates System
A work environment that allows for worklife balance
Competitive compensation
Comprehensive employee learning and developmentprograms
Flexible work schedule or telecommuting option
Opportunity for career growth
Strong organizational commitment to social responsibility andcommunity engagement
Opportunities to take on varied/diverse projects or workactivities
Organizational support for team work and/or collaborationamong colleagues
An organization that values employee input
Organizational dedication to technical excellence
Opportunity to be a shareholder in a 100% employee-ownedstructure
A supportive and caring work culture
Provision of challenging work
Firm organizational commitment to its pledge of honest, fair,and respectful treatment of employees
Be part of a successful and highly respected organization
Strong organizational commitment to employee health andsafety
Perceived Level of employer brand promise Fulfillment
I have no expectation Has not fulfilled my expectation at all
Has partially but not adequately fulfilled my expectation has adequately fulfilled my expectation
Has more than adequately fulfilled my expectation

174
benefits promised had been either adequately or more than adequately fulfilled by BOB. The
following Figure C6-b offers a visual view of the percentage of employee survey respondents who
expressed that their expectation for each of the employer brand promise identified had been either
adequately or more than adequately fulfilled.
Figure C6-b. Distribution of response 3 (adequately fulfilled) and 4 (more than
adequately fulfilled) for employer brand promise expectation fulfillment
The results also showed a strong proportion of the respondents whose expectation had not just
been adequately fulfilled but had actually been more than adequately fulfilled. Some customer
satisfaction literature suggests that those who give the highest mark have very strong and true
loyalty to the organization and with that comes repeat patronage, willingness to try new products
that the organization introduces, positive word of mouth, referrals, and other acts of loyalty which
would have direct impact on organization’s bottom line results. Should such indication be
transferred to employee loyalty and its impact on overall organizational performance, this
38%
53%
55%
55%
56%
30%
52%
56%
55%
53%
55%
46%
37%
44%
50%
43%
37%
44%
44%
29%
53%
35%
28%
28%
26%
50%
27%
21%
22%
22%
20%
27%
32%
21%
13%
16%
21%
11%
8%
17%
0% 10% 20% 30% 40% 50% 60% 70% 80% 90%100%
Strong organizational commitment to employee health…
Be part of a successful and highly respected…
Firm organizational commitment to its pledge of…
Provision of challenging work
A supportive and caring work culture
Opportunity to be a shareholder in a 100% employee-…
Organizational dedication to technical excellence
An organization that values employee input
Organizational support for team work and/or…
Opportunities to take on varied/diverse projects or…
Strong organizational commitment to social…
Opportunity for career growth
Flexible work schedule or telecommuting option
Comprehensive employee learning and development…
Competitive compensation
A work environment that allows for worklife balance
Peer nominated Principals and Associates System
Fairly flat organizational structure with low hierarchy
Organizational support for risk-taking and innovation
Opportunities for international assignments or…
Employee Survey Respondents Who Answered 3 or 4
EBP Expectations Adequately Fulfilled EBP Expectations More Than Adequately Fulfilled

175
organization would have a significant portion of workforce that would be exceptionally loyal to the
organization.
While the overall acknowledgements from respondents indicated that BOB had adequately or more
than adequately fulfilled employees’ expectations for all but one of its identified employer brand
promises, the results, as illustrated by Figure C6-c, also showed a reasonably high percentage of
responses from employees who indicated that their expectations for certain employer brand
promises had been either inadequately or not at all fulfilled or who had no expectation at all for the
items, particularly the following five employer brand promises, each with 40% or share of such
responses:
Opportunities for international assignments or employee exchanges
Organizational support for risk-taking and innovation
Fairly flat organizational structure with low hierarchy
Peer nominated Principals and Associates System
A work environment that allows for work-life balance

176
Figure C6-c. Distribution of response 0 (no expectation), 1 (not at all fulfilled), and 2
(inadequately fulfilled) for employer brand promise expectation fulfillment
Employer brand promises with large percentages, such as 40% of more, of such responses warrant
attention. In addition, five out of 20 employment benefits promised is a large number. That was ¼
of promised benefits where a large percentage of employees felt were not at all or not adequately
fulfilled.
0.00% 10.00% 20.00% 30.00% 40.00% 50.00% 60.00%
Strong organizational commitment to employee healthand safety
Be part of a successful and highly respectedorganization
Firm organizational commitment to its pledge ofhonest, fair, and respectful treatment of employees
Provision of challenging work
A supportive and caring work culture
Opportunity to be a shareholder in a 100% employee-owned structure
Organizational dedication to technical excellence
Organizational support for team work and/orcollaboration among colleagues
An organization that values employee input
Opportunities to take on varied/diverse projects orwork activities
Strong organizational commitment to socialresposibility and community engagement
Opportunity for career growth
Flexible work schedule or telecommuting option
Comprehensive employee learning and developmentprograms
Competitive compensation
A work environment that allows for worklife balance
Peer nominated Principals and Associates System
Fairly flat organizational structure with low hierarchy
Organizational support for risk-taking and innovation
Opportunities for international assignments oremployee exchanges
Employee Survey Respondents Who Answered 0, 1, or 2
No Expectation Not at all fulfilled Not adequately fulfilled

177
Each employer differs greatly not only in terms of their employment offerings but also in terms of
various aspects that might affect the successful fulfillment or receipt of their employment offerings,
such organizational structure and processes, culture, demographics of core workforce, resources,
and more. As such, the specific results above might not be transferable or significance beyond the
organization itself. The organization needs to examine why such high propositions of its employees
were feeling that their expectations had either not at all not been adequately fulfilled for the items
above.
Difference in perception of employer brand promise fulfilment among
different classes of employees
While the overall employer brand promise expectation fulfilment results is helpful in offering a
general insight into the organization’s success in fulfilling its employer brand promises, there is a
need to dig deeper to determine whether there is a difference in perception between those who
design, develop, and implement the employer branding strategies versus those who mainly receive
and experience them but are not actively involved in designing, developing, and implementing the
organization’s employer branding strategies.
Employees could be divided into four classes:
Purely non-management employees (that were neither Principals nor Associates)
Purely managers (that were neither Principals nor Associates)
Principals and Associates, which could be divided into two sub-classes
o Principals and Associates that were managers
o Principals and Associates that were non-management employees
The number of survey respondents who fully answered the employer brand promise expectation
fulfilment question was 299, with 261 being purely non-management employees, 30 being purely
managers, and 38 being Principals and Associates. Of the 38 Principals and Associates, 22 were
non-management employees and only 16 were managers.
The qualitative results have revealed that the design and development of the organization’s
employer branding strategies are led by senior leaders, who would be included in Group 1, and
executed by managers, who might be included in Group 1 or 3.
Table C5-6 in Appendix 10 presents the results from survey respondents who have acknowledged
that their expectation of each of the employer brand promise has been either adequately (Answer
# 3) or more than adequately (Answer # 4) fulfilled by BOB.

178
Results showed that there were seven out of the 20 promised employment benefits where 100%
of respondents, who held the both the roles of a manager as well as a Principal or an Associate,
acknowledged that their expectations had been either adequately or more than adequately fulfilled
by BOB. Respondents who were Principals or Associates but not managers showed the same
results for two of the 20 employer brand promises. However, there were no employer brand
promises among the 20 where 100% of purely non-management employees or purely managers
acknowledged that their expectations had been either adequately or more than adequately fulfilled
by BOB.
The trend noticeably reversed as the percentage of employees who acknowledged that their
expectations of the employer brand promises have been either adequately or more than
adequately fulfilled by BOB was lowered to 59% or below. In this case, respondents who were
Principals or Associates who were managers or otherwise identified a combined total of only two
employer brand promises among 20 for which 59% or less of its members had acknowledged that
their expectations had been either adequately or more than adequately fulfilled by BOB while
purely non-management employees or purely managers groups had identified a combined total of
six employer brand promises (there is overlap of promises identified) among 20 for which 59% or
less of its members had acknowledged that their expectations had been either adequately or more
than adequately fulfilled by BOB.
The results shown in figure C6-d below offers an indication of the disparity in the percentage of
respondents who acknowledged that each of their employer brand promises expectations had been
either adequately or more than adequately fulfilled by BOB was most noticeable between
employees who were held both roles of Principals or Associates and managers and those who were
purely non-management employees. Disparity in percentages for 18 of the 20 promised
employment benefits range from 9.96% to 46.75%, with 10 of them being over 20%. The mean of
the disparity in percentages for all 20 employer brand promises is 18.08%. It is noted, however,
that statistical significant (p≤0.05) results were found for only six of the twenty employer brand
promises: opportunity for career growth, peer nominated Principals and Associates system,
competitive compensation, fairly flat organizational structure with low hierarchy, opportunities for
international assignments or employee exchanges, and organizational support for risk-taking and
innovation.

179
Figure C6-d. Disparity in the percentage of respondents who acknowledged that each
of their employer brand promises expectations had been either adequately or more
than adequately fulfilled
While it was not surprising that 100% of respondents held both roles of Principals or Associates
and managers and 95.45% of respondents were Principals or Associates but not managers
acknowledged that their expectation of the employer brand promise of Peer nominated Principals
and Associates System had been either adequately or more than adequately fulfilled, it was
surprising that at 43.33%, the lowest percentage of respondent acknowledgement for the
fulfillment of this promise actually came from purely managers instead of purely non-managers,
who registered at 53.25%. A total of 27% of purely managers had indicated that their expectation
for this employer brand promise had been either not at all or not adequately fulfilled while only
19% of purely non-management employees had indicated the same. Both groups showed close to
a 30% ratio of individuals in that had no expectation for this provision. One could assume that a
higher proportion of purely managers were interested, felt ready, and closer to the possibility of
40.00%
50.00%
60.00%
70.00%
80.00%
90.00%
100.00%
Provision of challengingwork Strong organizational
commitment toemployee health and…Be part of a successful
and highly respectedorganization
Opportunity for careergrowth
Peer nominatedPrincipals and
Associates System
Opportunity to be ashareholder in a 100%
employee-owned…
A supportive and caringwork culture
Firm organizationalcommitment to its
pledge of honest, fair,…Opportunities to take onvaried/diverse projects
or work activitiesAn organization thatvalues employee input
Strong organizationalcommitment to social
resposibility and…
Competitivecompensation
Organizational supportfor team work and/orcollaboration among…
Comprehensiveemployee learning anddevelopment programs
Fairly flat organizationalstructure with low
hierarchy
Organizationaldedication to technical
excellence
Flexible work scheduleor telecommuting option
A work environmentthat allows for worklife
balance
Opportunities forinternational
assignments or…
Organizational supportfor risk-taking and
innovation
Principals or Associates who were Managers"
Principals or Associates who were Non-management Personnel
Purely Managers
Purely Non-management Employees

180
becoming an Associate but had either not been nominated as one or had failed in the selection
process, thus creating a sense of unfulfilled expectation.
As a whole, it appears that noticeably more promised employment benefits have been identified by
a higher percentage of Principals or Associates respondents as having been either adequately or
more than adequately delivered by BOB when compared to the percentage of non-Principals or
Associates respondents, even if they were managers. This result might not be that surprising
considering that many expectations would have had to be already fulfilled in order for employees
to reach the status of Principals or Associates. As well, these individuals had much more freedom
as well as control within the organization to decide on and/or direct the activities of the
organization, shape the culture and policies of the organization, or choose the project they want to
pursue. Purely non-management employees or even purely managers would not have such broad
combination and/or degree of autonomy, power, and control to affect their work environment or
work life. Ultimately, Principals and Associates also had greater stakes and investment in the
organization and would therefore be advocating for and establishing values and provisions for
which already met their expectations and assumptions as being essential to the organization’s
success

181
Examining the correlation between employees’ perceived
level of employer brand promise fulfilment and their level of
organizational citizenship and task performances
Hypotheses tested in this section were:
H1a: Employees’ reported level of overall organizational citizenship performance (OCP) is
positively co-related with their perceived level of overall employer brand promise (EBP)
expectation fulfilment by their employer.
H1b: Employees’ reported level of overall task performance (TP) is positively co-related with their
perceived level of overall employer brand promise (EBP) expectation fulfilment by their
employer.
In order to test hypotheses H1a and H1b, Pearson’s correlation was used and two separate
correlation coefficients were determined, one between the fulfillment of overall employer brand
promises and the reported level of overall organizational citizenship performance as well as
another between the fulfillment of overall employer brand promises and the reported level of
overall task performance.
First, the correlation between overall employer brand promise fulfilment and overall organizational
citizenship performance was found to be positive, moderate in strength, and achieved high
statistical significance, r = 0.358, p < 0.001. Then, the correlation between overall employer brand
promise fulfilment and overall task performance was found to be positive, weak in strength, and
achieved statistical significance, r = 0.155, p < 0.001. Both of these results indicate that
employees’ overall reported level of organizational citizenship performance as well as task
performance is positively correlated with their perceived level of overall fulfillment employer brand
promises by their employer. This supports hypotheses 1a and 1b.
Model H1: Results indicated positive correlations between employees’ perceived level
of employer brand promise expectation fulfilment and their organizational as well as
task performances
Employees’
Perceived Level of
Employer Brand
Promise
Expectation
Fulfilment
Organizational
Citizenship
Performance
Task Performance

182
In order to ensure that linearity was present, a scatter plot was constructed for visualization of
these measures. First, Figure H1-a presents the scatter-plot between the measures of overall
employer brand promise fulfilment and overall organizational citizenship performance. A positive,
linear association was indicated. Figure H1-b was constructed to show a scatter plot of the
relationship between overall employer brand promise fulfilment and overall task performance. The
scatter-plot also indicated that a linear, positive association was present between these two
measures.
Figure H1-a. Scatter Plot of Overall employer brand promise (EBP) expectation
fulfillment vs. Overall organizational citizenship performance (OCP) Values

183
Figure H1-b. Scatter Plot of Overall employer brand promise (EBP) expectation
fulfillment vs. Overall task performance (TP) Values
The following Figure H1-c offers a good visual comparison of the relationship between employer
brand promise fulfilment and the two types of performances, organizational citizenship
performance and task performance. The super-imposed scatter-plots show a steeper linear,
positive association between the measures of employer brand promise fulfilment and
organizational citizenship performance. The conclusion was that employees’ level of organizational
citizenship performance was more strongly co-related than their level of task performance - with
their perceived level of fulfillment of employer brand promises by their employer.

184
Figure H1-c. Overlapping Scatter-Plots of Overall employer brand promise (EBP)
expectation fulfillment vs. Overall organizational citizenship performance (OCP -
Green) and Overall task performance (TP – Orange) Values
While the correlations were of weak to moderate strength, results did lead to the conclusion that
as employees’ perceived level of employer brand promise fulfilment increases, their level of
organizational citizenship performance as well as task performance also increases.
It should be noted that while the results did suggest that employees’ performance was positively
co-related to their perception of the employer’s fulfilment of its employer brand promises, it did not
indicate whether the fulfilment of employer brand promises would actually influence or affect
employees’ performance. As well, the tests for hypotheses 1a and 1b did not offer any insight into
the differences in degree of influence between the fulfillment of one employer brand promise and
another. The answers to these questions were revealed in the testing of subsequent hypotheses.

185
Examining the influence that employees’ perceived level of
employer brand promise expectation fulfilment has on their
level of organizational citizenship and task performances
As indicated in Chapter 4: Main Research Project Methodology of this dissertation, a quasi-
experiment was set up to examine if employees’ perceived fulfilment of their employer brand
promise expectations by their employer does in fact have an effect or influence on their
organizational citizenship and task performances. In this experiment, employees who responded to
the research survey were divided into groups for each analysis, based solely on the reported
ratings of their perceived level of fulfilment for the employer brand promises being examined.
The investigation explored the different degrees of influence on performance that might exist in
response to employees’ perceived fulfilment of each employment benefit content factor cluster that
was outlined in Chapter 5. Organizational citizenship performance results as well as the task
performance results of two independent variable employee groups were examined. The groups
were:
Group HF: High Fulfilment - Employees who perceived that their employer brand
promise expectations as having been adequately or more than
adequately fulfilled by their employer.
Group LF/NE: Low Fulfilment or No Expectation – This is a group that combines
employees who perceived that their employer brand promise
expectations as having been inadequately or not at all fulfilled and
employees who had no expectations for that the investigated employer
brand promises.
T-test was used to examine the performance mean scores of the two groups in order to determine
if employees who perceived that their expectations for the employment benefits in each factor
cluster being adequately or more than adequately fulfilled did in fact demonstrate higher level of
organizational citizenship performance or task performance when compared to employees who did
not have expectations for these employment benefits or whose expectations were inadequately or
not at all fulfilled. The independent-samples t-tests conducted on these data also examined
whether statistically significant differences in these measures were present on the basis of low
versus high employer brand promise fulfilment scores. This was followed by the use of Pearson’s
correlations to determine the size of effect between the two groups.

186
The influence of employees’ perceived fulfilment of employment benefit
content factor clusters on their organizational citizenship and task
performances
Table C5-3 in Appendix 7 offers a summary of the t-test results for this section of the dissertation
while Table C5-4 in Appendix 8 offers a summary of the Pearson’s correlation results for this
section of the dissertation.
Influence of the factor of personal sustainability on employee performance
Hypotheses tested in this section were:
H2a: Employees who perceive a high level of expectation fulfilment by their employer of the
promises in the Personal Sustainability factor cluster will report a higher level of
organizational citizenship performance than employees who either perceive a low level of
expectation fulfilment by their employer in this factor cluster or who have no expectation for
the promises in this factor cluster.
H2b: Employees who perceive a high level of expectation fulfilment by their employer of the
promises in the Personal Sustainability factor cluster will report a higher level of task
performance than employees who either perceive a low level of expectation fulfilment by
their employer in this factor cluster or who have no expectation for the promises in this
factor cluster.
Factor Employment Benefits
Personal
Sustainability
A work environment that supports work-life balance
Competitive compensation and benefits
Organizational commitment to employee health and safety
Flexible work schedule or telecommuting option
Organizational commitment to treat employees with honesty, fairness, and
respect
T-test results supported both hypotheses 2a and 2b through the indication of influence of the
factor of Personal Sustainability on employees’ organizational citizenship performance as well as
task performance. It showed that employees whose expectations of the employer brand promises
within this factor cluster were adequately or more than adequately fulfilled by the employer
reported a higher organizational citizenship performance mean score as well as a higher task
performance mean score, when compared to employees who had no expectation of the employer
brand promises in this cluster or whose expectations were inadequately or not at all fulfilled (for
OCP, 4.21±0.85 vs. 3.96±0.82, p = 0.013 and for TP, 5.33±0.58 vs. 5.18±0.63, p = 0.047).

187
Using Pearson’s correlation coefficient, the size of influence for the adequate or more than
adequate fulfilment of the employment promises in the factor of Personal Sustainability on
employees’ organizational citizenship performance was found to be small (r= 0.196, p < 0.01),
accounting for only 3.84% of the total variance. The size of influence of this factor on task
performance was also found to be small (r= 0.174, p < 0.01), accounting for only 3.03% of the
total variance.
These results from the analysis of this factor cluster inferred that employees’ perceived adequate
or more than adequate fulfilment of the employment promises within the Personal Sustainability
factor had a positive and statistically significant influence, albeit small, on their overall
organizational citizenship performance as well as overall task performance.
Figure H2-a. Comparisons of the OCP and TP mean scores between groups within
Personal Sustainability factor cluster.
Influence of the factor of Connectedness and Belonging on employee performance
Hypotheses tested in this section were:
H2c: Employees who perceive a high level of expectation fulfilment by their employer of the
promises in the Connectedness and Belonging factor cluster will report a higher level of
organizational citizenship performance than employees who either perceive a low level of

188
expectation fulfilment by their employer in this factor cluster or who have no expectation for
the promises in this factor cluster.
H2d: Employees who perceive a high level of expectation fulfilment by their employer of the
promises in the Connectedness and Belonging factor cluster will report a higher level of task
performance than employees who either perceive a low level of expectation fulfilment by
their employer in this factor cluster or who have no expectation for the promises in this
factor cluster.
Factors Employment Benefits
Connectedness
and Belonging
Organizational support for team work and/or collaboration among colleagues
A supportive and caring work culture
T-test results showed employees whose expectations of the employer brand promises within this
factor cluster were adequately or more than adequately fulfilled by the employer reported a higher
organizational citizenship performance mean score as well as a higher task performance mean
score, when compared to employees who had no expectation of the employer brand promises in
this cluster or whose expectations were inadequately or not at all fulfilled but the results were not
found to be statistically significant at the level of p < 0.05 (for OCP, 4.17±0.88 vs. 3.96±0.73, p =
0.059 and for TP, 5.29±0.61 vs. 5.22±0.58, p = 0.397). As such, the results did not support
hypotheses 2c and 2d.
While the lack of statistical significance was highly evident in the result of the mean score
difference in task performance, the same could not be said in the result of the mean score
difference in organizational citizenship performance. With a slightly larger sample, the result of the
difference in the mean scores between the two groups for organizational citizenship performance
could possibly have been statistically significant to the level of p ≤ 0.05. With p = 0.059 being very
close to p = 0.05, one could argue that the result was not statistically significant from the standard
p ≤ 0.05 reporting perspective, however, in reality, the effect could be similar, at least to that of p
= 0.05.
Pearson’s results indicated the existence of a positive, small but statistically significant correlation
between employees’ perceived level of fulfilment of the employment promises within the factor of
Connectedness and Belonging and employees’ organizational citizenship performance (r= 0.212, p
< 0.001) as well as task performance (r= 0.149, p < 0.05).
These results from the analysis of this factor cluster inferred that while positive correlation exists
between employees’ perceived level of fulfilment of the employment promises within the
Connectedness and Belonging and their organizational citizenship as well as task performances,
actual influence of the fulfilment of the employment promises within the Connectedness and

189
Belonging on employees’ organizational citizenship or task performance could not be confidently
established.
Influence of the factor of Opportunities and Growth on employee performance
Hypotheses tested in this section were:
H2e: Employees who perceive a high level of expectation fulfilment by their employer of the
promises in the Opportunities and Growth factor cluster will report a higher level of
organizational citizenship performance than employees who either perceive a low level of
expectation fulfilment by their employer in this factor cluster or who have no expectation for
the promises in this factor cluster.
H2f: Employees who perceive a high level of expectation fulfilment by their employer of the
promises in the Opportunities and Growth factor cluster will report a higher level of task
performance than employees who either perceive a low level of expectation fulfilment by
their employer in this factor cluster or who have no expectation for the promises in this
factor cluster.
Factor Employment Benefits
Opportunities
and Growth
Opportunity for career growth
Comprehensive employee learning and development programs
Opportunities to take on varied/diverse projects or work activities
Provision of challenging work
Opportunities for international assignments or employee exchanges
Organizational support for risk-taking and innovation
T-test result showed employees whose expectations of the employer brand promises within this
factor cluster were adequately or more than adequately fulfilled by the employer reported a higher
organizational citizenship performance mean score when compared to employees who had no
expectation of the employer brand promises in this cluster or whose expectations were
inadequately or not at all fulfilled (4.42±0.71 vs. 3.89±0.87, p < 0.001). As such, the result
supported hypothesis 2e.
While a difference in mean scores was found between the two employee groups for task
performance, the result was not statistically significant to the level of p ≤ 0.05 (5.35±0.57 vs.
5.21±0.63, p = 0.054). As such, the results did not support hypothesis 2f. As with the scenario for
the fulfilment of employment promises within the factor cluster of Connectedness and Belonging,
the result of the difference in the mean scores between the two groups for this factor cluster of
Opportunities and Growth could possibly have been statistically significant to the level of p ≤ 0.05
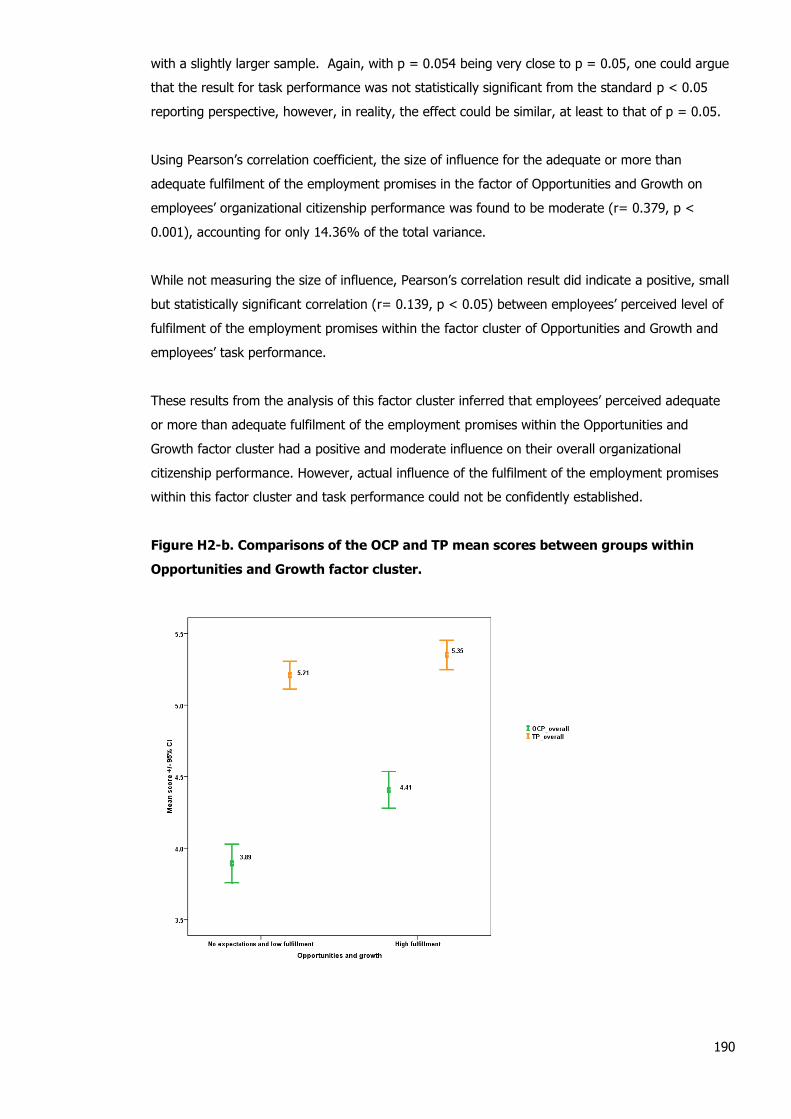
190
with a slightly larger sample. Again, with p = 0.054 being very close to p = 0.05, one could argue
that the result for task performance was not statistically significant from the standard p < 0.05
reporting perspective, however, in reality, the effect could be similar, at least to that of p = 0.05.
Using Pearson’s correlation coefficient, the size of influence for the adequate or more than
adequate fulfilment of the employment promises in the factor of Opportunities and Growth on
employees’ organizational citizenship performance was found to be moderate (r= 0.379, p <
0.001), accounting for only 14.36% of the total variance.
While not measuring the size of influence, Pearson’s correlation result did indicate a positive, small
but statistically significant correlation (r= 0.139, p < 0.05) between employees’ perceived level of
fulfilment of the employment promises within the factor cluster of Opportunities and Growth and
employees’ task performance.
These results from the analysis of this factor cluster inferred that employees’ perceived adequate
or more than adequate fulfilment of the employment promises within the Opportunities and
Growth factor cluster had a positive and moderate influence on their overall organizational
citizenship performance. However, actual influence of the fulfilment of the employment promises
within this factor cluster and task performance could not be confidently established.
Figure H2-b. Comparisons of the OCP and TP mean scores between groups within
Opportunities and Growth factor cluster.

191
Influence of the factor of Personal Stake and Influence on employee performance
Hypotheses tested in this section were:
H2g: Employees who perceive a high level of expectation fulfilment by their employer of the
promises in the Personal Stake and Influence factor cluster will report a higher level of
organizational citizenship performance than employees who either perceive a low level of
expectation fulfilment by their employer in this factor cluster or who have no expectation for
the promises in this factor cluster.
H2h: Employees who perceive a high level of expectation fulfilment by their employer of the
promises in the Personal Stake and Influence factor cluster will report a higher level of task
performance than employees who either perceive a low level of expectation fulfilment by
their employer in this factor cluster or who have no expectation for the promises in this
factor cluster.
Factors Employment Benefits
Personal Stake
and Influence
Opportunity to be a shareholder in a 100% employee-owned structure
Peer nominated Principals and Associates System
Fairly flat organizational structure with low hierarchy
An organization that values employee input
T-test result showed employees whose expectations of the employer brand promises within this
factor cluster were adequately or more than adequately fulfilled by the employer reported a higher
organizational citizenship performance mean score when compared to employees who had no
expectation of the employer brand promises in this cluster or whose expectations were
inadequately or not at all fulfilled (4.35±0.76 vs. 3.90±0.86, p < 0.001). As such, the result
supported hypothesis 2g.
While a difference in mean scores was found between the two employee groups for task
performance, the result was not statistically significant (5.30±0.58 vs. 5.24±0.63, p = 0.395). As
such, the results did not support hypothesis 2h.
Using Pearson’s correlation coefficient, the size of influence for the adequate or more than
adequate fulfilment of the employment promises in the factor of Personal Stake and Influence on
employees’ organizational citizenship performance was found to be moderate (r= 0.320, p <
0.001), accounting for only 10.24% of the total variance.
No statistically significant influence or correlation was found between employees’ perceived level of
fulfilment of the employment promises within the factor cluster of Personal Stake and Influence
and employees’ task performance.

192
These results from the analysis of this factor cluster inferred that employees’ perceived adequate
or more than adequate fulfilment of the employment promises within the Personal Stake and
Influence factor cluster had a positive and moderate influence on their overall organizational
citizenship performance but not their task performance.
Figure H2-c. Comparisons of the OCP and TP mean scores between groups within
Personal Stake and Influence factor cluster.
Influence of the factor of Significance and Esteem on employee performance
Hypotheses tested in this section were:
H2i: Employees who perceive a high level of expectation fulfilment by their employer of the
promises in the Significance and Esteem factor cluster will report a higher level of
organizational citizenship performance than employees who either perceive a low level of
expectation fulfilment by their employer in this factor cluster or who have no expectation for
the promises in this factor cluster.
H2j: Employees who perceive a high level of expectation fulfilment by their employer of the
promises in the Significance and Esteem factor cluster will report a higher level of task
performance than employees who either perceive a low level of expectation fulfilment by
their employer in this factor cluster or who have no expectation for the promises in this
factor cluster.

193
Factors Employment Benefits
Significance
and Esteem
Organizational commitment to technical excellence
Opportunity to be involved or contribute to the organization's community
building and engagement efforts
Opportunity to be part of a successful and highly respected organization
T-test results supported both hypotheses 2i and 2j through the indication of influence of the factor
of Significance and Esteem on employees’ organizational citizenship performance as well as task
performance. It showed that employees whose expectations of the employer brand promises
within this factor cluster were adequately or more than adequately fulfilled by the employer
reported a higher organizational citizenship performance mean score as well as a higher task
performance mean score, when compared to employees who had no expectation of the employer
brand promises in this cluster or whose expectations were inadequately or not at all fulfilled (for
OCP, 4.26±0.85 vs. 3.81±0.76, p < 0.001 and for TP, 5.32±0.61 vs. 5.17±0.58, p = 0.047).
Using Pearson’s correlation coefficient, the size of influence for the adequate or more than
adequate fulfilment of the employment promises in the factor of Significance and Esteem on
employees’ organizational citizenship performance was found to be moderate (r= 0.335, p <
0.001), accounting for 11.22% of the total variance. The size of influence of this factor on task
performance was found to be small (r= 0.128, p < 0.05), accounting for only 1.64% of the total
variance.
These results from the analysis of this factor cluster inferred that employees’ perceived adequate
or more than adequate fulfilment of the employment promises within the Significance and Esteem
factor cluster had a positive and moderate influence on their overall organizational citizenship
performance as well as a positive and small influence on their overall task performance.

194
Figure H2-d. Comparisons of the OCP and TP mean scores between groups within
Significance and Esteem factor cluster.
The influence of employees’ perceived fulfilment of specific employer
brand promises on their Organizational Citizenship Performance
Following the first set of investigations in the former section, more in depth examinations were
done on the different degrees of performance influence that might exist in the fulfilment of each
item of employer brand promise. In short, the investigation was intended to find out if certain
types or items of employer brand promises would have a stronger influence on employee
performance than others. For this investigation, the results from both High Fulfilment and Low
Fulfilment/No Expectation groups were once again used for comparison. For certain examinations,
the Low Fulfilment/No Expectation employee group was further broken down into two independent
groups – Low Fulfilment group and No Expectation group. The organizational citizenship
performance results as well as the task performance results of three independent variable
employee groups were therefore compared:
Group HF: High Fulfilment - Employees who perceived that their employer brand promise
expectations as having been adequately or more than adequately fulfilled by
their employer.
Group LF: Low Fulfilment - Employees who perceived that their employer brand promise
expectations as having been inadequately or not at all fulfilled.

195
Group NE: No Expectation - Employees who had no expectations for that the investigated
employer brand promises.
A one-way analysis of variance followed by Scheffe Post-hoc test was used to test for differences
in performance mean scores between the three above-mentioned groups. Where differences
existed between groups, Scheffe Post-Hoc test was used to ascertain the location of the difference
between the groups. In all cases, the assumption of equality of variances was not violated.
With reference to Table H2-1 in Appendix 12, statistically significant differences in the performance
mean scores between the three employee groups – High Fulfilment Group, Low Fulfilment Group,
and No Expectation Group, were found for 19 of the 20 employer brand promises, which indicated
that for 19 of the 20 employer brand promises, employees who perceived high fulfilment reported
a higher performance level of selective organizational citizenship behaviours when compared to
employees who had no expectation or perceived low fulfillment for those employer brand promises.
In this section, the influence of employer brand promises will be examined in several categories,
according to the extent of statistically significant influence they had on organizational citizenship
performance and task performance:
No Yield Influencers Category
Low Yield Influencers Category
High Yield Influencers Category
Moderate Yield Category
No Yield Influencer
Very surprisingly, statistically significant difference in the mean scores between the three employee
groups -High Fulfilment Group, Low Fulfilment Group, and No Expectation Group, for organizational
citizenship performance (as well as task performance) was not found for employer brand promise:
Employer brand promises EBP
#
Employment
Benefit
Content Factor
# of
OCP
affected
Types of
Employment
Benefits Based on
Extant Literature
NO YIELD INFLUENCERS - Results showed the following employer brand promise as
having statistically significant influence on the performance of 0 of the 17
organizational citizenship behaviours even when they were perceived by employees
as adequately or more than adequately fulfilled
Organizational support for team work
and/or collaboration among colleagues 5
Connectedness
and Belonging 0 Social/Psychological

196
Organizational support for team work and/or collaboration among colleagues. This inferred that
neither employees’ performance of civic virtues, helping behaviours, individual initiatives,
organizational compliance, organizational loyalty, self-development initiatives, nor sportsmanship
behaviours was noticeably influenced by the organization’s fulfillment of support for team work
and/or collaboration among colleagues.
Majority of BOB’s employees worked in teams and participated regularly in collaborative projects
between divisions. It is possible that team work and collaboration was such a common part of their
work structure and culture that it was not recognized by employees as a form of “employment
benefit” that they expected the organization to provide and upon which their work motivation and
demonstrated level of individual performance would be influenced. It is possible in this scenario
that employees see team work and collaboration as something within their own control rather than
facilitated by the organization.
This begs the question of whether: 1) a possible factor that is part of an organization’s basic work
structure or routine would lose its capacity to serve as a performance influencer to its specific
workforce even when that something is deemed by most in the world of work as positive and
desirable and 2) a possible factor that is common within employees’ profession or employment
(e.g. environmental project workers routinely work in teams and across different collaborative
projects, hence collaboration and team work is the norm rather than an exciting opportunity to
participate in team project and team development) would typically be seen by the employees as a
form of “benefit” or “value”.

197
Low Yield Influencers
As summarized in Table H2-2 in Appendix 13, each employer brand promise with statistically
significant effect on the performance of between two and four (less than 25%) of the 17
organizational citizenship performance behaviours were shown in the following table:
For each of the seven employer brand promises above, statistically significant difference in mean
scores between either two or all three of the employee groups - High Fulfilment Group, Low
Fulfilment Group, and No Expectation Group, were found for only four or less (less than ¼) of the
17 organizational citizenship performance behaviours. Benefits represented here were not confined
to one specific employment benefit content factor cluster.
Scheffe Post-Hoc test revealed that statistically significant differences in mean scores (see Table
H2-2 in Appendix 13) between groups were found between employees who perceived high
expectation fulfillment and those who perceived low expectation fulfillment for these items rather
Employer brand promises EBP
#
Employment
Benefit
Content Factor
# of
OCP
affected
Types of
Employment
Benefits Based on
Extant Literature
LOW YIELD INFLUENCERS - Results showed the following employer brand promises
as having statistically significant influence on the performance of 2 to 4 of the 17
organizational citizenship behaviours when they were perceived by employees as
adequately or more than adequately fulfilled
Be part of a successful and highly
respected organization 19
Significance
and Esteem 4 Symbolic
Flexible work schedule or
telecommuting option 4
Personal
Sustainability 3 Work-life Balance
Strong organizational commitment to
employee health and safety 10
Personal
Sustainability 3
Interest Value/
Organizational Culture
and Environment
Firm organizational commitment to its
pledge of honest, fair, and respectful
treatment of employees
18 Personal
Sustainability 3 Social/Psychological
Opportunity to be a shareholder in a
100% employee-owned structure 1
Personal Stake
and Influence 3 Economic/Monetary
A supportive and caring work culture 13 Connectedness
and Belonging 2 Social/Psychological
Comprehensive employee learning and
development programs 3
Opportunities
and Growth 2
Functional or
Development and
Applications

198
with those who had no expectation for these items. In short, employees who perceived adequate
or more than adequate expectation fulfilment of the employer brand promises in this category
reported higher level of performance in affected organizational citizenship behaviours that
employees who perceived inadequate or no expectation fulfilment of these employer brand
promises.
When looking at these three employer brand promises together, statistically significant differences
in mean scores between groups were found for the performance of six of the seven types of
organizational citizenship behaviours on the survey scale. The behaviours not significantly affected
by the employer brand promises in this category were those reflective of Self Development.
The organizational citizenship performance behaviours on the scale that were affected by the
fulfilment of the most number of employer brand promises in this category were those reflective of
organizational loyalty behaviours - defended the organization when other employees criticized it
and showed pride when representing the organization in public. Pearson’s correlation coefficient
showed a small effect (from r = .135 to r = .288, p≤0.05) of each of the employer brand promises
that had an effect on these two organizational loyalty behaviours, accounting for 1.8% to 8.29% of
the variance.
When the overall difference in organizational citizenship performance mean scores between
employee groups for this category of employer brand promises was examined, the disparity in the
level of performance between the employee groups in each category was evident and statistically
significant. In this T-test, the Low fulfillment and No Expectation employee groups were once again
combined as one. Results indicated that employees whose expectations of employer brand
promises were adequately or more than adequately fulfilled by the employer reported higher level
of organizational citizenship performance when compared to employees had no expectation of the
employer brand promises or whose expectations were inadequately or not at all fulfilled.

199
Employer Brand Promise Influencer Categories
Level of EBP
expectation fulfillment
Overall organizational citizenship performance
Results
N Mean Standard Deviation
Significance, p-value
Low Yield Influencers
EBP_1_3_4_10_13_18_19
No expectations
and low fulfillment
90 3.90 0.86
0.003
High fulfillment 192 4.22 0.82
Figure H2-a. Comparison of overall organizational citizenship performance (OCP) mean
scores between employee groups with “No expectations and Low fulfillment” and
“High fulfillment” for employer brand promises (EBP) categorized as low yield
influencers: EBP_1_3_4_10_13_18_19

200
High Yield Influencers
As summarized in Table H2-3 in Appendix 14, each employer brand promise with statistically
significant effect on the performance of between 12 and 13 (over 70%) of the 17 organizational
citizenship performance behaviours were shown in the following table:
For all three employer brand promises above, statistically significant differences in performance
mean scores were found between either two or all three of the employee groups. Employees who
perceived high expectation fulfillment for these employer brand promises reported higher level of
performance for 12 to 13 of the 17 organizational citizenship behaviours when compared, to either
those who perceived low expectation fulfillment or those who had no expectations for these three
employer brand promises and in ¼ of the cases, when compared to both of these employee
groups.
When looking at these three employer brand promises together, statistically significant differences
in mean scores between groups were found for the performance of all seven types of
organizational citizenship behaviours on the survey scale. The performance of organizational
citizenship behaviours affected by all three employer brand promises were those reflective of:
Organizational loyalty (two of two behaviour descriptors on the scale) - defending the
organization when other employees criticized it and showing pride when representing the
organization in public
Employer brand promises EBP
#
Employment
Benefit
Content Factor
# of
OCP
affected
Types of
Employment
Benefits Based on
Extant Literature
HIGH YIELD INFLUENCERS - Results showed the following employer brand promises
as having statistically significant influence on the performance of 12 to 14 of the 17
organizational citizenship behaviours when they were perceived by employees as
adequately or more than adequately fulfilled
Opportunities to take on varied/diverse
projects or work activities 14
Opportunities
and Growth 13
Functional or
Development and
Applications
Organizational support for risk-taking
and innovation 17
Opportunities
and Growth 12
Interest Value/
Organizational Culture
and Environment
Opportunities for international
assignments or employee exchanges 20
Opportunities
and Growth 12
Functional or
Development and
Applications

201
Sportsmanship (one of two behaviour descriptors on the scale) - maintained a positive
attitude even when things at work were not going the way you wanted them to go
Helping behaviour (one of four behaviour descriptors on the scale) - went out of your way
to make newer employees feel welcome in the work group
Civic virtue (one of three behaviour descriptors on the scale) - kept up with developments
in the organization
Individual initiative (one of three behaviour descriptors on the scale) - offered ideas for
organizational improvements.
Another noteworthy observation is that all three employer brand promises were within the
Opportunities and Growth factor cluster. These employer promises are representative of
strategies, structures, and activities designed and coordinated to enhance or expand employees’
professional and technical skills as well as to keep them professionally stimulated and engaged on
an on-going basis.
A stepwise multiple regression was conducted to evaluate whether all three of the above-
mentioned employer brand promise scores were necessary to predict each of the organizational
citizenship performance behaviours. The unstandardized and standardized regression coefficients
of the predictors together with R and R2 and significance levels are presented in Table H2-6 in
Appendix 17.
The models were statistically significant, p < 0.05. While none of the three employer brand
promises had the capacity on its own to predict or significantly influence all 17 identified
organizational citizenship performance behaviours, in combination the three employer brand
promises were required to predict 16 of the 17 identified organizational citizenship performance
behaviours. Behaviour not predicted by any employer brand promise was diligently followed
organizational rules, policies, and procedures, a behaviour reflective of organizational compliance.
It is very possible that this behaviour was seen by employees as a requirement rather than
discretionary. One would be expected to follow the rules at work regardless of whether one was
pleased or displeased with the organization’s ability to deliver on its promised benefits.
Results showed the predictive capacity of the three employer brand promises in the following
descending order:
1. Opportunities to take on varied/diverse projects or work activities was required to predict
seven of the 17 organizational citizenship performance behaviours.
2. Organizational support for risk-taking and innovation was required to predict five of the 17
organizational citizenship performance behaviours.

202
3. Opportunities for international assignments or employee exchanges was required to predict
four of the 17 organizational citizenship performance behaviours.
The inference here is that the fulfillment of opportunities to take on varied/diverse projects or work
activities would have the largest capacity to positively influence employees’ organizational
citizenship performance as it positively influenced the most number of organizational citizenship
performance behaviours compared to all other employer brand promises examined.
Generally, the size of influence explained by each of the variables was small to moderate (from r =
.126 to r = .418, p < 0.05), accounting for 1.6% to 17.4% of the variance of the organizational
citizenship performance behaviours.
When the overall difference in organizational citizenship performance mean scores between
employee groups for this category of employer brand promises was examined, the disparity in the
level of performance between the employee groups in each category was evident and statistically
significant. In this T-test, the Low fulfillment and No Expectation employee groups were once again
combined as one. Results indicated that employees whose expectations of employer brand
promises were adequately or more than adequately fulfilled by the employer reported higher level
of organizational citizenship performance when compared to employees had no expectation of the
employer brand promises or whose expectations were inadequately or not at all fulfilled.

203
Employer Brand Promise
Influencer Categories
Level of EBP expectation
fulfillment
Overall organizational citizenship performance
Results
N Mean Standard
Deviation
Significance,
p-value
High Yield Influencers
EBP_14_17_20
No expectations
and low fulfillment 176 3.93 0.85
<0.001
High fulfillment 106 4.43 0.74
Figure H2-b. Comparison of overall organizational citizenship performance (OCP) mean
scores between employee groups with “No and Low fulfillment” and “High fulfillment”
for employer brand promises (EBP) categorized as high yield influencers:
EBP_14_17_20

204
Moderate Yield Influencers
As summarized in Table H2-4 in Appendix 15, each employer brand promise with statistically
significant effect on the performance of between five and ten (between 30% to 60%) of the 17
organizational citizenship performance behaviours were shown in the following table:
For the identified employer brand promises above, statistically significant differences in
performance mean scores were found between either two or all three of the employee groups.
Employees who perceived high expectation fulfillment for these employer brand promises reported
Employer brand promises EBP
#
Employment
Benefit
Content Factor
# of
OCP
affected
Types of
Employment
Benefits Based on
Extant Literature
MODERATE YIELD INFLUENCERS - Results showed the following employer brand
promises as having statistically significant influence on the performance of 5 to 10 of
the 17 organizational citizenship behaviours when they were perceived by
employees as adequately or more than adequately fulfilled
Peer nominated Principals and
Associates System 15
Personal Stake
and Influence 10
Interest Value/
Organizational Culture
and Environment
Strong organizational commitment to
social responsibility and community
engagement
9 Significance
and Esteem 9
Functional or
Development and
Applications
A work environment that allows for
work-life balance 16
Personal
Sustainability 7 Work-life Balance
Competitive compensation 7 Personal
Sustainability 6 Economic/Monetary
Fairly flat organizational structure with
low hierarchy 12
Personal Stake
and Influence 6
Interest Value/
Organizational Culture
and Environment
Organizational dedication to technical
excellence 6
Significance
and Esteem 6
Interest Value/
Organizational Culture
and Environment
Provision of challenging work 2 Opportunities
and Growth 5
Functional or
Development and
Applications
Opportunity for career growth 8 Opportunities
and Growth 5
Functional or
Development and
Applications
An organization that values employee
input 11
Personal Stake
and Influence 5 Social/Psychological

205
higher level of performance for between five and ten of the 17 organizational citizenship
behaviours when compared, to either those who perceived low expectation fulfillment or those who
had no expectations for these three employer brand promises and in about 1/3 of the cases, when
compared to both of these employee groups.
For some employer brand promises, statistically significant differences in performance mean scores
between groups were found to be exclusively or almost exclusively between employees who
perceived high expectation fulfillment for these provisions and those who perceived low
expectation fulfillment. These employer brand promises were:
challenging work
organizational dedication to technical excellence
competitive compensation
fairly flat organizational structure with low hierarchy
For other employer brand promises, statistically significant differences in performance mean scores
between groups were found to be exclusively or almost exclusively between employees who
perceived high expectation fulfillment for these provisions and those who had no expectation for
them. These employer brand promises were:
strong organizational commitment to social responsibility and community engagement
an organization that values employee input
peer nominated Principals and Associates System
For the remaining employer brand promises, statistically significant differences in performance
mean scores between groups were found to be between employees who perceived high
expectation fulfillment for these provisions and both employees with low expectation fulfillment
and employees with no expectation for these provisions. These employer brand promises were:
opportunity for career growth
a work environment that allows for work-life balance
When looking at these nine employer brand promises together, statistically significant differences
in mean scores between groups were found for the performance of all seven types of
organizational citizenship behaviours on the survey scale. Organizational Citizenship Behaviours
with the most number of statistically significant differences in performance mean scores between
groups were those reflective of:
Organizational loyalty - defending the organization when other employees criticized it
(affected by eight of the nine employer brand promises above) and showing pride when
representing the organization in public (affected by all nine employer brand promises
above)
Sportsmanship - maintained a positive attitude even when things at work were not going
the way you wanted them to go (affected by seven of the nine employer brand promises
above)
206
A stepwise multiple regression was conducted to evaluate whether all nine of the above-mentioned
employer brand promise scores were necessary to predict each of the organizational citizenship
performance behaviours. The unstandardized and standardized regression coefficients of the
predictors together with R and R2 and significance levels are presented in Table H2-7 in Appendix
18.
The models were statistically significant, p < 0.05. In combination, six of the nine employer brand
promises were required to predict all 17 identified organizational citizenship performance
behaviours. Employer brand promises that did not predict any organizational citizenship
performance behaviours were: competitive compensation, fairly flat organizational structure with
low hierarchy, and a work environment that allows for work-life balance.
Results showed the predictive capacity of the six employer brand promises in the following
descending order:
1. Peer nominated Principals and Associates System was required to predict four of the 17
organizational citizenship performance behaviours.
2. Provision of challenging work, organizational dedication to technical excellence,
opportunity for career growth, and strong organizational commitment to social
responsibility and community engagement were each required to predict three of the 17
organizational citizenship performance behaviours.
3. An organization that values employee input was required to predict one of the 17
organizational citizenship performance behaviours.
Again the organizational citizenship performance behaviour most noticeably impacted was that
which is reflective of organizational loyalty - defending the organization when other employees
criticized it. Within this group, the employer brand promise of organizational dedication to technical
excellence received the strongest weight in the model for the behaviour, explaining approximately
9.4% of the variance for this behaviour.
Generally, the size of influence explained by each of the variables was small to moderate (from r =
.164 to r = .416, p < 0.05), accounting for 2.7% to 17.3% of the variance of the organizational
citizenship performance behaviours.
When the overall difference in organizational citizenship performance mean scores between
employee groups for this category of employer brand promises was examined, the disparity in the
level of performance between the employee groups in each category was evident and statistically
significant. In this T-test, the Low fulfillment and No Expectation employee groups were once again
combined as one. Results indicated that employees whose expectations of employer brand

207
promises were adequately or more than adequately fulfilled by the employer reported higher level
of organizational citizenship performance when compared to employees had no expectation of the
employer brand promises or whose expectations were inadequately or not at all fulfilled.
Employer Brand Promise
Influencer Categories
Level of EBP expectation
fulfillment
Overall organizational citizenship performance
Results
N Mean Standard Deviation
Significance, p-value
Moderate Yield Influencers
EBP_2_6_7_8_9_11_12_15_16
No expectations and low fulfillment
164 3.91 0.84
<0.001
High fulfillment 118 4.40 0.77
Figure H2-c. Comparison of overall organizational citizenship performance (OCP) mean
scores between employee groups with “No and Low fulfillment” and “High fulfillment”
for employer brand promises (EBP) categorized as moderate yield influencers:
EBP_2_6_7_8_9_11_12_15_16

208
The influence of employees’ perceived fulfilment of specific employer
brand promises on their Task Performance
As indicated in Table H2-5 in Appendix 16, no significant difference in mean scores could be found
for the reported level of task performance between employees who perceived high expectation
fulfilment and those who had no expectation or those who perceived low expectation fulfilment for
12 of the 20 identified employer brand promises. For the remaining eight employer brand promises
listed below, statistically significant differences in mean scores between groups were found for only
one or two task performance actions each.
The size of influence explained by each of the identified employer brand promise was small (from r
= .119 to r = .196, p ≤ 0.05), accounting for 1.42% to 3.84% of the variance of the task
performance actions.
Employer brand promises EBP
ID
Employment
Benefit
Content Factor
# of TP
affected
Types of
Employment
Benefits Based on
Extant Literature
LOW YIELD INFLUENCERS - Results showed the following employer brand promise
as having statistically significant influence on the performance of 1 to 2 of the 7 task
performance actions when they were perceived by employees as adequately or more
than adequately fulfilled
Flexible work schedule or
telecommuting option 4
Personal
Sustainability 1 Work-life Balance
Organizational dedication to technical
excellence 6
Significance
and Esteem 1
Interest Value/
Organizational Culture
and Environment
Opportunity for career growth 8 Opportunities
and Growth 1
Functional or
Development and
Applications
Opportunities to take on varied/diverse
projects or work activities 14
Opportunities
and Growth 1
Functional or
Development and
Applications
Opportunities for international
assignments or employee exchanges 20
Opportunities
and Growth 1
Functional or
Development and
Applications
Opportunity to be a shareholder in a
100% employee-owned structure 1
Personal Stake
and Influence 2 Economic/Monetary
Peer nominated Principals and
Associates System 15
Personal Stake
and Influence 2
Interest Value/
Organizational Culture
and Environment
Firm organizational commitment to its
pledge of honest, fair, and respectful
treatment of employees
18 Personal
Sustainability 2 Social/Psychological

209
For the identified employer brand promises above, statistically significant differences in task
performance mean scores were found between two of the three of the employee groups. Scheffe
Post-Hoc test revealed that in half of the cases, employees who perceived high expectation
fulfillment for these employer brand promises reported higher level of performance than those who
perceived low expectation fulfillment for these employer brand promises. In the other half of the
cases, employees who perceived high expectation fulfillment for these employer brand promises
reported higher level of performance than those who had no expectations for these employer
promises. Because of the low number of affected task performance actions for each of the above
employer brand promises, one could not confidently identify any trends of influence with any of
these employer brand promises.
When looking at these eight employer brand promises together, statistically significant differences
in mean scores between groups were found for the performance of five of the seven task
performance actions on the survey scale. The task performance action with the most number of
statistically significant differences in performance mean scores between groups was - engaged in
activities that would positively affect your performance evaluation (affected by five of the eight
employer brand promises). On the opposite end, task performance actions not influenced by the
fulfillment of any employer brand promises were adequately completed assigned duties and met
formal performance requirements of your job.
An interesting observation is that employees who had no expectation for the organization’s peer
nominated Principals and Associates System demonstrated higher level of task performance when
compared to employees whose expectation for this provision was not at all or not adequately
fulfilled. This meant higher frequency of demonstrated action, and in this case, it was specifically
for the action of NOT failed to perform essential duties (reversed statement). In the management
interview, respondents offered insight into the rigorous assessment and appointment process
employees have to go through in order to become an Associate or Principal. As such, it might not
be unusual for some employees who had not or not yet become an Associate or Principal to feel
that their expectation had not been adequately or at all met. A total 0f 15% of the 279 employee
survey respondents for this specific question fell into this group while 26% fell into the group of ‘no
expectation”. Here, one could assume that if an employee had no expectation to be an Associate
or Principal, having or not having this benefit would have little influence on his/her performance.
Instead, the employee’s task performance would be guided primarily by the requirements of
his/her job. On the other hand, if an employee had expected to be an Associate or Principal but
had not been able to fulfill this expectation, his/her task performance could very possibly be
influenced by the failure to have his/her expectation met, thus explaining the difference in
performance score.
When the overall difference in task performance mean scores between employee groups for these
eight employer brand promises were examined, disparity was present in the level of performance
between the employee groups but the overall categorical result itself was not statistically

210
significant to the level of p ≤ 0.05 (in this T-test, the Low fulfillment and No Expectation employee
groups were once again combined as one). As such, one could not confidently suggest that
employees’ task performance was influenced by their perception of adequate or more than
adequate fulfilment of their expectations of these employer brand promises.
Table H2-9. Comparison of overall task performance (TP) mean scores between groups
for employer brand promises 1_4_6_8_14_15_18_20:
Employer brand promises
Level of EBP
expectation
fulfillment
Overall task performance Results
N Mean Std.
Deviation
Significance,
p-value
EBP_1_4_6_8_14_15_18_20
No expectations
and Low fulfillment 156 5.22 0.63
0.099
High fulfillment 124 5.34 0.57

211
Overall results on the influence of employer brand promises on
employees’ Organizational Citizenship and task Performances
The combination of results would allow us to determine whether the following hypotheses could be
supported:
H2k: As a whole, employees who perceive a high level of employer brand promise expectation
fulfilment by their employer will report a higher level of organizational citizenship
performance than employees who have no expectation for the employer brand promises or
who perceive a low level of employer brand promise expectation fulfilment by their
employer.
H2l: As a whole, employees who perceive a high level of employer brand promise expectation
fulfilment by their employer will report a higher level of task performance than employees
who have no expectation for the employer brand promises or who perceive a low level of
employer brand promise expectation fulfilment by their employer.
The potential influence of employer brand promises on employees’ organizational citizenship
performance and task performance was investigated in different clusters and categories as well as
at different levels of depth to offer a more well-round and multi-dimensional view of the
examination outcomes.
Almost all test results showed that the organizational citizenship performance mean scores of
employees with high expectation fulfilment were statistically significantly higher than those with
low expectation fulfilment or no expectation. While there were a couple of exceptions where
results revealed non-statistically significant difference in performance mean scores, these few and
far-between results could not overshadow the overwhelming number of all other individual and
cluster or categorical results that clearly and consistently showed that employees who perceived
their employer brand promise expectations as having been adequately or more than adequately
fulfilled performed better that those who had no expectation of the employer brand promises or
those who perceived their employer brand promise expectations as having been inadequately or
not at all fulfilled. The sizes of the effects ranged from small to moderate. One could see that the
combination of results from these different clusters, categories, and levels support hypothesis H2k.

212
Model H2k: Statistically significant difference in organizational citizenship
performance mean scores found between HF group and NF or NE groups
The same could not be said for task performance. Majority of test results reveal no statistically
significant difference in mean scores for task performance between employees with high
expectation fulfilment and those with low expectation fulfilment or no expectation. As such, the
results did not support hypothesis H2l.
Model H2l: Statistically significant difference in task performance mean scores
between HF group and NF or NE groups
In addition to the separate tests done to determine the influence of that employees’ perceived high
fulfillment of different employer brand promises might have on their organizational citizenship and
task performances, a t-test was also completed to determine the influence that employees’
perceived high fulfillment of overall set of employer brand promises have on their overall
organizational citizenship performance as well as their overall task performance. In both cases, the
assumption of the equality of variances was not violated. Statistically significant difference in
overall organizational citizenship performance mean score was found (t = 3.600, p < .001)
between employees who perceived high fulfillment of their employer brand promise expectations
Employees’
Perception of
HIGH FULFILMENT
of Employer Brand
Promise
Expectations
19/20 EBP SS INFLUENCE ON OCP:
Statistically significant positive influence on
organizational citizenship performance was found
in the high fulfilment of 19 out of the 20
employer brand promises
1/20 EBP NO SS INFLUENCE ON OCP:
Statistically significant influence on organizational
citizenship performance was NOT found in the
high fulfilment of 1 out of the 20 employer brand
promises
Employees’
Perception of
HIGH FULFILMENT
of Employer Brand
Promise
Expectations
8/20 EBP SS INFLUENCE ON TP:
Statistically significant positive influence on task
performance was found in the high fulfilment of
8 out of the 20 employer brand promises
12/20 EBP NO SS INFLUENCE ON TP:
Statistically significant influence on task
performance was NOT found in the high
fulfilment of 12 out of the 20 employer brand
promises

213
and the combination group of employees who perceived low fulfillment or no expectation. On the
contrary, statistically significant difference in overall task performance mean score was not found (t
= 1.809, p = .071) between the high fulfillment group and the low fulfillment or no expectation
group.
In line with the different test results found earlier, these t-test results also supported hypothesis
H2k but not hypothesis H2l.
Model H2m: Statistically significant difference in mean scores found for organizational
citizenship performance but not task performance
There are several practical implications of the results found here. The first implication is that when
the employer ensure that its employees’ expectations of the employer brand promises are fulfilled,
it can likely anticipate better organizational citizenship performance from its employees, particularly
in the demonstration of behaviours reflective of organizational loyalty. To a much lesser extent and
scope, the employer could also anticipate small positive effects on some of the employees’ task
performance actions when ensure that its employees’ expectations of the employer brand promises
are fulfilled.
The second practical implication is that employers could dedicate less of their resources to some
employer brand promises and more to others, depending on the strength of their influence on
performance. More financial, material, human or other appropriate resources should be dedicated
to employer brand promises that show significant influence on a large number of performance
behaviours and actions while less resources should or could be dedicated to employer brand
promises that show significant influence on a small number of performance behaviours and
actions, unless those few behaviours or actions are deemed to be highly critical to the achievement
of the organization’s key objectives and goals. As most organizations operate with limited
resources, effective employer branding can still be materialized if the limited resources are used in
an effective matter through selective and strategic allocation of the resources to employer brand
promises that would yield significant influence on either the highest number and/or the most
important performance behaviours and actions. Employment benefits that do not generate
Employees’
Perception of
HIGH FULFILMENT
of Employer Brand
Promise
Expectations
OCP
Statistically significant positive influence on
organizational citizenship performance was
found
TP
Statistically significant influence on task
performance was NOT found

214
significant influence on targeted behaviours could possibly even be dropped from an employer’s list
of employer brand promises offered.
As organizations differ from one another in so many ways including the specific employer brand
promises offered and the performance outcomes they aim to achieve, it is realistic to assume that
an organization’s top 5 or top 10 most influential employer brand promises may not be the same
as those of other organizations. Realizing this and the likelihood that the fulfillment of some
employer brand promises will have a larger positive influence on more organizational citizenship
performance behaviours and task performance actions than the fulfillment of other employer brand
promises, organizations should analyze the influence of each of their own employer brand promise
and to determine where resources could be best allocated to yield the highest return on
investment in terms of the positive influence on the largest number or most critical performance
behaviours and actions.

215
Examining the influence that employees’ perceived level of
employer brand promise expectation fulfilment has on their
perception of having of a desirable and distinctive experience,
a great workplace, a desire to spend the rest of their career
with their organization as well as non-presence of frequent
thoughts of leaving their organization
Hypothesis tested in this section was:
H3: Employees who perceive a high level of employer brand promise expectation fulfilment by
their employer will concur more strongly with each four of the following notions when
compared to employees who have no expectation for the employer brand promises or who
perceive a low level of employer brand promise expectation fulfilment by their employer:
i. Their employment experience at the organization was both desirable and distinctive
(DDEE).
j. Their organization is a great place to work (GPTW).
k. They would be very happy to spend the rest of their career with the organization
(HSCO).
l. They DO NOT frequently think of leaving the employment at the organization (NFTL).
A one-way ANOVA was used to determine whether statistically significant differences could be
found in the concurrence mean scores for all four notions above between the three employee
groups – High Fulfilment Group, Low Fulfilment Group, and No Expectation Group. In determining
their level of concurrence, employee survey respondents were prompted to compare their current
experience to what they knew or what they had experienced with other similar organizations in the
industry. Where differences in concurrence mean scores existed between groups, Scheffe Post-Hoc
test was used to ascertain the location of the difference between the groups. Again, in all cases,
Levene’s tests were conducted and the assumption of equality of variances was not violated.
Table H3-1 on Appendix 19 offers a condensed view of the differences in concurrence mean scores
between the three groups for the fulfilment of every one of the 20 employer brand promises.
Results indicated that for the high fulfillment of every one of the 20 employer brand promise,
statistically significant difference in concurrence mean scores was found between groups for each
of the following notions:
a. Their employment experience at the organization was both desirable and distinctive
(DDEE).
b. Their organization is a great place to work (GPTW).
c. They would be very happy to spend the rest of their career with the organization (HSCO).
d. They do not frequently think of leaving their employment at the organization (NFTL).

216
For every employer brand promise, employees who perceived a high expectation fulfillment
expressed a higher level of concurrence with each of the notion above when compared to
employees who perceived a low expectation fulfillment and/or employees who had no expectation
for the provision. These results support hypothesis 3 above.
Pearson’s correlation coefficient (see Table H3-2 in Appendix 20) was used to determine the sizes
that the statistically significant influences above have on employees’ perception of the each of the
notions above. Results showed that statistically significant, positive, small to large effects exist
between employees’ perceived level of employer brand promise expectation fulfillment their level
of concurrence with the stated notions:
a. For the notion of “Their employment experience at the organization was both desirable
and distinctive”, effect of the high fulfilment of the 20 employer brand promises ranged
from moderate to large (0.282 ≤r≤ 0.597, p = 0.01 for all cases), accounting for 8% to
35.6% of the variance in employees’ level of concurrence with this notion.
b. For the notion of “Their organization is a great place to work”, effect of the high fulfilment
of the 20 employer brand promises ranged from small to large (0.232 ≤r≤ 0.646, p = 0.01
for all cases), accounting for 5.4% to 41.7% of the variance in employees’ level of
concurrence with this notion.
c. For the notion of “They would be very happy to spend the rest of their career with the
organization”, effect of the high fulfilment of the 20 employer brand promises ranged from
small to large (0.235 ≤r≤ 0.554, p = 0.01 for all cases), accounting for 5.5% to 30.7% of
the variance in employees’ level of concurrence with this notion.
d. For the notion of “They DO NOT frequently consider leaving their employment at the
organization”, effect of the high fulfilment of the 20 employer brand promises ranged from
small to moderate (0.149 ≤r≤ 0.459, p≤ 0.05 for all cases), accounting for 2.2% to 21.1%
of the variance in employees’ level of concurrence with this notion.
The uniformity and strength of the results is deserving of serious attention. The key inference here
is that the fulfilment of employer brand promises would have a generally evident, and in many
cases even large, positive effect on employees’ level of agreement that their employment
experience at the organization is both desirable and distinctive, their organization is a great place
to work, they would be very happy to spend the rest of their career with the organization and that
they do not frequently think of leaving their employment at the organization.
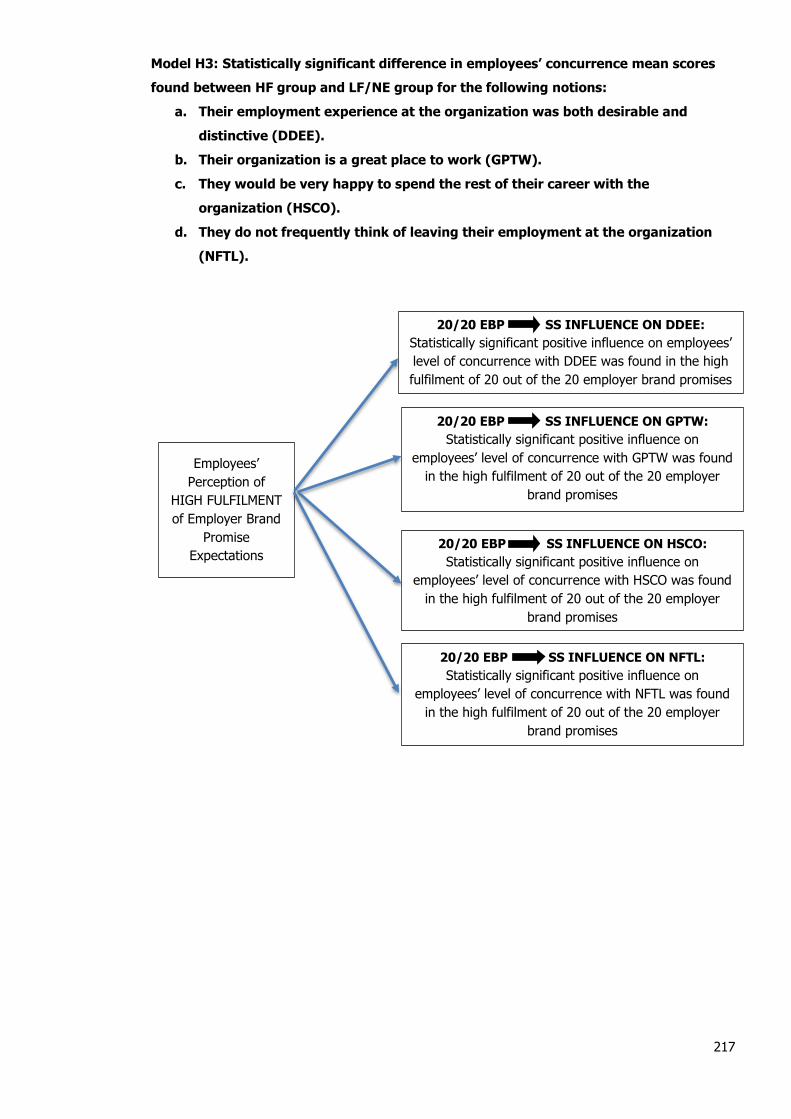
217
Model H3: Statistically significant difference in employees’ concurrence mean scores
found between HF group and LF/NE group for the following notions:
a. Their employment experience at the organization was both desirable and
distinctive (DDEE).
b. Their organization is a great place to work (GPTW).
c. They would be very happy to spend the rest of their career with the
organization (HSCO).
d. They do not frequently think of leaving their employment at the organization
(NFTL).
Employees’
Perception of
HIGH FULFILMENT
of Employer Brand
Promise
Expectations
20/20 EBP SS INFLUENCE ON DDEE:
Statistically significant positive influence on employees’
level of concurrence with DDEE was found in the high
fulfilment of 20 out of the 20 employer brand promises
DDEE – Concur More Strongly = 20/20 EBP
20/20 EBP SS INFLUENCE ON NFTL:
Statistically significant positive influence on
employees’ level of concurrence with NFTL was found
in the high fulfilment of 20 out of the 20 employer
brand promises
20/20 EBP SS INFLUENCE ON HSCO:
Statistically significant positive influence on
employees’ level of concurrence with HSCO was found
in the high fulfilment of 20 out of the 20 employer
brand promises
20/20 EBP SS INFLUENCE ON GPTW:
Statistically significant positive influence on
employees’ level of concurrence with GPTW was found
in the high fulfilment of 20 out of the 20 employer
brand promises

218
Examining the influence that employees’ perceived presence
of a desirable and distinctive experience, a great workplace, a
desire to spend the rest of their career with their organization
as well as non-presence of frequent thoughts of leaving their
organization, has on their level of organizational citizenship
and task performances
Hypotheses tested in this section were:
H4a: Employees who concur (CC) with each of the four notions below will demonstrate a higher
level of organizational citizenship performance (OCP) when compared to employees who do
not concur (DNC) with the notions:
i. Their employment experience at the organization was both desirable and
distinctive (DDEE).
j. Their organization is a great place to work (GPTW).
k. They would be very happy to spend the rest of their career with the organization
(HSCO).
l. They DO NOT frequently think of leaving the employment at the organization
(NFTL).
H4b: Employees who concur (CC) with each of the four notions below will demonstrate a higher
level of task performance (TP) when compared to employees who do not concur (DNC) with
the notions:
a. Their employment experience at the organization was both desirable and
distinctive (DDEE).
b. Their organization is a great place to work (GPTW).
c. They would be very happy to spend the rest of their career with the organization
(HSCO).
d. They DO NOT frequently think of leaving the employment at the organization
(NFTL).
This investigation explored the different degrees of influence on performance that might exist in
response to employees’ level of agreement with the four notions presented above. T-test was used
for this investigation and participants were divided into two independent variable groups based
solely on their concurrence score for each of the notions above. The groups were:
Group CC: Concur – This group consisted of employees who responded “agree” or
“strongly agree” when asked how much they agreed or disagreed with
each of the notions in hypotheses H4a and H4b.

219
Group NC: Do Not Concur – This group consisted of employees who responded
“neutral”, “disagree” or “strongly disagree” when asked how much they
agreed or disagreed with the notion above.
Organizational citizenship performance results as well as the task performance results of these two
independent variable employee groups were then examined. Table H4-1 in Appendix 21 offers a
summarized view of the differences in the organizational citizenship performance mean scores and
task performance mean scores between the two groups for each of the notion above.
For overall organizational citizenship performance, statistically significant differences in the
performance mean scores were found for every one of the four notions above between employees
who concurred and employees who did not concur with the notions. Pearson’s correlation
coefficient conducted offered further insight into the strength of the relationships and sizes of
influences. The results were as follow:
a. For the notion of “Their employment experience at the organization was both desirable
and distinctive”, x̅ Group CC = 4.23±0.79 vs. x̅ Group NC = 3.73±0.91, p≤0.001 and the effect
on employee performance appeared to be moderate with r= 0.308, p < 0.01, accounting
for 9.49% of the variance in the level of performance.
b. For the notion of “Their organization is a great place to work”, x̅ Group CC = 4.19±0.82 vs. x̅
Group NC = 3.69±0.9, p≤0.001 and the effect on employee performance appeared to be
small but nearing moderate with r= 0.263, p < 0.01, accounting for 6.92% of the
variance in the level of performance.
c. For the notion of “They would be very happy to spend the rest of their career with the
organization”, x̅ Group CC = 4.30±0.80 vs. x̅ Group NC = 3.83±0.84, p≤0.001 and the effect on
employee performance appeared to be moderate with r= 0.329, p < 0.01, accounting
for 10.82% of the variance in the level of performance.
d. For the notion of “They DO NOT frequently consider leaving their employment at the
organization”, x̅ Group CC = 4.23±0.84 vs. x̅ Group NC = 3.94±0.83, p≤0.01 and the effect on
employee performance appeared to be small with r= 0.157, p < 0.01, accounting for
2.46% of the variance in the level of performance.
Results showed that employees who perceived or concluded that their employment experience at
the organization was both desirable and distinctive, or that their organization was a great place to
work, they would be happy to spend the rest of their career with the organization, or that they did
not frequently thought of leaving their employment at the organization, reported higher level of
overall organizational citizenship performance when compared to employees who did not perceive
or conclude each of these notions.

220
The inference here is that employees’ concurrence with each of the notions above had a small to
moderate influence on their level of overall organizational citizenship performance. As a hole, these
results supported hypothesis H4a.
When the four notions were looked at as a whole, statistically significant differences in the
performance mean scores were found for all seven types of organizational citizenship behaviours
on the scale (helping behaviour, civic virtue, organizational compliance, organizational loyalty,
individual initiative, sportsmanship, self-development), although the specific types of organizational
citizenship behaviours influenced by employees’ concurrence with each of the four notions were as
follow, in decreasing order:
1. Their employment experience at the organization was both desirable and distinctive
Six of seven types of behaviours – excluded were behaviours reflective of Individual
Initiatives
2. They would be very happy to spend the rest of their career with the organization
Six of seven types of behaviours – excluded were behaviours reflective of Self-
development
3. Their organization is a great place to work
Five of seven types of behaviours – excluded were behaviours reflective of
Individual Initiatives and Self-development
4. They DO NOT frequently think of leaving the employment at the organization
Four of seven types of behaviours – excluded were behaviours reflective of
Individual Initiatives, Self-development, and Helping Behaviour
It appeared that Individual Initiatives and Self-Development were affected by a lesser number of
notions concurred by employees. On the other hand, organizational citizenship behaviours
statistically significantly affected by every one of the four notions concurred by employees were as
follow:
Organizational loyalty (two of two behaviour descriptors on the scale) - defending the
organization when other employees criticized it and showing pride when representing the
organization in public.
Civic virtue (two of three behaviour descriptors on the scale) - attended functions that
were not required but that helped the organizational image and kept up with
developments in the organization.
Sportsmanship (one of two behaviour descriptors on the scale) - maintained a positive
attitude even when things at work were not going the way you wanted them to go

221
Organizational compliance (one of one behaviour descriptor on the scale) - diligently
followed organizational rules, policies, and procedures.
The inference here is that employees who did perceive or conclude each of the four notions
identified would, for most organizational citizenship performance behaviours, performed at a
higher level when compared to employees who did perceive or conclude each of the four notions.
For overall task performance, statistically significant differences in mean scores between
employees who concurred and employees who did not concur were found for three of the four
notions. As with organizational citizenship performance, Pearson’s correlation coefficient conducted
here offered further insight into the strength of the relationships and sizes of influences. The
results were as follow:
a. For the notion of “Their employment experience at the organization was both desirable
and distinctive”, x̅ Group CC = 5.33±0.54 vs. x̅ Group NC = 5.08±0.75, p≤0.05 and the effect on
employee performance appeared to be small with r= 0.207, p < 0.01, accounting for
4.28% of the variance in the level of performance.
b. For the notion of “Their organization is a great place to work”, x̅ Group CC = 5.31±0.56 vs. x̅
Group NC = 5.02±0.77, p≤0.05 and the effect on employee performance appeared to be small
with r= 0.230, p < 0.01, accounting for 5.29% of the variance in the level of performance.
c. For the notion of “They would be very happy to spend the rest of their career with the
organization”, statistically significant difference in mean scores were not found between
employees who concur and employees who did not concur with this notion.
d. For the notion of “They DO NOT frequently consider leaving their employment at the
organization”, x̅ Group CC = 5.33±0.57 vs. x̅ Group NC = 5.17±0.64, p≤0.05 and the effect on
employee performance appeared to be small with r= 0.136, p < 0.05, accounting for
1.85% of the variance in the level of performance.
Results showed that employees who perceived or concluded that their employment experience at
the organization was both desirable and distinctive, or that their organization was a great place to
work, or that they did not frequently thought of leaving their employment at the organization,
reported higher level of overall task performance when compared to employees who did not
perceive or conclude each of these notions. However, statistically significant difference in
performance mean score was not present to support the suggestion that employees who did
perceive or conclude that they would be happy to spend the rest of their career with the
organization would perform better than those who did not perceive or conclude this notion.

222
The inference here is that employees’ concurrence with three of the four notions above had a small
influence on their level of overall task performance.
It should, however, be noted that when the influence on each task performance action was
examined, statistically significant difference in mean score between the two employee groups were
found for only one task performance action - Engaged in activities that would positively affect your
performance evaluation for employees concurrence with two of the four notions, which were,
“Their employment experience at the organization was both desirable and distinctive” and “They
would be very happy to spend the rest of their career with the organization”.
As a whole, the results for task performance could not fully support hypothesis H4b as statistically
significant difference in the level of performance were not present between the two employee
groups for almost all of the task performance actions.
Model H4: Statistically significant difference in employees’ concurrence mean scores
found between HF group and NF/NE group and statistically significant difference in
employees’ organizational citizenship performance mean scores as well as task
performance mean scores found between CC group and NC group
The following figures offer a visual view of the difference in the organizational citizenship and task
performance mean scores between groups for each of the four notions. Overlapping scatter plots
to show that a linear, positive association was present between values for employees’ level of
concurrence with each of the four notions and their demonstrated level of overall organizational
citizenship performance as well as task performance.
Employees’
Perception
of
HIGH
FULFILMENT
of Employer
Brand
Promise
Expectations
Higher level of
Concurrence with
DDEE
Higher level of
Concurrence with
NTLF
Higher level of
Concurrence with
HSCO
Higher level of
Concurrence with
GPTW
Higher Level of
organizational
citizenship
performance
Higher Level of
task
performance

223
Figure H5-ai. Comparison of organizational citizenship performance (OCP) and task
performance (TP) between Group CC and Group NC for the notion that their
employment experience at the organization was both desirable and distinctive (DDEE)
Figure H5-aii. Overlapping scatter plots of employees’ level of concurrence with the
notion that their employment experience at the organization was both desirable and
distinctive and overall organizational citizenship performance (OCP - green) as well
Overall task performance (TP - orange) values

224
Figure H5-bi. Comparison of organizational citizenship performance (OCP) and task
performance (TP) between Group CC and Group NC for the notion that their
organization is a great place to work (GPTW)
Figure H5-bii. Overlapping scatter plots of employees’ level of concurrence with the
notion that the organization is a great place to work and overall organizational
citizenship performance (OCP - green) as well as Overall task performance (TP -
orange) values

225
Figure H5-ci. Comparison of organizational citizenship performance (OCP) and task
performance (TP) between Group CC and Group NC for the notion that they would be
happy to spend the rest of their career with the organization (HSCO)
Figure H5-cii. Overlapping scatter plots of employees’ level of concurrence with the
notion that they would be very happy to spend the rest of their career with the
organization and overall organizational citizenship performance (OCP - green) as well
Overall task performance (TP - orange) values

226
Figure H5-di. Comparison of organizational citizenship performance (OCP) and task
performance (TP) between Group CC and Group NC for the notion that they do not
frequently think of leaving the employment at the organization (NFTL)
Figure H5-dii. Overlapping scatter plots of employees’ level of concurrence with the
notion that they do not frequently think of leaving their employment at the
organization and overall organizational citizenship performance (OCP - green) as well
Overall task performance (TP - orange) values

227
Summary of Quantitative Results
The summary of the results from this quantitative section is presented in the following tables:
Hypotheses: EBP Fulfillment vs. OCP and TP
Organizational Citizenship Performance
Task Performance
Statistically Significant Results
Size of Influence
Statistically Significant Results
Size of Influence
H1a and H1b: Correlation between employer brand promise fulfillment and employee performance
YES Moderate strength r = 0.358, p < 0.001
NA YES Weak strength r = 0.155, p < 0.001
NA
H2a and H2b: Influence of employees’ perceived high fulfillment of Personal Sustainability factor cluster on their performance
YES 4.21±0.85 vs. 3.96±0.82, p = 0.013
Small 3.84% r= 0.196, p < 0.01
YES 5.33±0.58 vs. 5.18±0.63, p = 0.047
Small 3.03% r= 0.174, p < 0.01
H2c and H2d: Influence of employees’ perceived high fulfillment of Connectedness and Belonging factor cluster on their performance
NOT TO THE LEVEL OF P ≤ 0.05 (but close) 4.17±0.88 vs. 3.96±0.73, p = 0.059 (A larger sample might have yielded a statistically significant result)
NA NO 5.29±0.61 vs. 5.22±0.58, p = 0.397
NA
H2e and H2f: Influence of employees’ perceived high fulfillment of Opportunities and Growth factor cluster on their performance
YES 4.42±0.71 vs. 3.89±0.87, p < 0.001
Moderate 4.36% r= 0.379, p < 0.001
NOT TO THE LEVEL OF P ≤ 0.05 (but close) 5.35±0.57 vs. 5.21±0.63, p = 0.054 (A larger sample might have yielded a statistically significant result)
NA
H2g and H2h: Influence of employees’ perceived high fulfillment of Personal Stake and Influence factor cluster on their performance
YES 4.35±0.76 vs. 3.90±0.86, p < 0.001
Moderate 10.24% r= 0.320, p < 0.001
NO 5.30±0.58 vs. 5.24±0.63, p = 0.395
NA
H2i and H2j: Influence of employees’ perceived high fulfillment of Significance and Esteem factor cluster on their performance
YES 4.26±0.85 vs. 3.81±0.76, p < 0.001
Moderate 11.22% r= 0.335, p < 0.001
YES 5.32±0.61 vs. 5.17±0.58, p = 0.047
Small 1.64% r= 0.128, p < 0.05
H2k and H2l: Influence of employees’ perceived high fulfillment of employer brand promises as a whole on employee performance
Statistically significant positive influence on organizational citizenship performance was found in the high fulfilment of 19 out of the 20 employer brand promises YES For test on overall result of difference in mean scores
t = 3.600, p < .001
Small to Moderate
Statistically significant positive influence on task performance was found in the high fulfilment of 8 out of the 20 employer brand promises NO For test on overall result of difference in mean scores t = 1.809, p = .071
Small
Influence of employees’ perceived high fulfillment of Low Yield EBP on OCP
EBP_1_3_4_10_13_18_19
YES on less than 25% of OCP for every EBP identified in the Low Yield
Group
Small 1.8% to 8.29%
r range = .135 to

228
YES for the Low Yield Group as a whole 4.22 ±0.82 vs. 3.90±0.86, p < 0.003
.288, p≤0.05
Influence of employees’ perceived high fulfillment of High Yield EBP on OCP EBP_14_17_20
YES on more than 70% of OCP for every EBP identified in the High Yield Group YES for the High Yield Group as a whole 4.43 ±0.74 vs. 3.93±0.85, p < 0.001
Small to Moderate 1.6% to 17.4% r range = .126 to .418, p < 0.05
Influence of employees’ perceived high fulfillment of Moderate Yield EBP on OCP
EBP_2_6_7_8_9_11_12_15_16
YES on between 30% and 60% of OCP for every EBP identified in the Moderate
Yield Group YES for the Moderate Yield Group as a whole 4.40±0.77 vs. 3.91±0.84, p < 0.001
Small to Moderate 2.7% to
17.3% r range = .164 to .416, p < 0.05
Influence of employees’ perceived high fulfillment of Low Yield EBP on TP EBP_1_4_6_8_14_15_18_20
YES on less than 30% of TP for every EBP identified in the Low Yield Group NOT TO THE LEVEL OF P ≤ 0.05 for the Low Yield Group as a whole 5.34±0.57 vs. 5.22±0.63, P < 0.099
Small 1.42% to 3.84% r range = .119 to .196, p≤0.05
Hypotheses: EBP Fulfillment vs. Concurrence with Notions as well as Concurrence with Notions vs. OCP and TP
My employment experience is both desirable and distinctive
My organization is a great place to work
I would be very happy to spend the rest of my career with the organization
I DO NOT frequently think of leaving my employment at the organization
H3: Influence of employees’ perceived high fulfillment of each employer brand promise on their concurrence with experiencing the four notions.
Statistically Significant Results: YES for every EBP (see Table H3-1 on Appendix 19) Size of Influence: Moderate to Large 8% to 35.6% 0.282 ≤r≤ 0.597, p = 0.01
Statistically Significant Results: YES for every EBP (see Table H3-1 on Appendix 19) Size of Influence: Small to Large 5.4% to 41.7% 0.232 ≤r≤ 0.646, p = 0.01
Statistically Significant Results: YES for every EBP (see Table H3-1 on Appendix 19) Size of Influence: Small to Large 5.5% to 30.7% 0.235 ≤r≤ 0.554, p = 0.01
Statistically Significant Results: YES for every EBP (see Table H3-1 on Appendix 19) Size of Influence: Small to Moderate 2.2% to 21.1% 0.149 ≤r≤ 0.459, p≤ 0.05
H4a: Influence of employees’ concurrence with experiencing the four notions on their overall organizational citizenship performance
Statistically Significant Results: YES x̅ Group CC = 4.23±0.79 vs. x̅ Group NC = 3.73±0.91, p≤0.001 Size of Influence:
Moderate, 9.49% r= 0.308, p < 0.01
Statistically Significant Results: YES x̅ Group CC = 4.19±0.82 vs. x̅ Group NC = 3.69±0.9, p≤0.001 Size of Influence: Small (nearing
moderate), 6.92% r= 0.263, p < 0.01
Statistically Significant Results: YES x̅ Group CC = 4.30±0.80 vs. x̅ Group NC = 3.83±0.84, p≤0.001 Size of Influence:
Moderate, 10.82% r= 0.329, p < 0.01
Statistically Significant Results: YES x̅ Group CC = 4.23±0.84 vs. x̅ Group NC = 3.94±0.83, p≤0.01 Size of Influence: Small, 2.46%
r= 0.157, p < 0.01

229
H4b: Influence of employees’ concurrence with experiencing the four notions on their overall task performance
Statistically Significant Results: YES x̅ Group CC = 5.33±0.54 vs. x̅ Group NC = 5.08±0.75, p≤0.05 Size of Influence: Small, 4.28% r= 0.207, p < 0.01
Statistically Significant Results: YES x̅ Group CC = 5.31±0.56 vs. x̅ Group NC = 5.02±0.77, p≤0.05 Size of Influence: Small, 5.29% r= 0.230, p < 0.01
Statistically Significant Results: NO Size of Influence: NA
Statistically Significant Results: YES x̅ Group CC = 5.33±0.57 vs. x̅ Group NC = 5.17±0.64, p≤0.05 Size of Influence: Small, 1.85% r= 0.136, p < 0.05
In general, results from the examination of the relationships between the fulfillment of different
employer brand promises and employee performance indicate that adequate or more than
adequate fulfillment of employer brand promises has a small to moderate positive influence on
employees’ organizational citizenship performance and the total variation in the level of employees’
organizational citizenship performance that could be accounted for by the variation in employees’
perceived level of fulfillment of employer brand promises ranged from 1.6% to 17.4%. For task
performance, statistically significant differences in performance mean scores were not found for
the fulfillment of almost 2/3 of the employer brand promises and with the remaining 1/3 that
showed statistically significant results, the strength of influence has been weak, with attributable
variation ranging from 1.42% to 3.84%.
Results from the analysis of each employer brand promise indicated that through the fulfillment of
one or more of nineteen (19) out of the twenty (20) employer brand promises on the scale,
statistically significant differences in performance mean scores between employees who perceived
high (adequate or more than adequate) expectation fulfillment and those who perceived low (not
at all or not adequately) expectation fulfillment and/or no expectation were found for all seventeen
(17) organizational citizenship performance behaviours presented on the research scale.
For task performance, the fulfillment of one or more of eight (8) out of the twenty (20) employer
brand promises yielded statistically significant differences in performance mean scores between
employees who perceived high (adequate or more than adequate) expectation fulfillment and
those who perceived low (not at all or not adequately) expectation fulfillment and/or no
expectation for five (5) of the seven (7) task performance actions presented on the research scale.
Results showed that high level of fulfillment of some employer brand promises would have
significant positive influence on more organizational citizenship performance behaviours and task
performance actions than the high level of fulfillment of other employer brand promises. However,
there is no clear trend on the types of employer brand promises that would have significant
influence on more organizational citizenship performance behaviours and task performance actions
or on the types of employer brand promises that would have significant influence on less
performance behaviours and actions. In general, organizational citizenship performance behaviours
most regularly influenced by the fulfillment of employer brand promises were those reflective of

230
organizational loyalty, while for task performance, action most regularly influenced by the by the
fulfillment of employer brand promises was that of Engage in activities that would positively affect
your performance evaluation.
Results showed that employees’ perceived high fulfilment of employer brand promises has a
positive and noticeably stronger influence on employees’ perception of the desirability of their
employment, as reflected by their sense of whether their employment experience was both
desirable and distinctive, their organization was a great place to work, their desire to spend the
rest of their career with their organization, and their lack of frequency in thinking about leaving
their employment with the organization. Percent of variation in employees’ perception of each
notion above that was attributable to the variation in the employees’ perceived level of employer
brand promise fulfilment were found to be as followed:
a. Their employment experience at the organization was both desirable and distinctive (8.1%
to 35.6%).
b. Their organization is a great place to work (5.4% to 41.7%).
c. They would be very happy to spend the rest of their career with the organization (5.5% to
30.7%).
d. They DO NOT frequently think of leaving the employment at the organization (2.2% to
21.1%).
When compared to the degrees of influence that employees’ perceived high employer brand
promise fulfillment have on their organizational citizenship performance behaviours or task
performance actions, the degrees of influence that employees’ perceived high employer brand
promise fulfillment have on employees’ perception of the desirability of their employment are, as a
whole, stronger.
Statistically significant differences in organizational citizenship performance mean scores were also
found between employees who concurred and employees who did not concur with each of the four
notions above. Employees who concurred reported a higher level of organizational citizenship
performance than those who did not concur and the sizes of influence range from small to
moderate. For task performance, statistically significant differences in task performance mean
scores between employees who concurred and employees who did not concur with notions above
were found for three of the four notions. No significant difference in task performance mean scores
were found between groups for the notion that employees would be very happy to spend the rest
of their career with the organization. For the other three notions, employees who concurred
reported a higher level of task performance than those who did not concur but the sizes of
influence are small.
When compared to the degrees of influence that employees’ perceived high employer brand
promise fulfillment have on their organizational citizenship performance behaviours or task
performance actions, the degrees of influence that employees’ concurrence with these notions has
on their organizational citizenship performance behaviours and with three of the four notions has

231
on task performance actions are, based on broad scan of all separated organizational citizenship
and task performance results, are generally parallel.

232
CHAPTER 7: DISCUSSIONS, IMPLICATIONS, AND CONCLUSIONS
This doctoral study was set out to investigate the influence of employer branding on employee job
performance. More specifically, the study attempted to answer the questions:
1. What are the factors present in the content and delivery of employer brand promises and
how might they influence employee performance?
2. What influence does employees’ perceived level of employer brand promise fulfilment by
their organization have on their level of organizational citizenship and task performances?
In this chapter, the researcher will make effort to first answer the research questions and offer
interpretations and opinions on the results as well as discuss how the findings relate and contribute
to existing knowledge on the subject of employer branding and its relationship with employee
performance. Following that, explanations will be provided on: the implications of the findings on
practice, limitations of the study, and directions for future research.
Answers, Discussions, and Contribution to Knowledge
This section will start off by answering the most important and ultimate question of the study,
which is whether employer branding, particularly employer brand promise fulfillment, has any
influence on employee performance.
What influence does employees’ perceived level of employer brand
promise fulfilment by their organization have on their level of
organizational citizenship and task performances?
The short answer to the question is, with all things being equal, employees’ perceived adequate or
more than adequate fulfillment of employer brand promises by their employer has, on aggregate, a
weak but nearing moderate positive influence on employees’ organizational citizenship
performance and a very weak positive influence on employees’ task performance.
Thus far, the positive relationship between effective employer branding, particularly employer
brand promise fulfillment, and improved employee performance has been mostly assumed rather
than proven. The quantitative results in this case study offers empirical evidence to suggest that
there is some merit in this assumption. However, the influence is not strong and to claim
unequivocally that employer brand promise fulfillment has a direct positive influence on employee

233
performance without acknowledging some of the conditions that exist would be somewhat
misleading.
The influence of employees’ perceived adequate or more than adequate fulfillment of employer
brand promises on their organizational citizenship performance has been shown to range from
weak to moderate. On task performance, statistically significant influence of employees’ perceived
adequate or more than adequate fulfillment of employer brand promises was only present for 1/3
of the promises and the strength of influence was found to be weak.
Results from the detail analysis of each employer brand promise showed that some of the
employer brand promises, when perceived as adequately or more than adequately fulfilled by
employees, did not achieve statistically significant influence on some of their organizational
citizenship performance behaviours or on most of their task performance actions when compared
to performance results of those who had no expectation of the employer brand promises or who
perceived a low level of fulfillment. No clear trend was found on the specific types of employer
brand promises that would have an influence on more organizational citizenship performance
behaviours and task performance actions or on the specific types of employer brand promises that
would have an influence on less performance behaviours and actions. Organizational citizenship
performance behaviours that appeared most frequently influenced by employees’ perceived high
fulfillment of employer brand promises were those reflective of organizational loyalty while the task
performance action that appeared most frequently influenced was Engage in activities that would
positively affect your performance evaluation.
Ultimately, one could interpret from the combination of analyses and results that employer brand
promise fulfillment has a positive influence on employees’ organizational citizenship and task
performance but it is small or weak, especially for task performance.
Possible reasons for the findings of weak influence
In general, the weak influence might not be that unrealistic or surprising considering that an
employee’s motivation and consistency in demonstrating targeted performance and work
behaviours could be moderated and mediated by various factors aside from the provision of
desirable employment benefits. These might include but are not limited to attitude (Adsit et al.,
1996), general mental abilities (Hunter, 1986), personality (Barrick and Mount, 1991), personal life
stressors (Hobson et al. 2004), qualifications, work-culture, and many more. As such, one could
likely conclude that in the case of BOB, employees’ motivation and consistency in demonstrating
performance and targeted work behaviours was influenced by more than just their perception of
their employer’s level of fulfillment of employer brand promises.
The method by which data was gathered could also play a role in the small size of effect found.
The quantitative data for the study was self-reported by respondents in an employee survey. As

234
such, the data for each employee’s demonstrated level of organizational citizenship and task
performance was interpreted and reported by the employee him/herself rather than observed and
verified by other parties such his/her supervisor, co-workers, or the researcher. As this study dealt
with issues that were quite personal (acknowledgement of personal performance, motivations of
behaviour, etc.), there might be the inclination to provide more socially desirable or acceptable
answers (Mensch and Kandel, 1988). Employees who reported low employer brand promise
expectation fulfillment or no expectation could, in spite their less than positive sentiment, be
indicating higher (more positive) ratings of their organizational citizenship and/or task
performance(s) unconsciously, as they truly viewed themselves and their performance more
favourably than reality (Fisher and Katz, 2000) or they had a strong psychological need for the
preservation of positive self-image. The action could also be conscious due to the possible concern
with the lack of survey anonymity and that their responses would be scrutinized by their employer
since the survey was approved and made accessible by the employer. Another reason for such
result could be the fact that employees were also owners of the organization, thus felt either
embarrassed to indicate even to themselves that they were not pulling their weight or felt a need
to answer positively to live up to the organization’s best employer, awesome organization
reputation.
There was a ceiling to the highest possible rating for the organizational citizenship and task
performances. Should respondents reported high ratings of performance regardless of their actual
performance or of their reported level of employer brand promise fulfillment, results would pool at
the high end of the performance ratings, thus reducing the true difference in the mean scores of
the organizational citizenship and task performances between employees with high employer brand
promise expectation fulfillment and those with no expectation or low employer brand promise
expectation fulfillment.
Some results of the difference in performance scores, such as those for hypotheses 2c and 2f, did
not achieve statistical significance to the level of p = 0.05 but were hovering close, for example, at
p = 0.059. The prediction is that with a larger sample, one would likely gain statistically significant
results. Because they were not statistical significant to the level of p = 0.05, they were included in
the aggregate assessment of effect as “non-influence”.
The implication of this could be significant in that the true difference in performance results
between employees with high employer brand promise expectation fulfillment and those with no
expectation or low employer brand promise expectation fulfillment might be much larger than
reported by the survey respondents. This in turn would mean that the influence of employees’
perceived high fulfillment of employer brand promises on their organizational citizenship and task
performances could be stronger than found in this study. In terms of how much stronger the
influence might be, is yet unknown.

235
In order to verify the speculation of a stronger than reported influence, one could conduct a study
with a much larger and diverse samples from different organizations and/or conduct investigations
where employees’ performances are observed and measured by other means than self-report
and/or by other parties such as one’s supervisor. Determination of an employee’s level of
performance often occurs at the end of a designated period after the employee has had the
chance to consistently demonstrate the expected behaviours or actions. Such is also true for the
determination of the level of performance for organizational citizenship behaviours and task
actions. As such, further studies to observe and verify the influence of employer brand promise
fulfillment on employees’ organizational citizenship performance behaviours and task performance
actions can be longitudinal in design.
Possible reasons for the noticeable disparity in results between organizational
citizenship performance and task performance
The more interesting question from the research findings is why employees’ organizational
citizenship performance was more noticeably influenced, both in terms of degree and scope, by
their perceived level of employer brand promise fulfilment, than their task performance?
Task performance is considered an in-role performance in that an employee is formally expected
by his/her employer to fulfil the specified duties and responsibilities of his/her job description
(Williams and Anderson, 1991) in exchange for the eligibility to keep his/her employment and get a
regular pay cheque. The understanding here is that if the employee fails to fulfil his/her required
job duties and responsibilities, he/she will immediately or eventually lose his/her employment. As
such, the fulfilment of required job duties and responsibilities is deemed compulsory rather than
discretionary, should one wishes to keep his/her job. In this situation, the employee’s main or even
sole motivation for fulfilling the required duties and responsibilities of his/her position comes from
his/her desire or need to keep his/her employment with the organization. Additional motivation
from other sources or lack thereof might have minimal influence on the employee’s commitment to
fulfilling these required obligations. In short, regardless of whether the employee feels that his/her
expectations of specific employment promises have been met or that he/she has a desirable and
distinctive work experience, the employee will still be expected by his/her employer to fulfill his/her
required job duties and responsibilities in exchange for continued employment. In return, the
employee will fulfil these required job duties and responsibilities in response to the motivation of
having continued employment. Termination of employment would result in the loss of not only
one’s livelihood but also one’s reputation and to some degree, self-esteem - factors that are likely
to be strong performance motivators for many employees. As such, it is conceivable for employees
to at least perform their essential duties as required, regardless of whether their expectations of
the employer brand promises are adequately or not adequately met.
Another contributing factor to employees’ task performance is their skills and ability to do what
needs to be done. Should employees receive the proper training and support in developing and

236
executing their work tasks, as appeared to be the case at BOB34, and they are motivated by the
prospect of keeping their employment, they could perform well in their required obligations,
regardless of their perceived level of employer brand promise fulfillment.
These factors might explain why statistically significant differences in the level of task performance
was scarcely found between employees whose employer brand promise expectations had been
adequately or more than adequately fulfilled and those whose expectations had be inadequately or
not at all fulfilled or those with no expectations at all.
Organizational citizenship performance, on the other hand, is considered an extra-role (outside of
one’s formal job requirements) performance because it is discretionary and performed at the
employee’s own volition without being required to do so by their employers (George and Brief,
1992). In such situation, one can argue that the employee would have to feel motivated enough to
not only do their required job duties well but also take on extra activities and obligations that is not
required of them. This is assuming that the employee also has other personal obligations in his/her
life to which he/she has to attend. As such, the “extra” motivation needed to carry out these extra-
role organizational citizenship activities and obligations could certainly be affected by how good the
employee feels about the organization and/or how well the organization has taken care of his/her
needs and expectations. After all, an employee can, in general, still keep his/her employment by
fulfilling all of his/her required task obligations without having to go the extra mile to take on non-
required activities or obligations. With this understanding and based on the results of the survey,
an employer can likely prompt more35 frequent and/or consistent performance of extra-role actions
and behaviours among more employees if it offers employee-desired employment propositions and
consistently fulfils its promises to employees.
It is noted that some organizational citizenship activities and behaviours might be a requirement in
certain positions and should that be the case, these specific organizational citizenship activities and
behaviours would be treated by the employer as compulsory in-role obligations rather than
discretionary extra-role obligations.
Likely mediator of performance in this case
The quantitative results showed a generally higher degree of influence by employees’ perceived
high fulfillment of employer brand promise expectations on their perception of the desirability of
their employment than on their organizational citizenship performance or task performance. This
suggests that high fulfillment of employer brand promise expectations might have more impact on
how employees feel about their employment with the organization and less on how they actually
perform in their job. However, results also showed that employees who perceived the presence of
34 Based on qualitative data and analysis 35 The word “more” instead of “all” or no word is used in recognition of the fact that some employees might, by personal nature or self-motivation, still go the extra-mile to provide extra-role service regardless of their satisfaction with their employer or employment.

237
what could be labeled as desirable employment (as reflected by their sense that their employment
experience was both desirable and distinctive, their organization was a great place to work, their
desire to spend the rest of their career with their organization, their lack of frequency in thinking
about leaving their employment with the organization), reported better organizational citizenship
performance as well as better task performance36 that employees who did not perceive the
presence of desirable employment. This in turn suggests that employees’ perception of the
desirability of their employment influences their level of organizational citizenship and task
performances.
When put together, both results above suggest that an employer’s ability to adequately or more
than adequately fulfill its employer brand promises will likely have a noticeably positive influence
on employees’ perception of the desirability of their employment and this in turn will positively
affect their organizational citizenship and task performance efforts.
One aspect of employer brand promise fulfillment worth repeating is that the act of delivering on a
promise itself is a demonstration of trustworthiness and in the case of employment promises, it is
also fulfillment of the psychological contract that the employer has established with its employee
(Robinson, 1996). The act of employer trustworthiness has shown to strengthen an employee’s
commitment to and engagement with its employer, which in turn also strengthens their work
performance, particularly organizational citizenship performance (Coyle-Shapiro, J. and Keller,
2000).
The implication here is that while the direct relationship between employer brand promise
fulfillment and employee performance was not statistically proven to be strong, it did not mean
that the organization’s efforts were futile and of little importance. In this case, there were
statistical indications that the influence of employee brand promise fulfillment on employee
performance were mediated by employees’ perception of the desirability of their employment.
Higher level of performance in more number of work behaviours and actions were demonstrated
by employees when they felt that there were opportunities to build their life long career with their
organization, their organization was a great place to work, they had a distinctive and desirable
work experience at the organization, and that they would prefer to stay rather than leave. It is
likely that their sense of the employer’s trustworthiness due to its ability to consistently deliver on
its employer brand promises also contributed to the enhancement of their performance. As such,
there is legitimate value for organizations to continue their efforts to ensure that they deliver on
their employer brand promises because when they positively affect the enhancement of mediators
of employee performance such as factors that strengthen the desirability of employees’
employment, with the fulfillment of its employer brand promises, they in fact also positively
influence the enhancement of employee performance.
36 Except for the notion of wanting to spend the rest of their career with the organization.

238
What are the factors present in the content and delivery of employer
brand promises and how might they influence employee performance?
The qualitative data analysis and interpretation led to the conclusion that there were two sets of
factors in BOB’s employer branding efforts that could have influenced employee performance.
The first set of factors were associated with the manner in which BOB viewed the employment
values and benefits offered to employees. Instead of looking, categorizing, and selecting
employment values and benefits based on their conventional functions - economic, functional,
interest value, organizational environment, social, psychological, and/or symbolic - such as
presented in extant literature, the organization viewed the development and enhancement of
employee performance as a holistic and very human venture. Accordingly, it viewed and
categorized employment values or benefits in an employee need-centred manner consisting of
factors that works inter-connectedly and in tandem to build and address the needs of the whole
human person, thus allowing the person to develop in a holistic manner. These factors were
labeled Employee Benefit Content Factors and were identified to be:
Factor of personal sustainability
Factor of connectedness and belonging
Factor of opportunities and growth
Factor of personal stake and influence
Factor of significance and esteem
Based on the qualitative analysis, these factors could have positively affected employee
performance by: ensuring that employees’ basic employment sustainability needs were met so that
they did not become a factor in the employees’ focus on other employment and development
priorities; expanding or improving employees’ work-related knowledge and skills so that they had
the ability to do their work well and to advance; motivating employees to perform well with various
targeted incentives; monitoring performance through various means and support; as well as
strengthening mediators of performance, particular employees’ sense of commitment and
engagement.
The second set of factors were associated with the organization’s recognition, hence preservation,
of actions and safeguards within its employer branding process that ensured the effective delivery
of the organization’s proposed employment values or benefits to its employees. For this employer,
the factors, labeled Employee Benefit Materialization Factors, were identified to be:
• Factor of brand championship
• Factor of branding control
• Factor of stakeholder awareness, selection, consultation
As explained in the qualitative component of the study, these factors might or might not have a
direct influence on employee performance, however, their absence or inadequate presence would

239
have a direct impact on BOB’s ability to effectively fulfill its employer brand promises and this, in
turn, could reduce, slow down, or even fully inhibit the enhancement of employee performance
and mediators of performance.
What is interesting and worthy of further discussion on this subject is how employees’ performance
could have been further affected by the manners in which the organization view and approach
employer branding. These were found to be:
• The view of employee performance enhancement as a holistic, continuous, inter-connected
endeavour.
• The intentional incorporation of the element of employee performance enhancement in the
design and fulfillment of employer brand promises.
• The recognition of the need to be authentic, selective, and not be the best employer to all
people.
• The leveraging of it unique 100% employee-owned organizational structure and Principals
and Associates system to layer and inter-connect its employer brand promises in order to
intensify employee commitment, engagement, and performance over time.
The view of employee performance enhancement as a holistic, continuous, inter-
connected endeavour
Firstly, this deemed best-of-the-best employer, BOB, saw the development and enhancement of
employee performance as a holistic and continuous endeavour where employment benefits and
programs were factored, coordinated, and facilitated to work inter-connectedly and in tandem to
continually engage as well as develop employees in order that enhancement occurred not only with
employees’ work-specific performance but also their overall capability as well as commitment to
and engagement with the organization. BOB saw its efforts to brand to and engage employees as
not having any end date, even when employees leave the organization. They called their
continuous engagement and development of employees the “cradle to grave” philosophy and felt
that such continuous effort would enable the organization to build a committed (even when the
employees might not be working for them at the time), capable, flexible, and consistently high
performing workforce that would be ready to work competently and effectively to tackle any
emerging organizational goals or challenges.
Employee performance enhancement initiatives have often been designed from the perspective of
the organization, specifically upon asking the questions: What organizational and business unit
results does the employer want to achieve? What do employees need to do in their respective job
and within the organization to help achieve these targeted results? How do we as the employer
ensure that they deliver on what we expect? At times, employers would ask employees for their
opinions on what they need in order to improve their performance in a specific area or for a
specific task. Upon accumulating such information for the different organizational and business unit

240
results that the employer wishes to achieve, efforts would be made to create incentives to address
employees’ performance for each targeted result or for a combination of results.
Very rarely, however, would most organizations truly look at employee performance enhancement
as a partnership endeavor where an employee is nurtured and developed as a whole being,
starting not from the basis of what the organization needs in order to achieve its results but from
what an employee – a person, may need in order to remain overall engaged and productive in
his/her work relationship with the organization. This would mean addressing a person’s needs
holistically instead of piece-meal based on targeted business results and doing so would involve
helping the employee sustain his/her employment relationship with the organization, establish a
supportive work family, build a capable self and a strong future, and in return be the best that
he/she could be for the employer not just in his/her specific job but also as a whole, because
he/she is in a significant, long-term relationship with the organization.
It is important to highlight that BOB’s holistic approach to enhancing employee performance
through its employer branding efforts were not all related to direct performance expectations or
requirements. In fact, its holistic view of and approach to employee development appeared to be
based firstly on establishing employee commitment and engagement, then on strengthening
overall personal and professional development, followed finally by ensuring work performance.
While no indication was given that the organization would tolerate low performance from an
employee while he/she went through the process of development, there were strong indications
that the organization was not interested in creating strategies that would focus only on the
enhancement of targeted work performance. By focusing on the strengthening of employee
commitment and engagement as well as on overall individual development, the organization had in
fact targeted the enhancement of known mediators and moderators of performance that in turn
could be expected to solidify the results of the efforts that the organization put in place to improve
formal work performance.
In BOB’s case, their declared organizational values and corresponding organizational practice of
caring for their employees from cradle to grave as well as of having a relationship with their
employees throughout their career regardless of whether they were still employed at BOB reflected
a good intent and equally good effort to not only enhance employee performance but also build a
sustainable partnership with each employee that entered into an employment relationship with the
organization. As a result, a very large majority of employees were, according to various evidence
presented in this case study, productive, engaged37 in ensuring that their organization remained
the best in the industry year after year, proud of being a member of the organization, and
responsive to maintaining a relationship with the organization even when they were no longer
employed at the organization.
37 The organization’s 2012 Gallup Q12 employee engagement results with 90% participation rate showed of 80.74%.

241
The intentional incorporation of the element of employee performance enhancement in
the design and fulfillment of employer brand promises
The second contributor to the enhancement of employee performance in BOB’s employer branding
efforts was likely its intentional incorporation of the element of employee performance
enhancement in the design and fulfillment of its employer brand promises.
Not surprisingly, it would be hard for employer branding or almost any other organization program
or initiative to have significant influence on employee performance if that is not one of the
objectives or deliverables of the program and it has not been incorporated in the design and
delivery of the program. The publicly held assumption that effective employer branding would lead
to better employee performance would not just automatically materialize itself. As mentioned in
earlier paragraphs, an organization’s employer branding strategies could be designed with the
objectives of employee attraction and retention alone without delving into performance
enhancement. In such cases, an organization can consider itself to have an effective employer
branding structure if it has been successful in attracting and retaining employees with an attractive
employment value proposition that does not involve achieving great employee or organizational
performance.
It is highly likely that employee performance enhancement could only be made possible with
concerted effort on the part of employers to intentionally incorporate specific objective and plan for
enhancing employee performance within the design and delivery of each of its employer brand
promises. The element of employee performance enhancement should likely not be limited to
direct work performance expectations and instead should include the strengthening of mediators
and moderators of employee performance, as has been done by BOB. As shown in the qualitative
data and supported by the quantitative results, BOB’s active incorporation of the element of
performance enhancement in the design and delivery of almost all of its employer brand promises
generated positive influence on mediators of employee performance as well as on employee
performance itself.
The recognition of the need to be authentic, selective, and not be the best employer to
all people
The third aspect of BOB’s approach to employer branding that could have retained rather than
enhanced strong performance was its recognition and acceptance that it could not be the best
employer to all employees and instead would focus on being authentic to its core characteristics
and to designate more of its resources to creating a distinct employment value proposition for its
targeted best-fit employees.
The uniqueness of each organization’s employment value proposition was made clear to the
researcher not from the empirical results but from the process of identifying BOB’s set of employer
brand promises. As reflected in the qualitative data, so many factors came together in determining,

242
delivering, evaluating, and upgrading the employment benefits that the organization offered its
employees. In order to ensure that the employment benefits offered were meaningful, relevant,
and impactful in terms of employee retention and performance enhancement, BOB spent much
time and effort in monitoring and attempting to better understand the organizational and core
workforce characteristics that made BOB what it was and what it needed to be in order to remain
successful.
Firstly, an organization’s core workforce possesses a unique combination of characteristics in terms
of factors such as types skills, level of education, age and gender proportions, family
configurations, ethnicity, and many others including but certainly not limited to generational
influences on aspects such work ethics, view of life and work, personal priorities, and so on. While
different organizations may share some of the characteristics of these factors, the combination
possessed by each organization is likely very different. The characteristics of each of these factors
may change over time depending on the organization’s strategic and operational changes.
Secondly, each organization itself possesses a unique combination of characteristics in terms of
factors such as type of industry or professional field, internal culture and value, general leadership
style, management practices, geographical dispersions of operation, and many others. Again, while
different organizations may share some of the characteristics of these factors, the combination
possessed by each organization is likely very different.
The employment value proposition offered by an organization, its ability to deliver on the content,
and employees’ reception of it are very likely affected by an intricate overall combination of both
unique organizational and workforce combinations of characteristics above. Since so many
organizational and workforce characteristics are involved in the making of an organization, the
likelihood of any two organizations sharing the same distinct combination of organizational and
workforce characteristics are slim to possibly none. As such, the specific employment benefits
deemed essential and performance enhancing for the core workforce of one organization might be
very different than those deemed essential and performance enhancing for the core workforce of
another organization. Trying to adopt the same configuration of employment value proposition
used by one’s successful competitor or trying to coordinate a set of employment value proposition
based on what might be found as “most employee satisfying/motivating benefits” by practitioner
research or even by academic research without first taking into consideration its own distinctive
combination of characteristics could create a very noticeable authenticity gap between the true
essence of the organization as well as what it can provide and what it tries to provide or to become
in order to compete for good employees. In such cases, the primary concern is not on the
employer’s ability to deliver on its employer brand promises. Rather, it is on the employer failure to
recognize as well as capitalize on who or what it is in the design of its employment value
proposition. Instead, it tries to adopt and deliver on employment value proposition created and/or
shared by others with characteristics of others or with no unique characteristics at all, thus
diminishing its own distinct and authentic characteristics in its employment value proposition.

243
Ultimate, this could result in failure to fully deliver on the value proposition, great disappointment,
and loss of investment.
In addition to taking into consideration its unique combination of organizational and workforce
characteristics in the creation and delivery of its employment value proposition, BOB recognized
and accepted the fact that it could not be a best choice employer for all job applicants and even
employees. In the management interviews, respondents were consistently clear about hiring best-
fit employees. Such employees would be best-fit for BOB but might not be best-fit for other
organizations. The presence of necessary skills to do their job would be a given rather than an
option. However, they were best-fit in terms of sharing the same values, priorities, work ethics,
and worldview as BOB’s leadership team and core workforce. As a result, the employment value
proposition painstakingly tailored for this targeted group of best-fit employees were seen by these
employees as meaningful and resonated authentically with who they were, what they stood for,
and what they needed. This in turn, created a desirable and distinctive employment experience for
this targeted group of employees. Given the same employment value proposition, other groups of
employees might not feel that it resonated with their values and needs and in turn might not enjoy
a desirable and distinctive employment experience. In this case, aside from some more genuinely
unique benefits such as the Principal and Associates System, the 100% employee-ownership
structure, the highly consultative decision making approach, and the many opportunities for cross-
division work, these employees’ sense of distinctness of in their work experience likely also resulted
from the fact that they felt the organization “gets them”, what they were about, and what they
needed in order to thrive – a sense they possibly never quite got from other employers.
The leveraging of its 100% employee-owned organizational structure and Principals
and Associates system to layer and inter-connect its employer brand promises to
intensify employee commitment, engagement, and performance over time
The fourth aspect of BOB’s approach to employer branding that could have enhanced employee
performance both directly and indirectly was its 100% employee-owned structure and Principle and
Associates system. In combination, it used layering and inter-connection of its employer brand
promises to intensify employee commitment, engagement, and good performance over time.
While not identified by any one respondent in the management interviews, a conclusion gained
from the 19 interviews was the concept that through its 100% employee-owned structure and
Principle and Associates system, the organization was able to engage in what could be termed as
“multi-bind branding” where the organization used various benefits and provisions throughout a
noticeable portion of the employees’ tenure at the organization to engage and “bind” an employee
to the organization. Such engagement escalated and binding intensified when the employee
became more personally involved and had a higher personal stake in maintaining the well-being
and sustainability of the organization.

244
Potential candidates were first attracted to the organization by its various brand promises. Majority
of the promises might satisfy an employee’s needs when consistently fulfilled, however, they would
not necessarily bind an employee to the organization for any extended period of time or prompt
better individual performances. In order to be truly bound, an employee would have to feel that
he/she owns something that is of significance to him/her and that to have to leave the
organization or to underperform for whatever reason would put his/her ownership of that
something at risk.
In the case of BOB, any individual that was an employee, regardless of rank, would have the
opportunity to own company shares. Company shares were sold exclusively to employees. Being a
part owner of the organization was BOB’s first significant effort to positively bind the employee to
the organization.
In this 100% employee-owned structure, an employee’s sense of ownership was augmented by
the fact that majority of organizational decisions had to be vetted through various employee
groups. Group consensus and collective decisions was deeply ingrained in the process and culture
of the organization, allowing employees to feel that they had some genuine owner influence in the
decisions made by the organization. This first effort of binding through ownership was augmented
by the second binding through the allowance for genuine collective decision making. Continue
engagement of the employee was then generated through its many high-interaction employment
benefits such as mentorship program, cross-division work, advancement opportunities, large-scale
community engagement projects, and more. As mentioned Chapter 6, these benefits worked inter-
connectedly and in tandem to both develop and engage employees.
While employee development and engagement continued, the third effort of binding occurred
through the organization’s very unique Principals and Associates system. Employees had to have
proven themselves as a superior performer as well as a true subscriber of the organization’s values
and culture before being eligible for nomination into the group. Such demand that came with the
declaration that any employee could become an Associate and then a Principal if he/she was
committed to attaining it, was itself a sense of informal binding that kept employees hopeful and
working towards stronger engagement with organization. When consistent engagement was
proven, and employee could be nominated and accepted into the exclusive group consisting of
12% of the organization’s workforce and once an employee became an Associate and later a
Principal, he/she retained substantially more organizational shares (76% of company shares owned
by this group) as well as increasingly stronger influence on organizational decision, thus further
strengthening their bind or attachment to the organization. By the time an employee reached this
level, much would be at stake to lose if they chose to leave or if they were asked to leave due to
various reasons including performance inadequacies. With this group continually safeguarding the
values and culture of the organization and with on-going, highly selective new entries into the
group, the practice of multi-bind branding would continue in the organization, thus preserving the
concept of intensified and escalated employee binding, engagement, and performance.

245
Distinction versus legitimacy – how this shapes the organization’s
employer branding actions
In employer branding literature, there has been much emphasis on being distinct as an employer
and needing to offer distinctive employment value proposition and total work experience (Michaels
et al., 2001; Ewing et al. 2002; Ruch, 2002; Lloyd, 2002; Mosley, 2004; Minchington, 2006;
Moroko & Uncles, 2008) when compared to those offered by other employers in order that the
organization can best attract and retain employees.
The question is, is it realistic for every organization to attempt to be distinct and come up with
distinctive employment value proposition and total work experience in order to attract and retain
good employees? Ultimately, is it necessary for an organization to be distinct and come up with a
distinctive employment value proposition and total work experience in order to attract and retain
good employees, and in the case of BOB, also to enhance employee performance?
In order to determine the answers to these question, one can start off by examining how most
employers try to develop or enhance their employer brand. For most organizations as well as job
searchers and employees, the benchmark or reference for successful employer branding and
employer branding best practices have been the employers in the “best employers” or “employers
of choice” lists or some deemed-successful employers highlighted by employer branding authors
and consultants. These employers have been repeated hailed by best employer competition
organizers, employer branding consultants, and through some research evidence as: offering more
superior employer brand provisions and/or employer branding practices (Joo and McLean, 2006);
demonstrating the gold standard for best practices in recruitment and retention (The Lawyers
Weekly – Mediacorp Press Review, 2013); being able to attract higher quality workforce (Fombrun
and Shanley, 1990; Rindova et al. 2005); possessing stronger competitive advantage in terms of
reputation (Ainspan et al., 2001; Lenaghan & Eisner, 2005); being able to yield better
organizational performance (Fulmer et al., 2003; Hewitt, 2004); and are ultimately being seen as
employers of choice by potential and actual employees (Joo and McLean, 2006) - when compared
to employers that have not been recognized as best employers or employers of choice. The
recognition of being the best among other employers, especially in a repeated manner, also
reflects the organizations’ ability to develop and maintain highly positive employer reputation and
brand image (Schulte, 2010).
With sale pitches and survey reports from consultants (e.g. Bernard Hodes, 2006; Nigel Wright,
2008; Employer Brand Institute, 2009, 2011, 2014), advice from management and employer
branding authors (e.g. Barrow and Mosley, 2006; Sartain and Schumman, 2006), and papers from
scholars (e.g. Ambler and Barrow, 1996; Ainspan et al., 2001; Ewing et al. 2002; Fulmer et al.,
2003; Harding, 2003; Lievens and Highhouse, 2003; Backhaus and Tikoo, 2004; Berthon et al.,
2005; Miles and Mangold, 2005; Ogilvie, 2006; Martin, 2007; Moroko & Uncles, 2008 and more) on
the importance of effective employer branding in attracting, retaining, and developing our human
246
resources, organizations that are not on the lists, those that want to be on the lists more
frequently, or those that just want to be more effective in employee attraction and retention, might
be driven by choice or by pressure, to adopt some of the employment offerings and practices of
these benchmarked employers, in hope they too can enhance the success of their employer
branding efforts.
Over time, with cross-adoptions by a large number of organizations of the deemed best-practices
of employer branding, employment value propositions and approaches to employer branding will
likely become more alike rather than different. By attempting to meet or get close to the gold
standard of employer branding exhibited by the best employers or employers of choice, these
employers are in fact striving to become one of the best employers or employers of choice. If and
when they achieve this, they would be seen as “in”, as one of them, and ultimately as a legitimate
best employer or employer of choice.
Employers might start out wanting to be different and distinctive compared to others but over
time, their efforts to become like the best employers and employers of choice would lead them to
be more alike than different, but at the same time, they also become more recognized and
legitimate as a member of the best employers or employers of choice club.
The neo-institutional theory of legitimacy was defined by Suchman (1995) as a generalized
perception or assumption that the actions of an entity are desirable, proper, or appropriate within
a set of prevailing, socially constructed system of norms, values, or beliefs. Organizations conform
to such external conditions in order to be accepted as legitimate and to enhance their chances of
survival. According to DiMaggio and Powell (1983), when an organization becomes a legitimate
leader or contender in the industry, such as the best employers or employers of choice, other
organizations will try to adopt similar practices with the hope and expectation that they too can
have the extra strengths and advantages possessed by the legitimate leading organizations. In the
case of employer branding, the theory would be that employers that are not successful in employer
branding or that want to be more successful in employer branding will try to adopt the employer
branding practices and employment value propositions used by the deemed legitimate leaders of
the pack, which are the recognized best employers or employers of choice. By doing that, these
organizations hope and expect to achieve not just more success but high success in their employer
branding efforts.
DiMaggio and Powell (1983) identified the following three common types of institutional
isomorphism or reproduction in organizations: (a) mimetic, (b) coercive and (c) normative. The
one most applicable to the situation of employer branding and competition for employees in a tight
and/or volatile market would be mimetic isomorphism, where the more uncertainty that is faced by
an organization, the more it will model its structures and processes after other successful
organizations. Organizations that employ many certified professionals, such as BOB, might also
experience pressure for normative isomorphism where conforming to academic and credentialing

247
requirements are the norm, regardless of one’s employer branding approach. One concern
highlighted by Scott and Meyer (1991) is that over time, such mimicry or isomorphism would result
in the loss of diversity.
The potential convergence of employer branding approaches and employment values provided by
employer need to be recognized. The lack of noticeable individual distinction now or in the future
for an employer does not equate to employer branding failure or doom. In the case of best
employers or employers of choice, distinction can occur in groups – groups of best employers or
employers of choice. Striving to be legitimate can in fact be a strategic and valid goal of employer
branding. Distinction for an organization can occur not necessarily as the most unique or best
among other employers but as an employer that offers and consistently delivers on employment
promises that fulfill the holistic human needs of its targeted employees. Due to the many variables,
factors, and actors that are involved, the fulfillment of employer brand promises is not an easy
feat, hence the constant concern by employees with employers’ ability to sell but not deliver on
their promises. The ability to fulfill promises of employee-valued provisions in a consistent basis
will unavoidably distinguishes an employer among others. One could equate this as being in the
group of people who obtained their doctoral degree versus those who obtained a master but not a
doctoral degree, a bachelor but not a master or a doctoral degree or those with only a high school
diploma. Due to the incrementally harder work and other extra variables involved in obtaining a
higher degree, there is the least number of people in the doctoral group and this distinguishes
them from those with other lower levels of degrees.
Ultimately, employers should focus on how to be a great employer to its targeted employees and
not be overly concerned with being highly distinctive. Many great employers, such as BOB, are able
to retain and develop great employees not because they are noticeably different than other
employers but because they see and consistently address the holistic needs of their employees.
They are generally known as a good or great employer for which employees want to work. One
should note that not being independently distinct is not the same as not being authentic. As
discussed in an earlier section, being authentic and seeking to hire and retain employees that
subscribe to the same values and qualities are essential aspects of employer branding success.

248
Relevance and Contribution of Findings to Existing
Knowledge/Literature
A large majority of academic literature and almost all of professional literature on employer
branding have focused on employee attraction, retention, and features of employer brand (e.g.
McKenzie and Glynn, 2001; Collins and Stevens, 2002; Berthon et al., 2005; Kateon & Macioschek,
2007; Lievens, Van Hoye & Anseel, 2007; Bhatnagar & Srivastava, 2008). As well, from a process
perspective, the definition and scope of employer branding actions have been limited to the
functions of communication of the employment values offered (e.g. Ewing et al., 2002; Lloyd,
2002; Backhaus and Tikoo’s, 2004) or employer image building (D’Arcy, 2003; Kateon &
Macioschek, 2007), with little or no reference to employer brand promise delivery or performance
enhancement.
Hence, the first relevance and contribution of this study to existing knowledge is the fact that it
investigates an aspect outside of the more commonly defined scope of employer branding and
adds to the still limited empirical literature that is specifically or generally focused on the
relationship between employer branding and employee performance (e.g. Fulmer, Gerhart, and
Scott, 2003; Davies, 2007; Bodderas et. al., 2011). More specifically, the findings add to existing
knowledge by offering particular insight into:
1. The possible influence that the fulfilment of employer brand promises have on employees’
organizational citizenship performance and task performance.
2. The possible influence that the fulfilment of employer brand promises has on employees’
perception of the desirability of their employment and in turn, the influence of this
perception on employees’ organizational citizenship performance and task performance.
3. How employee performance could have been influenced by the factors and process of
employer branding.
There are consistent mentions of the impact of employer branding on employee performance but
they are largely based on assumptions of related HR studies (e.g. employee engagement,
commitment and performance) rather than empirical studies directly on employer branding. Hence,
the second relevance and contribution of the research findings to existing knowledge is the
empirical evidence which lends some verifiable support to the mostly assumed influence of
employer branding on employee performance, as presented through some anecdotal reports, self-
reports by organizational representatives (Martin, 2007), and marketing materials by employer
branding consultants (e.g. Nigel Wright, 2008; Lombardi for Aberdeen Group, 2009).
The assumption that effective employer branding has a positive influence on employee
performance is not that surprising or without basis as there is a significant number of human
resource management research that link particular human resource management strategies,

249
systems, culture, climate, leadership, or some other aspects to better employee performance,
some of which are through the influence of these aspects on the mediators of performance such as
job satisfaction, commitment, and engagement (e.g. Guthrie, 2001; Medlin et. al., 2008; Albrecht,
2012; Biswas and Varma, 2012, Aslam et. al., 2013; Anitha, 2014; and many more). However, the
complex and interrelated nature of employer branding needs to be taken into consideration and as
a whole, employer branding appears to be much more intertwined and intricate than just any one
function of human resource management. It cannot simply be installed as isolated components and
be expected to work effectively as is, especially on the enhancement of employee performance,
regardless of how well designed each isolated component might be. In order to have an impact on
employee performance, the complex and many interrelated components of employer branding,
along with relevant moderating and mediating conditions, would likely have to be managed and
maneuvered in tandem, in a holistic and complementary manner. Even if there is a recognition of
the complex and interrelated nature of employer branding behind the assumption of its influence
on employer branding, there has been a noticeably lack of explanation on how such influence
might be materialized through that complex and interrelated system. This doctoral study offers one
insight into how such influence could have materialized. It is likely that similar studies of different
organizations or different studies on the subject would offer more or varied insights that, in
combination, would enrich our knowledge of the relationship between employer branding and
employee performance.
The third relevance and perhaps more important contribution of this study to knowledge is the
empirical finding that the influence of employer brand promise fulfillment, deemed the most
important aspect of employer branding by many, on employees’ organizational citizenship
performance is general small leaning towards moderate and on task performance is very small.
Evidence found did support the hypothesis that employer brand promise fulfillment has an
influence on mediators of performance such as employees’ perceived desirability of their
employment. However, the final results on employee performance did not change much.
This finding is meaningful in that employers have been told over and over by well-known employer
branding firms and even some scholars of the significance of effective employer branding in
ensuring strong employee performance, either directly or indirectly. Many employers around the
world have jumped on the employer branding bandwagon and either have or will spend large sums
on establishing or enhancing an employer branding program in their organizations. In fact, the
2014 Employer Branding Global Trend Study report produced by Employer Brand International
showed that 38% of its 1143 respondents from around the globe indicated they plan to increase
the investment they put into employer branding.
Ultimately, what true returns are employers getting for their employer branding investment,
particularly in area of organizational citizenship and task performance enhancement? The returns,
at least on organizational citizenship and task performance enhancement, could be much less than

250
expected and employers might need to think more carefully and more realistically about the
ultimate end goals of their employer branding initiatives.
It should be noted again that results in the study suggest a stronger employer brand promise
fulfillment influence on organization citizenship performance than on task performance. Theories
for this was provided in a former section of this chapter. This finding is also an interesting addition
to knowledge.
The fourth relevance and contribution of the research findings to existing knowledge is its
discovery and proposal of another way to view and treat employment values and benefits. The
existing view of employment values and benefits has been based more on functional categories –
economic function, development and application function, social and psychological function, and so
forth. The assumption is that an employer will select benefits from each or some of these
categories to fulfill the functional needs that employees may have. They might be provided to
employees as a cluster of independent benefits, formed with little or no inter-connection between
the activities and/or outcome of one benefit and another. The challenge is that viewing and
providing benefits in this manner does not necessarily fulfill a person’s needs in a holistic way and
gaps of immediate or subsequent level needs can often be missed. This can very likely cause an
employee to feel that there are inadequacies in some or all factors of work and life that determine
their retention and motivation in a job.
There is not necessarily one right way to look at employment values and benefits as they are
encountered by different parties coming from different perspectives and with different points of
interest. An employer might take a macro organizational view of employment values and benefits
and examine how they may affect the organization from a human, material, financial, and targeted
outcome perspectives while an employee or job applicant might take a more micro personal view
of employment values and benefits and examine how they may affect his/her immediate as well as
longer term needs and aspirations. The way that an employer views these employment values and
benefits could shape the types of values and benefits chosen as well as how they are organized
and delivered. In the case of BOB, the factor of personal sustainability was the foundation to the
other factors and this factor contained various types of benefits – financial, functional, work-life
balance, and work environment. As well, there was a strong emphasis on the need to deliver the
benefits within each factor in tandem and in an inter-connected manner as they work off and
augment the effects of one another to fulfill the employees’ needs as well as develop them.
Around ¾ of the employment benefits offered by BOB, while competitive, were not particularly
distinct or unique. However, it was BOB’s view and treatment of the employment value and
benefits that made their approach a new addition to existing knowledge on the subject.
Ultimately, one might determine how best to view and organize employment values and benefits
by asking who or what they are for, what goals one hopes to achieve by providing them, what

251
forces or conditions might mitigate that which is provided and how it is provided, and how to best
achieve the goals with the values and benefits present and the forces and conditions that are
mitigating the situation.
The sixth relevance of the research findings to existing knowledge is its contribution to literature
on human resources management practices of employee-owned organizations. Latest data
provided by the Employee Ownership Association of United Kingdom indicates that the number of
employee-owned businesses in the United Kingdom is growing by just under 10% per year and
contribute £30 billion GDP to the UK economy each year (2012 data). Almost half of the
organizations in Britain it surveyed in 2014 had become employee-owned, directly or indirectly,
since 2010. In Canada, where this study was conducted, the trend for employee ownership is also
on the rise. Forty percent of the organizations on the 2011 Canada Profit 200 list were employee-
owned (Advantage Magazine, 2013). Three of the five deemed best-of-the-best employers
shortlisted38 for this study were employee-owned with two, including BOB, being 100% employee-
owned. The amount of human resources management literature focused on employee-owned
organizations is still limited. The number focused on the subject of employer branding within
organizations with significant employee ownership could hardly be found.
With the rapid growth in employee ownership, there is certainly value in studies that shed light on
how employer branding practices are done in employee-owned organizations and whether
employee ownership plays a role in shaping these practices or in influencing the outcome of these
practices. Should it be found that employee ownership does play a role, such as found in this
study, the interesting questions would then be how it played a role and if there are ways that
either the approaches or the effects could be reproduced in organizations with other forms of
governance and ownership structures.
As a whole, this in-depth case study was a direct effort to respond to the call for investigation into
the relationship between employer branding and employee performance. The research generated
new knowledge and understanding not just on whether and to what extent relationships existed
between employer brand promise fulfillment and organizational citizenship as well as task
performances, but also on why and how such relationships were materialized and preserved within
a complex and organic organizational environment. The complexities and interactions within and
surrounding employer branding needed to be understood before any viable theories of
relationships could be derived and further tested. This case study allowed the researcher to
explore and generate insights on these complexities and on how employee performance was
affected. Such new insights have enable the researcher to address some of the key unanswered
questions that ultimately contributed to the advancement of scholarly knowledge in the matter.
38 See details in Chapter 4 for the shortlisting process

252
Implications for Practice
In addition to contribution to theoretical knowledge, the findings in this study also presented some
important implications for the practice of employer branding.
The first implication is the need for an organization to intentionally include the targeted outcome of
enhanced employee performance and the operational element of employee performance
enhancement in the design and execution of its employer branding plan, particularly in the
development and fulfillment of its employer brand promises. Only in doing so can an organization
be consistently reminded and called upon to address the performance enhancement objectives
identified. As such, it is not enough to simply provide employee with a mixture of desirable
employment values or benefits that have no association, by content or process, with the
enhancement of employee performance because that would likely limit the outcomes of employer
branding to ensuring employee attraction and retention alone.
In order to continually enhance performance and mediators of performance, the design of the
overall set of employment values or benefits should include:
Provisions with different capacities to enhance performance and mediators of performance.
Provisions that are inter-connected and work in tandem to achieve more than one
employer branding objective.
A progressive attachment and engagement plan that would provide formal opportunities
for employees to intensify their personal involvement with organization over time, and by
doing so also escalates their engagement with and commitment to the organization.
Another implication is the need to recognize employee performance enhancement as part of a
holistic employee development endeavour and to therefore view employment values or benefits
from a holistic, inter-connected, individual need-centred perspective instead of from an
independently functional perspective. Each employment value or benefit needs to be assessed as a
part of the whole in contributing to the development of the employee, and be provided in a
holistic, linked-to-others manner, rather than in an isolated À la carte manner.
As a whole, an employer should view holistic employee performance enhancement as a strategic
organizational goal that needs to be achieved and maintained regardless of the organizational and
business unit performance targets of the day. In doing so, the organization is building a high
performing workforce that would enable the organization to continually achieve its performance
goals, again, regardless of the organizational and business unit targets of the day.
The third implication from the research results is the realization that even a best-of-the-best
employer was not able to adequately fulfill the expectations of all employees for all of the

253
provisions the employer had promised. Is it in fact realistic to expect any employer to fulfill all or
even most of its employer brand promises to a level that is perceived as adequate by all or even
over ¾ of its employees? After all, perception of adequacy is highly subjective and can be
influenced by various factors including an employee’s work and life situation on the specific day
that he/she is taking the survey. The answer is likely no but the more important question is
whether employee performance would be noticeably affected if the employer is not able to
adequately fulfill most of its employer brand promises? In spite of the findings of small influence,
the answer to this question could be yes as it indicates a break of psychological contract and trust
for multiple promises. Hence it is important to be both authentic and selective in the selection and
coordination of one’s employer brand promises. Both of these implications are explained below.
The findings in this study indicate that not all employment values or benefits are created equal
when it comes to the enhancement of employees’ organizational citizenship or task performance.
As well, due to the many elements that shape an organization, the employment values or benefits
that would be most effective in influencing performance behaviours in one organization might be
very different that those in another organization. Hence the implication here is that there is a need
for employers to investigate and determine the employment values or benefits that work most
effectively in their respective organizations. In the era of higher management transparency and
accountability, there is pressure for organizational leaders to use their resources in a prudent,
strategic, and cost-effective manner. Instead of spending resources on a variety of employment
values or benefits, an employer might yield a higher performance return by allocating more
resources to performance-enhancing values or benefits and less or none to those that do not,
unless those values or benefits enhance other employee qualities targeted by the employer. Aside
from focusing resources on performance-enhancing values or benefits, employers with a tighter
budget can also consider focusing a larger portion of its finite resources on the fulfillment of the
needs of the core group of competitive-value-enhancing and organizational-sustaining employees
rather than offering a one-size-fits all or all-is-equal type of employment values and benefits to all
employees.
Another practical implication is to be realistic and strategic about the path to being an employer of
choice. It is not realistic, necessary, or even wise for an organization to try to be the best employer
or the employer of choice to all people. Distinction as an employer of choice does not necessarily
mean being an employer that is unique and distinct from all its competitors although this could
certainly happen. An organization can exist within a legitimate group of employers of choice and
distinction as a great employer can be achieved through the offer and consistent fulfillment of
employee-valued provisions.
The more important realization is that an employer needs to focus on employer branding aspects
within its realistic control and employment values or benefits that are within its realistic scope of
provision. This begins with the organization having a clear understanding of itself as an employer.
What is the essence of the organization? How can that be reflected in one’s employer brand and

254
human resources management practices? There is a need to promote one’s self and offer
employment proposition that is in line with its authentic organizational essence, values,
characteristics, and capability to fulfill because not doing so would make it very difficult for the
employer to fulfill its promises.
Being authentic would likely result in the organization appealing to some groups of individuals but
not to other groups, which might be a positive rather than a negative outcome. In order to be
most effective in employee attraction, retention, engagement, and performance enhancement, an
employer should focus its resources and employer branding efforts on targeted best-fit employees
rather than all employees. Best-fit employees are those that identify with and subscribe to the
employer’s authentic identity, values, expectations, and offers. Ensuring person-organization fit
would be the first level of control an employer has to create a positive and productive work
experience for the employee as well as the employer.
One final but important implication to be presented here is the fact that any employer branding
strategies or actions found to be effective or possibly insightful at this point in time might not be so
in the future. As cautioned by Rosenzweig (2007ii), there are factors that mediate one’s decisions,
actions, and outcomes and these include competitors’ actions and level of risk taken by an
organization’s executives. When these come into play at a later time, what is deemed effective
now may be less or more so at that time. Process scholars (e.g. MacKay and Chia, 2013; Langley
et. al., 2013) also presented the same caution and concluded that the specific decisions or
particular series of activities and events that would lead to a projected result at one point might
not be applicable or might even be catastrophic at another time when other activities, events,
entities, players, or factors intervene.
Ultimately, performance is relative rather than absolute (Rosenzweig 2007ii, pg. 60) and
organizations need to be adaptable in decisions and actions in order to stay competitive or even to
survive.
Limitations
There are some limitations in the study that need to be acknowledged. The first being the factors
that might affect the validity of the results and the second being the factors that might affect the
transferability of the results.
Factors that might affect validity of results
Many aspects of a research can affect the validity of its findings. These include but not limited to
what and how data is collected, sources of data, and how data is analyzed.

255
One of the factors that might affect the validity of result in this study is the self-reporting nature of
survey responses. The study asked respondents to declare their level of performance, albeit in an
anonymous manner. That meant an employee had to reflect on his/her own performance and
acknowledge whether he/she had been performing well. Such personal request could prompt social
desirability bias among some respondents. Should that be the case, these respondents would
provide an overly-positive report on how they reacted (Mensch and Kandel, 1988) when
encountering each of the organizational citizenship and task performance scenarios. While these
respondents might have felt assured that no one would be verifying their answers, there could still
be an inclination to provide more socially acceptable answers, possibly because they truly viewed
their performance as better than reality (Fisher and Katz, 2000). Then, there might be some
respondents who did in fact feel uncertain about whether their responses could be read by
someone in the management rank. Should that occurred, these respondents might answer the
questions dishonestly in order to put themselves in a better light or to avoid being viewed in a bad
light. Also as indicated in an earlier paragraph, employees were also owners of the organization,
thus anyone not performing as well might feel embarrassed to indicate even to one’s self that they
were not pulling their weight. Alternatively, they might feel a need as an owner to answer
positively in order for the results to reflect their best employer, awesome organization reputation.
This in turn could skew the performance ratings and overall outcome of the influence that
employees’ perceived employer brand promise fulfillment might have on employee performance.
There might also be a portion of respondents who felt pressured by their managers to participate
in the survey and did so half-heartedly, quickly, and without much thought given to the questions
and responses. Some respondents might experience fatigue part way through the survey and
proceeded to finish up the survey half-heartedly, quickly, and again, without much thought given
to the remaining questions and responses. This again could result in inaccurate ratings that could
affect the results of the analyses.
Another factor that might affect the validity of result is the manner in which the qualitative data
was treated. In the qualitative analysis, there was a need for interpretation by the researcher of
information gained from the management interviews and material review. While some answers to
question were direct and obvious, others were not. As well, some conditions of the employer
branding process were not directly mentioned by interview participants but were reflected through
their descriptions of scenarios, decisions, or actions. The researcher had to make sense of the
information and draw patterns and inferences from them. Even with the triangulation of data,
there would be some degree of subjectivity injected into the formation of the conclusions, which
means that one could not be fully certain of the accuracy, thus also validity, of the conclusions.
256
Factors that might affect the transferability of the results
Another possible limitation of this study involves the factors that might affect the transferability
and generalizability of the results found in the study.
The matter of transferability of results to a larger population has often be challenged in case
studies due to arguments that include: 1) the context of the case is unique and unlike those of the
general population, 2) current findings might not be relevant or applicable when there is a change
in the environment and forces which the findings originally exist.
The context in which a research subject exists could indeed be unique and unlike those of other
subjects. The fact that the case study was done on a fully-employee-owed, generally well-
resourced best-of-the-best organization in Canada could pose a challenge in the transferability of
results to other organizations that are either not employee-owned, not best-of-the-best
organizations, not well-resourced, not a Canadian organization, and/or not similar in
characteristics.
As indicated in earlier sections of the dissertation, individuals in an employee-owned organization,
especially one with 100% employee ownership, likely function in a very different environment and
perhaps also conduct themselves in a very different manner than employees in a non-employee-
owned or even partially-employee-owned organization. The first difference would be that this
organization could offer shares to employees as a proposed employment value while non-
employee-owned organizations could not do that. Employees in the organization might see
themselves as business owners rather than employees and should that be the case, they might feel
the right to expect and the organization, being 100% employee-owned, might feel the obligation to
comply with demands such as fully decentralized decision making, regular consultations, high
“business partner” (managers) accountability and responsiveness in different areas of the
organization, and more. On the other hand, employees in such structure might feel a much higher
stake in the success of the organization, thus would be willing to sacrifice some personal needs in
exchange for the greater good of the organization.
Other conditions that framed the context of the case, such as their highly educated and technical
workforce, their existence in a highly competitive, energy-focused province in Canada, their long-
term orientation towards employee relations and so on, could have affected the way they designed
and organized their employment values as well as the way they executed their employer branding.
From a macro perspective, Canada’s economic status, work culture, government incentives,
employment legislations, and other characteristics might cause employers to behave differently
than employers of other countries when it comes to the activities of human capital management.
Educated Canadian employees, particularly those residing in oil-rich Alberta, where this case study
was conducted, would generally receive high salaries and enjoy a high standard of living. Should
Maslow's hierarchy of needs be used as reference, these employees would likely not have a

257
concern with trying to meet basic physiological or safety needs. The type of employment benefits
they seek would be very different than those sought by employees in less developed or less
resourced countries. What was found to be effective in Canada might not be effective or even
realistic in other countries.
Knowledge gained in this dynamic and unique context enriches our understanding on employer
branding and adds to the literature on not only employer branding but also on employee-owned
organizations, especially fully employee-owned organization. However, the context that shapes the
organization is, in some aspects, unique to this organization, thus the findings in the study might
not be sufficiently transferable to the broader market.
While an organization’s existing context could make results found within the organization not
sufficiently transferable, changing context due to the changes with the forces and conditions that
define the context could also make results from one point in time not transferable to another point
in time.
According to Rosenzweig (2007i, ii, 2009), there is no formula or “timeless principles” (pg 11,
2007ii) that can guarantee an organization’s success in a competitive environment. He posits that
when one encounters ‘successful’ organizations (as typically reflected by financial and market share
performance), one assumes that the organizations are successful because they possess a secret
set of formula, principles, or traits that when applied, would predictably bring about their enduring
success, regardless of other mediating factors. Rosenzweig (2007ii) further argues that mediating
factors such as competitors’ actions and the level of risk taken by an organization’s executives
would directly affect the organization’s performance outcome, at any given time, in spite of any
good formula or traits the organization might have in place. Ultimately, performance is relative
rather than absolute (pg. 60).
Rosenzweig argument has merit in that BOB’s as well as any other organization’s existing employer
branding strategies to influence its employees’ performance can be affected by the organization’s
own increase or decrease in resources and/or efforts put into the existing employer branding
structure. It can also be challenged by the employer branding efforts of other organizations
attempting to recruit and retain the same kind of employees. Other organizations vying for the
same targeted groups of employees can attempt to imitate the same employer branding
approaches or concentrate on the same employer branding priorities and offer the same provisions
to attract and retain these employees. Alternatively, they can use other strategies, focus on other
priorities and offer different provisions that can yield better results. Should this happen, BOB’s
employer branding strategies and process that have been found to work very effectively now to
attract, retain, and develop employees can very possibly be weakened or be no longer effective at
that time.

258
Rosenzweig’s argument of relativity of organizational performance is echoed by process scholars
(e.g. MacKay and Chia, 2013; Langley et. al., 2013), who see the change in context as affecting
the series of activities and events that lead to the anticipated results or performance outcome. As
mentioned in an earlier section of this chapter, they too conclude that decisions or particular series
of activities that are effective in yielding targeted results at one point might not be so at another
time with the emergence of intervening activities, events, entities, players, or factors.
Changes in context at a subsequent time will result in changes to the processes, mechanisms, or
other factors that shape the conclusions we find at the present time. As such, the results in this
and many other studies, especially if they relate to process, change, or strategy, might only be
applicable for a point in time and not transferable to another time.
Transferability of Results is Possible In Some Aspects
While there might not be any timeless principles or series of activities and events that could
permanently ensure an organization’s employer branding success and/or positive influence on
employee performance, one could argue that there are some good practices of effective employer
branding grounded in the research and knowledge of psychology, organizational behaviour, or
employee management, and studied many times over throughout the years. If applied
appropriately, they would likely enhance an organization’s ability to attract and retain employees as
well as influence to some noticeable degree, their organizational citizenship performance and
possibly also other performances. These include:
i. Offering employment provisions that are, as a whole, desired by the specific groups of
employees targeted by the organization.
ii. Building trust by fulfilling one’s employer brand promises and psychological contract with
employees (Robinson, 1996).
iii. Integrating the aspect of employee performance in the design and evaluation on one’s
employer branding program.
The challenge in transferability may lie not so much in knowing these fundamental principles or
practices of effective employer branding but in recognizing that the content items and application
methods of these principles and practices would and should likely be different from one
organization to another. This is because the organic make-up or configuration of every
organization evolves and is different from that of another organization, no matter how alike they
appear to the public. Everything impacts this organic configuration, from employees and systems
of the day to buildings and locations. If an organization simply super-imposes the content items
and application methods of another organization on its own setting, it may be ineffective or even
disastrous depending on how the specific characters and articles that shape the organization’s own

259
unique configuration might respond or adapt to these pre-packaged content items and delivery
methods.
As well, one aspect of successful employer branding appears to be the organization’s ability to
offer employer brand promises that are deemed by its targeted employee groups as not only
desirable but also authentic. Ironically, to achieve authenticity and some degree of distinctness as
an employer of choice and to maintain competitive advantage, the organization’s combination of
employer branding practices, provisions, and overall delivery methods should be organization-
specific and hard to imitate or even non-transferable. It would be difficult for an organization to
hold the contrasting position of being like others (e.g. do what other employers of choice are doing
and offer what they are offering) and being distinctive and authentic at the same time.
At the same time, the knowledge of some fundamental good practices of employer branding as
well as the knowledge of performance enhancement factors identified in this case study can be
transferable to many other organizations regardless of industry, size, or other distinguishing
features that an organization might possess. Being attentive to employees’ development and
growth, sustainability of employment, a reasonable degree of personal influence, sense of
connectedness at work as well as sense of significance in the work they do, can be a common and
foundational practice rather than exceptional practice within an organization’s employer branding
agenda. Their specific content items and methods of delivery of each of these factors might be
different from one organization to another but the rationale and intent behind them could remain
the same across different organizations. These factors are not exhaustive and future research will
likely uncover more performance enhancement factors. Their presence on the agenda would serve
as a reminder as well as a reference in the organization’s selection, design, coordination,
communication, and delivery of employer brand promises.

260
Recommendations for Future Research
In order to determine whether there are commonalities in the ways that proven employers of
choice use employer branding to enhance employee performance, there would be a need to
conduct a larger number of in depth case studies of proven employers of choice. Doing so would
likely also reveal more unique, hard-to-imitate strategies used by these employers of choice to
remain distinctive and maintain competitive advantage. This would enrich our knowledge in the
types of strategies used and also allow us to determine if there is some common approach
employed by these proven employers of choice in their decision making, planning, or design of the
types of strategies to employ. In addition, having a larger group of proven employers of choice
would allow us to re-do the quantitative analyses to determine if the trend of results for the
influence of employer branding on employee performance remain the same. If so, this would
strengthen our conclusion on the degree of influence that the fulfillment of employer brand
promises would have on the level of employee performance. If not, it would be highly important to
examine how and why the trend changes.
To further verify how significant an influence effective employer branding truly has on employee as
well as organizational performance, more and larger comparative studies should be undertaken
between proven employers of choice and employers that have never been recognized as employers
of choice. Comparing the results between employees in deemed-opposite groups of organizations
could likely yield very different conclusions than comparing the results between different groups of
employees within the same organization. If in depth qualitative investigation is also carried out,
such results would shed light on why and how the difference exists. If at all possible, verification of
performance should also extend beyond employees’ self-perception to other more observable and
tangible outcomes.
Further research should also be done on the effects of employer brand image-identity gap on
employee engagement and performance. Would the degree of gap between the intended image
promoted to employees and the actual image promoted to job applicants be different when
measured against the organization’s identity as perceived by employees? What could have cause
the difference and how does an organization minimize the gap? How does this affect the
performance of employees with different amount tenure in the organization? Would image-identity
gap affect mainly new employees or do long-term employees get affected as well? These answers
would enable organization to take a closer look at how to minimize both the image-identity gap as
well as its impact on employee performance.

261
Overall Conclusion
The main conclusion of the case study is that the relationship between employee performance and
employer brand is intricate and complex. It is not straight-forward and it involves obvious and non-
obvious factors. While each organization should remain authentic in its employment value
proposition, it could improve its employer branding efforts by investigating, considering, and where
appropriate, incorporating missing key elements and/or common performance enhancing factors of
employer branding identified in extant literature. The same could be done with the basic
framework and processes of employer branding. However, the intricacies that exist within the
process of employer branding could be highly organization-specific. In BOB’s case, the intricate
way that its employment benefits were chosen, coordinated, and weaved together to enhance
employee performance was precisely what was unique about the organization’s ability to truly
foster long-term employee engagement and productive. Such intricate ability could be hard to
imitate, thus preserving it competitive advantage. The challenge for organizations is to design and
execute such organization-specific, intricate, effective, and hard-to-imitate strategies or approaches
within their own employer branding processes.
As a whole, this study have built on existing discoveries to produce new insights that would:
Serve as a meaningful addition to the growing body of investigative work that has been
done on employer branding as well as to the larger body of knowledge on branding and
human resource management as a whole.
Add new knowledge to the subject of employer branding, as it relates to employee
performance management.
Offer opportunities for critique, further investigations, modifications, and refinement of the
research results by academic and professional researchers from multiple disciplines
including marketing, human resource management, organizational behaviour,
organizational psychology, and others.
Serve as reference for the work of other researchers and/or as a foundation to launch
other related studies in the future.
Contribute to practical management planning and decision making knowledge by providing
organizations with an in depth empirically based understanding of the intricate nature of
employer branding and of aspects that would as well as would not effectively influence
employees’ job performance.

262
REFERENCES Aaker, D. (2004). Leveraging the corporate brand. California Management Review, 46(3), p. 16-18.
Abelson, M. A., & Baysinger, B. D. (1984). Optimal and dysfunctional turnover: Toward an
organizational level model. Academy of Management Review, 9, p. 331-341.
Adsit, D., London, M., Crom, S., & Jones, D. (1996). Relationships between employee attitudes,
customer satisfaction and departmental performance. The Journal of Management
Development, 15(1), p. 62-75.
Advantage Magazine. (2013, Oct, Nov, Dec). Sharing is good business. Retrieved November 1st,
2013 from Advantage Magazine website: http://advantagemagazine.ca/2013/sharing-is-good-
business/
Aggarwal, U., & Bhargava, S. (2009). Reviewing the relationship between human resource
practices and psychological contract and their impact on employee attitude and behaviours: a
conceptual model. Journal of European Industrial Training, 33(1), p. 4-31.
Ainspan, N., Bodenberg, T, Dell, D., Hickey, J., Troy, K. (2001). Engaging employees through your
brand. The Conference Board Research Report, R-1288-01-RR. New York, NY.
Al-Shahi, M. (2008). How contextual factors shape organisational change implementation. PhD
Doctoral Symposium. Brunel University London. Retrieved from Brunel University London
website:
http://www.brunel.ac.uk/__data/assets/file/0005/90590/phdSimp2008MohammedAlshahi.pdf
Albert, S., & Whetten, D. (1985). Organizational identity. In Cummings, L. & Staw, B. (Eds.),
Research in organizational behavior, 7, p. 263-295. Greenwich, CT: JAI Press.
Albrecht, S. L. (2012). The influence of job, team and organizational level resources on employee
well-being, engagement, commitment and extra-role performance. International Journal of
Manpower, 33(7), p. 840-853.
Allan, G. (2003). A critique of using grounded theory as a research method. Electronic Journal of
Business Research Methods, 2(1), no page number. Retrieved March 13th, 2007 from the
Electronic Journal of Business Research Methods website: htTP://www.ejbrm.com/vol2/v2-
i1/issue1-art1-allan.pdf
Allmendinger, P. (2002). Towards a post-positivist typology of planning theory. Planning
Theory, 1(1), p. 77-99.
Alvesson, M. (2003). Beyond neopositivisits, romantics and localists: a reflective approach to
interviews in organizational research. Academy of Management Review, 28(1), p. 13-33.
Alvesson, M. (2011). Interpreting Interviews. Sage Publications: London
Alvesson M & Sköldberg K. (2000). Reflexive methodology: New vistas for qualitative research.
California: Sage.

263
Ambler, T. & Barrow, S. (1996). The employer brand. Journal of Brand Management, 4(3), p. 185–
206.
Ambler, T. (n.d.) Employee-based brand equity. Points of View – Employerbrand.com. Retrieved
April 11th, 2009 from Employerbrand.com website:
htTP://www.employerbrand.com/points_detail.asp?id=3
Aon Hewitt Associates (2013). Best employer study – Canada. Retrieved June 8th, 2013 from Aon
Hewitt website: htTP://www.aon.com/canada/products-services/human-capital-
consulting/consulting/best_employers/bes_what_is_it.html
Anderson, G. (1998). Fundamentals of educational research (2nd Edition). Falmer Press.
Pennsylvania, USA.
Anitha, J. (2014). Determinants of employee engagement and their impact on employee
performance. International Journal of Productivity and Performance Management, 63(3), p.
308-323.
Argenti, P. & Druckenmiller, B. (2004). Reputation and the corporate brand. Corporate Reputation
Review, 6(4), p. 368-374.
Armenakis, A. & Bedeian, A. (1999). Organizational Change: A Review of Theory and Research in
the 1990s. Journal of Management, 25(3), p. 293–315.
Armstrong, M. (2000). Strategic Human Resource Management – A guide to action, London: Kogan
Page, p. 6.
Arthur, W., Bennett, W., Edens, P., & Bell, S. (2003). Effectiveness of training in organizations: A
meta–analysis of design and evaluation features. Journal of Applied Psychology, 88(2), p.
234–245.
Ashby, F. & Pell, A. (2001). Embracing excellence: Become an employer of choice to attract the
best talent. Prentice Hall.
Ask Oxford (no date). Compact Oxford English Dictionary – 3rd Edition (2008). Retrieved on July
19th, 2009 from AskOxford.com website:
htTP://www.askoxford.com/concise_oed/customer?view=uk
Aslam, M. S., Ayub, A., & Razzaq, A. (2013). Enhancing group performance through employee
involvement: A conceptual framework on workforce diversity. Interdisciplinary Journal of
Contemporary Research in Business, 4(11), p. 419-426.
Aurand, T., Gorchels, L., & Bishop, T. (2005). Human resource management’s role in internal
branding: an opportunity for cross-functional brand message synergy. Journal of Product &
Brand Management, 14(2/3), p. 163-169
Backhaus, K. & Tikoo, S. (2004). Conceptualizing and researching employer branding. Career
Development International, 9 (4/5), p. 501-517

264
Barrick, M. & Mount, M. (1991). The big five personality dimensions and job performance: a meta-
analysis. Personnel Psychology, 44(1), p. 1-26
Barrow, S. & Mosley R. (2005). The employer brand: Bringing the best of brand management to
people at work. Chichester, England: John Wiley & Sons Ltd.
Bassey, M. (1995) Creating Education through Research: A Global Perspective of Educational
Research in the 21st Century. BERA England: Moor Press.
Bauer, T. & Green, S. (1998). Testing the combined effects of newcomer information seeking and
manager behavior on socialization. Journal of Applied Psychology, 83, p. 72–83.
Becker, G. (1962). Investment in human capital: A theoretical analysis. Journal of Political
Economy, 70(5), p. 9-49.
Becker, T.E. (1998). Integrity in organisations: beyond honesty and conscientiousness. Academy of
Management Review, 23(1), p. 154-161.
Berg, B.L. (1998). Qualitative research methods for the social sciences. Allyn and Bacon: Boston,
MA.
Bernard Hodes Global Networks (2006). Global Employer Brand Study – June 2006.
Berthon, P., Ewing, M. & Hah, L. (2005). Captivating company: dimensions of attractiveness in
employer branding. International Journal of Advertising, 24(2), pg. 151-172
Bettencourt, L. & Brown, S. (1997). Contact employees: Relationships among workplace fairness,
job satisfaction and pro-social service behaviors. Journal of Retailing, 73 (1), p. 39-61.
Bhatnagar, J. & Srivastava, P. (2008). Strategy for staffing: Employer branding and person-
organization fit. The Indian Journal of Industrial Relations, 44(1), p. 35-48
Biswas, S. (2011). Commitment, involvement, and satisfaction as predictors of employee
performance. South Asian Journal of Management, 18(2), p. 92-107
Biswas, S. & Varma, A. (2012). Antecedents of employee performance: An empirical investigation
in India. Employee Relations, 43(2), p. 177-192.
Bodderas, M., Cachelin, J., Maas, P., & Schlager, T. (2011). The influence of the employer brand
on employee attitudes relevant for service branding: an empirical investigation Journal of
Services Marketing, 25/7, p. 497–508
Bogdan, R. & Biklen, S.K. (1992). Qualitative research for education: An introduction to theory and
methods. London: Allwyn and Bacon.
Bohman, J. (1991) New philosophy of social science. Cambridge: Polity Press.
Borman, W. & Motowidlo, S. (1993). Expanding the criterion domain to include elements of
contextual performance. In Schmitt, N. & Borman W. (Eds.), Personnel selection in
organizations, p. 71-98. New York: Jossey-Bass.

265
Borman, W. & Motowidlo, S. (1997). Task performance and contextual performance: The meaning
for personnel selection research. Human Performance, 10(2), p. 99-109.
Borman, W., Penner, L., Allen, T., & Motowidlo, S. (2001). Personality predictors of citizenship
performance. International Journal of Selection and Assessment, 9(1-2), p. 52-69.
Boxall, P. (1998). Achieving competitive advantage through human resource strategy: towards a
theory of industry dynamics. Human Resource Management Review, 8(3), p. 265-88.
Boyd, G. & Sutherland, M. (2006). Obtaining employee commitment to living the brand of the
organization. South African Journal of Business Management, 37(1), p. 9-20.
Brand Learning (no date). Employee value propositions: A key marketing tool for talent
management. Retrieved February 18th, 2013 from Brand Learning website:
htTP://www.brandlearning.com/uploadeddocuments/employee-value-propositions.pdf
Bratton, J. & Gold, J. (2003). Human Resource Management. 3rd Edition. Chapter 2. England:
Palgrave Macmillan Ltd.
Braun, V. and Clarke, V. (2006). Using thematic analysis in psychology. Qualitative Research in
Psychology, 3, p. 77-101.
Brent, P. (2003). Skilled labour shortage in Canada feared. The National Post. Retrieved June 6th,
2006 from The National Post website: htTP://www.queensu.ca/cora/polls/2003/Nov13-
labour_shortage.pdf
Brett, J., Cron, W. & Slocum, J. (1995). Economic dependency on work: a moderator of the
relationship between organizational commitment and performance. Academy of Management
Journal, 38(1), p. 261–271.
Brewerton, P. & Millward, L. (2001). Organizational research methods: A guide for students and
researchers. Sage Publications.
Brewster, C., Sparrow, P. & Harris, H. (2005). Towards a new model of globalizing HRM.
International Journal of Human Resource Management, 16(6), p. 949-70.
Bryman, A. (2007). The end of paradigm wars? In: P Alasuutari, L Bickman & J Brannen (eds), The
Sage handbook of social research methods. Los Angeles: Sage.
Buchanan, D. & Bryman, A. (2007). Contextualizing methods choice in organizational research.
Organizational Research Methods, 10(3), p. 483-501
Cairncross, F. (2000). Inside the machine: Survey of e-management. The Economist, 11
November, p. 6.
Cairncross, F. (2003). The Company of the Future: Meeting the Management Challenges of the
Communications Revolution. Profile Books, London
Campbell, J. P. (1990). Modeling job performance in a population of jobs. Personnel Psychology,
43, 313-333.

266
Carrington, L. (2007). Designs on the dotted line. People Management Magazine (18 October
2007), p. 36-39
Chambers, E., Foulon, M., Handfield-Jones, H., Hankin, S., & Michaels, E. (1998 ). The war for
talent. The McKinsey Quarterly, 1(3), p. 44 – 58.
Check, J. & Schutt, R. (2012). Research Methods in Education. Thousand Oaks, CA: Sage
Publications, Inc.
Chiles, T. (2003). Process theorizing: Too important to ignore in a kaleidic world. Academy of
Management Learning and Education, 2(3), p. 288–291.
Chiaburu, D. & Tekleab, A. (2005). Individual and contextual influences on multiple dimensions of
training effectiveness. Journal of European Industrial Training, 29(8), p. 604-26.
Ciao, B. (2011). Management studies through qualitative analyses: Epistemological justification,
verification of originality, and efforts of conceptualization. GSTF Business Review (GBR), 1(1),
p. 106-115.
CIBC World Markets Inc. (2012). The haves and have nots of Canada’s labour Market. Retrieved
March 15th, 2013, from the Council Of Ontario University Publication website:
htTP://www.cou.on.ca/publications/reports/pdfs/if_2012-1203
CIPD - Chartered Institute of Personnel and Development (2007). Research insight: Employer
Branding – The latest fad or the future for HR? Retrieved January 12th, 2009 from CIPD
website: htTP://www.cipd.co.uk/NR/rdonlyres/56C8377F-256B-4556-8650-
8408B0E07576/0/empbrandlatfad.pdf
CIPD - Chartered Institute of Personnel and Development. (2006). Reflections on employee
Engagement: Change agenda. CIPD: Retrieved July 18th, 2010 from CIPD website:
http://www.cipd.co.uk/changeagendas
Clarke, K. (2001). What businesses are doing to attract and retain talent - becoming an employee
of choice. Employee Benefits Journal, 26(1), p. 21-24
Cohen, J. (1988). Statistical power analysis for the behavioural sciences (2nd Edition). New York:
Academic Press.
Cohen, L., Manion, L. and Morrison, (2000). Research Methods in Education (5th ed.). London:
Routledge Falmer.
Collins, C. & Stevens, C. (2002). The relationship between early recruitment-related activities and
the application decisions of new labour market entrants: A brand equity approach to
recruitment. Journal of Applied Psychology, 87, pg. 1121-1133.
Conference Board of Canada (2004). Hot HR issues for the next two years. Retrieved on June 9,
2006 from Conference Board of Canada website:
htTP://www.conferenceboard.ca/boardwiseii/temp/BoardWise2PALINKEAEIHBCONCFOLDLMGJ
200662015823/HR-briefing.pdf

267
Conference Board (2006). Employee engagement: A review of current research and its
implications. Retrieved on July 18th, 2010 from:
http://montrealoffice.wikispaces.com/file/view/Employee+Engagement+-
+Conference+Board.pdf
Corporate Leadership Council (1999). The employment brand: Bulding competitive advantage in
the labour market. Washington, DC: Corporate Leadership Council.
Corporate Leadership Council (2006). Attracting and retaining critical talent segments: Building a
competitive employment value proposition – Research Summary. Washington, DC: Corporate
Leadership Council.
Conway, N. & Coyle-Shapiro, J. (2006). Reciprocity and psychological contracts: Employee
performance and contract fulfillment. Academy of Management Best Conference Paper 2006.
Cote, S. (1999). Affect and performance in organizational settings. Current Directions in
Psychological Science, 8, p. 65-68.
Covaleski, M., Dirsmith, M., Heian, J., & Samuel, S. 1998. The calculated and the avowed:
Techniques of discipline and struggles over identity in Big Six public accounting firms.
Administrative Science Quarterly, 43, p. 293–327.
Coyle-Shapiro, J. & Keller (2000). Consequences of psychological contract for the employment
relationship: A large scale survey. Journal of Management Studies, 37(7), p. 903-930
Creswell, J. (1998). Qualitative inquiry and research design: Choosing among five traditions.
Thousand Oaks, CA: Sage Publications, Inc.
Creswell, J. (2008). Educational research: Planning, conducting and evaluating quantitative and
qualitative research (3rd ed.). Upper Saddle River, NJ: Pearson Prentice Hall.
D’Arcy, S. (2003). When your horse is dead, just dismount. Personnel Today, Oct 7th, 2003. no
page number.
Davies, G. & Chun, R. (2002). Gaps between the internal and external perceptions of the corporate
brand. Corporate Reputation Review, 5(2/3), p. 144-157
Davies, G.J., Chun, R., Da Silva, R. and Roper, R. (2004). A corporate character scale to assess
employee and customer views of organisation reputation. Corporate Reputation Review, 7(2),
p. 125-46.
Davies, G. (2007). Employer branding and its influence on manager. European Journal of
Marketing, 42(5/6), p. 667-681
De Chernatony, L. (1999). Brand management through narrowing the gap between brand identity
and brand reputation. Journal of Marketing Management, 15 (1), p. 157–179.
De Chernatony, L. & Christodoulides, G. ( 2004 ). Taking the brand promise online: Challenges and
opportunities. Interactive Marketing, 5, p. 238 – 251.

268
De Loo, I. & Lowe, A. (2011). Mixed methods research: don’t – “just do it”. Qualitative Research in
Accounting & Management, 8(1), p. 22-38.
Deadrick, D. & Gardner, D. (2000). Performance distributions: measuring employee performance
using total quality management principles. Journal of Quality Management, 4(2), p. 225–241.
Denzin N. K. (2008). The new paradigm dialogs and qualitative inquiry. International Journal of
Qualitative Studies in Education, 21(4), 315-325.
Denzin, N. K. & Lincoln, Y. S. (1994). Introduction: Entering the field of qualitative research. In: N.
K. Denzin & Y. S. Lincoln (eds.), Handbook of Qualitative Research. Thousand Oaks, CA: Sage,
p. 1–17.
Dessler, G., Vole, N., Goodman, P., & Sutherland, V. (2004). Fundamentals of human resource
management in Canada. Chapter 1. Canada: Pearson Prentice Hall.
DiMaggio, P. J., & Powell, W. (1983). The iron cage revisited: Institutional isomorphism and
collective rationality in organizational fields. American Sociological Review 48, p. 147-60.
Dowling, G. (1994). Corporate reputations: Strategies for developing the corporate brand. Kogan
Page Limited, London, UK.
Eagleton, T. (2003). After theory. London: Allen Lane
Edwards, M. (2008). Employer branding: where to next? In Commitment, Engagement, and
Employer Branding - The Voice and Value Conference Report. Chartered Institute of Personnel
and Development Event Report. London School of Economic – March 14th, 2008.
Eisenhardt, K.M. (1989). Building theories from case study research. Academy of Management
Review, 14(4), p. 532-49.
Eisner, W. E. and Peshkin, A. (1990). Qualitative inquiry in education, the continuing debate. New York,
Teachers College Press.
Employee Ownership Association of United Kingdom (no date). Employee ownership in Britain. Retrieved
November 1st, 2014 from Employee Ownership Association website:
http://employeeownership.co.uk/resources/reports/
Employer Brand Institute (2009). Employer branding global research study. Report retrieved on Jan 31st,
2012 from Collective Learning Australia website:
htTP://www.collectivelearningaustralia.com/files/employer_brand_institute_employer_brandin
g_global_survey_report_b.minchington.pdf
Employer Brand International (2011a). Employer branding global research study. Report retrieved on
Nov 1st, 2012 from EmployerBrandingOnline.com website:
htTP://www.employerbrandingonline.com/news/research/346-new-research-findings-ebis-
2011-employer-branding-global-research-study.html
as well as EmployerBrandingReview.com website:
htTP://www.employerbrandingreview.com/?p=582

269
Employer Brand International (2011b). The rise of employer brand leadership. Report retrieved on June
1st, 2013 from www.brettminchington.com website:
htTP://www.brettminchington.com/files/minchington_ebi_the_rise_of_employer_brand_leader
ship.pdf
Employer Brand International (2014). Employer branding global trends study. Report retrieved on
Nov 1st, 2014 from www.brettminchington.com website:
http://www.brettminchington.com/thinking/12-research/152-2014-employer-branding-global-
trends-study.html
Employers Resource Council. (2008). Employment Value Proposition. ERC 2008 Research Studies.
Mayfield Village, OH.
Erickson, T. J. (2005). Testimony submitted before the U.S. Senate Committee on Health,
Education, Labor and Pensions, May 26.
Ewing, M., Pitt, L., de Bussy, N. & Berthon, P. (2002). Employment branding in the knowledge
economy, International Journal of Advertising, 21, p. 3-22.
Fombrun, C. (1996). Reputation: Realising value from the corporate image. Harvard Business
School Press, Cambridge, MA.
Fombrun, C., & Shanley, M. (1990). What’s in a name? Reputation building and corporate strategy.
Academy of Management Journal, 33(2), p. 233-258.
Farrell, J. (2002). Promises worth keeping. Incentive, 175(5), pg. 38.
Fernandez, C. (2007). Employee engagement. Journal of Public Health Management and Practice,
13(5), p. 524-526.
Field, A. P. (2009). Discovering statistics using SPSS (3rd Edition). London: Sage Publications Ltd.
Fincham, R. (2002). Narratives of success and failure in systems development. British Journal of
Management, 13(1), p. 1-14.
Fisher, R. J., & Katz, J. E. (2000). Social desirability bias and the validity of self-reported
values. Psychology & Marketing, 17(2), p. 105.
Fulmer, I., Gerhart, B. & Scott, K. (2003). Are the 100 best better? An empirical investigation of
the relationship between being a “great place to work” and firm performance. Personnel
Psychology, 56(4), p. 965-993.
Gaddam, S. (2008). Modelling employer branding communication: The softer aspect of HR
marketing management. The Icfai University Press, p. 45-55. Ref # 50J-2008-03-05-01
Gandossy, R. & Kao, T. (2004). Talent wars: Out of mind, out of practice. Human Resource
Planning, 27(4), p. 16.
Gawali, V. (2009). Effectiveness of employee cross-training as a motivational technique. ASBM
Journal of Management 2(2), p. 138-146.

270
George, J. M., & Bettenhausen, K. (1990). Understanding prosocial behavior, sales performance,
and turnover: A group level analysis in a service context. Journal of Applied Psychology, 75,
698-709.
George. J., & Brief, A. (1992). Feeling good-doing good: A conceptual analysis of the mood at
work-organizational spontaneity relationship. Psychological Bulletin, 112(2), p 310-329.
Gibbons, J. (2006). Employee Engagement: A Review of Current Research and Its Implications.
The Conference Board Research Report, E-0010-06-RR. New York, NY.
Gioia, D., Schultz, M. & Corley, K. (2000). Organizational identity, image, and adaptive instability.
Academy of Management Review, 25(1), p. 63-81.
Glaser, B. and A. Strauss. 1967. The discovery of grounded theory: Strategies for qualitative
research. New York: Aldine Publishing Company.
Glebbeek, A. C., & Bax, E. H. (2004). Is high employee turnover really harmful? An empirical test
using company records. Academy of Management Journal, 47(2), p. 277-286.
Goodman, P. & Dean, J. (1982). Creating long-term organizational change. In Goodman, P. (Ed.)
Change in organizations. Jossey-Bass, San Francisco, CA
Goree, C. & Marszalek, J., III (1995). Electronic surveys: Ethical issues for researchers. College
Student Affairs Journal, 15(1), p. 75-79.
Green, A. & Preston, J. (2005). Editorial: Speaking in tongues – diversity in mixed methods
research. International Journal of Social Research Methodology, 8(3), p. 167-71.
Guba, E. & Linclon, Y. (1985). Naturalistic Inquiry. Newbury Park, CA: Sage.
Guba, E. & Lincoln, Y. (1994). Competing paradigms in qualitative research. In: N. K. Denzin & Y.
S. Lincoln (eds), Handbook of Qualitative Research. Thousand Oaks, CA: Sage, p. 105–117.
Guest, G., Bunce, A., & Johnson, L. (2006). How many interviews are enough? An experiment with
data saturation and variability. Field Methods, 18(1), p. 59-82.
Guest, G., MacQueen, K., & Namey, E. (2012). Applied thematic analysis. Thousand Oaks, CA:
Sage Publications, Inc.
Guest, G., Namey, E., & Mitchell M. (2013). Collecting Qualitative Data: A Field Manual for Applied
Research. Thousand Oaks, CA: Sage Publications, Inc.
Guthrie, J. P. (2001). High-involvement work practices, turnover, and productivity: Evidence from
New Zealand. Academy of Management Journal, 44, p. 180-190.
Halldorsson, F. (2008). Leadership style, employee job performance, and organizational outcome.
PhD. Thesis. University of Minnesota , USA.
Hannabuss, S. (1996). Research interviews. New Library World, 97(1129), p. 22-30.
Harter, J.K., Schmidt, F.L. and Keyes, C.L.M. (2003). Wellbeing the workplace and its relationship
to business outcomes: a review of the Gallup studies, in Keyes, C.L. and Haidt, J. (Eds),

271
Flourishing: The Positive Person and the Good Life, American Psychological Association,
Washington, DC, p. 205-24.
Harter, J.K., Schmidt, F.L., Agrawal, S., Plowman, S.K. (2013). The relationship between
engagement at work and organizational outcomes: Meta-analysis research paper. Retrieved
September 13, 2013 from Gallup website:
http://www.gallup.com/strategicconsulting/126806/q12-meta-analysis.aspx
Haase, J.E. & Myers, S.T. (1988). Reconciling paradigm assumptions of qualitative and quantitative
research. Western Journal of Nursing Research, 10, p. 128-137
Hatch, M-J & Schultz, M. (1997). Relation between organizational culture, identity and image.
European Journal of Marketing, 31 (5–6), p. 356–365.
Haveman, H. (1992). Between a rock and a hard place: Organizational change and performance
under conditions of fundamental environmental transformation. Administrative Science
Quarterly, 37, p. 48-75.
Heger, B. (2007). Linking the employment value proposition (EVP) to employee engagement and
business outcomes: Preliminary findings from a linkage research pilot study, Organization
Development Journal, 25(1), p. 121–132.
Heneman, H., Schwab, D., Fossum, J., & Dyer, L. (1989). Personnel/ Human Resource
Management. 4th Edition. Homewood, IL: Irwin.
Herman, R. & Gioia, J. (2001). Helping your organization become an employer of choice.
Employment Relations Today, 28(2), p. 63-78
Herzberg, F. (1959). The motivation to work. New York: John Wiley.
Herzberg, F., Mausner, B., Peterson, R. & Capwell, D. (1957). Job attitudes: Review of research
and opinion. Pittsburgh, PA: Psychological Service of Pittsburgh.
Hewitt Associates (2004). What makes a best employer? Retrieved August 3rd, 2009 from Hewitt
Associates website: htTP://was2.hewitt.com/bestemployers/canada/pdfs/bestemployer.pdf
Hewitt Associates (2007). The best employers difference. Retrieved July 15th, 2007 from Hewitt
Associates website: htTP://was7.hewitt.com/bestemployers/canada/be_difference.htm
Hitchcock, G. & Hughes, D. (1989). Research and the teacher: Qualitative introduction to school
based research. London, Routledge.
Hobson, C., Kesic, D., Rosetti, D., Delunas, L., & Hobson, N. (2004). Motivating employee
commitment with empathy and support during stressful life events. International Journal of
Management, 21(3), p. 332-337
Hoffman, L. (1999). Redefining the “public” in PR. MC Technology Marketing Intelligence, 19(10),
p. 62–66.
Holstein, J. A., & Gubrium, J. 1997. Active interviewing. In D. Silverman (Ed.), Qualitative research:
113–129. London: Sage.

272
Huffington Post Alberta (2013). The highest paying industries in Canada, and how Saskatchewan
surpassed this Alberta staple. Retrieved June 12th, 2013 from Huffington Post website:
htTP://www.huffingtonpost.ca/2013/03/15/highest-paying-industry-canada-alberta-oil-
gas_n_2886682.html
Hunt, S. (2009). Nursing turnover: costs, causes and solutions. Retrieved on January 2013 from
Alliance for Organizational Excellence website:
htTP://www.uexcel.com/resources/articles/NursingTurnover.pdf
Hunt, S. & Landry, R. (Dec 2005). The importance of employer branding. Benefits Canada, 29, pg.
33-36
Hunter, J. E. 1986. Cognitive ability, cognitive aptitudes, job knowledge, and job performance.
Journal of Vocational Behavior, 29, p. 340-362.
Huxham, C., & Vangen, S. (2003). Researching organizational practice through action research:
Case studies and design choices. Organizational Research Methods, 6, p. 383-404.
Iaffaldano. M., & Muchinsky, P. (1985). Job satisfaction and job performance: A meta-analysis.
Psychological Bulletin, 97, p. 251-273.
Ind, N. (2004). Living the brand, 2nd Edition. Great Britain: Kogan Page.
Industry Canada (updated Aug 2009). Canadian Industry Statistics. Retrieved September 2nd, 2009
from Industry Canada website: htTP://www.ic.gc.ca/eic/site/cis-sic.nsf/eng/h_00019.html
Industry Canada (updated Jul 2009) Service industries are vital to the Canadian economy — Find
out why! Retrieved September 2nd, 2009 from Industry Canada website:
htTP://www.ic.gc.ca/eic/site/si-is.nsf/eng/Home
Johns, G. (2001). In praise of context. Journal of Organizational Behavior. 22(1), p. 31-42.
Johnson, R. B. and Onwuegbuzie, A.J. (2004). Mixed methods research: A research paradigm
those time has come. Educational Researcher, 33(7), p. 14-26
Joo, B. & McLean, G. (2006). Best employer studies: A conceptual model from a literature review
and a case study. Human Resource Development Review, 5(2), p. 228-257
Judge, T., Thoresen, C., Bono, J., & Patton, G. (2001). The job satisfaction-job performance
relationship: A qualitative and quantitative review. Psychological Bulletin, 127(3), p. 376-407.
Kahn, W. (1990) Psychological conditions of personal engagement and disengagement at work.
Academy of Management Journal, 33(4), p. 692-724.
Kateon, R., & Macioschek, A. (2007). Employer branding and talent-relationship-management –
Improving the organizational recruitment approach. Master thesis. UMEÅ University -
Department of Business Administration. Sweden.
Keaveney, Susan M. (1995). Customer Switching Behavior in Service Industries: An Exploratory
Study. Journal of Marketing, 59(2), p. 71-82

273
Keller, K., & Aperia, T. (2008). Strategic brand management: a European perspective. Prentice
Hall.
Kelly, D. and Amburgey, T. L. (1991). Organizational inertia and momentum: A dynamic model of
strategic change. Academy of Management Journal, 34, p. 591–612.
Kiesler, S. & Sproull, L. (1986). Response effects in the electronic survey. Public Opinion Quarterly,
50(3), p. 402-413.
Knox, S. & Freeman, C. (2006). Measuring and managing employer brand image in the service
industry. Journal of Marketing Management, 22, p. 695-716
Kvale, S. and Brinkmann, S. (2009). Inter Views: Learning the Craft of Qualitative Research
Interviewing, Sage: Los Angeles, CA.
Langley, A. (1999). Strategies for theorizing from process data. The Academy of Management
Review, 24(4), p. 691-710.
Langley, A., Smallman, C., Tsoukas, H., & Van De Ven, A. (2013). Process studies of change in
organization and management: Unveiling temporality, activity, and flow. Academy of
Management Journal, 26(1), p. 1-13.
Ledford, Jr., G. (1985). The persistence of organizational change: Varian theory and process theory
models. Prepared for the Western Academy of Management Annual Meeting, CEO Publication,
T85-2 (68), p. 1-30.
Lee, K. & Allen, N. (2002). Organizational citizenship behavior and workplace deviance: The role of
affect and cognitions. Journal of Applied Psychology, 87(1), p. 131-142.
Lenaghan, J. & Eisner, A. (2005). An exploration of the competitive advantage of employer of
choice programs on international human resource management. Journal of international
business research, 4(2), p. 87-97.
Leonard, D. (1998). Wellsprings of knowledge building and sustaining the success of innovation.
Harvard Business School Press, Boston, MA.
Lester, S., Turnley, W., Bloodgood, J., & Bolino, M. (2002). Not seeing eye to eye: differences in
supervisor and subordinate perceptions of and attributions for psychological contract breach.
Journal of Organizational Behavior, 23, p. 39-56.
Lievens, F. and Highhouse, S. (2003). The relation of instrumental and symbolic attributes to a
company's attractiveness as an employer. Personnel Psychology, 56 (1), p. 75-103
Lievens, F., Van Hoye, G. & Anseel, F. (2007). Organizational identity and employer image:
Towards a unifying framework. British Journal of Management, 18, p. S45-S59
Lincoln, Y. S., & Guba, E. (1985). Naturalistic inquiry. Beverly Hills, CA: Sage.
Lincoln, Y. S. and Guba, E. G. (2000). Paradigmatic controversies, contradictions, and emerging
influences. In N. Denzin and Y. Lincoln (eds.), Handbook of Qualitative Research (2nd ed.), p.
163-188. Thousand Oaks, CA: Sage.

274
Lincoln, Y. S. and Guba, E. G. (2005). Paradigms and perspectives in contention. In N. Denzin and
Y. Lincoln (eds.), Handbook of Qualitative Research (3rd ed.), p. 183- 190. Thousand Oaks, CA:
Sage.
Linkedin. (2012). The state of employer branding. Retrieved Nov 1st, 2012, from Linkedin website:
htTP://talent.linkedin.com/node/69037
Lloyd, J. & Bell, A. (2004). Achieving business results through employee engagement. Human
Resources Magazine – Apr 2004. Human resources Institute of New Zealand.
Lloyd, S. (2002). Branding from the inside out. BRW, 24(10), p. 64–66.
Lloyd, T. (1990). The nice company. Bloomsbury Publishing Limited, London, p. 182–201.
Lombardi, M. (2009). Employer branding - how to grow, measure and manage your company's
perception. Aberdeen Group Research Benchmark Report.
Lowe, A. (2001). Past postmodernism: Interviews, accounts and the production of research stories.
Third Asian Pacific Interdisciplinary Research in Accounting (APIRA) Conference. Retrieved
September 1st, 2014 from Asian Pacific Interdisciplinary Research in Accounting Conference
website: http://www.apira2013.org/past/apira2001/papers/Lowe95.pdf
Luchak, A. & Gellatly, I. (2007). A comparison of linear and non-linear relations between
organizational commitment and work outcomes. Journal of Applied Psychology, 92(3), p. 786-
793
MacKay, R. B. & Chia, R. (2013). Choice, chance and unintended consequences in strategic
change: A process understanding of the rise and fall of Norüico Automotive. Academy of
Management Journal, 56, p. 208-230.
MacKenzie, S., Podsakoff, P., Fetter, R. (1993). The impact of organizational citizenship behavior
on evaluations of salesperson performance. Journal of Marketing, 57(January), p 70-80
Mahroum, S. (2000). Highly skilled globetrotters: mapping the international migration of human
capital’, R & D Management, 30(1), p. 23–31.
Mamarchev, S. (2004). Keeping the cornerstone of your organization: Employee branding is a necessity
in an economic slowdown. Inward Strategic Consulting. Newton, MA
ManpowerGroup. (2009a). Global employment outlook survey – 3rd Quarter 2009. Retrieved August
1st, 2009 from ManpowerGroup. website:
htTP://files.shareholder.com/downloads/MAN/663544549x0x300182/59967E52-144A-49BC-
9C2C-5A9DF24C219F/Global_USLetter_Q309.pdf
ManpowerGroup. (2009b). The global talent crunch: Why employer branding matters now.
Retrieved August 1st, 2009 from ManpowerGroup. website:
htTP://files.shareholder.com/downloads/MAN/663544549x0x296576/88dc1669-e781-4697-
a295-593c026d1fd0/Talent_Branding_Paper_USletter_FINAL.pdf

275
ManpowerGroup. (2011).”Manufacturing” talent for the human age. Retrieved Oct 30th, 2012 from
ManpowerGroup website:
htT://files.shareholder.com/downloads/MAN/2153935391x0x469530/98abe58c-60f1-4d58-
8514-b6222422b010/ManufacturingTalent_lo.pdf
ManpowerGroup. (2013). Global Talent Shortage Survey Research Results. Retrieved June 28th,
2013 from ManpowerGroup website:
htTP://www.manpower.ca/Website-File-Pile/Canada/Talent-Shortage-
Survey/2013_Talent_Shortage_Survey_Results_US_hi.pdf
Marczyk, G. , DeMatteo, D. and Festinger, D. (2005). Essentials of Research Design and
Methodology. New Jersey. John Wiley and Sons, Inc.
Markos, S., & Sridevi, M. S. (2010). Employee engagement: The key to improving
performance. International Journal of Business and Management, 5(12), p. 89-96
Martin, G. (2007). Employer branding – time for some long and hard reflections? In Research
insight: Employer Branding – The latest fad or the future for HR? Retrieved January 12th,
2009 from Chartered Institute of Personnel and Development website:
htTP://www.cipd.co.uk/NR/rdonlyres/56C8377F-256B-4556-8650-
8408B0E07576/0/empbrandlatfad.pdf
Martin, G. (2008). Employer branding in a recession. Retrieved May 3rd, 2009 from Graeme Martin’s
HR and People Management Blog site:
htTP://graememartinshrblog.blogspot.com/2008/11/employer-branding-in-recession.html
Martin, G., Beaumont, P., Doig, R., & Pate, J. (2005). Branding: A new performance discourse for
HR? European Management Journal, 23 (1), p 76-88.
Martin, G. Gollan, P. & Grigg, K. (2011). Is there a bigger and better future for employer branding?
Facing up to innovation, corporate reputations and wicked problems
in SHRM. The International Journal of Human Resource Management, 22(17), p. 3618-3637
Maslow, A. (1970). Motivation and Personality, 2nd ed., Harper and Row, New York, NY.
Mathieu, J. & Zajac, D. (1990). A review and meta-analysis of the antecedents, correlates, and
consequences of organizational commitment. Psychological Bulletin, 108, p. 171–194.
Maxwell, J. A. (2006). Qualitative research design: An interactive approach ( 2nd ed.). Thousand
Islands: Sage.
May, D. R., Gilson, R. L., & Harter, L. M. (2004). Psychological conditions of meaningfulness, safety
and availability and the engagement of the human spirit at work. Journal of Occupational &
Organizational Psychology, 77(1), p. 11–37.
McDonald, M., de Chernatony, L. & Harris, F. (2001). Corporate marketing and service brands—
Moving beyond the fast-moving consumer goods model. European Journal of Marketing, 35
(3/4), p. 335–352.

276
McEwan, B. and Buckingham, G. (2001). Make a marque. People Management, p. 40–44.
McKenzie, A. & Glynn, S. (2001). Effective employment branding. Strategic Communication
Management, 5(4), pg. 22-25.
McLaren, J. (2011). Mind the gap: Exploring congruence between the espoused and experienced
employer brand. Thesis for Doctor of Education degree. University of Pennsylvania. USA
McMillan, D.W. and Chavis, D.M. (1986). Sense of community: A definition and theory. Journal of
Community Psychology, 14(1), p. 6-23.
Mediacorp Canada Inc. (2013). Canada’s top 100 employers – selection criteria. Retrieved February
4th, 2013 from Mediacorp Canada Inc. website:
htTP://www.canadastop100.com/research.html
Mediacorp Canada Inc. (2013). Press Reviews. Retrieved February 4th, 2013 from Mediacorp
Canada Inc. website: htTP://www.canadastop100.com/reviews.html
Medlin, B., & Green, K.,Jr. (2008). The relationship among goal setting, optimism, and
engagement: the impact on employee performance. Allied Academies International
Conference.Academy of Organizational Culture, Communications and
Conflict.Proceedings, 13(1), p. 51-56
Melin, E. (2005). Employer Branding: likeness and differences between external and internal
employer brand images. Thesis for Master of Science in Industrial Engineering and
Management degree. Lulea Uinversity of Technology. Sweden
Mensch, B. S., & Kandel, D. B. (1988). Underreporting of substance use in a national longitudinal
youth cohort. Individual and interviewer effects. The Public Opinion Quarterly, 52(1), p. 100-
124.
Meyer, A., Brooks, G. and Goer, J. (1990). Environmental jolts and industry revolutions:
Organizational responses to discontinuous change. Strategic Management Journal, 11, p. 93-
110.
Meyer, J. & Allen, N. (1991). A three-component conceptualization of organizational commitment.
Human Resource Management Review, 1, p. 61–89.
Meyer, J. & Herscovitch, L. (2001). Commitment in the workplace: Toward a general model.
Human Resource Management Review, 11, p. 299–326.
Meyer, J., Paunonen, S., Gellatly, I., Goffin, R. & Jackson, D. (1989). Organizational commitment
and job performance: It’s the nature of the commitment that counts. Journal of Applied
Psychology, 74, p. 152-156.
Michaels, E., Handfield-Jones, H., & Axelrod, B. (2001). The War For Talent. Boston: Harvard
Business School Press.
Miles, M. & Huberman, A. (1994) Qualitative Data Analysis: An Expanded Sourcebook, Thousand
Oaks, CA: Sage.

277
Miles, S. & Mangold, G. (2005). Positioning Southwest Airlines through employee branding.
Business Horizons, 48, pg. 535-545.
Milkovich, G., Glueck, W., Barth, R., & McShane S. (1988). Canadian Personnel/Human Resource
Management. Plano, TX: Business Publications.
Miller, J., & Glassner, B. (1997). The “inside” and the “outside”: Finding realities in interviews. In
D. Silverman (Ed.), Qualitative research, 99–112, Sage: London
Minchington, B. (2006). Your employer brand: attract-engage-retain. Collective Learning Australia
Mohr, L. B. (1982). Explaining organizational behavior. San Francisco: Jossey-Bass.
Mone, E., Eisinger, C., Guggenheim, K., Price, B. and Stine, C. (2011). Performance management
at the wheel: Driving employee engagement in organizations. Journal of Business and
Psychology, 26, p. 205-212.
Moore-Milroy, B. (1991). Into postmodern weightlessness. Journal of Planning Education and
Research 10(3), p. 181–7.
Moorman, R., Niehoff, B., and Organ, D. (1993). Treating employees fairly and organizational
citizenship behavior: Sorting the effects of job satisfaction, organizational commitment and
procedural justice. Employee Responsibilities and Rights Journal, 6, p. 209-225.
Moorman, R. & Blakely, G. (1995). Individualism-collectivism as an individual difference predictor
of organizational citizenship behavior. Journal of Organizational Behaviour, 16, p 127-142
Morgan, L. (2004). Driving performance and retention through employee engagement. Corporate
Leadership Council. Washington DC. Retrieved Sept 1st, 2009 from:
htTP://www.lloydmorgan.com/PDF/Driving%20Performance%20and%20Retention%20Throug
h%20Employee%20Engagement.pdf
Moroko, L. & Uncles, M. (2005). Employer branding – the case for a multidisciplinary process related
empirical investigation. Paper presented at ANZMAC 2005 Conference: Branding
Moroko, L. & Uncles, M. (2008). Characteristics of successful employer brands. Journal of Brand
Management, 16(3), p.160-175
Moroko, L. (2009). New Perspectives on Employer Branding: An empirical investigation of scope,
nature and success drivers. Thesis for Doctor of Philosophy degree. University of New South
Wales.
Morris, D. (2005). Causal inference in the social sciences: Variance theory, process theory, and
system dynamics. Retrieved on August 30th, 2014 from Research Gate website:
http://www.researchgate.net/publication/228864960_Causal_inference_in_the_social_sciences
_Variance_theory_process_theory_and_system_dynamics
Morse, J. 1994. Designing funded qualitative research. In Handbook for qualitative research, ed.
N. Denzin and Y. Lincoln, 220–35. Thousand Oaks, CA: Sage.

278
Mosley, R. (2004) Employer Brand Leadership, A roadmap. Retrieved May 15th, 2006 from People
In Business website:
htTP://www.webdms.net/dms/uploaded_files/pib/pib.mdb/downloads/Employer%20Brand%2
0Roadmap.pdf
Motowidlo, S. (1984). Does job satisfaction lead to consideration and personal sensitivity? Academy
of Management Journal, 27, p. 910-915.
Motowidlo, S. & Van Scotter, J. (1994). Evidence that task performance should be distinguished
from contextual performance. Journal of Applied Psychology, 79(4), p. 475-480.
Mouritsen, J. (2000). Chapter 13 - Valuing expressive organizations: intellectual capital and the
visualization of value creation. In Schultz, M., Hatch, M.J., & Holten Larsen, M. (Eds.). The
expressive organization: Linking identity, reputation, and the corporate brand, p. 208-229.
Oxford.
Mowday, R., Porter, L., & Dubin, R. (1974). Unit performance, situational factors, and employee
attitudes in spatially separated work units. Organizational Behavior and Human Performance,
12, p. 231-248.
Neuman, W., L. (2003). Social Research Methods: Qualitative and Quantitative Approaches (5th
ed.). Boston: Allyn and Bacon.
Nguyen, N. & Leblanc, G. (2002). Contact personnel, physical environment and the perceived
corporate image of intangible services by new clients. International Journal of Service Industry
Management, 13(3), p. 242–62.
Nigel Wright (2008). Employer branding survey. Retrieved July 15th, 2009 from Nigel Wright
website:
htTP://www.nigelwright.com/_downloads/Nigel_Wright_Employer_Branding_Survey_-
_Sept_08.pdf
O’Reilly, C. & Chatman, J. (1986). Organizational commitment and psychological attachment: The
effects of compliance, identification, and internalization on pro-social behavior. Journal of
Applied Psychology, 71, p. 492–499.
Ogilvie, J. (2006). Internal relationship management: Linking human resources to market
performance. Personnel Psychology, 59(1), pg. 249-253
Olivier, A.L. & Rothmann, S. (2007) Antecedents of work engagement in a multi-national oil
company. South African Journal of Industrial Psychology, 33(3), p. 49-56.
Olk, P. & Rosenzweig, P. (2010). The halo effect and the challenge of management inquiry: A
dialogue between Phil Rosenzweig and Paul Olk. Journal of Management Inquiry, 19(1), p. 48-
54.
Organ. D. & Ryan, K. (1995). A meta-analytic review of attitudinal and dispositional predictors of
organizational citizenship behavior. Personnel Psychology, 48, p. 775-802

279
Organ, D. (1997). Organizational citizenship behavior: It’s construct clean-up time. Human
Performance, 10, 85–97.
Organization for Economic Cooperation and Development (2006). Live longer, work longer: A
synthesis report. Executive summary – p 9-14. Retrieved on August 14th, 2009 from OECD
website: htTP://www.oecd.org/dataoecd/32/50/36218997.pdf
Organization for Economic Cooperation and Development (no date). Members and partners.
Retrieved on August 14th, 2009 from OECD website:
htTP://www.oecd.org/pages/0,3417,en_36734052_36761800_1_1_1_1_1,00.html
Orr, J., Sackett, P. & Mercer, M. (1989). Do role of prescribed and non-prescribed behaviors in
estimating the dollar value of performance. Journal of Applied Psychology, 74, p. 34-40.
Ostroff, C. (1992). The relationship between satisfaction, attitudes, and performance: An
organizational level analysis. Journal of Applied Psychology, 77, p. 963-974.
Palanski, M.E. and Yammarino, F.J. (2007). Integrity and leadership: clearing the conceptual
confusion. European Management Journal, 25(3), p. 171-184.
Parker, S. (2007). That is my job: how employees’ role orientation affects their job performance.
Human Relations, 60(3), p. 403-434.
Parry, K.W. and Proctor-Thomas, S.B. (2002). Perceived integrity of transformational leaders in
organisational settings. Journal of Business Ethics, 35(2), p. 75-96.
Penna (2007). Meaning at Work Research Report. Retrieved on July 18th, 2010 from Penna
website: http://www.penna.com/contentfiles/penna/content/research/e7031f6c-e95e-49ba-
9ecc-fad74a0829ec/meaning_at_work.pdf
Pettigrew, A. M. (1987). Context and action in the transformation of the firm. Journal of
Management Studies, 24, p. 649–70.
Pettigrew, A. M. (2012). Context and action in the transformation of the firm: A reprise. Journal of
Management Studies, 49(7), p. 1304-1328
Petty, M., McGee, G., & Cavender, J. (1984). A meta-analysis of the relationships between
individual job satisfaction and individual performance. The Academy of Management Review, 9
(4), p. 712-721.
Pfeffer, J. (1994). Competitive Advantage Through People: Unleashing the Power of the Work
Force. Boston: Harvard Business School Press.
Pfeffer, J. (1998). The human equation. Harvard Business School Press, Boston, MA.
Pfeffer, J., & Sutton, R. I. (2006). Hard facts, dangerous half-truths and total nonsense: Profiting
from evidence-based management. Cambridge, MA: Harvard Business School Press.
Phelan, M. (1991). Number of officers leaving a department for any reason other than retirement.
Law and Order, 39(5), p. 40-42.

280
Phillips, D. C. (1990). Postpositivistic science: Myths and realities. In Guba E. G., The paradigm
dialog. Newbury Park, CA, Sage, p. 31-35
Phiri, P. (no date). Methods and methodology: Which approach? Qualitative or quantitative
technical, epistemological and ontological considerations? Implications for the conduct of a
research project. Retrieved on August 30th, 2014 on Academia.edu website:
http://www.academia.edu/760617/Methods_and_Methodology_Which_approach_Qualitative_o
r_Quantitative_Technical_epistemological_and_ontological_considerations_Implications_for_th
e_conduct_of_a_research_project
Podsakoff, P. & MacKenzie, S. (1994). Organizational citizenship behaviors and sales unit
effectiveness. Journal of Marketing Research, 31(3), p. 351-363.
Podsakoff, P., MacKenzie, S., Paine, J. & Bachrach, D. (2000). Organizational citizenship behaviors:
A critical review of the theoretical and empirical literature and suggestions for future research.
Journal of Management, 26, p. 513–563.
Poropat, A. (2002). New models of work performance and their implications for employment
relations. Proceedings of the Tenth Annual Conference of the International Employment
Relations Association. Retrieved July 23rd, 2009:
htTP://www98.griffith.edu.au/dspace/bitstream/10072/1607/1/20235_1.pdf
Prahalad, C. & Hamel, G (1990). The core competence of the corporation. Harvard Business
Review, May-June, p. 79-91.
Priem, R. & Butler, J. (2001). Is the resource based view a useful perspective for strategic
management research. The Academy of Management Review, 26, p. 22-40.
Pring, R. (2000). Philosophy of educational research. Continuum International Publishing Group,
Limited.
Punjaisri, K., Wilson, A. & Evanschitzky, H. (2008). Exploring the influences of internal branding on
employees’ brand promise delivery: Implications for strengthening customer- brand
relationships. Journal of Relationship Marketing, 7(4), p. 407-424.
Qu, S. Q., & Dumay, J. (2011). The qualitative research interview. Qualitative Research in
Accounting and Management, 8(3), p. 238-264.
Rappaport, A. (2013). Business case for employee benefits. Benefits Quarterly, 29(1), p. 8-14
Rashid, H. A., Asad, A., & Ashraf, M. M. (2011). Factors persuading employee engagement and
linkage of EE to personal & organizational performance. Interdisciplinary Journal of
Contemporary Research in Business, 3(5), p. 98-108
Reichheld, F. (1996). The Loyalty Effect: The Hidden Force behind Growth, Profits and Lasting
Value. Boston: Harvard Business School Press.

281
Reign, D. (2013). Paradigm Wars: Promoting Mixed Methods Research in Social Sciences.
Proceedings of 6th International Business and Social Sciences Research Conference 3 – 4.
Dubai, UAE.
Rescher, N. (1996). Process metaphysics: An introduction to process philosophy. Albany: State
University of New York Press.
Rhian, S. (2002). Dispelling the modern myth: Employee satisfaction and loyalty drive service
profitability. International Journal of Operations & Production Management, 22(1), p. 30-49
Richman, A. (2006). Everyone wants an engaged workforce how can you create it? Workspan, 49,
p. 36-39.
Riessman, C.K. (1993), Narrative Analysis. Sage: Thousands Oaks, CA (Qualitative Research
Methods, Vol. 30).
Rindova, V.P., Williamson, I.O., Petkova, A.P., and Sever, J.M. (2005). Being good or being known:
An empirical examination of the dimensions, antecedents, and consequences of organizational
reputation. Academy of Management Journal, 49, p. 1033–1049.
Ritchie, S., & Rigano, D. (2001). Researcher-participant positioning in classroom research.
International Journal of Qualitative Studies in Education, 14, p. 741-756.
Robert Half (2007i). The rise of the employer brand. Media release – June 13th, 2007. No page
number.
Robert Half (2007ii). Employer branding white paper. Retrieved September 15th, 2007 from Robert
Half website: www.roberthalf.net/GfxUser/ev/RHF_NZL/doc_1242931980.pdf
Robinson, S. (1996). Trust and breach of the psychological contract. Administrative Service
Quarterly, 44(4), p. 574-599
Rosenzweig, P. (2007i). The halo effect and other managerial delusions. The McKinsey Quarterly,
2007-1, p. 77-85.
Rosenzweig, P. (2007ii). Misunderstanding the nature of company performance: The halo effect
and other business delusions. California Management Review, 49(4), p. 6-20.
Rosethorn, H. (2009). The Employer Brand: Keeping Faith with the Deal. Surrey, England: Gower
Publishing Limited.
Rosethorn, H., & Mensink, J. (2007). Employer branding – more than just a fashion statement? In
Research insight: Employer Branding – The latest fad or the future for HR? Retrieved January
12th, 2009 from Chartered Institute of Personnel and Development website:
htTP://www.cipd.co.uk/NR/rdonlyres/56C8377F-256B-4556-8650-
8408B0E07576/0/empbrandlatfad.pdf
Rosseau, D. (1989). Psychological and implied contracts in organizations. Employee Responsibilities
and Rights Journal, 2, p. 121-139.

282
Rossman, G., & Wilson, B. (1985). Numbers and words: combining quantitative and qualitative
methods in a single large-scale evaluation study. Evaluation Review, 9(5), p. 627-643.
Rothmann, S. & Rothmann, S. (Jr). (2010) Factors associated with employee engagement in South
Africa. South African Journal of Industrial Psychology, 36(1), p. 1-12.
Rothmann, S. & Welsh, C. (2013). Employee engagement: The role of psychological conditions.
Management Dynamics, 22(1), p. 14-25
Rotundo, M., & Sackett, P. R. (2002). The relative importance of task, citizenship, and
counterproductive performance to global ratings of job performance: A policy capturing
approach. Journal of Applied Psychology, 87, 66-88.
Roulston, K. (2010). Reflective interviewing: A guide to theory and practice. London: Sage
Rousseau, D. M. 2006. Is there such a thing as "evidence-based management"? Academy of
Management Review, 31, p. 256-269.
Ruch, W. (2002). Employer brand evolution: A guide to building loyalty in your organization.
Retrieved July 31st, 2007 from Versant website: www.versantsolutions.com/employerbranding
Ruto-Korir, R. % Lubbe, C. (2010). Locating the doctoral study in the ‘paradigm skirmishes’:
Challenges and prospects for adopting a paradigm cradle. Perspectives in Education, 28(3), p.
99-109.
Saks, A. M. (2006)Antecedents and consequences of employee engagement. Journal Managerial
Psychology, 21, p. 600-619.
Salanova, M., Agut, S., & Peiro, J. (2005). Linking organizational resources and work engagement
to employee performance and customer loyalty: The mediation of service climate. Journal of
Applied Psychology, 90(6), p. 1217- 1227.
Sale, J., Lohfeld, L. & Brazil, K. (2002). Revisiting the quantitative-qualitative debate: Implications
for mixed-methods research. Qualitative and Quantitative, 36, p. 43-53
Sarantakos, S. (2005). Social Research. (3rd ed.). Melbourne: Macmillan Education.
Sartain, L. & Schumann, M. (2006). Brand from the inside. San Francisco, USA: Jossey-Bass.
Saunders, M., Lewis, P. and Thornhill, A. (2007). Research Methods for Business Students, 4th ed.,
Prentice-Hall: Edinburgh.
Schmidt, F. L. (1993). Personnel psychology at the cutting edge. In N.Schmitt, W. C. Borman, &
Associates (Eds.), Personnel selection in organizations (p. 497–515). San Francisco: Jossey-
Bass.
Schwind, H., Das, H., & Wagar, T. (2002). Canadian human resource management: a strategic
approach. 6th Edition Chapter 1. McGraw-Hill Ryerson. Canada
Schmidt, W.C. (1997). World-Wide Web survey research: Benefits, potential problems, and
solutions. Behavior Research Methods, Instruments, & Computers, 29(2), p. 274-279.

283
Schofield, J. W. (1990). Increasing the generalizability of qualitative research. IN Peshkin, A.&
Eisner, E. W. Qualitative inquiry in education: The continuing debate. New York: Teachers
College Press, p. 201-231.
Schuler, R.S., & Huber, VL (1990) Personnel and human resource management. St. Paul, MN:
West.
Schulte, A. (2010). The role or learning and development in employer brand practices. Dissertation
for Degree of Doctor of Education, University of Pennsylvania. USA.
Schulze, S. (2003). Views on the combination of quantitative and qualitative research approaches.
University of South Africa. Progressio 25(2), p. 8-20
Scott, W. R. & Meyer, J. W. (1991). The Organization of societal sectors: Propositions and early
evidence. in The New Institutionalism in Organizational Analysis, edited by Walter W. Powell
and Paul J. DiMaggio. p. 108-142. Chicago: University of Chicago Press.
Scott, D. & Usher, R. (1999). Research education: Data, methods and theory in educational
enquiry. London: Cassell.
Sharma, A. (2008). Employer branding: Stairway to success. The Human Factor – December 2008.
Retrieved from Collective Learning Australia website:
htTP://www.collectivelearningaustralia.com/files/the_human_factor_cover_story.pdf
Sheridan, A. & Conway, L. (2001). Workplace flexibility: Reconciling the needs of employers and
employees. Women In Management Review, 16(1), p. 5-11.
Shuck, B. and Wollard, K.K. (2010). Employee engagement and HRD: a seminal review of the
foundations. Human Resource Development Review, 9(1), p. 89-110.
Smaling, A. (1994). The pragmatic dimension: paradigmatic and pragmatic aspects of choosing a
qualitative or quantitative method. Quality & Quantity, 28(2), p. 233-49.
Smedley, Tim (2007). Why employer branding is bigger than HR. People Management Magazine,
Oct 4th, 2007. Retrieved May 8th, 2009 from People Management website:
htTP://www.peoplemanagement.co.uk/pm/articles/2007/10/whyemployerbrandingisbiggerthan
HR.htm
Smith, J. K. (1983). Quantitative versus qualitative research: An attempt to clarify the issue.
Educational Researcher, 12, p. 6–13.
Sproull, L. (1986). Using electronic mail for data collection in organizational research. Academy of
Management Journal, 29(1), p. 159-169.
Stein, N. (2000). Winning the war to keep top talent. Fortune 141(11), p. 132–133.
Stone, M. & Liyanearachchi, D. (2007). Managing retention – who does it well? Database Marketing
& Customer Strategy Management 14(2), p. 90–103

284
Storbacka, K., Strandvik, T, & Gronroos, C. (1994). Managing customer relationships for profit: The
dynamics of relationship quality, International Journal of Service Industry Management, 5(5),
p. 21-38.
Suazo, M. (2009). The mediating role of psychological contract violation on the relations between
psychological contract breach and work-related attitudes and behaviors. Journal of Managerial
Psychology, 24(2), p. 136-160.
Suchman, M. (1995). Managing legitimacy: Strategic and institutional approaches. Academy of
Management Review, 20(3), p. 571-610.
Sullivan, J. (2004). Eight elements of a successful employment brand. ER Daily, 23 February.
Retrieved April 14, 2004 by Backhaus and Tikoo (2004) from:
www.erexchange.com/articles/db/52CB45FDADFAA4CD2BBC366659E26892A.asp
Sullivan, J. (2007). Are you wasting your employment branding dollars? Retrieved May 3rd, 2009
from ere.net website: htTP://www.ere.net/2007/07/30/are-you-wasting-your-employment-
branding-dollars/
Sullivan. J. (1999). Building an employment brand (Part 1 of 2). Retrieved June 7, 2006 from Dr.
John Sullivan’s website: htTP://www.drjohnsullivan.com/articles/1999/072399.htm
Sultana, A., Irum, S., Ahmed, K., Mehmood, N. (2012). Impact of training on employee
performance: A study of telecommunication sector in Pakistan. Interdisciplinary Journal of
Contemporary Research In Business 4(6), p. 646-661.
Sutherland, M. M., Torricelli, D. G., & Karg, R. F. (2002). Employerofchoice branding for
knowledge workers. South African Journal of Business Management, 33(4), p.1320
Taylor, P. & Medina, M. (2013). Educational research paradigms: From positivism to
multiparadigmatic. The Journal of Meaning-Centred Education, 1(1) .
Tashakkori, A. & Teddlie, C. (1998). Mixed methodology; combining qualitative and quantitative
approaches. Thousand Oaks, CA, Sage
Thibodeau, P. (2000). Labor shortage aired at World IT Congress. Computerworld, 19 June, p. 20.
Thorndike, E. (1920). A constant error in psychological ratings. Journal of Applied Psychology,
4, p. 469-477.
Thorne, K. (2004). What’s in a name? Personnel Today, (Nov 30, 2004), p. 18.
TMP Worldwide. (2011). The value of a managed employer brand in an increasingly competitive
landscape. Retrieved Nov 1st, 2012 from Slideshare website:
htTP://www.slideshare.net/hrtecheurope/employer-branding-whitepaper-tmp-worldwide
Toelken, K & Mark, P. (2008). Totally burned: A case study on employer branding. Journal of the
Academy of Business Education, 9, p. 1-9

285
Towers Perrin (2003). Working Today: Understanding What Drives Employee Engagement - The
2003 Towers Perrin Talent Report U.S Report. Retrieved on July 20th, 2010 from Tower Perrin
website: http://www.towersperrin.com/tp/getwebcachedoc? Webc =
HRS/USA/2003/200309/Talent_2003.pdf
Trochim, W. (no date). Positivism and post-positivism. Retrieved on August 30th, 2014 from Web
Centre for Social Research Methods website:
http://www.socialresearchmethods.net/kb/positvsm.php
Tsoukas, H. & Chia, R. (2002). On organizational becoming: Rethinking organizational change.
Organization Science, 13, p. 567-582.
Tuli, F. (2010). The basis of distinction between qualitative and quantitative research in social
science: Reflections on ontological, epistemological, and methodological perspectives.
Ethiopian Journal of Education and Sciences, 6(1), p. 97-108
Van Scotter, J., Motowidlo, S. & Cross, T. (2000). Effects of task performance and contextual
performance on systemic rewards. Journal of Applied Psychology, 85(4), p. 526-535.
Vey, M. & Campbell, J. (2004). In-role and extra-role organizational citizenship behavior: Which are
we measuring? Human Performance, 17(1), p 119-135
Viswesvaran, C. & Ones, D. (2000) Perspectives on models of job performance. International
Journal of Selection and Assessment, 8(4), p. 216-226.
Walker, H., Armenakis, A., & Bernerth, J. (2007). Factors influencing organizational change efforts:
An integrative investigation of change content, context, process and individual differences.
Journal of Organizational Change Management, 20(6), p. 761-773.
Walsh, M. (2001). Luring the Best in an Unsettle Time. The New York Times, January 30, 2001
Watson Wyatt Worldwide. (2009). Driving Business Results through Continuous Engagement.
2008/2009 WorkUSA survey report.
Weiss, H., & Cropanzano, R. (1996). Affective events theory. Research in Organizational Behavior,
18, p. 1-74.
Wickham, M., O’Donohue, W., Hanson, D. (2008). Conceptualising the employment value
proposition: The role of the extended marketing mix. Proceedings of the 2008 ANZMAC
Conference.
Wiersma, W. (2000). Research methods in education: An introduction. (7th ed.). Boston: Allyn and
Bacon.
Williams, L. & Anderson, S. (1991). Job satisfaction and organizational commitment as predictors
of organizational citizenship and in-role behaviours. Journal of Management, 17(3), p 601-617
Willis, J.W. (2007). Foundations of qualitative research: Interpretive and critical approaches.
Thousand Oaks, CA: Sage Publications

286
Yin, R. (2002). Applications of Case Study Research (2nd Edition) Applied Social Research Methods
Series – Volume 34. Thousand Oaks, CA: Sage.
Yin, R. (2003). Case study research: Design and method (3rd Edition). Thousand Oaks, CA: Sage.
Zeithaml, V., Bitner, M., & Gremler, D. (2006). Services Marketing: Integrating Customer Focus
Across the Firm (4th ed.). New York: McGraw-Hill.
Zerbe, W., Dobni, D. & Harel, G. (1998). Promoting employee service behavior: the role
perceptions of human resource management practices and service culture. Canadian Journal
of Administrative Sciences, 15(2), p. 165-179
Zhang, Y. (2000). Using the internet for survey research: A case study. Journal of the American
Society for Information Science, 51(1), p. 57-68
Zivnuska, S., Ketchen, D., & Snow, C. (2001). Implications of the converging economy for human
resource management. Research in Personnel and Human Resource Management, 20, p. 371-
405

287
APPENDICES
1. Abbreviations Used in this Dissertation
2. Employer Brand Promises
3. Organizational Citizenship Performance Scale
4. Task Performance Scale
5. Gallup Q12 Workplace Audit Questions
6. Management Interview Questionnaire
7. Table C5-3. Comparisons of the overall Organizational Citizenship Performance (OCP) as well as
overall Task Performance (TP) mean scores between Employer Brand Promise (EBP) Expectation
Fulfilment groups within each benefit-content oriented performance enhancement cluster
8. Table C5-4. Correlations between the expectation fulfillment of Employer Brand Promises (EBP)
within each benefit-content oriented performance enhancement cluster and the demonstrated level
of overall Organizational Citizenship Performance (OCP) as well as overall Task Performance (TP)
9. Table C5-5. Summary of Responses to the Question on Employees’ Employer Brand Promise
Expectation Fulfillment
10. Table C5-6. Summary of Responses by Employee Group to the Question on Employees’ Employer
Brand Promise Expectation Fulfillment
11. Table H1-1. Correlation Matrix – Employer Brand Promise Expectation Fulfilment (EBP) vs.
Organizational Citizenship Performance Behaviours (OCP) and Task Performance Actions (TP)
12. Table H2-1. Comparison between the mean scores of Employer Brand Promise (EBP) Expectation
Fulfilment groups for Employees’ Organizational Citizenship Performance (OCP): Results of ANOVA
and Scheffe Post-Hoc test
13. Table H2-2. Comparison between the mean scores of least influential Employer Brand Promise
(EBP) Expectation Fulfilment groups for Employees’ Organizational Citizenship Performance (OCP):
Results of ANOVA and Scheffe Post-Hoc test
14. Table H2-3. Comparison between the mean scores of the most influential Employer Brand Promise
(EBP) expectation fulfilment groups for employees’ Organizational Citizenship Performance (OCP):
Results of ANOVA and Scheffe Post-Hoc test

288
15. Table H2-4. Comparison between the mean scores of the moderately influential Employer Brand
Promise (EBP) expectation fulfilment groups for employees’ Organizational Citizenship Performance
(OCP): Results of ANOVA and Scheffe Post-Hoc test
16. Table H2-5. Comparison between the mean scores of the Brand Promise (EBP) expectation
fulfilment groups for employees’ Task Performance (TP): Results of ANOVA and Scheffe Post-Hoc
test
17. Table H2-6. Stepwise multiple regression results for the most influential Employer Brand Promises
(EBP): only significant results shown
18. Table H2-7. Stepwise multiple regression results for the moderately influential Employer Brand
Promises (EBP): only significant results shown
19. Table H3-1. Comparison between the mean scores of Employer Brand Promise (EBP) Expectation
Fulfilment groups for Employees’ Level of Concurrence for Perceiving That:
i. Their employment experience is both desirable and distinctive (DDEE)
ii. Their organization is a great place to work (GPTW)
iii. They would be happy to spend the rest of their career with the organization (HSCO)
iv. They DO NOT frequently think of leaving the employment at the organization (NFTL)
20. Table H3-2. Correlation between the Expectation Fulfillment of Individual Employer Brand Promise
(EBP) Items and Employees’ Level of Concurrence for Perceiving That:
i. Their employment experience at the organization is both desirable and distinctive (DDEE).
ii. Their Organization is a Great Place to Work (GPTW).
iii. They are Happy to Spend the Rest of Their Career with the Organization (HSCO).
iv. They DO NOT Frequently Consider Leaving Their Employment at the Organization (NFTL).
21. Table H4-1. Comparison of Organizational Citizenship Performance (OCP) and Task Performance
(TP) Between the Group that Concurs (C) and the Group that does not Concur (DNC) with the
Following Notions:
i. Their employment experience is both desirable and distinctive (DDEE).
ii. Their organization is a great place to work (GPTW).
iii. They would be happy to spend the rest of their career with the organization (HSCO).
iv. They DO NOT frequently think of leaving the employment at the organization (NFTL).

289
1. Abbreviations Used in this Dissertation
The following abbreviations will be used extensively in this chapter for explanations of analyses:
EBP = Employer Brand Promises
Which in this case, represent the 20 employment benefit items with acknowledgements
by the highest number of management interview respondents as being offered to
employees.
OCP = Positive Organizational Citizenship Performance
Which in this case, represents the 17 OCP scale behaviours selected for this study.
TP = Positive Task Performance
Which in this case, represents the 7 TP scale actions39 as used by William and Anderson
in their research, Job satisfaction and organizational commitment as predictors of
organizational citizenship and in-role behaviours (1991).
DDEE = Desirable and distinctive employment experience
GPTW = Great place to work
HSCO = Happy to spend the rest of my career with the organization
NFTL = DO NOT frequently think of leaving my employment with this organization
POI = Projected organizational image
AOI = Actual organizational image
EOI = Experienced organizational identity
39 2 negative actions and their responses were reversed for analysis.

290
2. Employer Brand Promises
EBP
#
Employer Brand Promised Items
Descriptors
Types of Employment
Benefits Based on Extant Literature
EBP Content
Factor Group
1 Opportunity to be a shareholder in a
100% employee-owned structure Economic/Monetary
Personal Stake
and Influence
2 Provision of challenging work Functional or Development and Applications
Opportunities and Growth
3
Comprehensive employee learning and
development programs (e.g. BOB University, coaching, mentoring, buddy
system, educational subsidy, etc.)
Functional or Development and Applications
Opportunities and Growth
4 Flexible work schedule or telecommuting option
Work-life Balance Personal Sustainability
5 Organizational support for team work
and/or collaboration among colleagues Social/Psychological
Connectedness
and Belonging
6 Organizational dedication to technical
excellence
Interest Value/
Organizational Culture and Environment
Significance
and Esteem
7 Competitive compensation Economic/Monetary Personal
Sustainability
8 Opportunity for career growth Functional or Development
and Applications
Opportunities
and Growth
9 Strong organizational commitment to social responsibility and community
engagement
Functional or Development
and Applications
Significance
and Esteem
10 Strong organizational commitment to
employee health and safety
Interest Value/ Organizational Culture and
Environment
Personal
Sustainability
11 An organization that values employee input
Social/Psychological Personal Stake and Influence
12 Fairly flat organizational structure with
low hierarchy
Interest Value/
Organizational Culture and Environment
Personal Stake
and Influence
13 A supportive and caring work culture Social/Psychological Connectedness
and Belonging
14 Opportunities to take on varied/diverse
projects or work activities
Functional or Development
and Applications
Opportunities
and Growth
15 Peer nominated Principals and
Associates System
Interest Value/ Organizational Culture and
Environment
Personal Stake
and Influence
16 A work environment that allows for work-life balance
Work-life Balance Personal Sustainability
17 Organizational support for risk-taking
and innovation
Interest Value/
Organizational Culture and Environment
Opportunities
and Growth
18 Firm organizational commitment to its pledge of honest, fair, and respectful
treatment of employees
Social/Psychological Personal
Sustainability
19 Be part of a successful and highly respected organization
Symbolic Significance and Esteem
20 Opportunities for international
assignments or employee exchanges
Functional or Development
and Applications
Opportunities
and Growth

291
3. Organizational Citizenship Performance Scale
Positive Organizational Citizenship Performance Behavioural Descriptors
Selected
Performance
Themes Sources
1 Being mindful of how your behavior affected other people’s work in the organization
Helping Behaviour - courtesy
Vey & Campbell (2004)
2 Risked disapproval in order to express your
beliefs about what's best for the organization Civic Virtue
MacKenzie, Podsakoff
& Fetter (1993)
3 Attended functions that were not required but that helped the organizational image
Civic Virtue
MacKenzie, Podsakoff
& Fetter (1993); Lee
& Allen (2002)
4 Diligently followed organizational rules, policies, and procedures
Organizational
Compliance - conscientiousness
Adapted from
MacKenzie, Podsakoff & Fetter (1993)
5 Defended the organization when other
employees criticized it
Organizational
Loyalty
Moorman and Blakely
(1995); Lee & Allen (2002)
6 Volunteered to carry out tasks that are not
formally part of your job responsibilities
Individual
Initiative
Borman & Motowidlo
(1997)
7
Maintained a positive attitude even when things
at work were not going the way you wanted
them to go
Sportsmanship Podsakoff et. al. (2000)
8
Voluntarily enhanced your knowledge and skills
(e.g. enrolling in a relevant course) in order
that you can perform your existing job better
Self-Development Adapted from George & Brief (1992)
9 Went above and beyond the call of duty when
doing your job
Individual
Initiative
Moorman and Blakely
(1995)
10 Went out of your way to make newer
employees feel welcome in the work group Helping Behaviour
Moorman and Blakely (1995); Lee & Allen
(2002)
11 Kept up with developments in the organization Civic Virtue MacKenzie, Podsakoff & Fetter (1993); Lee
& Allen (2002)
12
Offered ideas for organizational improvements
(e.g. in operations, administration, products
and services)
Individual Initiative
Adapted from Lee & Allen (2002)
13 Sacrificed your own interest for the good of
your organization and/or work team Sportsmanship
Podsakoff et. al.
(2000)
14 Showed genuine concern and courtesy toward coworkers, even under the most trying business
or personal situations
Helping Behaviour Moorman and Blakely (1995); Lee & Allen
(2002)
15 Showed pride when representing the
organization in public
Organizational
Loyalty
Moorman and Blakely (1995); Lee & Allen
(2002)
16
Voluntarily pursued new knowledge and skills (e.g. advancing your professional credentials)
so that you may take on more complex assignments and/or a higher level position
within the organization
Self-Development Adapted from George
& Brief (1992)
17 Willingly gave up your time to help co-workers who had work-related problems
Helping Behaviour - Alturism
Adapted from Lee & Allen (2002)

292
4. Task Performance Scale
TP # Task Performance Action Descriptors
Source: William and Anderson (1991)
1 Adequately completed assigned duties
2 Fulfilled responsibilities specified in your job description
3 Performed tasks that were expected of you
4 Met formal performance requirements of your job
5 Engaged in activities that would positively affect your performance evaluation
6 NOT Neglected aspects of your job that you were expected to perform (reversed)
7 NOT Failed to perform essential duties (reversed)

293
5. Gallup Q12 Workplace Audit Questions
The Q12 statements are:
Q00. (Overall Satisfaction) On a 5-point scale, where “5” is extremely satisfied and “1” is extremely
dissatisfied, how satisfied are you with (your company) as a place to work?
Q01. I know what is expected of me at work.
Q02. I have the materials and equipment I need to do my work right.
Q03. At work, I have the opportunity to do what I do best every day.
Q04. In the last seven days, I have received recognition or praise for doing good work.
Q05. My supervisor, or someone at work, seems to care about me as a person.
Q06. There is someone at work who encourages my development.
Q07. At work, my opinions seem to count.
Q08. The mission or purpose of my company makes me feel my job is important.
Q09. My associates or fellow employees are committed to doing quality work.
Q10. I have a best friend at work.
Q11. In the last six months, someone at work has talked to me about my progress.
Q12. This last year, I have had opportunities at work to learn and grow.
Source:
Harter, J.K., Schmidt, F.L., Agrawal, S., Plowman, S.K. (2013). The relationship between engagement at work and organizational outcomes: Meta-analysis research paper. Retrieved
September 13, 2013 from Gallup website:
http://www.gallup.com/strategicconsulting/126806/q12-meta-analysis.aspx

294
6. Management Interview Questionnaire
Research Overview
As one of the most recognized top/best employer in Canada, BOB has been specifically selected
among a large number of organizations to participate in this doctoral research on the relationship
between employer branding and employee performance. More specifically, the research will
investigate the influence of employer brand promise fulfillment on two dimensions of employee
performance - ask performance and organizational citizenship performance.
As a manager of BOB, your responses to the interview will offer the researcher with an
understanding of the philosophies, traits, practices, and provisions engaged by BOB to brand and
distinguish itself as an employer of choice for job applicants and existing employees. More
specifically, the interview aims to:
Identify the employment values/promises inherent in BOB’s employer brand.
Examine how the organization materializes its employer brand values/promises.
Examine how the organization uses it employer brand promises to enhance employee
performance.
Naturally, the completion of this doctoral research will not be possible without your input and
support. As such, your participation is both relevant and significant.
The information you share will be kept STRICTLY CONFIDENTIAL. NO member of BOB will see or
have access to your individual responses to the interview. As such, I hope that you will answer the
questions as honestly as possible.
The aggregate results (cumulative responses from all participants) of the interviews will be used to
establish part of the questionnaire for a larger scale follow-up survey of employees. They will also
form part of the researcher’s doctoral dissertation. A copy of this dissertation will be provided to
BOB.
If you have any questions concerning the study, please do not hesitate to contact me, Hendriatta
Wong or my research supervisor, Dr. Stuart Roper:
Primary Contact:
Hendriatta Wong
Doctoral Candidate
Manchester Business School
The University of Manchester
Work Phone: 1-780-413-7831
Work Email: [email protected]
Research Supervisor:
Dr. Stuart Roper
Senior Lecturer, Marketing
Manchester Business School
The University of Manchester
Work Phone: +44 (0)161 306 3475
Work Email: [email protected]
Please accept my deepest appreciation for your participation in this research.

295
Management Personnel Informed Consent Form
Purpose: You are invited to participate in a doctoral research conducted by Hendriatta Wong, a
doctoral candidate at the University of Manchester, United Kingdom. The purpose of the research
is to examine the relationship between employer branding and employee performance. More
specifically, the research will investigate the influence of employer brand promise fulfillment on two
dimensions of employee performance - task performance and citizenship performance.
Participation Requirements: Your participation in this research involves engaging in a one-on-
one interview with the researcher. The interview will take approximately 60 minutes. In the
interview, your opinions and observations will be sought on the philosophies, practices, provisions,
and traits that shape BOB’s employer brand and its effort to distinguish itself as an employer of
choice for job applicants and existing employees.
Confidentiality: The information you share will be kept STRICTLY CONFIDENTIAL. NO member
of BOB will see or have access to your individual responses to the interview. This completed
informed consent form will be kept separate from your interview data and no identifying
information will remain with your data. The researcher is interested in the collective responses
among a group of people and not in the single response of any one person. Analyses will be done
on the collective data and the aggregate results (cumulative responses from all participants) will be
used to establish part of the questionnaire for a larger scale follow-up survey of employees. They
will also form part of the researcher’s doctoral dissertation. Again, the dissertation will NOT contain
any identifying information about you personally. A copy of this dissertation will be provided to
BOB
Right to Refuse Participation: Your participation in this research is completely voluntary. You
are free to refuse participation without any fear of negative consequences. Should you choose to
participate but conclude sometime during the interview session that you are unable or unwilling to
continue, you may also terminate your participation at that time.
Contact: The following individuals are involved with the research and may be contacted at any
time for further information or questions. The primary researcher of this project is Hendriatta
Wong and the research supervisor for this project is Dr. Stuart Roper (PhD).
Primary Contact:
Hendriatta Wong
Doctoral Candidate
Manchester Business School
The University of Manchester
Work Phone: 1-780-413-7831
Work Email: [email protected]
Research Supervisor:
Dr. Stuart Roper
Senior Lecturer, Marketing
Manchester Business School
The University of Manchester
Work Phone: +44 (0)161 306 3475
Work Email: [email protected]
I have read the above information and understand the conditions of my participation. My signature
indicates my full consent to participate in the research. I also understand that I will retain a copy
of this informed consent form for my own records.
Participant’s Signature:
Participant’s Name:
Date:

296
Management Interview Questions
Identifying elements of employer branding
How does BOB brand and distinguish itself as an employer of choice?
What are the departments or employee groups that are involved in planning, developing, and
executing the organization’s employer branding strategies?
Disseminating and fulfilling employer brand promises
An organization’s employer brand typically reflects certain employment values and benefits that the
organization offers as an employer and as a place of employment. These employment values and
benefits have been referred to as “employer brand promises”. It is assumed that an individual who
becomes an employee of the organization can expect to have these promises fulfilled for him/her.
What are the key employment promises reflected in BOB’s employer brand? In other words,
what can job applicants and employees expect from BOB as an employer and as a place of employment?
Can an employee expect to have a distinctive and desirable overall work experience at BOB
(compared to what they would have by working for most other organizations)? If so, how so?
How are these employer brand promises communicated to job applicants?
o Do existing employees play a role in communicating these promises to potential employees? If so, how so?
How are these promises fulfilled for employees by the organization?
How does BOB determine if these promises are desired and valued by potential and actual
employees? o What sort of investigation/benchmark would be used to find the answer?
o When information is gained, how often would it be used to adjust the organization’s
own employment value propositions to remain attractive to potential and actual employees?
Do the organization’s senior leaders play a role in shaping the organization’s employer brand
and/or in directing its employer branding efforts? If so, in what way?
Determining the status, challenges and end goal(s) of employer branding
What are the most important goals that BOB wish to accomplish through its employer branding
efforts?
In your opinion, have BOB’s employer branding efforts been successful in bringing about these
accomplishments? How are the results tracked and measured? (NOTE: The researcher will
also work with the organization-designated representative to confirm the measures used and results tracked by the organization)
What are the main barriers experienced by the organization in its employer branding efforts?
How does the organization deal with these barriers? How has BOB linked its employer brand promises to the enhancement of employee
performance?
o How does BOB verify performance enhance for each of these?
How has BOB linked it overall employer branding efforts to the enhancement of employee
performance? o How does BOB verify performance enhance for each of these?

297
7. Table C5-3. Comparisons of the overall Organizational Citizenship
Performance (OCP) as well as overall Task Performance (TP) mean scores
between Employer Brand Promise (EBP) Expectation Fulfilment groups
within each benefit-content oriented performance enhancement cluster
Employment Benefit Content Factor Clusters
Overall OCP Overall TP
N Mean Standard Deviation
Significance, p-value
N Mean Standard Deviation
Significance, p-value
Personal Sustainability EBP 4, 7, 10, 16, 18
No expectations and low fulfillment
113 3.96 0.82
0.013
113 5.18 0.63
0.047
High fulfillment 169 4.21 0.85 167 5.33 0.58
Connectedness and Belonging EBP 5, 13
No expectations and low fulfillment
73 3.96 0.73
0.059
73 5.22 0.58
0.397
High fulfillment 209 4.17 0.88 207 5.29 0.61
Opportunities and Growth EBP 2, 3, 8, 14, 17, 20
No expectations and low fulfillment
161 3.89 0.87
<0.001
161 5.21 0.63
0.054
High fulfillment 121 4.42 0.71 119 5.35 0.57
Personal stake and Influence EBP 1, 11, 12, 15
No expectations and low fulfillment
147 3.90 0.86
<0.001
147 5.24 0.63
0.395
High fulfillment 135 4.35 0.76 133 5.30 0.58
Significance and Esteem EBP 6, 9, 19
No expectations and low fulfillment
91 3.81 0.76
<0.001
91 5.17 0.58
0.047
High fulfillment 191 4.26 0.85 189 5.32 0.61

298
8. Table C5-4. Correlations between the expectation fulfillment of Employer
Brand Promises (EBP) within each benefit-content oriented performance
enhancement cluster and the demonstrated level of overall Organizational
Citizenship Performance (OCP) as well as overall Task Performance (TP)
Employment Benefit Content Factor Clusters
Overall OCP Overall TP
Personal Sustainability EBP 4, 7, 10, 16, 18
Pearson Correlation .196** .174**
Significance, p-value .001 .004
N 282 280
Connectedness and Belonging EBP 5, 13
Pearson Correlation .212** .149*
Significance, p-value .000 .013
N 282 280
Opportunities and Growth EBP 2, 3, 8, 14, 17, 20
Pearson Correlation .379** .139*
Significance, p-value .000 .020
N 282 280
Personal stake and Influence EBP 1, 11, 12, 15
Pearson Correlation .320** .077
Significance, p-value .000 .202
N 282 280
Significance and Esteem EBP 6, 9, 19
Pearson Correlation .335** .128*
Significance, p-value .000 .033
N 282 280
Notes:
**. Correlation is significant at the 0.01 level (2-tailed).
*. Correlation is significant at the 0.05 level (2-tailed).

299
9. Table C5-5. Summary of Responses to the Question on Employees’ Employer
Brand Promise Expectation Fulfillment
Survey Responses:
0 = You have no expectation for this promise
1 = BOB has not fulfilled your expectation at all
2 = BOB has partially but not adequately fulfilled your expectation 3 = BOB has adequately fulfilled your expectation
4 = BOB has more than adequately fulfilled your expectation
Survey Responses 0 1 & 2 3 & 4 χ2 Significance,
p-value
Responses 3 & 4
Separated
Brand Promises
3 4
Strong organizational commitment to employee health and safety
1% 8% 91% 150.38 <0.001 38% 53%
Be part of a successful and highly respected organization
2% 10% 88% 130.34 <0.001 53% 35%
Firm organizational commitment to its pledge of honest, fair, and respectful treatment of employees
1% 16% 83% 114.38 <0.001 55% 28%
Provision of challenging work 0% 17% 83% 115.34 <0.001 55% 28%
A supportive and caring work culture 2% 16% 82% 105.62 <0.001 56% 26%
Opportunity to be a shareholder in a 100% employee-owned structure
12% 8% 80% 98.24 <0.001 30% 50%
Organizational dedication to technical excellence
3% 18% 79% 97.22 <0.001 52% 27%
An organization that values employee input
2% 21% 77% 91.22 <0.001 56% 21%
Organizational support for team work and/or collaboration among colleagues
1% 22% 77% 91.22 <0.001 55% 22%
Opportunities to take on varied/diverse projects or work activities
1% 24% 75% 86.06 <0.001 53% 22%
Strong organizational commitment to social responsibility and community engagement
5% 20% 75% 81.50 <0.001 55% 20%
Opportunity for career growth 3% 24% 73% 77.42 <0.001 46% 27%
Flexible work schedule or telecommuting option
4% 27% 69% 65.18 <0.001 37% 32%
Comprehensive employee learning and
development programs (e.g. BOB U, coaching, mentoring, buddy system, educational subsidy, etc.)
3% 33% 64% 57.74 <0.001 44% 21%
Competitive compensation 2% 34% 64% 57.68 <0.001 50% 13%
A work environment that allows for worklife balance
2% 38% 60% 51.44 <0.001 43% 16%
Peer nominated Principals and Associates System
25% 17% 58% 28.34 <0.001 37% 21%
Fairly flat organizational structure with low hierarchy
11% 33% 56% 30.38 <0.001 44% 11%
Organizational support for risk-taking and innovation
10% 37% 53% 27.44 <0.001 44% 8%
Opportunities for international
assignments or employee exchanges 22% 31% 47% 9.62 0.008 29% 17%

300
10. Table C5-6. Summary of Responses by Employee Group to the Question on
Employees’ Employer Brand Promise Expectation Fulfillment
Survey Responses:
0 = You have no expectation for this promise 1 = BOB has not fulfilled your expectation at all
2 = BOB has partially but not adequately fulfilled your expectation
3 = BOB has adequately fulfilled your expectation 4 = BOB has more than adequately fulfilled your expectation
Number of Respondents 16 22 30 231
χ2 Significance,
p-value
Survey Responses 3 & 4 3 & 4 3 & 4 3 & 4
STATUS Confirmation of whether respondents
hold status of Principal/Associate, Manager, both, or neither
Principal/Associate YES YES NO NO
Manager YES NO YES NO
Provision of challenging work 100% 100% 83% 80% 3.82 0.281
Strong organizational commitment to employee health and safety
100% 95% 93% 90% 0.56 0.905
Be part of a successful and highly respected organization
100% 95% 90% 85% 1.35 0.717
Opportunity for career growth 100% 95% 73% 69% 8.58 0.035
Peer nominated Principals and Associates System 100% 95% 43% 53% 34.54 <0.001
Opportunity to be a shareholder in a 100% employee-owned structure
100% 91% 83% 77% 3.40 0.333
A supportive and caring work culture 100% 86% 80% 80% 3.09 0.378
Firm organizational commitment to its pledge of honest, fair, and respectful treatment of employees
94% 100% 80% 81% 3.28 0.351
Opportunities to take on varied/diverse projects or work activities
94% 91% 70% 73% 5.49 0.139
An organization that values employee input 94% 86% 80% 75% 2.40 0.494
Strong organizational commitment to social responsibility and community engagement
94% 86% 70% 73% 4.69 0.196
Competitive compensation 94% 86% 63% 59% 11.67 0.009
Organizational support for team work and/or collaboration among colleagues
88% 95% 63% 77% 7.24 0.065
Comprehensive employee learning and development programs
88% 77% 60% 62% 7.31 0.063
Fairly flat organizational structure with low hierarchy 81% 77% 53% 52% 10.81 0.013
Organizational dedication to technical excellence 69% 86% 73% 80% 2.21 0.530
Flexible work schedule or telecommuting option 69% 68% 73% 69% 0.21 0.976
A work environment that allows for worklife balance 69% 64% 63% 58% 0.96 0.811
Opportunities for international assignments or employee exchanges
69% 45% 43% 46% 8.84 0.031
Organizational support for risk-taking and innovation 50% 82% 57% 49% 11.98 0.007

301
11. Table H1-1. Pearson’s Correlation matrix – Employer Brand Promise (EBP)
Expectation Fulfilment vs. Organizational Citizenship Performance
Behaviours (OCP) and Task Performance Actions (TP)
Employer Brand Promises
OCP
# EBP 1 EBP 2 EBP 3 EBP 4 EBP 5 EBP 6 EBP 7 EBP 8 EBP 9
EBP
10
EBP
11
EBP
12
EBP
13
EBP
14
EBP
15
EBP
16
EBP
17
EBP
18
EBP
19
EBP
20
1 (HB) -0.01 0.06 0.04 0.11 0.05 .164** 0.11 0.06 .145* 0.06 0.06 0.09 0.08 .126* 0.04 0.01 0.05 0.11 0.01 0.02
2 (CV) 0.1 0.05 0 .121* -0.03 -0.03 0.04 0.09 .150* -0.07 0.03 0.11 0.02 .136* .229** 0.06 .204** 0.04 0.11 .192**
3 (CV) .137* .135* .166** -0 .144* .132* 0.09 .247** .146* 0.1 0.1 0.11 .119* .139* .140* 0.09 .229** 0.09 .143* .169**
4 (OC) -0.03 -0.01 0.12 0.1 .184** .200** .164** 0.1 0.06 0.09 .150* .123* .149* 0.06 0.05 .178** 0.12 0.11 .154** -0
5 (OL) .217** .220** 0.11 0.11 .196** .307** .196** .284** .241** .154** .232** .226** .238** .303** .276** .160** .334** .139* .288** .300**
6 (II) 0.07 0.11 -0.04 0.01 0.08 0.06 0.01 0.03 0.12 -0.06 0.02 0.04 .120* .202** .140* 0.02 .140* 0.07 0.08 .124*
7 (SM) 0.09 .164** .128* 0.1 .234** .257** .211** .241** .265** .148* .221** .175** .200** .277** .199** .162** .241** .196** .257** .211**
8 (SD) -0.08 0.02 .128* 0.1 0.1 0.04 0.02 .166** .170** .140* .185** 0.1 .121* .158** 0.01 .175** 0.07 0.04 .158** .121*
9 (II) .124* .211** 0.01 0.01 0.07 .185** 0.11 0.09 .172** -0.02 0.03 0.1 0.04 .210** .194** -0.07 0.12 0.02 0.08 .152*
10 (HB) .177** .189** 0.07 0.1 0.07 0.08 0.11 .127* 0.08 -0.05 0.04 .156** 0.04 .150* .187** 0.04 .197** 0.03 0.01 .195**
11 (CV) .163** .177** .166** .126* .201** .291** .137* .221** .209** 0.12 .222** .200** .182** .255** .289** .175** .251** 0.1 .177** .320**
12 (II) .145* 0.09 0.06 0.05 0.09 0.06 .153* .123* .179** -0.05 0.08 .170** 0.05 .147* .204** 0.03 .176** 0.01 .132* .197**
13 (SM) .123* 0.11 -0 -0.08 -0.03 0.08 0.07 0.04 0.08 -0.09 0.01 0.06 -0.01 0.1 .209** -0.12 .129* 0.04 0.1 .156**
14 (HB) 0.05 0.03 -0.04 0.07 0.12 .156** 0.06 .118* .198** 0.03 0.07 0.11 0.06 .131* .194** 0.08 .143* .225** 0.1 .174**
15 (OL) .135* .227** .170** 0.11 .237** .265** .224** .333** .253** .214** .250** .278** .217** .263** .314** .187** .164** .175** .235** .181**
16 (SD) 0 -0.01 0.06 0.04 0.09 .122* 0 .172** .120* 0.09 .118* 0.08 0.06 .128* .125* 0.07 .173** -0.05 0.1 .136*
17 (HB) 0.12 0.11 0.04 .131* 0.1 0.03 .125* .164** .197** -0 0.1 0.12 .132* .207** .133* 0.03 .153** .118* .180** .176**
Employer Brand Promises
TP # EBP 1 EBP 2 EBP 3 EBP 4 EBP 5 EBP 6 EBP 7 EBP 8 EBP 9 EBP 10
EBP 11
EBP 12
EBP 13
EBP 14
EBP 15
EBP 16
EBP 17
EBP 18
EBP 19
EBP 20
TP 1 -0 -0.01 0.06 0.03 0.09 0.08 0.04 0.04 0.01 -0.03 0.08 -0 0.08 0.08 -0 .132* -0.02 .119* 0.07 0.07
TP 2 0.02 0.03 0 0.04 0.06 .122* 0.04 0.05 0.02 0.02 .129* 0.05 0.03 -0.01 0 0.05 .150* .164** 0.08 0.1
TP 3 0.04 0.04 0.06 0.1 0.1 0.07 -0.01 0.08 -0.01 0.06 .141* 0.06 0.11 0.11 0.05 .182** 0.09 .196** 0.11 .142*
TP 4 0.08 0.04 0.04 .171** 0.09 0.09 -0.02 .121* 0.11 0.04 .196** 0.1 0.1 0.04 0.08 .230** 0.1 .173** 0.12 0.05
TP 5 .134* .125* 0.08 .143* .121* 0.11 0.09 .161** 0.11 0.05 .190** .119* 0.11 .156** .192** .157** .194** 0.1 0.09 .176**
TP 6
Reversed
-
.196** -0.02 0.08 0.03 0.06 0.05 -0.03 -0.04 0.05 0.03 0.08 0.01 .149* 0.06 -0.08 0.1 -0.02 0.12 0.05 0.03
TP 7
Reversed
-
.155** -0.02 0.02 0.05 0.03 0.02 0.01 0.03 0.03 -0.02 .132* -0.06 0.1 0.1 -0.02 .119* -0.02 .164** 0.07 0.02
Notes:
** Correlation is significant at the 0.01 level (2-tailed)
* Correlation is significant at the 0.05 level (2-tailed)
Abbreviations:
CV = Civic Virtue (3 behaviours in OCP scale)
HB = Helping Behaviour (4 behaviours in OCP scale)
II = Individual Initiative (3 behaviours in OCP scale)
OC = Organizational Compliance (1 behaviours in OCP scale)
OL = Organizational Loyalty (2 behaviours in OCP scale)
SD = Self-Development (2 behaviours in OCP scale)
SM = Sportsmanship (2 behaviours in OCP scale)

302
12. Table H2-1. Comparison between the mean scores of Employer Brand
Promise (EBP) Expectation Fulfilment groups for Employees’ Organizational
Citizenship Performance (OCP): Results of ANOVA and Scheffe Post-Hoc
test
Variable Mean Scores of Organizational Citizenship Performance Behaviours
OCP # and Type
1 (HB) 2 (CV) 3 (CV) 4 (OC) 5 (OL) 6 (II) 7 (SM) 8 (SD) 9 (II) 10 (HB) 11 (CV) 12 (II) 13 (SM) 14 (HB) 15 (OL) 16
(SD) 17 (HB)
EBP 1
NE 4.77 2.63 2.29 4.94 2.77* 4.2 4.14 4.2 4.31 3.89* 3.74 3.34 3.34 4.57 4.09 3.89 4.17
LF 4.76 3.71 2.33 4.29 3.29 4.35 4.19 3.67 4.57 3.86 3.24^ 3.48 3.38 4.62 3.95 3.33 4.48
HF 4.7 3.23 3.05 4.74 3.77* 4.47 4.38 3.75 4.7 4.56* 4.16^ 3.85 3.82 4.77 4.66 3.91 4.62
EBP
2
NE - - - - - - - - - - - - - - - - -
LF 4.58 3.17 2.48 4.81 2.79^ 4.04 3.85^ 3.92 4.23^ 3.88^ 3.77 3.65 3.4 4.77 3.9^ 4.08 4.46
HF 4.74 3.2 2.99 4.71 3.78^ 4.51 4.43^ 3.77 4.73^ 4.54^ 4.1 3.79 3.79 4.73 4.67^ 3.82 4.57
EBP 3
NE 5 2.57 2 4.57 2.57 4.57 3.86 3.14 4.57 4.57 3.43 3.29 3.43 4.86 3* 3.57 4.14
LF 4.56 3.24 2.45^ 4.62 3.49 4.55 4.15 3.51 4.69 4.26 3.8 3.73 3.69 4.78 4.22 3.79 4.49
HF 4.78 3.19 3.15^ 4.79 3.71 3.36 4.44 3.96 4.62 4.5 4.18 3.8 3.76 4.72 4.74* 3.91 4.59
EBP 4
NE 4.1 1.6&* 2.8 4.8 2.8 3.4& 3.9 4.2 3.9 3.4 3.3 3.1 3.6 4.1 3.7 4.4 3.2&*
LF 4.61 3.07& 2.97 4.55 3.51 4.57& 4.3 3.36 4.72 4.41 3.85 3.76 3.85 4.76 4.45 3.58 4.49&
HF 4.79 3.32* 2.88 4.79 3.69 4.43 4.37 3.94 4.65 4.48 4.15 3.8 3.69 4.76 4.61 3.94 4.64*
EBP 5
NE 5.67 2.67 0.67 4 2.33 4.67 3.33 2.67 4.67 5.33 3 2.33 3.67 6 2.67 3 4.67
LF 4.46 3.35 2.53 4.47 3.14 4.4 4.07 3.67 4.7 4.33 3.89 3.88 3.82 4.54 4.14 3.93 4.61
HF 4.77 3.16 3.03 4.81 3.75 4.43 4.41 3.85 4.63 4.44 4.09 3.75 3.7 4.77 4.66 3.86 4.53
EBP
6
NE 3.86 3.43 1.29 4.86 1.71* 4.43 4.29 3.86 4.14 4.57 3 3 3 4.86 3.86 3 5.14
LF 4.53 3.43 2.73 4.12^ 2.86^ 4.29 3.84^ 3.84 4.47 4.14 3.55^ 3.8 3.67 4.35^ 3.75^ 3.73 4.22
HF 4.79 3.13 2.99 4.87^ 3.84*
^ 4.46 4.45^ 3.79 4.7 4.49 4.19^ 3.78 3.76 4.82^ 4.74^ 3.92 4.61
EBP 7
NE 5 2.83 3.17 4.83 2.83 4 3.5 3.83 5 3.67 4 3.67 3.67 4.83 3.67 4.5 3.67
LF 4.46^ 3.17 3.68 4.49^ 3.29 4.38 3.99^ 3.77 4.38^ 4.33 3.84 3.35^ 3.59 4.62 4.23^ 3.74 4.43
HF 4.84^ 3.21 3.01 4.85^ 3.8 4.47 4.54^ 3.81 4.77^ 4.5 4.75 3.97^ 3.8 4.79 4.72^ 3.9 4.64
EBP 8
NE 4.5 1.88 1.5* 4.25 1.25*& 4.13 3.25* 2.75 4.13 3.88 2.88* 2.5 3.13 4.25 3.13* 2.75 3.75
LF 4.52 3.28 2.18^ 4.55 3.07& 4.36 3.93^ 3.54 4.58 4.27 3.69^ 3.67 3.64 4.57 3.61^ 3.63 4.25
HF 4.79 3.21 3.19*
^ 4.81 3.88* 4.46 4.51*^ 3.92 4.68 4.5
4.20*
^ 3.84 3.78 4.81 4.89*^ 3.98 4.68
EBP
9
NE 4.29 2.21 2.07 4.71 2.4* 3.2*& 3.5* 2.71 3.9* 3.71 3.36 2.7* 3.29 4.14 3.93 2.71* 3.64*
LF 4.59 3.03 2.66 4.57 3^ 4.55& 4.1 3.47 4.55 4.45 3.7^ 3.48 3.71 4.66 3.9^ 3.95 4.43
HF 4.78 3.3 3.02 4.78 3.87*
^ 4.47* 4.45* 3.96 4.72* 4.47 4.20^ 3.91* 3.76 4.8 4.76^ 3.91* 4.64*
EBP 1
0 NE 3.5 2 0 5.5 1 2.5 2.5 2 4 4.5 3 4 4 4.5 1.5 2 4
LF 4.68 3.5 2.55 4.05^ 2.64^ 4.73 4.09 3.14 4.82 4.68 3.45 3.64 4.14 4.73 3.77^ 3.36 4.77
HF 4.73 3.17 2.95 4.78^ 3.72^ 4.42 4.37 3.87 4.63 4.4 4.1 3.77 3.69 4.74 4.62*^ 3.92 4.53
EBP 1
1 NE 4.25 1.25 0.75 4 0.75*& 3.75 2.5* 0.5*& 4 4.5 1.75*& 1.75 2.25 4.5 1.75*& 2.25 4
LF 4.7 3.26 2.61 4.47 3.25& 4.42 3.98^ 3.60& 4.68 4.37 3.88& 3.7 4.07 4.65 4.14^& 3.82 4.4
HF 4.73 3.21 3.01 4.81 3.76* 4.44 4.46*^ 3.91* 4.64 4.44 4.13* 3.81 3.67 4.76 4.69*^ 3.9 4.6
EBP 1
2 NE 4.61 2.52 2.87 4.61 3.19 4.26 3.97 3.87 4.45 4.03 3.71 2.81*& 3.39 4.52 4.06* 3.94 4.29
LF 4.6 3.16 2.53 4.51^ 3.08^ 4.37 4.19 3.57 4.51 4.17^ 3.78^ 3.82& 3.73 4.6 4.02^ 3.56 4.37
HF 4.81 3.35 3.13 4.89^ 4.02^ 4.49 4.49 3.92 4.76 4.86^ 4.27^ 3.92* 3.79 4.87 4.94*^ 4.03 4.71
EPB 1
3 NE 4.5 2.25 0.5* 4 2 2.75 3.5 3 4.5 5 3.25 3.75 4 5.25 2.75* 2.75 4
LF 4.49 2.98 2.57 4.47 3.13 4.34 4.04 3.38 4.68 4.28 3.66 3.53 3.66 4.64 3.91^ 3.81 4.36
HF 4.77 3.25 3.01* 4.8 3.74 4.47 4.41 3.9 4.64 4.45 4.13 3.81 3.74 4.75 4.69*^ 3.89 4.6
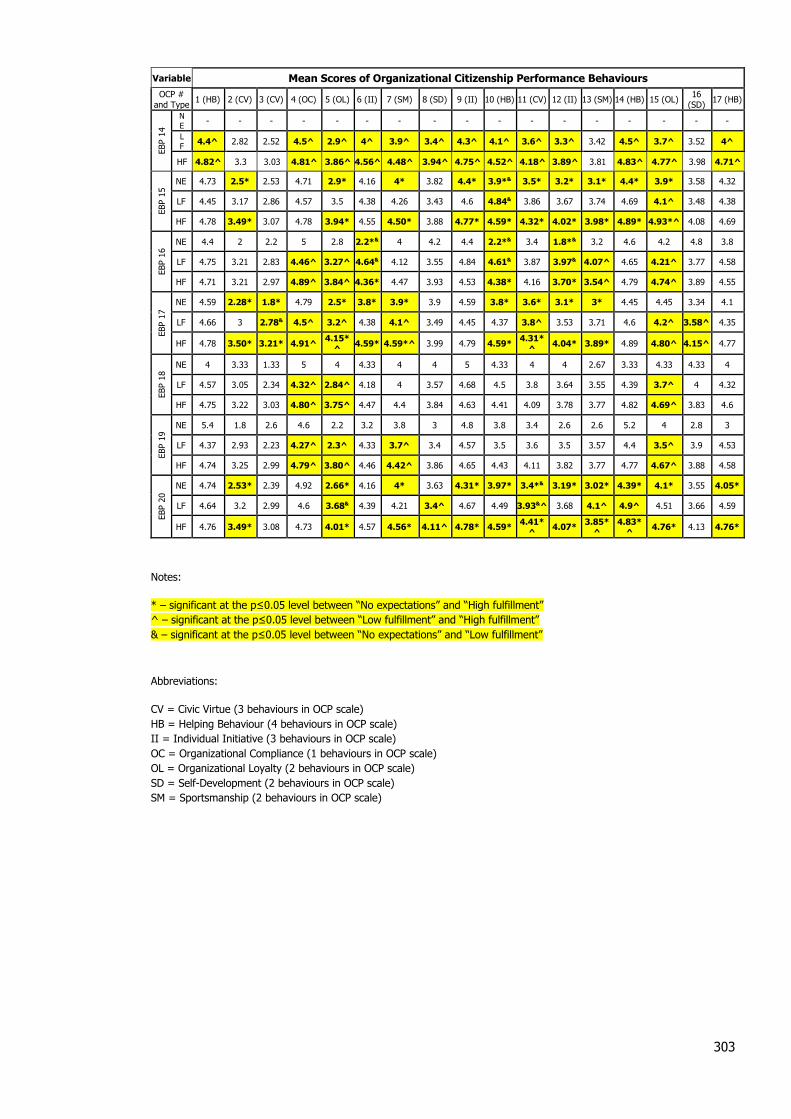
303
Notes:
* – significant at the p≤0.05 level between “No expectations” and “High fulfillment”
^ – significant at the p≤0.05 level between “Low fulfillment” and “High fulfillment”
& – significant at the p≤0.05 level between “No expectations” and “Low fulfillment”
Abbreviations:
CV = Civic Virtue (3 behaviours in OCP scale)
HB = Helping Behaviour (4 behaviours in OCP scale)
II = Individual Initiative (3 behaviours in OCP scale)
OC = Organizational Compliance (1 behaviours in OCP scale)
OL = Organizational Loyalty (2 behaviours in OCP scale)
SD = Self-Development (2 behaviours in OCP scale)
SM = Sportsmanship (2 behaviours in OCP scale)
Variable Mean Scores of Organizational Citizenship Performance Behaviours
OCP #
and Type 1 (HB) 2 (CV) 3 (CV) 4 (OC) 5 (OL) 6 (II) 7 (SM) 8 (SD) 9 (II) 10 (HB) 11 (CV) 12 (II) 13 (SM) 14 (HB) 15 (OL)
16
(SD) 17 (HB)
EBP 1
4
N
E - - - - - - - - - - - - - - - - -
L
F 4.4^ 2.82 2.52 4.5^ 2.9^ 4^ 3.9^ 3.4^ 4.3^ 4.1^ 3.6^ 3.3^ 3.42 4.5^ 3.7^ 3.52 4^
HF 4.82^ 3.3 3.03 4.81^ 3.86^ 4.56^ 4.48^ 3.94^ 4.75^ 4.52^ 4.18^ 3.89^ 3.81 4.83^ 4.77^ 3.98 4.71^ EBP 1
5 NE 4.73 2.5* 2.53 4.71 2.9* 4.16 4* 3.82 4.4* 3.9*& 3.5* 3.2* 3.1* 4.4* 3.9* 3.58 4.32
LF 4.45 3.17 2.86 4.57 3.5 4.38 4.26 3.43 4.6 4.84& 3.86 3.67 3.74 4.69 4.1^ 3.48 4.38
HF 4.78 3.49* 3.07 4.78 3.94* 4.55 4.50* 3.88 4.77* 4.59* 4.32* 4.02* 3.98* 4.89* 4.93*^ 4.08 4.69
EBP 1
6 NE 4.4 2 2.2 5 2.8 2.2*& 4 4.2 4.4 2.2*& 3.4 1.8*& 3.2 4.6 4.2 4.8 3.8
LF 4.75 3.21 2.83 4.46^ 3.27^ 4.64& 4.12 3.55 4.84 4.61& 3.87 3.97& 4.07^ 4.65 4.21^ 3.77 4.58
HF 4.71 3.21 2.97 4.89^ 3.84^ 4.36* 4.47 3.93 4.53 4.38* 4.16 3.70* 3.54^ 4.79 4.74^ 3.89 4.55
EBP 1
7
NE 4.59 2.28* 1.8* 4.79 2.5* 3.8* 3.9* 3.9 4.59 3.8* 3.6* 3.1* 3* 4.45 4.45 3.34 4.1
LF 4.66 3 2.78& 4.5^ 3.2^ 4.38 4.1^ 3.49 4.45 4.37 3.8^ 3.53 3.71 4.6 4.2^ 3.58^ 4.35
HF 4.78 3.50* 3.21* 4.91^ 4.15*
^ 4.59* 4.59*^ 3.99 4.79 4.59*
4.31*
^ 4.04* 3.89* 4.89 4.80^ 4.15^ 4.77
EBP 1
8 NE 4 3.33 1.33 5 4 4.33 4 4 5 4.33 4 4 2.67 3.33 4.33 4.33 4
LF 4.57 3.05 2.34 4.32^ 2.84^ 4.18 4 3.57 4.68 4.5 3.8 3.64 3.55 4.39 3.7^ 4 4.32
HF 4.75 3.22 3.03 4.80^ 3.75^ 4.47 4.4 3.84 4.63 4.41 4.09 3.78 3.77 4.82 4.69^ 3.83 4.6
EBP 1
9 NE 5.4 1.8 2.6 4.6 2.2 3.2 3.8 3 4.8 3.8 3.4 2.6 2.6 5.2 4 2.8 3
LF 4.37 2.93 2.23 4.27^ 2.3^ 4.33 3.7^ 3.4 4.57 3.5 3.6 3.5 3.57 4.4 3.5^ 3.9 4.53
HF 4.74 3.25 2.99 4.79^ 3.80^ 4.46 4.42^ 3.86 4.65 4.43 4.11 3.82 3.77 4.77 4.67^ 3.88 4.58
EBP 2
0
NE 4.74 2.53* 2.39 4.92 2.66* 4.16 4* 3.63 4.31* 3.97* 3.4*& 3.19* 3.02* 4.39* 4.1* 3.55 4.05*
LF 4.64 3.2 2.99 4.6 3.68& 4.39 4.21 3.4^ 4.67 4.49 3.93&^ 3.68 4.1^ 4.9^ 4.51 3.66 4.59
HF 4.76 3.49* 3.08 4.73 4.01* 4.57 4.56* 4.11^ 4.78* 4.59* 4.41*
^ 4.07*
3.85*^
4.83*^
4.76* 4.13 4.76*

304
13. Table H2-2. Comparison between the mean scores of the LEAST influential
Employer Brand Promise (EBP) expectation fulfilment category for
employees’ Organizational Citizenship Performance (OCP): Results of
ANOVA and Scheffe Post-Hoc test
Variable Mean Scores of Organizational Citizenship Performance Behaviours***
OCP # and Type
2 (CV) 3 (CV) 4 (OC) 5 (OL) 6 (II) 7 (SM) 10 (HB) 11 (CV) 15 (OL) 17 (HB)
EBP 1
NE 2.63 2.29 4.94 2.77* 4.2 4.14 3.89* 3.74 4.09 4.17
LF 3.71 2.33 4.29 3.29 4.35 4.19 3.86 3.24^ 3.95 4.48
HF 3.23 3.05 4.74 3.77* 4.47 4.38 4.56* 4.16^ 4.66 4.62
EBP 3
NE 2.57 2 4.57 2.57 4.57 3.86 4.57 3.43 3* 4.14
LF 3.24 2.45^ 4.62 3.49 4.55 4.15 4.26 3.8 4.22 4.49
HF 3.19 3.15^ 4.79 3.71 3.36 4.44 4.5 4.18 4.74* 4.59
EBP 4
NE 1.6*& 2.8 4.8 2.8 3.4& 3.9 3.4 3.3 3.7 3.2*&
LF 3.07& 2.97 4.55 3.51 4.57& 4.3 4.41 3.85 4.45 4.49&
HF 3.32* 2.88 4.79 3.69 4.43 4.37 4.48 4.15 4.61 4.64*
EBP 1
0 NE 2 0 5.5 1 2.5 2.5 4.5 3 1.5* 4
LF 3.5 2.55 4.05^ 2.64^ 4.73 4.09 4.68 3.45 3.77^ 4.77
HF 3.17 2.95 4.78^ 3.72^ 4.42 4.37 4.4 4.1 4.62*
^ 4.53
EPB 1
3 NE 2.25 0.5* 4 2 2.75 3.5 5 3.25 2.75* 4
LF 2.98 2.57 4.47 3.13 4.34 4.04 4.28 3.66 3.91^ 4.36
HF 3.25 3.01* 4.8 3.74 4.47 4.41 4.45 4.13 4.69*
^ 4.6
EBP 1
8 NE 3.33 1.33 5 4 4.33 4 4.33 4 4.33 4
LF 3.05 2.34 4.32^ 2.84^ 4.18 4 4.5 3.8 3.7^ 4.32
HF 3.22 3.03 4.80^ 3.75^ 4.47 4.4 4.41 4.09 4.69^ 4.6
EBP 1
9 NE 1.8 2.6 4.6 2.2 3.2 3.8 3.8 3.4 4 3
LF 2.93 2.23 4.27^ 2.3^ 4.33 3.7^ 3.5 3.6 3.5^ 4.53
HF 3.25 2.99 4.79^ 3.80^ 4.46 4.42^ 4.43 4.11 4.67^ 4.58
Notes:
* – significant at the p≤0.05 level between “No expectations” and “High fulfillment”
^ – significant at the p≤0.05 level between “Low fulfillment” and “High fulfillment”
& – significant at the p≤0.05 level between “No expectations” and “Low fulfillment”
*** Only statistically significant results (p≤0.05 level) are shown in this table
Abbreviations:
CV = Civic Virtue (3 behaviours in OCP scale)
HB = Helping Behaviour (4 behaviours in OCP scale)
II = Individual Initiative (3 behaviours in OCP scale)
OC = Organizational Compliance (1 behaviours in OCP scale)
OL = Organizational Loyalty (2 behaviours in OCP scale)
SD = Self-Development (2 behaviours in OCP scale)
SM = Sportsmanship (2 behaviours in OCP scale)

305
14. Table H2-3. Comparison between the mean scores of the MOST influential
Employer Brand Promise (EBP) expectation fulfilment category for
employees’ Organizational Citizenship Performance (OCP): Results of
ANOVA and Scheffe Post-Hoc test
Variable Mean Scores of Organizational Citizenship Performance Behaviours***
OCP # and Type
1 (HB) 2 (CV) 3 (CV) 4 (OC) 5 (OL) 6 (II) 7 (SM) 8 (SD) 9 (II) 10 (HB) 11 (CV) 12 (II) 13 (SM) 14 (HB) 15 (OL) 16 (SD) 17 (HB)
EBP 1
4 NE - - - - - - - - - - - - - - - - -
LF 4.4^ 2.82 2.52 4.5^ 2.9^ 4^ 3.9^ 3.4^ 4.3^ 4.1^ 3.6^ 3.3^ 3.42 4.5^ 3.7^ 3.52 4^
HF 4.82^ 3.3 3.03 4.81^ 3.86^ 4.56^ 4.48^ 3.94^ 4.75^ 4.52^ 4.18^ 3.89^ 3.81 4.83^ 4.77^ 3.98 4.71^
EBP 1
7 NE 4.59 2.3* 1.8*& 4.79 2.5* 3.8* 3.9* 3.9 4.59 3.8* 3.6* 3.1* 3* 4.45 4.45 3.34 4.1
LF 4.66 3 2.78& 4.5^ 3.2^ 4.38 4.1^ 3.49 4.45 4.37 3.8^ 3.53 3.71 4.6 4.2^ 3.6^ 4.35
HF 4.78 3.50* 3.21* 4.91^ 4.15*^ 4.59* 4.59*^ 3.99 4.79 4.59* 4.31*^ 4.04* 3.89* 4.89 4.80^ 4.15^ 4.77
EBP 2
0 NE 4.74 2.5* 2.39 4.92 2.7*& 4.16 4* 3.63 4.3* 4* 3.4*& 3.2* 3* 4.4* 4.1* 3.55 4.1*
LF 4.64 3.2 2.99 4.6 3.68& 4.39 4.21 3.4^ 4.67 4.49 3.93&^ 3.68 4.1^ 4.9^ 4.51 3.66 4.59
HF 4.76 3.49* 3.08 4.73 4.01* 4.57 4.56* 4.11^ 4.78* 4.59* 4.41*^ 4.07* 3.85*^ 4.83*^ 4.76* 4.13 4.76*
Notes:
* – significant at the p≤0.05 level between “No expectations” and “High fulfillment”
^ – significant at the p≤0.05 level between “Low fulfillment” and “High fulfillment”
& – significant at the p≤0.05 level between “No expectations” and “Low fulfillment”
*** Only statistically significant results (p≤0.05 level) are shown in this table
Abbreviations:
CV = Civic Virtue (3 behaviours in OCP scale)
HB = Helping Behaviour (4 behaviours in OCP scale)
II = Individual Initiative (3 behaviours in OCP scale)
OC = Organizational Compliance (1 behaviours in OCP scale)
OL = Organizational Loyalty (2 behaviours in OCP scale)
SD = Self-Development (2 behaviours in OCP scale)
SM = Sportsmanship (2 behaviours in OCP scale)

306
15. Table H2-4. Comparison between the mean scores of the MODERATELY
influential Employer Brand Promise (EBP) expectation fulfilment groups for
employees’ Organizational Citizenship Performance (OCP): Results of
ANOVA and Scheffe Post-Hoc test
Variable Mean Scores of Organizational Citizenship Performance Behaviours***
OCP # and Type
1 (HB) 2 (CV) 3 (CV) 4 (OC) 5 (OL) 6 (II) 7 (SM) 8 (SD) 9 (II) 10 (HB) 11 (CV) 12 (II) 13 (SM) 14 (HB) 15 (OL) 16
(SD) 17
(HB)
EBP
2
NE - - - - - - - - - - - - - - - - -
LF 4.58 3.17 2.48 4.81 2.79^ 4.04 3.85^ 3.92 4.23^ 3.88^ 3.77 3.65 3.4 4.77 3.9^ 4.08 4.46
HF 4.74 3.2 2.99 4.71 3.78^ 4.51 4.43^ 3.77 4.73^ 4.54^ 4.1 3.79 3.79 4.73 4.67^ 3.82 4.57
EBP
6
NE 3.86 3.43 1.29 4.86 1.71* 4.43 4.29 3.86 4.14 4.57 3 3 3 4.86 3.86 3 5.14
LF 4.53 3.43 2.73 4.12^ 2.86^ 4.29 3.84^ 3.84 4.47 4.14 3.55^ 3.8 3.67 4.35^ 3.75^ 3.73 4.22
HF 4.79 3.13 2.99 4.87^ 3.84*^ 4.46 4.45^ 3.79 4.7 4.49 4.19^ 3.78 3.76 4.82^ 4.74^ 3.92 4.61
EBP 7
NE 5 2.83 3.17 4.83 2.83 4 3.5 3.83 5 3.67 4 3.67 3.67 4.83 3.67 4.5 3.67
LF 4.46^ 3.17 3.68 4.49^ 3.29 4.38 3.99^ 3.77 4.38^ 4.33 3.84 3.35^ 3.59 4.62 4.23^ 3.74 4.43
HF 4.84^ 3.21 3.01 4.85^ 3.8 4.47 4.54^ 3.81 4.77^ 4.5 4.75 3.97^ 3.8 4.79 4.72^ 3.9 4.64
EBP 8
NE 4.5 1.88 1.5* 4.25 1.25*& 4.13 3.25* 2.75 4.13 3.88 2.88* 2.5 3.13 4.25 3.13* 2.75 3.75
LF 4.52 3.28 2.18^ 4.55 3.07& 4.36 3.93^ 3.54 4.58 4.27 3.69^ 3.67 3.64 4.57 3.61^ 3.63 4.25
HF 4.79 3.21 3.19*^ 4.81 3.88* 4.46 4.51*^ 3.92 4.68 4.5 4.20*^ 3.84 3.78 4.81 4.89*^ 3.98 4.68
EBP
9
NE 4.29 2.21 2.07 4.71 2.4* 3.2*& 3.5* 2.71 3.9* 3.71 3.36 2.7* 3.29 4.14 3.93 2.71* 3.64*
LF 4.59 3.03 2.66 4.57 3^ 4.55& 4.1 3.47 4.55 4.45 3.7^ 3.48 3.71 4.66 3.9^ 3.95 4.43
HF 4.78 3.3 3.02 4.78 3.87*^ 4.47* 4.45* 3.96 4.72* 4.47 4.20^ 3.91* 3.76 4.8 4.76^ 3.91* 4.64*
EBP 1
1 NE 4.25 1.25 0.75 4 0.75*& 3.75 2.5* 0.5*& 4 4.5 1.75*& 1.75 2.25 4.5 1.75*& 2.25 4
LF 4.7 3.26 2.61 4.47 3.25& 4.42 3.98^ 3.60& 4.68 4.37 3.88& 3.7 4.07 4.65 4.14^& 3.82 4.4
HF 4.73 3.21 3.01 4.81 3.76* 4.44 4.46*^ 3.91* 4.64 4.44 4.13* 3.81 3.67 4.76 4.69*^ 3.9 4.6
EBP 1
2 NE 4.61 2.52 2.87 4.61 3.19 4.26 3.97 3.87 4.45 4.03 3.71 2.81* 3.39 4.52 4.06* 3.94 4.29
LF 4.6 3.16 2.53 4.51^ 3.08^ 4.37 4.19 3.57 4.51 4.17^ 3.78^ 3.82& 3.73 4.6 4.02^ 3.56 4.37
HF 4.81 3.35 3.13 4.89^ 4.02^ 4.49 4.49 3.92 4.76 4.86^ 4.27^ 3.92* 3.79 4.87 4.94*^ 4.03 4.71
EBP 1
5 NE 4.73 2.5* 2.53 4.71 2.9* 4.16 4* 3.82 4.4* 3.9*& 3.5* 3.2* 3.1* 4.4* 3.9* 3.58 4.32
LF 4.45 3.17 2.86 4.57 3.5 4.38 4.26 3.43 4.6 4.84& 3.86 3.67 3.74 4.69 4.1^ 3.48 4.38
HF 4.78 3.49* 3.07 4.78 3.94* 4.55 4.50* 3.88 4.77* 4.59* 4.32* 4.02* 3.98* 4.89* 4.93*^ 4.08 4.69
EBP 1
6 NE 4.4 2 2.2 5 2.8 2.2*& 4 4.2 4.4 2.2*& 3.4 1.8*& 3.2 4.6 4.2 4.8 3.8
LF 4.75 3.21 2.83 4.46^ 3.27^ 4.64& 4.12 3.55 4.84 4.61& 3.87 3.97& 4.07^ 4.65 4.21^ 3.77 4.58
HF 4.71 3.21 2.97 4.89^ 3.84^ 4.36* 4.47 3.93 4.53 4.38* 4.16 3.70* 3.54^ 4.79 4.74^ 3.89 4.55
Notes:
* – significant at the p≤0.05 level between “No expectations” and “High fulfillment”
^ – significant at the p≤0.05 level between “Low fulfillment” and “High fulfillment”
& – significant at the p≤0.05 level between “No expectations” and “Low fulfillment”
*** Only statistically significant results (p≤0.05 level) are shown in this table
Abbreviations:
CV = Civic Virtue (3 behaviours in OCP scale)
HB = Helping Behaviour (4 behaviours in OCP scale)
II = Individual Initiative (3 behaviours in OCP scale)
OC = Organizational Compliance (1 behaviours in OCP scale)
OL = Organizational Loyalty (2 behaviours in OCP scale)
SD = Self-Development (2 behaviours in OCP scale)
SM = Sportsmanship (2 behaviours in OCP scale)

307
16. Table H2-5. Comparison between the mean scores of Employer Brand
Promise (EBP) expectation fulfilment groups for employees’ Task
Performance (TP): Results of ANOVA and Scheffe Post-Hoc test
Variable Mean Scores of Task Performance Actions
TP # 1 2 3 4 5 6 7
EBP 1
NE 5.37 5.4 5.46 5.26 4.63 5.57* 5.86*
LF 5.33 5.14 5.48 5.33 4.76 5 5.2
HF 5.3 5.36 5.49 5.39 5.01 4.89* 5.40*
EBP
2 NE - - - - - - -
LF 5.35 5.38 5.46 5.4 4.74 5.06 5.48
HF 5.31 5.34 5.49 5.36 4.99 4.97 5.43
EBP 3
NE 5 5 5.29 5.14 4.86 4.86 5.57
LF 5.31 5.45 5.48 5.4 4.89 4.93 5.39
HF 5.33 5.31 5.49 5.36 4.98 5.01 5.46
EBP 4
NE 5.5 5.2 5.2 5.1 4* 5.6 5.3
LF 5.27 5.35 5.45 5.26 4.81 4.84 5.39
HF 5.32 5.35 5.51 5.42 5.05* 5.01 5.47
EBP 5
NE 5 5.33 5 4.67 4.67 5 5.67
LF 5.32 5.35 5.44 5.35 4.7 4.88 5.4
HF 5.32 5.35 5.5 5.38 5.01 5.01 5.45
EBP
6 NE 5.71 5.57 5.57 5.43 4.57 5.29 5.57
LF 5.1 5.04^ 5.45 5.29 4.76 4.84 5.41
HF 5.36 5.41^ 5.49 5.38 5 5 5.44
EBP 7
NE 5.17 5.5 5.5 5.67 4.83 5.33 5.83
LF 5.33 5.32 5.51 5.38 4.79 4.99 5.42
HF 5.31 5.35 5.47 5.35 5.03 4.97 5.44
EBP 8
NE 5.38 5.25 5.38 5.25 4.25 5.5 5.38
LF 5.25 5.25 5.43 5.25 4.65^ 4.91 5.39
HF 5.33 5.38 5.5 5.41 5.07^ 4.99 5.46
EBP
9 NE 5.14 5.29 5.57 5.21 4.5 4.93 5.64
LF 5.47 5.4 5.55 5.31 4.98 4.95 5.24
HF 5.28 5.34 5.46 5.39 4.97 5 5.48
EBP 1
0 NE 5.5 6 5 5.5 4.5 5 5.5
LF 5.45 5.23 5.41 5.23 4.64 5.05 5.41
HF 5.3 5.35 5.49 5.38 4.98 4.98 5.44
EBP 1
1 NE 4.75 4.75 5 4.5 2.5 4.75 5.25
LF 5.3 5.25 5.37 5.25 4.79 4.96 5.28
HF 5.33 5.38 5.52 5.42 5.03 4.99 5.49
EBP 1
2 NE 5.32 5.16 5.45 5.13 5.61 5.1 5.77
LF 5.32 5.41 5.44 5.38 4.91 4.92 5.35
HF 5.31 5.34 5.51 5.41 5.03 5 5.43
EPB 1
3 NE 4.5 5.25 4.75 4.75 4.5 4.75 5.25
LF 5.3 5.43 5.49 5.47 4.85 4.66 5.21
HF 5.33 5.33 5.49 5.36 4.97 5.05 5.49

308
Variable Mean Scores of Task Performance Actions
TP # 1 2 3 4 5 6 7
EBP 1
4 NE - - - - - - -
LF 5.28 5.32 5.37 5.32 4.54^ 4.82 5.31
HF 5.33 5.36 5.52 5.38 5.07^ 5.03 5.48
EBP 1
5 NE 5.32 5.32 5.48 5.34 4.64* 5.07 5.59&
LF 5.38 5.5 5.5 5.29 4.86 5.17 5.10&
HF 5.3 5.32 5.48 5.4 5.10* 4.9 5.46
EBP 1
6 NE 5.6 5.2 5.6 5.4 4.6 5.6 5.2
LF 5.18 5.32 5.37 5.18 4.77 4.77 5.33
HF 5.38 5.37 5.55 5.48 5.06 5.09 5.51
EBP 1
7 NE 5.41 5.03 5.45 5.34 4.59 5.14 5.72
LF 5.31 5.32 5.39 5.25 4.77 4.97 5.28
HF 5.3 5.43 5.55 5.45 5.14 4.96 5.5
EBP 1
8 NE 5 4.67 4.33*& 4.67 4.67 5.33 5.33
LF 5.2 5.14 5.34& 5.2 4.77 4.59 5.07^
HF 5.34 5.39 5.52* 5.41 4.98 5.05 5.51^
EBP 1
9 NE 5.2 5.4 5.2 5.4 4.8 5.2 5.6
LF 5.23 5.27 5.27 5.1 4.7 4.77 5.13
HF 5.33 5.36 5.51 5.4 4.98 5 5.48
EBP 2
0 NE 5.19 5.21 5.37 5.37 4.53* 5.03 5.52
LF 5.39 5.36 5.44 5.29 4.99 4.89 5.35
HF 5.32 5.4 5.56 5.41 5.11* 5.02 5.46
Notes:
* – significant at the p≤0.05 level between “No expectations” and “High fulfillment”
^ – significant at the p≤0.05 level between “Low fulfillment” and “High fulfillment”
& – significant at the p≤0.05 level between “No expectations” and “Low fulfillment”
TP # Task Performance Action Descriptors Source: William and Anderson (1991)
1 Adequately completed assigned duties
2 Fulfilled responsibilities specified in your job description
3 Performed tasks that were expected of you
4 Met formal performance requirements of your job
5 Engaged in activities that would positively affect your performance evaluation
6 NOT Neglected aspects of your job that you were expected to perform (reversed)
7 NOT Failed to perform essential duties (reversed)

309
17. Table H2-6. Stepwise multiple regression results for the most influential
Employer Brand Promises (EBP): only significant results shown
Model R R2 B SE Beta
Significance, p-value
OCP 1 (HB)
1 EBP 14 0.126 0.016 0.189 0.088 0.126 0.034
OCP 2 (CV)
1 EBP 17 0.204 0.042 0.337 0.097 0.204 0.001
2 EBP 17 EBP 20
0.241 0.058 0.256 0.172
0.103 0.078
0.155 0.137
0.013 0.029
OCP 3 (CV)
1 EBP 17 0.229 0.052 0.414 0.105 0.229 <0.001
OCP 4 (OC)
No data included in the model
OCP 5 (OL)
1 EBP 17 0.334 0.111 0.569 0.096 0.334 <0.001
2 EBP 17 EBP 14
0.387 0.150 0.439 0.482
0.101 0.136
0.257 0.210
<0.001 <0.001
3 EBP 17 EBP 14 EBP 20
0.417 0.174 0.357 0.398 0.220
0.104 0.137 0.077
0.210 0.174 0.170
0.001 0.004 0.005
OCP 6 (II)
1 EBP 14 0.202 0.041 0.359 0.104 0.202 0.001
OCP 7 (SM)
1 EBP 14 0.277 0.077 0.419 0.087 0.277 <0.001
2 EBP 14 EBP 17
0.315 0.099 0.330 0.182
0.092 0.069
0.218 0.162
<0.001 0.008
OCP 8 (SD)
1 EBP 14 0.158 0.025 0.373 0.140 0.158 0.008
OCP 9 (II)
1 EBP 14 0.210 0.044 0.295 0.082 0.210 <0.001
OCP 10 (HB)
1 EBP 17 0.197 0.039 0.268 0.080 0.197 0.001
2 EBP 17 EBP 20
0.238 0.056 0.199 0.147
0.085 0.064
0.146 0.142
0.020 0.023
OCP 11 (CV)
1 EBP 20 0.320 0.103 0.305 0.054 0.320 <0.001
2 EBP 20 EBP 14
0.359 0.129 0.253 0.289
0.056 0.099
0.266 0.171
<0.001 0.004
OCP 12 (II)
1 EBP 20 0.197 0.039 0.240 0.072 0.197 0.001
OCP 13 (SM)
1 EBP 20 0.156 0.024 0.186 0.071 0.156 0.009
OCP 14 (HB)
1 EBP 20 0.174 0.030 0.138 0.047 0.174 0.003
OCP 15 (OL)
1 EBP 14 0.263 0.069 0.506 0.111 0.263 <0.001
OCP 16 (SD)
1 EBP 17 0.173 0.030 0.285 0.097 0.173 0.004
OCP 17 (HB)
1 EBP 14 0.207 0.043 0.377 0.107 0.207 <0.001
2 EBP 14 EBP 20
0.237 0.056 0.306 0.127
0.112 0.063
0.168 0.123
0.007 0.046

310
18. Table H2-7. Stepwise multiple regression results for the moderately
influential Employer Brand Promises (EBP): only significant results shown
Model
R R2 B SE Beta Significance,
p-value
OCP 1 (HB)
1 EBP 6 0.164 0.027 0.220 0.079 0.164 0.006
OCP 2 (CV)
1 EBP 15 0.229 0.053 0.268 0.068 0.229 <0.001
OCP 3 (CV)
1 EBP 8 0.247 0.061 0.491 0.115 0.247 <0.001
OCP 4 (OC)
1 EBP 6 0.200 0.040 0.243 0.071 0.200 0.001
2 EBP 6
EBP 16 0.236 0.056
0.197
0.146
0.074
0.067
0.162
0.131
0.008
0.031
OCP 5 (OL)
1 EBP 6 0.307 0.094 0.633 0.117 0.307 <0.001
2 EBP 6
EBP 8 0.363 0.132
0.493
0.383
0.122
0.111
0.239
0.204
<0.001
0.001
3
EBP 6
EBP 8
EBP 15
0.392 0.154
0.415
0.312
0.194
0.124
0.113
0.072
0.201
0.166
0.161
0.001
0.006
0.008
OCP 6 (II)
1 EBP 15 0.140 0.020 0.130 0.055 0.140 0.019
OCP 7 (SM)
1 EBP 9 0.265 0.070 0.330 0.072 0.265 <0.001
2 EBP 9
EBP 6 0.314 0.098
0.244
0.248
0.077
0.083
0.195
0.182
0.002
0.003
3
EBP 9
EBP 6
EBP 8
0.336 0.113
0.198
0.207
0.163
0.079
0.085
0.077
0.159
0.152
0.132
0.013
0.016
0.035
OCP 8 (SD)
1 EBP 11 0.185 0.034 0.411 0.131 0.185 0.002
OCP 9 (II)
1 EBP 2 0.211 0.045 0.299 0.083 0.211 <0.001
2 EBP 2
EBP 15 0.253 0.064
0.240
0.107
0.086
0.045
0.170
0.145
0.005
0.017
3
EBP 2
EBP 15
EBP 16
0.295 0.087
0.266
0.137
-0.182
0.085
0.046
0.069
0.188
0.185
-0.158
0.002
0.003
0.009
4
EBP 2
EBP 15
EBP 16
EBP 6
0.318 0.101
0.217
0.118
-0.211
0.171
0.088
0.046
0.070
0.080
0.153
0.160
-0.184
0.135
0.014
0.011
0.003
0.035
OCP 10 (HB)
1 EBP 2 0.189 0.036 0.348 0.108 0.189 0.001
2 EBP 2
EBP 15 0.234 0.055
0.272
0.139
0.112
0.058
0.147
0.144
0.016
0.018

311
Model
R R2 B SE Beta Significance,
p-value
OCP 11 (CV)
1 EBP 2 0.211 0.045 0.299 0.083 0.211 <0.001
2 EBP 2
EBP 15 0.253 0.064
0.240
0.107
0.086
0.045
0.170
0.145
0.005
0.017
3
EBP 2
EBP 15
EBP 16
0.295 0.087
0.266
0.137
-0.182
0.085
0.046
0.069
0.188
0.185
-0.158
0.002
0.003
0.009
4
EBP 2
EBP 15
EBP 16
EBP 6
0.318 0.101
0.217
0.118
-0.211
0.171
0.088
0.046
0.070
0.080
0.153
0.160
-0.184
0.135
0.014
0.011
0.003
0.035
OCP 12 (II)
1 EBP 15 0.204 0.042 0.232 0.067 0.204 0.001
OCP 13 (SM)
1 EBP 15 0.209 0.044 0.233 0.065 0.209 <0.001
2 EBP 15
EBP 16 0.277 0.077
0.293
-0.329
0.067
0.104
0.263
-0.190
<0.001
0.002
OCP 14 (HB)
1 EBP 9 0.198 0.039 0.230 0.068 0.198 0.001
2 EBP 9
EBP 15 0.234 0.055
0.166
0.101
0.074
0.047
0.143
0.136
0.026
0.033
OCP 15 (OL)
1 EBP 8 0.333 0.111 0.524 0.089 0.333 <0.001
2 EBP 8
EBP 15 0.400 0.160
0.409
0.235
0.091
0.059
0.260
0.232
<0.001
<0.001
3
EBP 8
EBP 15
EBP 6
0.416 0.173
0.357
0.206
0.217
0.094
0.060
0.103
0.227
0.203
0.126
<0.001
0.001
0.036
OCP 16 (SD)
1 EBP 8 0.172 0.030 0.312 0.107 0.172 0.004
OCP 17 (HB)
1 EBP 9 0.197 0.039 0.296 0.088 0.197 0.001

312
19. Table H3-1 Comparison between the Mean Scores of the High Fulfilment,
Low Fulfilment, and No Expectation groups for employees’ Level of
Concurrence for the Following Notions:
i. Their employment experience at the organization is both desirable
and distinctive (DDEE).
ii. Their organization is a great place to work (GPTW).
iii. They would be happy to spend the rest of their career with the
organization (HSCO).
iv. They DO NOT frequently think of leaving the employment at the
organization (NFTL)
Notes:
* – significant at the p≤0.05 level between “No expectations” and “High fulfillment”
^ – significant at the p≤0.05 level between “Low fulfillment” and “High fulfillment”
& – significant at the p≤0.05 level between “No expectations” and “Low fulfillment”
Variables DDEE GPTW HSCO NFTL
EBP 1
NE 1.678 1.838* 1.338* 1.47
LF 1.26 1.83^ 1.26^ 1.17^
HF 2.11* 2.28*^ 1.82*^ 1.76^
EBP 2 NE - - - -
LF 1.2^ 1.59^ 0.88^ 0.88^
HF 1.59^ 2.32^ 1.90^ 1.85^
EBP 3
NE 0.75*& 1* 0.75* 0.88*
LF 1.61& 1.76& 1.32^ 1.18^
HF 2.24* 2.45* 1.96*^ 1.97*^
EBP 4
NE 1.58 1.67* 1.25 1.42
LF 1.69^ 1.79^ 1.39^ 1.28^
HF 2.14^ 2.37*^ 1.88^ 1.85^
EBP 5
NE 0.5*& 0.75* 0.5* 0.75
LF 1.38& 1.59^ 1.13^ 1.16^
HF 2.19* 2.38*^ 1.91*^ 1.84^
EBP 6 NE 1.38* 1.38* 1.13 1.25
LF 1.4^ 1.73^ 1.16^ 1.18^
HF 2.15*^ 2.32*^ 1.87^ 1.81^
EBP 7
NE 0.57*& 1.14*& 0.43* 0.71*
LF 1.57&^ 1.92&^ 1.26^ 1.32^
HF 2.27*^ 2.37*^ 2.02*^ 1.91*^
EBP 8
NE 0.78* 1.22* 0.33* 0.67*
LF 1.34^ 1.61^ 0.94^ 0.97^
HF 2.26*^ 2.42*^ 2.03*^ 1.95*^
EBP 9 NE 1.6* 1.73* 1.2* 1.47
LF 1.52^ 1.69^ 1.25^ 1.07^
HF 2.15*^ 2.36*^ 1.89*^ 1.86^
EBP 1
0 NE 0.33* 0.33* 0* 0.33*
LF 1.09^ 1.17^ 0.83^ 0.74^
HF 2.09*^ 2.29*^ 1.82*^ 1.78*^
Variables DDEE GPTW HSCO NFTL
EBP 1
1 NE 0.4*& 0.2*& 0*& 0.2*
LF 1.35&^ 1.61&^ 1.11&^ 1.06^
HF 2.20*^ 2.39*^ 1.92*^ 1.88*^
EBP 1
2 NE 1.79* 1.97* 1.39* 1.64
LF 1.64^ 1.86^ 1.31^ 1.27^
HF 2.25*^ 2.43*^ 2.04*^ 1.94^
EPB 1
3 NE 0.4* 0.6*& 0* 0.4*
LF 1.12^ 1.38&^ 1.06^ 1^
HF 2.21*^ 2.39*^ 1.89*^ 1.85*^
EBP 1
4 NE - - - -
LF 1.34^ 1.7^ 1.15^ 1.15^
HF 2.21^ 2.36^ 1.91^ 1.86^
EBP 1
5 NE 1.83* 1.97* 1.44* 1.53
LF 1.56^ 1.88^ 1.34^ 1.26^
HF 2.19*^ 2.37*^ 1.95*^ 1.87^
EBP 1
6 NE 0.86*& 1.29* 0.86* 0.57*
LF 1.71&^ 1.8^ 1.4^ 1.36^
HF 2.21^* 2.46^* 1.96^* 1.93*^
EBP 1
7 NE 1.9 2.1 1.7 1.93*&
LF 1.67^ 1.86^ 1.34^ 1.29&
HF 2.24^ 2.44^ 1.99^ 1.91*
EBP 1
8 NE 1.76 1.5 1 1.25
LF 1.23^ 1.4^ 0.98^ 0.89^
HF 2.14^ 2.35^ 1.87^ 1.84^
EBP 1
9 NE 1.17* 1.33* 1 1.17
LF 0.87^ 1.03^ 0.61^ 0.68^
HF 2.15*^ 2.34*^ 1.87^ 1.81^
EBP 2
0 NE 1.77* 2* 1.51* 1.51*
LF 1.75^ 1.92^ 1.4^ 1.35^
HF 2.26*^ 2.45*^ 2.04*^ 1.98*^

313
20. Table H3-2. Correlation between the Expectation Fulfillment of Individual
Employer Brand Promise (EBP) Items and Employees’ Level of Concurrence
for Perceiving That:
i. Their employment experience at the organization is both desirable and
distinctive (DDEE).
ii. Their Organization is a Great Place to Work (GPTW).
iii. They are Happy to Spend the Rest of Their Career with the Organization
(HSCO).
iv. They DO NOT Frequently Consider Leaving Their Employment at the
Organization (NFTL).
Notes:
** Correlation is significant at the 0.01 level (2-tailed)
* Correlation is significant at the 0.05 level (2-tailed)
Variables Employer Brand Promises
EBP 1
EBP 2
EBP 3
EBP 4
EBP 5
EBP 6
EBP 7
EBP 8
EBP 9
EBP 10
EBP 11
EBP 12
EBP 13
EBP 14
EBP 15
EBP 16
EBP 17
EBP 18
EBP 19
EBP 20
DDEE .282
**
.526
**
.484
**
.323
**
.536
**
.429
**
.534
**
.589
**
.342
**
.465
**
.568
**
.367
**
.597
**
.497
**
.284
**
.425
**
.306
**
.437
**
.514
**
.315
**
GPTW .232**
.411**
.561**
.417**
.517**
.428**
.399**
.526**
.394**
.513**
.573**
.365**
.646**
.447**
.303**
.525 **
.296**
.499**
.569**
.309**
HSCO .235**
.415**
.399**
.298**
.401**
.322**
.443**
.554**
.322**
.312**
.445**
.359**
.483**
.386**
.314**
.398**
.239**
.370**
.453**
.273**
NFTL .149**
.400**
.407**
.320**
.361**
.288**
.364**
.459**
.296**
.369**
.434**
.255**
.432**
.357**
.219**
.412**
.147*
.363**
.385**
.235**
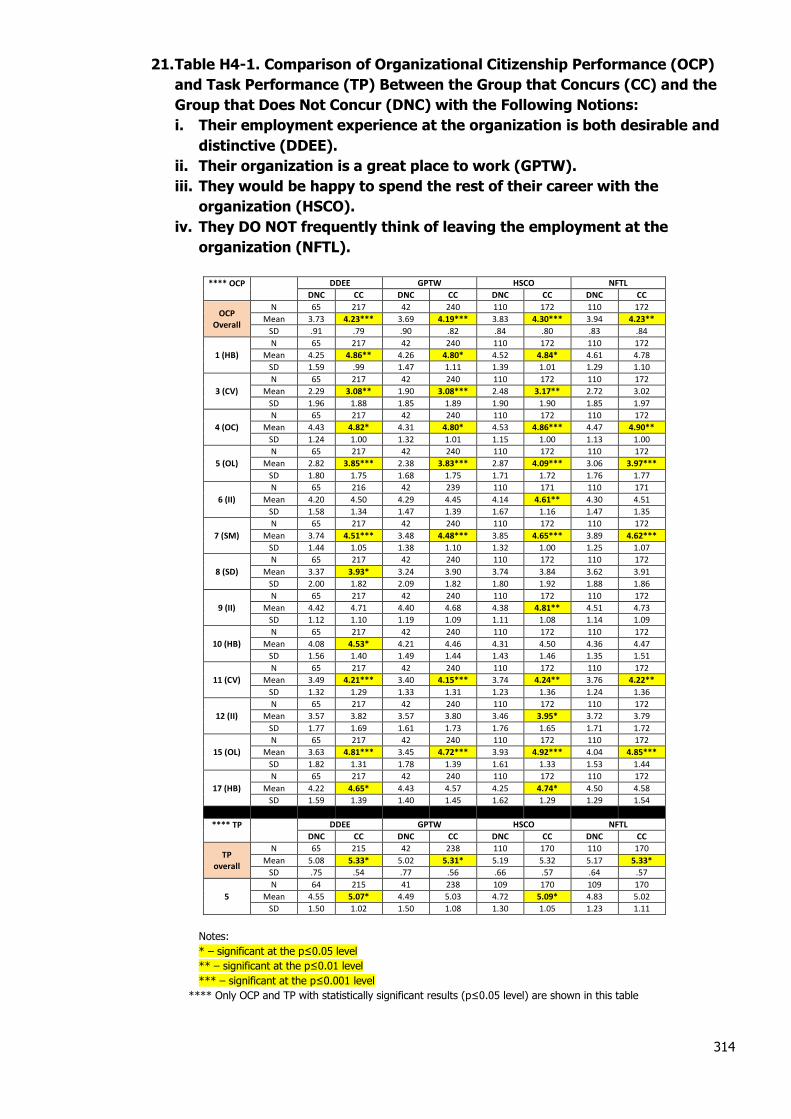
314
21. Table H4-1. Comparison of Organizational Citizenship Performance (OCP)
and Task Performance (TP) Between the Group that Concurs (CC) and the
Group that Does Not Concur (DNC) with the Following Notions:
i. Their employment experience at the organization is both desirable and
distinctive (DDEE).
ii. Their organization is a great place to work (GPTW).
iii. They would be happy to spend the rest of their career with the
organization (HSCO).
iv. They DO NOT frequently think of leaving the employment at the
organization (NFTL).
**** OCP
DDEE GPTW HSCO NFTL
DNC CC DNC CC DNC CC DNC CC
OCP Overall
N 65 217 42 240 110 172 110 172
Mean 3.73 4.23*** 3.69 4.19*** 3.83 4.30*** 3.94 4.23**
SD .91 .79 .90 .82 .84 .80 .83 .84
1 (HB)
N 65 217 42 240 110 172 110 172
Mean 4.25 4.86** 4.26 4.80* 4.52 4.84* 4.61 4.78
SD 1.59 .99 1.47 1.11 1.39 1.01 1.29 1.10
3 (CV)
N 65 217 42 240 110 172 110 172
Mean 2.29 3.08** 1.90 3.08*** 2.48 3.17** 2.72 3.02
SD 1.96 1.88 1.85 1.89 1.90 1.90 1.85 1.97
4 (OC)
N 65 217 42 240 110 172 110 172
Mean 4.43 4.82* 4.31 4.80* 4.53 4.86*** 4.47 4.90**
SD 1.24 1.00 1.32 1.01 1.15 1.00 1.13 1.00
5 (OL)
N 65 217 42 240 110 172 110 172
Mean 2.82 3.85*** 2.38 3.83*** 2.87 4.09*** 3.06 3.97***
SD 1.80 1.75 1.68 1.75 1.71 1.72 1.76 1.77
6 (II)
N 65 216 42 239 110 171 110 171
Mean 4.20 4.50 4.29 4.45 4.14 4.61** 4.30 4.51
SD 1.58 1.34 1.47 1.39 1.67 1.16 1.47 1.35
7 (SM)
N 65 217 42 240 110 172 110 172
Mean 3.74 4.51*** 3.48 4.48*** 3.85 4.65*** 3.89 4.62***
SD 1.44 1.05 1.38 1.10 1.32 1.00 1.25 1.07
8 (SD)
N 65 217 42 240 110 172 110 172
Mean 3.37 3.93* 3.24 3.90 3.74 3.84 3.62 3.91
SD 2.00 1.82 2.09 1.82 1.80 1.92 1.88 1.86
9 (II)
N 65 217 42 240 110 172 110 172
Mean 4.42 4.71 4.40 4.68 4.38 4.81** 4.51 4.73
SD 1.12 1.10 1.19 1.09 1.11 1.08 1.14 1.09
10 (HB)
N 65 217 42 240 110 172 110 172
Mean 4.08 4.53* 4.21 4.46 4.31 4.50 4.36 4.47
SD 1.56 1.40 1.49 1.44 1.43 1.46 1.35 1.51
11 (CV)
N 65 217 42 240 110 172 110 172
Mean 3.49 4.21*** 3.40 4.15*** 3.74 4.24** 3.76 4.22**
SD 1.32 1.29 1.33 1.31 1.23 1.36 1.24 1.36
12 (II)
N 65 217 42 240 110 172 110 172
Mean 3.57 3.82 3.57 3.80 3.46 3.95* 3.72 3.79
SD 1.77 1.69 1.61 1.73 1.76 1.65 1.71 1.72
15 (OL)
N 65 217 42 240 110 172 110 172
Mean 3.63 4.81*** 3.45 4.72*** 3.93 4.92*** 4.04 4.85***
SD 1.82 1.31 1.78 1.39 1.61 1.33 1.53 1.44
17 (HB)
N 65 217 42 240 110 172 110 172
Mean 4.22 4.65* 4.43 4.57 4.25 4.74* 4.50 4.58
SD 1.59 1.39 1.40 1.45 1.62 1.29 1.29 1.54
**** TP
DDEE GPTW HSCO NFTL
DNC CC DNC CC DNC CC DNC CC
TP overall
N 65 215 42 238 110 170 110 170
Mean 5.08 5.33* 5.02 5.31* 5.19 5.32 5.17 5.33*
SD .75 .54 .77 .56 .66 .57 .64 .57
5
N 64 215 41 238 109 170 109 170
Mean 4.55 5.07* 4.49 5.03 4.72 5.09* 4.83 5.02
SD 1.50 1.02 1.50 1.08 1.30 1.05 1.23 1.11
Notes:
* – significant at the p≤0.05 level
** – significant at the p≤0.01 level
*** – significant at the p≤0.001 level
**** Only OCP and TP with statistically significant results (p≤0.05 level) are shown in this table