the influence of work environment, salary, and …
TRANSCRIPT
i
THE INFLUENCE OF WORK ENVIRONMENT, SALARY,
AND LEADERSHIP TOWARDS EMPLOYEES’ MOTIVATION
(A CASE STUDY OF PT BRI LABUAN BRANCH)
By :
HENDRIK SUNEFIL
014201100150
A skripsi presented to the
Faculty of Business President University
In patrial fulfilment of the requirements for
Bachelor Degree in Economics Major in Management
April 2015
ii
PANEL OF EXAMINERS
APPROVAL SHEET
The Panel of Examiners declare that the skripsi entitled “THE
INFLUENCE OF WORK ENVIRONMENT, SALARY, AND
LEADERSHIP TOWARDS EMPLOYEES’ MOTIVATION (A
CASE STUDY OF PT BRI LABUAN BRANCH)” that was
submitted by Hendrik Sunefil majoring in Management (Banking and
Finance) from the Faculty of Business was assessed and approved to
have passed the Oral Examiners on 2nd April 2015.
Filda Rahmiati, MBA
Chair-Panel of Examiners
Purwanto, ST, MM
Examiner I
Ir.Yunita Ismail, M.Si
Examiner II
iii
SKRIPSI ADVISER
RECOMMENDATION LETTER
This skripsi entitled “THE INFLUENCE OF WORK
ENVIRONMENT, SALARY, AND LEADERSHIP TOWARDS
EMPLOYEES’ MOTIVATION (A CASE STUDY OF PT BRI
LABUAN BRANCH)” prepared and submitted by Hendrik Sunefil in
partial fulfillment of the requirements for the degree of Bachelor in
the Faculty of Business has been reviewed and found to have satisfied
the requirements for a skripsi fit to be examined. I therefore
recommend this skripsi for Oral Defense.
Cikarang, Indonesia, 30 March 2015
Acknowledged by,
Vinsensius Jajat K.,SE.MM.MBA
Head of Management Study Program
Recommended by,
Ir.Yunita Ismail, M.Si
Skripsi Advisor
iv
DECLARATION OF ORIGINALITY
I declare that this skripsi, entitled “THE INFLUENCE OF WORK
ENVIRONMENT, SALARY, AND LEADERSHIP TOWARDS
EMPLOYEES’ MOTIVATION (A CASE STUDY OF PT BRI
LABUAN BRANCH)” is, to the best of my knowledge and belief, an
original piece of work that has not been submitted, either in whole or
in part, to another university to obtain a degree.
Cikarang, Indonesia, 30 March 2015
Hendrik Sunefil
v
ABSTRACT
This research “The Influence of Work Environment, Salary, and Leadership
towards Employees‟ Motivation (A Case Study of PT BRI Labuan Branch)”. A
survey was conducted on 100 respondents who are officer BRI branch Labuan.
This research based on Research into this base on the result from report of
performance of officer BRI in the year 2014. There are three selection criteria as
work environment, salary, and leadership. Data analysis technique used is
multiple linear regression with least squares equation and test hypothesis using t-
statistic for testing the partial regression coefficients and F-statistic to test the
effect together with a significance level of 5%. It also tested the classical
assumptions that included tests of normality, multicollinearity test, test of
heterocedasticity and autocorrelation test. This shows the available data has been
qualified using multiple linear regression equation model. The Result indicate that
work environment (X1) have no significant effect towards employees‟ motivation
in bank. The variables salary, and leadership significantly positive effect to
employees motivation in bank of BRI branch Labuan. Predictive ability of three
variables to employees‟ motivation in bank of BRI branch Labuan in this study of
56.3% while the remaining is 43.7% be affected by other factors not include in the
research model.
Key words: Banking; Work Environment, Salary, and Leadership towards
Employees’ Motivation
vi
ACKNOWLEDGEMENT
I want to show my appreciation to my advisor – Mr. Orlando R.Santos. He
listened to me and gave me so many advices when I had trouble in my skripsi. He
always spends his time to guide me do the skripsi step by step, share ideas and
information to support my topic in particular, my skripsi in general. Thank you for
every supporting!
Huge thank should be delivered to my beloved family, to my parents, my
brother, my sister. Thank for their listening, understanding, and sharing,
encouraging and financial supporting. Thanks to them I can have motivation to do
the best this skripsi. I really love them!
My friends, the good friends I have during university. A million thank to
them in helping me in every exams. Moreover, without them, I cannot graduate as
convenient as now.
Finally, I want to send grateful to other lecturers in President University
who taught me knowledge that I can apply in this skripsi.
Cikarang, 30 March 2015
Hendrik Sunefil
vii
TABLE OF CONTENT
PANEL OF EXAMINERS ................................................................... i
APPROVAL SHEET ............................................................................ i
SKRIPSI ADVISER ............................................................................. ii
RECOMMENDATION LETTER ....................................................... ii
DECLARATION OF ORIGINALITY ............................................... iii
ABSTRACT ........................................................................................... iv
ACKNOWLEDGEMENT .................................................................... v
TABLE OF CONTENT ........................................................................ vi
LIST OF TABLE .................................................................................. ix
LIST OF FIGURE ................................................................................ x
LIST OF ABBREVIATION ................................................................. xi
CHAPTER I
INTRODUCTION ................................................................................. 1
1.1 Background of the Study ............................................................... 1
1.2 Problem Identification ................................................................... 4
1.3 Statement of the Problem............................................................... 4
1.4 Research Objectives....................................................................... 4
1.5 Definition of Terms ....................................................................... 5
1.6 Scope and Limitations ................................................................... 6
1.7 Research Benefit ............................................................................ 6
CHAPTER II
LITERATURE REVIEW ..................................................................... 8
2.1 Theoretical Review ........................................................................... 8
2.1.1 Motivation and its Theories ........................................................ 8
2.1.2 Abraham Maslow‟s 5 Tiered Human Desires and Needs ........... 8
2.1.3 Hetzberg‟s Two Motivation Theory............................................ 10
2.1.4 Fundamental principles of motivation ........................................ 11
2.1.5 Motivation Strategies .................................................................. 11
2.1.6 Work Environment ...................................................................... 12
2.1.6.1 Work Environment Relationship to Employees Motivation ....... 14
viii
2.1.7 Salary........................................................................................... 14
2.1.7.1 Salary Theories............................................................................ 14
2.1.7.2 Salary Relationship to Employees Motivation ............................ 15
2.1.8 Leadership ................................................................................... 15
2.1.8.1 Leadership Theories .................................................................... 16
2.1.8.2 Leadership Relationship to Employees Motivation .................... 20
2.2 Previous Research ............................................................................. 21
2.3 Theoretical framework ...................................................................... 23
2.4 Operational Definition ...................................................................... 24
2.5 Hypothesis ......................................................................................... 25
CHAPTER III
METHODOLOGY ................................................................................ 26
3.0 Research Design ................................................................................ 26
3.1 Sampling Design ............................................................................... 27
3.1.1 Sample ......................................................................................... 27
3.1.2 Sampling Method ........................................................................ 28
3.2 Research Instrument .......................................................................... 28
3.2.1 Primary Data ............................................................................... 29
3.2.2 Secondary Data ........................................................................... 30
3.2.3 Questionnaire .............................................................................. 30
3.2.4 Data Analysis .............................................................................. 32
3.2.5 Research framework.................................................................... 33
3.3 Validity and Reliability ..................................................................... 34
3.3.1 Validity Test ................................................................................ 34
3.3.2 Testing the Partial Correlation .................................................... 34
3.3.3 Reliability Test ............................................................................ 35
3.4 Data Collection Procedure ................................................................ 36
3.5 Descriptive Testing ........................................................................... 36
3.5.1 Mean ............................................................................................ 36
3.5.2 Standard Deviation ...................................................................... 37
3.5.3 Multiple Regression Analysis ..................................................... 38
ix
3.5.4 Standardized/Unstandardized Coefficient ................................... 39
3.5.5 Classical Assumption Test .......................................................... 39
3.5.5.1 Pre Test........................................................................................ 39
3.5.5.2 Normality Test ............................................................................ 39
3.6 Measuring the Variability of the Regression Model ......................... 40
3.7 Testing Hypothesis ............................................................................ 41
3.7.1 F-Test .......................................................................................... 41
3.7.2 T-Test .......................................................................................... 42
CHAPTER IV
LITERATURE REVIEW .....................................................................
4.1 Company Profile ............................................................................... 43
4.1.1 Vision and Mission, and object of BRI ....................................... 44
4.1.2 Organization Chart ...................................................................... 44
4.2 Data Analysis .................................................................................... 45
4.2.1 Validity Test ................................................................................ 46
4.2.2 Reliability Test ............................................................................ 46
4.3 Interpretation of Result .................................................................... 48
4.3.1 Respondent Profiling Demographic Profile ................................ 48
4.3.2 Descriptive Analysis ................................................................... 50
4.3.3 Classical Assumption Test .......................................................... 50
4.3.4 Multicollinearity Test .................................................................. 52
4.3.5 Heteroscedascity Test.................................................................. 53
4.3.6 Testing of Hypothesis ................................................................. 53
4.3.6.1 Coefficient of Correlation (R) and Coefficient of Determination (R2) 54
4.3.6.2 F- Test ......................................................................................... 55
4.3.6.3 T- Test ......................................................................................... 56
CHAPTER V
CONCLUSION AND RECOMMENDATION .................................. 60
5.1 Conclusion ........................................................................................ 60
5.2 Recommendation ............................................................................... 60
5.2.1 For The Bank .............................................................................. 61
5.2.2 For The Future Researchers ........................................................ 61
x
REFERENCES ...................................................................................... 62
APPENDIX ............................................................................................ 68
APPENDIX 1 .......................................................................................... 68
APPENDIX 2 .......................................................................................... 72
APPENDIX 3 .......................................................................................... 73
APPENDIX 4 .......................................................................................... 75
xi
LIST OF TABLE
Table 3.1 : Variables and Questionnaires ........................................................... 31
Table 3.2 : Likert Scale ...................................................................................... 33
Table 3.3 : Interpretation for Cronbach‟s Alpha Value...................................... 36
Table 4.1 : Validity Test Report Sheet ............................................................... 47
Table 4.2 : Work Environment cronbach‟s Alpha ............................................. 48
Table 4.2 : Interest and cost cronbach‟s Alpha .................................................. 48
Table 4.3 : Salary cronbach‟s Alpha .................................................................. 48
Table 4.4 : Leadership cronbach‟s Alpha ........................................................... 48
Table 4.5 : Gender Percentage Table ................................................................. 49
Table 4.6 : Respondents Profiling-Respondents‟ Age Table ............................. 51
Table 4.7 : Respondents Profiling-Education..................................................... 51
Table 4.7 : Respondents Profiling-Income pe month ......................................... 52
Table 4.7 : Respondents Profiling-Education..................................................... 51
Table 4.9 : Descriptive Statistic ........................................................................ 53
Table 4.10 : Multicollinearit ................................................................................. 55
Table 4.11 : Coefficient Determinant (R2) ........................................................... 57
Table 4.12 : F-test ................................................................................................. 58
Table 4.13 : T-test ................................................................................................ 59
xii
LIST OF FIGURE
Figure 2.1 : Abraham Maslow‟s Tiered Human and Needs .............................. 10
Figure 2.2 : Leadership Styles ........................................................................... 21
Figure 2.3 : Theoretical Farmwork ................................................................... 24
Figure 3.1 : Data Collection Method ................................................................. 31
Figure 3.2 : Research Framework ..................................................................... 34
Figure 4.1 : Respondent profiling – gender Pie Chart ...................................... 49
Figure 4.2 : Respondent profiling – Age Pie Chart ........................................... 50
Figure 4.3 : Respondent profiling – Education Pie Chart ................................. 51
Figure 4.4 : Respondent profiling – Income per month Pie Chart .................... 52
Figure 4.5 : Normal P – P Plot of Regression Standard Residual ..................... 54
Figure 4.6 : Histogram – Regression Standardized Residual ............................ 55
Figure 4.7 : Heteroscedascity Test .................................................................... 56
xiii
LIST OF ACRONYMS
BRI : Bank Rakyat Indonesia
ATM : Automatic Teller Machines
SPSS : Statistical Package for the Social Sciences
et al. : People Things
etc. : et cetera
1
CHAPTER 1
INTRODUCTION
1.1 Background of Study
Every organization concerned towards the best performance that produced by a
series of system that prevails in the Organization. Human resources is one of the
key factors to get the best performance, because in addition to addressing the
issue of expertise, skills and human resource management are also obliged to
establish employee behavior conducive to getting the best performance.
Competitive pressures in the business require companies to think about how
companies adapt to changing environments. Environmental adaptation could
mean in terms of administrative environment company, which means it should
restructured in organization. Generally, company has a purpose not only to
achieve of maximum profit, but it also can survive in an increasingly high
competition. To achieve that goal, the company is not able to throw over human
labor as one of the factors of production. This is because human resources
become a controller and economical planner.
Employees as a worker in companies become as very active role in order to the
achievement of their purpose. The goal will be successful if they work very
productively. Hence, companies should provide a suitable feedback to improve
employee performance in working.
Work motivation is also necessary for employees to improve its performance.
According to Sujak (1990), a good understanding of work motivation that
comprehends in each employee‟s thinking or their outside environment will be
helpful for improving of work performance.
The performance was the result of work that can be accomplished by a person or
group of people within an organization, in accordance with the authority and
responsibilities of each other, in order to reach the objectives of the organization's
efforts in question legally and it does not violate the law and in accordance with
2
the moral and ethical (Prawirosentono, 2001). Employee‟s motivation was
influence by lot factors, which conducted to the work performance itself or
companies of environment or organizations such as motivation and work
environment (Mathis and Jackson, 2006).
PT. BANK RAKYAT INDONESIA (BRI) is a government bank that first
established after the independence of Indonesia. BRI commit that BRI will always
build micro business, small and size enterprise and it will not be changed even
thought a government is no longer shareholders after initial public offering (IPO).
For next, Bank BRI has set a channeling credit to micro, small, and medium
enterprises should not be less than 80 percent. As one of the state-owned business
entities (BUMN) that have been go public, BRI always care to help build small
businesses and medium enterprises.
Object of this research is BRI Branch of Labuan which is the largest state-owned
bank and the bank with the largest asset holdings in Indonesia, in which human
resources are the most important asset in it, thus the need for an evaluation of
employee performance continuously in order to reliable human resources, the BRI
can continue to provide maximum service to the general public as well as
customers of BRI.
BRI is company that moves savings in the fields of services and services banking
loans. On BRI Bank branch of Labuan there are some forms of savings as:
Deposit, Britama, ONH and Clearing accounts. While loans namely commercial
credit consists of: working capital credits and investment, consumption credit,
KPR and vehicles.
According to Rokhman ( 2002 ) “work environment is formed by the existence of
an external commitments, it arise because of demands on the completion of duty
and responsibility and commitment of internal is determined by the ability of the
leaders and environmental organization in need and professional attitude in
resolving unmannerly the responsibility of companies”.
At work, we need high motivation so that we can complete the job with high-
3
efficiency, high motivation during job not only can help us finish the work but
also we can achieve our goal more easily.
Motivation is internal and external factors that stimulate people‟s desire and
energy to be continually committed to a job or subject, or to make an effort to
achieve a goal. Motivation results from the interaction of both conscious and
unconscious factors such as aspire of desire or need; incentive or reward value of
the goal, these factors are the reasons one has for behaving a certain way. In
today‟s economy world, it is more important than ever to have a motivated
workforce. With motivation, employees are productive. And a productive
employee is a more profitable employee. When people aren‟t motivated, they
become less productive, less creative, less of an asset to company.
In this research the researcher only consider the external factors that influence
employees‟ motivation in bank. The external factors that consider in this research
are company‟s work environment, salary, and leadership. The company should
consummate their management system and take human-based management to
improve their employees‟ work motivation. It is necessary and significant for
company to provide a better work environment, pay an equitable salary to
employees, and established a perfect leadership system. Improve employee
motivation is not only the employees own thing but also is the company
leadership‟s responsibilities.
Only when they enjoy the company‟s work environment and satisfied with the
company‟s management style they can have a high work motivation and this will
promote the development of company and can create benefit to employees
themselves; the low work motivation will influence the development of the
company and also is not good to the employees‟ profit.
The reason why the researcher choose this topic is that because that the researcher
take internship in PT BANK RAKYAT INDONESIA (BRI) Branch of Labuan.
Sometimes the employees‟ motivation in bank is not high; the researcher is
interested to know whether the work environment, salary, and leadership have
significant influence to employee‟s motivation in bank. And also the researcher
4
want give some suggestions about what factors influence employees‟ motivation
to the company according to the research result.
1.2 Problem Identification
As the background stated above that the company is very concerned in regard to
the achievement of every personnel in every functional division. This concern is
fuelled by the fact that the achievement of the company‟s personnel motivation
are lower that several employees didn‟t give the best performance to the company
which raises the company‟s opportunity cost in training new personnel, with that
company need to correct a way to improve their employees‟ motivation and work
efficiently rightly.
According to the result of interview by manager of BRI branch of Labuan
expressing that motivational level of employees is lower. Therefore, in order to
gain a head start in 2015, a research is being launched in order to find a way to
formulate and improved efficiency of employees‟ motivation. As a start a research
on personnel mental activity is done in order to find a way to increase the
willingness of employees and raise maximum effort.
Based on this concern the researcher would like to conduct a research to be able to
investigate work environment, salary, and leadership towards employees‟
motivation in Bank (A Case Study of PT. BRI Labuan Branch).
1.3 Statement of the problem
Based on problem identified, there are some problems that can be stated.
1. Is there any partial significance influence between work environments
towards employees‟ motivation?
2. Is there any partial significance influence between salary towards
employees‟ motivation?

5
3. Is there any partial significance influence between leadership towards
employees‟ motivation?
4. Is there any simultaneous significance influence between work
environment, salary and leadership towards employees‟ motivation?
1.4 Research Objectives
The objective of this research
1. To find out partial significance influence between work environment
towards employees‟ motivation
2. To find out partial significance influence between salary towards
employees‟ motivation.
3. To find out partial significance influence between leadership towards
employees‟ motivation.
4. To find out simultaneous significance influence between work
environment, salary and leadership towards employees‟ motivation.
1.5 Definition of terms
1. Employees: An employee contributes labor and/or expertise to an
enterprise or an employer and is usually hired to perform specific set of
duties which are packaged into a job. An employee is a person who is
hired to provide services to a company on a regular basis in
exchange for compensation and who does not provide these services as a
part of an independent business.
2. Leadership: leadership is organizing a group of people to achieve a
common goal. Leadership is a process of influencing others to understand
and accept what needs to be done and how to do it, and it is the process of
facilitating individual and collective effort to accomplish shared objective.
3. Motivation: internal and external factors that stimulate desire and energy
in people to be continually and committed to a job, role, or subject, or to
make an effort to attain a goal. Motivation results from the interaction of
6
make an effort to attain a goal. Motivation results from the interaction of
desire or need: or reward value of the goal and expectations of the
individual and of his her peers. The factors are the reasons one has for
behaving a certain way.
4. Salary: a salary is the compensation provisioned by employer for
employees in exchange of their services. The amount of salary is often
agreed between employers and employees before performing services.
There are many occasion a salary can be paid e.g. annually, monthly,
biweekly, weekly, and daily.
5. Work Motivation: is a process used to increase the employee‟s fervor in
doing their jobs.
6. Work Environment: worksite, a place where the employees do their
jobs. Work environment encompasses the actual site and its surrounding
and various factors in the site and the surrounding e.g. air temperature,
weather, worksite condition, cleanliness, pollution, noise pollution. Work
Environment also includes the facility the employees can use to aid their
jobs e.g. photocopy and fax machines, coffee machines, recreation room,
napping room.
1.6 Scope and Limitation
The scope and limitation of this research of this study only covers the
banking sector of employees BRI Labuan. Another limitation is that it
excludes many variables of compensation due to shortage of time. Funds
were also another limitation. Apart from these limitations this research may
provide insights to the managers to enhance the employee performance of
their subordinates. Here are several scope and limitation on this research such
as:
1. No data from the company shall be displayed in any manner due to
confidentiality reason with the exception the raw data result of
questionnaire and any information/conclusion derived from such data.
7
2. This research limitation that its questionnaires are answered truthfully by
the respondents from the company.
1.7 Research Benefit
For President University
This research can be used to again better understanding of the knowledge of how
to improve employees‟ work in companies. The factors that influence the
employees‟ work motivation for other students who are interested in HR or
launching a privately owned company.
For other researcher
Other researchers can use the factor used in this research as a part of their own
research and gain better understanding of related knowledge. Research can also
use this as reference to make their research paper thicker.
For the company
The company can use the research to find out how to make their employees work
harder at the lowest cost possible. That way they can save more money and gain
more profit.
For the researcher
To find out how strong brand equity of BRI Branch of Labuan and gain more
understanding on brand awareness, brand associations, brand loyalty and
Perceived quality also their impact on the consumer purchasing decision.
For future researcher
The output of the research would become a baseline and additional knowledge to
enhance the needs of people who would do future research about the Brand Equity
and Perceived Quality and their impact on the purchasing decision.
8
CHAPTER II
REVIEW OF LITERATURE
2.1 Theoretical Review
2.1.1 Motivation and its Theories
From Oxford Dictionaries, motivation as a noun means a reason or reason
for acting or behaving in a certain way. As a mass noun it also means desire or
willingness to do something or enthusiasm.
According to about com there are three components of motivation which are
activation persistence and intensity. Activation involves the decision to initiate
behavior such as applying in accompany. Persistence is continues effort towards a
goal even though obstacles may exist, such as going overtime in workplace to
reach the company‟s targets and goal. Finally, intensity can be seen in the
concentration and vigor that goes into pursuing a goal. For example employee
may go out of his way to attend courses on how to get higher Client.
Awosusi (2011) said that motivation is anything done or efforts made to
encourage the behavior of employees towards better performance in the course of
accomplishing he goals of the organization. Motivation is the incentives
inducements and rewards that are given to works at regular basis so as to boost
their morale for enhanced productivity.
2.1.2 Abraham Maslow’s 5 Tiered Human Desires and Needs
Working motivation of a worker is usually complex due to the tight relation
of individual factors and organizational factors. Examples of individual factors are
basic necessities, personal goals, attitude and abilities. Meanwhile organization
the employees belong to for example, salary payment, social security, co-worker
relationship, supervising, relation to customer and the job description itself.
Based on the paragraph above, in this research, the measurement of working
motivation adopts the theory of Abraham Maslow‟s 5 hierarchical necessities.
According to this theory, the necessities of a human are classified into a 5 tier
hierarchy. The five hierarchies are as follow:
9
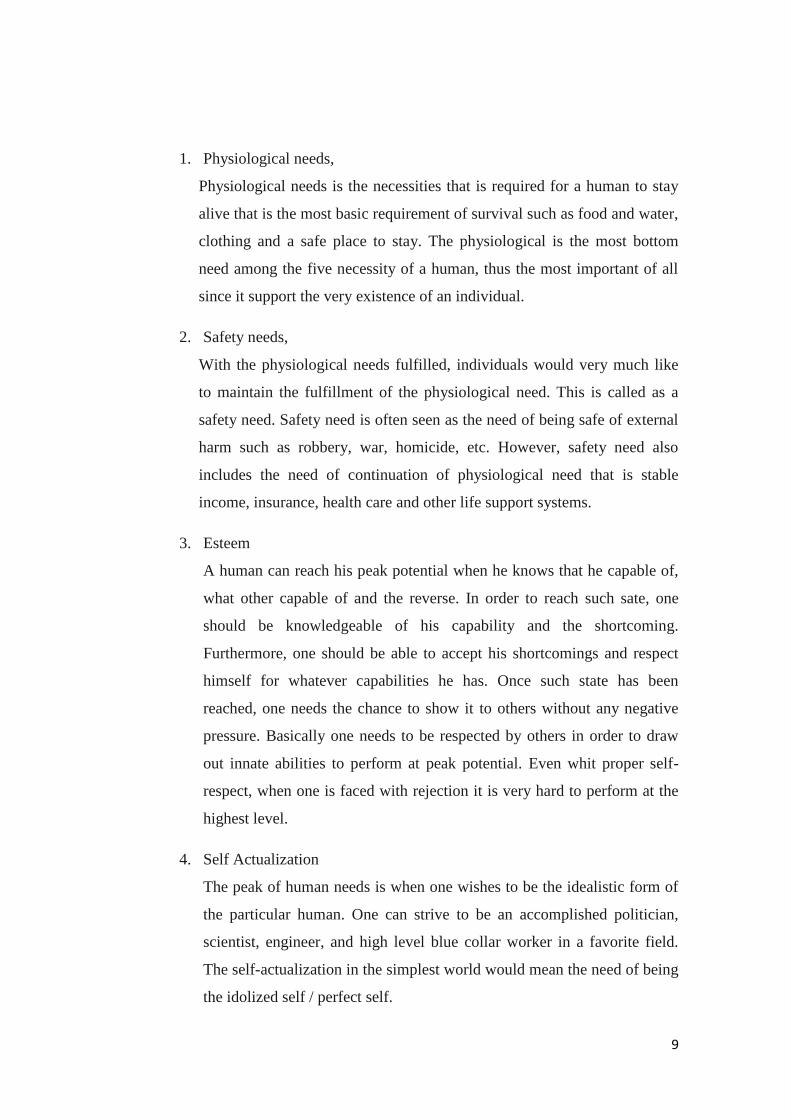
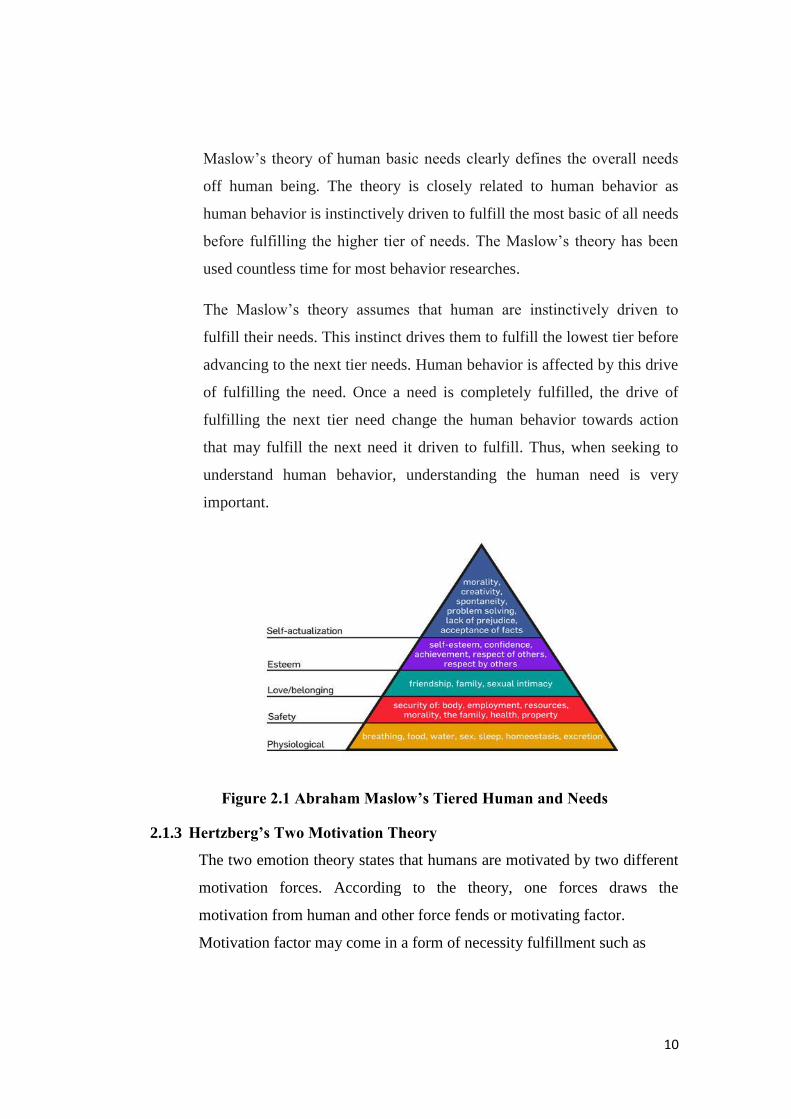
1. Physiological needs,
Physiological needs is the necessities that is required for a human to stay
alive that is the most basic requirement of survival such as food and water,
clothing and a safe place to stay. The physiological is the most bottom
need among the five necessity of a human, thus the most important of all
since it support the very existence of an individual.
2. Safety needs,
With the physiological needs fulfilled, individuals would very much like
to maintain the fulfillment of the physiological need. This is called as a
safety need. Safety need is often seen as the need of being safe of external
harm such as robbery, war, homicide, etc. However, safety need also
includes the need of continuation of physiological need that is stable
income, insurance, health care and other life support systems.
3. Esteem
A human can reach his peak potential when he knows that he capable of,
what other capable of and the reverse. In order to reach such sate, one
should be knowledgeable of his capability and the shortcoming.
Furthermore, one should be able to accept his shortcomings and respect
himself for whatever capabilities he has. Once such state has been
reached, one needs the chance to show it to others without any negative
pressure. Basically one needs to be respected by others in order to draw
out innate abilities to perform at peak potential. Even whit proper self-
respect, when one is faced with rejection it is very hard to perform at the
highest level.
4. Self Actualization
The peak of human needs is when one wishes to be the idealistic form of
the particular human. One can strive to be an accomplished politician,
scientist, engineer, and high level blue collar worker in a favorite field.
The self-actualization in the simplest world would mean the need of being
the idolized self / perfect self.
10
Maslow‟s theory of human basic needs clearly defines the overall needs
off human being. The theory is closely related to human behavior as
human behavior is instinctively driven to fulfill the most basic of all needs
before fulfilling the higher tier of needs. The Maslow‟s theory has been
used countless time for most behavior researches.
The Maslow‟s theory assumes that human are instinctively driven to
fulfill their needs. This instinct drives them to fulfill the lowest tier before
advancing to the next tier needs. Human behavior is affected by this drive
of fulfilling the need. Once a need is completely fulfilled, the drive of
fulfilling the next tier need change the human behavior towards action
that may fulfill the next need it driven to fulfill. Thus, when seeking to
understand human behavior, understanding the human need is very
important.
Figure 2.1 Abraham Maslow’s Tiered Human and Needs
2.1.3 Hertzberg’s Two Motivation Theory
The two emotion theory states that humans are motivated by two different
motivation forces. According to the theory, one forces draws the
motivation from human and other force fends or motivating factor.
Motivation factor may come in a form of necessity fulfillment such as
11
salary, and social benefit motivation is needed in order to increase
employee motivation hygiene factor may come in a from of s
afterguard such as insurance or safety.
2.1.4 Fundamental principles of motivation
1. Fundamental principle of goal formulation
Both employee and corporation should be beneficial to both company
and employee to increases the chance of increasing motivation.
2. Combination of material incentive and mental simulation
Combination of both material and mental benefits makes strong
spiritual attachment with both driving forces, employee might stay
longer.
3. Principles of guidance
“Mentors” is an important part motivation process. This way, employee
would perhaps learn faster.
4. Principles of logical Motivation
The input of motivation should be balanced with expectation of result
and the balance of reward and consequences. That way, the input and
output should be balanced.
5. Principles of the Transparency
Everything that can be known should be known such be done regularly.
That way, the motivation should be maintained.
6. Principle of regularity
In order maintain motivation, maintenance should be done regularly,
that way, the motivation should be maintained.
7. Combination of positive and negative emotion
Both positive and negative emotions can be used to attain corporate
goal. By using both, employee should have more source of motivation,
2.1.5 Motivation strategies
There are several ways to motivate employees
1. Reward and Recognition
12
The usage of reward shall increase the motivation of the employee.
And recognition shall provide sense of belonging. By using both,
hopefully the motivation increases.
2. Communication
Regular communication in workplace provider better sense of
belonging. Hopefully employee would stay longer in the company.
3. Culture
Creating motivation preserving culture in workplace shall create a self
preserving autonomous motivation maintenance system. Hopefully the
company needs no external motivation anymore.
4. Supplies
Proper facility and apparatus prevents the drop of morale in
workplace. Employee should be able to work at erase with proper
supply.
2.1.6 Work Environment
In order to maintain the motivation level, the environment should be
physically and mentally adjusted to a condition where a proper motivation level
can be maintained with smallest cost possible.
According to R.B. Briner (2006) work environment appear to have both
positive and negative impacts on the psychological well-being of workers. High
motivation need the organization provide good work environment. The physical
work environment such as the buildings, private offices, cubicles, work spaces,
meeting rooms, team rooms, and mobile workplaces-has a significant effect on
people‟s behavior and performance.
John Holland‟s Theory of carrier Choice maintains that people prefer
search for environment that will let them use their skills and abilities, and express
their attitudes and values, Behavior is determined by an interaction between
personality and environment. (Steve D.Brown. Robert W. Lent, 2005) Holland
emphasizes that people who choose to work in an environment similar to their
personality type are more likely to be successful and satisfied.
13
Climate and culture were directly related to post training behaviors. The
climate and culture in Indonesia for example is different from most western
countries. Companies should take measure in order to provide a hospitable
workplace for their employee such us the provision of Air Conditioning units and
cold beverages might help lessen the burden on the employees this maintaining
motivation.
2.1.6.1 Work Environment Theories
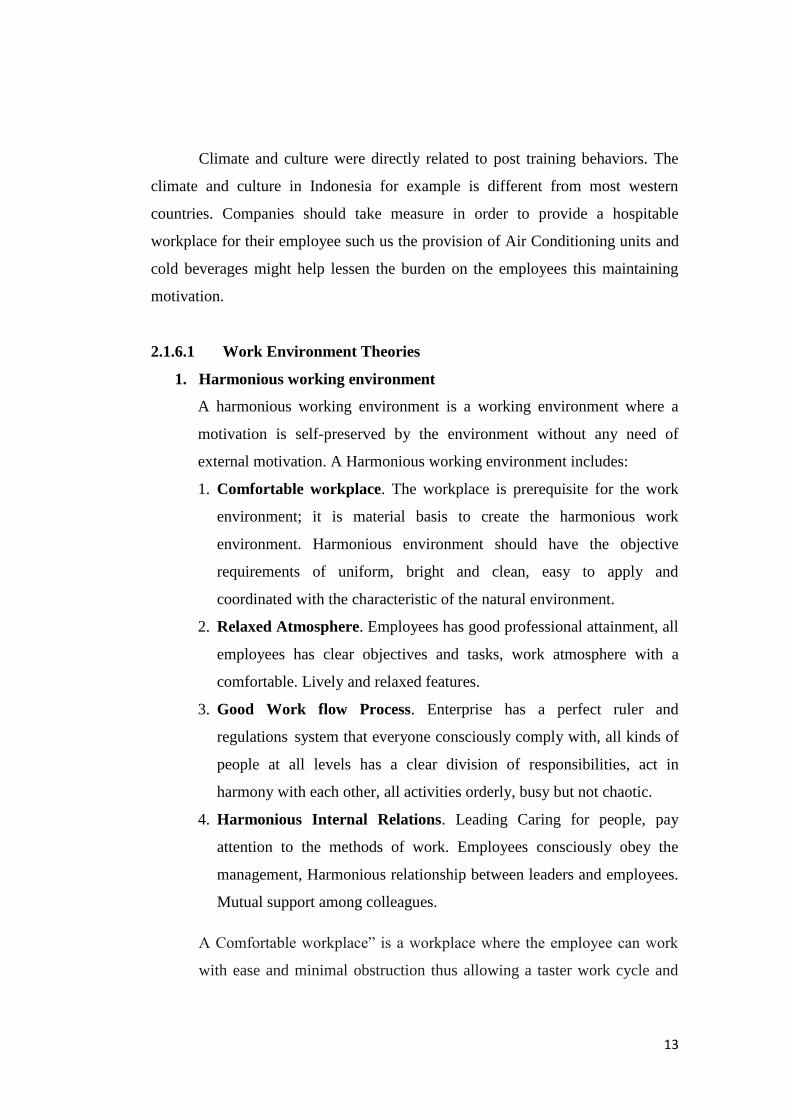
1. Harmonious working environment
A harmonious working environment is a working environment where a
motivation is self-preserved by the environment without any need of
external motivation. A Harmonious working environment includes:
1. Comfortable workplace. The workplace is prerequisite for the work
environment; it is material basis to create the harmonious work
environment. Harmonious environment should have the objective
requirements of uniform, bright and clean, easy to apply and
coordinated with the characteristic of the natural environment.
2. Relaxed Atmosphere. Employees has good professional attainment, all
employees has clear objectives and tasks, work atmosphere with a
comfortable. Lively and relaxed features.
3. Good Work flow Process. Enterprise has a perfect ruler and
regulations system that everyone consciously comply with, all kinds of
people at all levels has a clear division of responsibilities, act in
harmony with each other, all activities orderly, busy but not chaotic.
4. Harmonious Internal Relations. Leading Caring for people, pay
attention to the methods of work. Employees consciously obey the
management, Harmonious relationship between leaders and employees.
Mutual support among colleagues.
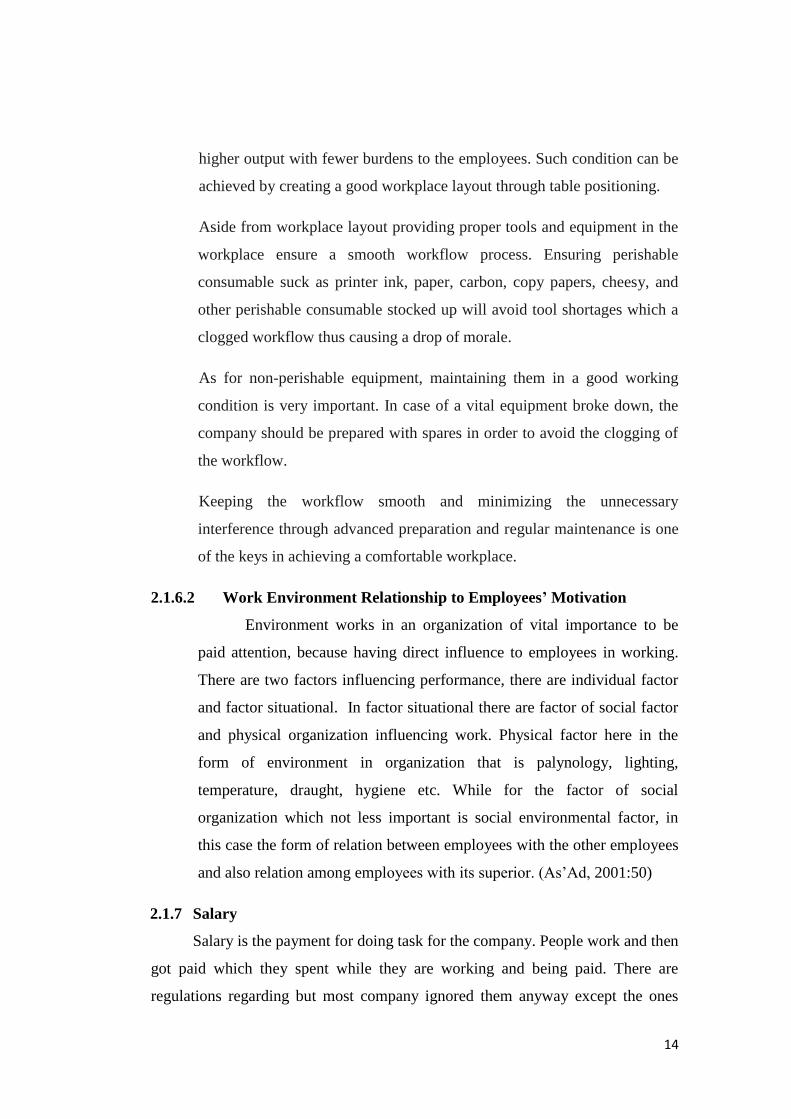
A Comfortable workplace” is a workplace where the employee can work
with ease and minimal obstruction thus allowing a taster work cycle and
14
higher output with fewer burdens to the employees. Such condition can be
achieved by creating a good workplace layout through table positioning.
Aside from workplace layout providing proper tools and equipment in the
workplace ensure a smooth workflow process. Ensuring perishable
consumable suck as printer ink, paper, carbon, copy papers, cheesy, and
other perishable consumable stocked up will avoid tool shortages which a
clogged workflow thus causing a drop of morale.
As for non-perishable equipment, maintaining them in a good working
condition is very important. In case of a vital equipment broke down, the
company should be prepared with spares in order to avoid the clogging of
the workflow.
Keeping the workflow smooth and minimizing the unnecessary
interference through advanced preparation and regular maintenance is one
of the keys in achieving a comfortable workplace.
2.1.6.2 Work Environment Relationship to Employees’ Motivation
Environment works in an organization of vital importance to be
paid attention, because having direct influence to employees in working.
There are two factors influencing performance, there are individual factor
and factor situational. In factor situational there are factor of social factor
and physical organization influencing work. Physical factor here in the
form of environment in organization that is palynology, lighting,
temperature, draught, hygiene etc. While for the factor of social
organization which not less important is social environmental factor, in
this case the form of relation between employees with the other employees
and also relation among employees with its superior. (As‟Ad, 2001:50)
2.1.7 Salary
Salary is the payment for doing task for the company. People work and then
got paid which they spent while they are working and being paid. There are
regulations regarding but most company ignored them anyway except the ones
15
which are closely watched by the police. However, lately, employees are getting
smart and start rioting regarding their payments which is the cause of traffic jams
in many cities. Several cases also involves tire burning which accelerated global
warming.
2.1.7.1 Salary Theories
1. Living Salary Theory
Salary should be, at minimum able to maintain the most basic living
expenses of the employee‟s direct family. Quite humanistic, basically this
theory suggest that, even if the employee only laze around or doesn‟t come
to work or doesn‟t give benefit to the company, they should be still paid
salary equal to their bare minimum living expenses.
2. Share Salary Theory
Salary should be proportional to the benefit the employee contributes to
the company. Using this theory will start spark of fiery (if not friendly)
competition among employees. Company can expect accelerated growth at
the initial phase until someone starts bribery and backstabbing and other
stuffs that can potentially ruin the internal structure of the company.
3. Bargaining Theory
Salary is decided before employment and the value are decides in an
agreement between the company and the employee. This theory, no matter
how sound it is, has a tad bit gambling elements. The company will have
to pay the agreed amount of salary after the agreement no matter how good
/ bad the employee‟s achievement. Basically the company wins if it can
sign low salary signed a high salary agreement with an actually low
achievement employee.
2.1.7.2 Salary Relationship to Employees’ Motivation
In a company a manager can improve in a company a manager can
improve the performance in the way of pushing its employees to strive in their
work. Efficacy or its not a manager in motivating its employees can be seen
behaviorally its employees in working. Somebody very motivated will strive to

16
the work as according to expected goals, but the employees who didn‟t motivated
didn‟t want to work according to the goals expected even its work messed
absolutely.
To increase the employees‟ performance a manager can give the
motivation for the example by giving salary, compensation, subsidy and incentive.
All of the motivation things will pushing the employees to strive in their work
Efficacy or it‟s not a manager in motivating its employees can be seen
behaviorally its employees in working. Somebody very motivated will strive to
the work as according to expected goals, somebody which is not motivated do not
want to its work as according to goals expected even its work messed absolutely.
To increase its employees performance a manager the motivation by for
example by giving salary, compensation, subsidy and incentive to employees.
(Dewhurst et al, 2010)
2.1.8 Leadership
Leadership is a process of giving orders and having them executed.
Leadership is also the process of facility procurement in order to have the orders
done. Without proper leadership, most of the time employees would not be
productive.
When employee is not productive the company profit level compared to its
potential. In some worse case the company may go in the red and ended up
exhausting its cash reserve and had to cease operation leaving the unproductive
employees unemployed.
According to Gary Yuki (2006), leadership is a process of influencing
others to understand and accept what needs to be done and how to do it, and it is
the process of facilitating individual and collective effort to accomplish shared
objective. There are some leadership theories; in here the researcher would like to
choose some theories such as behavioral theories, participative theory and
situational theory.
17
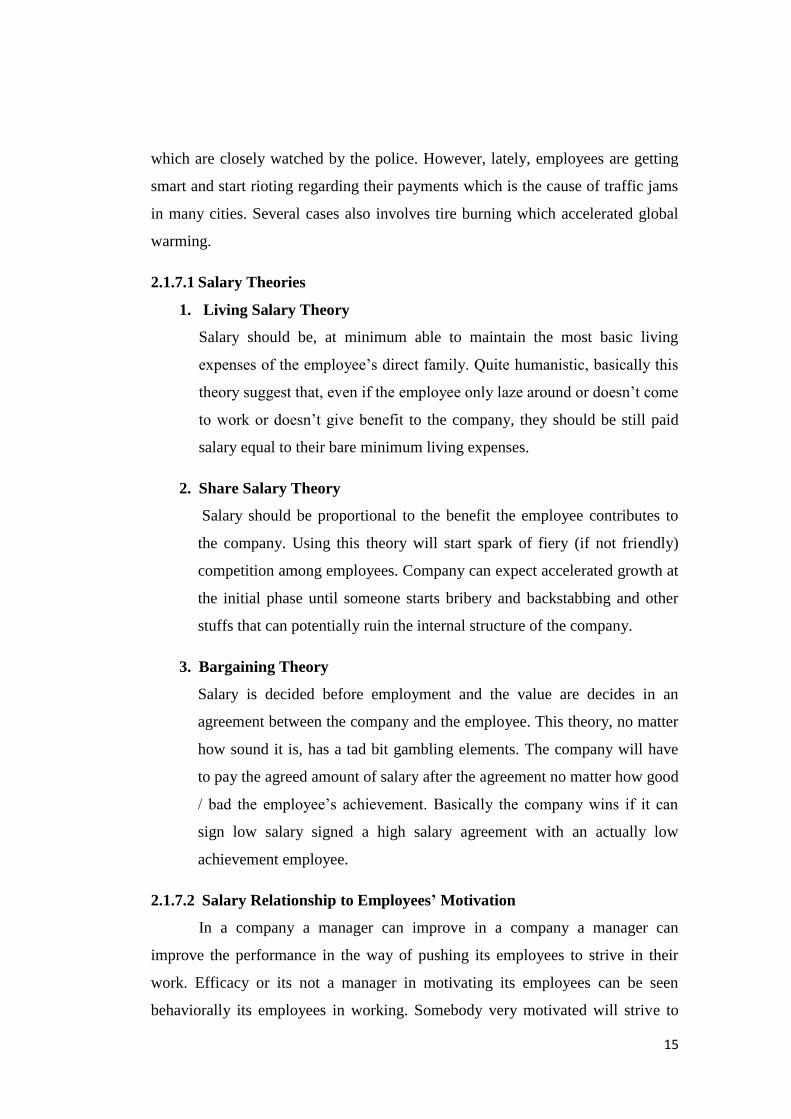
2.1.8.1 Leadership Theories
1. Behavioral Leadership
Behavioral theories of leadership refer to what the leader actually do rather
than seek their inborn traits or capabilities.
The managerial grid is a model that defined by Blake and Mouton in
1963s and is based on behavioral theories, the leaders have to concern the
productivity while at the same time concern their employees, how much
attention they pay for one or another decide what kind of leadership they
are. The managerial grid as follows:
a. Impoverished Leadership –low production/ low people
This is the most ineffective leadership, in this style of leadership the
leader nether has a high regards to get the job done, or satisfying the
employees and motivate them.
b. Produce or perish leadership – high production / low people
This style leadership focuses on task but more the employee‟s
satisfying needs, it is very autocratic.
c. Country Club leadership – high people / low production
This style‟s leadership care and concern for their employee‟s,
employees have high degree of satisfaction, but with a low focus on
task, the company may give questionable results.
d. Middle of the road leadership – Medium production / Medium people
This style leadership is a weak balance of focus on both people and
work but neither is fully satisfied.
e. Team Leadership – High Production / High people
According to Blake – Mouton model, this is the best leadership style.
People are committed to task and leader is committed to both people
and task. The employee‟s needs and production needs coincides leads
to a high satisfaction and motivation and as a result a high production.
2. Situational Leadership
The relation between leader and followers, the followers‟ motivation and
capability, and the particular situation may affect the leader to make
18
decision. Situational leadership is not just a single preferred style when
need decision.
Yuki (2006) identifies six variable combine with other approaches.
a. Subordinate effort
Motivation and endeavor that actual expended
b. Subordinate ability and position clear
Followers know what to do and how to do it
c. Organizing of the work
Work structure and resources utilization
d. Cooperation and cohesiveness
The group members working together
e. Resources and support
The availability of tools materials and people
f. External coordination
The need to collaborate with other groups
3. Contingency Theory
This theory states that one approach may give different result in a different
situation. One way maybe better that other way and in different situation
the reverse may applies. In short, according to contingency theory,
something can stay the same or change on different situation; in another
word nothing is certain, according to contingency theory.
4. Cognitive Resource Theory
According to this theory, a leader should:
1. lead when they can lead
If they don‟t know how to lead, they should let someone else lead the
team. Trying to lead a team without knowing how to lead will only
waste time and money and effort. In another word, a blind man should
not be allowed to lead the team for him will eventually led the team to
a pitfall.
2. Leader’s stress affects their decision making process
19
Stressful situation makes leaders (actually almost everyone, not just
the leader) unable to think much before making the decision. That
why, most decision taken under stressful condition have high chance
making things worse. Either that or it doesn‟t solve the problem at all.
3. Numerous Stress Situation creates habitual decision making on
reflex
When someone is exposed to numerous stressful situations, he‟ll
develop some sort of decision making reflex where he just cull
through any factors and skip to taking a decision which he often take
in the past with similar condition.
4. Leader’s doesn’t to lead what doesn’t need to be led
A leader should lead, except things that don‟t need to be le. A leader
leading the staff on how to operate the photocopy machine is a waste
og salary compared to it the spend more time on improving the
workflow.
5. Leadership Skills
1. Relationship
Better relationship allows leader to initiate more commands without
being seen as autocratic. It allows leaders to issue order in the name of
friendship instead of a boss. This makes a leader looks more sociable
despite still issuing the same order to employees.
2. Team Building
Putting employees into team allow smaller task to be handled through
delegated officers, making mass control over employees easier. Why
waste time controlling every single employee? Putting employees in
teams led by someone that can be controlled can save time and money.
3. Vision and Strategy
Being visionary gives employees something to look for in the future
and being strategic allows the company through dire times. Employees
20
have a tendency to admire leader who can see what they cannot see.
That‟s where being a visionary leader comes, it allows a leader to be
more charismatic.
4. Decision making
Better decision making skill allows better decision to be made. More
good decision a tendency to give bonus to employees and the leader.
That is, unless the company is a totalitarian one.
5. Planning
A good planning allows the company to prepare for future conflicts. It‟s
like chess, if you plan well you re likely to win. Unless someone in the
company mess things up.
6. Leadership Style
Leadership style is a tendency of using a particular set of habits when
leading
1. Autocratic / Totalitarian
Leaders issue orders and followers execute them. This leadership style
is basically almost the same as a city under martial law. Any
disobedience will be met with large (if not excessive) force
2. Participative / Democratic
Followers recommend orders and leaders make the final call then
followers execute them. Think of it like a shareholder meeting. The one
where the leaders has 51% of the vote which mean the leader accept
suggestions from the followers, but still has the option to ignore all
suggestion and create a personal choice which followers still has to
follow to heart.
3. Delegates / Liaises Faire
Followers do what they want and leaders watch. It has some anarchy
feels, leaders has no power or pretend not to have power while
followers are free to use their own solution to every problem the
21
company the company encounter. This leadership style is one where
there is no leader, which unique.
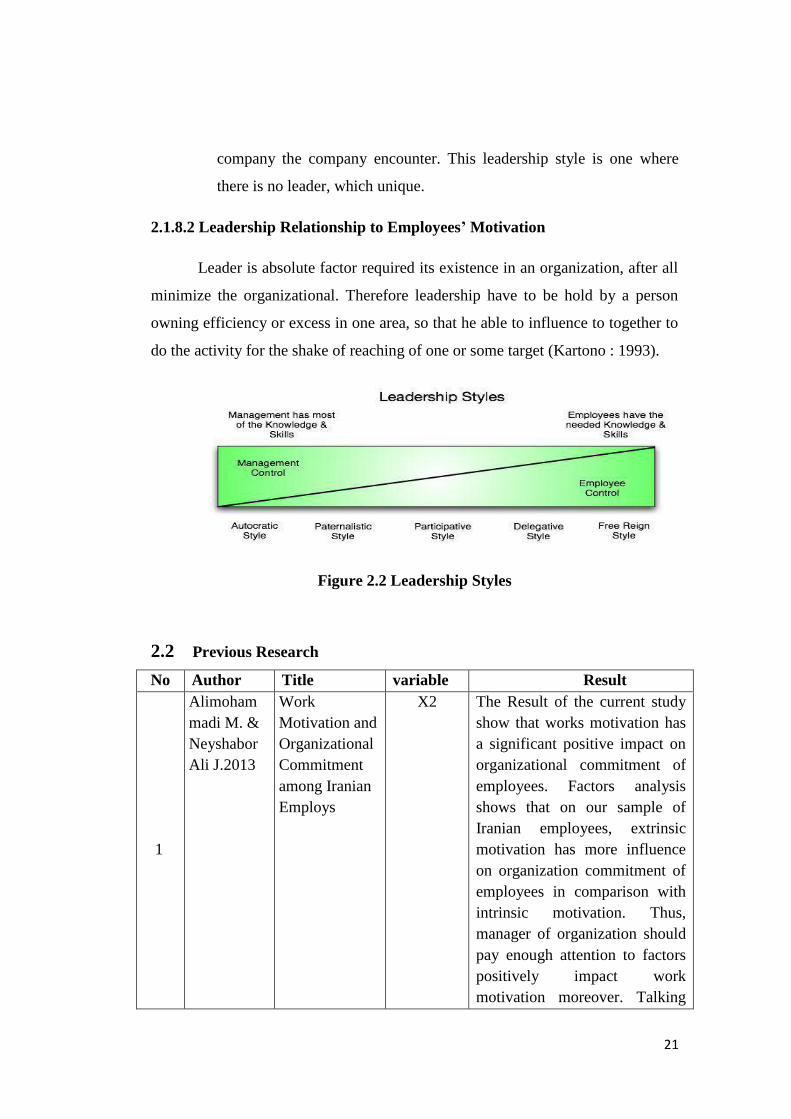
2.1.8.2 Leadership Relationship to Employees’ Motivation
Leader is absolute factor required its existence in an organization, after all
minimize the organizational. Therefore leadership have to be hold by a person
owning efficiency or excess in one area, so that he able to influence to together to
do the activity for the shake of reaching of one or some target (Kartono : 1993).
Figure 2.2 Leadership Styles
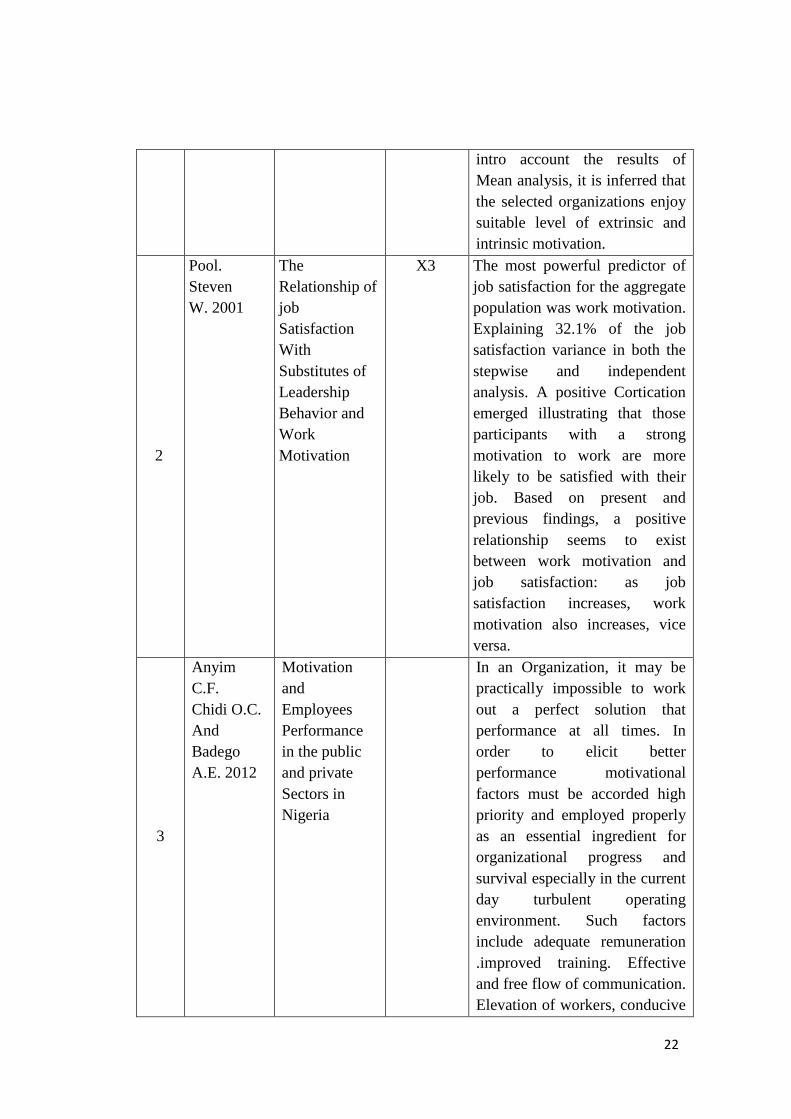
2.2 Previous Research
No Author Title variable Result
1
Alimoham
madi M. &
Neyshabor
Ali J.2013
Work
Motivation and
Organizational
Commitment
among Iranian
Employs
X2 The Result of the current study
show that works motivation has
a significant positive impact on
organizational commitment of
employees. Factors analysis
shows that on our sample of
Iranian employees, extrinsic
motivation has more influence
on organization commitment of
employees in comparison with
intrinsic motivation. Thus,
manager of organization should
pay enough attention to factors
positively impact work
motivation moreover. Talking
22
intro account the results of
Mean analysis, it is inferred that
the selected organizations enjoy
suitable level of extrinsic and
intrinsic motivation.
2
Pool.
Steven
W. 2001
The
Relationship of
job
Satisfaction
With
Substitutes of
Leadership
Behavior and
Work
Motivation
X3 The most powerful predictor of
job satisfaction for the aggregate
population was work motivation.
Explaining 32.1% of the job
satisfaction variance in both the
stepwise and independent
analysis. A positive Cortication
emerged illustrating that those
participants with a strong
motivation to work are more
likely to be satisfied with their
job. Based on present and
previous findings, a positive
relationship seems to exist
between work motivation and
job satisfaction: as job
satisfaction increases, work
motivation also increases, vice
versa.
3
Anyim
C.F.
Chidi O.C.
And
Badego
A.E. 2012
Motivation
and
Employees
Performance
in the public
and private
Sectors in
Nigeria
In an Organization, it may be
practically impossible to work
out a perfect solution that
performance at all times. In
order to elicit better
performance motivational
factors must be accorded high
priority and employed properly
as an essential ingredient for
organizational progress and
survival especially in the current
day turbulent operating
environment. Such factors
include adequate remuneration
.improved training. Effective
and free flow of communication.
Elevation of workers, conducive
23
and healthy working
environment amongst others.
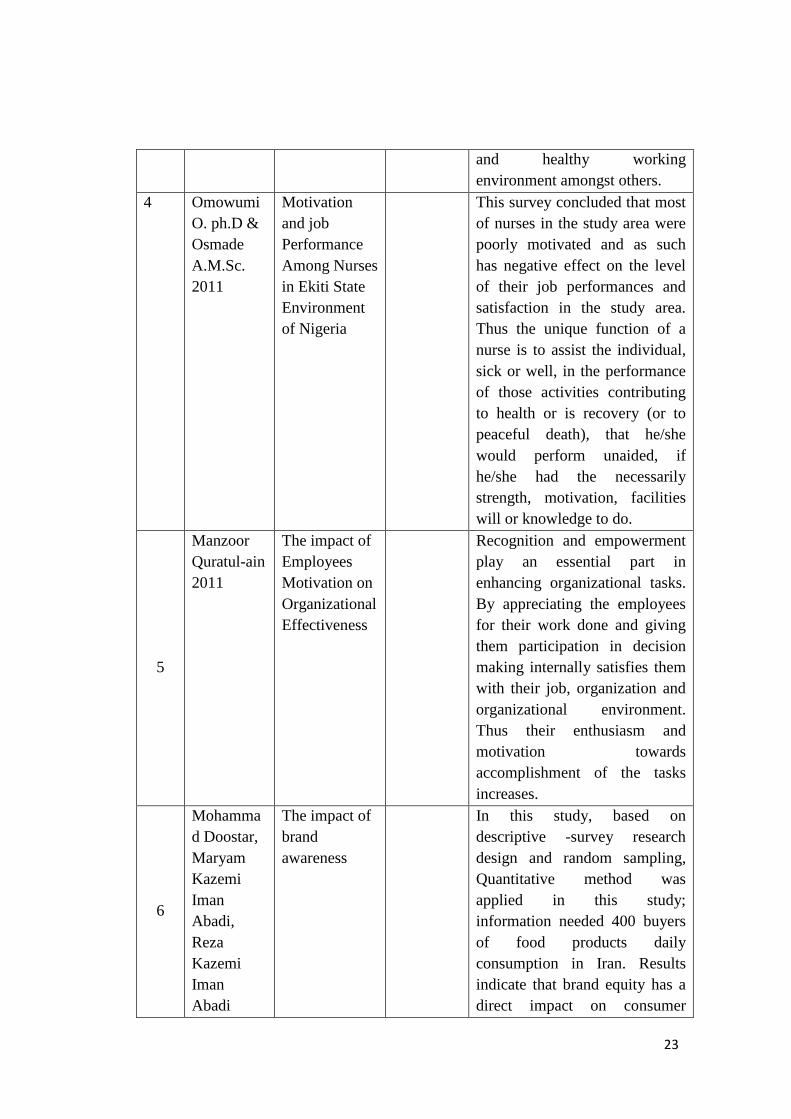
4 Omowumi
O. ph.D &
Osmade
A.M.Sc.
2011
Motivation
and job
Performance
Among Nurses
in Ekiti State
Environment
of Nigeria
This survey concluded that most
of nurses in the study area were
poorly motivated and as such
has negative effect on the level
of their job performances and
satisfaction in the study area.
Thus the unique function of a
nurse is to assist the individual,
sick or well, in the performance
of those activities contributing
to health or is recovery (or to
peaceful death), that he/she
would perform unaided, if
he/she had the necessarily
strength, motivation, facilities
will or knowledge to do.
5
Manzoor
Quratul-ain
2011
The impact of
Employees
Motivation on
Organizational
Effectiveness
Recognition and empowerment
play an essential part in
enhancing organizational tasks.
By appreciating the employees
for their work done and giving
them participation in decision
making internally satisfies them
with their job, organization and
organizational environment.
Thus their enthusiasm and
motivation towards
accomplishment of the tasks
increases.
6
Mohamma
d Doostar,
Maryam
Kazemi
Iman
Abadi,
Reza
Kazemi
Iman
Abadi
The impact of
brand
awareness
In this study, based on
descriptive -survey research
design and random sampling,
Quantitative method was
applied in this study;
information needed 400 buyers
of food products daily
consumption in Iran. Results
indicate that brand equity has a
direct impact on consumer
24
(2012) purchase decision with brand
awareness as the highest
significant to purchase decision
followed by brand association
and perceived quality.
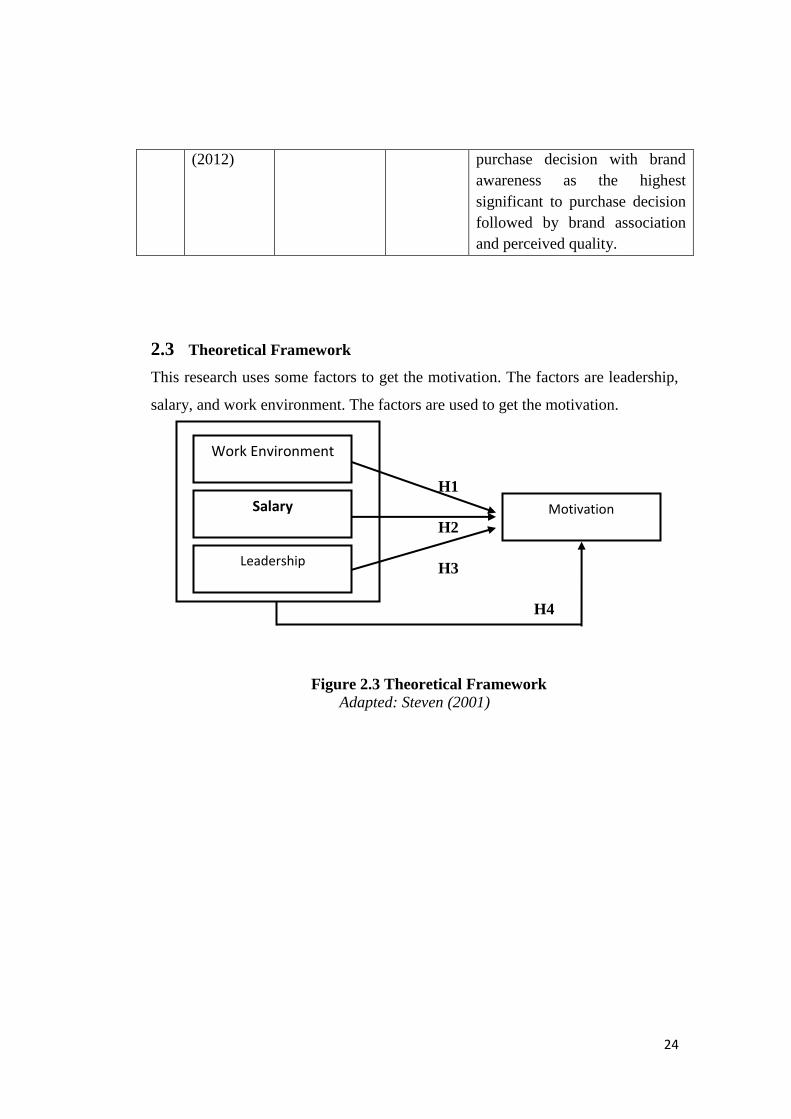
2.3 Theoretical Framework
This research uses some factors to get the motivation. The factors are leadership,
salary, and work environment. The factors are used to get the motivation.
H1
H2
H3
H4
Figure 2.3 Theoretical Framework
Adapted: Steven (2001)
Work Environment
(X1)
Salary
(X2)
Leadership
(X3)
Motivation
(Y)
25
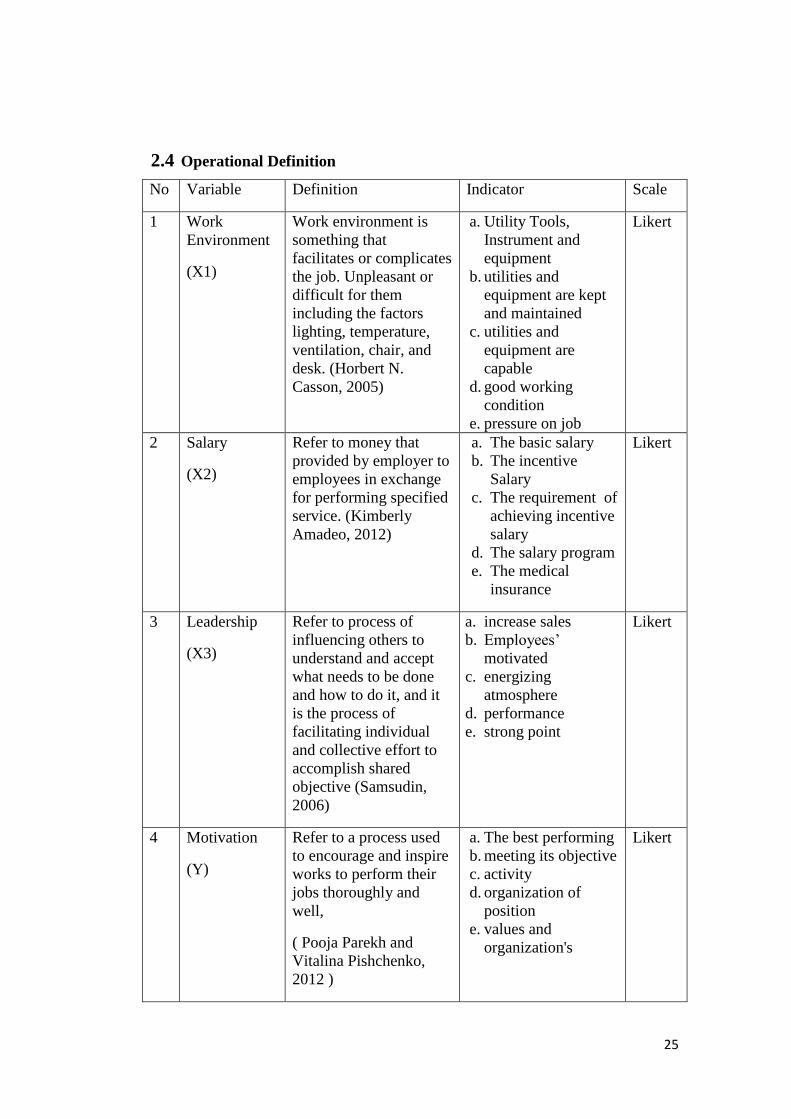
2.4 Operational Definition
No Variable Definition Indicator Scale
1 Work
Environment
(X1)
Work environment is
something that
facilitates or complicates
the job. Unpleasant or
difficult for them
including the factors
lighting, temperature,
ventilation, chair, and
desk. (Horbert N.
Casson, 2005)
a. Utility Tools,
Instrument and
equipment
b. utilities and
equipment are kept
and maintained
c. utilities and
equipment are
capable
d. good working
condition
e. pressure on job
Likert
2 Salary
(X2)
Refer to money that
provided by employer to
employees in exchange
for performing specified
service. (Kimberly
Amadeo, 2012)
a. The basic salary
b. The incentive
Salary
c. The requirement of
achieving incentive
salary
d. The salary program
e. The medical
insurance
Likert
3 Leadership
(X3)
Refer to process of
influencing others to
understand and accept
what needs to be done
and how to do it, and it
is the process of
facilitating individual
and collective effort to
accomplish shared
objective (Samsudin,
2006)
a. increase sales
b. Employees‟
motivated
c. energizing
atmosphere
d. performance
e. strong point
Likert
4 Motivation
(Y)
Refer to a process used
to encourage and inspire
works to perform their
jobs thoroughly and
well,
( Pooja Parekh and
Vitalina Pishchenko,
2012 )
a. The best performing
b. meeting its objective
c. activity
d. organization of
position
e. values and
organization's
Likert
26
2.5 Hypothesis
Hypothesis is an explanation for a phenomenon which can be tested in
some way to either proves or disproves the hypothesis. During testing, the
hypothesis is taken to be true, and the goal the researcher is to rigorously test the
hypothesis. The concept of the hypothesis is a very important part of the scientific
method, and it also holds true in other discipline as well.
For this research the hypothesis is as follows:
1. Ho1: there is no partial significance influence between work environment
towards employees‟ motivation
Ha1: There is partial significance influence between work environments
towards employees‟ motivation.
2. Ho2: There is no partial significance influence between salary towards
employees‟ motivation
Ha2: there is partial significance influence between salary towards employees‟
motivation
3. Ho3: There is no partial significance of influence between leadership towards
employees‟ motivation
Ha3: there is partial significance influence between leadership towards
employees‟ motivation.
4. Ho4: there is no simultaneous significance influence between work
environment, salary, and leadership towards employees‟ motivation.
Ha4: there is simultaneous significance between work environment, salary, and
leadership towards employees‟ motivation.
27
CHAPTER III
METHODOLOGY
3.0 Research Design
In doing scientific research, there are two methods that is provided which
are qualitative and quantitative research. The differences between qualitative and
quantitative research are the type of data, research process, instrument in
collecting the data and the purpose of research. Qualitative method usually
gathered by observations, interviews, or focus groups and the data also is gathered
from written documents and through case studies. It less emphasis on counting
numbers of people who think or behave in certain ways and more focus on
explaining why people think and behave in certain ways. While, quantitative
method involves smaller numbers of respondents, uses open-ended questionnaires
or protocols, best used to answer how and why questions
(civicpartnership.org,2013).
Quantitative observations are made using scientific tools and
measurements. The results can be measured or counted, and any other person
trying to quantitatively assess the same situations should end up with the same
results. In quantitative method pieces of information that can be counted
mathematically which is usually gathered by surveys from large numbers of
respondents selected randomly. It is analyzed using statistical methods best used
to answer what, when, and who questions. The method that is used by researcher
is quantitative method.
In quantitative research, the goal is to determine the relationship between
one variable (a dependent variable) and another variable (a dependent variable or
outcome variable) in a population. Quantitative research designs are either
descriptive (subject usually measured once) or experimental (subjects measured
before and after a treatment). A descriptive study established only associations
between variables. An experiment establishes causality. Quantitative research
28
deals in numbers, logic and the objective, and unchanging static data and detailed,
convergent reasoning rather than divergent reasoning.
3.1 Sampling design
Sampling design is part of statistical methodology that related in taking a
portion of population. If a sampling is done correctly, statistical analysis can be
used to generalize a whole population. There are two major types of sampling
design which are probability and nonprobability sampling. In probability
sampling, the elements in the population have some known non-zero chance or
probability of being selected as sample subjects. While in non-probability
sampling, the elements do not have a known or predetermined chance of being
selected as subjects (Sekaran & Bougie, 2010).
3.2.1 Sample
This is the unknown population. Sample size or the number of samples taken
to be an important issue when the type of research to be done is research that uses
quantitative analysis. Roscoe (1975) and Sekaran (2010) provided guidance on the
determination of the number of samples should be among 30 to 500 elements.
According to Supranto (2001) in which he state that size of the sample can be
determined by calculating with below formula:
n = 5 x q
With:
n: number of sample
q: number of question
By that formula, minimum number of respondent in this research is 100
because there are 20 questions. Researcher spread 100 just in case there are
questionnaires lost or left unfinished as those will not be counted. The number of
100 is very applicable according to Roscoe (1975) and Sekaran (2010) in which
they stated that number of samples should be among 30 to 500 elements.
Population is the whole object or subject in a region and meets certain conditions
29
and related with the problems which the sample chosen for an exact purpose. A
person is chosen as sample because the researcher assumes that the person has
relevant information toward the research and fulfilled the criteria that are already
determined by the researcher. (Ferdinand, 2006)
Based on that explanation, the samples in this study were selected as many as
100 respondents and eligible to be processed there as much as 100 respondents.
3.2.2 Sampling Method
Due to distance matter, the researcher used questionnaire to employees of BRI
branch of Labuan. The sampling method used was convenience sampling from
non-probability sampling. Besides, the researcher spread the questionnaires to
employees of BRI branch of Labuan which are in the list of employees as much as
possible. However, for the characteristic of employees (as age, gender, etc.), the
researchers cannot control it.
3.2 Research instrument
Research instrument is the tool that used to answer the research questions that
stated in the previous chapter. The researcher intention is to gather the
information from as much various sources. Data can be obtained from primary or
secondary data. Primary data refers to information obtained first-hand by the
researcher on the variables of interest for specific purpose of the research.
Secondary data means information gathered from sources that already exist
(Sekaran & Bougie, 2010). In order to fulfill the validity of this research, the
researcher use both primary and secondary data as shown in the figure below:
30
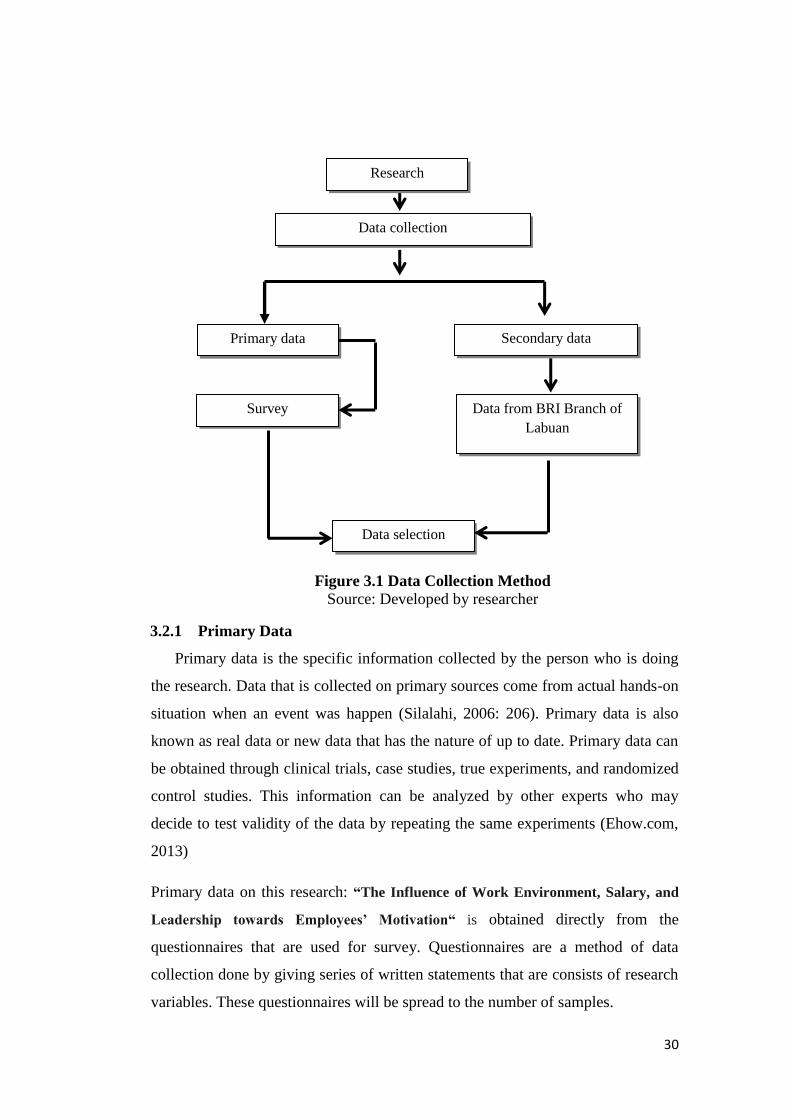
Figure 3.1 Data Collection Method
Source: Developed by researcher
3.2.1 Primary Data
Primary data is the specific information collected by the person who is doing
the research. Data that is collected on primary sources come from actual hands-on
situation when an event was happen (Silalahi, 2006: 206). Primary data is also
known as real data or new data that has the nature of up to date. Primary data can
be obtained through clinical trials, case studies, true experiments, and randomized
control studies. This information can be analyzed by other experts who may
decide to test validity of the data by repeating the same experiments (Ehow.com,
2013)
Primary data on this research: “The Influence of Work Environment, Salary, and
Leadership towards Employees’ Motivation“ is obtained directly from the
questionnaires that are used for survey. Questionnaires are a method of data
collection done by giving series of written statements that are consists of research
variables. These questionnaires will be spread to the number of samples.
Primary data Secondary data
Data from BRI Branch of
Labuan
Survey
Data collection
Data selection
Research
31
3.2.2 Secondary data
Secondary data is information gathered for purposes other than the completion
of a research project and it also uses to gain initial insight into the research
problem (steppingstones.ca, 2013). Secondary data is the data that has been
already collected by and readily available from other sources. Such data are
cheaper and more quickly obtainable than the primary data and also may be
available when primary data cannot be obtained at all
(managementstudyguide.com, 2013).
Secondary data on this research is the literature studies which mean a method
of data collection based on information gathered from books and journals related
to the research discussion. Data collected by learning and selecting from previous
literature studies, books, journal, articles, and related websites.
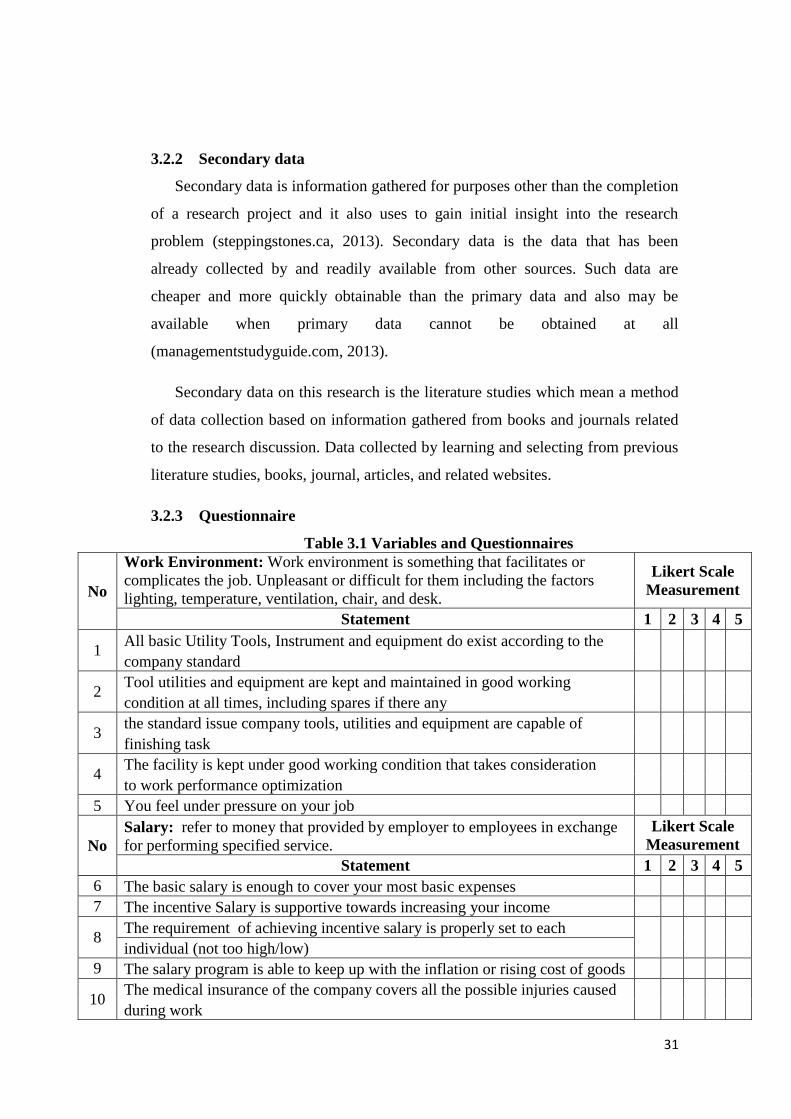
3.2.3 Questionnaire
Table 3.1 Variables and Questionnaires
No
Work Environment: Work environment is something that facilitates or
complicates the job. Unpleasant or difficult for them including the factors
lighting, temperature, ventilation, chair, and desk.
Likert Scale
Measurement
Statement 1 2 3 4 5
1 All basic Utility Tools, Instrument and equipment do exist according to the
company standard
2 Tool utilities and equipment are kept and maintained in good working
condition at all times, including spares if there any
3 the standard issue company tools, utilities and equipment are capable of
finishing task
4 The facility is kept under good working condition that takes consideration
to work performance optimization
5 You feel under pressure on your job
No
Salary: refer to money that provided by employer to employees in exchange
for performing specified service.
Likert Scale
Measurement
Statement 1 2 3 4 5
6 The basic salary is enough to cover your most basic expenses
7 The incentive Salary is supportive towards increasing your income
8 The requirement of achieving incentive salary is properly set to each
individual (not too high/low)
9 The salary program is able to keep up with the inflation or rising cost of goods
10 The medical insurance of the company covers all the possible injuries caused
during work
32
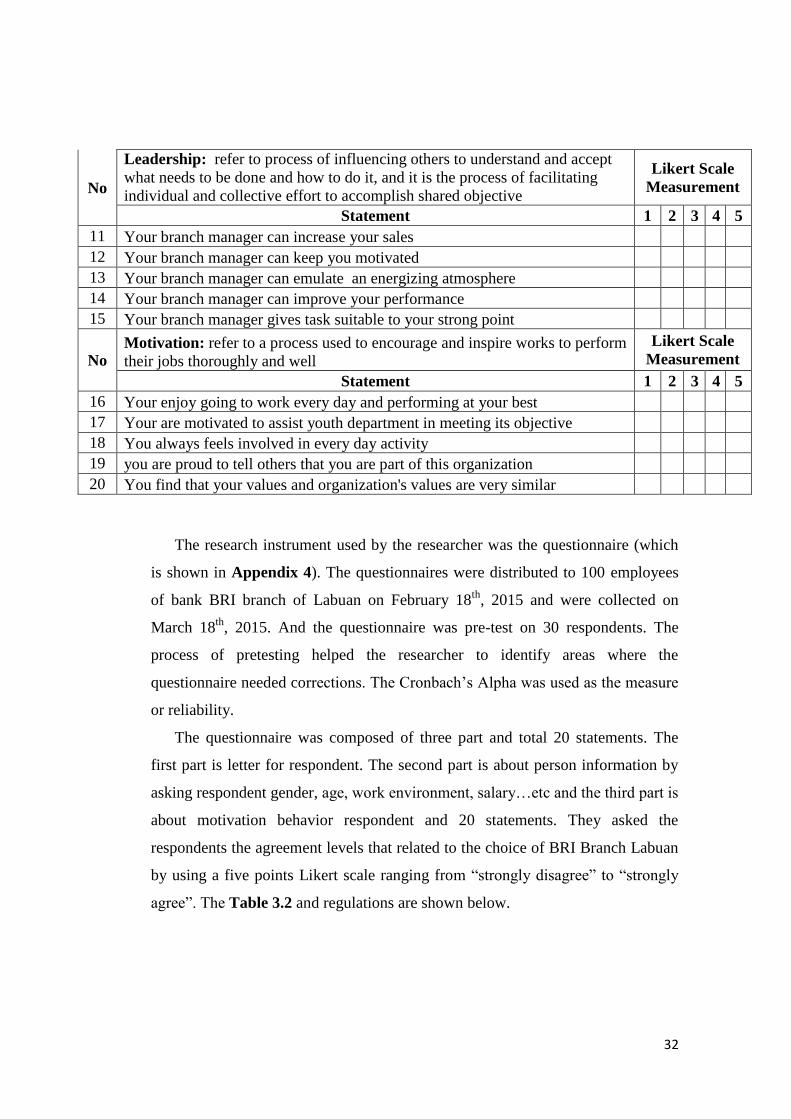
No
Leadership: refer to process of influencing others to understand and accept
what needs to be done and how to do it, and it is the process of facilitating
individual and collective effort to accomplish shared objective
Likert Scale
Measurement
Statement 1 2 3 4 5
11 Your branch manager can increase your sales
12 Your branch manager can keep you motivated
13 Your branch manager can emulate an energizing atmosphere
14 Your branch manager can improve your performance
15 Your branch manager gives task suitable to your strong point
No Motivation: refer to a process used to encourage and inspire works to perform
their jobs thoroughly and well
Likert Scale
Measurement
Statement 1 2 3 4 5
16 Your enjoy going to work every day and performing at your best
17 Your are motivated to assist youth department in meeting its objective
18 You always feels involved in every day activity
19 you are proud to tell others that you are part of this organization
20 You find that your values and organization's values are very similar
The research instrument used by the researcher was the questionnaire (which
is shown in Appendix 4). The questionnaires were distributed to 100 employees
of bank BRI branch of Labuan on February 18th
, 2015 and were collected on
March 18th
, 2015. And the questionnaire was pre-test on 30 respondents. The
process of pretesting helped the researcher to identify areas where the
questionnaire needed corrections. The Cronbach‟s Alpha was used as the measure
or reliability.
The questionnaire was composed of three part and total 20 statements. The
first part is letter for respondent. The second part is about person information by
asking respondent gender, age, work environment, salary…etc and the third part is
about motivation behavior respondent and 20 statements. They asked the
respondents the agreement levels that related to the choice of BRI Branch Labuan
by using a five points Likert scale ranging from “strongly disagree” to “strongly
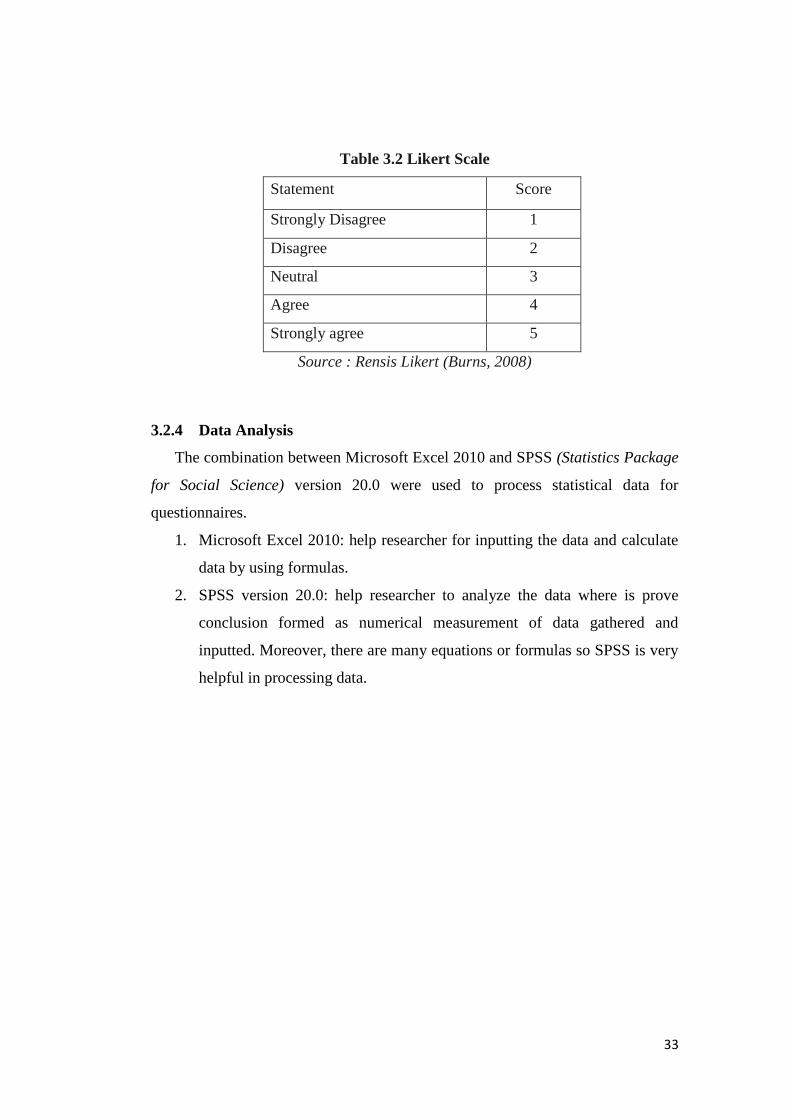
agree”. The Table 3.2 and regulations are shown below.
33
Table 3.2 Likert Scale
Statement Score
Strongly Disagree 1
Disagree 2
Neutral 3
Agree 4
Strongly agree 5
Source : Rensis Likert (Burns, 2008)
3.2.4 Data Analysis
The combination between Microsoft Excel 2010 and SPSS (Statistics Package
for Social Science) version 20.0 were used to process statistical data for
questionnaires.
1. Microsoft Excel 2010: help researcher for inputting the data and calculate
data by using formulas.
2. SPSS version 20.0: help researcher to analyze the data where is prove
conclusion formed as numerical measurement of data gathered and
inputted. Moreover, there are many equations or formulas so SPSS is very
helpful in processing data.
34
Yes
Yes
No
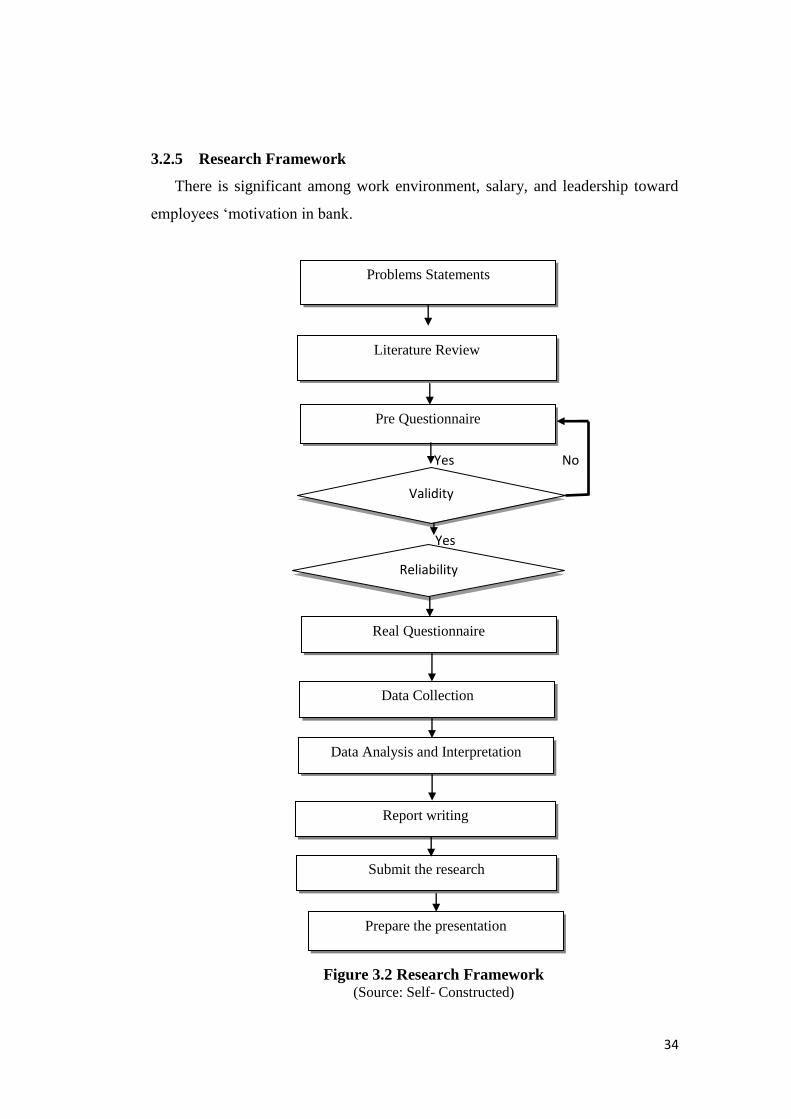
3.2.5 Research Framework
There is significant among work environment, salary, and leadership toward
employees „motivation in bank.
Problems Statements
Prepare the presentation
Validity
Reliability
Pre Questionnaire
Data Collection
Real Questionnaire
Data Analysis and Interpretation
Report writing
Submit the research
Literature Review
Figure 3.2 Research Framework (Source: Self- Constructed)
35
3.3 Validity and Reliability
A major aspect of research design is the obtaining of reliable and void
information (Wallen&Fraenkel, 2011). Since both reliability and validity depend
on the way that instruments are used (Wallen&Fraenkel, 2011), researcher has to
find the validity and reliability of the data in the pilot test before calculating and
analyzing the data.
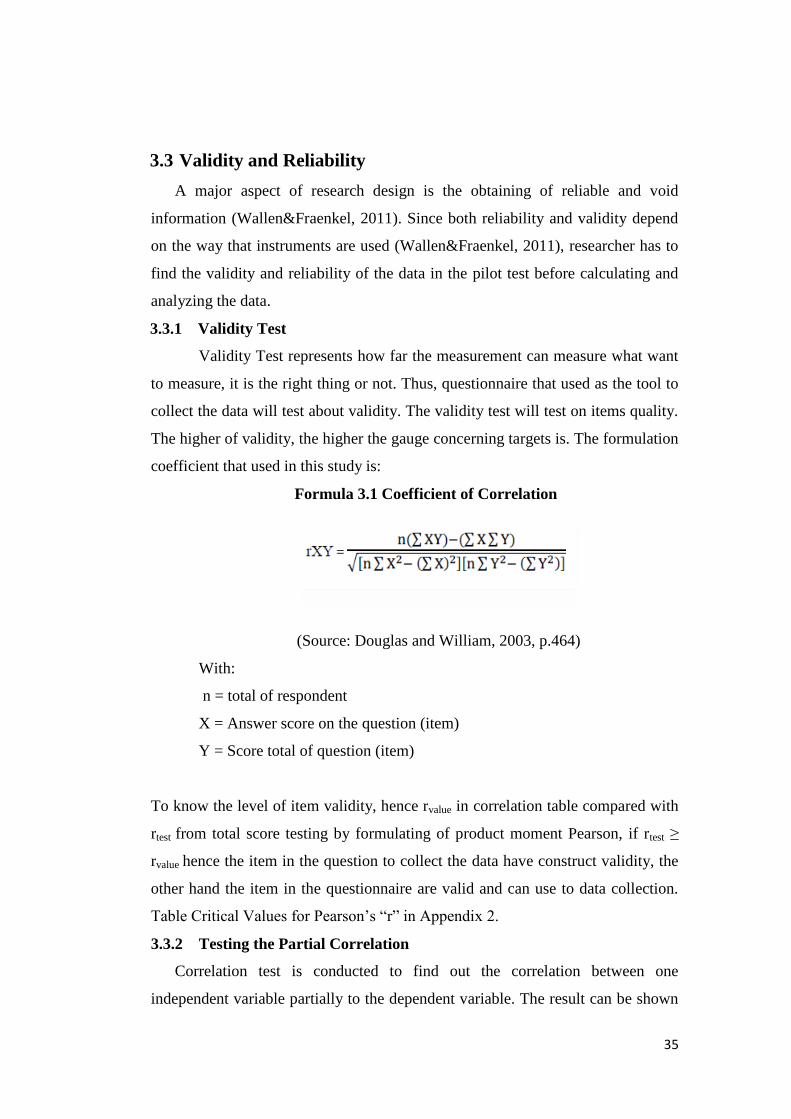
3.3.1 Validity Test
Validity Test represents how far the measurement can measure what want
to measure, it is the right thing or not. Thus, questionnaire that used as the tool to
collect the data will test about validity. The validity test will test on items quality.
The higher of validity, the higher the gauge concerning targets is. The formulation
coefficient that used in this study is:
Formula 3.1 Coefficient of Correlation
(Source: Douglas and William, 2003, p.464)
With:
n = total of respondent
X = Answer score on the question (item)
Y = Score total of question (item)
To know the level of item validity, hence rvalue in correlation table compared with
rtest from total score testing by formulating of product moment Pearson, if rtest ≥
rvalue hence the item in the question to collect the data have construct validity, the
other hand the item in the questionnaire are valid and can use to data collection.
Table Critical Values for Pearson‟s “r” in Appendix 2.
3.3.2 Testing the Partial Correlation
Correlation test is conducted to find out the correlation between one
independent variable partially to the dependent variable. The result can be shown
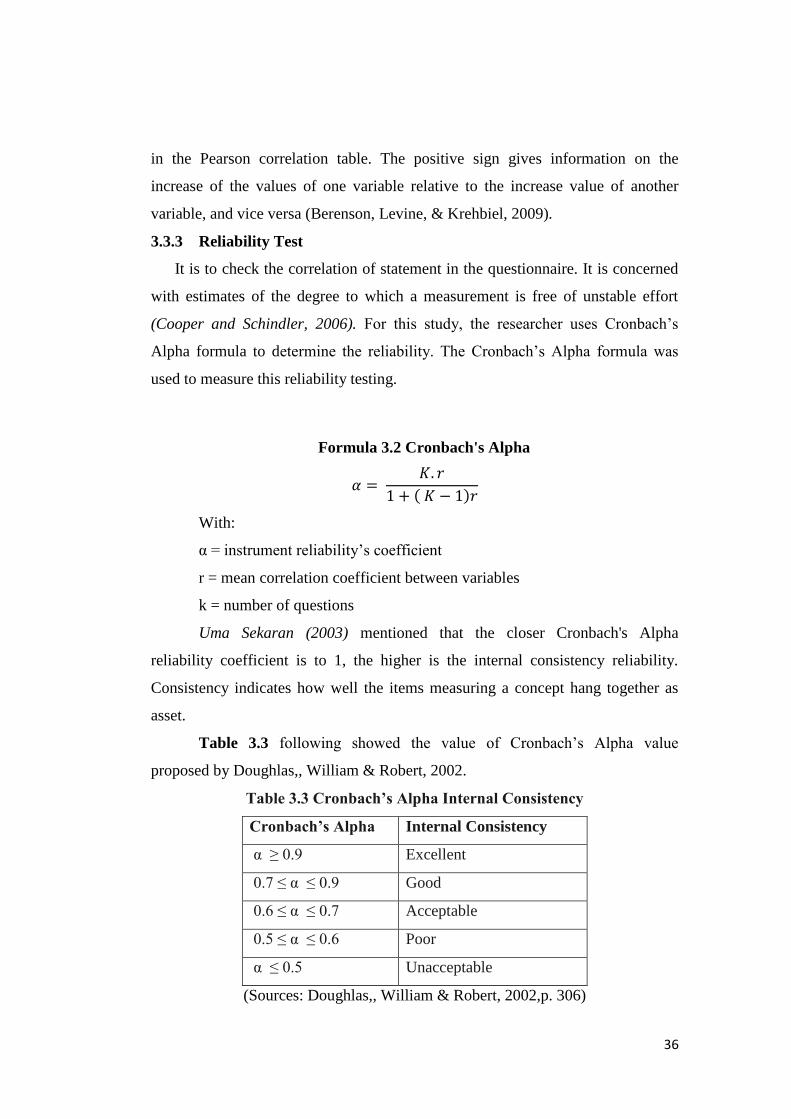
36
in the Pearson correlation table. The positive sign gives information on the
increase of the values of one variable relative to the increase value of another
variable, and vice versa (Berenson, Levine, & Krehbiel, 2009).
3.3.3 Reliability Test
It is to check the correlation of statement in the questionnaire. It is concerned
with estimates of the degree to which a measurement is free of unstable effort
(Cooper and Schindler, 2006). For this study, the researcher uses Cronbach‟s
Alpha formula to determine the reliability. The Cronbach‟s Alpha formula was
used to measure this reliability testing.
Formula 3.2 Cronbach's Alpha
( )
With:
α = instrument reliability‟s coefficient
r = mean correlation coefficient between variables
k = number of questions
Uma Sekaran (2003) mentioned that the closer Cronbach's Alpha
reliability coefficient is to 1, the higher is the internal consistency reliability.
Consistency indicates how well the items measuring a concept hang together as
asset.
Table 3.3 following showed the value of Cronbach‟s Alpha value
proposed by Doughlas,, William & Robert, 2002.
Table 3.3 Cronbach’s Alpha Internal Consistency
Cronbach’s Alpha Internal Consistency
α ≥ 0.9 Excellent
0.7 ≤ α ≤ 0.9 Good
0.6 ≤ α ≤ 0.7 Acceptable
0.5 ≤ α ≤ 0.6 Poor
α ≤ 0.5 Unacceptable
(Sources: Doughlas,, William & Robert, 2002,p. 306)
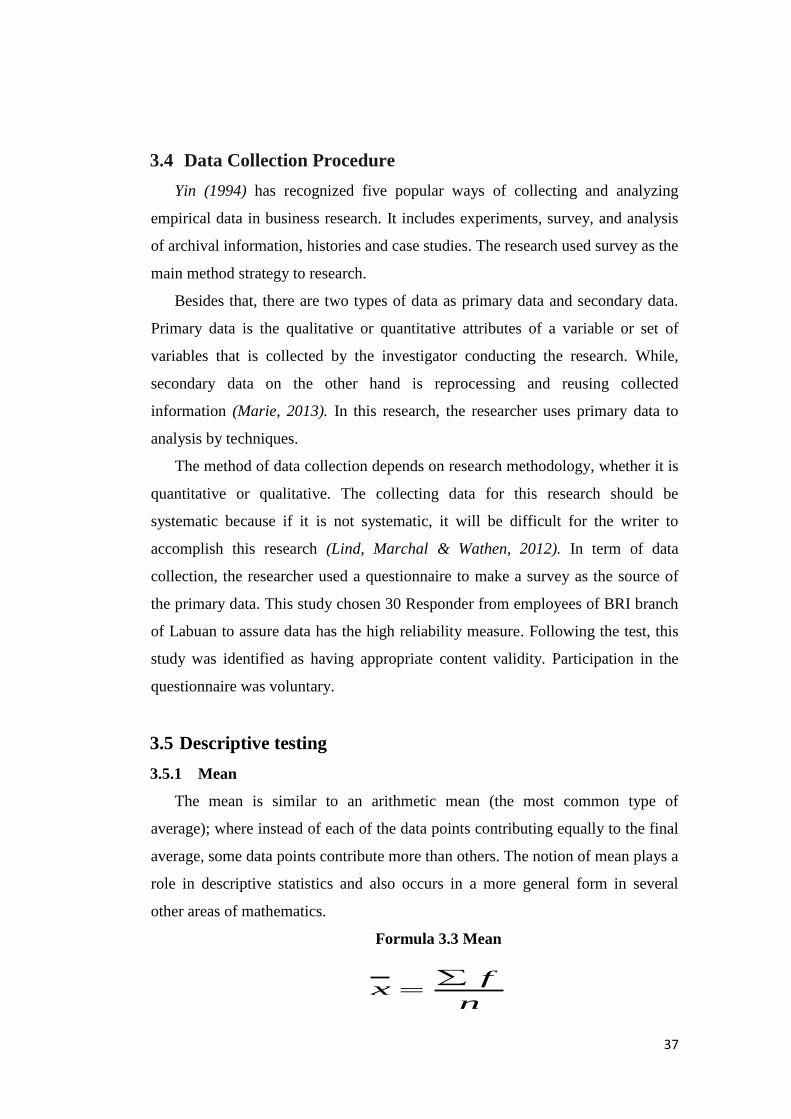
37
3.4 Data Collection Procedure
Yin (1994) has recognized five popular ways of collecting and analyzing
empirical data in business research. It includes experiments, survey, and analysis
of archival information, histories and case studies. The research used survey as the
main method strategy to research.
Besides that, there are two types of data as primary data and secondary data.
Primary data is the qualitative or quantitative attributes of a variable or set of
variables that is collected by the investigator conducting the research. While,
secondary data on the other hand is reprocessing and reusing collected
information (Marie, 2013). In this research, the researcher uses primary data to
analysis by techniques.
The method of data collection depends on research methodology, whether it is
quantitative or qualitative. The collecting data for this research should be
systematic because if it is not systematic, it will be difficult for the writer to
accomplish this research (Lind, Marchal & Wathen, 2012). In term of data
collection, the researcher used a questionnaire to make a survey as the source of
the primary data. This study chosen 30 Responder from employees of BRI branch
of Labuan to assure data has the high reliability measure. Following the test, this
study was identified as having appropriate content validity. Participation in the
questionnaire was voluntary.
3.5 Descriptive testing
3.5.1 Mean
The mean is similar to an arithmetic mean (the most common type of
average); where instead of each of the data points contributing equally to the final
average, some data points contribute more than others. The notion of mean plays a
role in descriptive statistics and also occurs in a more general form in several
other areas of mathematics.
Formula 3.3 Mean
n
fx
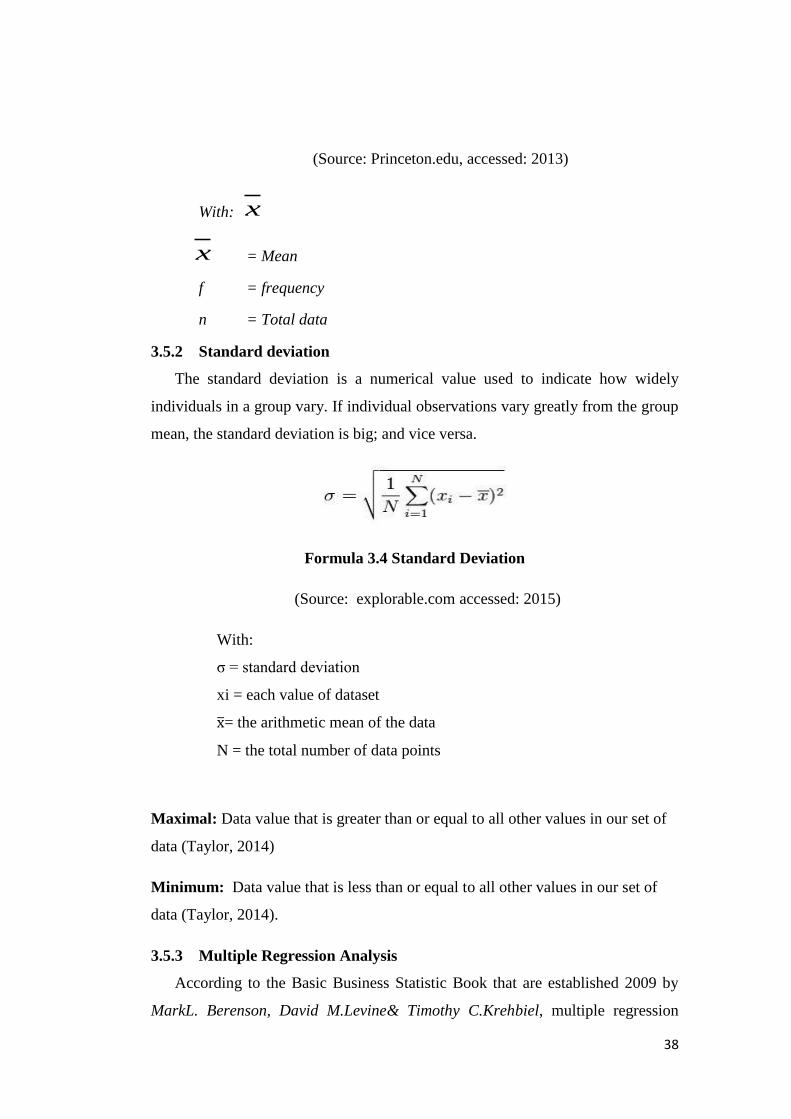
38
(Source: Princeton.edu, accessed: 2013)
With:
x
x = Mean
f = frequency
n = Total data
3.5.2 Standard deviation
The standard deviation is a numerical value used to indicate how widely
individuals in a group vary. If individual observations vary greatly from the group
mean, the standard deviation is big; and vice versa.
Formula 3.4 Standard Deviation
(Source: explorable.com accessed: 2015)
With:
σ = standard deviation
xi = each value of dataset
= the arithmetic mean of the data
N = the total number of data points
Maximal: Data value that is greater than or equal to all other values in our set of
data (Taylor, 2014)
Minimum: Data value that is less than or equal to all other values in our set of
data (Taylor, 2014).
3.5.3 Multiple Regression Analysis
According to the Basic Business Statistic Book that are established 2009 by
MarkL. Berenson, David M.Levine& Timothy C.Krehbiel, multiple regression
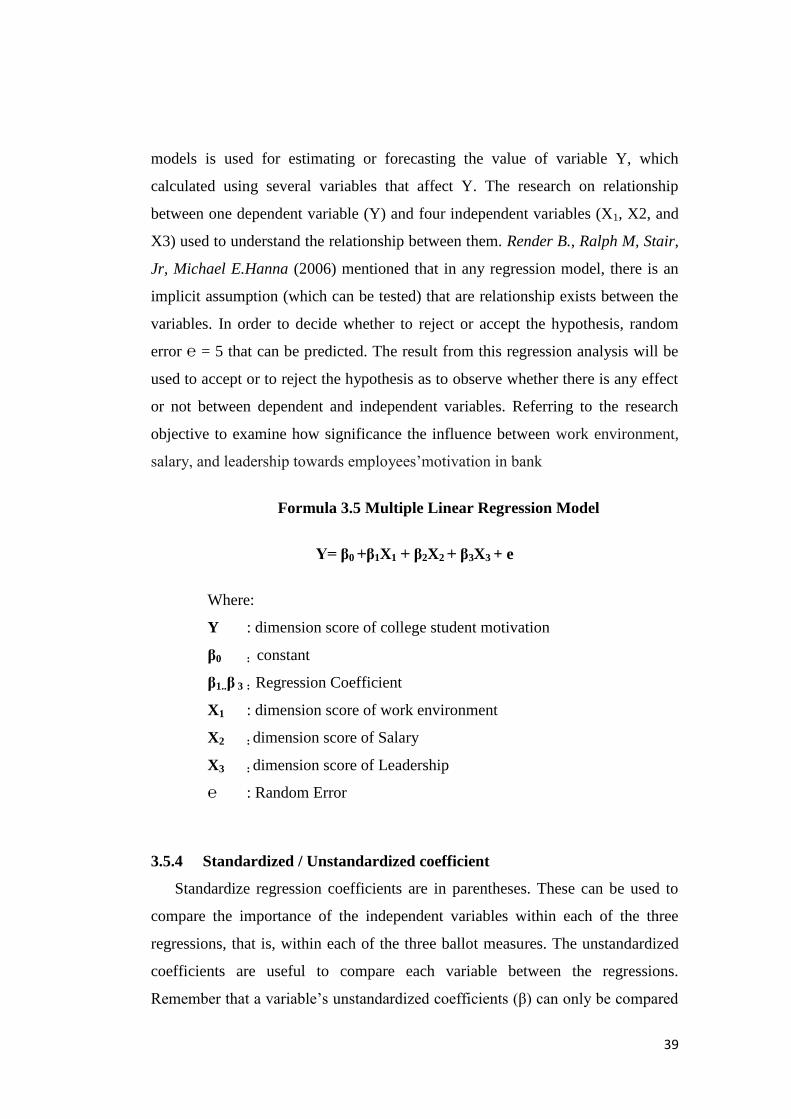
39
models is used for estimating or forecasting the value of variable Y, which
calculated using several variables that affect Y. The research on relationship
between one dependent variable (Y) and four independent variables (X1, X2, and
X3) used to understand the relationship between them. Render B., Ralph M, Stair,
Jr, Michael E.Hanna (2006) mentioned that in any regression model, there is an
implicit assumption (which can be tested) that are relationship exists between the
variables. In order to decide whether to reject or accept the hypothesis, random
error ℮ = 5 that can be predicted. The result from this regression analysis will be
used to accept or to reject the hypothesis as to observe whether there is any effect
or not between dependent and independent variables. Referring to the research
objective to examine how significance the influence between work environment,
salary, and leadership towards employees‟motivation in bank
Formula 3.5 Multiple Linear Regression Model
Y= β0 +β1X1 + β2X2 + β3X3 + e
Where:
Y : dimension score of college student motivation
β0 : constant
β1..β 3 : Regression Coefficient
X1 : dimension score of work environment
X2 : dimension score of Salary
X3 : dimension score of Leadership
℮ : Random Error
3.5.4 Standardized / Unstandardized coefficient
Standardize regression coefficients are in parentheses. These can be used to
compare the importance of the independent variables within each of the three
regressions, that is, within each of the three ballot measures. The unstandardized
coefficients are useful to compare each variable between the regressions.
Remember that a variable‟s unstandardized coefficients (β) can only be compared

40
with other variables measured in the same units (like population density for each
of the ballots). Standardized coefficients (Beta) are best for comparing two or
more variables that have different measurement unit. In this research the
researcher use unstandardized coefficient.
3.5.5 Classical Assumption Test
The estimation method used in this research is the Ordinary Least Square
(OLS) method. Least Square method determines a regression equation by
minimizing the sum of the squares of the vertical distance between the actual Y
values and the predicted values of Y (Lind, Marchal, &Wathen, 2012). This
method is chosen because it is the most powerful and popular methods of
regression analysis. Moreover, it is also simpler mathematically. The use of this
mathematic has to meet several assumptions to make sure that the data collected
are valid and reliable distribution (Berenson, Levine, &Krehbiel, 2009).
3.5.5.1 Pre - Test
The classical assumption test is needed in order to show the validity and free
from bias relationship. Regression model consist of normality test,
heteroscedasticity test and multicollinearity test will apply in testing the reliability
and validity or the assumption.
3.5.5.2 Normality Test
Normality test is used to examine whether the data is distributed normally.
Normality test can be measured from several ways such as Plot spread data and
also statistical test such as: Chi- square, Kolmogorov- Smirnov, Lifefors and
Shapiro Wilk. During this research, the researcher uses the Normal Plot spread
data to check the data and is explained with Standardized Residual Plots of
Histogram and Normal Probability Plot. This test needed to make sure that the
data used distributed normally, means also it is free from classic test.
An assessment of the normality of data is a prerequisite for many statistical
tests as normal data is an underlying assumption in parametric testing. There are
two main methods of assessing normality: graphically and numerically. The
normality test also can be done by using SPSS statistical software for evaluating
data are normally distributed or not. The result can be viewed in the graph of
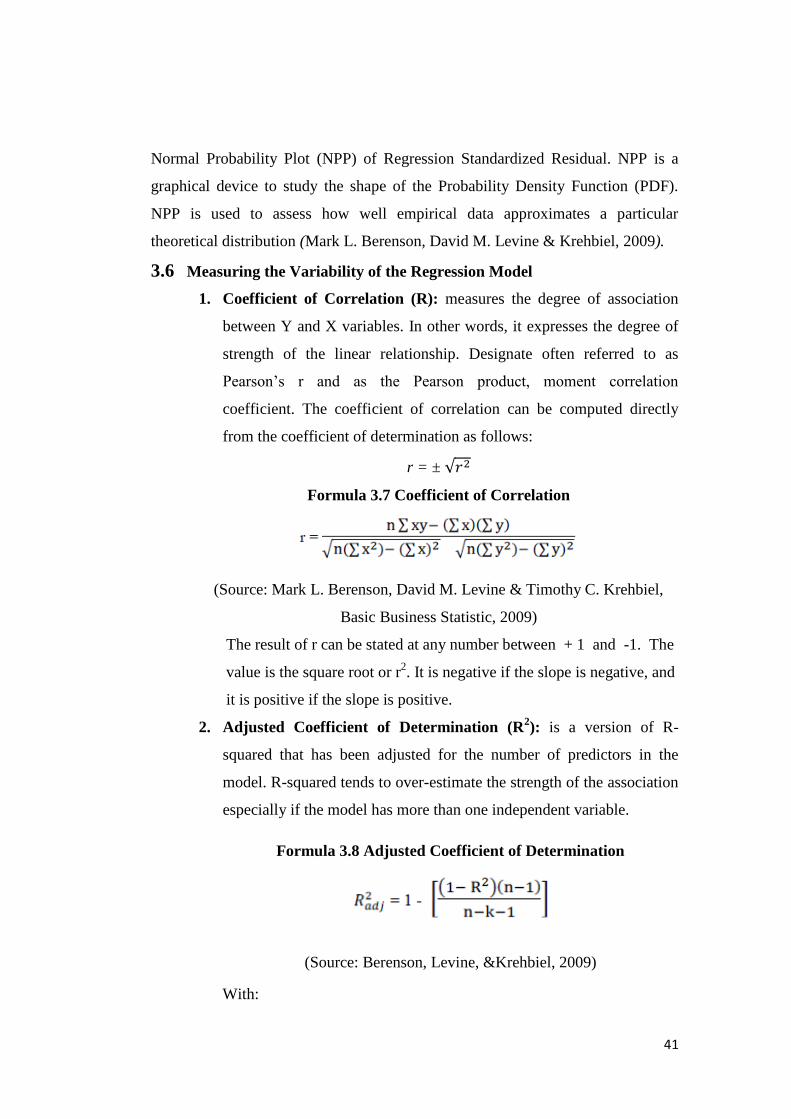
41
Normal Probability Plot (NPP) of Regression Standardized Residual. NPP is a
graphical device to study the shape of the Probability Density Function (PDF).
NPP is used to assess how well empirical data approximates a particular
theoretical distribution (Mark L. Berenson, David M. Levine & Krehbiel, 2009).
3.6 Measuring the Variability of the Regression Model
1. Coefficient of Correlation (R): measures the degree of association
between Y and X variables. In other words, it expresses the degree of
strength of the linear relationship. Designate often referred to as
Pearson‟s r and as the Pearson product, moment correlation
coefficient. The coefficient of correlation can be computed directly
from the coefficient of determination as follows:
r = ± √
Formula 3.7 Coefficient of Correlation
(Source: Mark L. Berenson, David M. Levine & Timothy C. Krehbiel,
Basic Business Statistic, 2009)
The result of r can be stated at any number between + 1 and -1. The
value is the square root or r2. It is negative if the slope is negative, and
it is positive if the slope is positive.
2. Adjusted Coefficient of Determination (R2): is a version of R-
squared that has been adjusted for the number of predictors in the
model. R-squared tends to over-estimate the strength of the association
especially if the model has more than one independent variable.
Formula 3.8 Adjusted Coefficient of Determination
(Source: Berenson, Levine, &Krehbiel, 2009)
With:
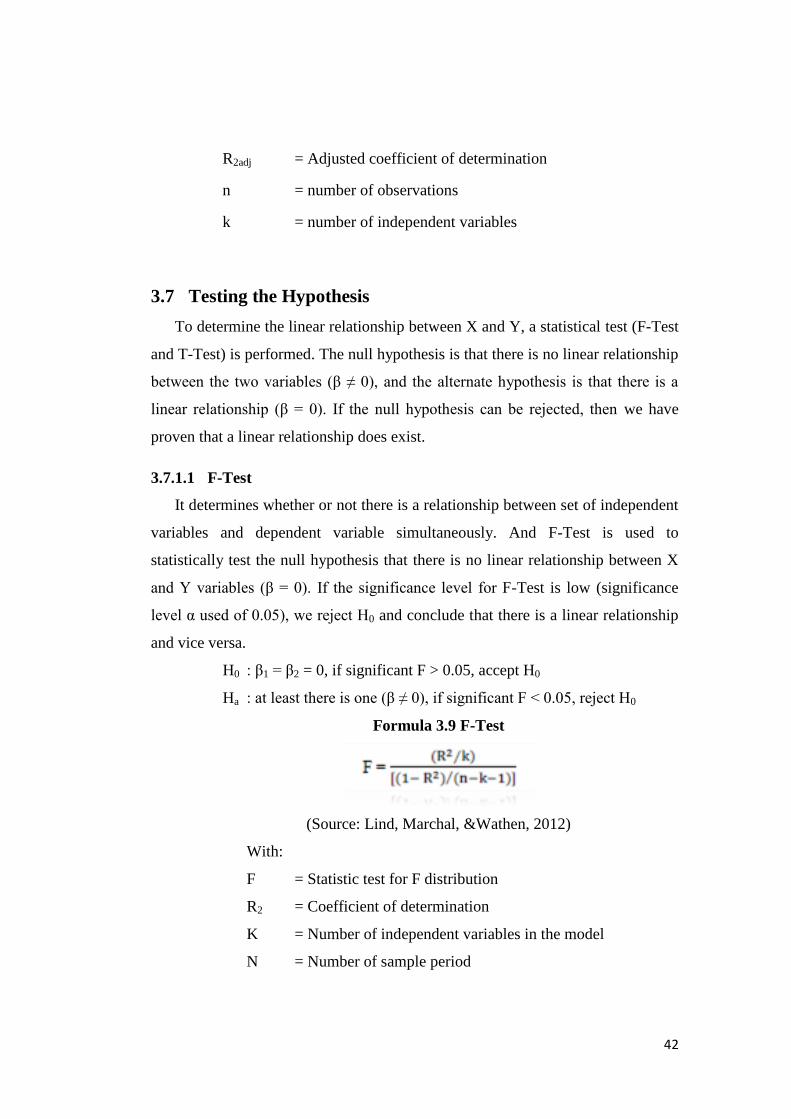
42
R2adj = Adjusted coefficient of determination
n = number of observations
k = number of independent variables
3.7 Testing the Hypothesis
To determine the linear relationship between X and Y, a statistical test (F-Test
and T-Test) is performed. The null hypothesis is that there is no linear relationship
between the two variables (β ≠ 0), and the alternate hypothesis is that there is a
linear relationship (β = 0). If the null hypothesis can be rejected, then we have
proven that a linear relationship does exist.
3.7.1.1 F-Test
It determines whether or not there is a relationship between set of independent
variables and dependent variable simultaneously. And F-Test is used to
statistically test the null hypothesis that there is no linear relationship between X
and Y variables (β = 0). If the significance level for F-Test is low (significance
level α used of 0.05), we reject H0 and conclude that there is a linear relationship
and vice versa.
H0 : β1 = β2 = 0, if significant F > 0.05, accept H0
Ha : at least there is one (β ≠ 0), if significant F < 0.05, reject H0
Formula 3.9 F-Test
(Source: Lind, Marchal, &Wathen, 2012)
With:
F = Statistic test for F distribution
R2 = Coefficient of determination
K = Number of independent variables in the model
N = Number of sample period
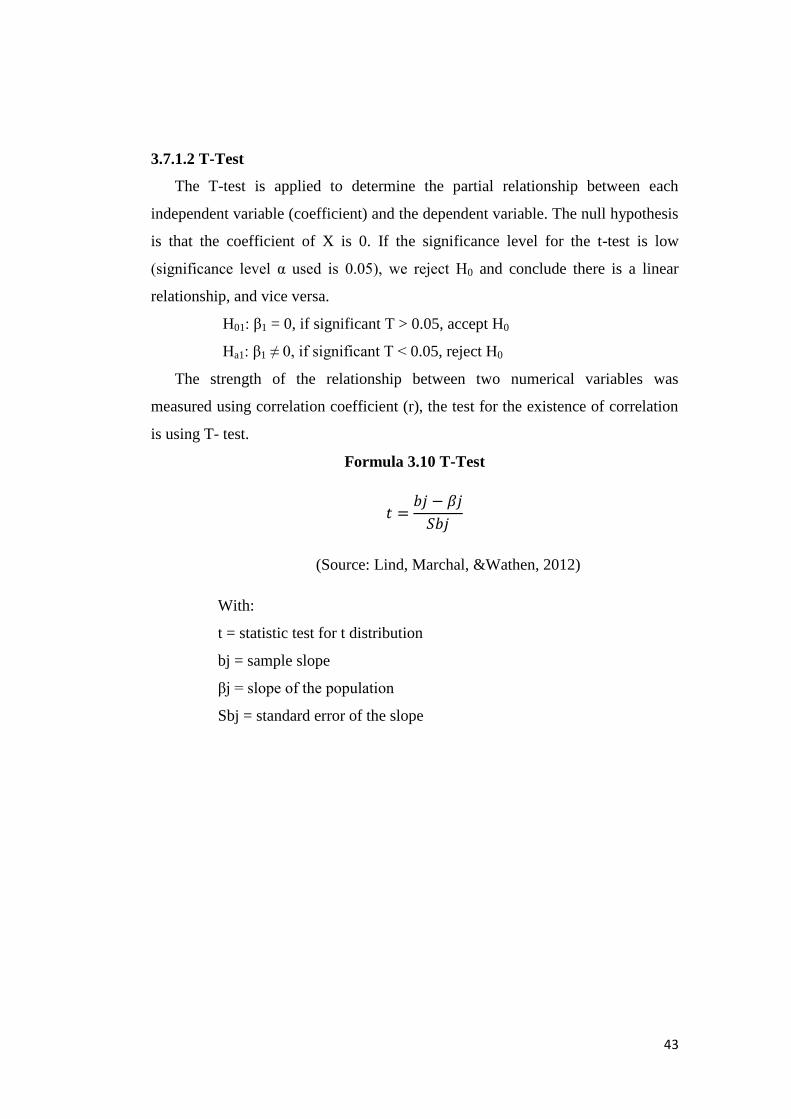
43
3.7.1.2 T-Test
The T-test is applied to determine the partial relationship between each
independent variable (coefficient) and the dependent variable. The null hypothesis
is that the coefficient of X is 0. If the significance level for the t-test is low
(significance level α used is 0.05), we reject H0 and conclude there is a linear
relationship, and vice versa.
H01: β1 = 0, if significant T > 0.05, accept H0
Ha1: β1 ≠ 0, if significant T < 0.05, reject H0
The strength of the relationship between two numerical variables was
measured using correlation coefficient (r), the test for the existence of correlation
is using T- test.
Formula 3.10 T-Test
(Source: Lind, Marchal, &Wathen, 2012)
With:
t = statistic test for t distribution
bj = sample slope
βj = slope of the population
Sbj = standard error of the slope

44
CHAPTER IV
ANALYSIS AND INTERPRETATION
4.1 Company Profile
Bank Rakyat Indonesia (BRI) is one of the biggest government bank in
Indonesia. Initially Bank Rakyat Indonesia (BRI) founded in Purwokerto, Central
Java by Raden Bei of Aria Wirjaatmadja by the name of De Poerwokertosche
Hulp en Spaarbank der Inlandsche Hoofden or " Bank of Aid and Deposit Own
The Clan of Formalist Purwokerto", an financial institution serving people of have
nationality to Indonesia ( indigenous). The institute stand up the date of 16
December 1895, which then made by as birthday BRI..
Since 1 August 1992 pursuant to Code of Banking No. 7 year 1992 and
Governmental Regulation of RI No. 21 year 1992 status BRI turned into the
limited liability. In that moment ownership of BRI still 100% on-hand Republic
Government of Indonesia. In the year 2003, Indonesia Government set mind on to
sell 30% this bank share, so that become the public company by opening name is
PT. Bank Rakyat Indonesia ( Persero) Tbk., and still be used until this time.
The main office of BRI branch of Labuan domicile in region of Regency
Pandeglang, precisely sub district Labuan. Regency Pandeglang consisted of 36
sub district and reside in Tip Of West of Province Banten with the regional
boundary the following administration:
North side : Regency Attack
Side South Arch : Indonesia Ocean
Westside : Sunda Strait
Eastside : Regency Lebak
BRI branch of Labuan direct 6 BRI units which are gone be the round of in
6 sub district, among other things are:
1. Sub district Menes
2. Sub district Caringin
3. Sub district Panimbang
4. Sub district Cibaliung
45
5. Sub district Sobang
6. Sub district Cikeusik
In running its operational activity is BRI Unit of below wings of BRI branch
of Labuan and headed by a head of BRI unit and always major the very good
service for all client, good that client having the character of micro and macro
economy.
4.1.1 Vision and Mission, and object of BRI
Vision
Become the notable commercial bank is which always major the client
satisfaction.
Mission
Creating the best banking activity by majoring service to micro effort
minimize and middle to support the make-up of society economics.
Giving a prima service to client of through widespread job network and
supported by professional human resource and reliable information
technology by executing risk management and also practice the Good
Corporate Governance (Very good GCG).
Giving optimal benefit and advantage to interested parties (stakeholders).
4.1.2 Organization Chart
Organization Chart Office of BRI Branch Labuan
Period January 2015
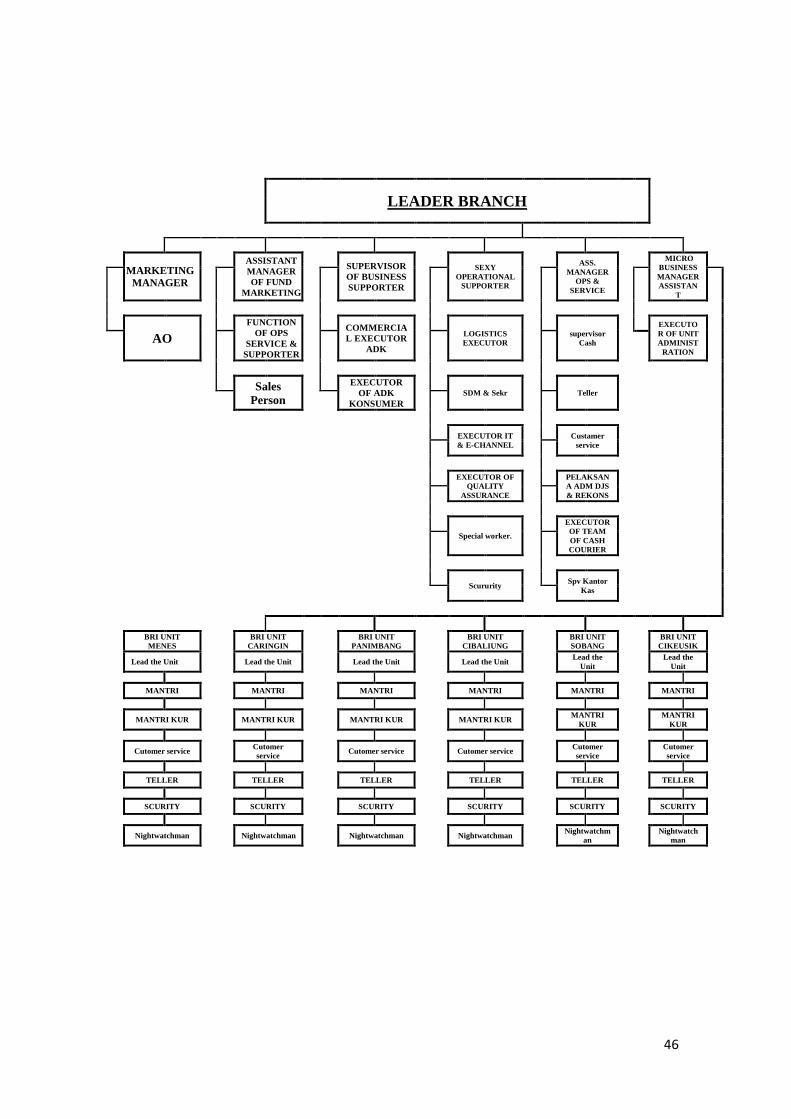
46
LEADER BRANCH
MARKETING
MANAGER
ASSISTANT
MANAGER
OF FUND
MARKETING
SUPERVISOR
OF BUSINESS
SUPPORTER
SEXY
OPERATIONAL
SUPPORTER
ASS.
MANAGER
OPS &
SERVICE
MICRO
BUSINESS
MANAGER
ASSISTAN
T
AO FUNCTION
OF OPS
SERVICE &
SUPPORTER
COMMERCIA
L EXECUTOR
ADK
LOGISTICS
EXECUTOR
supervisor
Cash
EXECUTO
R OF UNIT
ADMINIST
RATION
Sales
Person
EXECUTOR
OF ADK
KONSUMER
SDM & Sekr
Teller
EXECUTOR IT
& E-CHANNEL
Custamer
service
EXECUTOR OF
QUALITY
ASSURANCE
PELAKSAN
A ADM DJS
& REKONS
Special worker.
EXECUTOR
OF TEAM
OF CASH
COURIER
Scururity
Spv Kantor
Kas
BRI UNIT
MENES
BRI UNIT
CARINGIN
BRI UNIT
PANIMBANG
BRI UNIT
CIBALIUNG
BRI UNIT
SOBANG
BRI UNIT
CIKEUSIK
Lead the Unit
Lead the Unit
Lead the Unit
Lead the Unit
Lead the
Unit
Lead the
Unit
MANTRI
MANTRI
MANTRI
MANTRI
MANTRI
MANTRI
MANTRI KUR
MANTRI KUR
MANTRI KUR
MANTRI KUR
MANTRI
KUR
MANTRI
KUR
Cutomer service
Cutomer
service
Cutomer service
Cutomer service
Cutomer
service
Cutomer
service
TELLER
TELLER
TELLER
TELLER
TELLER
TELLER
SCURITY
SCURITY
SCURITY
SCURITY
SCURITY
SCURITY
Nightwatchman
Nightwatchman
Nightwatchman
Nightwatchman
Nightwatchm
an
Nightwatch
man
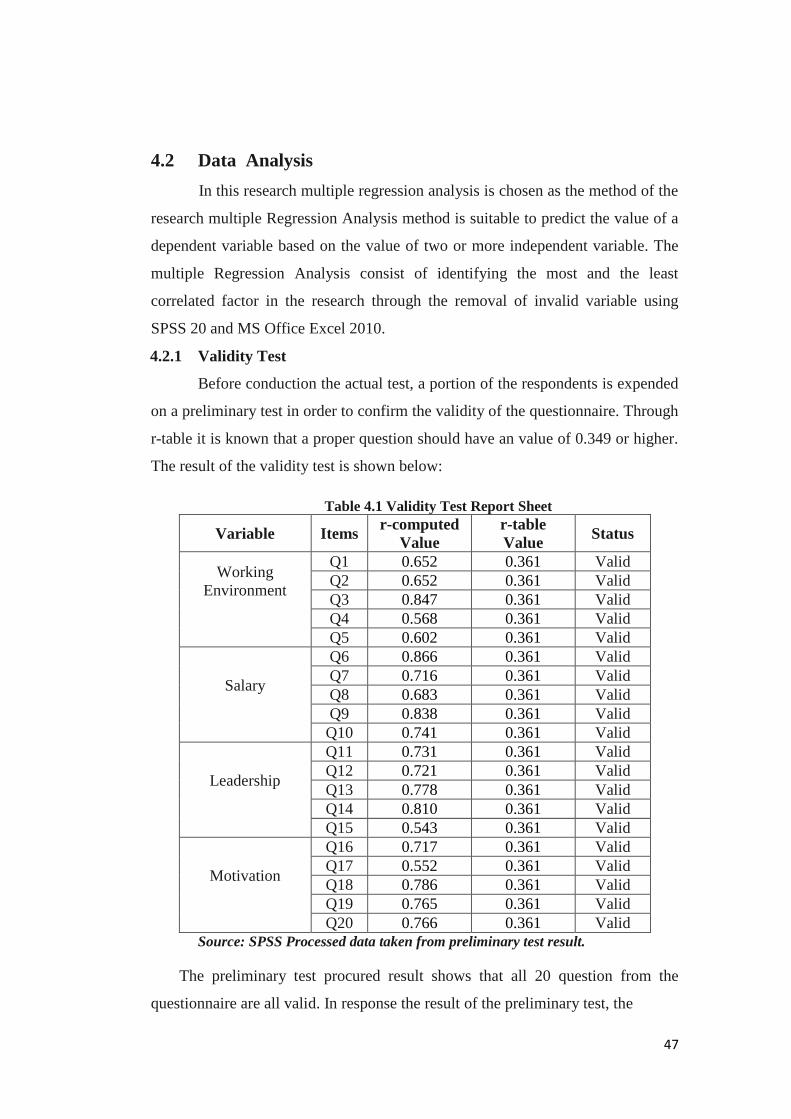
47
4.2 Data Analysis
In this research multiple regression analysis is chosen as the method of the
research multiple Regression Analysis method is suitable to predict the value of a
dependent variable based on the value of two or more independent variable. The
multiple Regression Analysis consist of identifying the most and the least
correlated factor in the research through the removal of invalid variable using
SPSS 20 and MS Office Excel 2010.
4.2.1 Validity Test
Before conduction the actual test, a portion of the respondents is expended
on a preliminary test in order to confirm the validity of the questionnaire. Through
r-table it is known that a proper question should have an value of 0.349 or higher.
The result of the validity test is shown below:
Table 4.1 Validity Test Report Sheet
Variable Items r-computed
Value
r-table
Value Status
Working
Environment
Q1 0.652 0.361 Valid
Q2 0.652 0.361 Valid
Q3 0.847 0.361 Valid
Q4 0.568 0.361 Valid
Q5 0.602 0.361 Valid
Salary
Q6 0.866 0.361 Valid
Q7 0.716 0.361 Valid
Q8 0.683 0.361 Valid
Q9 0.838 0.361 Valid
Q10 0.741 0.361 Valid
Leadership
Q11 0.731 0.361 Valid
Q12 0.721 0.361 Valid
Q13 0.778 0.361 Valid
Q14 0.810 0.361 Valid
Q15 0.543 0.361 Valid
Motivation
Q16 0.717 0.361 Valid
Q17 0.552 0.361 Valid
Q18 0.786 0.361 Valid
Q19 0.765 0.361 Valid
Q20 0.766 0.361 Valid
Source: SPSS Processed data taken from preliminary test result.
The preliminary test procured result shows that all 20 question from the
questionnaire are all valid. In response the result of the preliminary test, the
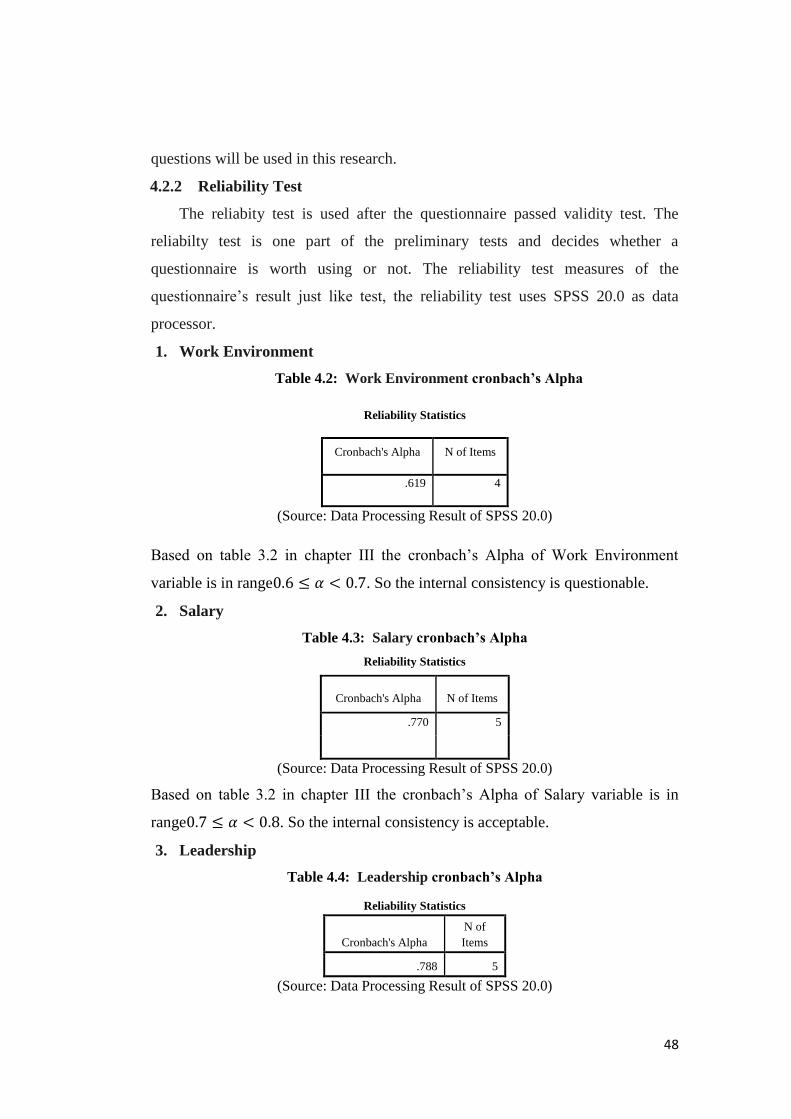
48
questions will be used in this research.
4.2.2 Reliability Test
The reliabity test is used after the questionnaire passed validity test. The
reliabilty test is one part of the preliminary tests and decides whether a
questionnaire is worth using or not. The reliability test measures of the
questionnaire‟s result just like test, the reliability test uses SPSS 20.0 as data
processor.
1. Work Environment
Table 4.2: Work Environment cronbach’s Alpha
Reliability Statistics
Cronbach's Alpha N of Items
.619 4
(Source: Data Processing Result of SPSS 20.0)
Based on table 3.2 in chapter III the cronbach‟s Alpha of Work Environment
variable is in range . So the internal consistency is questionable.
2. Salary
Table 4.3: Salary cronbach’s Alpha
Reliability Statistics
Cronbach's Alpha N of Items
.770 5
(Source: Data Processing Result of SPSS 20.0)
Based on table 3.2 in chapter III the cronbach‟s Alpha of Salary variable is in
range . So the internal consistency is acceptable.
3. Leadership
Table 4.4: Leadership cronbach’s Alpha
Reliability Statistics
Cronbach's Alpha
N of
Items
.788 5
(Source: Data Processing Result of SPSS 20.0)
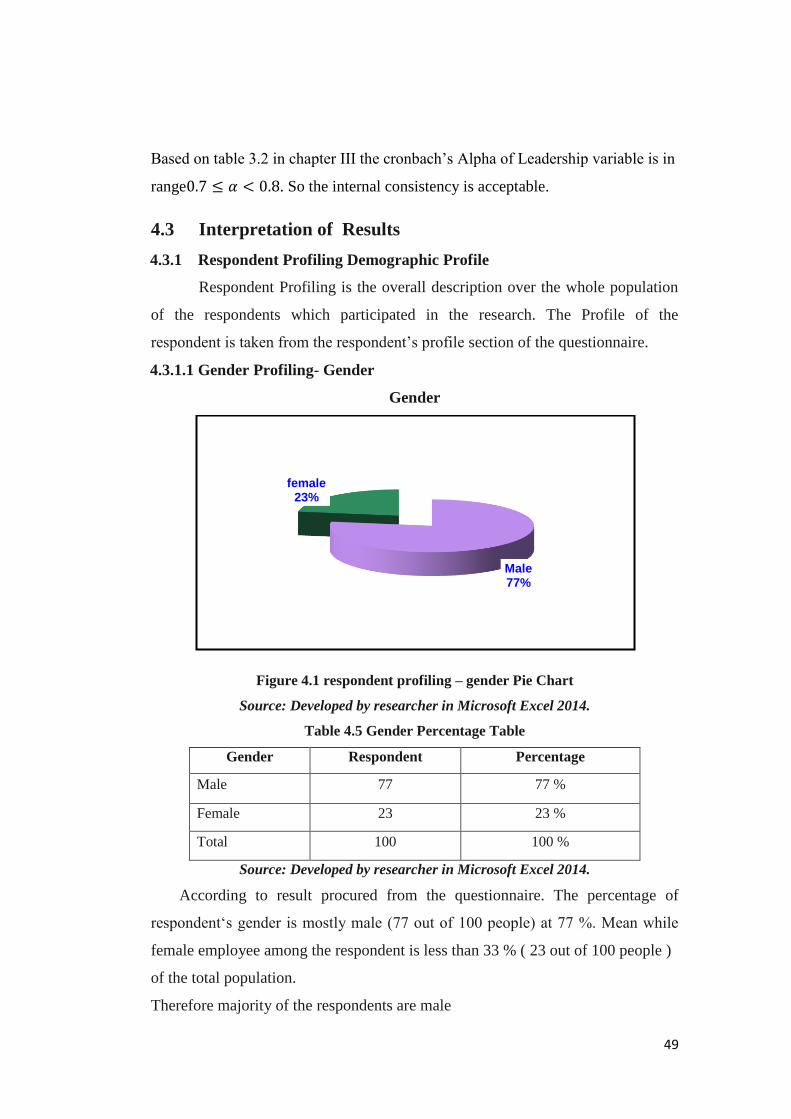
49
Based on table 3.2 in chapter III the cronbach‟s Alpha of Leadership variable is in
range . So the internal consistency is acceptable.
4.3 Interpretation of Results
4.3.1 Respondent Profiling Demographic Profile
Respondent Profiling is the overall description over the whole population
of the respondents which participated in the research. The Profile of the
respondent is taken from the respondent‟s profile section of the questionnaire.
4.3.1.1 Gender Profiling- Gender
Gender
Figure 4.1 respondent profiling – gender Pie Chart
Source: Developed by researcher in Microsoft Excel 2014.
Table 4.5 Gender Percentage Table
Gender Respondent Percentage
Male 77 77 %
Female 23 23 %
Total 100 100 %
Source: Developed by researcher in Microsoft Excel 2014.
According to result procured from the questionnaire. The percentage of
respondent„s gender is mostly male (77 out of 100 people) at 77 %. Mean while
female employee among the respondent is less than 33 % ( 23 out of 100 people )
of the total population.
Therefore majority of the respondents are male
Male 77%
female 23%
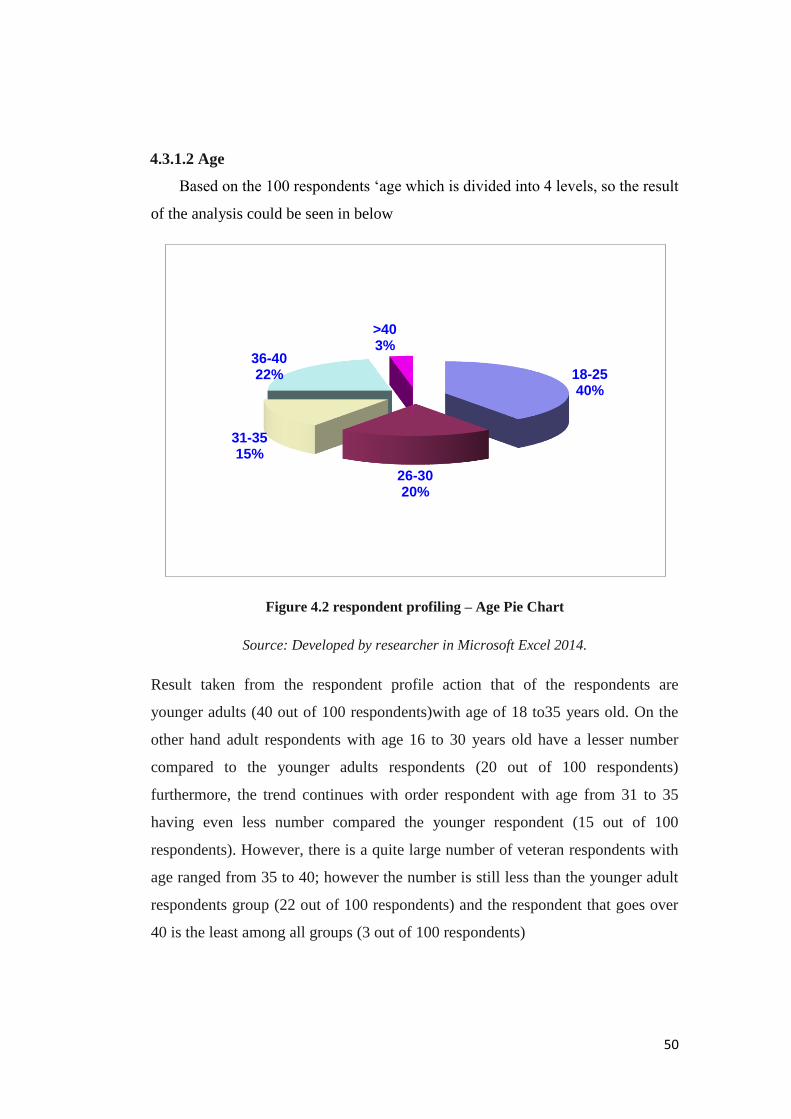
50
4.3.1.2 Age
Based on the 100 respondents „age which is divided into 4 levels, so the result
of the analysis could be seen in below
Figure 4.2 respondent profiling – Age Pie Chart
Source: Developed by researcher in Microsoft Excel 2014.
Result taken from the respondent profile action that of the respondents are
younger adults (40 out of 100 respondents)with age of 18 to35 years old. On the
other hand adult respondents with age 16 to 30 years old have a lesser number
compared to the younger adults respondents (20 out of 100 respondents)
furthermore, the trend continues with order respondent with age from 31 to 35
having even less number compared the younger respondent (15 out of 100
respondents). However, there is a quite large number of veteran respondents with
age ranged from 35 to 40; however the number is still less than the younger adult
respondents group (22 out of 100 respondents) and the respondent that goes over
40 is the least among all groups (3 out of 100 respondents)
18-25 40%
26-30 20%
31-35 15%
36-40 22%
>40 3%
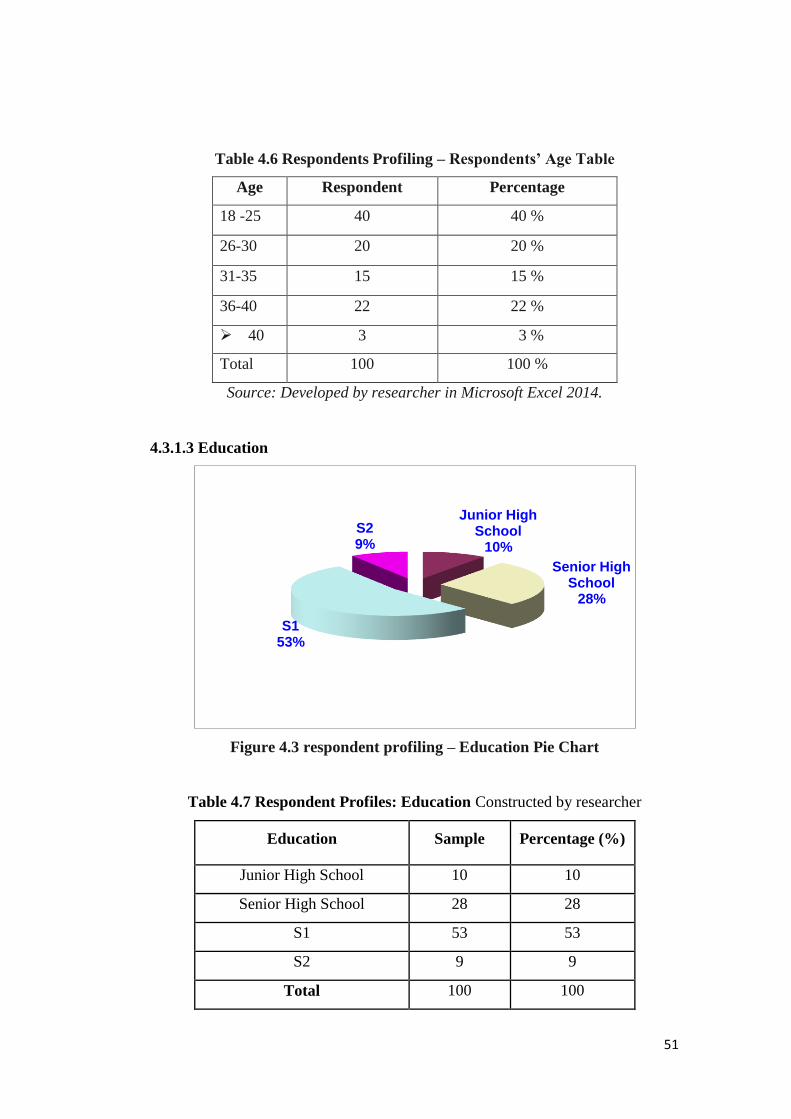
51
Table 4.6 Respondents Profiling – Respondents’ Age Table
Age Respondent Percentage
18 -25 40 40 %
26-30 20 20 %
31-35 15 15 %
36-40 22 22 %
40 3 3 %
Total 100 100 %
Source: Developed by researcher in Microsoft Excel 2014.
4.3.1.3 Education
Figure 4.3 respondent profiling – Education Pie Chart
Table 4.7 Respondent Profiles: Education Constructed by researcher
Education Sample Percentage (%)
Junior High School 10 10
Senior High School 28 28
S1 53 53
S2 9 9
Total 100 100
Junior High School
10%
Senior High School
28%
S1 53%
S2 9%
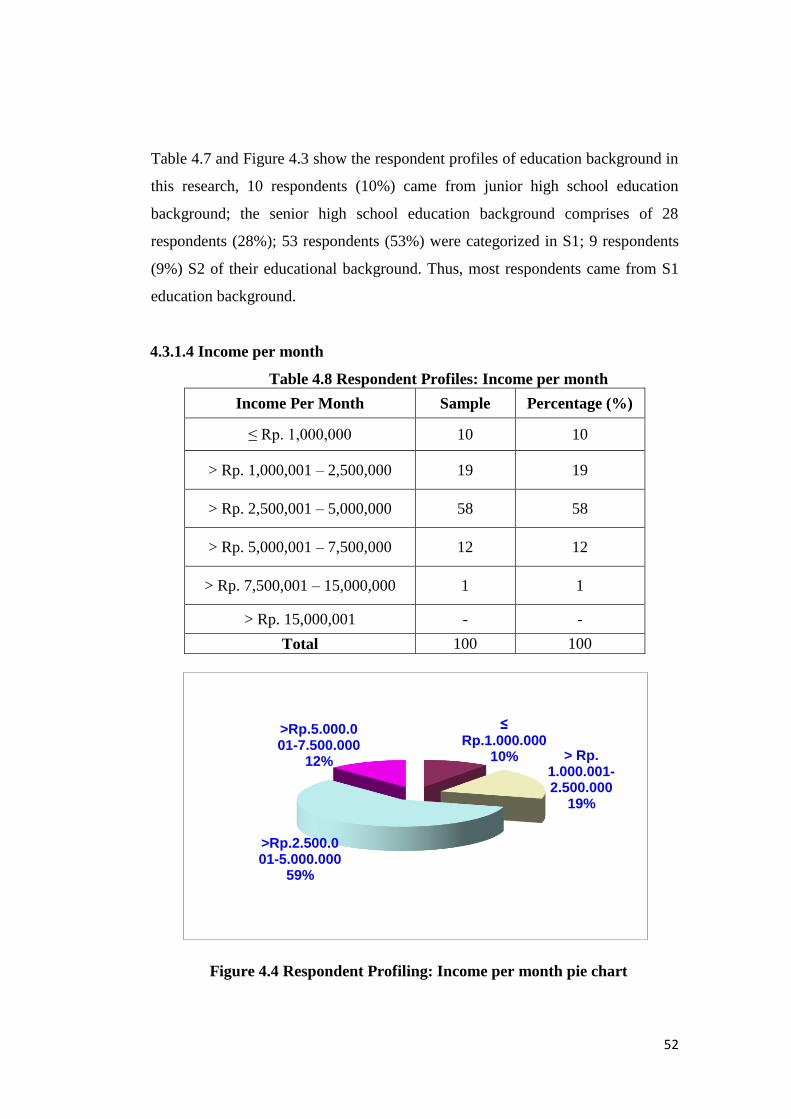
52
Table 4.7 and Figure 4.3 show the respondent profiles of education background in
this research, 10 respondents (10%) came from junior high school education
background; the senior high school education background comprises of 28
respondents (28%); 53 respondents (53%) were categorized in S1; 9 respondents
(9%) S2 of their educational background. Thus, most respondents came from S1
education background.
4.3.1.4 Income per month
Table 4.8 Respondent Profiles: Income per month
Income Per Month Sample Percentage (%)
≤ Rp. 1,000,000 10 10
> Rp. 1,000,001 – 2,500,000 19 19
> Rp. 2,500,001 – 5,000,000 58 58
> Rp. 5,000,001 – 7,500,000 12 12
> Rp. 7,500,001 – 15,000,000 1 1
> Rp. 15,000,001 - -
Total 100 100
Figure 4.4 Respondent Profiling: Income per month pie chart
≤ Rp.1.000.000
10% > Rp. 1.000.001-2.500.000
19%
>Rp.2.500.001-5.000.000
59%
>Rp.5.000.001-7.500.000
12%
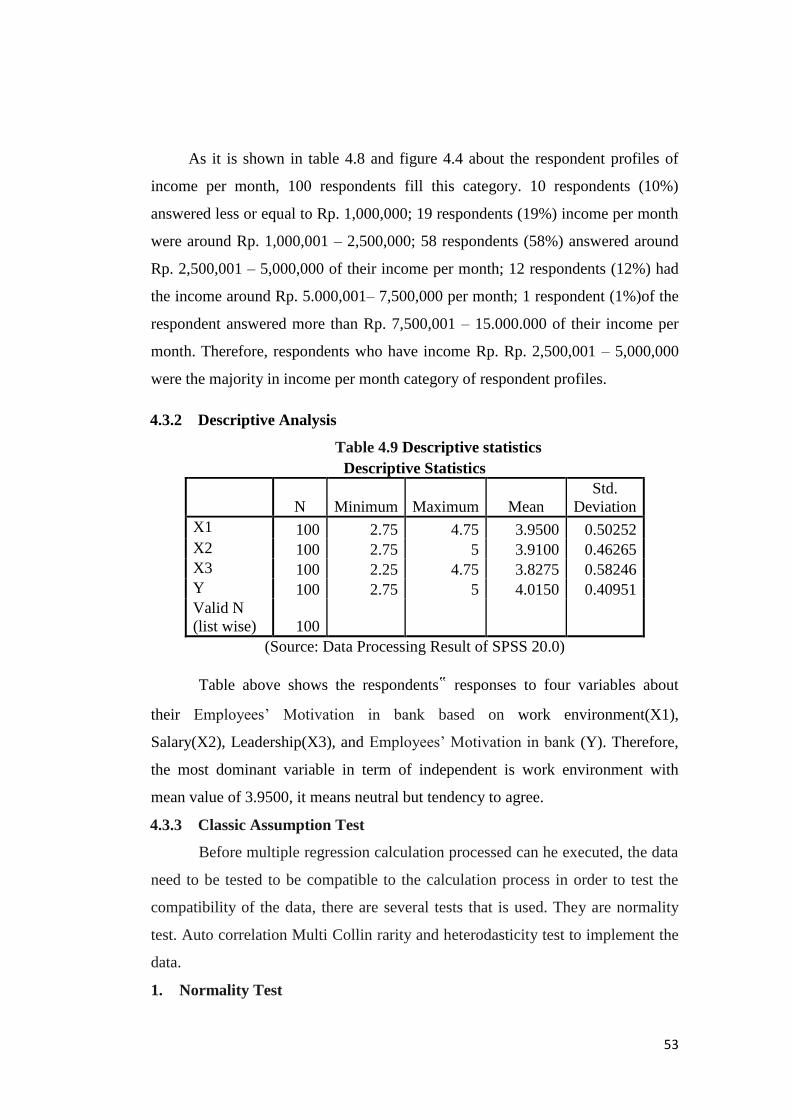
53
As it is shown in table 4.8 and figure 4.4 about the respondent profiles of
income per month, 100 respondents fill this category. 10 respondents (10%)
answered less or equal to Rp. 1,000,000; 19 respondents (19%) income per month
were around Rp. 1,000,001 – 2,500,000; 58 respondents (58%) answered around
Rp. 2,500,001 – 5,000,000 of their income per month; 12 respondents (12%) had
the income around Rp. 5.000,001– 7,500,000 per month; 1 respondent (1%)of the
respondent answered more than Rp. 7,500,001 – 15.000.000 of their income per
month. Therefore, respondents who have income Rp. Rp. 2,500,001 – 5,000,000
were the majority in income per month category of respondent profiles.
4.3.2 Descriptive Analysis
Table 4.9 Descriptive statistics
Descriptive Statistics
N Minimum Maximum Mean
Std.
Deviation
X1 100 2.75 4.75 3.9500 0.50252
X2 100 2.75 5 3.9100 0.46265
X3 100 2.25 4.75 3.8275 0.58246
Y 100 2.75 5 4.0150 0.40951
Valid N
(list wise) 100
(Source: Data Processing Result of SPSS 20.0)
Table above shows the respondents‟ responses to four variables about
their Employees‟ Motivation in bank based on work environment(X1),
Salary(X2), Leadership(X3), and Employees‟ Motivation in bank (Y). Therefore,
the most dominant variable in term of independent is work environment with
mean value of 3.9500, it means neutral but tendency to agree.
4.3.3 Classic Assumption Test
Before multiple regression calculation processed can he executed, the data
need to be tested to be compatible to the calculation process in order to test the
compatibility of the data, there are several tests that is used. They are normality
test. Auto correlation Multi Collin rarity and heterodasticity test to implement the
data.
1. Normality Test
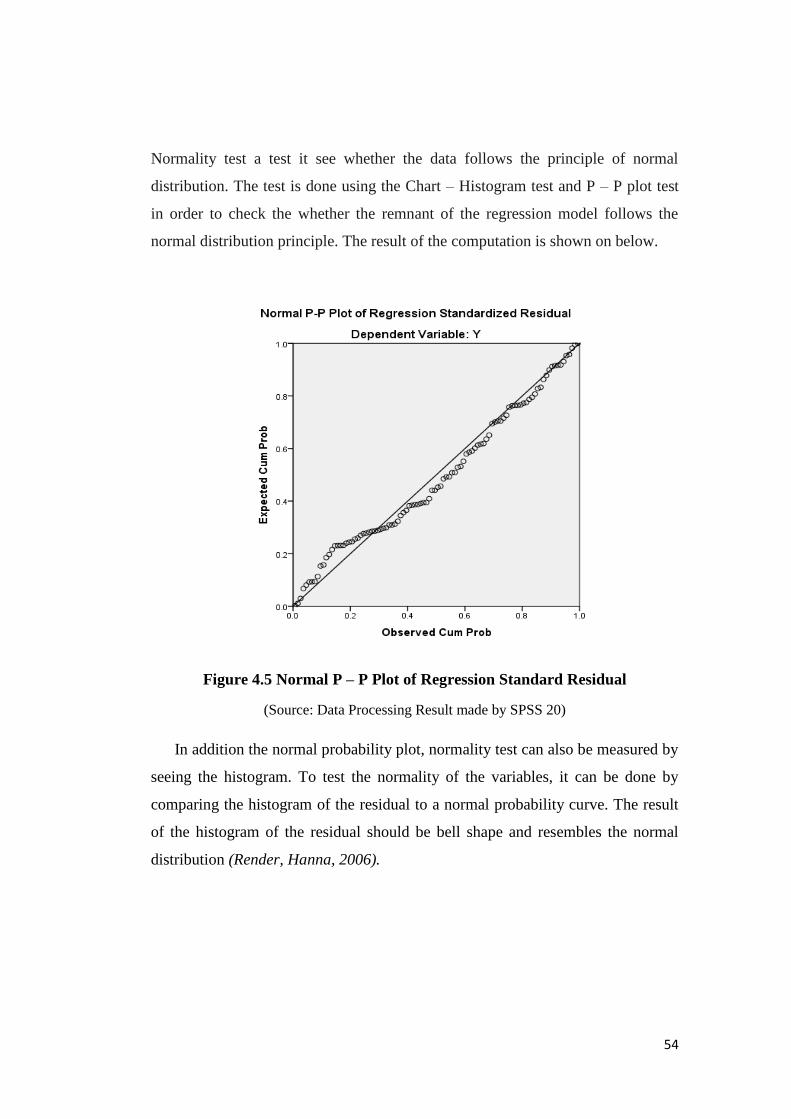
54
Normality test a test it see whether the data follows the principle of normal
distribution. The test is done using the Chart – Histogram test and P – P plot test
in order to check the whether the remnant of the regression model follows the
normal distribution principle. The result of the computation is shown on below.
Figure 4.5 Normal P – P Plot of Regression Standard Residual
(Source: Data Processing Result made by SPSS 20)
In addition the normal probability plot, normality test can also be measured by
seeing the histogram. To test the normality of the variables, it can be done by
comparing the histogram of the residual to a normal probability curve. The result
of the histogram of the residual should be bell shape and resembles the normal
distribution (Render, Hanna, 2006).
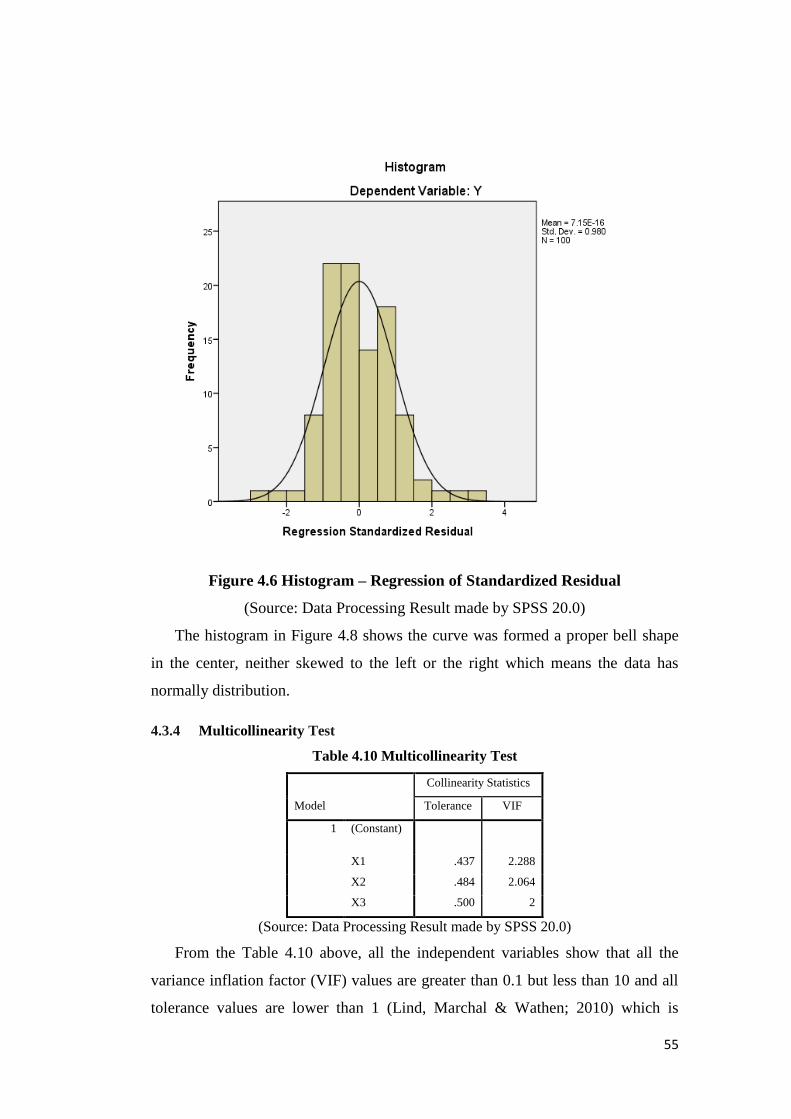
55
Figure 4.6 Histogram – Regression of Standardized Residual
(Source: Data Processing Result made by SPSS 20.0)
The histogram in Figure 4.8 shows the curve was formed a proper bell shape
in the center, neither skewed to the left or the right which means the data has
normally distribution.
4.3.4 Multicollinearity Test
Table 4.10 Multicollinearity Test
Model
Collinearity Statistics
Tolerance VIF
1 (Constant)
X1 .437 2.288
X2 .484 2.064
X3 .500 2
(Source: Data Processing Result made by SPSS 20.0)
From the Table 4.10 above, all the independent variables show that all the
variance inflation factor (VIF) values are greater than 0.1 but less than 10 and all
tolerance values are lower than 1 (Lind, Marchal & Wathen; 2010) which is
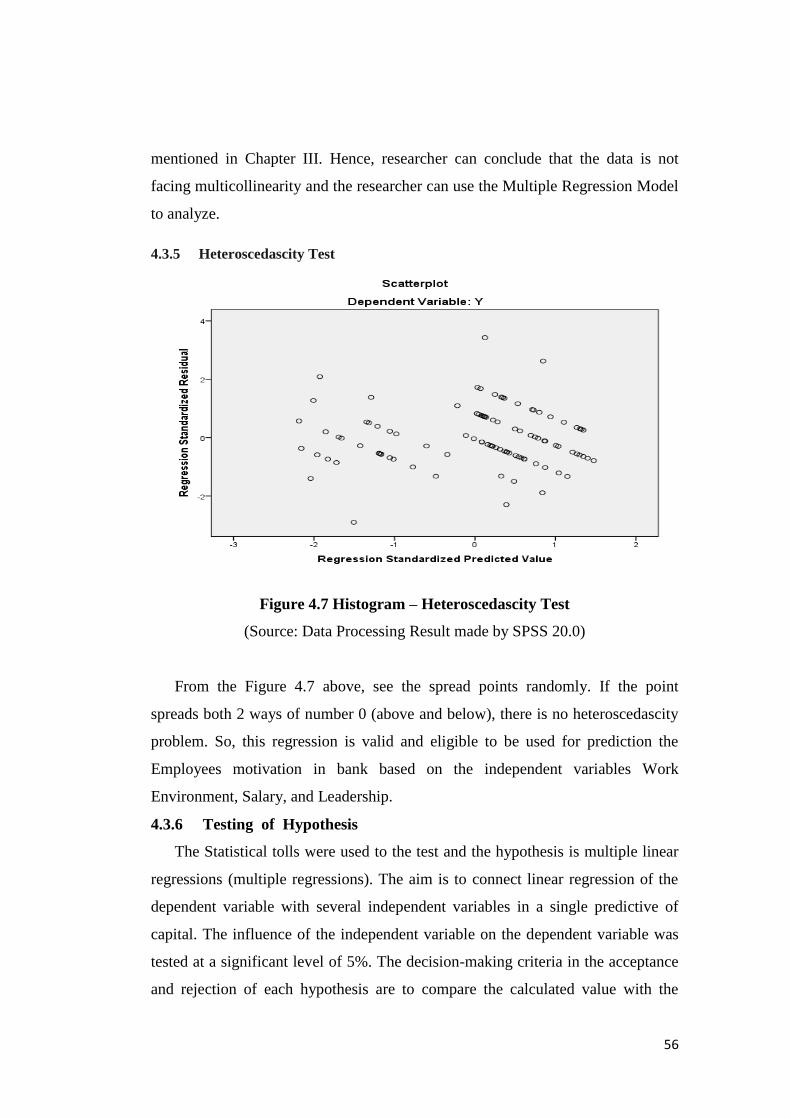
56
mentioned in Chapter III. Hence, researcher can conclude that the data is not
facing multicollinearity and the researcher can use the Multiple Regression Model
to analyze.
4.3.5 Heteroscedascity Test
Figure 4.7 Histogram – Heteroscedascity Test
(Source: Data Processing Result made by SPSS 20.0)
From the Figure 4.7 above, see the spread points randomly. If the point
spreads both 2 ways of number 0 (above and below), there is no heteroscedascity
problem. So, this regression is valid and eligible to be used for prediction the
Employees motivation in bank based on the independent variables Work
Environment, Salary, and Leadership.
4.3.6 Testing of Hypothesis
The Statistical tolls were used to the test and the hypothesis is multiple linear
regressions (multiple regressions). The aim is to connect linear regression of the
dependent variable with several independent variables in a single predictive of
capital. The influence of the independent variable on the dependent variable was
tested at a significant level of 5%. The decision-making criteria in the acceptance
and rejection of each hypothesis are to compare the calculated value with the
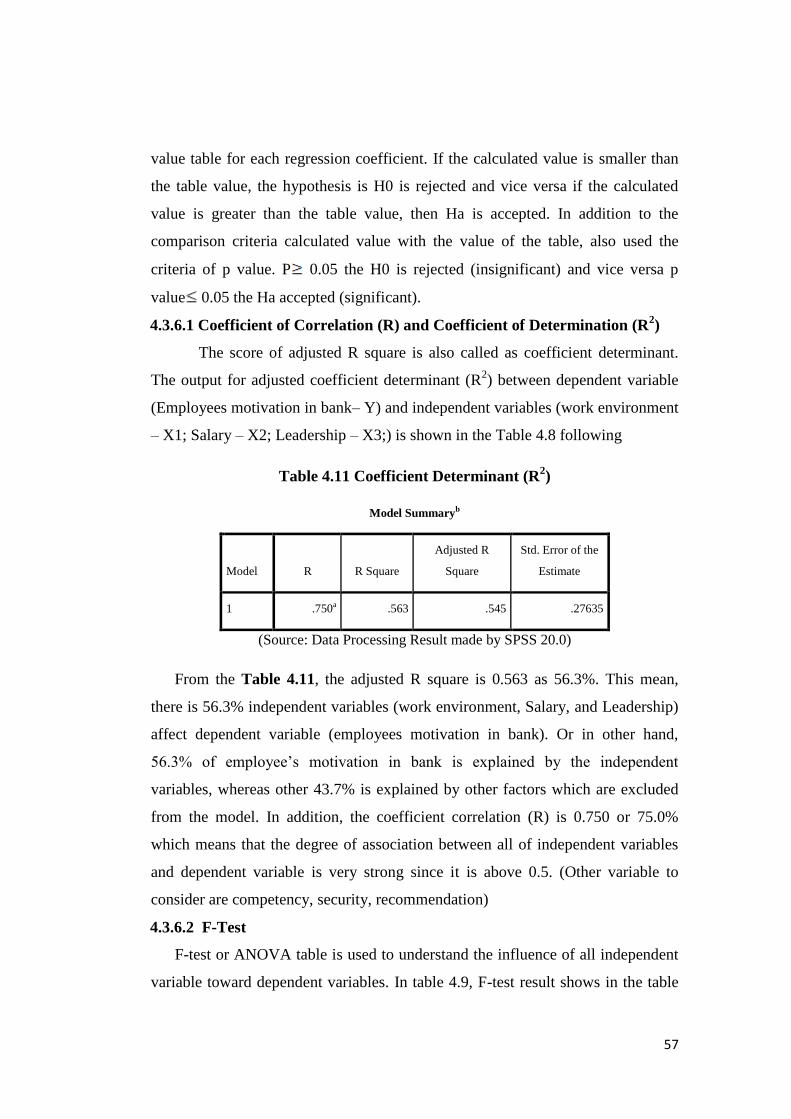
57
value table for each regression coefficient. If the calculated value is smaller than
the table value, the hypothesis is H0 is rejected and vice versa if the calculated
value is greater than the table value, then Ha is accepted. In addition to the
comparison criteria calculated value with the value of the table, also used the
criteria of p value. P 0.05 the H0 is rejected (insignificant) and vice versa p
value 0.05 the Ha accepted (significant).
4.3.6.1 Coefficient of Correlation (R) and Coefficient of Determination (R2)
The score of adjusted R square is also called as coefficient determinant.
The output for adjusted coefficient determinant (R2) between dependent variable
(Employees motivation in bank– Y) and independent variables (work environment
– X1; Salary – X2; Leadership – X3;) is shown in the Table 4.8 following
Table 4.11 Coefficient Determinant (R2)
Model Summaryb
Model R R Square
Adjusted R
Square
Std. Error of the
Estimate
1 .750a .563 .545 .27635
(Source: Data Processing Result made by SPSS 20.0)
From the Table 4.11, the adjusted R square is 0.563 as 56.3%. This mean,
there is 56.3% independent variables (work environment, Salary, and Leadership)
affect dependent variable (employees motivation in bank). Or in other hand,
56.3% of employee‟s motivation in bank is explained by the independent
variables, whereas other 43.7% is explained by other factors which are excluded
from the model. In addition, the coefficient correlation (R) is 0.750 or 75.0%
which means that the degree of association between all of independent variables
and dependent variable is very strong since it is above 0.5. (Other variable to
consider are competency, security, recommendation)
4.3.6.2 F-Test
F-test or ANOVA table is used to understand the influence of all independent
variable toward dependent variables. In table 4.9, F-test result shows in the table
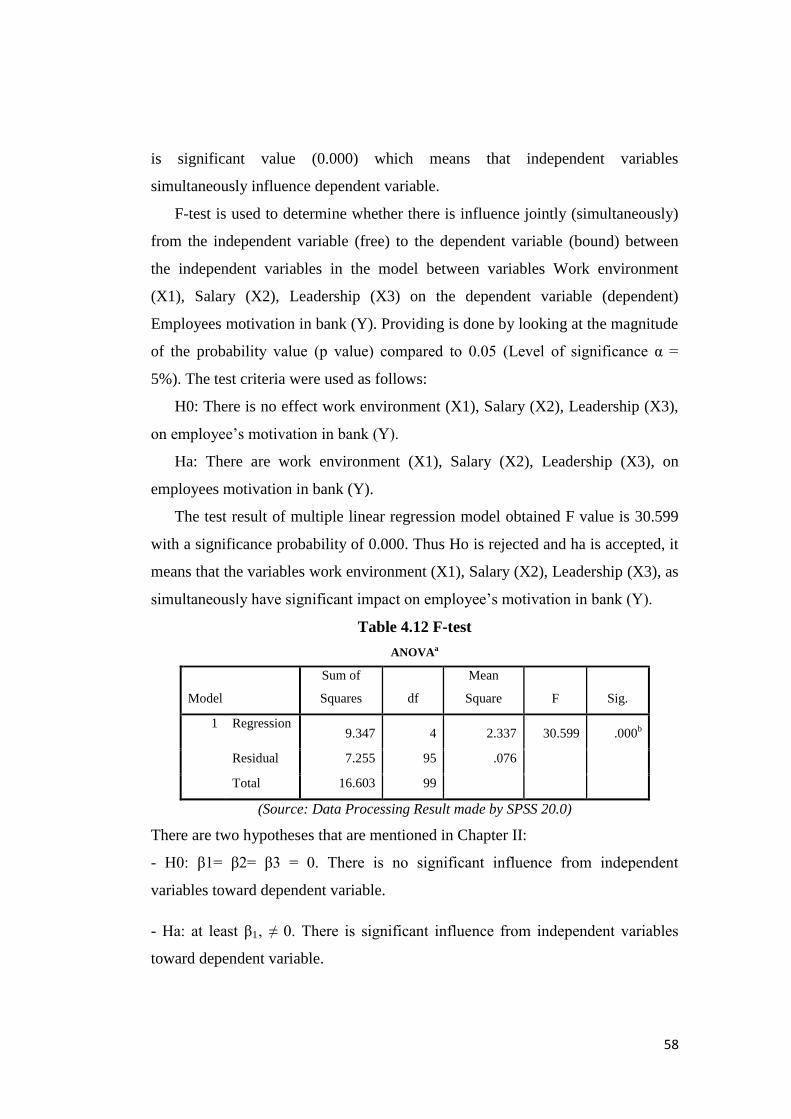
58
is significant value (0.000) which means that independent variables
simultaneously influence dependent variable.
F-test is used to determine whether there is influence jointly (simultaneously)
from the independent variable (free) to the dependent variable (bound) between
the independent variables in the model between variables Work environment
(X1), Salary (X2), Leadership (X3) on the dependent variable (dependent)
Employees motivation in bank (Y). Providing is done by looking at the magnitude
of the probability value (p value) compared to 0.05 (Level of significance α =
5%). The test criteria were used as follows:
H0: There is no effect work environment (X1), Salary (X2), Leadership (X3),
on employee‟s motivation in bank (Y).
Ha: There are work environment (X1), Salary (X2), Leadership (X3), on
employees motivation in bank (Y).
The test result of multiple linear regression model obtained F value is 30.599
with a significance probability of 0.000. Thus Ho is rejected and ha is accepted, it
means that the variables work environment (X1), Salary (X2), Leadership (X3), as
simultaneously have significant impact on employee‟s motivation in bank (Y).
Table 4.12 F-test
ANOVAa
Model
Sum of
Squares df
Mean
Square F Sig.
1 Regression 9.347 4 2.337 30.599 .000
b
Residual 7.255 95 .076
Total 16.603 99
(Source: Data Processing Result made by SPSS 20.0)
There are two hypotheses that are mentioned in Chapter II:
- H0: β1= β2= β3 = 0. There is no significant influence from independent
variables toward dependent variable.
- Ha: at least β1‚ ≠ 0. There is significant influence from independent variables
toward dependent variable.
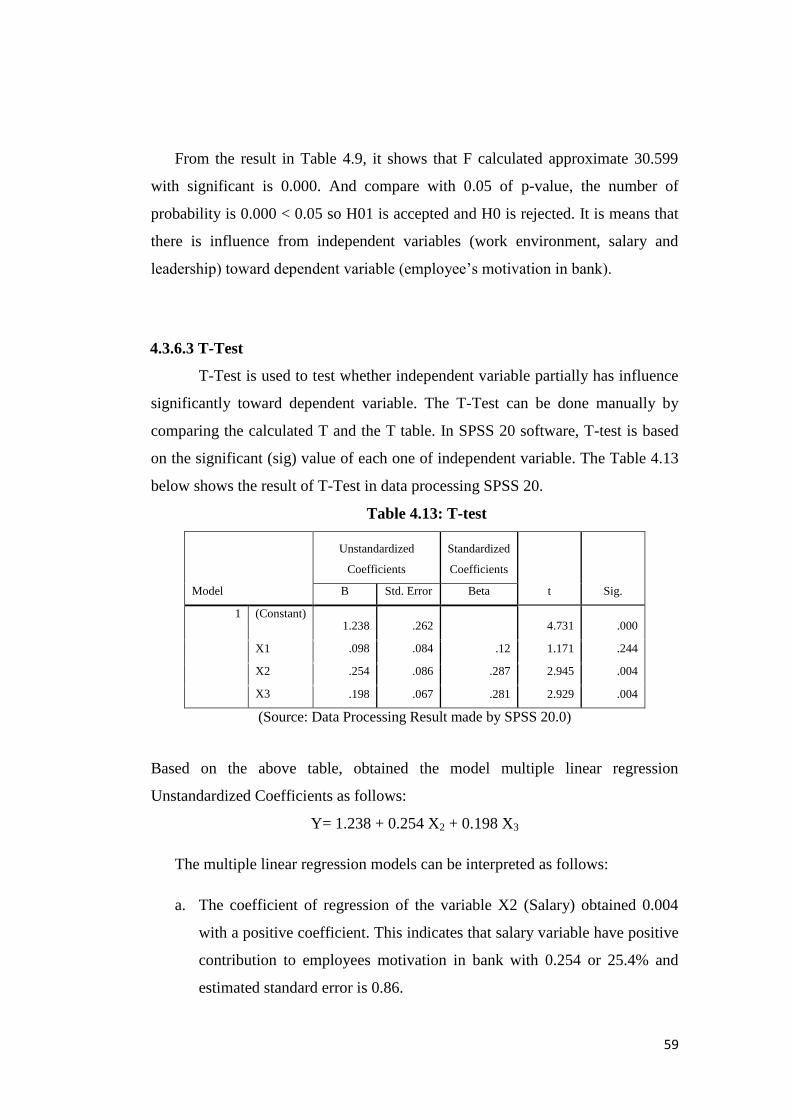
59
From the result in Table 4.9, it shows that F calculated approximate 30.599
with significant is 0.000. And compare with 0.05 of p-value, the number of
probability is 0.000 < 0.05 so H01 is accepted and H0 is rejected. It is means that
there is influence from independent variables (work environment, salary and
leadership) toward dependent variable (employee‟s motivation in bank).
4.3.6.3 T-Test
T-Test is used to test whether independent variable partially has influence
significantly toward dependent variable. The T-Test can be done manually by
comparing the calculated T and the T table. In SPSS 20 software, T-test is based
on the significant (sig) value of each one of independent variable. The Table 4.13
below shows the result of T-Test in data processing SPSS 20.
Table 4.13: T-test
Model
Unstandardized
Coefficients
Standardized
Coefficients
t Sig. B Std. Error Beta
1 (Constant) 1.238 .262 4.731 .000
X1 .098 .084 .12 1.171 .244
X2 .254 .086 .287 2.945 .004
X3 .198 .067 .281 2.929 .004
(Source: Data Processing Result made by SPSS 20.0)
Based on the above table, obtained the model multiple linear regression
Unstandardized Coefficients as follows:
Y= 1.238 + 0.254 X2 + 0.198 X3
The multiple linear regression models can be interpreted as follows:
a. The coefficient of regression of the variable X2 (Salary) obtained 0.004
with a positive coefficient. This indicates that salary variable have positive
contribution to employees motivation in bank with 0.254 or 25.4% and
estimated standard error is 0.86.
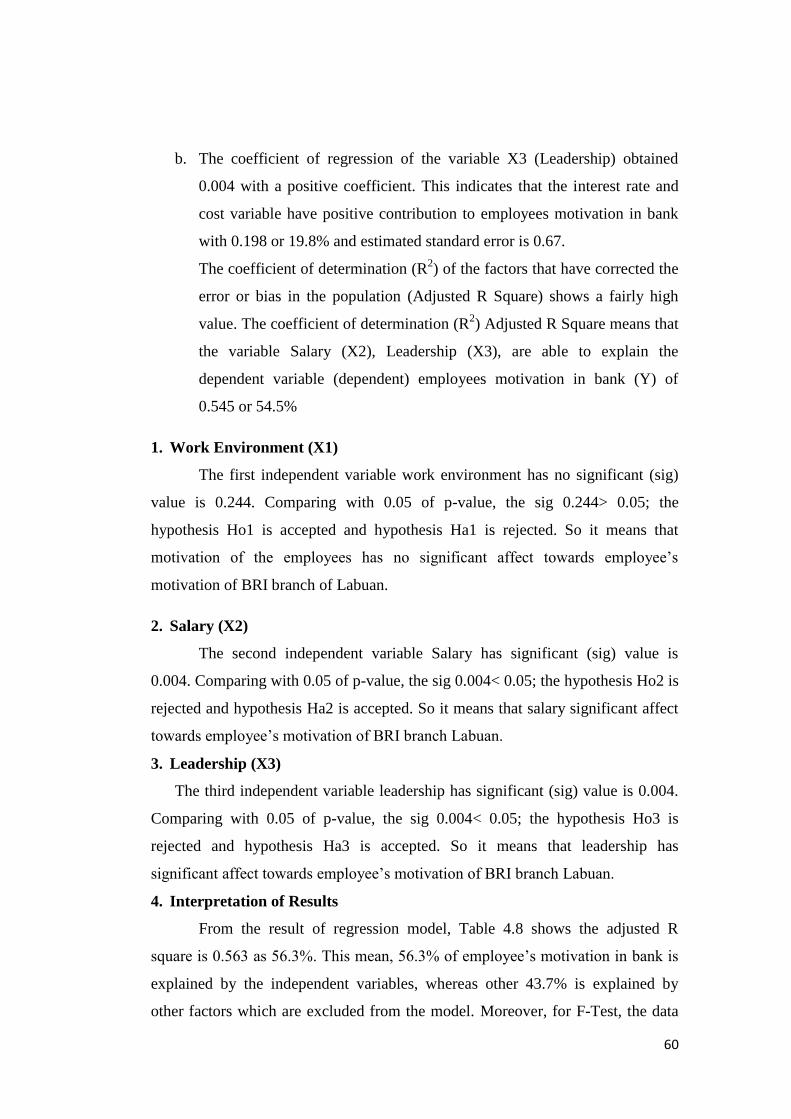
60
b. The coefficient of regression of the variable X3 (Leadership) obtained
0.004 with a positive coefficient. This indicates that the interest rate and
cost variable have positive contribution to employees motivation in bank
with 0.198 or 19.8% and estimated standard error is 0.67.
The coefficient of determination (R2) of the factors that have corrected the
error or bias in the population (Adjusted R Square) shows a fairly high
value. The coefficient of determination (R2) Adjusted R Square means that
the variable Salary (X2), Leadership (X3), are able to explain the
dependent variable (dependent) employees motivation in bank (Y) of
0.545 or 54.5%
1. Work Environment (X1)
The first independent variable work environment has no significant (sig)
value is 0.244. Comparing with 0.05 of p-value, the sig 0.244> 0.05; the
hypothesis Ho1 is accepted and hypothesis Ha1 is rejected. So it means that
motivation of the employees has no significant affect towards employee‟s
motivation of BRI branch of Labuan.
2. Salary (X2)
The second independent variable Salary has significant (sig) value is
0.004. Comparing with 0.05 of p-value, the sig 0.004< 0.05; the hypothesis Ho2 is
rejected and hypothesis Ha2 is accepted. So it means that salary significant affect
towards employee‟s motivation of BRI branch Labuan.
3. Leadership (X3)
The third independent variable leadership has significant (sig) value is 0.004.
Comparing with 0.05 of p-value, the sig 0.004< 0.05; the hypothesis Ho3 is
rejected and hypothesis Ha3 is accepted. So it means that leadership has
significant affect towards employee‟s motivation of BRI branch Labuan.
4. Interpretation of Results
From the result of regression model, Table 4.8 shows the adjusted R
square is 0.563 as 56.3%. This mean, 56.3% of employee‟s motivation in bank is
explained by the independent variables, whereas other 43.7% is explained by
other factors which are excluded from the model. Moreover, for F-Test, the data
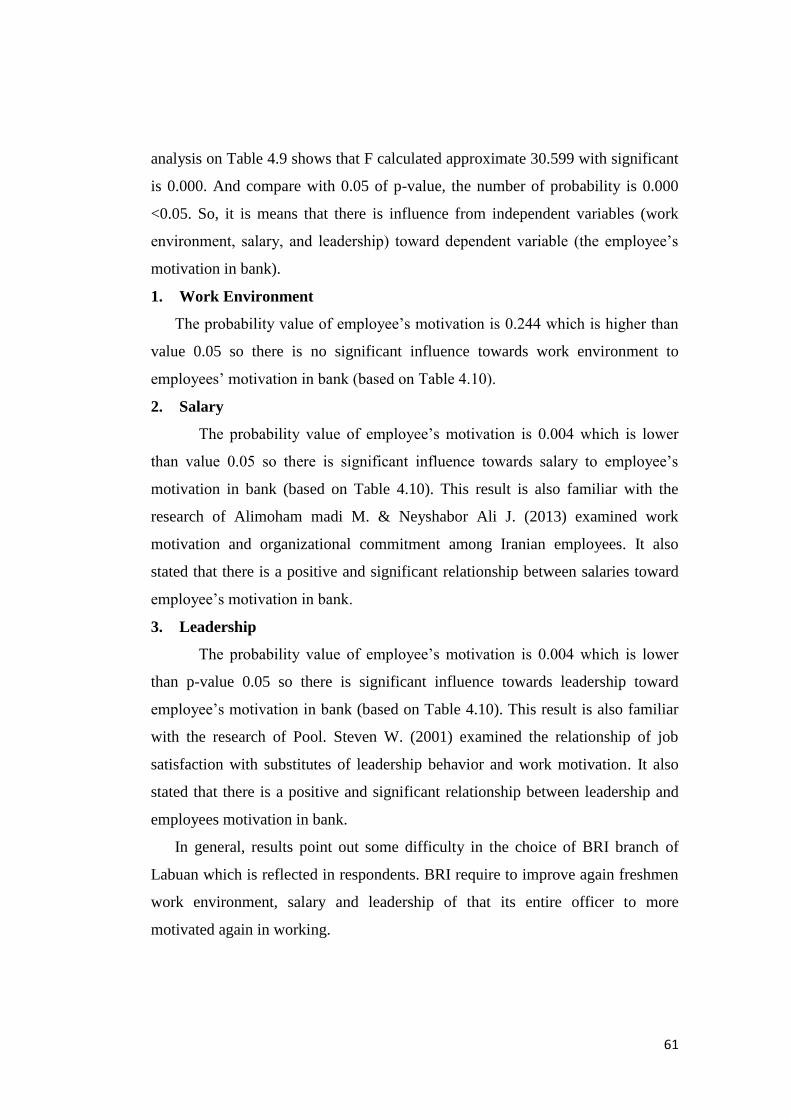
61
analysis on Table 4.9 shows that F calculated approximate 30.599 with significant
is 0.000. And compare with 0.05 of p-value, the number of probability is 0.000
<0.05. So, it is means that there is influence from independent variables (work
environment, salary, and leadership) toward dependent variable (the employee‟s
motivation in bank).
1. Work Environment
The probability value of employee‟s motivation is 0.244 which is higher than
value 0.05 so there is no significant influence towards work environment to
employees‟ motivation in bank (based on Table 4.10).
2. Salary
The probability value of employee‟s motivation is 0.004 which is lower
than value 0.05 so there is significant influence towards salary to employee‟s
motivation in bank (based on Table 4.10). This result is also familiar with the
research of Alimoham madi M. & Neyshabor Ali J. (2013) examined work
motivation and organizational commitment among Iranian employees. It also
stated that there is a positive and significant relationship between salaries toward
employee‟s motivation in bank.
3. Leadership
The probability value of employee‟s motivation is 0.004 which is lower
than p-value 0.05 so there is significant influence towards leadership toward
employee‟s motivation in bank (based on Table 4.10). This result is also familiar
with the research of Pool. Steven W. (2001) examined the relationship of job
satisfaction with substitutes of leadership behavior and work motivation. It also
stated that there is a positive and significant relationship between leadership and
employees motivation in bank.
In general, results point out some difficulty in the choice of BRI branch of
Labuan which is reflected in respondents. BRI require to improve again freshmen
work environment, salary and leadership of that its entire officer to more
motivated again in working.
62
CHAPTER V
CONCLUSION AND RECOMMENDATION
5.1 Conclusion
The purpose of this research is to identify whether there is a correlation
between four independent variables (work environment, salary, and leadership)
toward one dependent variable (employees motivation in bank). Regarding from
the result and discussion on chapter IV, the conclusion would be drawn as follow:
A. Based on T-test result, there is no a partial significant influence of work
environment toward employees motivation in bank, since p-value of work
environment (X1) is 0.244 > α (0.05), which means in partial work
environment does not influence to employees motivation in bank.
B. Based on T-test result, there is a partial significant influence of salary toward
employees motivation in bank, since p-value of work environment (X1) is
0.004 < α (0.05).
C. Based on T-test result, there is a partial significant influence of leadership
toward employees motivation in bank, since p-value of work environment
(X1) is 0.004 < α (0.05).
5.2 Recommendation
After conducting the research, the researcher has several recommendations
that can be used as consideration regarding the effects of work environment,
salary, and leadership towards employee‟s motivation in bank.
5.2.1 For the Bank
Company can use this research to find employees a more effective and
efficient in terms of growth and productivity and in order to achieve this and to
employ asset of tools that incorporates salary increases while placing added
emphasis on non-monetary rewards. While providing incentives, bonuses, or the
opportunity to increases wages through piecework pay, institute changes that
improve morale, such as leading by example, treating all workers fairly, and

63
providing KPR (Kredit Perumahan Rakyat), insurance for health and life,
transportation, etc. Providing training and opportunities for advancement
motivates employees to increase productivity while increasing their sense of
value. Open communication, fairness, security, and rewards in aimed at successful
teamwork also complement a balanced managerial style that encourages both
loyalty and higher productivity.
5.2.2 For the Future Researchers
From this research, the factor studies are limited to three based on the
previous research that play important role on having influencing motivation in
bank BRI. It can lengthen the research period more that this research to obtain
more results that is more comprehensive. Furthermore deep study in work
environment and directly could improve work environment and also consider
alternative method and instrument in this research. Distribute more questionnaires
to branches rather than only did it in main branch.
64
REFERENCES
Book
Alimohammadi M. & Neyshabor Ali J.2013 “Work Motivation and
Organizational Commitment among Iranian Employs” New York: Mc
Graw - Hill International Edition
Conway, N. & Briner, R.B. (2005). Understanding Psychological Contracts at
Work - A Critical Evaluation of Theory and Research. Oxford: Oxford ..
Douglas A. Lind, W. G. (2009). Statistic Techniques in Business and Economic,
14th Edition. LonDon: McGraw- Hill International Edition.
Field, A. (2009). Discovering Statistics Using SPSS. London: Sage Publictions
Ltd.
Gary Yukl. 1994.Leadership in organization, prentice Hall
Kennet N Wexly, Gary Yukl. 1975. Organizational Behavior and industrial
Psychology readings with commentary, Prentice Hall
green, S. B. (2008). Using SPSS for Windows and Macintosh: Analysis and
Understanding Data, (5th ed.). America: Prentice Hall
Mathis, Robert L. dan John H. Jackson. 2002. Management of Human Resource `
Jilid 2.. Jakarta : Grafindo.
Pool. Steven.2001. “The Relationship of job Satisfaction With Substitutes of
Leadership Behavior and Work Motivation. America: Prentice Hall
Rabindra N. Kamingo, 1998. Charismatic Leadership in Organizations, London:
Thomson Learning.
65
Journal:
A. Shadare, Oluseyi dan Hammed, T. Ayo. 2009. “Influence of Work Motivation,
Leadership Effectiveness and Time Management on Employees’
Performance in Some Selected Industries in Ibadan, Oyo State, Nigeria”.
European Journal of Economics, Finance and Administrative Sciences
ISSN 1450-2275 Issue 16.
Musriha. 2011 .”Influences of Work Behavior, Work Environment and Motivation
in clove cigarette factories in Kudus, Indonesia”. Journal Of Academic
Research International. ISSN: 2223-9553. Volume 1, Issue 3, November
2011.
Srivastava, A.K. 2008. “Effect of Perceived Work Environment on
Employees’ Job Behaviour and Organizational Effectiveness”. Juornal of
the Indian Academy of Applied Psychology, Vol. 34, No. 1, 47-55.
Banaras Hindu University ; Varanasi.
Aregbeyen, O. (2011). The Determinants of Bank Selection Choices by
Customers: Recent and Extensive Evidence from Nigeria. International
Journal of Business and Social Science Vol. 2 No. 22; December 2011.
Brady, M. .. (2001). Some New Thoughts on Con ceptualizing Perceived Services
Quality.
Bruhn, A. C. (2006). “Service Marketing: Managing the Service Value Chain”.
Harlow: Pearson Education.
Byström, P. a. (2013). Ekonomi eller intresse? - En studie av de viktigaste
faktorernavid studenters val av bank. Undergraduate thesis. Umeå
University.
Chen. (1999). Critical success factor in banking industry. International Journal of
Bank, 83-91.
Chigamba, C. (2010). Factors Influencing the Choice of Commercial Banks by
University Students in South Africa. International Journal of Business and
Management Vol. 6, No. 6; June 2011.
Cicic, M. B. (2004). Bank selection criteria employed by students in a
southeastern European country: An empirical analysis of potential market
segments preferences.
66
Cleopas, C. a. (2011). Factors Influencing the Choice of Commercial Banks by
University Students in South Africa. International Journal of Business and
Management 6(6), 66-76.
Har, P. a. (2000). A study of bank selection decisions in Singapore using the
Analytical Hierarchy Process. International Journal of Bank Marketing
18, 170- 180.
Hill, F. (. (n.d.). Managing Service Quality in Higher Education: The Role of
Students as Primary Consumer”. Quality Assurance in Education, 3 (3),.
10-21.
Hinson, R. D.-F. (2009). Undergraduate First Time Bank Customers‟ Perception
of Service Quality in Ghana. International Business Economics working
paper series, 49,.
J.F., D. (2002). Customer Knowledge and Choice criteria in retail banking.
Journal of Strategic Marketing, Vol. 10, pp. 273-290.
J.Richard Dietrich, R. S. (2002). Empirical Analysis of the Commercial Loan
Classification Decision. American Accounting Association.
Jabnoun, N. C. (2003). “Comparing the quality of private and public hospitals in
UAE”. Managing Service Quality, Vol. 13, No. 4.
Jesswein, K. R. (2006). International Banking and large community banks: a
preminary look. Journal of commercial Banking and Finance.
K. Osotimehin, B. A. (2015). Customers Perception of Service Quality in the
Nigerian Telecommunication Sector. Journal of Economics and Business
Research No. 1, 2015, pp. 144-157.
Karatepe, O. M. (2005). Measuring service quality of banks: Scale development
and validation. Journal of Retailing and ConsumerServices, 12, 373-383.
Khan, W. A. (2014). Impact of Interest Rate Changes on the Profitability of four
Major Commercial Banks in Pakistan. International Journal of Accounting
and Financial Reporting ISSN 2162-3082 2014, Vol. 4, No. 1.
Kishan, R. a. (2000). Bank size, bank capital and the lending channel,. Journal of
Money, Credit and Banking 32(1), : 121–141.
Krisnanto, U. (2011). The Customers‟ Determinant Factors of the Bank Selection.
Umbas Krisnanto / The Customers’ Determinant Factors of the Bank
Selection / 59 - 70.
67
Kwan, P. N. (1999). “Quality Indicators in Higher Education – Comparing Hong
Kong and China‟s Students”. Managerial Auditing Journal, Vol. 14, No.
1, 20-77.
Lymperopoulos C., C. I. (2006). The Important of Service quality in Bank
Selection for Mortgage Loans. Managing Service Quality, pp. 365 -379.
M., S. U. (2012). Analysis of the Influence of Gender on the Choice of Bank in
Southeast Nigeria. International Journal of Business and Management,
Vol. 7, No. 3.
Maddern H., M. R. (2007). "Managing Service Quality in Banks: Customers'
Gender Effect". International Journal of Operational and Production
Management, 998 -1019.
Mamunur R., a. K. (2009). Customer Demographics Affecting Bank Selection
Criteria, Prefernce, and market Segmentation: Study on Domestic Islamic
Banks in Bangladesh. International Journal of Business and Management,
Vol. 4, No. 6.
Marquez., D. A. (2004). Information and Commercial loan analysis. Journal of
Financial Economics, 185-214.
Mohklis S., S. H. (2010). Ethnicity and Choice Criteria in Retail Banking: A
Malaysian Perspective. International Journal of Business and
Management, Vol. 5, No. 6.
Mokhlis, S. (2009). Determinants of choice Criteria in Malaysia's Retail banking:
An analysis of Gender based Choice Decision. European Journal of
Economics. Finance and Administrative siciences.
141.
Osman, D. S. (2012). Consumer Criteria for the Selection of an Islamic Bank:
Evidence from Pakistan. MPRA Paper No. 40384, posted 31. July 2012
09:01 UTC.
Rao, S. a. (2010). Bank Selection Criteia Employed by MBA Students in Delhi:
An Empirical Analysis. Journal of Business Studies, 56 - 69.
Rashid, M. (2009). Customer Demographics Affecting Bank Selection Criteria,
Preference, and Market Segmentation: Study on Domestic Islamic Banks
in Bangladesh. International journal of business and management Vol. 4,
No. 6.
68
Rehman, H. &. (2008). An Empirical Analysis of the Determinants of Bank
Selection on Pakistan: A Customer View. Pakistant Economic and Social
Review, Vol. 46, No. 2., pp. 147 -160.
Website:
Aduda, P. J. Retrieved February 25th
from http://business.uonbi.ac.ke/node/1497
Amadeo, K. (2012). What are the interest rates and how do they work. Retrieved
February 26th
, 2015 from:
http://useconomy.about.com/bio/Kimberly-Amadeo-22286.htm
Bibi, W. (2011). Reputational Risk or Risks to Reputation? Retrieved February
27th
, 2015 from: bibiconsulting.com
eximbank annual report 2013. (n.d.). Retrieved February 27th
, 2015 from:
http://www.eximbank.com.vn/Home/Static/baocaotaichinh.aspx#
eximbank home page. (n.d.). Retrieved February 27th
, 2015 from:
http://www.eximbank.com.vn/Home/
SURVEY, G. o. (2008 - 2009). Retrieved March 2rd
, 2015 from:
ecostatjk.nic.in/publications/release4.pdf
Weighted mean. (n.d.). Retrieved March 2rd
, 2015 from:
http://www.princeton.edu/~achaney/tmve/wiki100k/docs/Weighted_mean.
html.
what is Commerical bank? (n.d.). Retrieved March 2rd
, 2015 from:
http://voer.edu.vn/m/ngan-hang-thuong-mai/e9edd823
Aduda, J. (n.d.). Retrieved from http://business.uonbi.ac.ke/node/1497
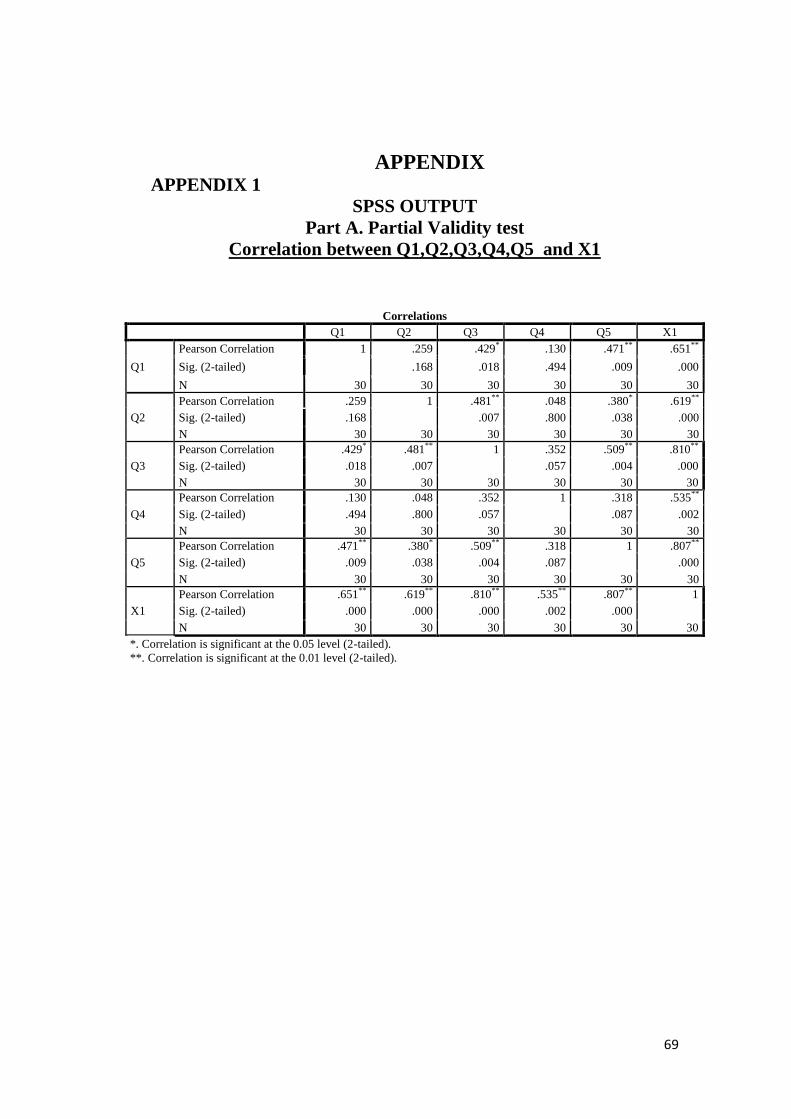
69
APPENDIX APPENDIX 1
SPSS OUTPUT
Part A. Partial Validity test
Correlation between Q1,Q2,Q3,Q4,Q5 and X1
Correlations
Q1 Q2 Q3 Q4 Q5 X1
Q1
Pearson Correlation 1 .259 .429* .130 .471** .651**
Sig. (2-tailed) .168 .018 .494 .009 .000
N 30 30 30 30 30 30
Q2
Pearson Correlation .259 1 .481** .048 .380* .619**
Sig. (2-tailed) .168 .007 .800 .038 .000
N 30 30 30 30 30 30
Q3
Pearson Correlation .429* .481** 1 .352 .509** .810**
Sig. (2-tailed) .018 .007 .057 .004 .000
N 30 30 30 30 30 30
Q4
Pearson Correlation .130 .048 .352 1 .318 .535**
Sig. (2-tailed) .494 .800 .057 .087 .002
N 30 30 30 30 30 30
Q5
Pearson Correlation .471** .380* .509** .318 1 .807**
Sig. (2-tailed) .009 .038 .004 .087 .000
N 30 30 30 30 30 30
X1
Pearson Correlation .651** .619** .810** .535** .807** 1
Sig. (2-tailed) .000 .000 .000 .002 .000 N 30 30 30 30 30 30
*. Correlation is significant at the 0.05 level (2-tailed).
**. Correlation is significant at the 0.01 level (2-tailed).
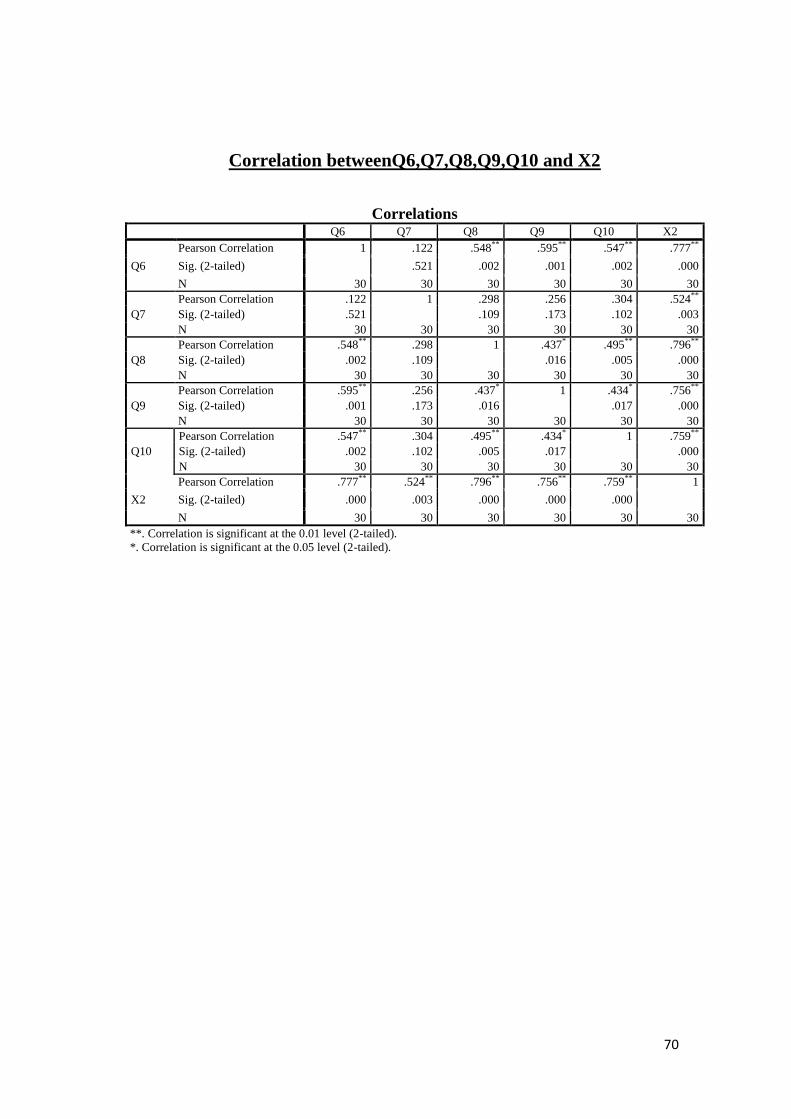
70
Correlation betweenQ6,Q7,Q8,Q9,Q10 and X2
Correlations Q6 Q7 Q8 Q9 Q10 X2
Q6
Pearson Correlation 1 .122 .548** .595** .547** .777**
Sig. (2-tailed) .521 .002 .001 .002 .000
N 30 30 30 30 30 30
Q7
Pearson Correlation .122 1 .298 .256 .304 .524**
Sig. (2-tailed) .521 .109 .173 .102 .003
N 30 30 30 30 30 30
Q8
Pearson Correlation .548** .298 1 .437* .495** .796**
Sig. (2-tailed) .002 .109 .016 .005 .000
N 30 30 30 30 30 30
Q9
Pearson Correlation .595** .256 .437* 1 .434* .756**
Sig. (2-tailed) .001 .173 .016 .017 .000
N 30 30 30 30 30 30
Q10
Pearson Correlation .547** .304 .495** .434* 1 .759**
Sig. (2-tailed) .002 .102 .005 .017 .000
N 30 30 30 30 30 30
X2
Pearson Correlation .777** .524** .796** .756** .759** 1
Sig. (2-tailed) .000 .003 .000 .000 .000
N 30 30 30 30 30 30
**. Correlation is significant at the 0.01 level (2-tailed).
*. Correlation is significant at the 0.05 level (2-tailed).

71
Correlation between Q11,Q12,Q13,Q14,Q15 and X3
Correlations Q11 Q12 Q13 Q14 Q15 X3
Q11
Pearson Correlation 1 .122 .548** .595** .547** .777**
Sig. (2-tailed) .521 .002 .001 .002 .000
N 30 30 30 30 30 30
Q12
Pearson Correlation .122 1 .298 .256 .304 .524**
Sig. (2-tailed) .521 .109 .173 .102 .003
N 30 30 30 30 30 30
Q13
Pearson Correlation .548** .298 1 .437* .495** .796**
Sig. (2-tailed) .002 .109 .016 .005 .000
N 30 30 30 30 30 30
Q14
Pearson Correlation .595** .256 .437* 1 .434* .756**
Sig. (2-tailed) .001 .173 .016 .017 .000
N 30 30 30 30 30 30
Q15
Pearson Correlation .547** .304 .495** .434* 1 .759**
Sig. (2-tailed) .002 .102 .005 .017 .000
N 30 30 30 30 30 30
X3
Pearson Correlation .777** .524** .796** .756** .759** 1
Sig. (2-tailed) .000 .003 .000 .000 .000
N 30 30 30 30 30 30
**. Correlation is significant at the 0.01 level (2-tailed).
*. Correlation is significant at the 0.05 level (2-tailed).
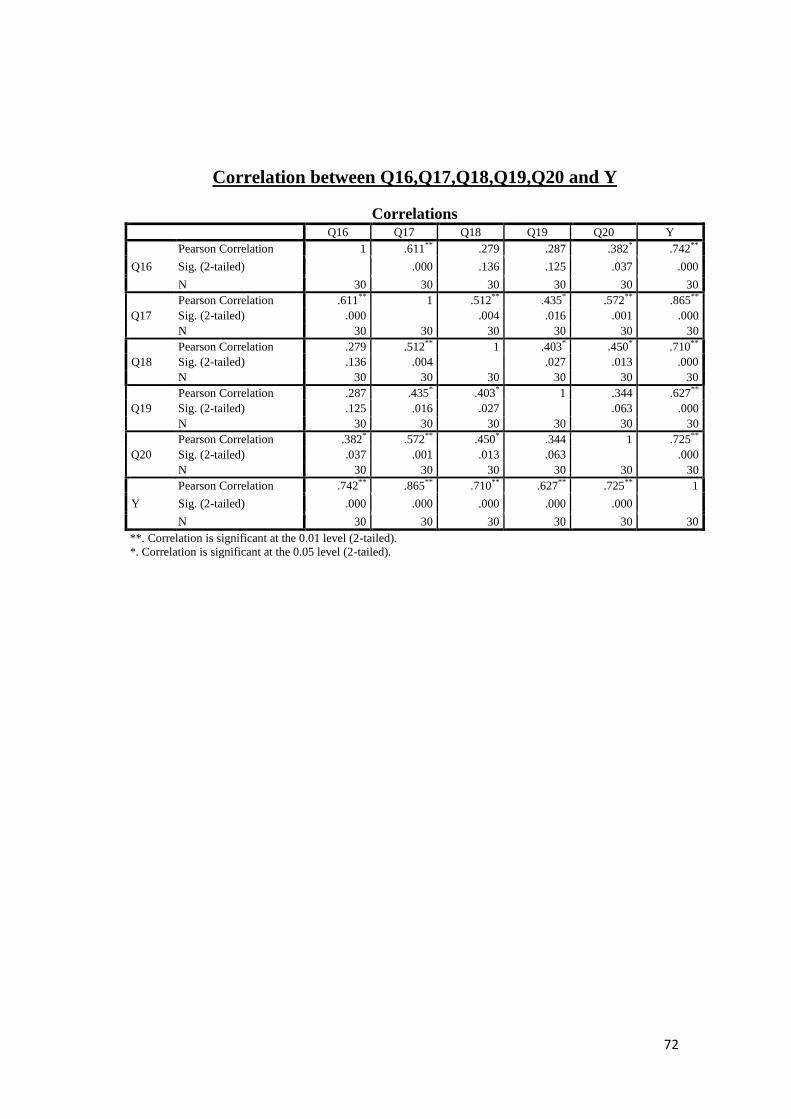
72
Correlation between Q16,Q17,Q18,Q19,Q20 and Y
Correlations Q16 Q17 Q18 Q19 Q20 Y
Q16
Pearson Correlation 1 .611** .279 .287 .382* .742**
Sig. (2-tailed) .000 .136 .125 .037 .000
N 30 30 30 30 30 30
Q17
Pearson Correlation .611** 1 .512** .435* .572** .865**
Sig. (2-tailed) .000 .004 .016 .001 .000
N 30 30 30 30 30 30
Q18
Pearson Correlation .279 .512** 1 .403* .450* .710**
Sig. (2-tailed) .136 .004 .027 .013 .000
N 30 30 30 30 30 30
Q19
Pearson Correlation .287 .435* .403* 1 .344 .627**
Sig. (2-tailed) .125 .016 .027 .063 .000
N 30 30 30 30 30 30
Q20
Pearson Correlation .382* .572** .450* .344 1 .725**
Sig. (2-tailed) .037 .001 .013 .063 .000
N 30 30 30 30 30 30
Y
Pearson Correlation .742** .865** .710** .627** .725** 1
Sig. (2-tailed) .000 .000 .000 .000 .000
N 30 30 30 30 30 30
**. Correlation is significant at the 0.01 level (2-tailed).
*. Correlation is significant at the 0.05 level (2-tailed).
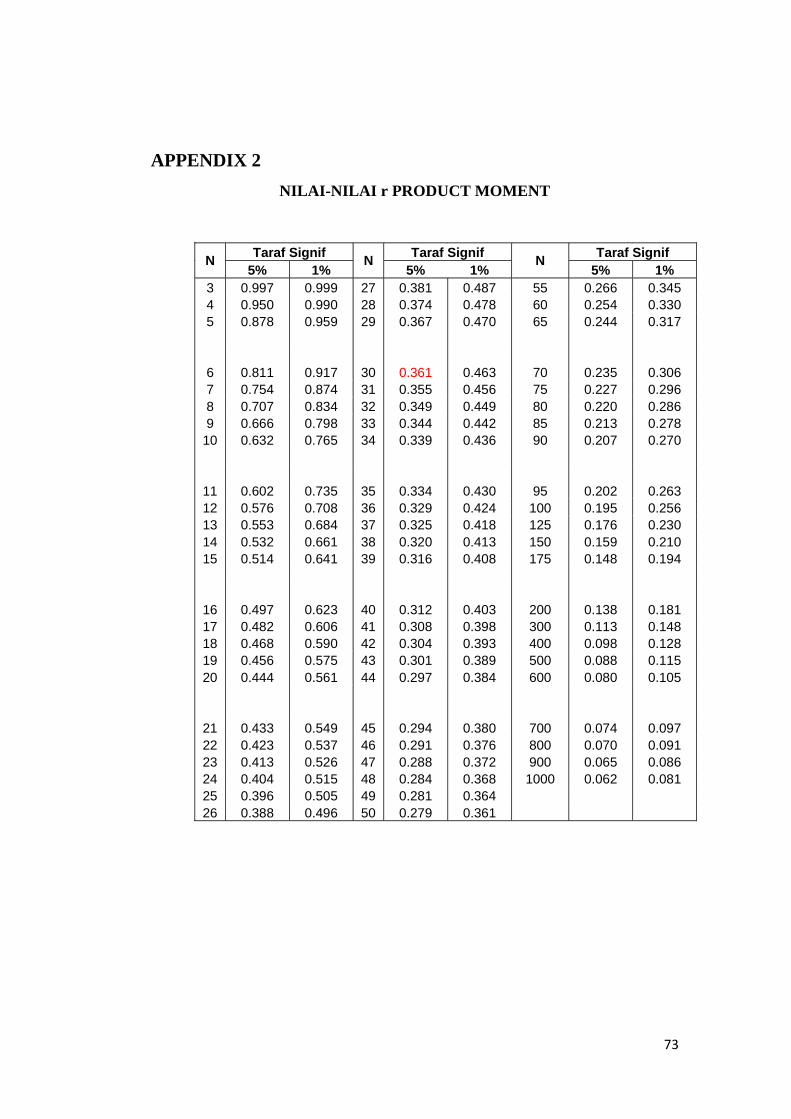
73
APPENDIX 2
NILAI-NILAI r PRODUCT MOMENT
N Taraf Signif
N Taraf Signif
N Taraf Signif
5% 1% 5% 1% 5% 1%
3 0.997 0.999 27 0.381 0.487 55 0.266 0.345
4 0.950 0.990 28 0.374 0.478 60 0.254 0.330
5 0.878 0.959 29 0.367 0.470 65 0.244 0.317
6 0.811 0.917 30 0.361 0.463 70 0.235 0.306
7 0.754 0.874 31 0.355 0.456 75 0.227 0.296
8 0.707 0.834 32 0.349 0.449 80 0.220 0.286
9 0.666 0.798 33 0.344 0.442 85 0.213 0.278
10 0.632 0.765 34 0.339 0.436 90 0.207 0.270
11 0.602 0.735 35 0.334 0.430 95 0.202 0.263
12 0.576 0.708 36 0.329 0.424 100 0.195 0.256
13 0.553 0.684 37 0.325 0.418 125 0.176 0.230
14 0.532 0.661 38 0.320 0.413 150 0.159 0.210
15 0.514 0.641 39 0.316 0.408 175 0.148 0.194
16 0.497 0.623 40 0.312 0.403 200 0.138 0.181
17 0.482 0.606 41 0.308 0.398 300 0.113 0.148
18 0.468 0.590 42 0.304 0.393 400 0.098 0.128
19 0.456 0.575 43 0.301 0.389 500 0.088 0.115
20 0.444 0.561 44 0.297 0.384 600 0.080 0.105
21 0.433 0.549 45 0.294 0.380 700 0.074 0.097
22 0.423 0.537 46 0.291 0.376 800 0.070 0.091
23 0.413 0.526 47 0.288 0.372 900 0.065 0.086
24 0.404 0.515 48 0.284 0.368 1000 0.062 0.081
25 0.396 0.505 49 0.281 0.364
26 0.388 0.496 50 0.279 0.361
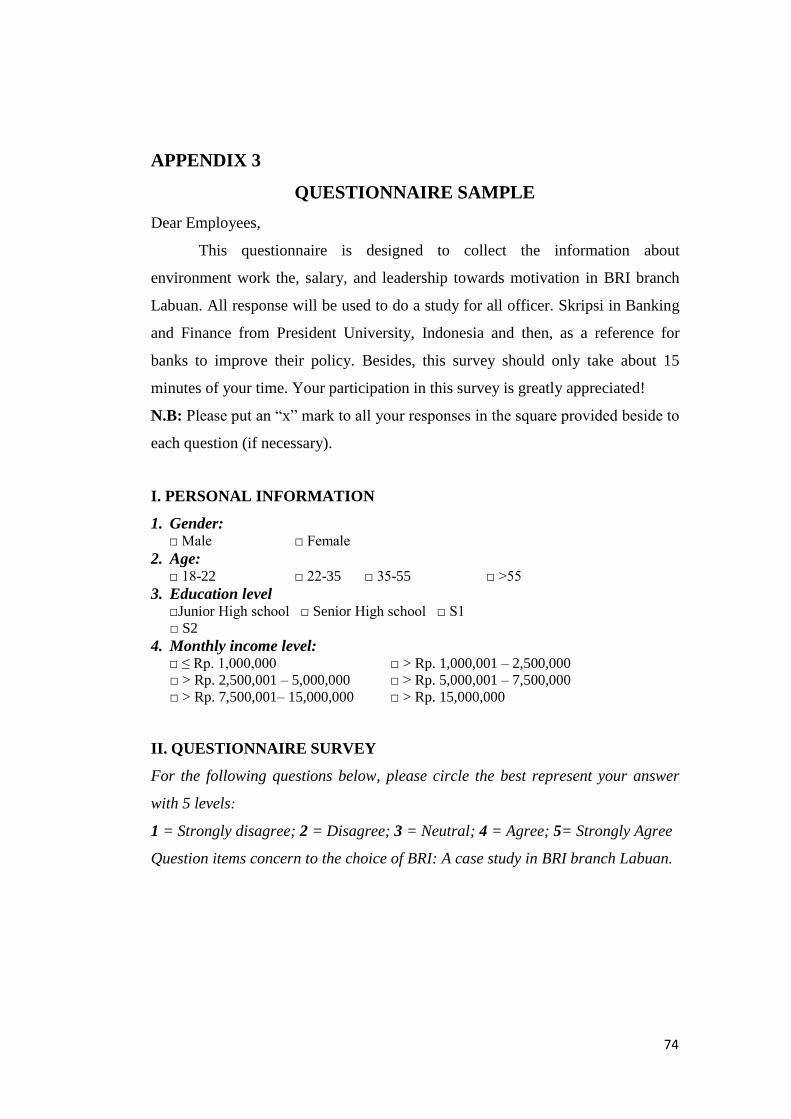
74
APPENDIX 3
QUESTIONNAIRE SAMPLE
Dear Employees,
This questionnaire is designed to collect the information about
environment work the, salary, and leadership towards motivation in BRI branch
Labuan. All response will be used to do a study for all officer. Skripsi in Banking
and Finance from President University, Indonesia and then, as a reference for
banks to improve their policy. Besides, this survey should only take about 15
minutes of your time. Your participation in this survey is greatly appreciated!
N.B: Please put an “x” mark to all your responses in the square provided beside to
each question (if necessary).
I. PERSONAL INFORMATION
1. Gender: □ Male □ Female
2. Age: □ 18-22 □ 22-35 □ 35-55 □ >55
3. Education level □Junior High school □ Senior High school □ S1
□ S2
4. Monthly income level: □ ≤ Rp. 1,000,000 □ > Rp. 1,000,001 – 2,500,000
□ > Rp. 2,500,001 – 5,000,000 □ > Rp. 5,000,001 – 7,500,000
□ > Rp. 7,500,001– 15,000,000 □ > Rp. 15,000,000
II. QUESTIONNAIRE SURVEY
For the following questions below, please circle the best represent your answer
with 5 levels:
1 = Strongly disagree; 2 = Disagree; 3 = Neutral; 4 = Agree; 5= Strongly Agree
Question items concern to the choice of BRI: A case study in BRI branch Labuan.
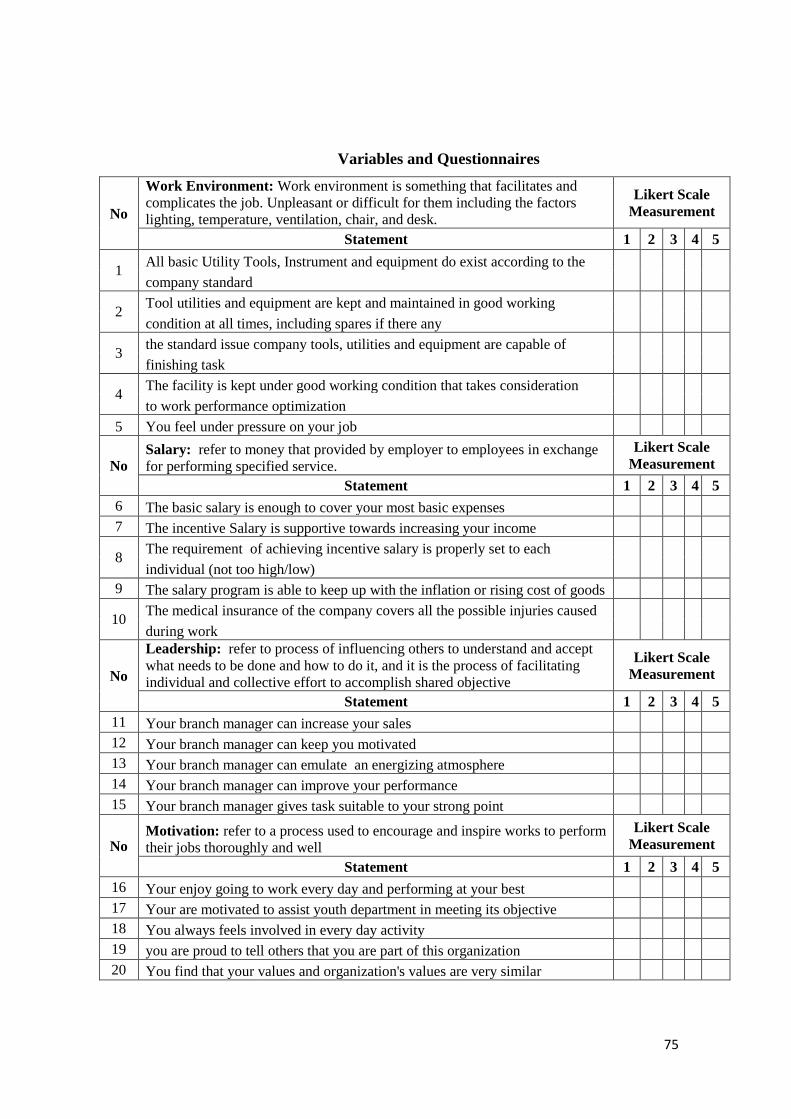
75
Variables and Questionnaires
No
Work Environment: Work environment is something that facilitates and
complicates the job. Unpleasant or difficult for them including the factors
lighting, temperature, ventilation, chair, and desk.
Likert Scale
Measurement
Statement 1 2 3 4 5
1 All basic Utility Tools, Instrument and equipment do exist according to the
company standard
2 Tool utilities and equipment are kept and maintained in good working
condition at all times, including spares if there any
3 the standard issue company tools, utilities and equipment are capable of
finishing task
4 The facility is kept under good working condition that takes consideration
to work performance optimization
5 You feel under pressure on your job
No
Salary: refer to money that provided by employer to employees in exchange
for performing specified service.
Likert Scale
Measurement
Statement 1 2 3 4 5
6 The basic salary is enough to cover your most basic expenses
7 The incentive Salary is supportive towards increasing your income
8 The requirement of achieving incentive salary is properly set to each
individual (not too high/low)
9 The salary program is able to keep up with the inflation or rising cost of goods
10 The medical insurance of the company covers all the possible injuries caused
during work
No
Leadership: refer to process of influencing others to understand and accept
what needs to be done and how to do it, and it is the process of facilitating
individual and collective effort to accomplish shared objective
Likert Scale
Measurement
Statement 1 2 3 4 5
11 Your branch manager can increase your sales
12 Your branch manager can keep you motivated
13 Your branch manager can emulate an energizing atmosphere
14 Your branch manager can improve your performance
15 Your branch manager gives task suitable to your strong point
No Motivation: refer to a process used to encourage and inspire works to perform
their jobs thoroughly and well
Likert Scale
Measurement
Statement 1 2 3 4 5
16 Your enjoy going to work every day and performing at your best
17 Your are motivated to assist youth department in meeting its objective
18 You always feels involved in every day activity
19 you are proud to tell others that you are part of this organization
20 You find that your values and organization's values are very similar

76
APPENDIX 4
RAW DATA OF QUESTIONNAIRES
Ques
tions Q1 Q2 Q3 Q4 Q5 X1 Q6 Q7 Q8 Q9 Q10 X2 Q11 Q12 Q13 Q14 Q15 X3 Q16 Q17 Q18 Q19 Q20 y
1 4 4 3 3 2 3.2 2 4 1 3 3 2.6 4 3 3 3 3 3.2 3 4 4 3 3 3.4
2 4 3 3 4 2 3.2 3 4 2 2 4 3 3 3 2 4 3 3 3 4 3 3 4 3.4
3 4 3 3 3 3 3.2 3 3 2 3 3 2.8 4 2 4 4 2 3.2 3 4 3 3 3 3.2
4 4 4 2 3 3 3.2 3 4 3 5 3 3.6 3 2 2 4 4 3 2 4 4 2 3 3
5 3 3 3 3 2 2.8 3 3 3 2 2 2.6 2 3 4 4 4 3.4 4 3 3 3 3 3.2
6 2 3 2 4 3 2.8 4 2 3 3 3 3 5 4 2 3 3 3.4 3 2 3 2 4 2.8
7 2 4 3 4 3 3.2 3 3 3 4 4 3.4 3 3 3 4 3 3.2 4 2 4 3 4 3.4
8 3 3 3 5 3 3.4 2 5 4 2 2 3 2 3 4 3 3 3 4 3 3 3 5 3.6
9 3 4 4 2 2 3 3 3 3 2 3 2.8 4 3 3 3 4 3.4 4 3 4 4 2 3.4
10 3 4 3 3 3 3.2 4 4 2 2 3 3 2 3 3 3 3 2.8 4 3 4 3 3 3.4
11 4 3 3 3 3 3.2 3 2 4 3 3 3 2 3 4 3 3 3 4 4 3 3 3 3.4
12 4 2 3 4 3 3.2 4 3 2 2 3 2.8 3 4 4 4 4 3.8 2 4 2 3 4 3
13 4 4 5 4 4 4.2 5 3 5 4 5 4.4 5 4 4 4 4 4.2 5 4 4 5 4 4.4
14 4 3 5 5 5 4.4 5 4 2 5 3 3.8 4 5 4 5 5 4.6 4 4 3 5 5 4.2
15 5 4 4 4 4 4.2 4 5 4 4 5 4.4 4 4 4 4 4 4 5 5 4 4 4 4.4
16 4 4 4 4 5 4.2 4 5 4 5 4 4.4 3 4 4 4 4 3.8 5 4 4 4 4 4.2
17 4 5 4 2 5 4 5 5 5 4 3 4.4 5 4 4 4 4 4.2 5 4 5 4 2 4
18 5 5 4 5 4 4.6 5 4 4 5 5 4.6 5 5 4 4 4 4.4 4 5 5 4 5 4.6
19 4 4 5 5 5 4.6 4 5 4 4 4 4.2 4 5 4 5 4 4.4 5 4 4 5 5 4.6
20 3 5 5 5 2 4 5 3 5 5 4 4.4 4 3 3 4 4 3.6 5 3 5 5 5 4.6
21 4 4 4 5 5 4.4 5 4 5 4 4 4.4 5 5 5 5 4 4.8 5 4 4 4 5 4.4
22 4 5 4 4 3 4 4 5 5 3 5 4.4 3 4 5 5 4 4.2 4 4 5 4 4 4.2
23 5 4 4 4 5 4.4 5 4 5 5 4 4.6 5 5 5 3 5 4.6 5 5 4 4 4 4.4
24 5 4 5 5 4 4.6 4 4 5 3 5 4.2 5 5 4 5 4 4.6 4 5 4 5 5 4.6
25 4 5 5 4 5 4.6 4 5 4 4 5 4.4 4 3 4 4 5 4 4 4 5 5 4 4.4
26 4 5 5 4 4 4.4 5 4 4 4 4 4.2 5 4 5 5 4 4.6 4 4 5 5 4 4.4
27 4 5 5 4 5 4.6 4 4 5 4 3 4 5 4 5 4 4 4.4 4 4 5 5 4 4.4
28 5 5 4 4 4 4.4 4 5 5 4 4 4.4 5 5 4 4 5 4.6 5 5 5 4 4 4.6
29 5 4 5 3 4 4.2 5 4 4 4 5 4.4 4 4 5 4 5 4.4 4 5 4 5 3 4.2
30 4 5 3 4 5 4.2 5 4 5 4 5 4.6 5 5 4 4 4 4.4 5 4 5 3 4 4.2
31 3 4 4 4 4 3.8 4 5 4 4 5 4.4 4 3 4 5 3 3.8 4 3 4 4 4 3.8
32 4 5 5 3 4 4.2 4 4 4 3 4 3.8 3 4 5 4 4 4 5 4 5 5 3 4.4
33 5 3 4 3 4 3.8 4 5 5 4 4 4.4 5 4 2 5 5 4.2 5 5 3 4 3 4
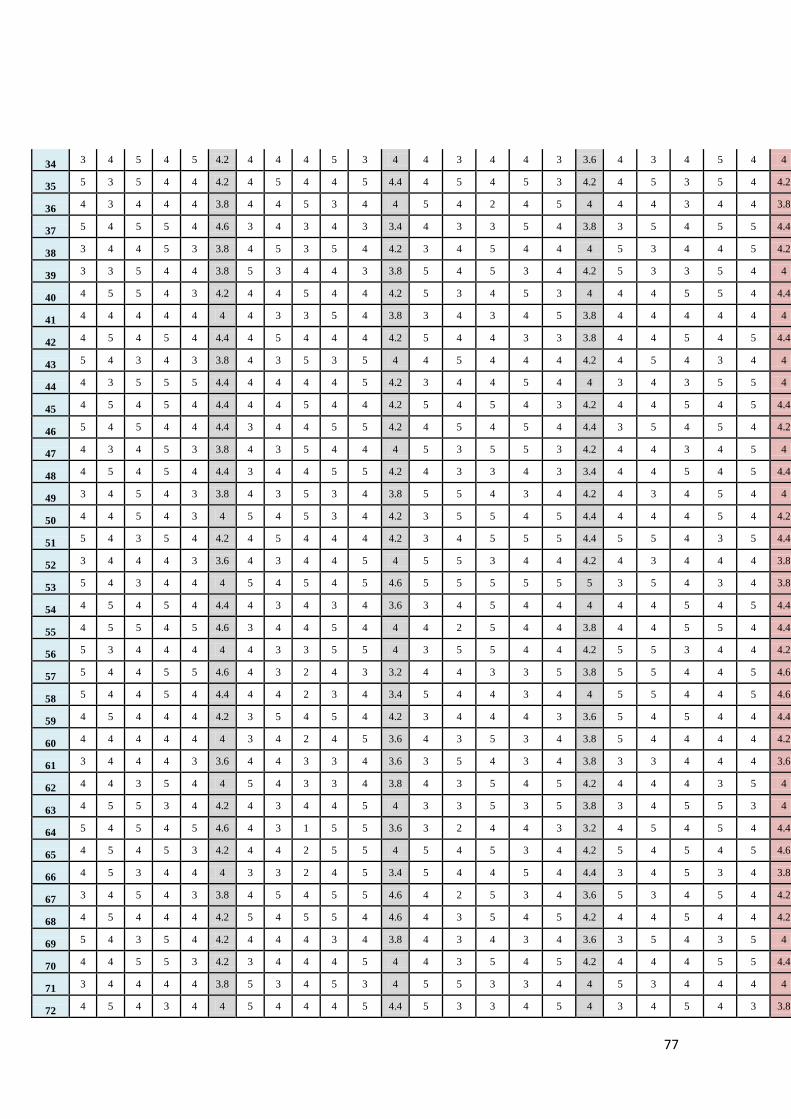
77
34 3 4 5 4 5 4.2 4 4 4 5 3 4 4 3 4 4 3 3.6 4 3 4 5 4 4
35 5 3 5 4 4 4.2 4 5 4 4 5 4.4 4 5 4 5 3 4.2 4 5 3 5 4 4.2
36 4 3 4 4 4 3.8 4 4 5 3 4 4 5 4 2 4 5 4 4 4 3 4 4 3.8
37 5 4 5 5 4 4.6 3 4 3 4 3 3.4 4 3 3 5 4 3.8 3 5 4 5 5 4.4
38 3 4 4 5 3 3.8 4 5 3 5 4 4.2 3 4 5 4 4 4 5 3 4 4 5 4.2
39 3 3 5 4 4 3.8 5 3 4 4 3 3.8 5 4 5 3 4 4.2 5 3 3 5 4 4
40 4 5 5 4 3 4.2 4 4 5 4 4 4.2 5 3 4 5 3 4 4 4 5 5 4 4.4
41 4 4 4 4 4 4 4 3 3 5 4 3.8 3 4 3 4 5 3.8 4 4 4 4 4 4
42 4 5 4 5 4 4.4 4 5 4 4 4 4.2 5 4 4 3 3 3.8 4 4 5 4 5 4.4
43 5 4 3 4 3 3.8 4 3 5 3 5 4 4 5 4 4 4 4.2 4 5 4 3 4 4
44 4 3 5 5 5 4.4 4 4 4 4 5 4.2 3 4 4 5 4 4 3 4 3 5 5 4
45 4 5 4 5 4 4.4 4 4 5 4 4 4.2 5 4 5 4 3 4.2 4 4 5 4 5 4.4
46 5 4 5 4 4 4.4 3 4 4 5 5 4.2 4 5 4 5 4 4.4 3 5 4 5 4 4.2
47 4 3 4 5 3 3.8 4 3 5 4 4 4 5 3 5 5 3 4.2 4 4 3 4 5 4
48 4 5 4 5 4 4.4 3 4 4 5 5 4.2 4 3 3 4 3 3.4 4 4 5 4 5 4.4
49 3 4 5 4 3 3.8 4 3 5 3 4 3.8 5 5 4 3 4 4.2 4 3 4 5 4 4
50 4 4 5 4 3 4 5 4 5 3 4 4.2 3 5 5 4 5 4.4 4 4 4 5 4 4.2
51 5 4 3 5 4 4.2 4 5 4 4 4 4.2 3 4 5 5 5 4.4 5 5 4 3 5 4.4
52 3 4 4 4 3 3.6 4 3 4 4 5 4 5 5 3 4 4 4.2 4 3 4 4 4 3.8
53 5 4 3 4 4 4 5 4 5 4 5 4.6 5 5 5 5 5 5 3 5 4 3 4 3.8
54 4 5 4 5 4 4.4 4 3 4 3 4 3.6 3 4 5 4 4 4 4 4 5 4 5 4.4
55 4 5 5 4 5 4.6 3 4 4 5 4 4 4 2 5 4 4 3.8 4 4 5 5 4 4.4
56 5 3 4 4 4 4 4 3 3 5 5 4 3 5 5 4 4 4.2 5 5 3 4 4 4.2
57 5 4 4 5 5 4.6 4 3 2 4 3 3.2 4 4 3 3 5 3.8 5 5 4 4 5 4.6
58 5 4 4 5 4 4.4 4 4 2 3 4 3.4 5 4 4 3 4 4 5 5 4 4 5 4.6
59 4 5 4 4 4 4.2 3 5 4 5 4 4.2 3 4 4 4 3 3.6 5 4 5 4 4 4.4
60 4 4 4 4 4 4 3 4 2 4 5 3.6 4 3 5 3 4 3.8 5 4 4 4 4 4.2
61 3 4 4 4 3 3.6 4 4 3 3 4 3.6 3 5 4 3 4 3.8 3 3 4 4 4 3.6
62 4 4 3 5 4 4 5 4 3 3 4 3.8 4 3 5 4 5 4.2 4 4 4 3 5 4
63 4 5 5 3 4 4.2 4 3 4 4 5 4 3 3 5 3 5 3.8 3 4 5 5 3 4
64 5 4 5 4 5 4.6 4 3 1 5 5 3.6 3 2 4 4 3 3.2 4 5 4 5 4 4.4
65 4 5 4 5 3 4.2 4 4 2 5 5 4 5 4 5 3 4 4.2 5 4 5 4 5 4.6
66 4 5 3 4 4 4 3 3 2 4 5 3.4 5 4 4 5 4 4.4 3 4 5 3 4 3.8
67 3 4 5 4 3 3.8 4 5 4 5 5 4.6 4 2 5 3 4 3.6 5 3 4 5 4 4.2
68 4 5 4 4 4 4.2 5 4 5 5 4 4.6 4 3 5 4 5 4.2 4 4 5 4 4 4.2
69 5 4 3 5 4 4.2 4 4 4 3 4 3.8 4 3 4 3 4 3.6 3 5 4 3 5 4
70 4 4 5 5 3 4.2 3 4 4 4 5 4 4 3 5 4 5 4.2 4 4 4 5 5 4.4
71 3 4 4 4 4 3.8 5 3 4 5 3 4 5 5 3 3 4 4 5 3 4 4 4 4
72 4 5 4 3 4 4 5 4 4 4 5 4.4 5 3 3 4 5 4 3 4 5 4 3 3.8
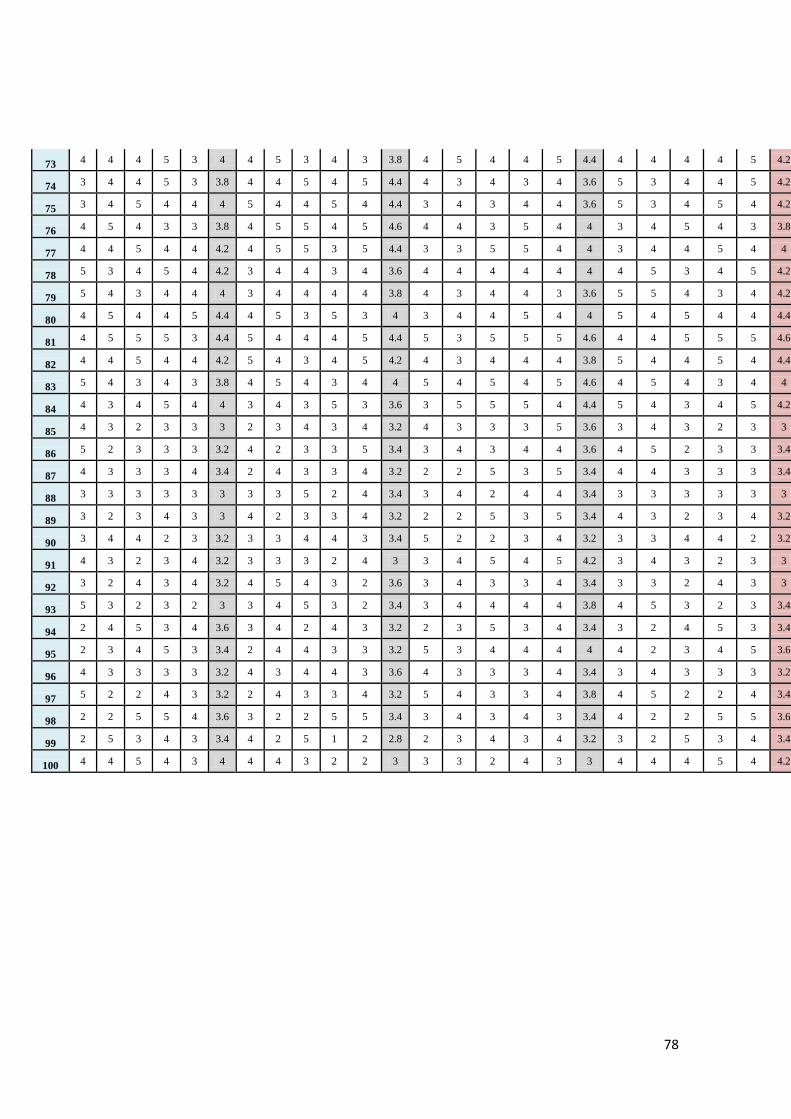
78
73 4 4 4 5 3 4 4 5 3 4 3 3.8 4 5 4 4 5 4.4 4 4 4 4 5 4.2
74 3 4 4 5 3 3.8 4 4 5 4 5 4.4 4 3 4 3 4 3.6 5 3 4 4 5 4.2
75 3 4 5 4 4 4 5 4 4 5 4 4.4 3 4 3 4 4 3.6 5 3 4 5 4 4.2
76 4 5 4 3 3 3.8 4 5 5 4 5 4.6 4 4 3 5 4 4 3 4 5 4 3 3.8
77 4 4 5 4 4 4.2 4 5 5 3 5 4.4 3 3 5 5 4 4 3 4 4 5 4 4
78 5 3 4 5 4 4.2 3 4 4 3 4 3.6 4 4 4 4 4 4 4 5 3 4 5 4.2
79 5 4 3 4 4 4 3 4 4 4 4 3.8 4 3 4 4 3 3.6 5 5 4 3 4 4.2
80 4 5 4 4 5 4.4 4 5 3 5 3 4 3 4 4 5 4 4 5 4 5 4 4 4.4
81 4 5 5 5 3 4.4 5 4 4 4 5 4.4 5 3 5 5 5 4.6 4 4 5 5 5 4.6
82 4 4 5 4 4 4.2 5 4 3 4 5 4.2 4 3 4 4 4 3.8 5 4 4 5 4 4.4
83 5 4 3 4 3 3.8 4 5 4 3 4 4 5 4 5 4 5 4.6 4 5 4 3 4 4
84 4 3 4 5 4 4 3 4 3 5 3 3.6 3 5 5 5 4 4.4 5 4 3 4 5 4.2
85 4 3 2 3 3 3 2 3 4 3 4 3.2 4 3 3 3 5 3.6 3 4 3 2 3 3
86 5 2 3 3 3 3.2 4 2 3 3 5 3.4 3 4 3 4 4 3.6 4 5 2 3 3 3.4
87 4 3 3 3 4 3.4 2 4 3 3 4 3.2 2 2 5 3 5 3.4 4 4 3 3 3 3.4
88 3 3 3 3 3 3 3 3 5 2 4 3.4 3 4 2 4 4 3.4 3 3 3 3 3 3
89 3 2 3 4 3 3 4 2 3 3 4 3.2 2 2 5 3 5 3.4 4 3 2 3 4 3.2
90 3 4 4 2 3 3.2 3 3 4 4 3 3.4 5 2 2 3 4 3.2 3 3 4 4 2 3.2
91 4 3 2 3 4 3.2 3 3 3 2 4 3 3 4 5 4 5 4.2 3 4 3 2 3 3
92 3 2 4 3 4 3.2 4 5 4 3 2 3.6 3 4 3 3 4 3.4 3 3 2 4 3 3
93 5 3 2 3 2 3 3 4 5 3 2 3.4 3 4 4 4 4 3.8 4 5 3 2 3 3.4
94 2 4 5 3 4 3.6 3 4 2 4 3 3.2 2 3 5 3 4 3.4 3 2 4 5 3 3.4
95 2 3 4 5 3 3.4 2 4 4 3 3 3.2 5 3 4 4 4 4 4 2 3 4 5 3.6
96 4 3 3 3 3 3.2 4 3 4 4 3 3.6 4 3 3 3 4 3.4 3 4 3 3 3 3.2
97 5 2 2 4 3 3.2 2 4 3 3 4 3.2 5 4 3 3 4 3.8 4 5 2 2 4 3.4
98 2 2 5 5 4 3.6 3 2 2 5 5 3.4 3 4 3 4 3 3.4 4 2 2 5 5 3.6
99 2 5 3 4 3 3.4 4 2 5 1 2 2.8 2 3 4 3 4 3.2 3 2 5 3 4 3.4
100 4 4 5 4 3 4 4 4 3 2 2 3 3 3 2 4 3 3 4 4 4 5 4 4.2

79