the irresistible rise of the craft brewing sector in italy...
TRANSCRIPT

________________________________________________________________________________________________
________________________________________________________________________________________________
The irresistible rise of the craft brewing sector in Italy:
can we explain it?
(draft version)
Matteo Fastigi1, Roberto Esposti1, Francesco Orazi1, Elena Viganò2,
1 Department of Economics and Social Sciences, Marche Polytechnic University, Ancona, Italy
2 Department of Economics, Society, Politics, University of Urbino, Urbino, Italy
Paper prepared for presentation at the 4th AIEAA Conference “Innovation, productivity and growth: towards sustainable agri-food production”
11-12 June, 2015
Ancona, Italy
Summary
This research empirically investigates the emergence of craft breweries in Italy over the period 1993-2014, whose rise
has generated, in the recent years, an high number of entries in the sector.
Two different order of possible drivers can be taken into account. therefore the rise of craft brewing can be simply
interpreted as the consequence of a change in the beer market, particularly the increasing attention of consumers to the
quality of productions and their geographical origin, with the consequent differentiation and segmentation of the
market. Secondly, it can be argued tha, the rise of craft breweries in Italy shows a territorial concentration thus
indicating that also local factors may represent major drivers. Due to agglomeration economies of different nature,
areas with a specialization in food and, above all, beverages production may represent preferential territories for new
entries. The same can be argued for areas showing a strong tendency towards agricultural diversification.At the same
time, this geographical concentration may generate congestion effects (or localized diseconomies) whenever localized
entries become too many given the size of the market. The present study proposes an empirical investigation on the role
of local drivers in determining the entry into this sector of new craft breweries as well as the selection process of the
existing breweries. This investigation takes the form of an entry-exit analysis and is carried out through a sequence of
survival models.
Keywords: Craft breweries, Beer industry, Entry and exit, Survival analysis. JEL Classification codes: L11, L66, Q13.

4th AIEAA Conference – Innovation, productivity and growth Ancona, 11-12 June 2015 ________________________________________________________________________________________________
________________________________________________________________________________________________
1
The irresistible rise of craft breweries in Italy:
can we explain it?
Matteo Fastigi1, Roberto Esposti1, Francesco Orazi1, Elena Viganò2
1 Department of Economics and Social Sciences, Marche Polytechnic University, Ancona, Italy
2 Department of Economics, Society, Politics, University of Urbino, Urbino, Italy
1. INTRODUCTION
In the last decades, the beer industry has been shacked by a phenomenon called the “craft beer
revolution”, whose origin dates back in the 1970s in the United States; this new sector has met the needs of
an increasing share of consumers that, after years of standardization and mass-production, started to prefer an
old style, tastier and more full-bodied beer, realized by small producers. From the mid 1990s this market
segmentation slowly started to spread in the italian market as well, particularly surprising situation for a
country known world-wide for its wine production, certainly not for beer. And, from the mid 2000s on, both
the number of microbreweries and the popularity of craft beers boomed across the country.
This paper will try to give an answer to this question: what drivers induced this revolution in the
italian beer market? Is the phenomenon basically generated and lead by market drivers (satisfaction of new
consumers' needs, in particular) or by local factors, which may contribute to make specific areas preferential
territories for new entries (for example, agglomeration economies of different nature)?
Section 2 provides a short introduction on the evolution of beer production and consumption
worldwide. Section 3 discusses the main characteristics of craft brewing, as of as of its emergence, within the
Italian market over the last years. In particular, the section reviews the main possible drivers of entry into the
sectors and possible forces inducing selection and, eventually, market exit. These drivers are distinguished
between market forces and local/geographical factors and their role differs in affecting the entry and exit
dynamics. Section 4 presents the empirical approach here adopted to perform such entry-exit investigation. It
is a sequence of survival models whose of estimation results are then reported and discussed in section 5.
Section 6 finally draws some general concluding remarks.
2. THE EVOLUTION OF BEER PRODUCTION AND CONSUMPTION WORLDWIDE: A SHORT OVERVIEW
The origin of beer production dates back to millenniums. However, only in the last two centuries this
activity took the form of one of the major branches of the food industry. In particular, it was the industrial
revolution to boost the development of the beer sector: economies of scale together with scientific
discoveries allowed a rapid diffusion of this drink, which started to be carried over long distances without
suffering organoleptic and qualitative deterioration. Thanks to technological innovations, it became possible
to produce a bigger and bigger amount of beer and to minimize both flaws and unpleasant odours;
furthermore, the discovery of the Saccharomyces carlsbergensis yeast, in Carlsberg's laboratories (in 1883),
made possible to reproduce “lager” beers for mass production (Table 1). Not only the standardization of a
new and particular type of beer became possible, but for the first time ever the product of the fermentation
4th AIEAA Conference – Innovation, productivity and growth Ancona, 11-12 June 2015 ________________________________________________________________________________________________
________________________________________________________________________________________________
2
was a perfectly clear and transparent beer, huge revolution for those times in which beers were cloudy,
letting 'lagers' becoming soon extremely popular (Hornsey, 2003).
This event represented the start of the bottom-fermentation revolution, which “occurs at low
temperatures (33-60° Fahrenheit1) and requires 6-10 days. Because the process of making this style of beer
involved longer storage time, it came to be called 'lager', which means “storehouse” in German” (Tremblay
et al., 2005: 5). This process constantly necessitates cooled fermentation tanks, particularly difficult and
expensive to be implemented by small firms, but ideal for big firms and the achievement of economies of
scale. Therefore, technological innovations like mechanization, faster transportation networks, refrigeration,
pasteurization, improvement of storage conditions and, especially, the transition from top to bottom
fermentation, made it possible to achieve consistency in the brewing process, stability of the beer once
bottled (Gourvish, 1998) and to transport it everywhere: from 1880s on, the United States and continental
Europe “embarked on the road to industrialization (Teich, 1990)” (Poelmans et al., 2011: 16).
During the 20th century the production of beer increased enormously (Stack, 2003) and, by the end of
2013, the world beer production was about to cross the threshold of 2 millions of hectolitres. Furthermore,
despite the variety of beer styles and traditions (Table 1), the German lager beer has become the most widely
produced and consumed around the world.
Table 1: Major beer traditions (referring to particular geographic areas)
German and Czech
styles
These two countries are recognized worldwide for producing bottom-fermented beers. Styles like Lager or
Pils, usually less expensive because of the economies of scale operating in their production, have cornered
the market and have been representing the vast majority of beer consumption worldwide for decades. Other
important styles are Bock, Weizen and Kölsch, etc.;
British and
anglophone styles
These countries, in particular the United Kingdom, have preserved a passion for traditional top-fermenting
styles, called Ales (and its different versions, such as Mild, Bitter, Pale Ale and Scotch Ale). In the last years
the Campaign for Real Ale, based in England, has been successful in promoting the production and
consumption of the traditional British ale (named Real Ale), “brewed using traditional ingredients and left to
mature in the cask (container) from which it is served in the pub through a process called secondary
fermentation” (Camra, 2014);
Belgium style It's a country with an enormous variety of beer styles, mostly brewed with top-fermenting yeast, such as
Trappist beers, Abbey beers, Blanche (white beers), Saison, etc.; a limited amount of beer production is also
based in the Pajottenland region, where spontaneous-fermenting yeasts are used (e.g. Lambic, etc.).
Source: Elaboration on Cleri (2013).
Even though, during the 20th century, the Temperance Movement (that brought to the prohibition of
producing, selling and buying alcohol beverages from 1919 to 1933), the dust bowl (a severe drought in the
1930s) and grain rationing (due to the World Wars) affected seriously the production of beer in the United
States, from 1950 on the volume of its beer production rocketed and it became, by far, the uncontested world
leader in the beer industry for many decades. But, Prohibition, dust bowl and rationing conditioned
drastically the composition of beer: in fact, barley became more and more expensive and, as a consequence,
beer recipes were realized with increasing shares of corn and rice, that brought to cheaper drinks and with
less alcoholic content (Triossi, 2013). Furthermore, industrialization and mass production drastically reduced
the number of breweries, passing from several thousand of firms at the end of the 20th century to 43 in 1983
(Swaminathan, 1998).
1 From 0 to 15° Celsius.
4th AIEAA Conference – Innovation, productivity and growth Ancona, 11-12 June 2015 ________________________________________________________________________________________________
________________________________________________________________________________________________
3
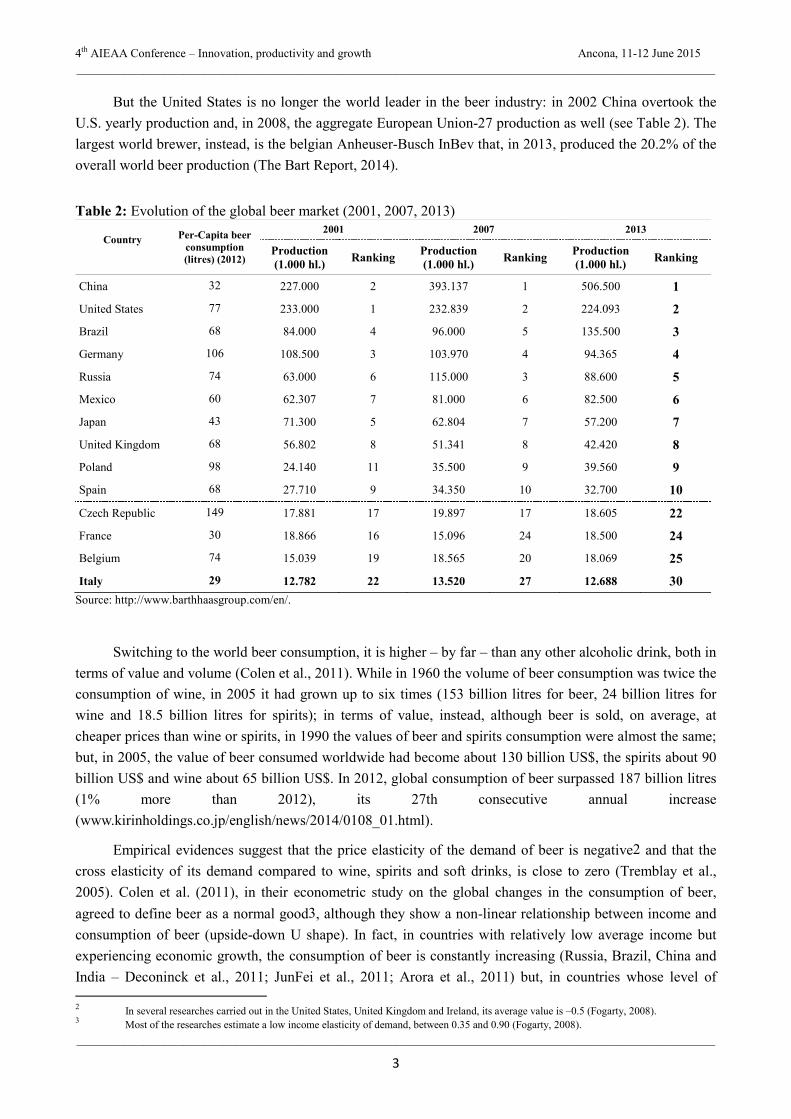
But the United States is no longer the world leader in the beer industry: in 2002 China overtook the
U.S. yearly production and, in 2008, the aggregate European Union-27 production as well (see Table 2). The
largest world brewer, instead, is the belgian Anheuser-Busch InBev that, in 2013, produced the 20.2% of the
overall world beer production (The Bart Report, 2014).
Table 2: Evolution of the global beer market (2001, 2007, 2013)
Country Per-Capita beer
consumption
(litres) (2012)
2001 2007 2013
Production
(1.000 hl.) Ranking
Production
(1.000 hl.) Ranking
Production
(1.000 hl.) Ranking
China 32 227.000 2 393.137 1 506.500 1
United States 77 233.000 1 232.839 2 224.093 2
Brazil 68 84.000 4 96.000 5 135.500 3
Germany 106 108.500 3 103.970 4 94.365 4
Russia 74 63.000 6 115.000 3 88.600 5
Mexico 60 62.307 7 81.000 6 82.500 6
Japan 43 71.300 5 62.804 7 57.200 7
United Kingdom 68 56.802 8 51.341 8 42.420 8
Poland 98 24.140 11 35.500 9 39.560 9
Spain 68 27.710 9 34.350 10 32.700 10
Czech Republic 149 17.881 17 19.897 17 18.605 22
France 30 18.866 16 15.096 24 18.500 24
Belgium 74 15.039 19 18.565 20 18.069 25
Italy 29 12.782 22 13.520 27 12.688 30
Source: http://www.barthhaasgroup.com/en/.
Switching to the world beer consumption, it is higher – by far – than any other alcoholic drink, both in
terms of value and volume (Colen et al., 2011). While in 1960 the volume of beer consumption was twice the
consumption of wine, in 2005 it had grown up to six times (153 billion litres for beer, 24 billion litres for
wine and 18.5 billion litres for spirits); in terms of value, instead, although beer is sold, on average, at
cheaper prices than wine or spirits, in 1990 the values of beer and spirits consumption were almost the same;
but, in 2005, the value of beer consumed worldwide had become about 130 billion US$, the spirits about 90
billion US$ and wine about 65 billion US$. In 2012, global consumption of beer surpassed 187 billion litres
(1% more than 2012), its 27th consecutive annual increase
(www.kirinholdings.co.jp/english/news/2014/0108_01.html).
Empirical evidences suggest that the price elasticity of the demand of beer is negative2 and that the
cross elasticity of its demand compared to wine, spirits and soft drinks, is close to zero (Tremblay et al.,
2005). Colen et al. (2011), in their econometric study on the global changes in the consumption of beer,
agreed to define beer as a normal good3, although they show a non-linear relationship between income and
consumption of beer (upside-down U shape). In fact, in countries with relatively low average income but
experiencing economic growth, the consumption of beer is constantly increasing (Russia, Brazil, China and
India – Deconinck et al., 2011; JunFei et al., 2011; Arora et al., 2011) but, in countries whose level of
2 In several researches carried out in the United States, United Kingdom and Ireland, its average value is –0.5 (Fogarty, 2008).
3 Most of the researches estimate a low income elasticity of demand, between 0.35 and 0.90 (Fogarty, 2008).

4th AIEAA Conference – Innovation, productivity and growth Ancona, 11-12 June 2015 ________________________________________________________________________________________________
________________________________________________________________________________________________
4
individual income is already over 29,000 international dollars, per-capita beer consumption is decreasing.
Furthermore, the econometric research showed, for countries with a strong beer tradition (such as Belgium,
Germany, Czech Republic and United Kingdom), a significant negative correlation between the level of
openness to international trade and the share of beer consumption (calculated over the total of alcoholic
consumption), whereas the opposite is happening for countries traditionally wine (Italy, Spain, France) or
spirits (Russia) consumers.
These results are consistent with Aizenman et al. (2008), Bentzen et al. (2010) and Leifman (2001),
according to which economic integration and globalization have caused a convergence in alcoholic
consumption patterns (Table 3).
Table 3: Share of beer, wine and other spirits in total alcoholic consumption (in litres of pure alcohol)1
Country
1961 2000 2010
Beer Wine Oth.
spirits Beer Wine
Oth.
spirits Beer Wine
Oth.
spirits
Polonia 27,66 12,24 60,10 49,29 21,19 29,52 55,14 9,35 35,51
Germany 57,14 17,32 25,54 55,46 24,63 19,91 53,61 27,83 18,55
Czech Republic 69,01 19,05 11,94 56,58 13,84 29,58 53,51 20,48 26,00
United States 47,05 11,15 41,79 56,27 14,25 29,48 50,00 17,29 32,71
Spain 11,04 65,39 23,58 37,68 37,05 25,27 49,74 20,12 28,19
Belgium 71,28 15,06 13,67 57,26 35,62 7,03 49,10 36,33 14,38
Russia 14,61 17,14 68,26 21,44 6,92 71,64 37,59 11,42 50,99
United Kingdom 80,95 4,32 14,73 49,26 25,97 18,37 36,94 33,82 21,83
Italy 2,08 89,60 8,26 17,71 76,24 6,05 22,95 65,57 11,48
France 11,25 74,41 14,33 15,26 63,02 19,88 18,80 56,41 23,08
Polonia 27,66 12,24 60,10 49,29 21,19 29,52 55,14 9,35 35,51
Source: Elaboration on Colen et al. (2011), World Health Organization (http://apps.who.int/gho/data/node.main.A1022?lang=en&showonly=GISAH). 1 The entries in bold indicate which beverage has the highest share in total alcohol consumption.
3. THE EMERGENCE OF CRAFT BREWING IN ITALY: EVIDENCE AND POSSIBLE EXPLANATIONS
As a consequence of the rampant spread of lager beer, the drastic reduction in the number of breweries
(due to industrialization and mass production) and the increasing adjunct of cheaper grains such corn and
rice, the beer market was (and still is) cornered from light and extremely standardized beers. This is the main
reason that brought to the craft revolution, which started in the 1970s in the United States and whose aim
was the (re)discovery of traditional beer styles.
To set a common definition of craft beer is not easy and it is debated in every country. In the United
States, for example, small brewers have always tried to differentiate their products from the ones of the giant
brewers: according to the Brewers Association, craft brewer is defined as small (annual production of 7
million hl. of beer or less), independent (less than 25 percent of the craft brewery can be owned or controlled
by an alcoholic beverage industry member that is not itself a craft brewer) and traditional (a brewer that has
the majority of its total beverage alcohol volume in beers whose flavor derives from traditional or innovative
brewing ingredients and their fermentation).
In general, craft brewers reinterpret traditional beer styles (generally avoiding the use of cheaper
cereals like the ones – mainly rice and corn – used in the industry), characterizing them in a unique way as

4th AIEAA Conference – Innovation, productivity and growth Ancona, 11-12 June 2015 ________________________________________________________________________________________________
________________________________________________________________________________________________
5
well. During the last years, in fact, their ability has been to vary the quantity and variety of different hops, to
distinguish their recipes using other raw or malted cereals (wheat, spelt, oat, rye, etc.) or modifying the
recipes with the addition of fruit, spices, etc.
As a result, they usually obtain a darker, stronger and more flavorful beer (all-malt) than the beers of
mass producers which, instead, use variable shares of corn and rice (from 25% to 65%), less expensive than
barley, and their beers have less alcohol by volume, a golden colour and less flavour (Goldammer, 1999;
Tremblay et al., 2005). This is one of the reasons why price elasticity of demand for craft beers is much
lower than the one of industrial beers (Kleban et al., 2011).
Up to twenty years ago, Italy counted only very few major industrial beer producers, mainly located in
the northern east Regions which were, until the foundation of the Kingdom of Italy in 1861, under the
Kingdom of Lombardy–Venetia, crown land of the Austrian Empire.
But it's only from mid 1990s that the craft beer movement started to grow, mostly in the northern
areas. In 1995, the Legislative Decree n. 504 brought some simplifications and innovations into the complex
bureaucratic procedures which the production of beer was subjected to, and 1996 is considered the year in
which the italian craft beer sector was born. The first microbreweries had a very small productive capacity
and their beers, great innovation for those years, were neither pasteurized nor filtered. Some of the pioneers,
such as “Birrificio Italiano” and “Baladin”, are now world-renowned. According to Agostino Arioli, founder
of the “Birrificio Italiano” (in 1996), the italian craft beer sector has been the first one, in Europe, to follow
what it was happening in the United States, especially for the creativeness used into the reinvention of
traditional recipes (Manzi, 2012).
Italy has never been known as a beer-producing (or consuming) country: nevertheless, thanks to the
small productive capacity of the microbreweries (that allowed flexibility and opportunity to experiment) and
the italian artisan ability, Italy has become more and more respected from beer lovers, both in Italy and
abroad (Rosso, 2014) and now it can be recognised worldwide for new beer styles as well (Manzi, 2012; see
Table 4).
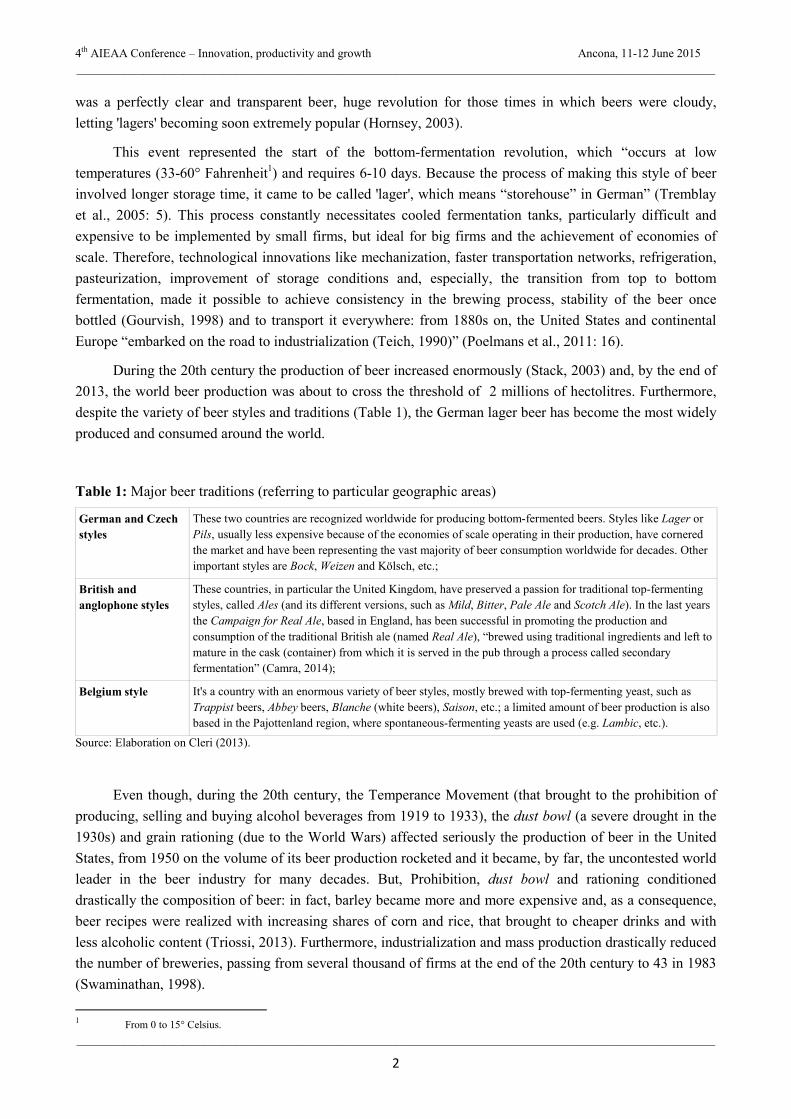
According to Assobirra, in 2013 the craft beer sector produced of 320.000 hl., equal to 2,4% of the
national total beer supply in Italy, and the number of craft breweries is increasing year after year (over 750
by the end of 2014; Figure 1).
Based on the Brewers Association's taxonomy, the italian microbreweries – whose per capita
production, for the great majority, doesn't exceed 10,000 hectolitres per year – can be categorised into four
different typologies: 1) craft brewery, whose sales are mostly realized off-site; 2) brew pub, whose turnover
chiefly comes from its bar/pub; 3) beer firm, which hires another brewery to brew its beer, or part of its beer
production; 4) agricultural craft brewery, a newness in the italian beer landscape, arised from the Ministerial
Decree n. 212/2010 which sum up a new list of goods (beer, bread, grape spirit, flour, and baker's fresh
products) to be considered related to agricultural production (with reference to beer production, at least 51%
of the raw materials used for producing it have to be produced from the agricultural firm itself – Turco,
2010). It's important to highlight that this law has opened new and potentially interesting spaces for
multifunctionality in agriculture (Van der Ploeg, 2009).
4th AIEAA Conference – Innovation, productivity and growth Ancona, 11-12 June 2015 ________________________________________________________________________________________________
________________________________________________________________________________________________
6
Figure 1: Italian microbreweries (by category; 1996–2014)
Source: Elaboration on www.microbirrifici.org.
Table 4: Italian beer styles
National styles Ingredients/Distinguishing raw materials
Beers with different cereals Spelt, rye, kamut, wheat, etc.;
Chestnut beers Different types of chestnuts, cooked or dehydrated, more or less smoked;
Beers with grape or wine Yeast of the grape peel, use of must or wort, maturation in oak barrels were wine was aged, etc.
Beers linked to the terroir Local products, mostly fruit
Source: Elaboration on Giaccone et al. (2012).
3.1. The drivers of entry
Most literature on market dynamics, therefore on firms’ entry, concentrates on the role of market
variables and signals inducing profit maximizing , or rent seeking, companies to enter a new market or sector
(Geroski, 1991). The market is new for the given firm, but the firm itself is already incumbent in other
markets. Moreover, the market is not new by itself but it is simply experiencing changes, for instance shifts
in the technological paradigm or changes in consumers’ preferences or behavior, that are increasing the
profitability of this market thus favoring the entry of new firms.
Something similar can be argued also in the case of craft breweries in Italy. In fact, as mentioned, this
market is relatively new at least for the country and most new craft breweries are new activities, that is,
without any former presence of experience in other markets. What drives entry, therefore, is not some
rationale economic and financial calculation of the profitability of the new market given observable
conditions and a detailed analysis of the competitors. It is rather the feeling, or the intuition, that deep
cultural changes in the consumers’ attitude towards food now also involves alcoholic drinking and,
consequently, the Italian beer market is now experiencing a deep and unprecedented revolution. Such
intuition, together with enthusiasm, passion and imitation, more than clearly identifiable market forces, seem
to be the key drivers of entry into the craft brewing sector in Italy. One major consequence of this is that
while, market signals expressed by changes of consumers’ preferences may maintain general validity
regardless the specific spatial context where the potential new craft breweries are located, the other drivers
are very often strongly localized and significantly affected by geographical factors. Let’s consider these two
orders of basic drivers more in detail.
As discussed, the rise of craft breweries can be simply interpreted as the consequence of a change in
the beer market in Italy, with a combination of a strongly growing demand and an increasing attention of

4th AIEAA Conference – Innovation, productivity and growth Ancona, 11-12 June 2015 ________________________________________________________________________________________________
________________________________________________________________________________________________
7
consumers to the quality of productions and their geographical origin, which has caused differentiation and
segmentation of demand in this respect. According to such interpretation, the phenomenon is basically
generated and lead by market drivers with a limited, if any, role of localized factors. Secondly, however, it
can be argued that, though rapid and intense, the rise of craft breweries in Italy might show territorial
concentrations thus indicating that local factors could represent major drivers as well. Areas with a certain
level of social capital, or specialization in food and, above all, alcoholic beverages production, may represent
preferential territories for new entries.
A significant role in the diffusion of craft breweries in Italy is the increasing attention addressed to a
pre-industrial way of production, a cultural climate that can be seen as an exogenous change in the sphere of
consumption (Garavaglia, 2010). In post-industrial societies (Bell, 1973), thanks to the improvement of life
conditions, less and less people need to struggle for existence, while it becomes more and more meaningful
to define one's own choices and one's own place in the society (Sacco et al., 2004). Persons cultivate taste
(Bourdieu, 1984) and differentiate themselves on this basis, and the ones with more economic and cultural
capital are more likely to determine/condition the taste of the society. And what makes the task of the
researcher more difficult is the omnivorous nature of modern consumers, where “in place of the traditional
high/low divide as a status marker, high status is signaled by selectively drawing on multiple cultural forms
from across the cultural hierarchy” (Johnston et al., 2010: 35).
The post-industrial consumers brings along two consequences: on the one hand, it's more and more
important their growing influence to orient businesses strategies according to their needs (Wilkinson, 2001);
on the other hand, there's a growing involvement of the consumers in the production of the desired goods,
such as, e.g., the so called craft consumer, “who typically takes any number of mass-produced products and
employs these as the 'raw materials' for the creation of a new 'product', one that is typically intended for self-
consumption” (Campbell, 2005: 27-28). The success of craft breweries may also be partially originated from
what Harvey (2004) calls an effect of postmodernity, namely the necessity of more and more people to
reaffirm an identity (individual or collective, often connected to a physical location) as defense of one's own
traditions and local peculiarities (jeopardized from global economy and homogenisation): either the sector is
able to answer to these needs, or consumers become producers themselves.
In the first case, the role of the producers is fundamental to recall a belonging to a certain terroir,
(Paxson, 2013; Trubek, 2008), creating a sense of identity telling a story about the food produced, often
based on a romantic idea of local and tradition: a form of “neolocalism”, through which reattaching people to
their local community and economy (Shortridge, 1996; Flack, 1997; Shortridge et al., 1998). Researches in
the U.S. show that consumers of craft beers look for all-malt drinks, made by small craftsmen who brew
traditionally; on the other hand, they tend to avoid beers produced by big industrial brewers or contract
brewers (the latter is either a firm that hires a brewery to produce its beer or a brewery that hires another
brewery to produce additional beer – Maytag, 1996; Wall Street Journal, 1996; Carroll et al., 2000). For
some people, there's also a sort of elitist behavior, preferring local beers instead of the ones advertised on the
media or sold at a long distance (Schnell et al., 2003; Pratt, 2007).
What consumers see and believe can influence their decisions about which goods to purchase or not:
some researches (Allison et al., 1964; Lee et al., 2006; Galizzi et al., 2009; Garavaglia, 2010), in fact,
showed that consumers, e.g., are not able to identify their favorite drinks when drinking from nude bottles. In
the second case, it's the direct participation in the production process of the consumers to make this
phenomenon original. Until few decades ago, people's identities were mostly shaped and defined through the
work that person was doing, but in a society in which most of the people don't produce goods but knowledge,
information and services, persons shape themselves not only by purchasing goods (Halter, 2000), but also

4th AIEAA Conference – Innovation, productivity and growth Ancona, 11-12 June 2015 ________________________________________________________________________________________________
________________________________________________________________________________________________
8
producing them during their leisure (productive leisure). It's a more substantial approach than the act of
consuming, since more and more during their leisure, than on their workplace, people define their identity
and their place in the society. Production has become less important for the society, but more and more
important at personal level (De Solier, 2013). Furthermore, productive leisure can be seen as a fundamental
trial period in which someone, with no pressure and for fun, can test handcrafted skills that, in the future,
might turn into a business venture.
Moving to the role of local influence and geographical factors, it is worth noticing that in economic
and sociological literature it is well established the idea that the whole Italian industrialization process has
been mostly based on the success of localized systems of small and medium enterprises in semi-peripheral
areas rather than on fordist factories (Bagnasco, 1988; Becattini, 1979; Trigilia, 2005). The “local”, intended
as both institutional, social and cultural context, can positively contribute to create value and economic
development (Carboni, 2009), and this concept is deeply linked to a central theoretical framework on local
development: the embeddedness, namely the idea that production, distribution and consumption of goods are
constrained by non-economic institutions, like culture, social conventions and values of a certain place. As a
consequence, both the economy and economic actions are embedded in social relations (Granovetter, 1973;
1985), relations which condition economic behaviors and impose restrictions upon the extension of the
market. (Magatti, 2002).
It's a process that emerges from specific historical, economic and cultural conditions of a certain
localized social structure, and for this reason it's been called social construction of the market (Bagnasco,
1988). It's also important to highlight that the concept of embeddedness can be interpreted in different ways.
In Polanyi (1968), e.g., the approach is different: the economy is embedded in both non-economic (political
and cultural) and economic institutions, but social relations are ancillary to the economic ones (Laville et al.,
1999). In this view, the economic sphere conserves a relative autonomy which, in turn, influence the
evolution of social relations. According to Polanyi, the rise of the craft beer sector might derive from
exogenous market drivers with a limited, if any, role of localized factors. Passion for beer doesn't arise from
local traditions, that in Italy doesn't exist, but from consumer's aesthetic and taste.
3.2. Market dynamics and the sector’s life cycle: the drivers of exit
The rapid rise and the evolution of the craft brewing sector in Italy, however, can not be only
represented by the increasing entries in the sector. As for any other sector, its lifecycle is a combination of
new entries and of a selection process on the incumbent producers. Though we may conclude, looking at data
(Figure 1), that sector is still in is explosive stage, more recent years also signal an increasing rate of
turnover, that is, while entries still increase, we also observed an increasing number of exits (Figure 2). The
literature discussing the forces underlying this selection process, that is inducing some incumbent firms to
exit the market, often proposes the analogy between market and natural selection (Geroski, 1991).
Eventually, this analogy expresses that exit the market is somehow a failure to survive within the market and,
as in natural habitats, this occurs for some non-favorable combination of individual (or idiosyncratic)
characteristics (of the brewery, in the present case) and of the environment (here the local context and the
beer market).
The local environment can be relevant for survival in both directions. In particular, the presence of
other craft breweries or, more generally, of other activities related to alcoholic drink production may prevent
or facilitate exit, ceteris paribus. In the former case, the presence of localized agglomeration economies may
improve the competitiveness (thus, the fitness) of an individual production unit. In the latter case, in fact,
these external economies are negative and reduce the fitness of individual breweries as expression of

4th AIEAA Conference – Innovation, productivity and growth Ancona, 11-12 June 2015 ________________________________________________________________________________________________
________________________________________________________________________________________________
9
congestion effects. This localized economies are related to the positive or negative externalities of entries
that may, at the same time, improve quantity and quality of the workforce, of agricultural raw material,
technology and the local market size or crowd out them (“too much entry”; Geroski, 1991) .
The impact of these factors on market exit, however, depends on the specific characteristics of the
brewery that define its fitness in the given local and market environment. In this respect, of major relevance
in this respect is the production mix, that is the number and quality of difference beers produced by the
brewery, as well its cost competiveness as indicated by plant size, technology, quality of production factors
(particularly labor force), quality of the commercial network and entrepreneurial skills in turn indicated by
some proxies like the age, the experience, the education level of the entrepreneur.
Figure 2: Entries and exits in the Italian craft brewing (1996–2014)
4. THE EMPIRICAL MODELS
In social sciences, duration models (also known as event history analysis) supply information on the
causes behind a transition between two states (e.g., the transition for a person between a single status to a
married one, or for a firm which is initially out of the market but then it enters in it, etc.) of the units
observed within a specific time span (Knoke, 2011).
The transition is called event, the hazard that this event occurs is the dependent variable of the model
and the covariates explain their positive (or negative) effect to the event occurrence.
In this paper, for each unit of the population under investigation, both the event “entry in the market”
and the event “exit from the market” are separately analyzed, in order to understand if local factors positively
or negatively contribute to the evolution of the italian craft beer sector.
What is important to know, in these models, it is the duration (how long each observation is at-risk of
an event during the observation period for?) and the destination (does the event happen during the
observation period?).
Since the time span is arbitrarily determined, censoring problems may arise, because it's not possible
to define (or it's only partially possible) the behaviour of some observations, with consequent loss of
4th AIEAA Conference – Innovation, productivity and growth Ancona, 11-12 June 2015 ________________________________________________________________________________________________
________________________________________________________________________________________________
10
information. A way to limit this problem, in parametric and semi-parametric models, is to opt for the
likelihood estimation method.
A useful estimator to understand the life cycle of the population under observation is the Kaplan-
Meier (Kaplan et al., 1958), a non parametric analysis in which neither time-distribution assumptions nor
influence of the covariates are considered: the result of this procedure is the estimation of a “survivor
function”4 (Bontemps et al., 2013), that is the probability of a microbrewery to remain in its initial state until
time t (in other words, the probability that the event does not occur); the inverse of this function is the
“hazard rate”: it is the “propensity of an event to occur” (Knoke, 2011: 7) during the time span [t, t+1], on
condition that the event had not already occurred earlier than t, that is to say that the microbrewery is
“survived” up to t. This means that the “hazard rate” contains the information, with regard to the
microbreweries survived up to time t, about the possibility of the event to occur from t on (Blossfeld et al.,
2014).
In semi-parametric estimations, instead, only the effect of the covariates is introduced in the model,
but not the assumption on the time-distribution. The most popular version among the semi-parametric
regression models (used in this research) is the Cox proportional hazards model (Cox, 1972), which leaves
the hazard rate function unspecified (StataCorp., 2013):
(1) ( ) ( ) ( )βx jjj thth exp,0 == λλ
where, for the generic j-th observation, ( )jth is the hazard function, ( )jth0 is an unspecified function
(also called baseline hazard) because no assumption on the distributional form of the “hazard rate” is made,
λ is the scaling factor that expresses the proportionality of hazard as a linear function of the vector of
covariates jx and of their respective unknown parameters β .
The selection of this model is advisable when the main aim is to know the extent and the effect of the
covariates only, without doing exogenous assumptions. Because of this, the regression coefficients are
obtained through partial likelihood estimation: in this way, standard errors are higher than the ones of the
parametric models, but the results are more robust.
The last useful technique to estimate event history data is the one of the parametric regression models.
In fact, if socio-economic theory – or previous empirical evidences – suggests a particular distribution of the
“hazard function”, the parametric models are preferred (Knoke, 2011), and they can be either Proportional
Hazard (PH) or Accelerated Failure-Time (AFT) models.
For PH models, the only difference with the Cox proportional hazards model is that, in the parametric
model, the function ( )jth0 assumes a specific distribution (either exponential, Weibull or Gompertz),
whereas in the AFT ones, t is expressed in logarithmic form as linear function of the covariates (StataCorp.,
2013):
(2) ( ) jjj zt += βxlog
where the distributional assumption on the error term jz determines the regression model and, unlike
PH models, AFT models are robust to the omission of covariates (Keiding et al., 1997). If z has a normal
distribution, a log-normal regression model is obtained; if z has a logistic distribution, a log-logistic
regression model is obtained; exponential and Weibull distribution, instead, can be used both in the
proportional and in the acceleration form.
4 Non increasing and approaching to zero during the time interval.

4th AIEAA Conference – Innovation, productivity and growth Ancona, 11-12 June 2015 ________________________________________________________________________________________________
________________________________________________________________________________________________
11
The effect of the AFT models is to change the time scale for a factor equal to λ = exp(–xj β): if λ > 1,
the expected time of the potential occurrence of the event decreases (and the hazard rate increases), whereas
if λ < 1, the expected time increases (but the hazard rate decreases).
The models analyzed in this research are non-nested, therefore a common approach to select one
among the parametric models is to choose the one with the smallest Akaike Information Criterion (AIC)
(StataCorp., 2013).
5. DATA AND EMPIRICAL ESTIMATION
The time span under observation goes from 1993 to 2014, it is measured in yearly intervals and each
microbrewery is localized referring to its plant, and not in its legal head office (even if the two very often
correspond).
The source used to create the data-set of the italian microbreweries is the website
www.microbirrifici.org. The operating microbreweries, by the end of 2014, are 754, while those that closed
their business during the time span considered are 112, for a total amount of 866 observations.
The independent variables (or covariates) used in the econometric analysis are time-constant (the
information cannot change over time) and their sources are the following:
• the website www.microbirrifici.org;
• the ISTAT data warehouse.
These independent variables, which represent the potential drivers of the entry/exit dynamics subject
to test, are categorized into three different orders (Table 5): territorial/local (number 1, 2, 4 and 5),
geographical (number 6 and 7) and market (number 3, 8 and 9).
Table 5: Independent variables used in the econometric analysis
Variables Territorial
disaggregation Year Source
1) % employees of the beverage industry on employees of the
manufacturing industry Province 2011 Industry and services census (Istat)
2) % employees of the food industry on employees of the
manufacturing industry Province 2011 Industry and services census (Istat)
3) Unemployment rate Province 2011 Population and housing census (Istat)
4) % familiar and non familiar labour (permanent employees
only) in agriculture on population Municipality 2010 Agricultural census (Istat)
5) Number of microbreweries already active over the birth
year of the new microbrewery Province www.microbirrifici.org
6) Region dummies Region www.microbirrifici.org
7) Altimetric zone dummies (1 = Interior mountain; 2 =
Litoral mountain; 3 = Interior hill; 4 = Litoral hill; 5 = Plain) Istat
8) Type of microbrewery dummies (craft brewery, brew pub,
beer firm, agricultural craft brewery) www.microbirrifici.org
9) Birth year, year of exit from the market (if exited), number
of different beers produced, top/bottom fermenting process
adopted
www.microbirrifici.org
In this work on the craft breweries, four different censoring cases emerged: (i) with reference to the
entries in the market, it is not possible to observe the potential craft breweries which considered to enter, but

4th AIEAA Conference – Innovation, productivity and growth Ancona, 11-12 June 2015 ________________________________________________________________________________________________
________________________________________________________________________________________________
12
only those ones that actually did it in the observed time span (it's a potentially relevant censoring problem,
whose size is obviously impossible to interpret); (ii) craft breweries which entered after 1993 but are still
active at the end of 2014 (right-censoring, because the event exit will happen in a later time, after 2014); (iii)
the craft breweries that will enter in the market from January 2015 on cannot be observed as well (right-
censoring); (iv) the craft breweries entered in the market before 1993 and exited before 2014 (left-
censoring).
With respect to this last case, only two microbreweries started brewing before 1993: however, this
doesn't influence the likelihood estimation and, as shown by Rabe-Hesketh et al. (2008), “the correct
contribution to the likelihood of a left-truncated firm under delayed entry is obtained by discarding the
periods preceding 199[3]” (Bontemps et al., 2013: 423).
5.1. Analysis of the market entries
To check the potential influence that market and territorial factors could have had on the decision of
the microbreweries to enter in the market, two variables have been created: gestation, which measures – from
1993 (used as reference year) – the numbers of years needed by each microbrewery to enter in the market
(so, if a microbrewery was born in 1993, its variable gestation will count 1, whereas if it was born in 2014,
its variable gestation will count 22); entry, instead, it is a dummy whose value always equals 1 (in fact, all
the microbreweries have to be in the market in order to be able to observe them, that is why the value of this
variable cannot equal 0).
The event entry can happen only once. There are only two microbreweries which entered in the
market, exited after few years and then entered again: in this particular case, for each microbrewery the first
and the second entry were treated as two perfectly distinct observations (each observation's entrance in the
market is registered in different years and different values are ascribed to the variable gestation).
Instead, with respect to the two microbreweries whose entrance in the market happened in 1983 and
1988, according to Bontemps et al. (2013) these two observations were included in the database with the
1993 as birth year.
In the following paragraphs, the results of the estimates will be shown in this order: firstly the non
parametric model, then the semi-parametric and, last, the parametric ones.
5.1.1. Non parametric results
In Figure 3 two graphs are plotted: the Kaplan-Meier survivor function (a) and the Hazard rate
function (b).
The abscissa measures the so called gestation, or rather the years passed (counting from 1993) for the
entrance of the microbreweries in the market. In the graph a, connected with “x = 1” – value which ideally
represents the year 1993 – the microbreweries have to enter in the market yet (expressed by the value 1.00 of
the ordinate) but, at the end of the interval 1–2 (correspondent to the interval 1993–1994), few
microbreweries made appearance in the market. In fact, in “x = 2”, which is the beginning of the interval 2–3
(time span 1994–1995), the share of the variable gestation decreases and lower than 1.00 (or 100%), whose
percentage difference is equal to the share of those entered in the market in 1993, and so on.
In “x = 15” (beginning of the interval 2007–2008), only 25% of the microbreweries population already
entered in the market (that is to say that 75% of all the italian microbreweries made their appearance from
2007 on). In “x = 22”, at last, the ordinate sets to zero because all the microbreweries started their beer
business within the end of 2014.

4th AIEAA Conference – Innovation, productivity and growth Ancona, 11-12 June 2015 ________________________________________________________________________________________________
________________________________________________________________________________________________
13
The explanation gave for the graph b is the contrary of what said for the graph a. The “hazard”
connected to the entrance of new microbreweries in the market (measured in the ordinate) increases as the
value of the variable gestation (on the abscissa) increases. At the beginning only few microbreweries
produce craft beer (therefore the “hazard” of opening a microbrewery is relatively low; connected with “x=
16”, instead, the hazard rate is approximately 0.1: this means that, ideally, among the population observed
and still not operative at the beginning of the period 16 (year 2008), 10% of them have started to produce
craft beer within the time span 2008–2009. The hazard rate, as it can be easily observed, rises very quickly
approaching “x = 22”, given that the function registers the boom of the entries (therefore, the hazard rate is
relatively higher) happened in the craft beer sector in the last few years.
Figure 3: Kaplan-Meier survivor function (left) and Hazard rate function (right)
5.1.2. A comparison between semi-parametric and parametric results
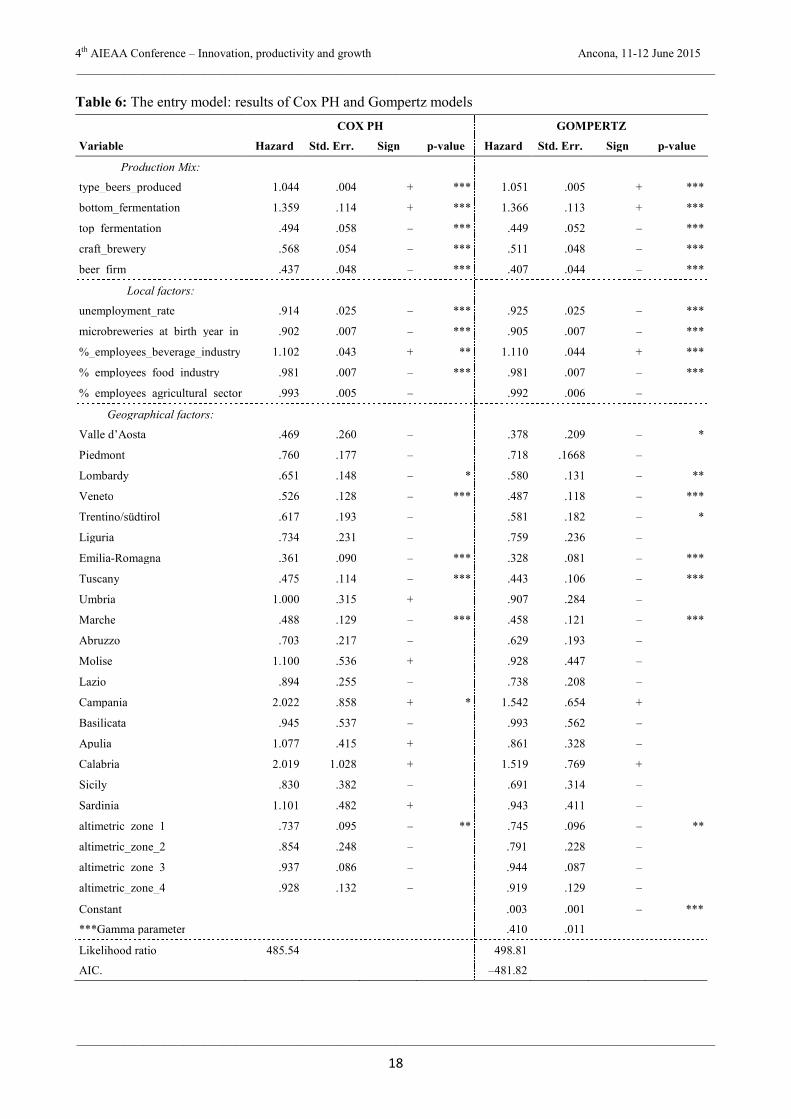
The models presented in the Table 6 are the Cox Proportional Hazards and the Gompertz. The latter
was chosen, among the parametric models (both PH and AFT), because its Akaike information criterion was
the lowest.
For each variable of each models, firstly the “hazard rate” is shown (if it is higher than 1 it means that
the correspondent variable increases the hazard rate, whereas if it lower than 1, it decreases the hazard rate),
the “sign” (“+” if the effect is positive, or rather the hazard raises, and “–” if the effect is negative, that is the
hazard reduces) and the “p-value” (one star means a significance level between 10% and 5%, two stars a
significance level between 5% and 1% and three stars a significance level lower than 1%, that is that variable
is highly statistically significant.
In both models the same variables are simultaneously statistically significant: this is a positive aspect
given that to obtain almost identical estimates, through different models, it reveals the reliability of the
estimates themselves.
The Gompertz model was preferred to the other parametric models because its A.I.C. value was the
lowest; also, Gompertz distribution is the one which better adapts to an increasing hazard function.
The variables that negatively influence the hazard rate (in other words, those reducing the propensity
of the microbreweries still out of the market to enter into it) are the unemployment rate of the Province
where the microbrewery is located, the number of microbreweries already in the market (in the same
Province) during the year of the launch of the new microbrewery, the share of employees in the food industry
on those of the manufacturing industry in the Province of the microbrewery, the dummies top-fermentation

4th AIEAA Conference – Innovation, productivity and growth Ancona, 11-12 June 2015 ________________________________________________________________________________________________
________________________________________________________________________________________________
14
and typologies of microbrewery, few Regions (Lombardy, Veneto, Emilia-Romagna, Tuscany and Marche)
and the altimetric zone 1, correspondent to the interior mountain.
Instead, the variables that positively influence the hazard rate are the share of employees in the
beverage industry on those of the manufacturing industry in the Province of the microbrewery, the number of
different beers produced and the bottom-fermentation dummy.
5.2. Analysis of the selection process: market exits
To assess the propensity of the microbreweries, once entered in the market, to survive, and to
understand if territorial and market factors can affect on this strategic decision, it was necessary to create two
new variables: the first, called life, is the duration variable and it shows how long each microbrewery (has)
remained on the market for; the second, exit, is a dummy which take the value 0 if the microbrewery is still
on the market by the end of 2014, or 1 if the production of beer ceased within 2014.
The event exit can happen only once. As in the previous case, in the two cases in which a
microbrewery entered, exited from the market and started its production again, each microbrewery generated
two different observations (the first, which entered and then exited and, the second, which entered again in
the market5.
5.2.1. Non parametric results
Symmetrically to what done for the analysis of the entrance in the market, in Figure 4 the Kaplan-
Meier survivor function (a) and the Hazard rate function (b) are shown.
The abscissa measures the duration variable (life), that is the number of years that the observed
microbreweries, after having entered, have remained on the market (or rather the age of the microbreweries),
with a smallest value of “x = 1” for the ones whose activity lasted one year only, and a maximum of “x = 21”
(there is only one microbrewery born in 1994 and still open). The ordinate, instead, measures the percentage
of microbreweries remaining on the market as the age grows. The value of the ordinate goes from 0 to 1, or
rather from 0% to 100%.
The Kaplan-Meier survivor function (a) shows that in “x = 1” the value of the ordinate is 1 (because
all the microbreweries lasted one year), in “x = 2” the value of the ordinate decreases because the share of
those microbreweries which survived one year only is deducted; from “x = 16” on, the value of the ordinate
is around 0.6 (or 60%). This means that, among the microbreweries entered in the market in the time span
1993–2014 (and whose vast majority, to this day, is composed of very young producers), the probability that
they will continue to produce beer for 15 years (at least) is higher than 60%.
The hazard rate function (b), instead, measures the hazard related to the exit of the producers from the
market (on the ordinate): it increases initially, then decreases and it slightly increases and decreases again
after the tenth year. Since the numbers of older craft beer producers is limited (only 81 of them are between
11 and 21 years old and 26 only are 15 years old or older), the hazard function is not estimated anymore after
the fourteenth year.
The hazard rate function is always very small though and it estimates, on the basis of the current
market scenario, a prediction about the ability to survive of the microbreweries still open, particularly
interesting for the majority of them, which started their beer production in the recent years.
5 Both the microbreweries that started again their production of beer, they are still on the market by the end of 2014.

4th AIEAA Conference – Innovation, productivity and growth Ancona, 11-12 June 2015 ________________________________________________________________________________________________
________________________________________________________________________________________________
15
Figure 4: Kaplan-Meier survivor function (left) and Hazard rate function (right)
5.2.2. A comparison between semi-parametric and parametric results
The models presented in the Table 7 are the Cox Proportional Hazards and the Log-normal. The latter
was chosen, among the parametric models (both PH and AFT), because its Akaike information criterion was
the lowest.
With regards to the Cox Proportional Hazards model only, for each variable, the “hazard rate”, the
“sign” and the “p-value” are shown. For the Log-normal one, instead, of each variable the “coefficient” (and
not its hazard rate) and the “p-value” are shown.
As it is possible to see in Table 7, even if with few slight differences, in both models the same
variables are simultaneously statistically significant: as in the previous estimation, this is considered a
positive aspect.
The Log-normal model was preferred to the other parametric models because its A.I.C. value was the
lowest and its distribution is the one which better adapts to a firstly increasing and then decreasing hazard
function. Peculiarity of the Log-normal model is that it is not shown the hazard rate, for each variable, but
the coefficient6.
The variables that negatively influence the hazard rate (in other words, those reducing the propensity
of the microbreweries to exit from the market) are the number of microbreweries already in the market (in
the same Province) during the year of the launch of the new microbrewery, the different typologies of beer
produced and the dummy of the agricoltural craft brewery.
Instead, the variables that positively influence the hazard rate are the share of employees in the
agricultural sector on the population of the municipality and the Regions Piedmont, Lombardy, Emilia-
Romagna, Umbria, Abruzzo, Apulia and Sicily.
6 See tab. 6.2, function number six; this function is not written in the exponential form, therefore the influence of the coefficients on the
hazard rate (either they increase or decrease it) is not in terms of greater or lower than 1, but greater or lower than 0. For each variable, the greater is the value of the coefficient, the lower is its hazard rate (Cameron e Trivedi, 2005).

4th AIEAA Conference – Innovation, productivity and growth Ancona, 11-12 June 2015 ________________________________________________________________________________________________
________________________________________________________________________________________________
16
6. CONCLUDING REMARKS
The results of the entry/exit analysis show which territorial and market factor affect the
microbreweries' strategic decisions. The sole variables resulting highly significant in both the specifications
(entry and exit) are the number of the craft beer producers in the same province during the birth year of the
new producer and the different types of beer produced by each microbrewery.
With respect to the number of producers, the result may indicate that emerging in a competitive
territory, where there are already several beer producers, it is more difficult, therefore the decision to enter in
the market should be more elaborate and complex than for the others located in less crowded places. But, on
the other hand, those which finally enter and survive in a competitive environment run a lower risk of closing
their business in the future. Not only though: the fact that many microbreweries live in a territory may
indicate a favourable cultural and socio-economic basis (milieu), where a prior unfulfilled demand of local
and high quality goods/drinks is now satisfied thanks to the production of craft beer.
Regarding the number of different types of beer produced, higher it is lower is the chance to exit from
the market, because it shows a solid business structure (often this is the outcome of a relatively long history
of craft beer production): these characteristics are positively correlated to the economic performance, which
increases the probability of surviving (Dunne et al., 1988).
Symmetrically, people considering to start producing craft beer should have a good business plan, to
know in which distribution channels to sell their beers and clear ideas on the beer styles and the different
types of beer to produce: all this could be a good strategy to ease their entrance.
But this might also be expression of an informed and highbrow consumer, who orient the firms' supply
and the number of goods they produce.
Other variables, instead, have effect either on the entrance or on the exit solely.
Regarding those variables that reduce the propensity to enter in the market, the unemployment rate
might point out that, in provinces where it is particularly high, the local market could be economically
“depressed” and not appropriate for selling craft beers, typically more expensive than industrial beers and
also than wine of decent/medium quality.
The negative influence of the share of the employees in the food industry (on the employees of the
manufacturing industry) might stand for a vocation of that province as an industrial food producer, so less
“interested” in the artisan production of food. Regarding the rural degree of a territory, what the estimates
show is that rural areas don't have a positive correlation with the spread of the craft beer production: this
might come from a relatively higher age of the population living in those areas that, together with the italian
historical inclination to produce wine, make the craft beer business (and the often unknown opportunity to
diversify the farm production through the cultivation of cereals and the following production of beer) not
attractive.
Where, instead, there are economic activities connected to the beverage industry, agglomeration
economies could arise, as in the case of wine producers that, interested in the success of the craft beer sector,
have decided to start producing beer as well, though choosing the beer firm typology. In this particular
situation, a clear advantage consists both in using already well-established distribution channels and in
avoiding the investment in the brewing plant.
As for the variables referring to the production techniques, the top-fermenting procedure shows a
negative influence on the decision of entering in the market, probably because it is more and more
recognised in the collective consciousness as the way of production more directly ascribable to the craft beer
philosophy, and the most used from the producers: therefore, the adoption of this technique might put the
new potential incoming in a even stronger competition with the others. That's why, to the contrary, the

4th AIEAA Conference – Innovation, productivity and growth Ancona, 11-12 June 2015 ________________________________________________________________________________________________
________________________________________________________________________________________________
17
bottom-fermenting process has a positive effect on the decision to enter, being a relatively less used
technique from the microbrewers yet.
Referring to the the different possible typologies of microbrewery, being an agricultural craft brewery
reduces the risk to exit from the market (it's the typology which registered the lowest number of exits: from
2010 to 2014, only 1 on 73 ended its beer production): even if this figure has been legislatively created at the
end of 2010, the data is surprising though.
As for the Regions, Lombardy, Emilia-Romagna, Tuscany, Piedmont and Umbria7 registered
relatively strong growth rates in the recent years, so becoming territories where the competition among
producers is more intense. A congestion effect in these areas might induce some producers to exit from the
market since not able to withstand a certain level of competition. Moreover, in Abruzzo, Apulia and Sicily, a
higher risk of exiting might come from socio-economic factors, but also from a poorer beer culture than the
one in northern and centre Regions, which could constitute a less appropriate milieu to start the production of
craft beer yet.
For the same reason previously explained, Lombardy, Emilia-Romagna and Tuscany (and Marche as
well, which has surprisingly registered substantial growth rate for such a modest densely populated Region,
and for an almost absolute lack of beer tradition), the propensity to enter in the market is lower because there
is already a high number of craft beer producers there.
Lastly, the negative effect of the altimetric zone 1 on the decision to enter in the market, may mean
that those territories are isolated and it is more unlikely to start a business there.
7 Considering the per capita craft breweries, the entrances are considerably high.
4th AIEAA Conference – Innovation, productivity and growth Ancona, 11-12 June 2015 ________________________________________________________________________________________________
________________________________________________________________________________________________
18
Table 6: The entry model: results of Cox PH and Gompertz models
COX PH GOMPERTZ
Variable Hazard Std. Err. Sign p-value Hazard Std. Err. Sign p-value
Production Mix:
type_beers_produced 1.044 .004 + *** 1.051 .005 + ***
bottom_fermentation 1.359 .114 + *** 1.366 .113 + ***
top_fermentation .494 .058 – *** .449 .052 – ***
craft_brewery .568 .054 – *** .511 .048 – ***
beer_firm .437 .048 – *** .407 .044 – ***
Local factors:
unemployment_rate .914 .025 – *** .925 .025 – ***
microbreweries_at_birth_year_in .902 .007 – *** .905 .007 – ***
%_employees_beverage_industry 1.102 .043 + ** 1.110 .044 + ***
%_employees_food_industry .981 .007 – *** .981 .007 – ***
%_employees_agricultural_sector .993 .005 – .992 .006 –
Geographical factors:
Valle d’Aosta .469 .260 – .378 .209 – *
Piedmont .760 .177 – .718 .1668 –
Lombardy .651 .148 – * .580 .131 – **
Veneto .526 .128 – *** .487 .118 – ***
Trentino/südtirol .617 .193 – .581 .182 – *
Liguria .734 .231 – .759 .236 –
Emilia-Romagna .361 .090 – *** .328 .081 – ***
Tuscany .475 .114 – *** .443 .106 – ***
Umbria 1.000 .315 + .907 .284 –
Marche .488 .129 – *** .458 .121 – ***
Abruzzo .703 .217 – .629 .193 –
Molise 1.100 .536 + .928 .447 –
Lazio .894 .255 – .738 .208 –
Campania 2.022 .858 + * 1.542 .654 +
Basilicata .945 .537 – .993 .562 –
Apulia 1.077 .415 + .861 .328 –
Calabria 2.019 1.028 + 1.519 .769 +
Sicily .830 .382 – .691 .314 –
Sardinia 1.101 .482 + .943 .411 –
altimetric_zone_1 .737 .095 – ** .745 .096 – **
altimetric_zone_2 .854 .248 – .791 .228 –
altimetric_zone_3 .937 .086 – .944 .087 –
altimetric_zone_4 .928 .132 – .919 .129 –
Constant .003 .001 – ***
***Gamma parameter .410 .011
Likelihood ratio 485.54 498.81
AIC. –481.82

4th AIEAA Conference – Innovation, productivity and growth Ancona, 11-12 June 2015 ________________________________________________________________________________________________
________________________________________________________________________________________________
19
Table 7: The exit model: results of Cox PH and Log-normal models
COX PH LOG-NORMAL
Variable Hazard Std. Err. Sign p-value Coefficient Std. Err. p-value
Production Mix:
type_beers_produced .755 .029 – *** .182 .024 ***
bottom_fermentation 1.276 .301 + -.186 .1567
top_fermentation 1.248 .318 + -.156 .182
craft_brewery 1.037 .277 + -.029 .173
beer_firm .865 .334 – -.091 .221
agricultural_craft_brewery .094 .098 – ** 1.490 .569 ***
Local factors:
unemployment_rate .953 .066 – .017 .043
microbreweries_at_birth_year_in_province
.894 .035 – *** .048 .024 **
%_employees_beverage_industry .956 .094 – .057 .071
%_employees_food_industry .984 .019 – .007 .012
%_employees_agricultural_sector 1.029 .016 + * -.017 .009 *
Geographical factors:
Valle d’Aosta 0.001 0.000 – 3.182 25.594
Piedmont 7.054 5.669 + ** -1.126 .474 **
Lombardy 7.541 5.821 + *** -1.234 .456 ***
Veneto 2.360 2.014 + -.306 .499
Trentino/südtirol 3.077 2.931 + -.716 .582
Liguria 6.023 5.858 + * -.936 .602
Emilia-Romagna 10.120 8.104 + *** -1.529 .474 ***
Tuscany 5.537 4.655 + ** -1.157 .488 **
Umbria 6.523 6.235 + ** -1.099 .603 *
Marche 2.942 3.035 + -.420 .605
Abruzzo 6.690 6.440 + ** -.983 .594 *
Molise 7.801 11.394 + -1.536 .872 *
Lazio 5.596 5.724 + * -.921 .587
Campania 9.254 11.457 + * -1.159 .768
Basilicata 7.833 11.804 + -1.064 1.016
Apulia 8.721 10.232 + * -1.314 .692 *
Calabria 1.845 2.979 + -.012 .957
Sicily 25.754 34.876 + ** -1.950 .795 **
Sardinia 5.240 6.668 + -.782 .769
altimetric_zone_1 .849 .296 – .123 .234
altimetric_zone_2 0.001 0.000 – 5.645 18.506
altimetric_zone_3 1.268 .341 + -.208 .179
altimetric_zone_4 1.339 .511 + -.265 .241
Constant 2.950 .550 ***
***Sigma parameter 1.009 .073
Likelihood ratio 152.00 157.65
AIC. 623.96

4th AIEAA Conference – Innovation, productivity and growth Ancona, 11-12 June 2015 ________________________________________________________________________________________________
________________________________________________________________________________________________
20
REFERENCES
Aizenman, J. and Brooks, E. (2008). Globalization and taste convergence: The cases of wine and beer,
Review of International Economics 16: 217-233.
Allison, R. I. and Uhl, K. P. (1964). Influence of beer brand identification on taste perception, Journal of
Marketing Research 1: 36-39.
Arora, A., Bhaskar, A., Minten, B., Vandeplas, A. and Swinnen, J. F. M. (2011). Opening the Beer Gates:
How Liberalization Caused Growth in India's Beer Market. In Swinnen, J. F. M. (ed.), The Economics of
Beer. Oxford: Oxford University Press, 308-332.
Bagnasco, A. (ed.) (1988). La Costruzione Sociale del Mercato. Bologna: Il Mulino.
Becattini, G. (ed.) (1979). Dal Settore Industriale al Distretto Industriale. Alcune Considerazioni
sull'Unità di Indagine dell'Economia Industriale. Bologna: Il Mulino.
Bell, D. (ed.) (1973). The Coming of Post Industrial Society: A Venture in Social Forecasting. New York:
Basic Books.
Bentzen, J. and Smith, V. (2010). Developments in the Structure of Alcohol Consumption in OECD
Countries. Paper for the pre‐AARES conference workshop. Adelaide.
Bourdieu, P. (ed.) (1984). Distinction: A Social Critique of the Judgement of Taste. Cambridge: Harvard
University Press.
Carboni, C. (ed.) (2009). La Governance dello Sviluppo Locale. Città e Territori in Italia nell'Epoca della
Globalizzazione. Bologna: Il Mulino.
Carroll, G. R. and Swaminathan, A. (2000). Why the microbrewery movement? Organizational dynamics
of resource partitioning in the U.S., American Journal of Sociology 106: 715-762.
Cleri, C. (2013). Analisi del concetto di birra artigianale nel mercato brassicolo italiano. Tesi per il Master
in Management dell'Enogastronomia, Università degli Studi di Scienze Gastronomiche, Pollenzo.
Colen, L. and Swinnen, J. F. M. (2011). Beer-drinking nations: The determinants of global beer
consumption. In Swinnen, J. F. M. (ed.), The Economics of Beer. Oxford: Oxford University Press, 124-140.
De Solier, I. (2013). Food and the Self: Consumption, Production and Material Culture. New York:
Bloomsbury Academic.
Deconinck, K. and Swinnen, J. F. M. (2011). From vodka to baltika: A perfect storm in the Russian beer
market. In Swinnen, J. F. M. (ed.), The Economics of Beer. Oxford: Oxford University Press, 287-307.
Flack, W. (1997). American microbreweries and neolocalism: “Ale-ing” for a sense of place. Journal of
Cultural Geography 16: 37-53.
Fogarty, J. (2008). The Demand for Beer, Wine and Spirits: Insights from a Meta-Analysis Approach,
AAWE Working Paper 31.
Galizzi, M. and Garavaglia, C. (2009). Consumers' preferences and product information: Evidence from a
beer tasting experiment. Beeronomics, Conference on the economics of beer and brewing, Leuven, May 27-
30.
Garavaglia, C. (2010). Birra, identità locale e legame territoriale, Agriregionieuropa.
http://agriregionieuropa.univpm.it/content/article/31/20/birra-identita-locale-e-legame-territoriale.
Geroski, P. (1991). Market dynamics and entry. Oxford, Oxfordshire. Cambridge (UK): Blackwell
Publishers.
Giaccone, L. and Signoroni, E. (eds) (2012). Guida alle Birre d'Italia 2013. Bra: Slow Food.
Goldammerm, T. (ed.) (1999). The Brewer's Handbook. Clifton: KVP Pulishers.

4th AIEAA Conference – Innovation, productivity and growth Ancona, 11-12 June 2015 ________________________________________________________________________________________________
________________________________________________________________________________________________
21
Gourvish, T. R. (1998). Concentration, diversity and firm strategy in European brewing, 1945–90. In
Wilson, R. G. and Gourvish, T. R. (eds), The Dynamics of the International Brewing Industry since 1800.
London: Routledge, 80–92.
Granovetter, M. (1973). The strength of weak ties. American Journal of Sociology 78: 1360-1380.
Granovetter, M. (1985). Economic action and social structure: The problem of embeddedness. American
Journal of Sociology 91: 481-510.
Halter, M. (ed.) (2000). Shopping for Identity: The Marketing of Ethnicity. New York: Schocken Books.
Harvey, D. (ed.) (2004). The Condition of Postmodernity: An Enquiry into the Origins of Cultural
Change. Cambridge: Blackwell.
Hornsey, I. S. (ed.) (2003). A History of Beer and Brewing. Cambridge: The Royal Society of Chemistry.
Johnston, J. and Baumann, S. (eds) (2010). Foodies: Democracy and Distinction in the Gourmet
Foodscape, New York: Routledge.
JunFei, B., JiKun, H., Rozelle, S. and Boswell, M. (2011). Beer battles in China: The struggle over the
world's largest beer market. In Swinnen, J. F. M. (ed.), The Economics of Beer. Oxford: Oxford University
Press.
Kleban, J. and Ingeborg, N. (2011). The U.S. craft brew industry. Proceedings of the International
Academy for Case Studies 18: 33-38.
Laville, J. L. and Levesque, B. (1999). La rinascita della sociologia economica francofona. In Laville J. L.
and Mingione E., La Nuova Sociologia Economica: Prospettive Europee. Milano: Franco Angeli.
Lee, L., Frederick, S. and Ariely, D. (2006). Try it, you’ll like it: The influence of expectation,
consumption and revelation on preferences for beer. Psychological Science 17: 1054-1058.
Leifman, H. (2001). Trends in population drinking. In Norström T. (ed.), Alcohol in Post‐War Europe:
Consumption, Drinking Patterns, Consequences and Policy Responses in 15 European Countries.
Stockholm: National Institute of Public Health.
Magatti, M. (ed.) (2002). Mercato e Società: Introduzione alla Sociologia Economica. Roma: Carocci.
Manzi, T. (2012). Pionieri si nasce, non si diventa!. Fermento Birra 1: 4-6.
Maytag, F. (1996). Fritz Maytag: Anchor brewing co.. New Brewer 22.
Nelson, M. (ed.) (2005). The Barbarian's Beverage: A History of Beer in Ancient Europe. New York:
Routledge.
Papazian, C. (2013). Dirottamento birrario. Riflessioni sul concetto di birra artigianale. Fermento Birra
10: 14-16.
Patroons, W. (ed.) (1979). Bier. Antwerp: Standaard Uitgeverij.
Paxson, H. (ed.) (2013). The Life of Cheese: Crafting Food and Value in America. Berkeley: University of
California Press.
Poelmans, E. and Swinnen, J. F. M. (2011). A brief economic history of beer. In Swinnen, J. F. M. (ed.),
The Economics of Beer. Oxford: Oxford University Press.
Polanyi, K. (1968). The economy as instituted process. In LeClair, E. and Schneider, H. (eds), Economic
Anthropology. New York: Holt, Rinehart and Winston.
Pratt, J. (2007). Food values. The local and the authentic. Critique of Anthropology 27, 285-300.
Rosso G. (2014). Visti da fuori: La birra artigianale italiana, Piattoforte. http://piattoforte.tiscali.it/blog-
dautore/sottopiatto/pagina-di-dettaglio/post/birra-allitaliana.html.
Sacco, P. L. and Zarri, L. (2004). Cultura, promozione della libertà positiva e integrazione sociale.
Economia della Cultura 4: 409-507.

4th AIEAA Conference – Innovation, productivity and growth Ancona, 11-12 June 2015 ________________________________________________________________________________________________
________________________________________________________________________________________________
22
Schnell, S. M. and Reese, J. F. (2003). Microbreweries as tools of local identity. Journal of Cultural
Geography 21: 45-69.
Shortridge, J. R. (1996). Keeping tabs on Kansas: Reflections on regionally based field study. Journal of
Cultural Geography 16: 5-16.
Shortridge, B. G. and Shortridge, J. R. (eds) (1998). The Taste of American Place. Lanham: Rowman and
Littlefield.
Stack, M. (2003). A concise history of America's brewing industry. In Whaples, R. (ed.), EH.Net
Encyclopedia. http://eh.net/encyclopedia/a-concise-history-of-americas-brewing-industry.
Stigler, G. J. and Becker, G. S. (1977). De gustibus non est disputandum. The American Economic Review
67: 76-90.
Swaminathan, A. (1998). Entry into new market segments in mature industries: Endogenous and
exogenous segmentation in the U.S. brewing industry. Strategic Management Journal 19: 389-404.
Teich, M (1990). The industrialisation of brewing in Germany (1800–1914). In Aerts, E., Cullen L. M.
and Wilson R.G. (eds) (1990), Production, Marketing and Consumption of Alcoholic Beverages. Leuven:
Leuven University Press, 102-113.
Tremblay, V. J. and Tremblay, C. H. (eds) (2005). The U.S. Brewing Industry: Data and Economic
Analysis. Cambridge: MIT Press.
Trigilia, C. (ed.) (2005). Sviluppo Locale. Un Progetto per l'Italia. Roma-Bari: Laterza.
Triossi, G. (2012). All rye! Storia, pregi e difetti di un cereale tornato in voga: La segale. Fermento Birra
4: 10-13.
Triossi G. (2013). American history. Dai coloni al fenomeno artigianale: Successi e sconfitte della birra a
stelle e striscie. Fermento Birra 7: 8-12.
Trubek, A. (ed.) (2008). The Taste of Place: A Cultral Journey into Terroir. Berkeley: University of
California Press.
Turco, A. (2010). La birra diventa un prodotto agricolo. http://www.cronachedibirra.it/notizie/3102/la-
birra-diventa-un-prodotto-agricolo/.
Van der Ploeg, J. D. (ed.) (2009). The New Peasantries: Struggles for Autonomy and Sustainability in an
Era of Empire and Globalization. London: Earthscan.
Wall Street Journal (1996). Who really makes that cute little beer? You'd be surprised. April 15th.
Wilkinson, J. (2001). Dalla dittatura dell'offerta alla democrazia della domanda? Alimenti transgenici,
alimenti biologici e dinamiche della domanda nell'agroalimentare. Questione Agraria 1: 47-64.
WEBSITES
www.assobirra.it
www.brewersassociation.org
www.brewersofeurope.org
http://www.camra.org.uk/home
www.kirinholdings.co.jp/english/news/2014/0108_01.html
www.microbirrifici.org
www.barthhaasgroup.com/en/
World Health Organization. http://apps.who.int/gho/data/node.main.A1022?lang=en&showonly=GISAH