the networked sensory landscape: capturing and experiencing … · reshape presence, opening up...
TRANSCRIPT
Brian MaytonGershon Dublon*Spencer RussellEvan F. LynchDon Derek HaddadVasant RamasubramanianClement DuhartResponsive Environments GroupMIT Media Lab75 Amherst St., E14-548Cambridge, MA 02142
Glorianna DavenportLiving Observatory
Joseph A. ParadisoMIT Media Lab
Presence, Vol. 26, No. 2, Spring 2017, 182–209
doi:10.1162/PRES_a_00292
© 2017 by the Massachusetts Institute of Technology
The Networked SensoryLandscape: Capturing andExperiencing Ecological ChangeAcross Scales
Abstract
What role will ubiquitous sensing play in our understanding and experience ofecology in the future? What opportunities are created by weaving a continuouslysampling, geographically dense web of sensors into the natural environment, fromthe ground up? In this article, we explore these questions holistically, and presentour work on an environmental sensor network designed to support a diverse arrayof applications, interpretations, and artistic expressions, from primary ecologicalresearch to musical composition. Over the past four years, we have been incor-porating our ubiquitous sensing framework into the design and implementation ofa large-scale wetland restoration, creating a broad canvas for creative explorationat the landscape scale. The projects we present here span the development andwide deployment of custom sensor node hardware, novel web services for provid-ing real-time sensor data to end user applications, public-facing user interfaces foropen-ended exploration of the data, as well as more radical UI modalities, throughunmanned aerial vehicles, virtual and augmented reality, and wearable devices forsensory augmentation. From this work, we distill the Networked Sensory Landscape,a vision for the intersection of ubiquitous computing and environmental restora-tion. Sensor network technologies and novel approaches to interaction promise toreshape presence, opening up sensorial connections to ecological processes acrossspatial and temporal scales.
1 Introduction
Landscape captures the complex exchange between the world we see, theworld we make, and the world we imagine. These worlds are often in tension,and perhaps no human endeavor captures this tension more than our pursuitof technology, the most significant driver of our impact on the environment.At the same time, technology provides our primary means of understandingthe environment, preserving it, and expressing our relationship to it throughart—from cave paintings to audio recordings of melting sea ice (Helmreich,2016).
What is the role of ubiquitous sensing in the future of landscape? SinceSzewczyk et al. (2004) demonstrated the potential of wireless sensor net-works (WSNs) as research tools in habitat monitoring, systems like theirs havebeen used with increasing frequency in primary ecological research and for
*Correspondence to [email protected].
182 PRESENCE: VOLUME 26, NUMBER 2
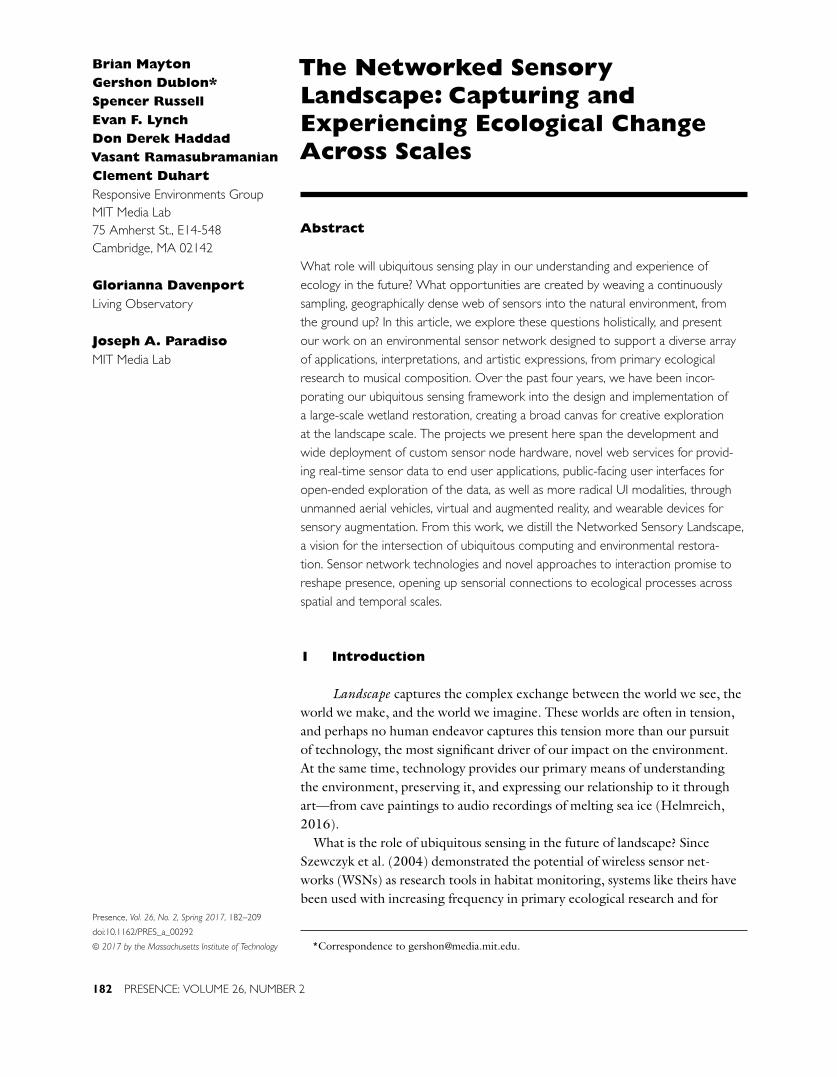
Where ubiquitous computing meets environmental restoration, new opportunities arise
but also to explore radically new forms of physical and remote presence across scales.
THE NETWORKEDSENSORY LANDSCAPE
AUGMENTED SENSESAn onsite visitor wears a headset that spatially repro -duces live sound from surrounding microphones as
-logical sensors are used to infer the wearer’s attention, which in turn modulates the virtual soundscape.
ACOUSTIC MONITORINGListeners can tune into a rich natural soundscape captured by distributed microphones
TAGGING WILDLIFEBeginning with herring, researchers are tagging wildlife with RFID to track their movements across newly connected ecosystems. Tracking data are streamed in real time.
FIBER & COPPERUnderground cables
installed during the restoration supplement the wireless infra-structure, and support dense, localized acoustic monitoring.
VIRTUAL PRESENCERemote visitors can log into a sensor-driven virtual analogue
of the physical environment to observe, explore, and
experience presence in the landscape, moving seamlesly between the current moment
and the past.
AUGMENTED REALITYWearing an AR headset, users can explore a 1/1000
scale landscape miniature with real-time visualization
dozens of microphones. Detail is increased where
PRESENCE,MAPPING, CALIBRATION An unmanned aerial vehicle can
offer 360° augmented views, map terrain, and calibrate remote
TIDMARSH SENSOR NETWORKA low-power, extensible wireless sensing platform for environmental monitoring is distributed across the landscape.
Illustration by Natalya Zahn
Mayton et al. 183
Figure 1. In this article we introduce our vision for a landscape future at the intersection of ubiquitous computing and environmental restoration.The Networked Sensory Landscape presents opportunities to capture long-term ecological change at higher spatial and temporal resolutions than
ever before, and to experiment with radically new forms of physical and remote presence across scales.
conservation (Hu et al., 2009; Lloret, Garcia, Bri,& Sendra, 2009; Rundel, Graham, Allen, Fisher, &Harmon, 2009; Watras et al., 2014). More than adecade on, in the era of mobile and ubiquitous comput-ing, we are finding that environmental sensor networksembedded in the landscape can serve as a platform fora wide array of applications spanning research, out-reach, and art. In general, our work has been focused onthe intersection of presence and pervasive sensing, andlandscape is a natural site for this broad line of research(Dublon & Paradiso, 2014).
In this article, we call this field the Networked Sen-sory Landscape, and present our own work developingan environmental sensor network along with its diverseapplications and outcomes. What opportunities are cre-ated by weaving a continuously sampling, geographicallydense web of sensors into the natural environment, from
the ground up? And how can the data produced by thiskind of network extend an enhanced sense of presenceto both onsite and remote visitors? Figure 1 captures ourvision for the techno-ecological landscape in which thisinquiry is rooted, and which we see as a model to carryforward to other sites.
Our field laboratory for this work, called Tidmarsh,is currently the site of the largest freshwater wetlandand riverine restoration in the state of Massachusetts.Formerly an industrial-scale cranberry farm, Tidmarshhas recently undergone restoration (Interfluve, 2015)with the goals of reestablishing natural processes, suchas the free flow of water, and ecosystem services, suchas biodiversity support. At the time of this writing,water control structures have been removed and ditchesfilled; three miles of new sinuous stream channel havebeen constructed and connected to a new pond, and

184 PRESENCE: VOLUME 26, NUMBER 2
riffles have been built to raise the water table. Finally,the flat bog surfaces have been sculpted with micro-topography and many tons of fallen trees have beendistributed to create a wealth of new microhabitatsacross the site. Spring 2017 was the nascent wetland’sfirst. In Fall 2017 the land became a public wildlifesanctuary (Massachussetts Audubon Society, 2017). Inaddition, a nonprofit organization, the Living Obser-vatory (LO), has been formed to bring together thescientists, artists, and wetland restoration practitionersworking on the land and engaging through it (Bidgood,2017).
Over the past four years, as the restoration has gonefrom the design phase into active construction, we haveincorporated our ubiquitous sensing framework at eachstage of the process, ultimately spanning sensor nodes,a generalized real-time sensor data API, and novel userexperiences. Our continuously evolving sensor networkhas been in place for more than three years document-ing the prerestoration environment, and will continueas nature takes its course. Its data, in conjunction withother, more targeted data collected by our research part-ners, are available to scientists, restoration engineers,and land managers. But beyond the environmental sci-ence and local environmental benefits of the project, thepartnership behind the restoration is seeking to under-stand how future park visitors will interact with thisnew kind of landscape model. For this reason, our man-date has extended beyond sensing, both to constructinginfrastructure and developing user interfaces that bringmanifestations of the sensor data to the public. A sig-nificant portion of the underlying ecological change isinvisible to the naked eye—some of it too slow for us towitness, some passing in the blink of an eye, and muchof it occurring where we’re not looking. Can we buildtechnologies that allow us to witness, enjoy, and examinelandscape-scale change in new ways?
This article will introduce the concept of the Net-worked Sensory Landscape as we have constructed itat Tidmarsh. Like any end-to-end sensor system, ourshas three layers (collection, back-end, and user inter-face) but in our case, each part is designed with thisconcept at its core. The sensors themselves and networkinfrastructure were built for both scientific inquiry and
open-ended user experience, the back-end was built tosupport almost any kind of real-time, user-facing appli-cation, and the diverse set of interfaces we present herewere built to encompass the myriad ways the public canengage with landscape.
The next sections of the article will detail these lay-ers from the bottom up. In the following section, wedescribe the sensing layer, which combines a low-powerenvironmental WSN, dense collection of audio fromwired and wireless microphones and hydrophones, andwired network cameras. Next, we introduce ChainAPI,a hypermedia web service that links the different partsof our system together, focused on data persistence, acommon protocol to link our disparate systems, and thedata plumbing required to do so. Finally, we detail theapplications and user interfaces that bring the sensedlandscape to both researchers and the general public;these include traditional visualization systems, virtualand augmented reality (VR/AR) experiences mir-roring the physical landscape, wearable devices, andtools for creative expression—enabling landscape ascanvas.
2 Sensing the Landscape
To construct the Networked Sensory Landscape,we have densely instrumented Tidmarsh with numer-ous data sources and the infrastructure required to makeall of the captured data available via the internet in realtime. A network of custom low-power wireless sensornodes provides spatially and temporally dense mea-surements of basic environmental parameters, and anarray of microphones provides many channels of liveaudio. These two main sources are supplemented byadditional data streams in a few locations, such as livecamera images. The data sources are concentrated inseveral different locations on the site, chosen to cap-ture a cross-section of the different conditions and typesof habitats across the property. The following sectiondescribes each of the instrumented sites and the networkinfrastructure that connects them. Next, our sensor plat-forms are introduced, followed by our audio streamingsetup. Finally, we describe an example of processing data
Mayton et al. 185
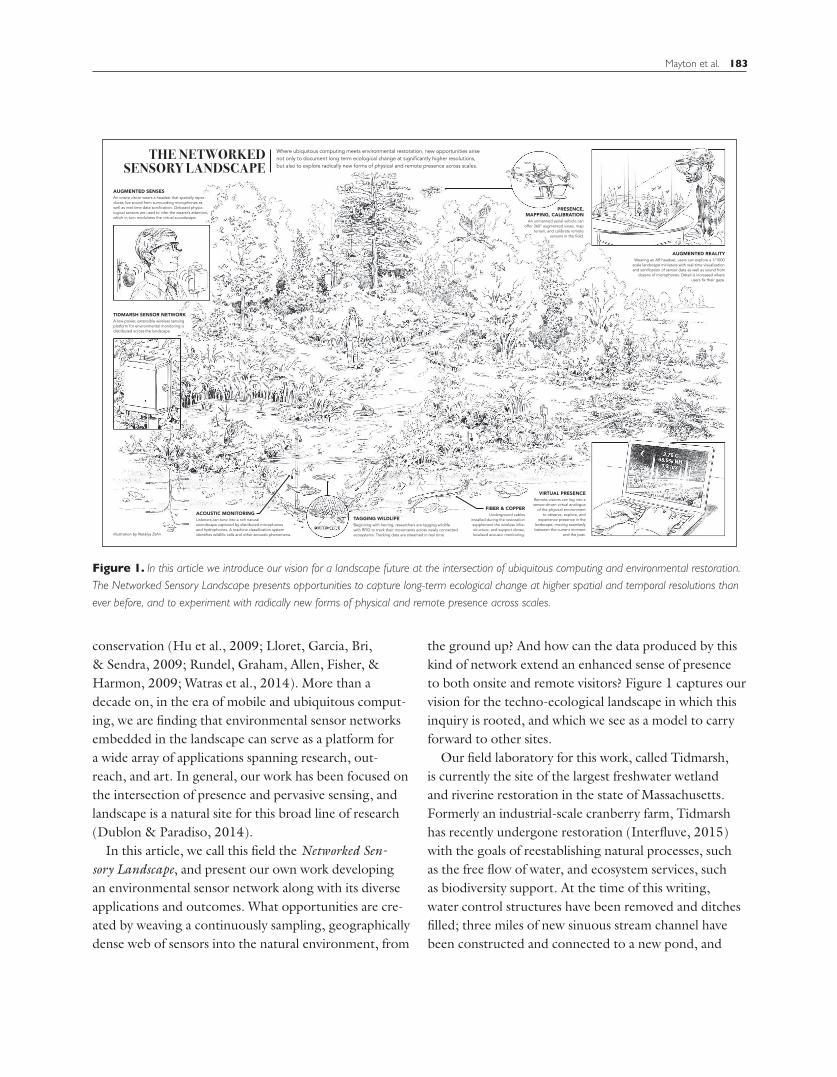
Figure 2. Tidmarsh network infrastructure and sensor sites.
streams in real time to produce higher-level data sourcesthat can be used by applications.
2.1 Sensor Sites and NetworkInfrastructure
Figure 2 shows most of the 600-acre Tidmarshproperty, highlighting the locations that we have
instrumented. Sensing is deployed across three activesites (numbered 1–3) and will be added to a fourthplanned site (4) in the coming spring. These sites areconnected together by a low-latency, high-bandwithinternet protocol (IP) network, enabling real-time datastreaming from the sensors, microphones, and cam-eras. The IP network also provides internet connectivityfor visitors to the site, enabling them to interact with

186 PRESENCE: VOLUME 26, NUMBER 2
the sensors through portable and wearable devices,including several that will be described later in thisarticle.
Internet connectivity comes in from a local internetservice provider at the northeast edge of the prop-erty (indicated by the cloud symbol in Figure 2).A barn at this location houses the head-end infras-tructure, including the main router and on-site server.A 5.8-GHz 90◦ sector antenna mounted outside thebarn creates a TDMA Wi-Fi network that serves as thewireless backhaul for the property; this network is acces-sible using inexpensive hardware anywhere with a directline-of-sight from the bog surface.
The first sensors were installed at the west edge of theproperty (site 1 in Figure 2 or the “west side”) in Febru-ary 2014, and is now the largest sensor installation atTidmarsh. This site receives connectivity via the wire-less backhaul, and the base station is powered by two100-watt solar panels and a 2,400-watt-hour battery.The base station also includes a network camera and astereo audio streaming setup, as well as a weather sta-tion measuring wind speed, direction, and rainfall. Thissite has been planted with Atlantic white cedar seedlingsduring the summer of 2016, and will become a forestover the coming decades. Sixty-four sensor nodes werein place from October 2014 through August 2015; allbut a small handful were then removed to allow the con-struction and microtopography work to take place. Asof autumn 2016, most of the sensor nodes have beenre-installed.
The southern end of the property (site 2 in Figure 2,or the former impoundment) was once an artifical pondthat provided a source of water to flood the cranberrybogs. The dam impounding the water was removedseveral years ago and minimal construction work hasbeen done on this part of the site during the restora-tion. As such, it represents a portion of the property thatis several years ahead in its process of transformation.It contains another large sensor node deployment, aswell as an extensive array of microphones that streamlive audio (see Section 2.3). As there is no line-of-sightto the network head end, connectivity is provided byburied fiber optic cable running through the forest.The fiber connects to the wireless network at the barn
near site 3. This site also has wired power that joins theburied fiber at a house partway along the route. This sitealso includes a camera that has been capturing images forthe past year.
Another site along the edge of the bog surface (site 3in Figure 2, the “greenhouse and test plot”) will includesensing in three different environments. A nearby green-house contains several sensor nodes and is an example ofa controlled environment that has been used to raiseseedlings for planting. The nearby bog surface, alsoin range of the network, will become transitional fen,and sensor nodes will be installed once the restorationwork is complete. The nearby bog surface also containsa rectangular test plot where ecologists will conductsoil experiments; this plot has been instrumented withfour sensor nodes, each with soil moisture and soil tem-perature probes at two different depths, in addition tothe standard set of sensors inside the node itself. Net-work connectivity for this site comes from the wirelessbackhaul, and it has wired electricity from the nearbybarn.
A fourth site (site 4 in Figure 2, the “constructedpond”) is underway as part of the summer 2017deployment. At this location, a large pond has been con-structed. Despite being less than a year old, the pond isalready buzzing with natural activity.
2.2 The Sensor Network
Wireless Sensor Networks have a history goingback over a decade, using a variety of hardware and net-working protocols. Many projects from the early 2000s,such as the work on Great Duck Island (Szewczyk etal., 2004), made use of Berkeley’s Mica motes (Hill &Culler, 2002) and TinyOS (Levis et al., 2005). Severalsensor node designs are now commercially available,including some that have grown out of research work(MEMSIC, Inc—Wireless Sensor Networks, 2015) andnew turnkey product designs (Libelium—ConnectingSensors to the Cloud, 2015). While the appearance ofthese products on the market is exciting for the futureof WSNs, we determined that the cost and specializationof existing systems were not compatible with our needs.With a diverse landscape under rapid transformation, we
Mayton et al. 187
needed a network that was flexible to deploy, customize,and alter as the construction work progressed. In orderto support a spectrum of different applications, fromtraditional ecological research to experiments in pres-ence and perception, frequent sampling and real-timetransmission were important considerations. In manycases the requirements of various applications were notwell-defined at the time the network and infrastructurewere installed. While the engineering costs of develop-ing our own platform have not been insignificant, thelower per-node cost (approximately $80 per assemblednode) and flexibility to iterate on the complete hardwareand software stack to meet the requirements of differentlocations and applications as the site changes over timehave been of great benefit.
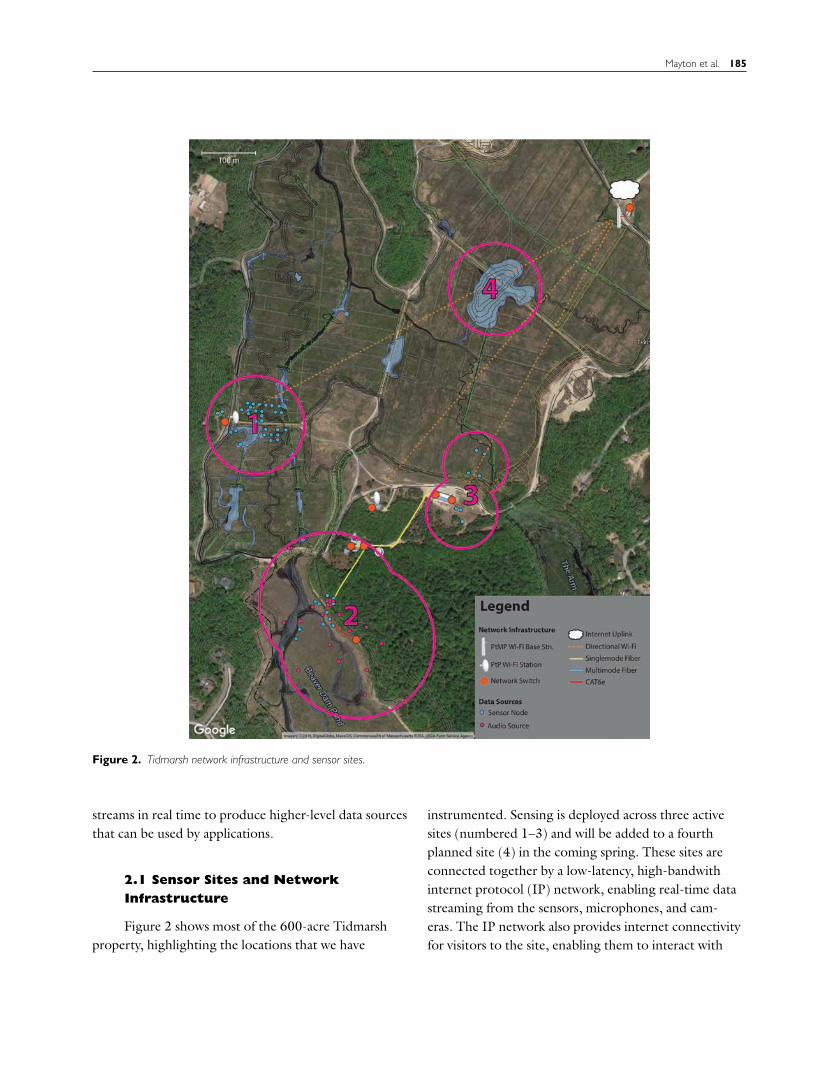
Our low-power wireless sensor network providesgeneral data about the environment at Tidmarsh. Thenetwork is built from custom sensor nodes, each con-sisting of a microcontroller, radio, power source, andsensors in a weatherproof enclosure. This platform isdesigned to be easily deployed in large numbers acrossthe areas we have chosen to instrument, and the com-plement of internal sensors provide a standard baselinefor the sensing across the site. Expansion capabilitiesallow sensor nodes to measure additional parameterswhere it makes sense to do so, allowing many differ-ent types of probes to be connected to the network.Two generations of sensor hardware are described inthis section. The first-generation sensors, developed in2013, has been used for most of the sensing to date. Thesecond-generation sensors, preparing for manufactur-ing at the time of this writing, will feature an expandedset of internal sensors and several improvements thatwill increase the lifetime of the nodes in the field. Thesecond-generation sensor nodes are expected to be readyfor deployment during the summer of 2017.
The first generation of our sensor node platformis built on an 8-bit ATxmega128A4U processor andAT86RF233 2.4-GHz 802.15.4 radio for communi-cation. The on-board sensors include temperature andhumidity (SHT21), light (ISL29023), atmospheric pres-sure (BMP180), and an accelerometer (ADXL362).The accelerometer was added with local wind sensing inmind if the sensor node is installed on a flexible mount;
Figure 3. The second-generation hardware inside the waterproofenclosure.
however, this has not yet been thoroughly explored. ThePCB and batteries (shown in Figure 3) are designedto fit into a small weatherproof enclosure with portsto expose the sensors to the environment. The assem-bly mounts to stakes made from PVC pipe that can berapidly installed in the field and will not decay over time(see Figure 5). The node can be extended through awaterproof connector that connects to an expansionbox providing four 12-bit analog input channels andprogrammable excitation voltages to power the sensorprobes.
The second generation of the sensor node platformaims to improve the sensing capabilities and extendthe lifetime of the node. The new device, diagrammedin Figure 4, uses the same MCU and radio, and mostof the same sensors. The single light sensor has beenreplaced by two digital sensors (VEML6030, providinghigh dynamic range visible light, and VEML6070, pro-viding separate UVA and UVB measurements). A pairof photodiode amplifiers and 12-bit A/D convertersallow two additional photodiodes to be installed, whichwill be used for IR sensing. Different plant and bacte-ria species can make use of different wavelengths forphotosynthesis; separate measurements of these spec-tral bands may provide insight into what grows where.A passive IR motion sensor enables the detection oflarge wildlife, and a microphone with an integrator,peak detector, and FFT capability will allow analysis ofaudio around the node, including wind noise. Integratedflash memory storage will allow sensor data to be stored

188 PRESENCE: VOLUME 26, NUMBER 2
Figure 4. Second-generation sensor node hardware diagram.
internally and retrieved later so that data are not lostduring network outages. A small solar panel, recharge-able battery, and energy harvesting controller will allowfor much longer operation before battery replacementwill be required—an important consideration as the sitereverts to nature and the nodes become more difficultto access. The second-generation nodes will have theexpansion capability built in, allowing external probes tobe easily connected without additional electronics. Ini-tial prototypes are currently being evaluated, as shown inFigure 5.
The sensor nodes communicate using a modified ver-sion of the Atmel Lightweight Mesh protocol, which isbuilt on top of the IEEE 802.15.4 standard. The pro-tocol provides basic multihop routing support whilemaintaining a low memory footprint, and is simple to
extend and debug. Our extension includes an efficientbinary sensor data format that identifies each sensormetric present in the message so that the data can beproperly decoded when received by the central server.The network protocol also provides several controlcommands and an over-the-air firmware update mech-anism so that updates to the sensor node software can beinstalled in the field, which has proven useful as sensingrequirements change.
The sensor node has been designed with low-poweroperation in mind. The first generation nodes arepowered by three primary AA cells, while the secondgeneration nodes will have a single rechargeable lithiumion cell. The present generation of the hardware hasa quiescent draw of about 25 µA. A custom real-timeoperating system keeps the node in this low-power mode

Mayton et al. 189
Figure 5. Left: first-generation sensor node in its enclosure, installed in the field. Right: second-generation sensor node prototype, with insetshowing optical components on top of the node (detailed in Figure 4).
most of the time, with only a low-power 32-kHz RCoscillator operating the scheduler task. Every 30 sec-onds, the scheduler wakes up and triggers all of thesensors to start measurements (the sensing interval isprogrammable via remote commands). As the A/Dconversion for most of the sensors takes some time, thenode goes back to sleep for the next second, then wakesup to read the results, assemble a wireless frame, andtransmit. The node consumes approximately 2 mA whenreading the sensor values and 16 mA while transmit-ting. The second-generation sensor node reduces thequiescent power draw significantly by correcting severaldesign issues present in the first-generation node.
Soil monitoring will constitute a significant part ofour external sensing. Soil hydrology, pH, oxidation-reduction potential, and temperature (Vorenhout, vander Geest, & Hunting, 2011) aid in evaluation of the
site’s efficacy in providing important ecosystem services(Zedler & Kercher, 2005) and provide a window intonormally invisible underground processes. Other exter-nal probes include weather stations (monitoring windspeed, wind direction, and rainfall), water quality (dis-solved oxygen, pH, conductivity, temperature, redoxpotential, water level), and air quality.
The low-power wireless sensor network is bridgedto the IP backhaul at each site via a gateway node. Thegateway platform is an Intel Galileo single-board com-puter with a custom radio connected to the Galileo’sexpansion headers. The radio has an external 24-dBpower amplifier, LNA, and RF switch with automaticantenna diversity. Software running on the Galileoprovides the network discovery and firmware updateservices, and connects to the central server (running atthe Media Lab) through ZeroMQ.
190 PRESENCE: VOLUME 26, NUMBER 2
2.3 Audio Streaming
Audio has several qualities which make it com-pelling as a data source, especially when synthesizing asense of presence. First, it captures a huge amount ofinformation about the site, including weather condi-tions and the activity of wildlife, which may be a goodindicator of the overall health of the site. It is relativelyinexpensive to capture and transmit in high fidelity, com-pared to other rich data streams such as video. It alsopossesses a flexibility that video images do not; while acamera presents a single point-of-view through a lens,audio can be spatialized and presented in a partiallyvirtual environment without feeling overly unnatural.
At Tidmarsh, we have implemented audio streamingin a number of different ways, depending on the avail-ability of power and network access at each location.One location (site 1 in Figure 2), which does not havewired power or network, uses a solar-powered computerand audio interface to capture and encode two channelsof audio and transmit the result via Wi-Fi. At the formerimpoundment location (site 2), we have taken advantageof the wired power and network to implement a muchlarger installation. A rackmount 32-channel mixer acts asan audio interface with DSP (filtering and dynamics pro-cessing on each channel reduce the effects of wind noise)and is connected to an x86 computer, colocated withthe base station for the wireless sensor network. Thecomputer encodes the audio using the Opus codec andtransmits the streams to our central server at the MediaLab.
Sixteen of the inputs are located on the mixer. Cablesrun underground and connect to microphones up to500 feet away. Another 16 inputs (and correspond-ing microphones) are located at a satellite box 300 feetsouth of the base station box, connected via CAT6 andpower cable. As of this writing, there are 24 channelsactively being streamed from this installation (includinga hydrophone). Microphone locations are shown as pinkdots on Figure 2.
As most commercial microphones are unsuitablefor installing outdoors where they are exposed to theelements, we have developed our own weatherproofomnidirectional microphones (see Figure 6). These
utilize low-noise electret capsules and a circuit forbuffering the microphone signals and driving a dif-ferential cable. The assembly is protected inside of analuminum tube and potted with silicone rubber to pro-tect it from water, leaving only the front of the capsuleexposed. Foam windscreens placed over the front of thetube reduce wind noise and help repel water from theexposed capsules. The microphones interface directly tostandard professional audio equipment with balancedXLR connectors and 48-V phantom power. Several ofthese microphones have operated in the field for morethan two years without issue.
The audio streams are published using the Icecast pro-tocol, commonly used for internet streaming audio.This enables the streams to be directly used in a vari-ety of contexts, such as embedded in a web page or ina virtual representation of the site (see Section 4.7.2).The streams from the former impoundment locationare published as a single multichannel stream, whichmaintains synchronization between the individualmicrophones, as well as a stereo mix that can be receivedwithout specialized software (e.g., on our web site).Various parts of the audio installation, including micro-phones, the main electrical box, and the satellite box, areshown in Figure 6.
2.4 Virtual Sensors:TidZam
Data sources may also be processed to create addi-tional streams of data useful to applications. These“virtual sensors” may aggregate data from physicalsensors, or represent some more abstract data source.TidZam is an example of a virtual sensor that ana-lyzes our microphone audio streams in real time toanalyze outdoor ambient sound, identify wildlife,and characterize biodiversity over the course of therestoration.
Bird call recognition has been studied for some timewith a number of different approaches (Brandes, 2008),with partial success demonstrated on small subsets ofbird species. Bird calls contain complex structures anal-ogous to the phonemes, syllables and even sentencesfound in human language, which are varied even amongthe same species. As such, traditional classification

Mayton et al. 191
Figure 6. Parts of the audio streaming installation. Top left: microphones awaiting installation. Bottom left: satellite input box. Center:microphones in trees and in the marsh. Right: main electrical box, showing mixer (top), computer (center), network switch and fiber (bottom left).
approaches tend to fail because it is difficult to manuallyselect features. Recently, researchers have demonstratedmajor improvements in bird call recognition usingalgorithms for unsupervised self-extraction of features(Stowell & Plumbley, 2014).
TidZam is built using convolutional neural networksfor self-extraction of hierarchical feature representa-tions that describe the spectral content associated withqualitatively different types of outdoor sound (e.g.,rain, wind, frogs, birds, human voices, aircraft, etc.).An expert architecture is used to analyze incoming sig-nals and forward them to more specialized classifiers,which produce the final classification (Jacobs, Jordan,Nowlan, & Hinton, 1991). The classifiers are trainedusing nonexclusive output classes, which allow classoverlapping on the same signal sample, such as birds call-ing during a rainstorm. The system also generates anambiguity measure, used for labeling unfamiliar samplesor indicating that a final classification (e.g., bird speciesdetection) cannot be made, even if an initial classification
(e.g., generic bird detection) has been produced. In thiscase the signal is extracted dynamically so that an expertmay determine the source of the audio (crow, blue jay,frog, rain, etc.) to build a new class or improve an exist-ing one. The framework’s interactive interface provides atraining feedback mechanism between users/experts andthe neural system in order to improve the knowledge ofthe system and the users. The resulting classifiers form“virtual sensors” associated with the microphone wherethe audio was recorded. The TidZam web interface isshown in Figure 7.
There remain several open problems, the most press-ing of which is developing a process for automaticallyevaluating system performance on a large scale. Thevolume of data is significant, and a comparably largeground truth dataset does not yet exist. System perfor-mance on hand-labeled data is continuously measuredto improve the classification. At the same time, thedatabase of unsupervised labeled examples is beingcontinuously grown as new detections are made and
192 PRESENCE: VOLUME 26, NUMBER 2
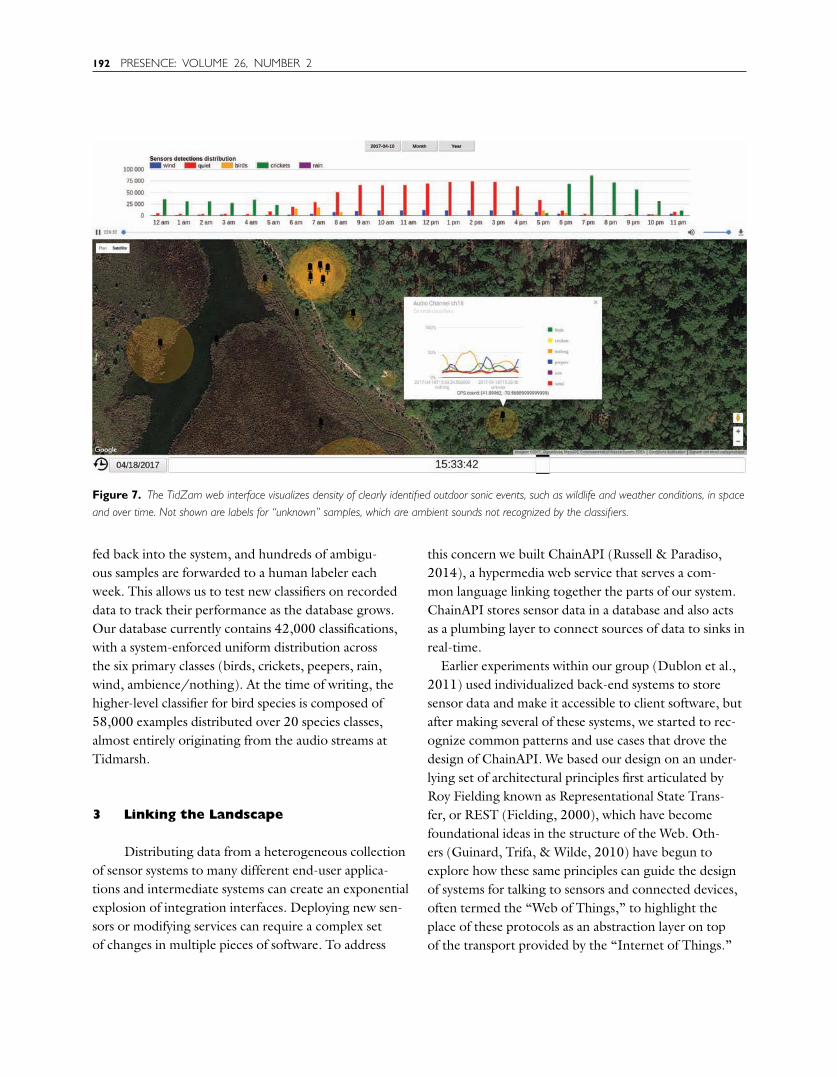
Figure 7. The TidZam web interface visualizes density of clearly identified outdoor sonic events, such as wildlife and weather conditions, in spaceand over time. Not shown are labels for “unknown” samples, which are ambient sounds not recognized by the classifiers.
fed back into the system, and hundreds of ambigu-ous samples are forwarded to a human labeler eachweek. This allows us to test new classifiers on recordeddata to track their performance as the database grows.Our database currently contains 42,000 classifications,with a system-enforced uniform distribution acrossthe six primary classes (birds, crickets, peepers, rain,wind, ambience/nothing). At the time of writing, thehigher-level classifier for bird species is composed of58,000 examples distributed over 20 species classes,almost entirely originating from the audio streams atTidmarsh.
3 Linking the Landscape
Distributing data from a heterogeneous collectionof sensor systems to many different end-user applica-tions and intermediate systems can create an exponentialexplosion of integration interfaces. Deploying new sen-sors or modifying services can require a complex setof changes in multiple pieces of software. To address
this concern we built ChainAPI (Russell & Paradiso,2014), a hypermedia web service that serves a com-mon language linking together the parts of our system.ChainAPI stores sensor data in a database and also actsas a plumbing layer to connect sources of data to sinks inreal-time.
Earlier experiments within our group (Dublon et al.,2011) used individualized back-end systems to storesensor data and make it accessible to client software, butafter making several of these systems, we started to rec-ognize common patterns and use cases that drove thedesign of ChainAPI. We based our design on an under-lying set of architectural principles first articulated byRoy Fielding known as Representational State Trans-fer, or REST (Fielding, 2000), which have becomefoundational ideas in the structure of the Web. Oth-ers (Guinard, Trifa, & Wilde, 2010) have begun toexplore how these same principles can guide the designof systems for talking to sensors and connected devices,often termed the “Web of Things,” to highlight theplace of these protocols as an abstraction layer on topof the transport provided by the “Internet of Things.”
Mayton et al. 193
Icecast StreamingGateway
HearThere
WSNGateway
SensorChimes
Doppelmarsh
ChainAPI
Sensor Glasses
MarshVis
TidZam
TidmarshWebsite
GraphiteHakoniwa
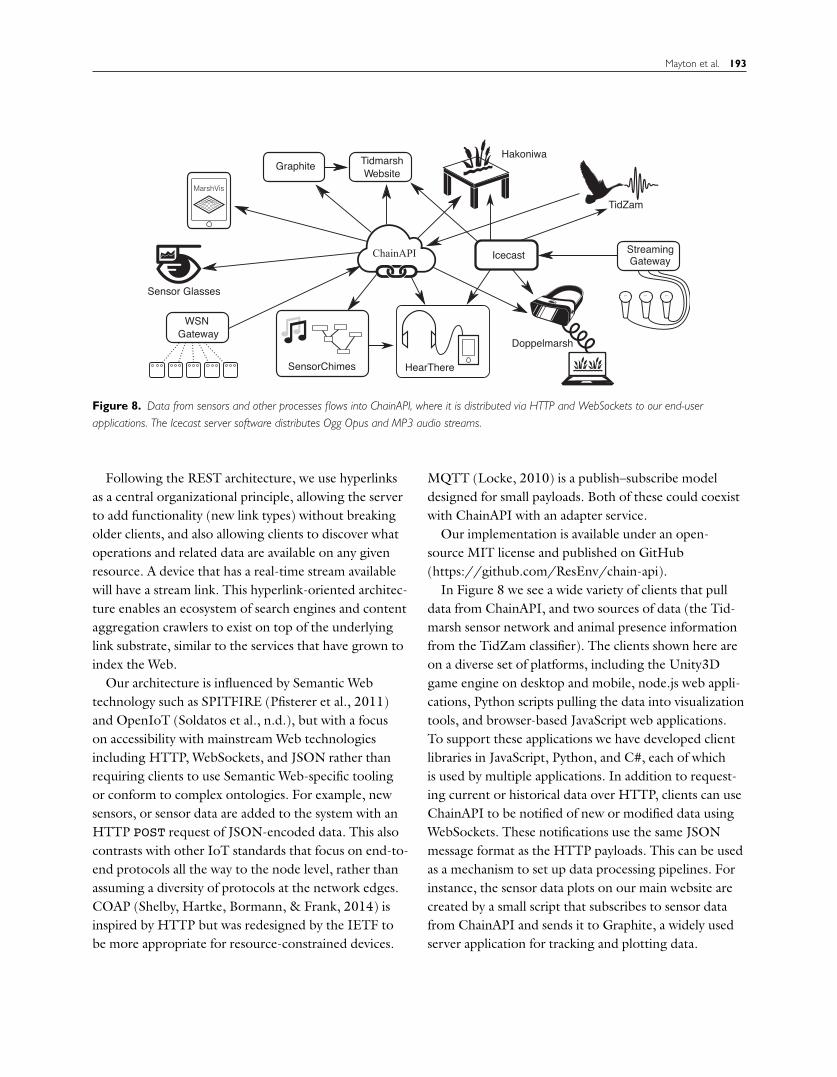
Figure 8. Data from sensors and other processes flows into ChainAPI, where it is distributed via HTTP and WebSockets to our end-userapplications. The Icecast server software distributes Ogg Opus and MP3 audio streams.
Following the REST architecture, we use hyperlinksas a central organizational principle, allowing the serverto add functionality (new link types) without breakingolder clients, and also allowing clients to discover whatoperations and related data are available on any givenresource. A device that has a real-time stream availablewill have a stream link. This hyperlink-oriented architec-ture enables an ecosystem of search engines and contentaggregation crawlers to exist on top of the underlyinglink substrate, similar to the services that have grown toindex the Web.
Our architecture is influenced by Semantic Webtechnology such as SPITFIRE (Pfisterer et al., 2011)and OpenIoT (Soldatos et al., n.d.), but with a focuson accessibility with mainstream Web technologiesincluding HTTP, WebSockets, and JSON rather thanrequiring clients to use Semantic Web-specific toolingor conform to complex ontologies. For example, newsensors, or sensor data are added to the system with anHTTP POST request of JSON-encoded data. This alsocontrasts with other IoT standards that focus on end-to-end protocols all the way to the node level, rather thanassuming a diversity of protocols at the network edges.COAP (Shelby, Hartke, Bormann, & Frank, 2014) isinspired by HTTP but was redesigned by the IETF tobe more appropriate for resource-constrained devices.
MQTT (Locke, 2010) is a publish–subscribe modeldesigned for small payloads. Both of these could coexistwith ChainAPI with an adapter service.
Our implementation is available under an open-source MIT license and published on GitHub(https://github.com/ResEnv/chain-api).
In Figure 8 we see a wide variety of clients that pulldata from ChainAPI, and two sources of data (the Tid-marsh sensor network and animal presence informationfrom the TidZam classifier). The clients shown here areon a diverse set of platforms, including the Unity3Dgame engine on desktop and mobile, node.js web appli-cations, Python scripts pulling the data into visualizationtools, and browser-based JavaScript web applications.To support these applications we have developed clientlibraries in JavaScript, Python, and C#, each of whichis used by multiple applications. In addition to request-ing current or historical data over HTTP, clients can useChainAPI to be notified of new or modified data usingWebSockets. These notifications use the same JSONmessage format as the HTTP payloads. This can be usedas a mechanism to set up data processing pipelines. Forinstance, the sensor data plots on our main website arecreated by a small script that subscribes to sensor datafrom ChainAPI and sends it to Graphite, a widely usedserver application for tracking and plotting data.
194 PRESENCE: VOLUME 26, NUMBER 2
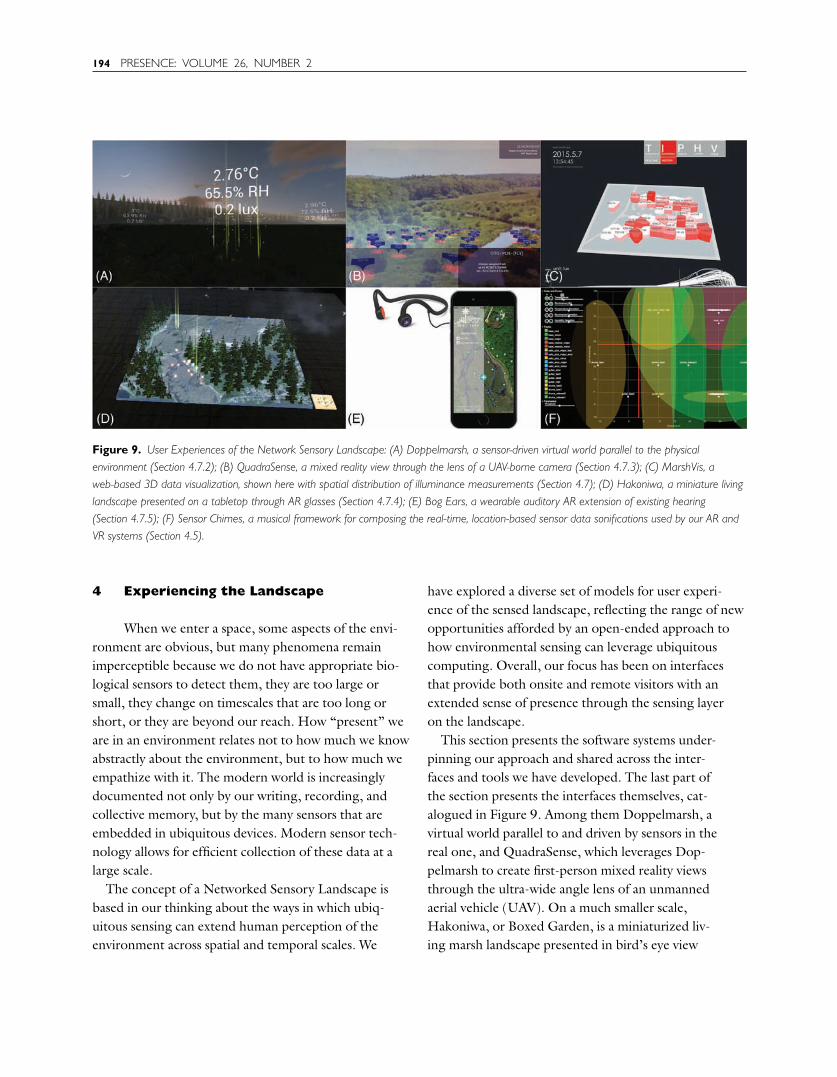
Figure 9. User Experiences of the Network Sensory Landscape: (A) Doppelmarsh, a sensor-driven virtual world parallel to the physicalenvironment (Section 4.7.2); (B) QuadraSense, a mixed reality view through the lens of a UAV-borne camera (Section 4.7.3); (C) MarshVis, aweb-based 3D data visualization, shown here with spatial distribution of illuminance measurements (Section 4.7); (D) Hakoniwa, a miniature livinglandscape presented on a tabletop through AR glasses (Section 4.7.4); (E) Bog Ears, a wearable auditory AR extension of existing hearing(Section 4.7.5); (F) Sensor Chimes, a musical framework for composing the real-time, location-based sensor data sonifications used by our AR andVR systems (Section 4.5).
4 Experiencing the Landscape
When we enter a space, some aspects of the envi-ronment are obvious, but many phenomena remainimperceptible because we do not have appropriate bio-logical sensors to detect them, they are too large orsmall, they change on timescales that are too long orshort, or they are beyond our reach. How “present” weare in an environment relates not to how much we knowabstractly about the environment, but to how much weempathize with it. The modern world is increasinglydocumented not only by our writing, recording, andcollective memory, but by the many sensors that areembedded in ubiquitous devices. Modern sensor tech-nology allows for efficient collection of these data at alarge scale.
The concept of a Networked Sensory Landscape isbased in our thinking about the ways in which ubiq-uitous sensing can extend human perception of theenvironment across spatial and temporal scales. We
have explored a diverse set of models for user experi-ence of the sensed landscape, reflecting the range of newopportunities afforded by an open-ended approach tohow environmental sensing can leverage ubiquitouscomputing. Overall, our focus has been on interfacesthat provide both onsite and remote visitors with anextended sense of presence through the sensing layeron the landscape.
This section presents the software systems under-pinning our approach and shared across the inter-faces and tools we have developed. The last part ofthe section presents the interfaces themselves, cat-alogued in Figure 9. Among them Doppelmarsh, avirtual world parallel to and driven by sensors in thereal one, and QuadraSense, which leverages Dop-pelmarsh to create first-person mixed reality viewsthrough the ultra-wide angle lens of an unmannedaerial vehicle (UAV). On a much smaller scale,Hakoniwa, or Boxed Garden, is a miniaturized liv-ing marsh landscape presented in bird’s eye view
Mayton et al. 195
on a table through an AR head-mounted display.For extended perception onsite, we developedHearThere, a precise head-tracking bone conductionheadphone system for auditory AR experiences thatoverlay sonification and live audio onto the physicalenvironment. Real-time sonifications for our variousdisplays were developed by commissions to outsidecomposers, who designed them using our sensor datasonification and composition tool, called SensorChimes.
Some precedents for our work can be found in theHCI and embedded systems literature around generalpurpose sensor network user interfaces. Among these,Marquardt et al. (2010) presented the “Visual Envi-ronment Explorer,” a tool for assessing the states ofmultiple networked devices and exploring the networkin various ways. Michel et al. (2009) demonstrated anend-to-end environmental sensor network and visualiza-tion tool comprising environmental monitoring weatherstations and various forms of graphical display, includ-ing 3D contour map overlays; in its focus on the dataplumbing as well as the map-based, physically linkedvisualization, their system is similar to several of ourapplications. However, in contrast to these examples,our aim is for data visceralization over compact rep-resentation (Dobson, 2016). In its encoding in musicand abstract forms and presentation in virtual and aug-mented realities, information in our interfaces can beslower to digest. Our approach privileges user explo-ration over targeted queries, more akin to a nature walkthan a Google search.
To support more open-ended exploration of sensornetworks than traditional user interfaces would allow,we proposed Cross-Reality Environments, where ubiq-uitous sensor networks would interact with pervasivelyshared virtual worlds (Lifton et al., 2009). In the inter-vening years, we have focused on evoking experiencesof presence by tying physical environments and sensorsto immersive virtual counterparts using 3D visualiza-tion and spatial sonification. An early example of thiswork, DoppelLab, is a cross-reality interface to thereal-time and recorded data produced by a modernbuilding and its occupants (Dublon et al., 2011). InDoppelLab, representations of sensors are bound toarchitectural space in a game engine, while users’ move-ments are unconstrained by physical rules, and time is
a dynamic parameter (to be traversed, stretched, andcompressed). Virtual sensors can be represented in com-posite visualizations, and detail can be parameterized(representations are zoomable).
Cross-reality environments have allowed us to exploresensor-driven worlds tied to landscape but unencum-bered by physical or temporal constraints. Throughthis process, we have developed a core set of softwarecomponents, shown in Figure 10, on which most ofour user-facing projects depend. Whether targetingtraditional devices, AR, or VR, our applications sharecomponents that provide location services, produce 3Dvisualization and sonification, render spatial live audio,process real-time data streams, and include static dataresources such as maps, terrains, and other physicaldatasets (ground penetrating radar data, archived audio,thousands of user-submitted photos, etc.). Sections 4.1through 4.6 detail these components, and Section 4.7presents the applications and devices that use them toenhance users’ presence in the sensory landscape.
4.1 Static Resources
Our UI applications make use of a large databaseof recorded data, which we refer to as static resources.These data can be statically linked with the applicationsor downloaded at runtime from ChainAPI and otherfile servers. They include recorded audio files, manuallyacquired landscape datasets such as ground penetratingradar and topographic maps, photographs, and more.For example, our VR applications directly render thephysical landscape using LIDAR measurements collectedby the United States Geological Survey (USGS).
In another example, our systems access prerecordedaudio files from a place-based audio documentary systemcalled Roundware (http://roundware.org). Developedand curated by Halsey Burgund, Roundware allows usto download location-tagged, user-submitted recordingsthat can be spatially rendered through our applicationsin AR and VR.
4.2 Real-Time Data
Our applications rely on ChainAPI to keep track ofand in many cases directly access real-time and archiveddata streams; as such, the data handling system is shared

196 PRESENCE: VOLUME 26, NUMBER 2
Static Resources
Maps, terrains, images
Virtual Location Services
Virtual location, world scale
Dynamic Sonifications
Musical mappings, filters, sample banks
Dynamic Visualizations
Visual mappings, objects, weather, textures
Real-Time Data
Sensor data, video, live sound, etc
Chain API
Historical & Static Data
GPS, Ultra-wideband, SLAM
Physical Location Services
Rendering & Display
3D spatial rendering, attention sensing
Datasets, images, maps, etc
(From ChainAPI)User Application / Device
Figure 10. Components of the UI to Networked Sensory Landscape.
across them and reflects the design of ChainAPI. Thisapproach lets us decouple the state of the sensor networkfrom any UI code; the application updates dynamicallyas new nodes come online or others go off.
On startup, our realtime data component, calledChainSync, downloads a summary digest of the sensorson a given top-level ChainAPI “site.” This could be theclosest site to the user in an onsite AR application, forexample. The summary includes device IDs, geoloca-tions, and a cache of recent data, as well as the uniquedevice URLs. In this way, nodes and sensors can beinstantiated in the virtual environment without any hardcoding of link URLs, save for the first link to ChainAPI.After parsing the site summary, most of our applicationssubscribe to ChainAPI’s real-time data stream, using acomponent we call ChainSocket. Handlers within the
application can subscribe to updates for complete sites,sensor nodes, or individual sensors.
As new data comes in, it is forwarded appropriately,keyed on the unique ChainAPI URLs for each device.Some of our systems use ChainAPI to refer to dataresources linked on other servers. For example, liveaudio streams are indexed in ChainAPI but served fromother servers.
Some of these data streams require special handlingby the application. For example, to handle the specialcase of multichannel audio streams, we built a cross-platform game engine plugin that decodes audio streamswithout limits on channel count. Our current systemsuse the plugin to decode 30-channel Opus-encodedaudio streams from the microphone installation atTidmarsh.

Mayton et al. 197
4.3 Location and Navigation
In our mixed reality applications, users are alwayssituated in three-dimensional space and the data arepresented around them, responding to their motionand allowing them to explore by moving throughouttheir environment. In the literature, we find numer-ous examples of spatially registered data overlay, withapplications in geographical information systems (GIS),agriculture, and many other related areas. In one earlyexample, King, Piekarski, and Thomas (2005) visuallyoverlay data such as harvest yield directly onto a grapevineyard in situ. All these systems require the user’sreal-world motion be tracked so that content can be ren-dered around them, maintaining alignment between thephysical and virtual. These applications also require us toalign data associated with physical locations in the realworld (generally represented with latitude, longitude,and elevation) with locations in a local virtual world (inx , y , z coordinates).
4.3.1 Real-World LocationTracking. We haveexplored several technologies for tracking users in phys-ical space. For outdoor use, GPS is an obvious option,and works well for applications in relatively open areasthat don’t require precision below a few meters. Ultra-wideband radio (UWB) offers much higher precision(to 20 cm) but requires anchor nodes to be installedfor localization. In prior work (Russell, Dublon, &Paradiso, 2016), we designed a head-tracking systemthat uses UWB when it is available and can fall backto GPS otherwise. In both cases, we use an inertialmeasurement unit (IMU, a combination gyroscope,accelerometer, and magnetometer) to measure thehead’s orientation, which we combine with the locationfrom UWB or GPS to synthesize the scene around them.The UWB and IMU data are streamed from a customheadset to the user’s mobile phone over Bluetooth Low-Energy, where it is combined with the phone’s built-inGPS. This application is described in more detail inSection 4.7.5.
We have also used Microsoft’s HoloLens platform forour AR applications. The HoloLens uses a depth cam-era and four standard visible light cameras to perform
Simultaneous Location and Mapping (SLAM), mean-ing that it both maps the environment and tracks its ownposition.
4.3.2 Virtual Navigation. Each platform andenvironment provides different navigational affordancesto the user. In our desktop software, the user moves witha mouse and keyboard, similar to traditional first-personvideo games. In VR they can look around freely andmove in a limited area, and can travel larger distances bypointing their controller in the direction they want to goand pressing a button to accelerate in that direction. InAR applications, data representations are overlaid ontothe physical environment, allowing users full range ofmotion.
4.3.3 Mapping Geography. Because our dataoriginates in the real world, we have developed a richtoolkit for managing geo-tagged data and mapping itonto virtual environments. Even in our full-scale aug-mented reality environments, where the virtual andphysical worlds are overlaid on top of each other, weneed to convert global latitude, longitude, and elevationcoordinates into local x , y , and z coordinates in meters.This also sometimes involves scaling up or down intominiature.
Our software library allows designers to place a sin-gle reference object into a virtual scene with knowngeographic coordinates, and the library can use thatobject as a reference to place the rest of the scene, con-verting their geographic coordinates to virtual worldcoordinates. We use the Web Mercator projection sothat our virtual world mapping will align with map tilesdownloadable from many mapping services (Battersby,Finn, Usery, & Yamamoto, 2014). When designing ascene, it is also possible to place objects directly usingtheir virtual world coordinates, so both coordinate sys-tems can be easily mixed. For example, in Doppelmarshwe get all the sensor coordinates from ChainAPI atruntime and they are placed using our geographic map-ping, but other objects such as logs, trees, and terrainare placed in the scene directly using the virtual worldcoordinates.
198 PRESENCE: VOLUME 26, NUMBER 2
4.4 Visualization
Aiming at a more spatial, embodied, visceral inter-action with the data, we created a game engine toolkitfor modular 3D animated visualizations that can bemixed and matched in different applications. The archi-tecture is oriented around a publish/subscribe model,where data modules (such as ChainSync) can publish toany number of subscribed consumers (such as the visual-ization modules). This allows us to build self-containedbehaviors that can be easily added or removed.
Some visualizations affect the whole application, suchas weather or virtual camera effects. Others are local andmay vary throughout the site, such as a representationof temperature as measured by each of the sensor nodes.Both use the same publish/subscribe mechanism to sub-scribe to the data, but the code defining the behavioris instantiated differently. For global visualizations, asingle instance of the visualization code can live at thetop-level of the scene, and is placed when the scene isdesigned. For locally varying or per-node visualizations,we don’t know ahead of time how many will be neededor where they will be. Game engines provide support forprototype objects that can be defined once and instan-tiated multiply, in our case at the location of each node.Adding a new representation involves designing a visualor sonic element and exposing one or more parametersto be mapped to a sensor value. For example, propertiesof a 3D object, such as color or size, could be mapped tohumidity. The resulting prototype would then be auto-matically instantiated across the virtual terrain for eachsensor. This framework allows visualizations to incorpo-rate sensor-driven models that viewers can physicallymove through in virtual reality, such as a kinetic gasmodel driven by temperature (Remsen, 2017).
4.5 Sonification
Much of our work at Tidmarsh has focused on thesonic experience, which includes both informationalauditory display and data-driven musical composition.This work has the parallel goals of improving peo-ple’s understanding of the environment by extendingtheir perception and building empathetic connections
through aesthetic experience. In both cases we seek toaugment the natural soundscape rather than replac-ing it, and prioritize preserving the user’s unmediatedexperience of their natural world.
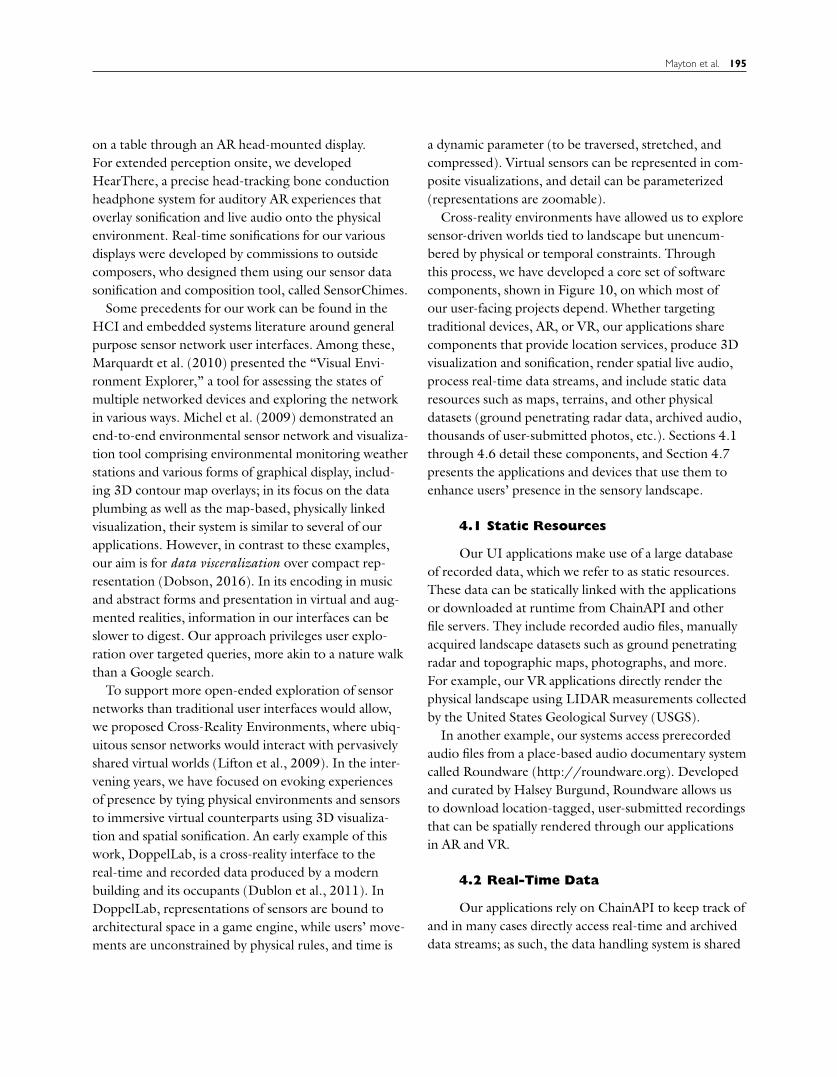
While most game engines include a wide variety ofvisual effects and models, they lack the tools we neededto accomplish our vision for pervasive spatial sonifi-cation. To fill this gap, we built a framework to allowcomposers with limited or no knowledge about sen-sor data processing to compose musical pieces drivenby ubiquitous sensing (Lynch & Paradiso, 2016).This framework, called “SensorChimes” and shown inFigure 11, aims to augment our sense of presence byproviding additional information about the environ-ment through sound, expanding what we can readilyand immediately intuit. The windchime, a prehistoric(and still evolving; Hopkin, 2005) wind sensor thatmakes music, inspires this project. The windchimeis an augmentation to the acoustic environment thatmechanically couples wind speed and direction to sound.This project reimagines, generalizes, and augmentsthis concept in the digital domain with electronic sen-sors that measure many parameters, electronic musiccomposition, and virtual reality.
SensorChimes is implemented as a library for thegraphical programming environment Max/MSP whichmakes it easy to route real-time and historical data froma sensor network into a Max patch. It has also beenported to the PureData environment and made fullyembeddable within the game engine, where it can beused to create rich and responsive real-time musicalexperiences that are coupled with the 3D visualiza-tions. This allows composers and sound designers towork within a familiar musical programming environ-ment. SensorChimes provides an interface for data fromeach device in the network as well as aggregate met-rics over many devices, allowing for quick realizationof innumerable musical mapping ideas.
Four compositions have been written using Sen-sorChimes. Each uses a different mapping strategyand explores a different part of the potential of sen-sor network-driven music as a new canvas for artists.In one example, by coauthor Evan Lynch, real-timedata modulates a live mix of looping acoustic tracks,
Mayton et al. 199
Figure 11. SensorChimes is a composition environment for writing sensor-driven music. Composers can use Max/MSP or PureData to buildsonification programs, which can then be embedded within our mixed-reality applications to provide portable music and sound design elements for3D experiences.
where the mix parameters are determined by the envi-ronmental conditions at Tidmarsh. A second piece, bycommissioned composer Evan Ziporyn, explores usingreal-time data to modulate a shifting timbral space ofinstrumental textures. A third piece, by commissionedcomposer Ricky Graham, uses granular synthesis to real-ize data on multiple timescales. These musical worksare presented as immersive virtual explorations of thewetland with spatialized musical mappings keyed to theuser’s position in the virtual landscape. Several exam-ples of SensorChimes-based compositions are availableat http://resenv.media.mit.edu/sensorchimes.
4.6 Devices and Interaction
Using the game engine Unity3D as a basis, wehave built modular applications targeting a number ofdifferent devices. Virtual environments may be ren-dered on a flat desktop display, virtual reality displayssuch as the HTC Vive and Oculus Rift, augmented
reality displays such as the Microsoft HoloLens, orour own custom hardware, such as HearThere (seeSection 4.7.5). Components can be included depend-ing on the platform needs; for example, our auditory ARsystems depend on the real-time data and head-trackingcomponents but omit the visual rendering systems.
4.6.1 User Attention. Our interfaces makelarge amounts of real-time data perceptually availableto users in both remote settings and in situ. To man-age this flow, we have explored various ways of sensinguser intent to offer more implicit control over these dis-plays. For example, as a user concentrates on a body ofwater, our auditory AR display offers more informa-tion from the subsurface, such as hydrophone audiostreams and water quality sonification. Similarly, a visualAR display would render more detail in subsurface ani-mations. Currently, we use focused gaze as a proxy forattention, an approach we have found intuitive to usersin AR scenarios.

200 PRESENCE: VOLUME 26, NUMBER 2
Figure 12. Left: Sensor Glasses allows sensor data to be accessed by a Google Glass user. Right: A web interface developed by a visitingresearcher explores the use of web technologies to create an interactive visualization of the sensor network and data. The application pulls datafrom ChainAPI and presents it in several different ways.
In addition, we are conducting psychoacoustic studiesinvestigating methods of sensing the wearer’s auditoryattention, and adjusting the source levels in response. Inaddition to gaze, we collect physiological signals such asheart rate variability and facial expression as subjects shifttheir attention from source to source in a spatial soundpresentation. As future work, we intend to train modelsof attention for individuals. In our vision, the systemwould modulate the distribution of detail in the display,reacting to the user’s mental attention instead of relyingon stationary gaze as a proxy.
4.7 Applications
In this section, we describe several user-facingapplications that we have built. These applications bringtogether components from the preceding sections toprovide the user with various means of experiencing andinteracting with the Networked Sensory Landscape.
4.7.1 VisualizationTools. While most of ourwork has focused on virtual environments, we havedeveloped a number of other visualization tools fordata, network performance, and diagnostics. Figure 12shows a web-based tool plotting the charging state of
our solar-powered backhaul against weather conditions.The same application provides several different viewsof the sensor network including a visualization of pack-ets received from each sensor node over time, and anoverview of when each node was active on the network.Yet another view renders data from each sensor on astylized map of the site, using color and height to showdifferent values (shown in Figure 9[c]). It also presentsan interface that allows the relationships between nearbysensor nodes to be explored, and allows the user toscrub through historical data in addition to the live view(Li, Dublon, Mayton, & Paradiso, 2015).
Using Google’s Glass platform, we developedan application called Sensor Glasses (also shown inFigure 12) that uses the built-in camera to recognizeQR codes printed on the sensor nodes and display plotsof recent sensor data. While the visualization is location-dependent, the displayed information doesn’t maintainregistration with physical space (the display floats at afixed position relative to the user’s head).
4.7.2 Doppelmarsh. Doppelmarsh is a virtualworld based on the state of the physical environment atTidmarsh. The virtual site is visually and sonically ren-dered and displayed to the user, re-synthesizing reality
Mayton et al. 201
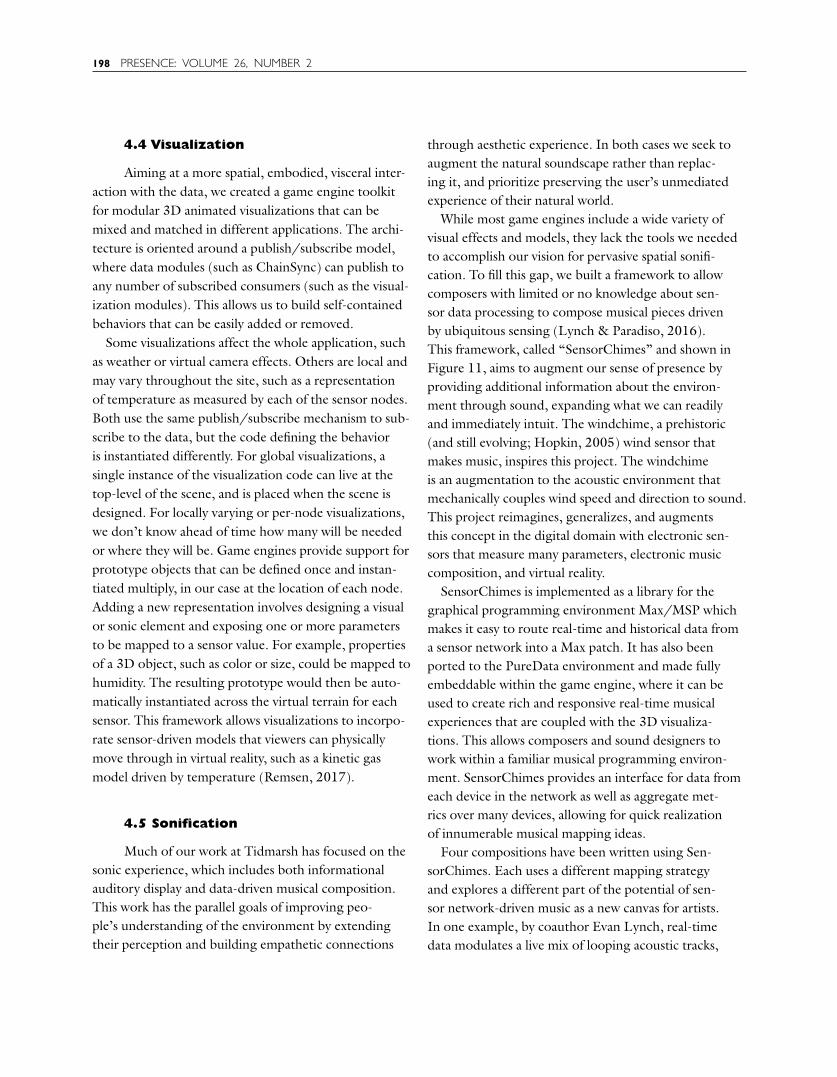
Figure 13. Different virtual “lenses” highlight various aspects of the sensory world in Doppelmarsh: at left (A) with heatmaps on the terrain, andat right (B) with sensor-driven simulated microclimates. A “mini-map” overlay shows the statuses and relative locations of sensor nodes around theuser.
but free from physical constraints. The development ofDoppelmarsh has opened up new avenues for research,such as dynamic automated scene painting fromlive video and real-time rendering of environmentalconditions (Haddad et al., 2017).
The Doppelmarsh terrain forms the virtual worldonto which data are rendered. Our terrain modelsoriginated as topographic maps and LIDAR scansthat we converted and imported into the game engineas heightmaps. As the construction work on the sitehas transformed the terrain, we have modified themodels to reflect the current landscape using therestoration engineering plans as a guide. The terraincontour itself will continue to be updated to reflectchanges from the restoration as new data are col-lected, including from UAV-based imaging and LIDARflyovers.
We have developed a variety of interaction modali-ties for user exploration of the virtual environment. The
primary one is a first-person view, shown in Figure 13,that allows users to see and hear the site as they would ifthey were there in person. The first-person view is well-suited to virtual reality displays, where the user’s headmovements are tracked and used to position the virtualcamera. This mode provides a realistic sense of scale onthe ground, but traversing large distances in this way isslow. For this reason, a top-down mode allows users tomove more quickly, as well as take in larger sections oftopography, wildlife, and sensor data. Finally, a position-tracking VR headset with accompanying handheldcontrollers (HTC Vive) can be used to fly in first-personview. These modes are also used to drive and exploreother systems on the site, such as a remotely operatedUAV (detailed in Section 4.7.3).
Doppelmarsh relies on our real-time data frameworkintroduced in Section 4.2. As such, the application doesnot contain any hard coding of nodes or sensors, butrather crawls ChainAPI to build up the state of the
202 PRESENCE: VOLUME 26, NUMBER 2
Figure 14. Doppelmarsh virtual weather patterns: fog is controlled by nearby humidity sensors, and rain intensity by precipitation meters. Sensordata are combined with machine vision on the camera images to control rendering of snowpack and vegetation.
sensor network. New data is pushed to the applicationover the ChainAPI WebSocket stream.
Real-time sensor data visualizations are associatedwith 3D representations of each sensor node auto-matically placed on the terrain using the metadatareceived from ChainAPI. In contrast to our previouswork (Dublon et al., 2011), where the sensor visualiza-tions were strongly animated by the sensor values anddominated how the building model looked, our currentvisualizations for Tidmarsh blend more subtly with theenvironment. Sensor data is seen as white text floatingabove the sensor location, which can be configured toshow particular metrics of interest. Whenever a sensorupdates, an illuminated “burst” is animated. As we addnodes and sensors to the landscape, we will be addingmany different types of sensor-driven animation, butwill still strive to keep a pleasing aesthetic guided by therealistic wetland depiction.
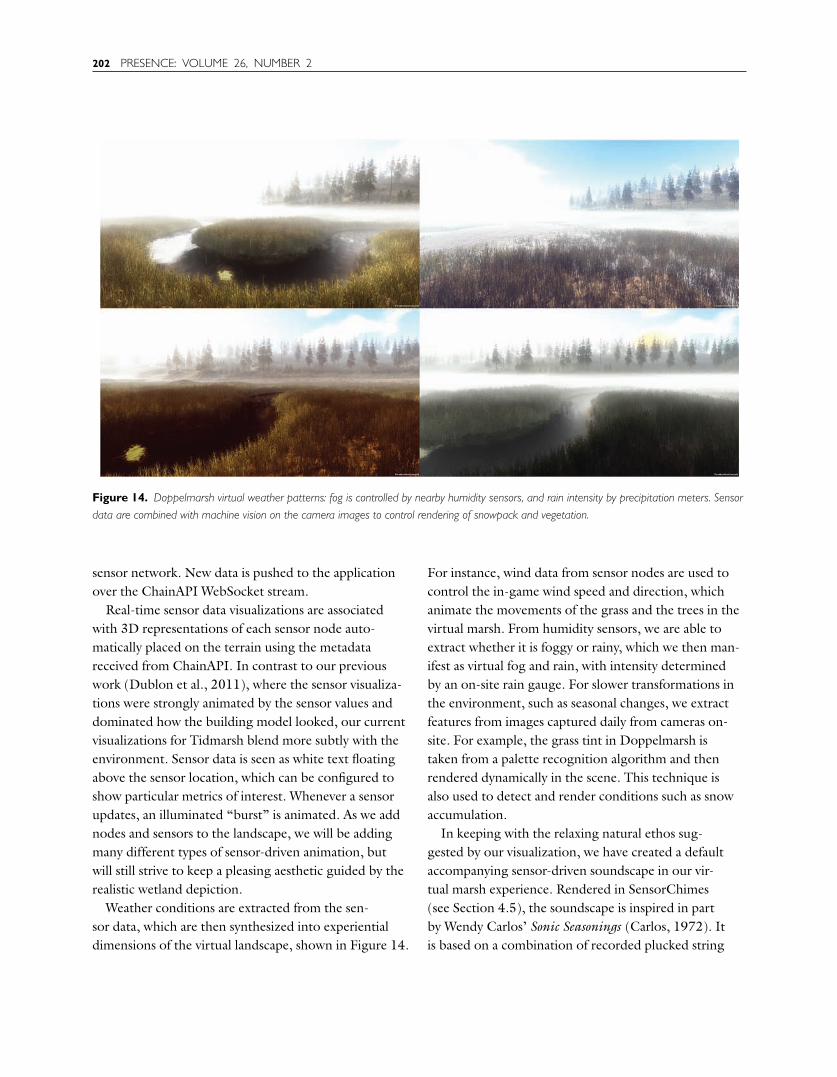
Weather conditions are extracted from the sen-sor data, which are then synthesized into experientialdimensions of the virtual landscape, shown in Figure 14.
For instance, wind data from sensor nodes are used tocontrol the in-game wind speed and direction, whichanimate the movements of the grass and the trees in thevirtual marsh. From humidity sensors, we are able toextract whether it is foggy or rainy, which we then man-ifest as virtual fog and rain, with intensity determinedby an on-site rain gauge. For slower transformations inthe environment, such as seasonal changes, we extractfeatures from images captured daily from cameras on-site. For example, the grass tint in Doppelmarsh istaken from a palette recognition algorithm and thenrendered dynamically in the scene. This technique isalso used to detect and render conditions such as snowaccumulation.
In keeping with the relaxing natural ethos sug-gested by our visualization, we have created a defaultaccompanying sensor-driven soundscape in our vir-tual marsh experience. Rendered in SensorChimes(see Section 4.5), the soundscape is inspired in partby Wendy Carlos’ Sonic Seasonings (Carlos, 1972). Itis based on a combination of recorded plucked string
Mayton et al. 203
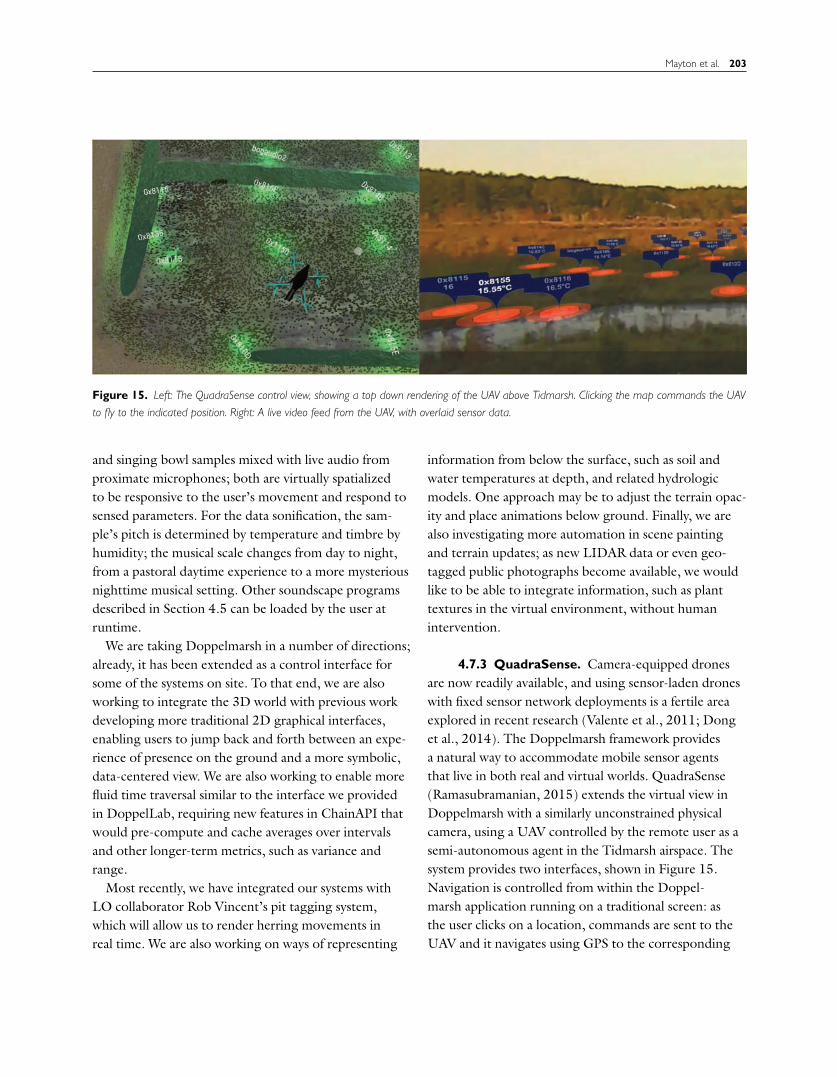
Figure 15. Left: The QuadraSense control view, showing a top down rendering of the UAV above Tidmarsh. Clicking the map commands the UAVto fly to the indicated position. Right: A live video feed from the UAV, with overlaid sensor data.
and singing bowl samples mixed with live audio fromproximate microphones; both are virtually spatializedto be responsive to the user’s movement and respond tosensed parameters. For the data sonification, the sam-ple’s pitch is determined by temperature and timbre byhumidity; the musical scale changes from day to night,from a pastoral daytime experience to a more mysteriousnighttime musical setting. Other soundscape programsdescribed in Section 4.5 can be loaded by the user atruntime.
We are taking Doppelmarsh in a number of directions;already, it has been extended as a control interface forsome of the systems on site. To that end, we are alsoworking to integrate the 3D world with previous workdeveloping more traditional 2D graphical interfaces,enabling users to jump back and forth between an expe-rience of presence on the ground and a more symbolic,data-centered view. We are also working to enable morefluid time traversal similar to the interface we providedin DoppelLab, requiring new features in ChainAPI thatwould pre-compute and cache averages over intervalsand other longer-term metrics, such as variance andrange.
Most recently, we have integrated our systems withLO collaborator Rob Vincent’s pit tagging system,which will allow us to render herring movements inreal time. We are also working on ways of representing
information from below the surface, such as soil andwater temperatures at depth, and related hydrologicmodels. One approach may be to adjust the terrain opac-ity and place animations below ground. Finally, we arealso investigating more automation in scene paintingand terrain updates; as new LIDAR data or even geo-tagged public photographs become available, we wouldlike to be able to integrate information, such as planttextures in the virtual environment, without humanintervention.
4.7.3 QuadraSense. Camera-equipped dronesare now readily available, and using sensor-laden droneswith fixed sensor network deployments is a fertile areaexplored in recent research (Valente et al., 2011; Donget al., 2014). The Doppelmarsh framework providesa natural way to accommodate mobile sensor agentsthat live in both real and virtual worlds. QuadraSense(Ramasubramanian, 2015) extends the virtual view inDoppelmarsh with a similarly unconstrained physicalcamera, using a UAV controlled by the remote user as asemi-autonomous agent in the Tidmarsh airspace. Thesystem provides two interfaces, shown in Figure 15.Navigation is controlled from within the Doppel-marsh application running on a traditional screen: asthe user clicks on a location, commands are sent to theUAV and it navigates using GPS to the corresponding
204 PRESENCE: VOLUME 26, NUMBER 2
Figure 16. Hakoniwa uses a head-mounted augmented reality display (A) to render a real-time sensor-driven miniature marsh landscapeon a tabletop (B).
position in the physical airspace. Simultaneously, near-omnidirectional real-time video imagery from theUAV’s 180◦ camera is presented to the user through ahead-mounted display (HMD). Users see sensor datarendered on top of the real-time imagery of the land-scape, and can switch seamlessly between the alignedvirtual and physical cameras. Turning one’s head in theVR headset dewarps the omnidirectional video in hard-ware to produce a natural and responsive field of viewfor the user.
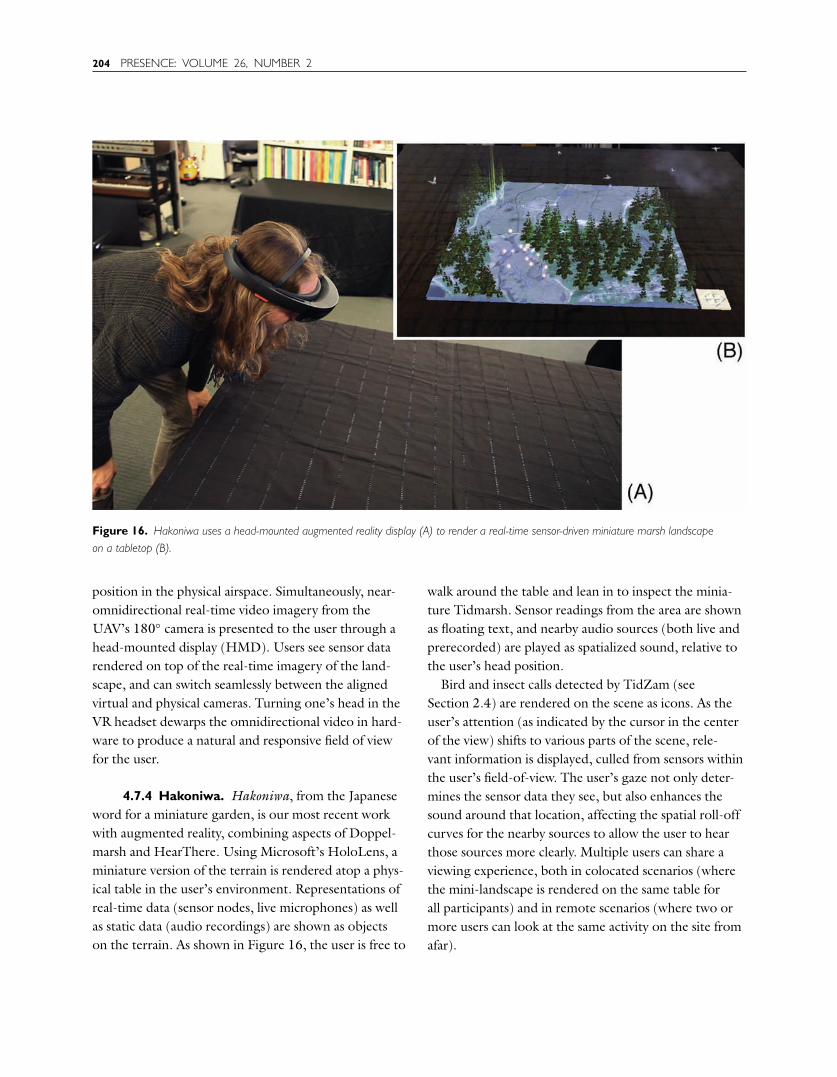
4.7.4 Hakoniwa. Hakoniwa, from the Japaneseword for a miniature garden, is our most recent workwith augmented reality, combining aspects of Doppel-marsh and HearThere. Using Microsoft’s HoloLens, aminiature version of the terrain is rendered atop a phys-ical table in the user’s environment. Representations ofreal-time data (sensor nodes, live microphones) as wellas static data (audio recordings) are shown as objectson the terrain. As shown in Figure 16, the user is free to
walk around the table and lean in to inspect the minia-ture Tidmarsh. Sensor readings from the area are shownas floating text, and nearby audio sources (both live andprerecorded) are played as spatialized sound, relative tothe user’s head position.
Bird and insect calls detected by TidZam (seeSection 2.4) are rendered on the scene as icons. As theuser’s attention (as indicated by the cursor in the centerof the view) shifts to various parts of the scene, rele-vant information is displayed, culled from sensors withinthe user’s field-of-view. The user’s gaze not only deter-mines the sensor data they see, but also enhances thesound around that location, affecting the spatial roll-offcurves for the nearby sources to allow the user to hearthose sources more clearly. Multiple users can share aviewing experience, both in colocated scenarios (wherethe mini-landscape is rendered on the same table forall participants) and in remote scenarios (where two ormore users can look at the same activity on the site fromafar).
Mayton et al. 205
Figure 17. The HearThere head-mounted wearable device for auditory augmented reality: the wearer gazing across this marsh instrumentedwith microphones is able to hear spatial live sound as well as spatial sonification of the sensor data. Insets: compact version 2 with eye tracker(top left), precision tracking development version 1 (bottom left).
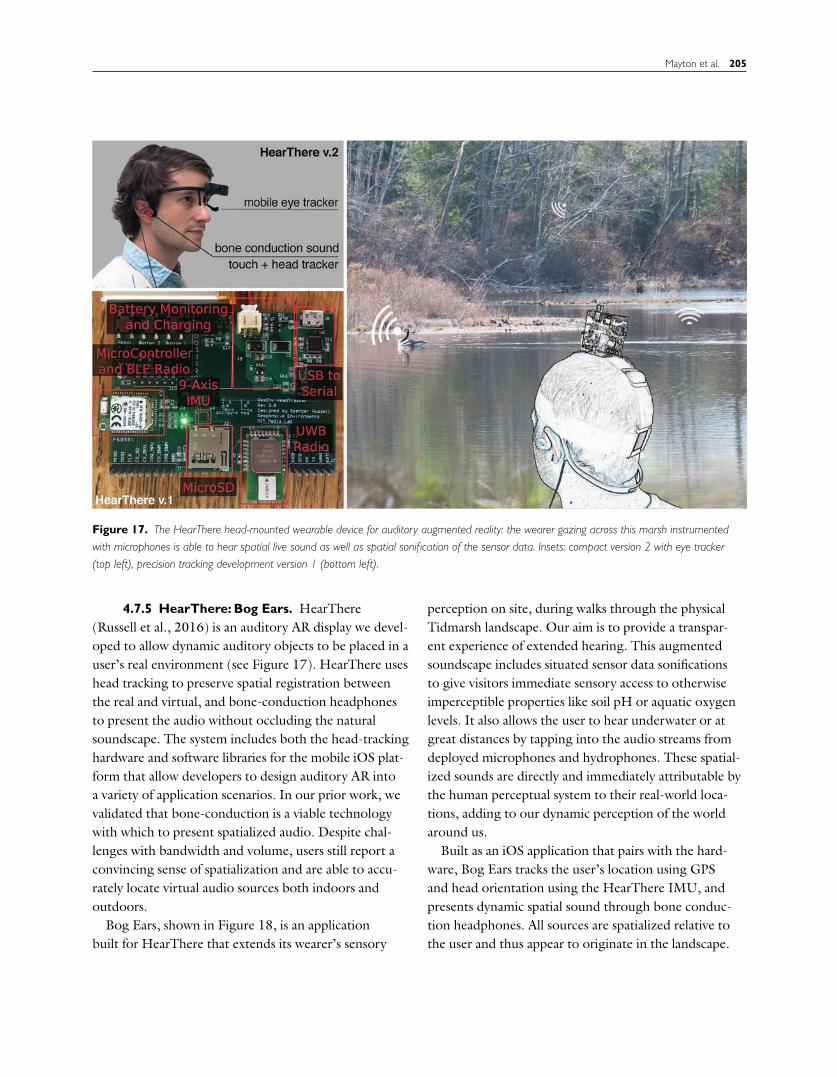
4.7.5 HearThere: Bog Ears. HearThere(Russell et al., 2016) is an auditory AR display we devel-oped to allow dynamic auditory objects to be placed in auser’s real environment (see Figure 17). HearThere useshead tracking to preserve spatial registration betweenthe real and virtual, and bone-conduction headphonesto present the audio without occluding the naturalsoundscape. The system includes both the head-trackinghardware and software libraries for the mobile iOS plat-form that allow developers to design auditory AR intoa variety of application scenarios. In our prior work, wevalidated that bone-conduction is a viable technologywith which to present spatialized audio. Despite chal-lenges with bandwidth and volume, users still report aconvincing sense of spatialization and are able to accu-rately locate virtual audio sources both indoors andoutdoors.
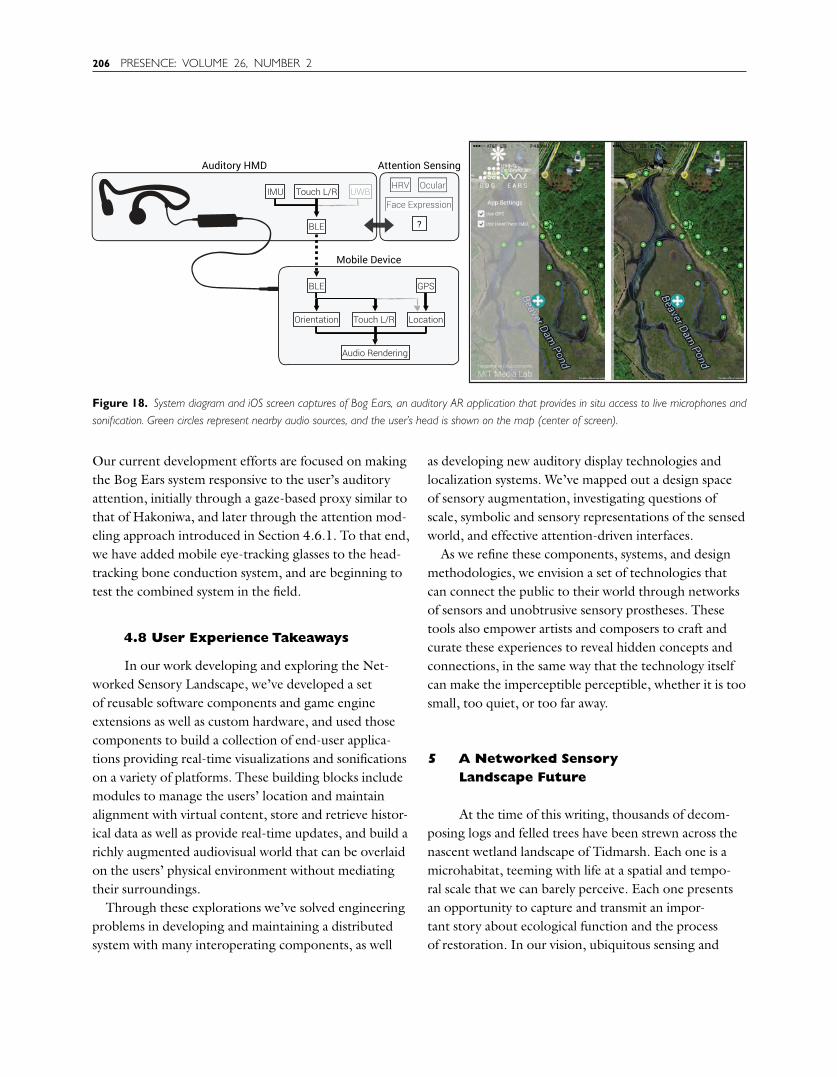
Bog Ears, shown in Figure 18, is an applicationbuilt for HearThere that extends its wearer’s sensory
perception on site, during walks through the physicalTidmarsh landscape. Our aim is to provide a transpar-ent experience of extended hearing. This augmentedsoundscape includes situated sensor data sonificationsto give visitors immediate sensory access to otherwiseimperceptible properties like soil pH or aquatic oxygenlevels. It also allows the user to hear underwater or atgreat distances by tapping into the audio streams fromdeployed microphones and hydrophones. These spatial-ized sounds are directly and immediately attributable bythe human perceptual system to their real-world loca-tions, adding to our dynamic perception of the worldaround us.
Built as an iOS application that pairs with the hard-ware, Bog Ears tracks the user’s location using GPSand head orientation using the HearThere IMU, andpresents dynamic spatial sound through bone conduc-tion headphones. All sources are spatialized relative tothe user and thus appear to originate in the landscape.
206 PRESENCE: VOLUME 26, NUMBER 2
Figure 18. System diagram and iOS screen captures of Bog Ears, an auditory AR application that provides in situ access to live microphones andsonification. Green circles represent nearby audio sources, and the user’s head is shown on the map (center of screen).
Our current development efforts are focused on makingthe Bog Ears system responsive to the user’s auditoryattention, initially through a gaze-based proxy similar tothat of Hakoniwa, and later through the attention mod-eling approach introduced in Section 4.6.1. To that end,we have added mobile eye-tracking glasses to the head-tracking bone conduction system, and are beginning totest the combined system in the field.
4.8 User Experience Takeaways
In our work developing and exploring the Net-worked Sensory Landscape, we’ve developed a setof reusable software components and game engineextensions as well as custom hardware, and used thosecomponents to build a collection of end-user applica-tions providing real-time visualizations and sonificationson a variety of platforms. These building blocks includemodules to manage the users’ location and maintainalignment with virtual content, store and retrieve histor-ical data as well as provide real-time updates, and build arichly augmented audiovisual world that can be overlaidon the users’ physical environment without mediatingtheir surroundings.
Through these explorations we’ve solved engineeringproblems in developing and maintaining a distributedsystem with many interoperating components, as well
as developing new auditory display technologies andlocalization systems. We’ve mapped out a design spaceof sensory augmentation, investigating questions ofscale, symbolic and sensory representations of the sensedworld, and effective attention-driven interfaces.
As we refine these components, systems, and designmethodologies, we envision a set of technologies thatcan connect the public to their world through networksof sensors and unobtrusive sensory prostheses. Thesetools also empower artists and composers to craft andcurate these experiences to reveal hidden concepts andconnections, in the same way that the technology itselfcan make the imperceptible perceptible, whether it is toosmall, too quiet, or too far away.
5 A Networked SensoryLandscape Future
At the time of this writing, thousands of decom-posing logs and felled trees have been strewn across thenascent wetland landscape of Tidmarsh. Each one is amicrohabitat, teeming with life at a spatial and tempo-ral scale that we can barely perceive. Each one presentsan opportunity to capture and transmit an impor-tant story about ecological function and the processof restoration. In our vision, ubiquitous sensing and
Mayton et al. 207
computation weave into the natural environment toform the Networked Sensory Landscape that wouldmake that story possible. Inspired by work in acousticecology (Dunn & Crutchfield, 2006), we are developingvibration pickups and other sensors to capture the insectlife and natural processes within. At the same time, lever-aging the interface components introduced here, we areinvestigating new ways of experiencing these processes.For example, a virtual log could be presented at full scaleon a tabletop, allowing users to peer in and listen, or bemagnified substantially to allow users to walk throughtheir buzzing interiors. On the site itself, a passer-bywearing HearThere might stop and sit on the log tolisten to its rich history condensed into a few minutes.Our design process around this single example reflectsthe approach we are taking overall: meaningful sensingthat both advances the science and offers transformativeexperiences of presence within ecological processes andacross scales.
Through virtual world “browsers,” we use sensorinformation to resynthesize reality. In these physi-cally linked virtual environments, users can float acrossa landscape that maintains a natural aesthetic whilebeing augmented by animation, spatial sonification,and live sound that together bring invisible phenom-ena into view. Our experiments in the user experienceof ubiquitous sensing point at different ways people canbe connected to a dense sensor infrastructure. Theseinclude wearable devices that extend the perception ofon-site scientists and visitors through attention-drivenmanifestations of embedded sensor data, a frameworkfor mapping the data to music and sound, and mobileagents such as UAVs. To accommodate the diverserequirements of these different applications, we presentour hypermedia framework for flexibly organizing andaccessing sensor data. Demonstrating the effectivenessof this approach for building interconnected sensor sys-tems, we introduce our ongoing work in recognizingbirds and wildlife from linked audio streams and postingthe results as virtual sensors. Each of these applicationsopens up a plethora of exciting future work.
Broadly, while the world is captivated by the Inter-net of Things, far less attention has been paid to theways in which our senses of presence can be altered
by seamless connection to the sensors appearing allaround us. In “Beyond Being There,” Hollan and Stor-netta (1992) posit that telepresence would not meetits full potential until users could do more remotelythan on location. While still in its infancy, the Net-worked Sensory Landscape points to something evenbeyond Hollan’s imagination, as we see a parallel con-nected world and hear its music develop from day tonight, season to season, and year to year. That worldwill both transform physical presence and enable newforms of telepresence. As large sensor networks becomeincreasingly commonplace, their data are forming arich medium upon which artists can build creationsthat continually evolve and grow, driven by underly-ing activity that reveals both patterns and exceptions incompelling ways. Today we can “tune in” to a wetland,hearing it through the ears of an artist of our choice;tomorrow we could experience a resynthesized city as asymphonic sensory landscape, heralding a new art formof interpretive presence enabled by ubiquitous sensing.
More information on the work presented inthis article, as well as live data, project videos,and downloadable applications, are available athttp://tidmarsh.media.mit.edu. More informationabout the Living Observatory, a learning collaborativeformed around the Tidmarsh wetland restoration, isavailable at http://livingobservatory.org.
Acknowledgments
This article was made possible with the support of manyindividual and institutional partners. Thanks to TidmarshFarms for providing the restoration landscape that containsand inspires our work; to the Living Observatory (LO) forunderwriting sensor node hardware and other physical infras-tructure; to Alex Hackman, MA Department of EcologicalRestoration, for his passionate work and continuing insights;to Brian Spires; to Jessica Norriss and Charis Durrance ofLO; and to Paula Aguilera and Jonathan Williams. Thanksto Mary Murphy-Hoye, to Intel and EMC for their in-kindand financial support, and to the sponsors of the MIT MediaLab.
Thanks to our affiliates at MIT: Qiansheng Li, for his workvisualizing sensor data (MarshVis); Sara Remsen, for her the-sis on environmental models in VR; Halsey Burgund, for

208 PRESENCE: VOLUME 26, NUMBER 2
Roundware and Bog People, from which we draw recordedaudio content; undergraduate researcher Ben Eck; and RobertVincent, of MIT Sea Grant, for his work on wildlife trackingsystems that interface in real time with our network.
Thanks to our natural sciences partners: Kate Ballan-tine, Assistant Professor of Environmental Studies at MountHolyoke and Christine E. Hatch, Assistant Professor of Geo-sciences at UMass, for their indispensable guidance in sensordevelopment and deployment. Thanks to the US EPA fortheir critical work on the site and across the region, and toour landscape partners: USDA-NRCS, USFWS, NOAA,MA Environmental Trust (MET), MA Fish and Game, andthe Town of Plymouth. Thanks to Mass Audubon and BobWilber, its Director of Land Conservation, for establishing awildlife sanctuary at Tidmarsh, and for their stewardship ofthe nature of Massachusetts.
References
Battersby, S. E., Finn, M. P., Usery, E. L., & Yamamoto,K. H. (2014). Implications of Web Mercator and its usein online mapping. Cartographica: The International Jour-nal for Geographic Information and Geovisualization, 49(2),85–101.
Bidgood, J. (2017). The rewilding of a century-old cran-berry bog. The New York Times, A9. Retrieved fromhttps://nyti.ms/2tHX8hX
Brandes, T. S. (2008). Automated sound recording and anal-ysis techniques for bird surveys and conservation. BirdConservation International, 18(S1), S163–S173.
Carlos, W. (1972). Sonic seasonings. Columbia Records.Dobson, K. (2016). The energy propagated. Retrieved from
http://cargocollective.com/TheEnergyPropagatedDong, M., Ota, K., Lin, M., Tang, Z., Du, S., & Zhu, H.
(2014). UAV-assisted data gathering in wireless sen-sor networks. The Journal of Supercomputing, 70(3),1142–1155.
Dublon, G., & Paradiso, J. A. (2014). Extra SensoryPerception. Scientific American, 311(1), 36–41.
Dublon, G., Pardue, L. S., Mayton, B., Swartz, N., Joliat, N.,Hurst, P., & Paradiso, J. A. (2011). DoppelLab: Tools forexploring and harnessing multimodal sensor network data.IEEE International Conference on Sensors, 1612–1615.
Dunn, D., & Crutchfield, J. P. (2006). Insects, trees, andclimate: The bioacoustic ecology of deforestation and ento-mogenic climate change. arXiv preprint q-bio/0612019
Fielding, R. T. (2000). Architectural styles and the design ofnetwork-based software architectures (Unpublished doctoraldissertation). University of California, Irvine.
Guinard, D., Trifa, V., & Wilde, E. (2010). A resource ori-ented architecture for the web of things. Internet of things(IOT) (pp. 1–8).
Haddad, D. D., Dublon, G., Mayton, B., Russell, S., Xiao, X.,Perlin, K., & Paradiso, J. A. (2017). Resynthesizing reality:Driving vivid virtual environments from sensor networks.SIGGRAPH Talks, 51, 1–2.
Helmreich, S. (2016). Melt. Theorizing the contem-porary. Cultural anthropology website. Retrieved fromhttps://culanth.org/fieldsights/801-melt
Hill, J. L., & Culler, D. E. (2002). Mica: A wireless plat-form for deeply embedded networks. IEEE Micro, 22(6),12–24.
Hollan, J., & Stornetta, S. (1992). Beyond being there. Pro-ceedings of the ACM SIGCHI Conference on Human Factorsin Computing Systems, 119–125.
Hopkin, B. (2005). Wind chimes design and construction: Abook and audio CD. Experimental Musical Instruments.
Hu, W., Bulusu, N., Chou, C. T., Jha, S., Taylor, A., & Tran,V. N. (2009). Design and evaluation of a hybrid sensornetwork for cane toad monitoring. ACM Transactions onSensor Networks, 5(1), 1–28.
Interfluve. (2015). Tidmarsh Restoration Project [Engineeringdrawings].
Jacobs, R. A., Jordan, M. I., Nowlan, S. J., & Hinton,G. E. (1991). Adaptive mixtures of local experts. NeuralComputation, 3(1), 79–87.
King, G. R., Piekarski, W., & Thomas, B. H. (2005). ARVino:Outdoor augmented reality visualisation of viticultureGIS data. IEEE International Symposium on Mixed andAugmented Reality. doi:10.1109/ISMAR.2005.14
Levis, P., Madden, S., Polastre, J., Szewczyk, R., Whitehouse,K., Woo, A., … Culler, D. (2005). Tinyos: An operatingsystem for sensor networks. In W. Weber, J. Rabaey, & E.Aarts (Eds.), Ambient intelligence (pp. 115–148). Berlin:Springer.
Li, Q., Dublon, G., Mayton, B., & Paradiso, J. A. (2015).MarshVis: Visualizing real-time and historical ecological datafrom a wireless sensor network. Tech. Rep. MIT Media Lab.Cambridge, MA.
Libelium—Connecting sensors to the cloud. (2015). Retrievedfrom http://www.libelium.com
Lifton, J., Laibowitz, M., Harry, D., Gong, N. W., Mittal,M., & Paradiso, J. A. (2009). Metaphor and manifestation:
Mayton et al. 209
Cross-reality with ubiquitous sensor/actuator networks. IEEEPervasive Computing, 8(3).
Lloret, J., Garcia, M., Bri, D., & Sendra, S. (2009). A wire-less sensor network deployment for rural and forest firedetection and verification. IEEE Sensors, 9(11), 8722–8747.
Locke, D. (2010). MQ Telemetry Transport (MQTT) V3.1Protocol Specification. IBM Developerworks TechnicalLibrary. Retrieved from http://www.ibm.com/developerworks/webservices/library/ws-mqtt/index.html
Lynch, E. F., & Paradiso, J. A. (2016). SensorChimes:Musical mapping for sensor networks. Conference on NewInterfaces for Musical Expression, 137–142.
Marquardt, N., Gross, T., Carpendale, S., & Greenberg, S.(2010). Revealing the invisible: Visualizing the locationand event flow of distributed physical devices. Interna-tional Conference on Tangible, Embedded, and EmbodiedInteraction, 41–48.
Massachussetts Audubon Society. (2017). Discover Tidmarsh:Take a walk on the wildflower side. Mass Audubon ExploreNewsletter. Retrieved from http://massaudubon.org/news-events/publications/explore/spring-2017
Memsic, Inc.—Wireless Sensor Networks. (2015). Retrievedfrom http://www.memsic.com/wireless-sensor-networks
Michel, S., Salehi, A., Luo, L., Dawes, N., Aberer, K.,Barrenetxea, G., … Zhou, Y. (2009). Environmental mon-itoring 2.0. International Conference on Data Engineering,1507–1510.
Pfisterer, D., Romer, K., Bimschas, D., Kleine, O., Mietz, R.,Truong, C., … Richardson, R. (2011). SPITFIRE: Towarda semantic web of things. IEEE Communications Magazine,49(11), 40–48.
Ramasubramanian, V. (2015). Quadrasense: Immersive UAV-based cross-reality environmental sensor networks. Master’sthesis, Massachusetts Institute of Technology.
Remsen, S. (2017). Visualizing models driven by real-time,sensor-based data: A new way to experience the inner work-ings of ecosystems. Master’s thesis, Massachusetts Institute ofTechnology.
Rundel, P. W., Graham, E. A., Allen, M. F., Fisher, J. C.,& Harmon, T. C. (2009). Environmental sensor
networks in ecological research. New Phytologist, 182(3),589–607.
Russell, S., Dublon, G., & Paradiso, J. A. (2016). HearThere:Networked sensory prosthetics through auditory aug-mented reality. Proceedings of the ACM Augmented HumanInternational Conference, 20, 1–8.
Russell, S., & Paradiso, J. A. (2014). Hypermedia APIs forsensor data: A pragmatic approach to the web of things.Proceedings of the 11th International Conference on Mobileand Ubiquitous Systems: Computing, Networking andServices, 30–39.
Shelby, Z., Hartke, K., Bormann, C., & Frank, B. (2014).Rfc 7252: The Constrained Application Protocol (CoAP).Internet Engineering Task Force.
Soldatos, J., Kefalakis, N., Hauswirth, M., Serrano, M., Cal-bimonte, J. P., Riahi, M., … Herzog, R. (n.d.). Open IoT:Open Source Internet-of-Things in the Cloud, 13–25.
Stowell, D., & Plumbley, M. D. (2014). Automatic large-scale classification of bird sounds is strongly improved byunsupervised feature learning. PeerJ, 2, e488.
Szewczyk, R., Mainwaring, A., Polastre, J., Anderson, J., &Culler, D. (2004). An analysis of a large scale habitat mon-itoring application. International Conference on EmbeddedNetworked Sensor Systems, 2, 214–226.
Valente, J., Sanz, D., Barrientos, A., Cerro, J. D., Ribeiro, Á.,& Rossi, C. (2011). An air-ground wireless sensor networkfor crop monitoring. MDPI Sensors, 11(6), 6088–6108.
Vorenhout, M., van der Geest, H. G., & Hunting, E. R.(2011). An improved datalogger and novel probes forcontinuous redox measurements in wetlands. Interna-tional Journal of Environmental and Analytical Chemistry,91(7–8), 801–810.
Watras, C. J., Morrow, M., Morrison, K., Scannell, S., Yazi-ciaglu, S., Read, J. S., … Kratz, T. (2014). Evaluation ofwireless sensor networks (WSNs) for remote wetland moni-toring: Design and initial results. Environmental Monitoringand Assessment, 186(2), 919–934.
Zedler, J. B., & Kercher, S. (2005). Wetland resources: Status,trends, ecosystem services, and restorability. Annual Reviewof Environment and Resources, 30, 39–74.