the noaa hurricane hunters: a historical and mission
TRANSCRIPT
The Florida Geographer
57
The NOAA Hurricane Hunters: A Historical and Mission Perspective
Jennifer Collins
University of South Florida
Paul Flaherty
National Oceanic and Atmospheric Administration (NOAA)
Tropical cyclones are one of nature’s most destructive weather events. As such, not only are they
important financially, with hurricanes such as Andrew causing $US 38.4 billion of damage, but
also in terms of loss of life, with storms such as the Labor Day 1935 Hurricane being responsible
for just over 400 deaths. A tropical cyclone is a generic term for a non-frontal (barotropic)
synoptic scale low pressure system over tropical or sub-tropical waters with organized
convection and definite cyclonic surface wind circulation (Holland, 1993). When considering
storms in the North Atlantic and Eastern North Pacific, the weakest classification for tropical
cyclones is the 'tropical depression' which has maximum sustained surface (at a height of 33 ft or
10 m) winds over a one-minute average of greater than 11 m s-1 (22 knots) but less than 17.5 m
s-1 (34 knots). This may develop into a 'tropical storm' if wind speeds reach 17.5 m s-1. At this
stage a name would be assigned to the system. Another classification is made at 33 m s-1 (64
knots) when the term 'hurricane' is used. A further distinction is made between a hurricane and
an 'intense (or major) hurricane' when wind speeds become greater than 50 m s-1 (96knots). This
may also be described as a major hurricane of category 3 or above, according to the Saffir-
Simpson scale which describes hurricane wind speeds (Landsea, 1993; Elsner and Kara, 1999).
Tropical cyclones develop over the warm open ocean, and while satellites have been able to track
their movement since 1961 (with Hurricane Esther being the first hurricane observed by
satellite), aircraft reconnaissance has remained an important eye in the sky to get the most
accurate information about the storm. Since its creation in the early 1960’s, the NOAA
Hurricane Hunters have provided the nation with increasingly-sophisticated atmospheric data in
the hurricane environment, to aid NOAA and the National Hurricane Center (NHC) in depicting
storms more accurately and in predicting hurricane track and intensity. The history of “hunting”
hurricanes extends back to 1943 with the first flight into a hurricane eye by U.S. Army Air
Forces (USAAF) Colonel Joseph Duckworth (Dorst 2007). By the following year,
reconnaissance missions into tropical systems were being flown by the USAAF, with assistance
from the U.S. Weather Bureau (USWB) and the U.S. Navy. During a U.S. government
reorganization in 1970, the National Oceanic and Atmospheric Administration (NOAA) was
created, and USWB services were transferred to the NOAA National Weather Service (NWS)
(Dorst 2007). Currently, reconnaissance flights are conducted primarily by the US Air Force
Reserve’s 53rd Weather Reconnaissance Squadron stationed at Keesler Air Force Base in Biloxi,
Mississippi, while research and surveillance missions are conducted primarily by NOAA’s
Hurricane Hunters out of Tampa, Florida (NOAA Aircraft Operations Center Science Section
n.d.).
Based out of MacDill Air Force Base in Tampa since January 1993, NOAA Hurricane Hunter
aircraft are operated and maintained by NOAA’s Aircraft Operations Center (AOC). Under
NOAA’s Office of Marine and Aviation Operations (OMAO) since the early 1990’s, the NOAA
Hurricane Hunters and the AOC were born out of the Research Flight Facility (RFF), which

Collins and Flaherty
58
operated out of the Miami International Airport from 1961 through 1992. NOAA's mission states
(NOAA (a) n.d):
“Science, Service, and Stewardship.
To understand and predict changes in climate, weather, oceans, and coasts,
To share that knowledge and information with others, and
To conserve and manage coastal and marine ecosystems and resources.”
The very specialized NOAA aircraft directly support this mission statement by providing
scientists with unique platforms to precisely observe, measure and chart the dynamics of our
oceans and atmosphere.
Some of the duties that fall under the AOC include weather research and data accumulation,
overseeing aircraft use pertaining to weather events, and providing planning services for fisheries
and coastal management (Sullivan n.d.). During the hurricane season, the aircraft and crew
gather data in and around tropical systems, providing this information to organizations such as
the National Hurricane Center based in Miami, FL. This information is also available to the
media, emergency managers, and to the public in near-real time. While the data is used by
computer models to help forecast the track and intensity of the storm, it is also used by
forecasters to verify pertinent storm information forecasted in prior model runs. This verification
step becomes even more critical when individual computer models output different track and/or
intensification forecasts.
When not flying into tropical systems such as Hurricane Katrina (Figure 1), the NOAA
Hurricane Hunters are involved in other weather research and operational projects including
winter storm reconnaissance (e.g. Majumdar et al. 2010), air quality studies (e.g. Langford et al.
2011), low-level jet experiments (e.g. Vera et al. 2006), atmospheric rivers (e.g. Neiman et al.
2011), BAMEX (Bow echo and mesoscale convective vortex experiment; e.g. Storm et al. 2011),
drylines (e.g. Hane et al. 2001), mountain waves (e.g. Garvert et al. 2011), MJO research (e.g.
Kerns and Chen 2013), and a myriad of other meteorological and climatological studies.
Figure 1: Hurricane Katrina, 2005
The Florida Geographer
59
When not flying science missions, hurricane hunters remain active through training and
simulation exercises, reviewing aircraft regulations and policies, maintaining aircraft and
scientific equipment, reviewing and updating data collection and quality control procedures,
attending conferences on relevant scientific technologies and advancements (NOAA (b) 2012),
and speaking with students and other public groups about the importance of the missions.
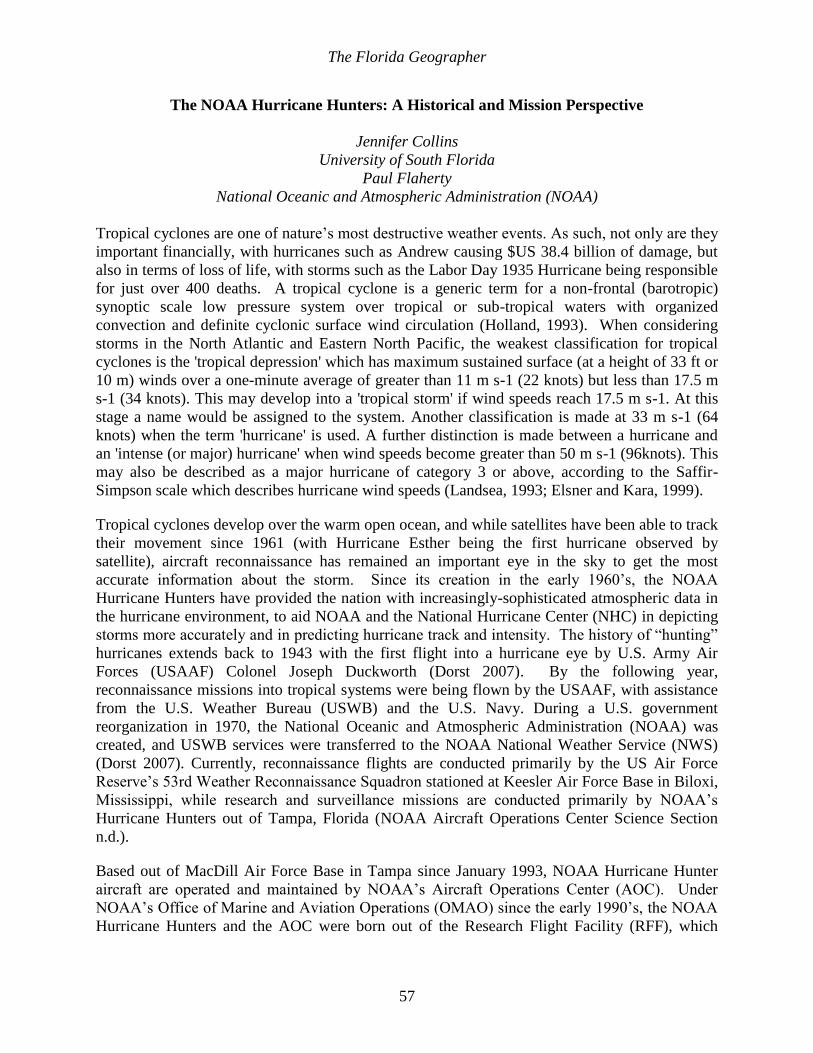
Flight Meteorologists, also known as Flight Directors at the AOC, continually work to ensure
that the data collected by the aircraft are of the highest quality. On a normal flight day, Flight
Directors arrive at the office up to 3 hours before the planned take-off time in order to analyze
the 'area of operations', or the storm environment. Along with mission scientists, they outline a
plan that allows the aircraft to meet the science objectives of the day in a safe and efficient
manner. Two hours before take-off, the Flight Director meets with the AOC flight crew to
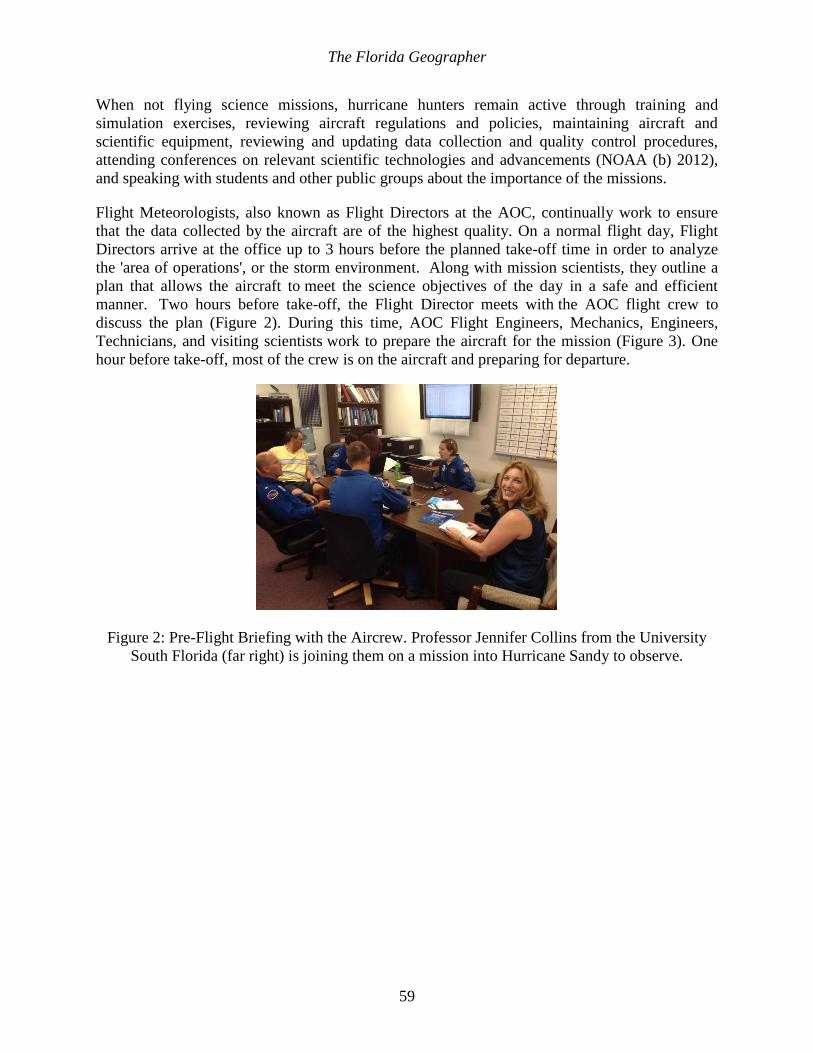
discuss the plan (Figure 2). During this time, AOC Flight Engineers, Mechanics, Engineers,
Technicians, and visiting scientists work to prepare the aircraft for the mission (Figure 3). One
hour before take-off, most of the crew is on the aircraft and preparing for departure.
Figure 2: Pre-Flight Briefing with the Aircrew. Professor Jennifer Collins from the University
South Florida (far right) is joining them on a mission into Hurricane Sandy to observe.
Collins and Flaherty
60
Figure 3: Scientists Help AOC Crewmembers Load and Secure Airborne Expendables for an
Upcoming Mission
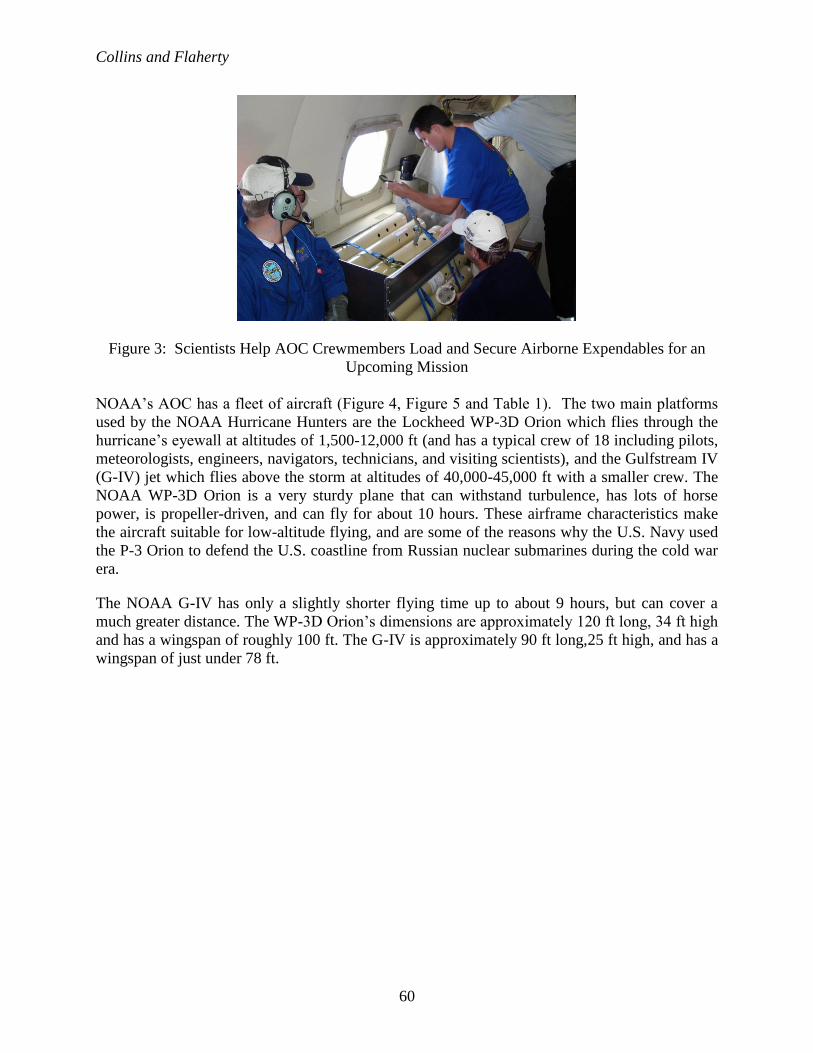
NOAA’s AOC has a fleet of aircraft (Figure 4, Figure 5 and Table 1). The two main platforms
used by the NOAA Hurricane Hunters are the Lockheed WP-3D Orion which flies through the
hurricane’s eyewall at altitudes of 1,500-12,000 ft (and has a typical crew of 18 including pilots,
meteorologists, engineers, navigators, technicians, and visiting scientists), and the Gulfstream IV
(G-IV) jet which flies above the storm at altitudes of 40,000-45,000 ft with a smaller crew. The
NOAA WP-3D Orion is a very sturdy plane that can withstand turbulence, has lots of horse
power, is propeller-driven, and can fly for about 10 hours. These airframe characteristics make
the aircraft suitable for low-altitude flying, and are some of the reasons why the U.S. Navy used
the P-3 Orion to defend the U.S. coastline from Russian nuclear submarines during the cold war
era.
The NOAA G-IV has only a slightly shorter flying time up to about 9 hours, but can cover a
much greater distance. The WP-3D Orion’s dimensions are approximately 120 ft long, 34 ft high
and has a wingspan of roughly 100 ft. The G-IV is approximately 90 ft long,25 ft high, and has a
wingspan of just under 78 ft.
The Florida Geographer
61
Figure 4: NOAA’s Aircraft Operations Center Fleet. The NOAA G-IV is at the back middle, the two WP-3D Orion planes are at the back right and left, the King Air is at the front middle, the Turbo (Jet Prop)
Commanders are at the front, and the Twin Otters are the blue planes (second from front).
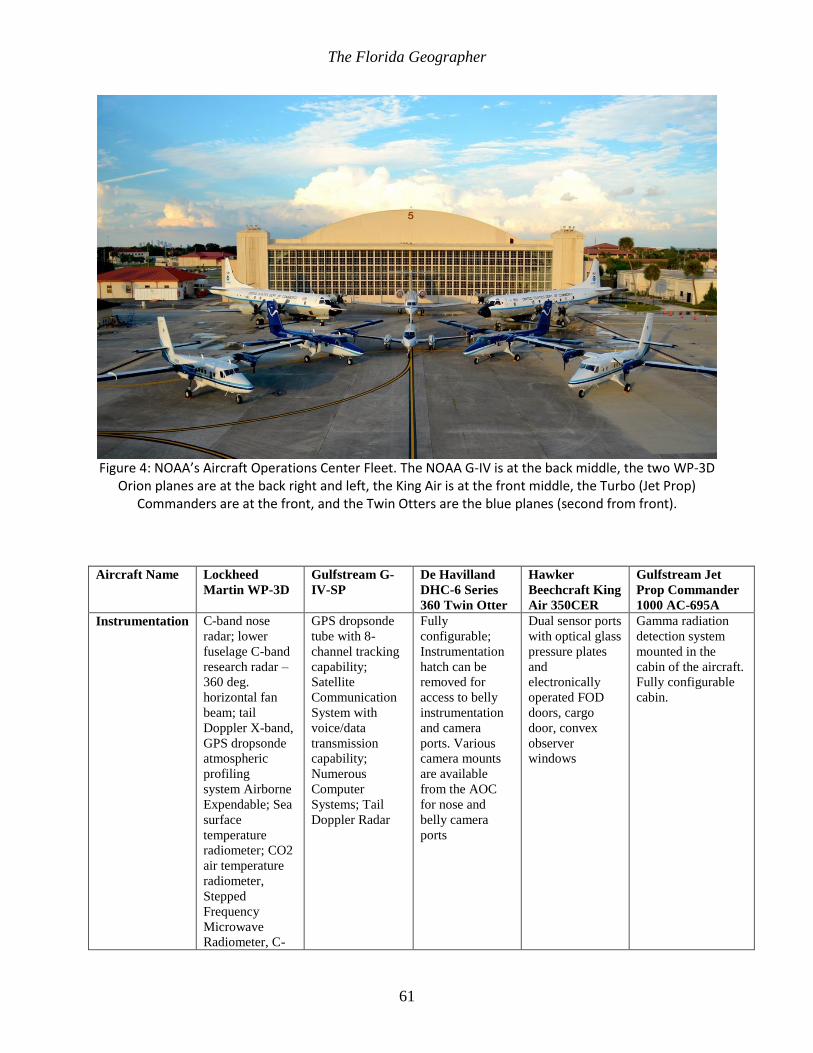
Aircraft Name Lockheed
Martin WP-3D
Gulfstream G-
IV-SP
De Havilland
DHC-6 Series
360 Twin Otter
Hawker
Beechcraft King
Air 350CER
Gulfstream Jet
Prop Commander
1000 AC-695A
Instrumentation C-band nose
radar; lower
fuselage C-band
research radar –
360 deg.
horizontal fan
beam; tail
Doppler X-band,
GPS dropsonde
atmospheric
profiling
system Airborne
Expendable; Sea
surface
temperature
radiometer; CO2
air temperature
radiometer,
Stepped
Frequency
Microwave
Radiometer, C-
GPS dropsonde
tube with 8-
channel tracking
capability;
Satellite
Communication
System with
voice/data
transmission
capability;
Numerous
Computer
Systems; Tail
Doppler Radar
Fully
configurable;
Instrumentation
hatch can be
removed for
access to belly
instrumentation
and camera
ports. Various
camera mounts
are available
from the AOC
for nose and
belly camera
ports
Dual sensor ports
with optical glass
pressure plates
and
electronically
operated FOD
doors, cargo
door, convex
observer
windows
Gamma radiation
detection system
mounted in the
cabin of the aircraft.
Fully configurable
cabin.
Collins and Flaherty
62
band and Ku-
band
scatterometers
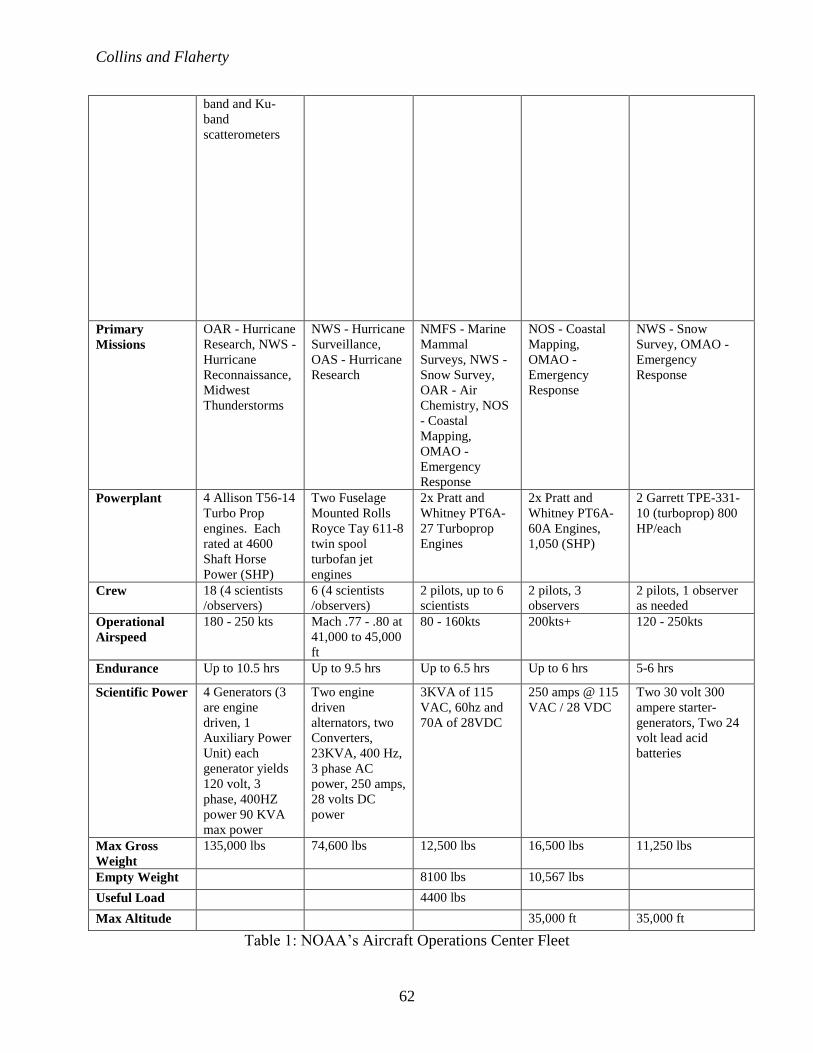
Primary
Missions
OAR - Hurricane
Research, NWS -
Hurricane
Reconnaissance,
Midwest
Thunderstorms
NWS - Hurricane
Surveillance,
OAS - Hurricane
Research
NMFS - Marine
Mammal
Surveys, NWS -
Snow Survey,
OAR - Air
Chemistry, NOS
- Coastal
Mapping,
OMAO -
Emergency
Response
NOS - Coastal
Mapping,
OMAO -
Emergency
Response
NWS - Snow
Survey, OMAO -
Emergency
Response
Powerplant 4 Allison T56-14
Turbo Prop
engines. Each
rated at 4600
Shaft Horse
Power (SHP)
Two Fuselage
Mounted Rolls
Royce Tay 611-8
twin spool
turbofan jet
engines
2x Pratt and
Whitney PT6A-
27 Turboprop
Engines
2x Pratt and
Whitney PT6A-
60A Engines,
1,050 (SHP)
2 Garrett TPE-331-
10 (turboprop) 800
HP/each
Crew 18 (4 scientists
/observers)
6 (4 scientists
/observers)
2 pilots, up to 6
scientists
2 pilots, 3
observers
2 pilots, 1 observer
as needed
Operational
Airspeed
180 - 250 kts Mach .77 - .80 at
41,000 to 45,000
ft
80 - 160kts 200kts+ 120 - 250kts
Endurance Up to 10.5 hrs Up to 9.5 hrs Up to 6.5 hrs Up to 6 hrs 5-6 hrs
Scientific Power 4 Generators (3
are engine
driven, 1
Auxiliary Power
Unit) each
generator yields
120 volt, 3
phase, 400HZ
power 90 KVA
max power
Two engine
driven
alternators, two
Converters,
23KVA, 400 Hz,
3 phase AC
power, 250 amps,
28 volts DC
power
3KVA of 115
VAC, 60hz and
70A of 28VDC
250 amps @ 115
VAC / 28 VDC
Two 30 volt 300
ampere starter-
generators, Two 24
volt lead acid
batteries
Max Gross
Weight
135,000 lbs 74,600 lbs 12,500 lbs 16,500 lbs 11,250 lbs
Empty Weight 8100 lbs 10,567 lbs
Useful Load 4400 lbs
Max Altitude 35,000 ft 35,000 ft
Table 1: NOAA’s Aircraft Operations Center Fleet
The Florida Geographer
63
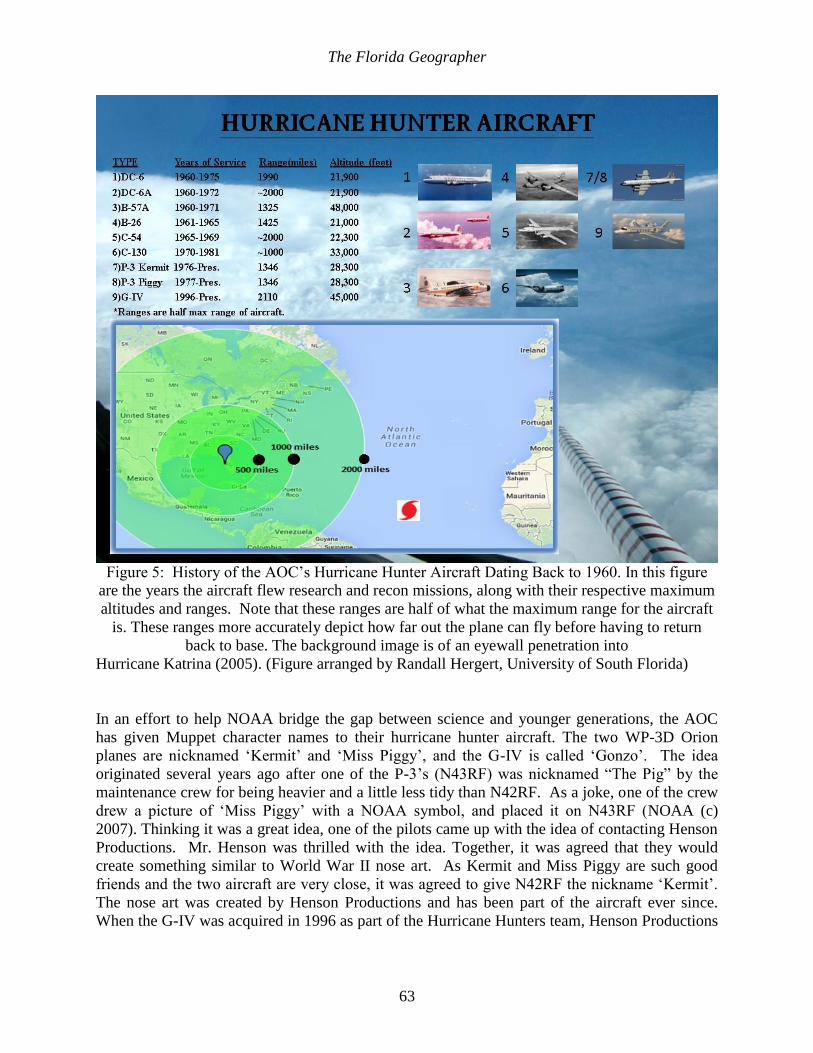
Figure 5: History of the AOC’s Hurricane Hunter Aircraft Dating Back to 1960. In this figure
are the years the aircraft flew research and recon missions, along with their respective maximum
altitudes and ranges. Note that these ranges are half of what the maximum range for the aircraft
is. These ranges more accurately depict how far out the plane can fly before having to return
back to base. The background image is of an eyewall penetration into
Hurricane Katrina (2005). (Figure arranged by Randall Hergert, University of South Florida)
In an effort to help NOAA bridge the gap between science and younger generations, the AOC
has given Muppet character names to their hurricane hunter aircraft. The two WP-3D Orion
planes are nicknamed ‘Kermit’ and ‘Miss Piggy’, and the G-IV is called ‘Gonzo’. The idea
originated several years ago after one of the P-3’s (N43RF) was nicknamed “The Pig” by the
maintenance crew for being heavier and a little less tidy than N42RF. As a joke, one of the crew
drew a picture of ‘Miss Piggy’ with a NOAA symbol, and placed it on N43RF (NOAA (c)
2007). Thinking it was a great idea, one of the pilots came up with the idea of contacting Henson
Productions. Mr. Henson was thrilled with the idea. Together, it was agreed that they would
create something similar to World War II nose art. As Kermit and Miss Piggy are such good
friends and the two aircraft are very close, it was agreed to give N42RF the nickname ‘Kermit’.
The nose art was created by Henson Productions and has been part of the aircraft ever since.
When the G-IV was acquired in 1996 as part of the Hurricane Hunters team, Henson Productions

Collins and Flaherty
64
agreed once again to provide the nose art. The character of Gonzo was chosen because of the
non-standard nose radome that is installed on the NOAA G-IV.
Over time, the technology and aircraft used for reconnaissance became more advanced and
specialized for data acquisition on tropical cyclones. The P-3’s have a variety of specialized
equipment including the C-band nose radar, the lower fuselage C-band research radar – 360 deg.
horizontal fan beam, tail Doppler X-band radar, a GPS dropsonde atmospheric profiling
system, airborne expendable sea surface temperature probes, a CO2 air temperature radiometer, a
stepped frequency microwave radiometer, and both C-band and Ku-band scatterometers.
As noted, both Hurricane Hunter platforms have advanced radar for weather avoidance and data
collection. When flying convective weather, the G-IV nose radar is constantly monitored by the
pilots and the Flight Director (Figure 6).
Figure 6: The G-IV Flight Director Station
The Florida Geographer
65
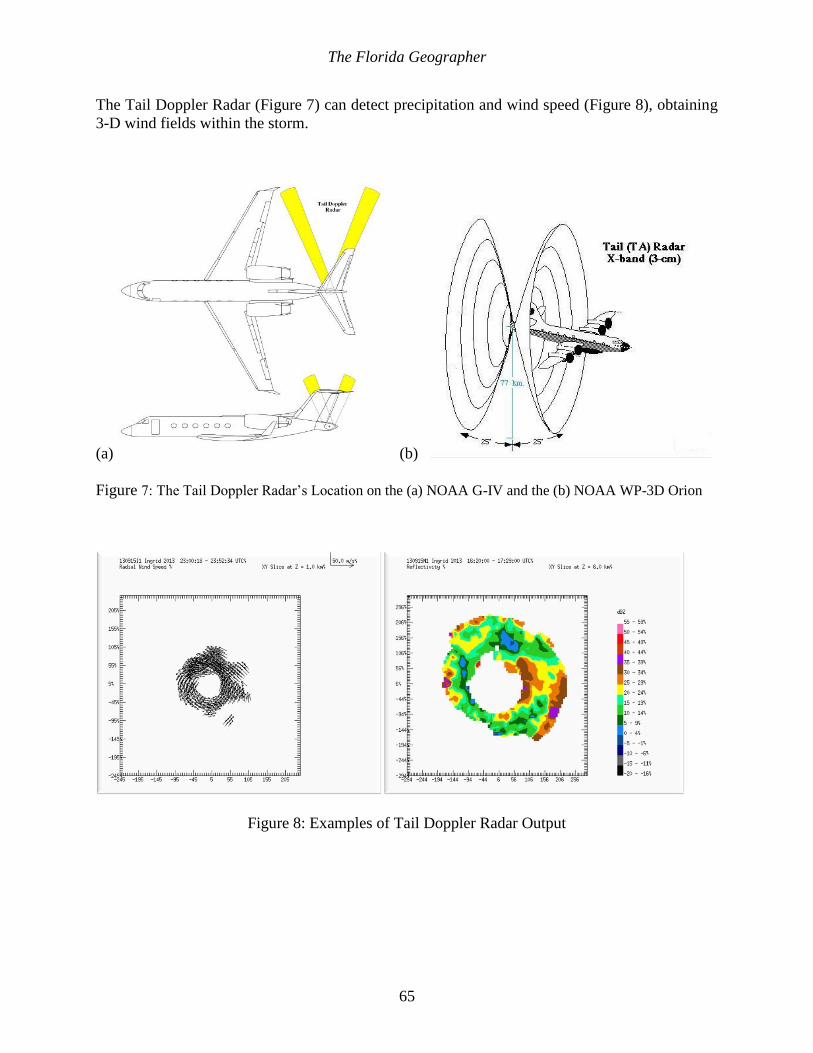
The Tail Doppler Radar (Figure 7) can detect precipitation and wind speed (Figure 8), obtaining
3-D wind fields within the storm.
(a) (b)
Figure 7: The Tail Doppler Radar’s Location on the (a) NOAA G-IV and the (b) NOAA WP-3D Orion
Figure 8: Examples of Tail Doppler Radar Output

Collins and Flaherty
66
GPS Dropsondes (Figure 9) are deployed from the aircraft descending through the atmosphere
on a stabilizing parachute toward the ocean surface. During the descent, the dropsonde transmits
meteorological information back to the aircraft. The information received and processed by
aircraft systems includes atmospheric pressure, relative humidity, air temperature, altitude, wind
direction and speed. This information is monitored and quality controlled by onboard
meteorologists, coded into a World Meteorological Organization (WMO) message format, and
transmitted from the aircraft in near-real time.
Figure 9: GPS Dropsonde
The Florida Geographer
67
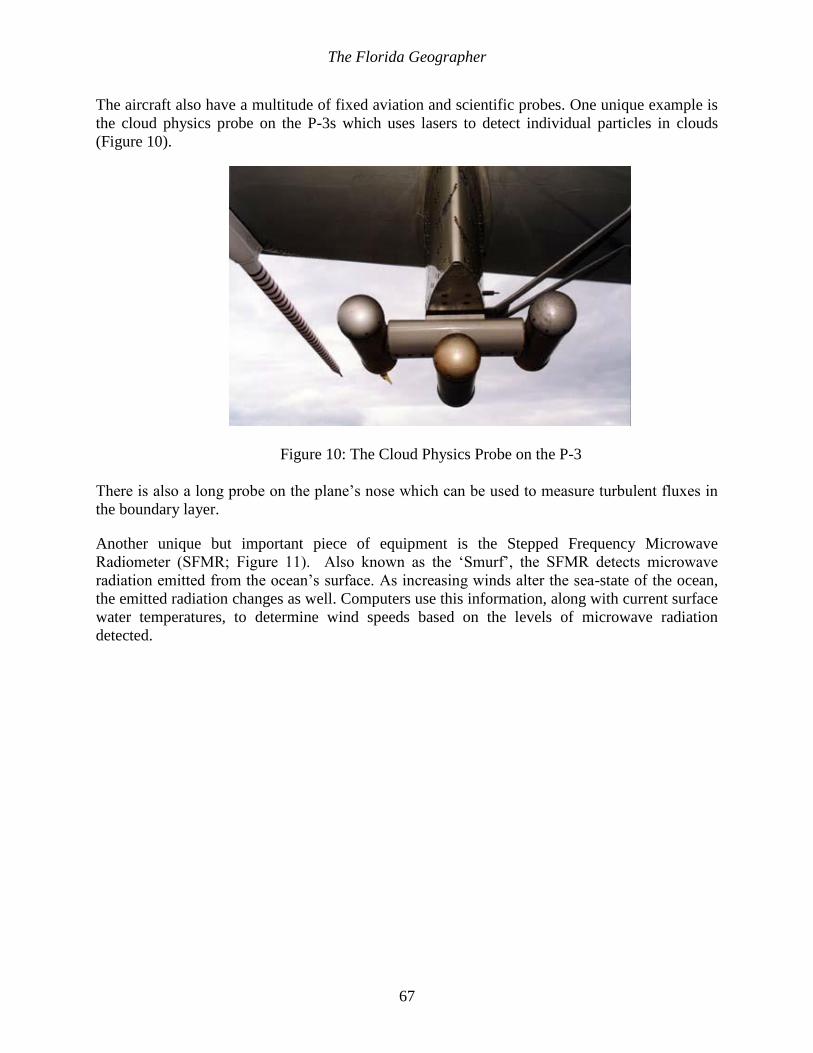
The aircraft also have a multitude of fixed aviation and scientific probes. One unique example is
the cloud physics probe on the P-3s which uses lasers to detect individual particles in clouds
(Figure 10).
Figure 10: The Cloud Physics Probe on the P-3
There is also a long probe on the plane’s nose which can be used to measure turbulent fluxes in
the boundary layer.
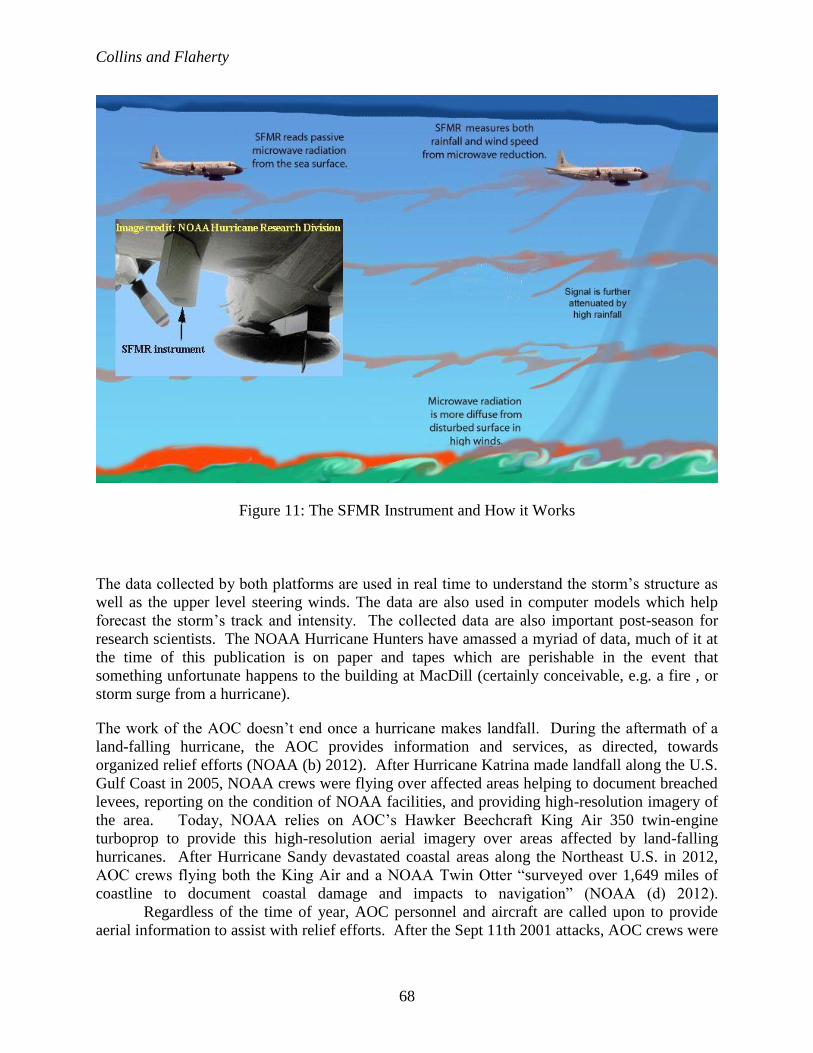
Another unique but important piece of equipment is the Stepped Frequency Microwave
Radiometer (SFMR; Figure 11). Also known as the ‘Smurf’, the SFMR detects microwave
radiation emitted from the ocean’s surface. As increasing winds alter the sea-state of the ocean,
the emitted radiation changes as well. Computers use this information, along with current surface
water temperatures, to determine wind speeds based on the levels of microwave radiation
detected.
Collins and Flaherty
68
Figure 11: The SFMR Instrument and How it Works
The data collected by both platforms are used in real time to understand the storm’s structure as
well as the upper level steering winds. The data are also used in computer models which help
forecast the storm’s track and intensity. The collected data are also important post-season for
research scientists. The NOAA Hurricane Hunters have amassed a myriad of data, much of it at
the time of this publication is on paper and tapes which are perishable in the event that
something unfortunate happens to the building at MacDill (certainly conceivable, e.g. a fire , or
storm surge from a hurricane).
The work of the AOC doesn’t end once a hurricane makes landfall. During the aftermath of a
land-falling hurricane, the AOC provides information and services, as directed, towards
organized relief efforts (NOAA (b) 2012). After Hurricane Katrina made landfall along the U.S.
Gulf Coast in 2005, NOAA crews were flying over affected areas helping to document breached
levees, reporting on the condition of NOAA facilities, and providing high-resolution imagery of
the area. Today, NOAA relies on AOC’s Hawker Beechcraft King Air 350 twin-engine
turboprop to provide this high-resolution aerial imagery over areas affected by land-falling
hurricanes. After Hurricane Sandy devastated coastal areas along the Northeast U.S. in 2012,
AOC crews flying both the King Air and a NOAA Twin Otter “surveyed over 1,649 miles of
coastline to document coastal damage and impacts to navigation” (NOAA (d) 2012).
Regardless of the time of year, AOC personnel and aircraft are called upon to provide
aerial information to assist with relief efforts. After the Sept 11th 2001 attacks, AOC crews were
The Florida Geographer
69
sent to fly over both the World Trade Center in New York City, and the Pentagon in Washington
DC. (NOAA (e) n.d.). After the 2010 Deepwater Horizon oil spill in the Gulf of Mexico, AOC
crews were on scene shortly after the crisis began. AOC’s response helped “collect and provide
mission-critical information to guide the emergency response” (NOAA (f) n.d.). With
international events, “NOAA works closely with the Department of Homeland Security,
Department of Defense, Department of the Interior and others to provide coordinated remote
sensing response capabilities” (NOAA (g) 2010). After the devastating January 2010 earthquake
near the capital of Haiti, AOC crews were once again called upon to help with the relief efforts.
Over Haiti, imagery provided by AOC were used “to support detailed damage assessment, locate
and digitize footprints of major demolition projects necessary for long-term recovery and
rebuilding, and preserve a high-resolution record of the initial post-disaster state to assess
recovery efforts” (NOAA (h) 2010).
Florida experiences twice as many landfalling hurricanes as the next prevalent state, Texas. After
using a GIS to plot the tracks of all tropical cyclones during 1851-2011, Collins and Matyas
(2013) showed that 269 have crossed the boundary of Florida, yielding an average of 1.67
landfalls per year. When considering the future impacts of tropical cyclones to coastal Florida
residents, one must consider that with the shallow bathymetry, the infrastructure built along and
near its shores, along with the high population density in the area resulting from population
growth, the costs of Hurricane Andrew could easily be surpassed if a similar storm were to hit a
major Florida city such as Miami and Tampa in the future. The NOAA Hurricane Hunters, as
well as the University of South Florida, have recently forged a collaboration through the NOAA
Preserve American Internal Funding (PAIF) initiative (NOAA PAIF 2013) to digitize and
preserve the valuable data collected to benefit future research and public education. With so
many vulnerable locations which may one day be in the path of a future landfalling hurricane,
such information is vital. With more and more people moving to vulnerable coastal areas like
we have here in Florida, this information is even more important to hurricane forecasters and
researchers. Ultimately, it is the emergency managers and the public who will benefit most by
this collected data if they one day find themselves making critical decisions based on a forecast
of a tropical cyclone heading their way.
A link to a video:
http://oceantoday.noaa.gov/hurricanehunters/welcome.html
Acknowledgements
Pictures are from NOAA websites, unless stated otherwise.
Collins and Flaherty
70
REFERENCES
Collins, J.M. and C. Matyas 2013: I’ll follow the sun … to Tampa. Association of American
Geographers Newsletter, Sept 4.
Dorst, N. M., 2007: The National Hurricane Research Project: 50 years of research, rough rides,
and name changes. Bull. Am. Meteor. Soc., 88, 1566, doi:10.1175/BAMS-88-10-1566.
Elsner, J.B. and A.B. Kara, 1999: Hurricanes of the North Atlantic. Oxford University Press,
New York, 488pp.
Garvert, M. F., B. Smull, and C. Mass, 2007: Multiscale mountain waves influencing a major
orographic precipitation event. J. Atmos. Sci., 64, 711-737.
Hane, C. E., M. E. Baldwin, H. B. Bluestein, T. M. Crawford, and R. M. Rabin, 2001: A case
study of severe storm development along a dryline within a synoptically active
environment. Part I: Dryline motion and an Eta Model forecast. Mon. Wea. Rev., 129,
2183-2204.
Holland, G.J., 1993: Ready Reckoner. In: Global Guide to Tropical Forecasting (Ed. G.J.
Holland). WMO/TC-No. 560, Report No. TCP-31, World Meteorological Organisation,
Geneva, Switzerland, 9.1-9.32.
Kerns, B., and S. Chen, 2013: Equatorial dry air intrusion and related synoptic variability in MJO
initiation during DYNAMO. Mon. Wea. Rev., 1, in press.
Langford, A., C. Senff, R. Alvarez, R. Banta, R. Hardesty, D. Parrish, and T. Ryerson, 2011:
Comparison between the TOPAZ airborne ozone lidar and in situ measurements during
TexAQS 2006. J. Atmos. Oceanic Technol., 28, 1243-1257.
Landsea, C.W., 1993: A climatology of intense (or major) Atlantic hurricanes. Mon. Wea. Rev.,
121, 1703-1713.
Majumdar, S. J., K. J. Sellwood, D. Hodyss, Z. Toth, and Y. Song, 2010: Characteristics of
target areas selected by the Ensemble Transform Kalman Filter for medium-range
forecasts of high-impact winter weather. Mon. Wea. Rev., 138, 2803-2824.
Neiman, P. J., L. J. Schick, F. M. Ralph, M. Hughes, and G. A. Wick, 2011: Flooding in Western
Washington: The Connection to Atmospheric Rivers. J. Hydrometeor., 12, 1337-1358.
NOAA (a), n.d.: About NOAA. [Available online at http://www.noaa.gov/about-noaa.html].
NOAA (b), 2012: Destination: The Storm's Eye. [Available online at
http://www.noaa.gov/features/03_protecting/hurricanehunterstory_2012.html].

The Florida Geographer
71
NOAA (c), 2007: NOAA 200th Feature Stories: Meet the Muppets. [Available online at
http://celebrating200years.noaa.gov/magazine/muppets/welcome.html].
NOAA (d), 2012: Responding to Hurricane Sandy. [Available online at
http://oceanservice.noaa.gov/news/weeklynews/oct12/nos-response-sandy.html].
NOAA (e), n.d.: NOAA Conducts More Flights Over World Trade Site. [Available online at
http://www.noaanews.noaa.gov/stories/s798.htm].
NOAA (f), n.d.: NOAA Deep Water Horizon Achieve. [Available online at
http://www.noaa.gov/deepwaterhorizon/].
NOAA (g), 2010: NOAA Produces Images of Haiti for First Responders. [Available online at
http://www.noaanews.noaa.gov/stories2010/20100119_haiti.html].
NOAA (h), 2010: NGS Supports Relief Efforts in Haiti. [Available online at
http://www.ngs.noaa.gov/web/news/Relief_Efforts_in_Haiti_012010.shtml].
NOAA Aircraft Operations Center Science Section: Hurricane Hunters. [Available online at
http://flightscience.noaa.gov/].
NOAA National Weather Service, 2013: NHC Aircraft Reconnaissance. [Available online at
http://www.nhc.noaa.gov/recon.php].
NOAA Preserve America Initiative, 2013: Internal funding program recipients. [Available
online at http://preserveamerica.noaa.gov/pdfs/paig13_recip.pdf].
Storm, B. A., M. D. Parker, and D. P. Jorgensen, 2007: A convective line with leading stratiform
precipitation from BAMEX. Mon. Wea. Rev., 135, 1769-1785.
Sullivan, K., About NOAA. [Available online at http://www.noaa.gov/about-noaa.html].
Vera, C., J. Baez, M. Douglas, C. Emmanuel, J. Marengo, J. Meitin, M. Nicolini, J. Nogues-
Paegle, J. Paegle, and O. Penalba, 2006: The South American low-level jet experiment.
Bull. Am. Meteor. Soc., 87, 63-77.