the organization of the human cerebellum estimated by...
TRANSCRIPT

doi:10.1152/jn.00339.2011 106:2322-2345, 2011. First published 27 July 2011;J NeurophysiolThomas YeoRandy L. Buckner, Fenna M. Krienen, Angela Castellanos, Julio C. Diaz and B. T.by intrinsic functional connectivityThe organization of the human cerebellum estimated
You might find this additional info useful...
105 articles, 39 of which can be accessed free at:This article cites http://jn.physiology.org/content/106/5/2322.full.html#ref-list-1
1 other HighWire hosted articlesThis article has been cited by
[PDF] [Full Text] [Abstract]
, October 19, 2011; 31 (42): 15065-15071.J. Neurosci.Rong, Xiaoyi Wang, Randy L. Buckner and Kuncheng LiJie Lu, Hesheng Liu, Miao Zhang, Danhong Wang, Yanxiang Cao, Qingfeng Ma, DongdongPolysynaptic Anatomical PathwaysFocal Pontine Lesions Provide Evidence That Intrinsic Functional Connectivity Reflects
including high resolution figures, can be found at:Updated information and services http://jn.physiology.org/content/106/5/2322.full.html
can be found at:Journal of Neurophysiologyabout Additional material and information http://www.the-aps.org/publications/jn
This infomation is current as of November 20, 2011.
American Physiological Society. ISSN: 0022-3077, ESSN: 1522-1598. Visit our website at http://www.the-aps.org/.(monthly) by the American Physiological Society, 9650 Rockville Pike, Bethesda MD 20814-3991. Copyright © 2011 by the
publishes original articles on the function of the nervous system. It is published 12 times a yearJournal of Neurophysiology
on Novem
ber 20, 2011jn.physiology.org
Dow
nloaded from
The organization of the human cerebellum estimated by intrinsicfunctional connectivity
Randy L. Buckner,1,2,3,4 Fenna M. Krienen,2,4 Angela Castellanos,1,2 Julio C. Diaz,1,5
and B. T. Thomas Yeo2,4
1Howard Hughes Medical Institute, Cambridge; 2Center for Brain Science, Department of Psychology, Harvard University,Cambridge; 3Department of Psychiatry, Massachusetts General Hospital, Boston; 4Athinoula A. Martinos Centerfor Biomedical Imaging, Department of Radiology, Massachusetts General Hospital, Charlestown, Massachusetts;and 5Department of Biology, University of Miami, Miami, Florida
Submitted 13 April 2011; accepted in final form 20 July 2011
Buckner RL, Krienen FM, Castellanos A, Diaz JC, Yeo BT. Theorganization of the human cerebellum estimated by intrinsic func-tional connectivity. J Neurophysiol 106: 2322–2345, 2011. Firstpublished July 27, 2011; doi:10.1152/jn.00339.2011.—The cerebralcortex communicates with the cerebellum via polysynaptic circuits.Separate regions of the cerebellum are connected to distinct cerebralareas, forming a complex topography. In this study we explored theorganization of cerebrocerebellar circuits in the human using resting-state functional connectivity MRI (fcMRI). Data from 1,000 subjectswere registered using nonlinear deformation of the cerebellum incombination with surface-based alignment of the cerebral cortex. Thefoot, hand, and tongue representations were localized in subjectsperforming movements. fcMRI maps derived from seed regionsplaced in different parts of the motor body representation yielded theexpected inverted map of somatomotor topography in the anteriorlobe and the upright map in the posterior lobe. Next, we mapped thecomplete topography of the cerebellum by estimating the principalcerebral target for each point in the cerebellum in a discovery sampleof 500 subjects and replicated the topography in 500 independentsubjects. The majority of the human cerebellum maps to associationareas. Quantitative analysis of 17 distinct cerebral networks revealedthat the extent of the cerebellum dedicated to each network isproportional to the network’s extent in the cerebrum with a fewexceptions, including primary visual cortex, which is not representedin the cerebellum. Like somatomotor representations, cerebellar re-gions linked to association cortex have separate anterior and posteriorrepresentations that are oriented as mirror images of one another. Theorderly topography of the representations suggests that the cerebellumpossesses at least two large, homotopic maps of the full cerebrum andpossibly a smaller third map.
somatotopy; motor control; prefrontal; functional magnetic resonanceimaging; default network; connectome
THE ORGANIZATION OF THE CEREBELLUM has been the topic ofdebate for more than a century (Manni and Petrosini 2004).Although there is agreement that the cerebellum containsmultiple somatomotor representations, a challenging feature ofcerebellar anatomy prevents resolving its complete organiza-tion: the cerebellum is connected to the cerebral cortex only byway of polysynaptic circuits (Evarts and Thach 1969; Kempand Powell 1971; Schmahmann and Pandya 1997a; Strick1985). Efferent projections from the cerebrum synapse initiallyin the pontine nuclei and then project primarily to the con-
tralateral cerebellar cortex (the pontocerebellar tract). Afferentprojections first synapse in the deep cerebellar nuclei (e.g.,dentate nucleus) and then project to a second synapse in thecontralateral thalamus that in turn serves as a relay to thecerebral cortex (the dentatothalamocortical tract). There are nomonosynaptic connections between the cerebrum and cerebel-lum. As a result, traditional anterograde and retrograde tracingtechniques cannot be used to explore the relation betweencerebral topography and the cerebellum. Insights into cerebel-lar organization require physiological and transneuronal trac-ing techniques, inferences from deficits following lesions, andfunctional neuroimaging studies.
Somatomotor Topography in the Cerebellum
Early electrophysiological studies revealed that the cerebel-lum possesses multiple topographically organized somatomo-tor1 representations (Adrian 1943; Snider and Sowell 1944).An inverted somatomotor map is present in the anterior lobe,and a second posterior map is upright, forming an inversionbetween the anterior and posterior representations. Evidencedirectly demonstrating that cerebral motor areas are anatomi-cally connected to specific regions of the cerebellum came withthe development of transneuronal tracing techniques. Trans-neuronal tracing techniques use virus strains that selectivelyspread through retrograde or anterograde infection of synapti-cally connected neurons (HSV1; Middleton and Strick 1994,2001; rabies virus; Kelly and Strick 2003). With the use ofviral tracing, the hand region of cebus monkey cerebral M1was found to possess both efferent and afferent polysynapticprojections to lobules V and VI (the anterior lobe somatomotorrepresentation) and HVIIB/HVIII in the posterior lobe (Kellyand Strick 2003). The intervening posterior lobules, in partic-ular Crus I and II, were spared anatomical connections tomotor cortex but did show projections to prefrontal cortex, animportant observation that is discussed in more detail below.
Human neuroimaging studies have confirmed somatomotorrepresentations within the cerebellum. In a particularly thor-ough exploration using task-based functional MRI (fMRI),Grodd et al. (2001) had subjects make movements that re-vealed maps of both gross motor topography (foot, hand,tongue, and lips) as well as fine motor topography (elbow,
Address for reprint requests and other correspondence: R. L. Buckner,Harvard Univ., 52 Oxford St., Northwest Bldg., 280.06, Cambridge, MA02138 (e-mail: [email protected]).
1 Here and elsewhere the term “somatomotor” is chosen because it isdifficult to resolve whether cerebellar representations of body space areselectively linked to motor cortex or somatosensory cortex.
J Neurophysiol 106: 2322–2345, 2011.First published July 27, 2011; doi:10.1152/jn.00339.2011.
2322 0022-3077/11 Copyright © 2011 the American Physiological Society www.jn.org
on Novem
ber 20, 2011jn.physiology.org
Dow
nloaded from

wrist, and multiple individuated finger movements). An in-verted representation was detected extending from lobule V ofthe anterior lobe (foot, arm, and fingers) to just past the primaryfissure in lobule VI (tongue and lip representation). A secondupright representation was detected in VIII and IX. Wiestler etal. (2011) recently used high-resolution fMRI data acquisitionto localize the representation of the fingers to lobules V andVIII. Relevant to the present article, the well-characterizedsomatomotor representations provide a target for validatingnew human neuroimaging techniques.
Uncharted Regions of the Cerebellum
In the monkey, the anterior somatomotor representationextends just past the primary fissure with the face localized tothe simplex lobule (HVI) (Snider and Eldred 1952). Thesecond posterior representation is near the paramedian lobule(HVIII). The relation between the two representations is that ofinversion, much like the mirror-image representations of thevisual field that exist between certain visual areas (e.g., V1 andV2; Cowey 1964). However, unlike maps of retinal spacewithin early visual cortex, which are contiguous with oneanother (Van Essen et al. 1982; Wandell et al. 2007), theidentified somatomotor maps of the cerebellum leave a largegap between the two detected representations. This raises animportant question that we attempt to address in this article:What is mapped to the intervening regions of the cerebellum?
One possibility is that multiple repeated somatomotor mapsexist, creating a set of regions within the cerebellum that havedifferent or elaborated representations of motor space. Consis-tent with the possibility that the uncharted regions of thecerebellum contain multiple somatomotor maps, Schlerf et al.(2010) recently found preliminary evidence for a second so-matomotor map posterior to the primary fissure. In their study,complex finger and toe movements (involving sequences ofextension and flexion across digits) showed more extensiveactivation than simple movements with the toe response ex-tending posterior to the finger response, raising the possibilityof a second adjacent representation. The novel map is hypoth-esized to participate when complex skilled movements areperformed but less so when simple movements are initiated.Somatomotor maps with novel properties may occupy a por-tion of the remaining cerebellar cortex.
A second possibility is that the cerebellum is mapped tocerebral regions outside the domain of motor function, includ-ing areas implicated in cognition. Although we provide evi-dence in this article to support this second possibility, it isimportant to note past findings that have caused opposition tothis idea. Foremost, cerebellar lesions result in profound motordeficits; cognitive deficits exist but are more subtle (Ben-Yehudah et al. 2007; Schmahmann et al. 2007; Timmann andDaum 2007). Early physiological and anatomical studies didsearch for cerebellar connections with prefrontal associationcortex but found only selective examples (Brodal 1978; Glick-stein et al. 1985; Snider and Eldred 1952). As a result of theseanatomical findings, many theories addressing the cerebel-lum’s evolutionary expansion emphasized motor skills, includ-ing volitional control of hand movements (e.g., Glickstein2007; Holmes 1939). However, a seminal theoretical report byLeiner et al. (1986; see also Leiner 2010) and a series ofunexpected findings from the emerging field of human neuro-
imaging (Petersen et al. 1989) rekindled interest in the idea thatthe cerebellum may interact with the prefrontal cortex and beimportant to cognition.
Activation of the cerebellum during cognitive tasks has beena common observation (Desmond and Fiez 1998; Timmannand Daum 1997), leading to several explorations of the func-tional meaning of the responses (e.g., Durisko and Fiez 2010;Marvell and Desmond 2010; O’Reilly et al. 2008; Spencer etal. 2007). Recently, Stoodley and Schmahmann (2009) con-ducted a meta-analysis of previously published articles thatreported cerebellar activations across a range of sensory, mo-tor, and cognitive tasks. By using a meta-analytic approach thatgenerates spatial maps of consensus responses (Laird et al.2005), they observed several features of human cerebellarorganization. First, different task domains elicit activation indistinct cerebellar regions. As expected, anterior and posteriorregions near to or containing the body representations emergefrom tasks that have motor demands. Second, the expanse ofthe cerebellum occupied by Crus I and lobules VI and VIIshows consensus activation during tasks that place demands oncognitive functions including language, working memory, andexecutive function. These results reinforce the possibility thatregions of the cerebellum between the known somatomotorrepresentations contribute to higher level cognition. The ex-pansion of these regions in the human cerebellum may parallelthe expansion of association cortex, including prefrontal cortex(e.g., see Balsters et al. 2010 for a recent discussion).
Anatomical Evidence for Prefrontal-Cerebellar Circuits
Using anterograde tracing techniques, Schmahmann andPandya (1997b) identified projections from dorsolateral androstral regions of prefrontal cortex including areas 9, 46, and10 to the pontine nuclei. The presence of pontine-labeledneurons indicates that a cerebrocerebellar projection exists,albeit without specifying where the projection terminateswithin the cerebellar cortex. Transneuronal tracing techniqueshave revealed both efferent and afferent cerebellar projectionsto the prefrontal cortex (Kelly and Strick 2003; Middleton andStrick 1994, 2001; see Strick et al. 2009 for review). Middletonand Strick (1994, 2001) first used transneuronal retrogradetracing to show that prefrontal areas 9m, 9l, and 46 receivepolysynaptic projections from the dentate nucleus. Later ad-vances allowed direct visualization of both anterograde trans-port (using HSV1) and retrograde transport (using rabies virus)between prefrontal cortex and the cerebellar cortex itself (Kellyand Strick 2003). Area 46 was found to possess polysynapticprojections to cerebellar regions that were spared motor pro-jections. Prefrontal efferents labeled with HSV were found inCrus II extending into Crus I but were absent in the anteriorlobe. Prefrontal afferents labeled with rabies virus were foundin Crus II.
The findings of Strick and colleagues are important to thepresent work for two reasons. First, the results suggest that asignificant portion of the cerebellum between the anterior andposterior somatomotor representations is linked to cerebralassociation cortex. Given that association cortex is dispropor-tionately expanded in humans relative to monkeys and evenapes (Hill et al. 2010; Preuss 2004; Van Essen and Dierker2007), it is possible that a majority of the cerebellum isconnected to association cortex in the human. Second, the
2323THE HUMAN CEREBELLUM
J Neurophysiol • VOL 106 • NOVEMBER 2011 • www.jn.org
on Novem
ber 20, 2011jn.physiology.org
Dow
nloaded from
results reveal that multiple closed-loop cerebellar circuits existin parallel. The region of the cerebellum that receives projec-tions from area 46 sends projections back to prefrontal area 46;this region is anatomically distinct from the cerebellar regionsreceiving and sending projections to somatomotor cortex. Thepresence of multiple, segregated cerebrocerebellar circuits pro-vides an opportunity to map cerebellar topography using hu-man neuroimaging techniques by examining functional cou-pling between the two structures.
Functional Connectivity Provides a Tool to MapCerebellar Organization
Intrinsic low-frequency functional correlations measured byfMRI can be used to map brain systems in the human (see Foxand Raichle 2007; Raichle 2011; Van Dijk et al. 2010 forreview). Biswal et al. (1995) first described the approach. Theyobserved that activity fluctuations within the motor cortexmeasured at rest demonstrate functional coupling with thecontralateral motor region and the supplementary motor regionalong the medial wall. The correlations were anatomicallyselective, suggesting the tool could be used for mapping. Sincethen, numerous studies have used this approach, termed func-tional connectivity MRI (fcMRI), to map brain systems includ-ing subdivisions of the cingulate (Margulies et al. 2007),hippocampal formation (Kahn et al. 2008), amygdala (Roy etal. 2009), thalamus (Zhang et al. 2008), and striatum (DiMartino et al. 2008). fcMRI has limitations and interpretationaldifficulties, including sensitivity to factors other than anatom-ical connectivity (Buckner 2010; Cole et al. 2010; Moeller etal. 2009). We discuss these limitations later when interpretingresults of the present study. Relevant first is that, even withthese limitations, fcMRI is a potentially powerful technique formapping cerebrocerebellar circuits.
Initial fcMRI studies of the cerebellum reported multipleresults that are consistent with known anatomical properties ofcerebrocerebellar circuits (Allen et al. 2005; Habas et al. 2009;Krienen and Buckner 2009; O’Reilly et al. 2010). First, intrin-sic activity measured from lateralized seed regions in thefrontal motor cortex is correlated with the contralateral cere-bellum more so than the ipsilateral cerebellum. This functionalobservation is consistent with the anatomical finding that themajority of cerebrocerebellar projections are contralateral. Sec-ond, the functionally coupled motor regions fall within theanterior and posterior lobe locations predicted by task-basedanalysis of human somatomotor topography. This result indi-cates that the technique is anatomically specific as well assensitive, because both the primary (anterior lobe) and second-ary (posterior lobe) somatomotor representations can be de-tected (e.g., Fig. 1 of Krienen and Buckner 2009; Fig. 1 ofO’Reilly et al. 2010). Third, lateralized infarcts to the basilarpons selectively disrupt contralateral but not ipsilateral func-tional coupling between the cerebrum and cerebellum (Lu et al.in press) as predicted by anatomical studies (Schmahmann etal. 2004a, 2004b).
Prior fcMRI studies also have observed that a major portionof the human cerebellum is functionally coupled to cerebralassociation areas (Habas et al. 2009; Krienen and Buckner2009; O’Reilly et al. 2010). These studies generally agreeabout the topography of association regions of the cerebellumdespite the use of different analytic approaches and data
samples. For example, they all reported nearly the same loca-tions for human cerebellar somatomotor cortex and also ob-served that Crus I and II were coupled to cerebral associationareas falling within dorsolateral prefrontal cortex and parietalassociation cortex.
The most marked difference between studies occurred inrelation to the estimates of the cerebellar zones coupled to thehuman “default network” (Buckner et al. 2008; Raichle et al.2001; see Yeo et al. 2011 for relevant discussion). Althoughboth Habas et al. (2009) and Krienen and Buckner (2009)noted that a cerebellar region associated with the defaultnetwork exists within lobule IX, Krienen and Buckner reporteda second major region in Crus I. This difference led the tworeports to emphasize distinct cerebellar regions associated withthe default network: one report focused on lobule IX and theother on Crus I. This difference may arise from an omissionrather than a true discrepancy. Habas et al. (2009) did notassign the portion of Crus I in question to any identifiablecerebral network; rather, there is an absence of a networkassignment in the exact region proposed to align with thedefault network in Krienen and Buckner (2009). Thus a carefulassessment of the prior reports suggests general agreement,with the few differences possibly arising because each studydid not comprehensively survey the cerebellum. These initialresults encourage further exploration.
In this study we mapped the complete topography of thehuman cerebellum. In doing so, we sought to extend prior workto determine whether there were any mapping principles be-tween the cerebral cortex and the cerebellum. By mapping thefull extent of the cerebellum to the cerebral cortex, we wereable to examine whether there were any expansions and re-strictions in the representations of specific cortical networks inthe cerebellum and, as a consequence, examine the orderlyrepresentation of different functional domains in the cerebel-lum. We discovered that the cerebellum possesses multiplerepresentations of the cerebrum in which the known somato-motor representations are parts of at least two, and possiblythree, homotopic maps of the full cerebrum.
METHODS
Overview
In the present study, we explored the functional organization of thehuman cerebellum using resting-state fcMRI. Analyses proceeded inthree phases. First, cerebrocerebellar circuitry of the somatomotorcortex was explored because of the strong expectations about thelocation and topographic organization of the body representations.Data were acquired from 26 subjects while they performed activemovements of the foot, hand, or tongue. Motor task activation wasused to estimate somatomotor topography. The somatomotor topog-raphy of the cerebellum was then analyzed in 1,000 young adults byexclusively using functional connectivity of resting-state data. Themotor task data served as the reference.
Second, having established that basic properties of cerebellar to-pography can be revealed by intrinsic functional connectivity, we nextmapped the full extent of the cerebellar cortex. The cerebral networksdefined in the companion paper by Yeo et al. (2011) provided thebasis for this analysis. The strategy was to ask, for each voxel withinthe cerebellum, to which cerebral network it was most stronglycorrelated. This approach yielded a complete map of the cerebellumthat represented regions of the cerebellum coupled to distinct regionsof the cerebrum.
2324 THE HUMAN CEREBELLUM
J Neurophysiol • VOL 106 • NOVEMBER 2011 • www.jn.org
on Novem
ber 20, 2011jn.physiology.org
Dow
nloaded from
The final analyses sought to quantify in more detail functionalconnectivity between the cerebellum and cerebrum. The strategy wasto define small seed regions within the cerebellum and map thefunctionally correlated topography in the cerebral cortex, and toestimate functional correlation strength between cerebellar regionsand multiple cerebral regions to quantify specificity. These analysesdid not assume that the a priori cortical networks used for the aboveanalyses were correct. For these analyses, cerebral and cerebellarregions were always defined in the discovery sample (n � 500) andfunctional connectivity was only quantified in the independent repli-cation sample (n � 500) to avoid bias.
Participants
Paid participants were clinically normal, English-speaking youngadults with normal or corrected-to-normal vision (ages 18–35 yr).Subjects were excluded if their fMRI signal-to-noise ratio (SNR) waslow (�100; see Yeo et al. 2011), artifacts were detected in the MRdata, their self-reported health information indicated a history ofneurological or psychiatric illness, or they were taking psychoactivemedications. Two data sets were used for analysis. The first data setinvolved task-based data collected while subjects made active motormovements (n � 26, mean age � 21.3 yr, 50% male). The data set forfunctional connectivity analysis consisted of 1,000 individuals imagedduring eyes open rest (EOR) and was divided into two independentsamples (each n � 500; labeled the discovery and replication sam-ples). Age and sex were matched for the discovery (mean age � 21.3yr, 42.6% male) and replication (mean age � 21.3 yr, 42.8% male)samples as described in Yeo et al. (2011). Participants providedwritten informed consent in accordance with guidelines set by insti-tutional review boards of Harvard University or Partners Healthcare.
MRI Data Acquisition
All data were collected on matched 3T Tim Trio scanners (Sie-mens, Erlangen, Germany) using the vendor-supplied 12-channelphased-array head coil. The functional imaging data were acquiredusing a gradient-echo echo-planar imaging (EPI) sequence sensitive toblood oxygenation level-dependent (BOLD) contrast (Kwong et al.1992; Ogawa et al. 1992). Whole brain coverage including the entirecerebellum was achieved with 47 3-mm slices aligned to the anteriorcommissure-posterior commissure plane using automated alignment(van der Kouwe et al. 2005). Structural data included a high-resolu-tion multiecho T1-weighted magnetization-prepared gradient-echoimage (multiecho MP-RAGE; van der Kouwe et al. 2008).
For the motor task, subjects performed a blocked-task paradigmconsisting of 40-s blocks of active movement interspersed with 18-sblocks of passive fixation. For foot movement, subjects alternateddorsiflexion and plantarflexion of the right foot. For hand movement,subjects individually lifted the right thumb, index finger, and littlefinger in sequence. For tongue movement, subjects moved the tonguebetween left, middle, and right positions touching their upper teeth.For each of six runs, six task blocks were embedded for a total of 36task blocks per participant. All runs began and ended with visualfixation. Before each movement block, a 2-s visual cue informed thesubjects to initiate one of three movement types. The fixation cross-hair then changed to include a small green circle around its border,indicating to the subjects to continue their movements. At the end ofthe block, the green circle was removed and subjects passively fixated.The order of movement condition (foot, hand, tongue) was counter-balanced between runs. Subjects practiced the movements beforescanning to ensure they understood the directions and were encour-aged to maintain a constant rate of repetitive movement throughoutmovement blocks. To reduce extraneous motion, subjects’ legs weresupported in a semiflexed position using an ergonomic knee-to-anklecushion. A piece of tape was attached around the right ankle to limit
leg movement during the foot condition. Arms rested on each side ofthe body with the right hand and wrist supported on a flat foam pad.
Functional imaging parameters were as follows: repetition time(TR) � 3,000 ms, echo time (TE) � 30 ms, flip angle (FA) � 85°,3 � 3 � 3-mm voxels, field of view (FOV) � 216, and 47 slicescollected with interleaved acquisition and no gap between slices.Each functional run in the motor task lasted 6 min 27 s (129 timepoints). Parameters for the structural scan (multiecho MP-RAGE)were as follows: TR � 2,200 ms, TI � 1,100 ms, TE � 1.54 msfor image 1 to 7.01 ms for image 4, FA � 7°, 1.2 � 1.2 �-1.2-mm,and FOV � 230.
For the resting-state data used for functional connectivity analysis,subjects were instructed to remain still, stay awake, and keep theireyes open. The acquisition parameters were identical to those de-scribed above, except 124 time points were acquired. Resting-statedata acquisition is described in more detail in Yeo et al. (2011).
Functional MRI Data Preprocessing
The fMRI data were preprocessed as described in the companionpaper (Yeo et al. 2011). Briefly, the first four volumes of each runwere discarded to allow for T1-equilibration effects, slice acquisition-dependent time shifts were compensated per volume using SPM2(Wellcome Department of Cognitive Neurology, London, UK), andhead motion was corrected using rigid body translation and rotationusing the FMRIB Software Library (FSL) (Jenkinson et al. 2002;Smith et al. 2004). Resting-state data underwent further preprocess-ing, including low-pass temporal filtering, head-motion regression,whole brain signal regression, and ventricular and white matter signalregression. This regression procedure minimized nonneuronal signalcontributions, including respiration-induced signal fluctuations (Birnet al. 2006; Wise et al. 2004), but shifted the distribution of correla-tions around zero (Vincent et al. 2006), making physiological inter-pretation of negative correlations tenuous (Fox et al. 2009; Murphy etal. 2009; Van Dijk et al. 2010). In this study, we only interpretpositive correlations.
Structural MRI Data Preprocessing and Functional-StructuralData Alignment
The structural data were processed using the FreeSurfer version4.5.0 software package (http://surfer.nmr.mgh.harvard.edu), whichprovides automated algorithms for reconstructing surface mesh rep-resentations of the cortex from individual subject’s structural imagesand registering each subject to a common spherical coordinate system(Dale et al. 1999; Fischl et al. 1999a, 1999b, 2001; Ségonne et al.2004, 2007). The cortical surface extraction process is described inYeo et al. (2011).
The structural and functional images were aligned (Fig. 1, A and B)using boundary-based registration (Greve and Fischl 2009) within theFsFast software package (http://surfer.nmr.mgh.harvard.edu/fswiki/FsFast). The resting-state BOLD fMRI data were then aligned to thecommon spherical coordinate system via sampling from the middle ofthe cortical ribbon in a single interpolation step. A 6-mm full-widthhalf-maximum (FWHM) smoothing kernel was applied to the fMRIdata in the surface space, and the data were downsampled to a 4-mmmesh. See Yeo et al. (2011) for details.
Quality Control
Visual inspection of the registered data suggested that accuraterepresentations of the cerebellum and cortical surface were obtainedfor each subject and that structural and functional image registrationswere successful. In addition, the volumetric registration was verifiedto ensure that the cerebellum was successfully aligned betweensubjects. Figure 2 shows the results of cerebellar and cortical surface
2325THE HUMAN CEREBELLUM
J Neurophysiol • VOL 106 • NOVEMBER 2011 • www.jn.org
on Novem
ber 20, 2011jn.physiology.org
Dow
nloaded from

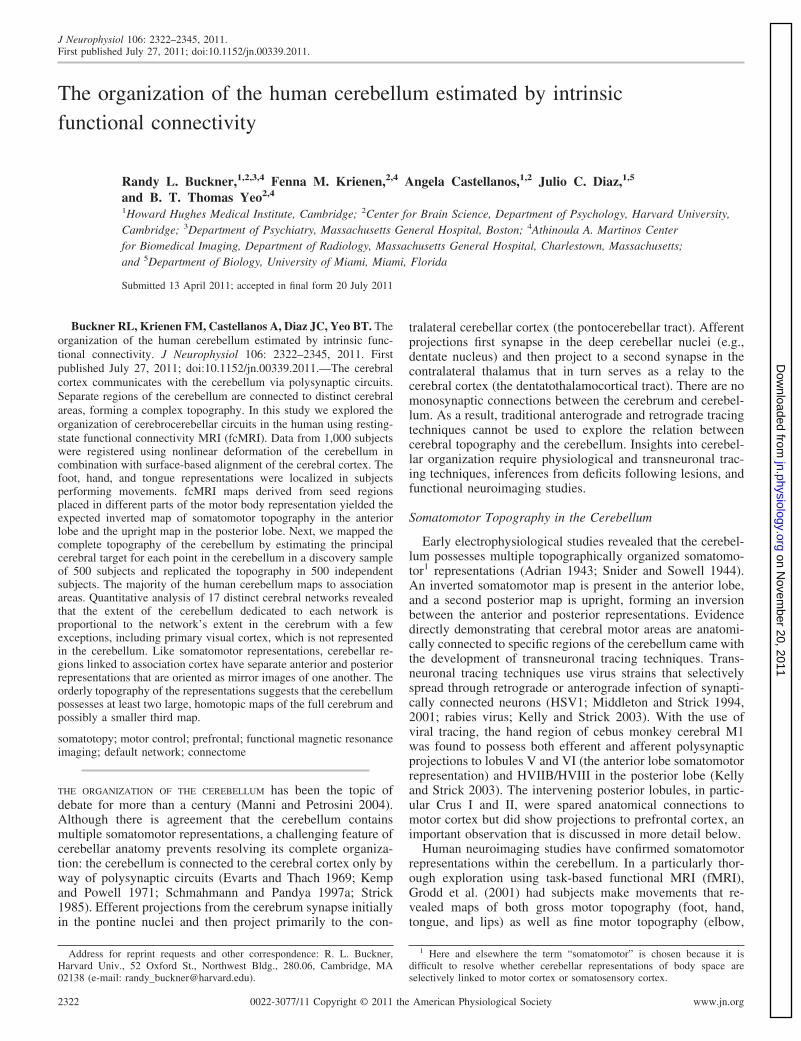
extraction from the T1 images and T2* to T1 registration of threetypical subjects. Intersubject registration is illustrated in Fig. 3.
Hybrid Surface- and Volume-Based Alignment
The resolution of human imaging techniques is sufficient tomodel functional connectivity across the cerebral cortex as atwo-dimensional surface, respecting its topology (Yeo et al. 2011).In principle, the cerebellar cortex could also be modeled as asurface (Van Essen 2002). However, the cerebellar cortex is aboutone-third the thickness of the cerebral cortex, and the convolutionsare sufficiently more complex, making surface-based reconstruc-tion of functional data impractical within the resolution constraintsof our present data. For this reason, we adopted a hybrid surface-and volume-based alignment approach. The cerebral cortex wasmodeled as a surface as described in Yeo et al. (2011), and thecerebellum was aligned using nonlinear volumetric registration.
The volumetric registration algorithm proceeded by jointly deform-ing the structural volume to a probabilistic template and classifyingeach native brain voxel into one of multiple brain structures, includingleft and right cerebellar gray and white matter (Fischl et al. 2002,2004). The probabilistic template encodes multiple features including1) spatial relationships among different anatomical structures (e.g., the
cerebrum is dorsal to the cerebellum), 2) expected MR intensity giventhe acquisition parameters and intrinsic tissue properties estimated aspart of the algorithm (e.g., T1, T2, and T2*), and 3) spatial variationin MR intensity as a result of spatial variation in intrinsic tissueproperties (e.g., T1 is longer in frontal gray matter than primarysomatomotor cortex).
The nonlinear deformation is represented by a dense displacementfield (i.e., a single displacement vector at each 2-mm isotropic atlasvoxel) and is driven by five energy terms: one to encourage smoothdeformations, one to minimize metric distortion within each anatom-ical structure, one to encourage the invertibility of the displacementfield, and two terms to maximize the likelihood of the observed imageintensity conditioned on the location and identity of the brain struc-ture. The resulting deformation field, together with the correspon-dence yielded by the structural-functional data alignment discussedabove, was used to transform the subject’s fMRI data into FreeSurfernonlinear volumetric space (Fig. 1, B–D), thus establishing spatialcorrespondences between the subject and other subjects that were alsobrought into this common coordinate system. The resulting volumetricfMRI data were smoothed with a 6-mm FWHM smoothing kernelconstrained by the cerebellum mask defined using the FreeSurfertemplate (Fischl et al. 2002, 2004).
Fig. 1. Hybrid surface- and volume-basedregistration. For each subject, the T2* im-ages yielding blood oxygenation level-de-pendent (BOLD)-contrast functional mag-netic resonance imaging (fMRI) data (A)were registered to the T1-weighted structuraldata (B) in the subject’s native space. Thecerebral surface and cerebellar boundarywere estimated based on the structural dataand projected to the BOLD data. The redlines show the estimated inner boundary ofthe cerebral cortical surface at the gray-whiteinterface. The green line shows the estimatededge of the cerebellum. The cerebral corticalsurface was then extracted (C) and alignedbetween subjects using surface-based regis-tration. The T1-weighted structural datawere also aligned between subjects usingnonlinear volume-based registration (D).The surface and volume were then registeredto the Montreal Neurological Institute (MNI)atlas space (E) for visualization and coordi-nate reporting.
2326 THE HUMAN CEREBELLUM
J Neurophysiol • VOL 106 • NOVEMBER 2011 • www.jn.org
on Novem
ber 20, 2011jn.physiology.org
Dow
nloaded from

Spatial correspondence was established between FSL MontrealNeurological Institute (MNI) space and the FreeSurfer nonlinearvolumetric space by running the nonlinear FSL MNI152 templatethrough the FreeSurfer pipeline (Fig. 1, D and E). All cerebellaranalyses were performed in FreeSurfer nonlinear volumetric space.The use of the nonlinear deformation reduces intersubject anatomicalvariability (Fig. 3).
Mapping Between Surface- and Volume-Based Coordinatesand Visualization
At the end of the processing pipeline for a single subject, thetransformation from the subject’s native space to the FreeSurfer
surface coordinate system was estimated, as well as the transformationfrom the subject’s native space to FreeSurfer nonlinear volumetricspace (Fig. 1, A–D). By concatenating the two transformations andaveraging the composed transformations over all 1,000 subjects, wewere able to establish spatial correspondence between the FreeSurfersurface and volumetric coordinate systems. Since the spatial corre-spondence between FSL MNI152 space and FreeSurfer nonlinearvolumetric space was also estimated by running the FSL MNI152template through the FreeSurfer pipeline (Fig. 1, D and E), thisallowed us to obtain spatial correspondences between FSL MNI152space and FreeSurfer surface space by running the FSL MNI152template (Fig. 1E) through the FreeSurfer pipeline.
Fig. 2. Examples of within-subject surface andvolume extraction. Examples of the extractedcerebral cortex surface and cerebellum bound-aries are shown for 3 typical subjects withintheir native space. The green line shows theestimate edge of the cerebellum tailored to eachindividual subject’s T1-weighted image to illus-trate deviations in the T2* images. Imperfec-tions are apparent in the BOLD data, especiallyin regions prone to susceptibility artifact (e.g.,inferior temporal cortex).
2327THE HUMAN CEREBELLUM
J Neurophysiol • VOL 106 • NOVEMBER 2011 • www.jn.org
on Novem
ber 20, 2011jn.physiology.org
Dow
nloaded from
These correspondences were used 1) to compute functional con-nectivity between the volume and surface representations and 2) toestimate atlas coordinates using the MNI coordinate framework (Ev-ans et al. 1993) as implemented in the nonlinear FSL MNI152 space(Fonov et al. 2011). For example, signal modulation from a seedregion in the cerebellum could be extracted and the functionallycorrelated surface map computed (see below). The locations of theseed regions could also be described in terms of MNI coordinateseven though they were estimated from functional data analyzedwithin a surface representation.
Although all analyses were performed in FreeSurfer surface andvolumetric space, for the purpose of visualization, maps were dis-played in the volume using the MNI atlas space and for the surface onthe left and right inflated PALS cortical surfaces using Caret software(Van Essen 2005). Cerebellar nomenclature uses the conventions ofLarsell (1970) as described in the MRI atlas of Schmahmann et al.(1999, 2000). Diedrichsen et al. (2009) was also relied on to determinefissure and lobule locations.
Regression of Adjacent Cerebral Cortex Signal when Analyzingthe Cerebellum
The close physical proximity of the cerebellum to ventral regionsof the cerebral cortex results in the blurring of fMRI signal across thecerebellar-cerebral boundary, especially between the visual cortex andthe putative somatomotor regions of the cerebellar anterior lobe.Consequently, when no steps are taken to address this issue, func-tional coupling between neighboring regions of the cerebellum andcerebral cortex is detected that masks functional coupling of thecerebellum to other cerebral regions. To map the full extent of thecerebellar cortex to its principal cerebral targets, we adopted anadditional processing step.
The signal arising from the cerebral cortex immediately adjacent tothe cerebellum was regressed from the cerebellar signal. This wasaccomplished by computing masks of left and right cerebral cortexwithin 6 and 7 mm, respectively, from the cerebellum. The spatial
extent of the cerebellum was defined using the FreeSurfer template(Fischl et al. 2002, 2004). The distances used to define the corticalmasks were chosen so that the masks wrapped around the adjacentcerebellum. The distances were asymmetric so that the left and rightcerebral cortex contributed roughly equally to the regression. For eachindividual subject, the fMRI signal within the left and right cerebralcortex masks were averaged and regressed from the smoothed fMRIdata within the cerebellum. This regression procedure allows mappingof the full surface of the anterior lobe. Because the regression maycause artifactual reduction of true correlation of cerebral regions in theanalysis, especially visual cortex, additional analyses were performedwith and without regression for key results.
SNR Maps
Temporal SNR of the motion-corrected fMRI time series was com-puted for each voxel in the subject’s native volumetric space by averagingthe signal intensity across the whole run and dividing it by the standarddeviation over time. The SNR was averaged across runs within subjectwhen multiple runs were available. The SNR was then averaged acrossthe 1,000 subjects from the core data set and displayed in the volume tovisualize the SNR of the cerebellum. SNR was good throughout the fullextent of cerebellum, with minimal evidence for significant signal loss.However, because the cerebral cortex did possess regions of low SNR,particularly within regions prone to susceptibility artifact, including or-bital frontal cortex and inferior portions of the temporal lobe (see Fig. 3of Yeo et al. 2011), for analyses exploring correlation between thecerebellum and cerebrum, there may be low power to accurately charac-terize cerebellar regions that are coupled to affected cerebral targets. Thisissue should be kept in mind when interpreting maps of the cerebellum.
Seed Region Correlation Estimates Between the Cerebellum andCerebrum
The hybrid surface- and volume-based alignment allowed us toperform region-based analyses between the cerebellum of a subject in
Fig. 3. Examples of between-subject cerebel-lar alignment. Volumetric alignment is illus-trated for the structural data from 3 typicalsubjects. The green line represents a loose-fitting cerebellar edge estimated from thegroup template and is displayed identicallyacross the 3 subjects as a reference to illustratehow each individual conforms to the grouptemplate. Each subject’s cerebellum is wellregistered in relation to the template. Closeexamination reveals subtle differences be-tween subjects reflecting alignment errors onthe order of a few millimeters. There was noattempt to align the details of the folia be-tween subjects.
2328 THE HUMAN CEREBELLUM
J Neurophysiol • VOL 106 • NOVEMBER 2011 • www.jn.org
on Novem
ber 20, 2011jn.physiology.org
Dow
nloaded from

FreeSurfer nonlinear volume space and the cerebrum of the samesubject in FreeSurfer surface space. Cerebellar maps for specificcerebral regions were obtained by computing the Pearson’s productmoment correlation between the surface region’s preprocessed restingfMRI time course and the time courses of the voxels within the regionof the cerebellum. Cerebral regions included a single surface vertex(�4 � 4 mm) but should be considered spatially more extensivebecause of the spatial smoothing. Conversely, correlation maps fromcerebellar regions were obtained by computing the correlation be-tween the voxel’s time course and the time courses of all vertices onthe cerebral cortical surface. Cerebellar volumetric regions were alsorestricted to single voxels (2 � 2 � 2 mm) and impacted by spatialsmoothing.
To obtain group-averaged correlation z-maps, the correlation mapsof individual subjects were converted to individual subject z-mapsusing Fisher’s r-to-z transformation and then averaged across allsubjects in the group. The Fisher’s r-to-z transformation increasesnormality of the distribution of correlations in the sample. For subjectswith multiple runs, the individual subject z-maps were first averagedwithin the subject before submitting to the group average. An inverseFisher’s r-to-z transformation was then applied to the group-averagedcorrelation z-map, yielding a group-averaged correlation map.
To quantify functional connectivity between regions based onsurface vertices and volumetric voxels, Fisher’s r-to-z transformedcorrelations were computed for each subject within a group. Classicalstatistical analyses, including t-tests and ANOVA, were then per-formed on the z-correlations using Matlab 7.4 (The Mathworks,Natick, MA) or SPSS 18.0 (IBM, Armonk, NY).
Selecting Regions for Functional Connectivity Analysis
Surface and volumetric regions for functional connectivity analysiswere selected using criteria appropriate for the purpose of the givenanalysis. Regional vertices and voxels corresponding to the hand, foot,and tongue representations in the cerebrum and cerebellum were derivedbased on the analysis of the motor task data set (see Motor task analysisfor further details). When testing for seed-based confirmation of theresolved cerebellar topography, the confidence maps of the discoverysample were used to derive cerebellar regions to be tested in the repli-cation sample. In addition, we utilized a subset of cerebral regions definedin the companion paper (Yeo et al. 2011) for certain analyses. This subsetof regions was selected based on 1) the meta-analysis of putative humanfrontal eye field (FEF) coordinates reported in the fMRI literature, 2)probabilistic histological maps of V1 (Amunts et al. 2000; Fischl et al.2008) and MT� (Malikovic et al. 2007; Wilms et al. 2005; Yeo et al.2010) estimated from 10 subjects mapped to FreeSurfer surface space,and 3) the estimated cerebral network boundaries and confidence in thediscovery sample. Further details can be found in Yeo et al. (2011). If aparticular data set was used for defining the region (e.g., discoverysample), functional connectivity was always computed with a differentdata set (e.g., replication sample), providing unbiased measurement ofcorrelation strength.
Motor Task Analysis
After preprocessing, the task data collected in the 26 subjects wereanalyzed using the general linear model (GLM), including the threemovement conditions as well as fixation as regressors of interest. Theonsets of the three movement events were modeled 2 s after the
Fig. 4. Functional connectivity of the cerebral motor hand region revealscontralateral somatomotor regions of the cerebellum. Coronal sections (top,y � �20; bottom, y � �55) display functional connectivity for the directcontrast between seed motor regions placed in the left and right hand regionsof 1,000 subjects (white circles in top section display the region locations).Each panel shows connectivity maps for a different coronal section (top: y ��20 mm, the section containing the hand region of M1; bottom: y � �55 mm,the section containing the cerebellar hand representation). Red colors displayconnectivity of the right motor seed region subtracted from the left motor seedregion; blue colors display the reverse subtraction. Note the crossed lateral-ization and double representation in the cerebellum, including the strongprimary somatomotor representation in the anterior lobe (top) and the slightlyweaker secondary representation in the posterior lobe (bottom). Color barsindicate the correlation strength [z(r)]. The correlation strength near to the seedregions (top) is considerably stronger than the distant correlations (bottom),necessitating plotting the data using different scales. The left hemisphere isdisplayed at left (neurological convention).
Table 1. Locations of seed regions used to quantify specificity ofsomatomotor networks
Left Coordinates Right Coordinates
Cerebral CortexM1F �6, �26, 76 6, �26, 76M1H �41, �20, 62 41, �20, 62M1T �55, �4, 26 55, �4, 26S1F �10, �42, 74 10, �42, 74S1H �42, �35, 65 42, �35, 65S1T �64, �8, 27 64, �8, 27FEF �26, �6, 48 26, �6, 48PrCv �50, 6, 30 50, 6, 30
CerebellumFoot �17, �33, �26 14, �34, �26Hand �20, �52, �24 17, �52, �24Tongue �18, �61, �21 16, �61, �22
Coordinates represent x, y, z in the atlas space of the Montreal NeurologicalInstitute (MNI). Motor task functional magnetic resonance imaging (fMRI)together with probabilistic histological maps of areas 2 and 4 (Geyer et al.1996; Grefkes et al. 2001; Fischl et al. 2008) were used to identify M1F, M1H,M1T, S1F, S1H, and S1T in the left hemispheres (where subscripts F, H, and Tindicate foot, hand, and tongue representations) and were reflected across themidline in MNI space to obtain seed regions in the right hemisphere. Motortask fMRI was also used to identify motor seed regions in the right cerebellum.Left frontal eye field (FEF) and ventral precentral cortex (PrCv) seed regionswere obtained from Yeo et al. (2011). Contralateral cerebellar seed regionswere obtained by reflection across the midline in the native FreeSurfer volumespace, leading to asymmetric MNI atlas coordinates in some instances.
2329THE HUMAN CEREBELLUM
J Neurophysiol • VOL 106 • NOVEMBER 2011 • www.jn.org
on Novem
ber 20, 2011jn.physiology.org
Dow
nloaded from

appearance of the cue to account for potential differences in move-ment initiation/preparation times across the different motor effectors.The duration of each event was set to the remaining duration of eachmovement block (40 s), and events were modeled with a canonicalhemodynamic response function along with its temporal derivative.Regressors of no interest included run means, low-frequency lineartrends, and six parameters obtained for correction of rigid body headmotion. Contrasts of interest were constructed and analyzed using theSPM2 software package (Friston et al. 1995).
GLM analyses were performed in subjects’ native fMRI space.The maps of individual subjects corresponding to each movementcontrast were then transformed onto the FreeSurfer surface coor-dinate system and averaged across subjects. The averaged contrastmaps, together with probabilistic histological maps of areas 2 and4 (Geyer et al. 1996, Grefkes et al. 2001; Fischl et al. 2008), wereused to identify peak vertices in M1 and S1 associated with eachparticular movement.
For the cerebellum, the contrast maps of individual subjects cor-responding to hand � foot and foot � tongue were transformed intoFreeSurfer nonlinear volumetric space and averaged across subjects.
The averaged hand � foot contrast map was used to identify peakvoxels associated with either hand or foot movement, whereas theaveraged tongue � foot contrast map was used to identify the peakvoxel associated with tongue movement. Comparisons of these con-ditions to fixation produced similar peak coordinates. However, thedirect comparison of the two movement conditions additionally re-moved nonspecific responses in the cerebellum and was thereforepreferred (similar to Krienen and Buckner 2009).
Because the task consisted of right hand and foot motion, we selectedpeaks in the left hemisphere of the cerebrum and in the right hemisphereof the cerebellum. Corresponding seed locations in the contralateralhemispheres were determined by reflecting the peak coordinates acrossthe midline. The bilateral sets of seed regions derived from this procedurewere then carried forward to estimate the cerebellar topography of thethree motor effectors in the independent resting-state data.
Distribution of Parcellations and Raw Data
A primary result of our analyses is the parcellation of thecerebellum into networks. The parcellations in FreeSurfer space
Fig. 5. Functional connectivity reveals inverted somatomotor topography within the anterior lobe of the cerebellum that is comparable to task-evoked estimates.A: the cerebral (right hemisphere) and cerebellar (left hemisphere) locations of the hind paw (green), forepaw (red), and face (blue) somatomotor representationsin the monkey are known from physiological responses to stimulation. Note that the representation of body space is inverted in the anterior lobe. [Adapted fromAdrian (1943).] B: the cerebral somatomotor topography evoked by foot (green), hand (red), and tongue (blue) movements as measured by task fMRI in thehuman. C: the inverted somatomotor topography is clearly present in the anterior lobe of the contralateral cerebellum. D: right cerebral seed regions were definedbased on the task activation data in B and reflected across the midline. The seed regions are illustrated for the right hemisphere to show their positions relativeto the left hemisphere task data. E: the somatomotor map in the cerebellum is displayed based exclusively on functional connectivity MRI (fcMRI) with thecontralateral cerebrum. The inverted somatomotor topography is present and similar to the task-based estimates, suggesting functional connectivity can resolvedistinct regions of body space within the cerebellum. F: 3 views of somatomotor representation within the cerebellum are illustrated. Each estimate comes froma bilateral cerebral region and represents the extent of the functionally coupled response thresholded at r � 0.04. Displayed coordinates represent the plane inMNI atlas space. Note that the anterior lobe representation is inverted with the foot anterior to the hand and tongue, whereas the posterior lobe representationis upright with the tongue anterior to the hand and foot.
2330 THE HUMAN CEREBELLUM
J Neurophysiol • VOL 106 • NOVEMBER 2011 • www.jn.org
on Novem
ber 20, 2011jn.physiology.org
Dow
nloaded from
are available (http://www.freesurfer.net/fswiki/CerebellumParcel-lation_Buckner2011). Movies of the region-based functional con-nectivity estimates can be downloaded from http://www.youtube-.com/bucknerkrienen. The raw functional MRI data from the 1,000subjects in the functional connectivity analysis will be madeopenly available to researchers using the procedures established bythe OASIS data releases (Marcus et al. 2007, 2010) and the 1,000Functional Connectomes Project (Biswal et al. 2010).
RESULTS
Cerebral Motor Regions Show Functional Connectivity withthe Contralateral Cerebellum
Subtraction of functional connectivity maps from left andright motor cortex seed regions revealed robust contralateralconnectivity in the cerebellum (Fig. 4). Results are shown foranalysis of all 1,000 subjects. Coordinates of the motor cortexseed regions are reported in Table 1. The cerebral seed regionswere localized within the hand representations. Both the pri-mary and secondary somatomotor representations in the ante-rior and posterior lobes are evident. Moreover, the functionalconnectivity is specific to the expected regions of the cerebel-lum and not broadly throughout the cerebellum.
Functional Connectivity Reveals the SomatomotorTopography of the Cerebellum
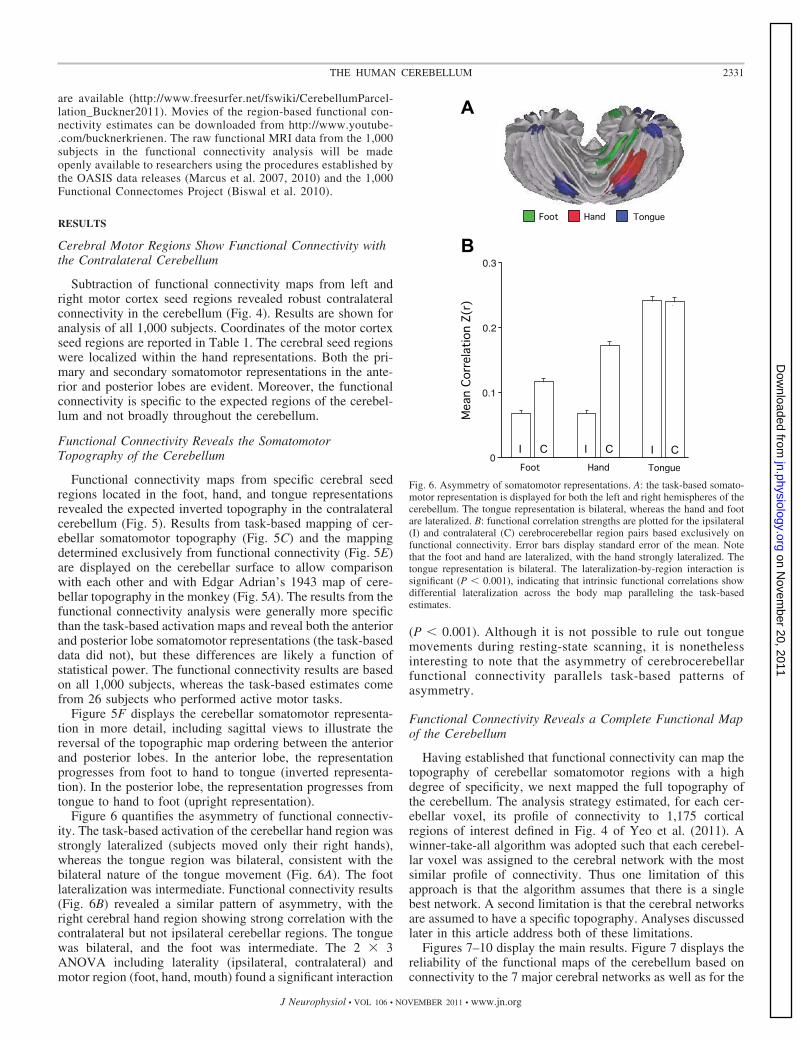
Functional connectivity maps from specific cerebral seedregions located in the foot, hand, and tongue representationsrevealed the expected inverted topography in the contralateralcerebellum (Fig. 5). Results from task-based mapping of cer-ebellar somatomotor topography (Fig. 5C) and the mappingdetermined exclusively from functional connectivity (Fig. 5E)are displayed on the cerebellar surface to allow comparisonwith each other and with Edgar Adrian’s 1943 map of cere-bellar topography in the monkey (Fig. 5A). The results from thefunctional connectivity analysis were generally more specificthan the task-based activation maps and reveal both the anteriorand posterior lobe somatomotor representations (the task-baseddata did not), but these differences are likely a function ofstatistical power. The functional connectivity results are basedon all 1,000 subjects, whereas the task-based estimates comefrom 26 subjects who performed active motor tasks.
Figure 5F displays the cerebellar somatomotor representa-tion in more detail, including sagittal views to illustrate thereversal of the topographic map ordering between the anteriorand posterior lobes. In the anterior lobe, the representationprogresses from foot to hand to tongue (inverted representa-tion). In the posterior lobe, the representation progresses fromtongue to hand to foot (upright representation).
Figure 6 quantifies the asymmetry of functional connectiv-ity. The task-based activation of the cerebellar hand region wasstrongly lateralized (subjects moved only their right hands),whereas the tongue region was bilateral, consistent with thebilateral nature of the tongue movement (Fig. 6A). The footlateralization was intermediate. Functional connectivity results(Fig. 6B) revealed a similar pattern of asymmetry, with theright cerebral hand region showing strong correlation with thecontralateral but not ipsilateral cerebellar regions. The tonguewas bilateral, and the foot was intermediate. The 2 � 3ANOVA including laterality (ipsilateral, contralateral) andmotor region (foot, hand, mouth) found a significant interaction
(P � 0.001). Although it is not possible to rule out tonguemovements during resting-state scanning, it is nonethelessinteresting to note that the asymmetry of cerebrocerebellarfunctional connectivity parallels task-based patterns ofasymmetry.
Functional Connectivity Reveals a Complete Functional Mapof the Cerebellum
Having established that functional connectivity can map thetopography of cerebellar somatomotor regions with a highdegree of specificity, we next mapped the full topography ofthe cerebellum. The analysis strategy estimated, for each cer-ebellar voxel, its profile of connectivity to 1,175 corticalregions of interest defined in Fig. 4 of Yeo et al. (2011). Awinner-take-all algorithm was adopted such that each cerebel-lar voxel was assigned to the cerebral network with the mostsimilar profile of connectivity. Thus one limitation of thisapproach is that the algorithm assumes that there is a singlebest network. A second limitation is that the cerebral networksare assumed to have a specific topography. Analyses discussedlater in this article address both of these limitations.
Figures 7–10 display the main results. Figure 7 displays thereliability of the functional maps of the cerebellum based onconnectivity to the 7 major cerebral networks as well as for the
Fig. 6. Asymmetry of somatomotor representations. A: the task-based somato-motor representation is displayed for both the left and right hemispheres of thecerebellum. The tongue representation is bilateral, whereas the hand and footare lateralized. B: functional correlation strengths are plotted for the ipsilateral(I) and contralateral (C) cerebrocerebellar region pairs based exclusively onfunctional connectivity. Error bars display standard error of the mean. Notethat the foot and hand are lateralized, with the hand strongly lateralized. Thetongue representation is bilateral. The lateralization-by-region interaction issignificant (P � 0.001), indicating that intrinsic functional correlations showdifferential lateralization across the body map paralleling the task-basedestimates.
2331THE HUMAN CEREBELLUM
J Neurophysiol • VOL 106 • NOVEMBER 2011 • www.jn.org
on Novem
ber 20, 2011jn.physiology.org
Dow
nloaded from
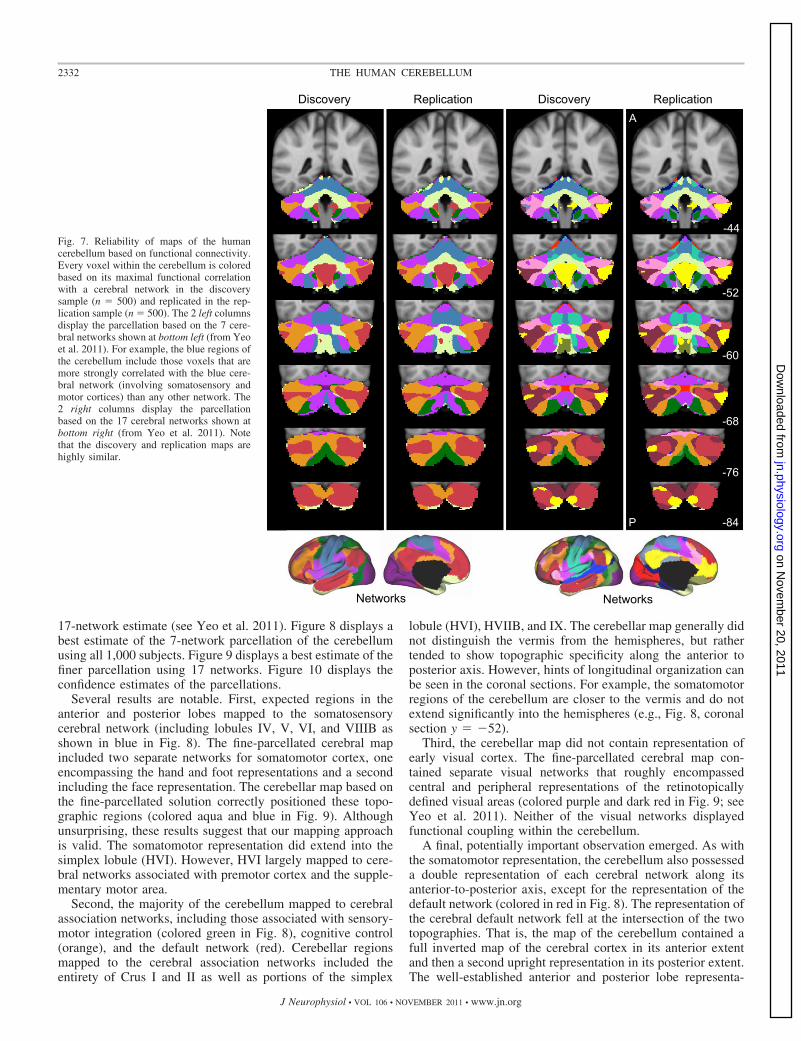
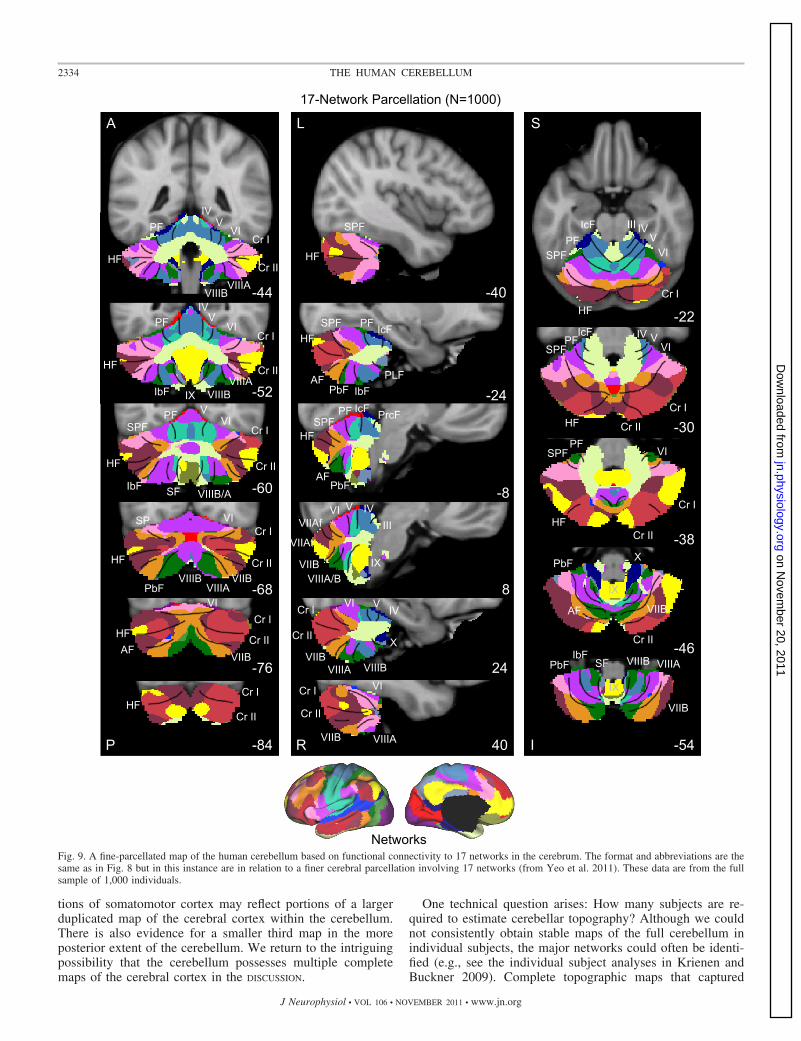
17-network estimate (see Yeo et al. 2011). Figure 8 displays abest estimate of the 7-network parcellation of the cerebellumusing all 1,000 subjects. Figure 9 displays a best estimate of thefiner parcellation using 17 networks. Figure 10 displays theconfidence estimates of the parcellations.
Several results are notable. First, expected regions in theanterior and posterior lobes mapped to the somatosensorycerebral network (including lobules IV, V, VI, and VIIIB asshown in blue in Fig. 8). The fine-parcellated cerebral mapincluded two separate networks for somatomotor cortex, oneencompassing the hand and foot representations and a secondincluding the face representation. The cerebellar map based onthe fine-parcellated solution correctly positioned these topo-graphic regions (colored aqua and blue in Fig. 9). Althoughunsurprising, these results suggest that our mapping approachis valid. The somatomotor representation did extend into thesimplex lobule (HVI). However, HVI largely mapped to cere-bral networks associated with premotor cortex and the supple-mentary motor area.
Second, the majority of the cerebellum mapped to cerebralassociation networks, including those associated with sensory-motor integration (colored green in Fig. 8), cognitive control(orange), and the default network (red). Cerebellar regionsmapped to the cerebral association networks included theentirety of Crus I and II as well as portions of the simplex
lobule (HVI), HVIIB, and IX. The cerebellar map generally didnot distinguish the vermis from the hemispheres, but rathertended to show topographic specificity along the anterior toposterior axis. However, hints of longitudinal organization canbe seen in the coronal sections. For example, the somatomotorregions of the cerebellum are closer to the vermis and do notextend significantly into the hemispheres (e.g., Fig. 8, coronalsection y � �52).
Third, the cerebellar map did not contain representation ofearly visual cortex. The fine-parcellated cerebral map con-tained separate visual networks that roughly encompassedcentral and peripheral representations of the retinotopicallydefined visual areas (colored purple and dark red in Fig. 9; seeYeo et al. 2011). Neither of the visual networks displayedfunctional coupling within the cerebellum.
A final, potentially important observation emerged. As withthe somatomotor representation, the cerebellum also possesseda double representation of each cerebral network along itsanterior-to-posterior axis, except for the representation of thedefault network (colored in red in Fig. 8). The representation ofthe cerebral default network fell at the intersection of the twotopographies. That is, the map of the cerebellum contained afull inverted map of the cerebral cortex in its anterior extentand then a second upright representation in its posterior extent.The well-established anterior and posterior lobe representa-
Fig. 7. Reliability of maps of the humancerebellum based on functional connectivity.Every voxel within the cerebellum is coloredbased on its maximal functional correlationwith a cerebral network in the discoverysample (n � 500) and replicated in the rep-lication sample (n � 500). The 2 left columnsdisplay the parcellation based on the 7 cere-bral networks shown at bottom left (from Yeoet al. 2011). For example, the blue regions ofthe cerebellum include those voxels that aremore strongly correlated with the blue cere-bral network (involving somatosensory andmotor cortices) than any other network. The2 right columns display the parcellationbased on the 17 cerebral networks shown atbottom right (from Yeo et al. 2011). Notethat the discovery and replication maps arehighly similar.
2332 THE HUMAN CEREBELLUM
J Neurophysiol • VOL 106 • NOVEMBER 2011 • www.jn.org
on Novem
ber 20, 2011jn.physiology.org
Dow
nloaded from
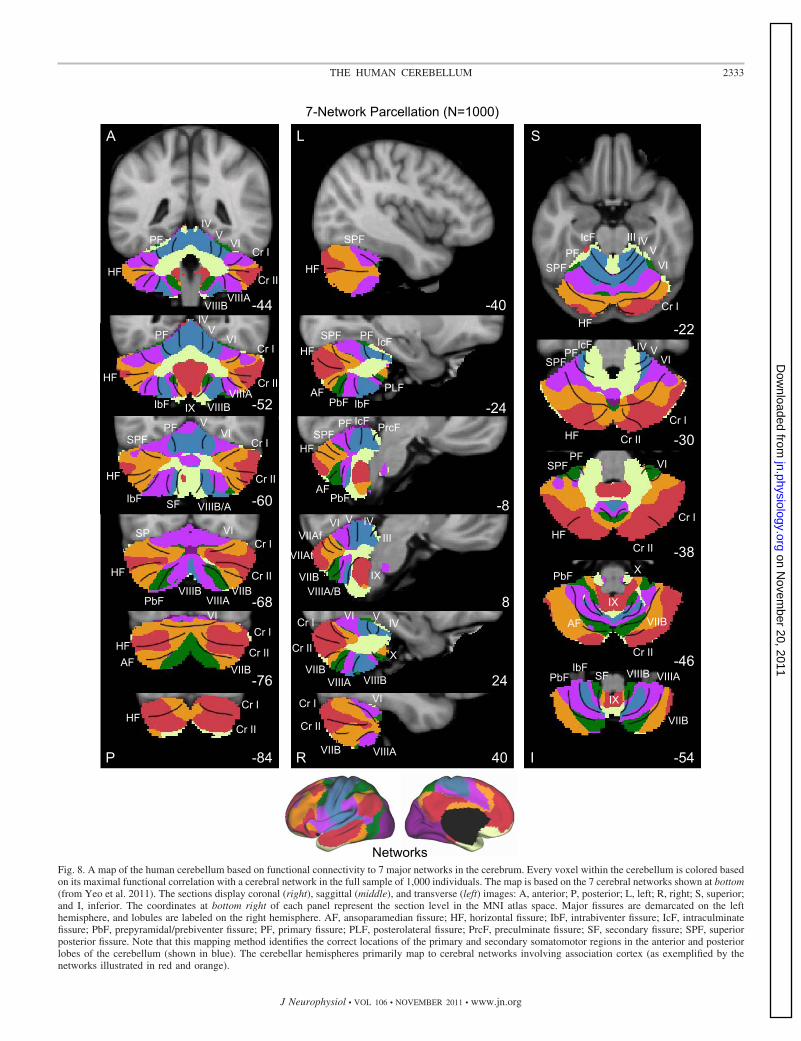
Fig. 8. A map of the human cerebellum based on functional connectivity to 7 major networks in the cerebrum. Every voxel within the cerebellum is colored basedon its maximal functional correlation with a cerebral network in the full sample of 1,000 individuals. The map is based on the 7 cerebral networks shown at bottom(from Yeo et al. 2011). The sections display coronal (right), saggittal (middle), and transverse (left) images: A, anterior; P, posterior; L, left; R, right; S, superior;and I, inferior. The coordinates at bottom right of each panel represent the section level in the MNI atlas space. Major fissures are demarcated on the lefthemisphere, and lobules are labeled on the right hemisphere. AF, ansoparamedian fissure; HF, horizontal fissure; IbF, intrabiventer fissure; IcF, intraculminatefissure; PbF, prepyramidal/prebiventer fissure; PF, primary fissure; PLF, posterolateral fissure; PrcF, preculminate fissure; SF, secondary fissure; SPF, superiorposterior fissure. Note that this mapping method identifies the correct locations of the primary and secondary somatomotor regions in the anterior and posteriorlobes of the cerebellum (shown in blue). The cerebellar hemispheres primarily map to cerebral networks involving association cortex (as exemplified by thenetworks illustrated in red and orange).
2333THE HUMAN CEREBELLUM
J Neurophysiol • VOL 106 • NOVEMBER 2011 • www.jn.org
on Novem
ber 20, 2011jn.physiology.org
Dow
nloaded from
tions of somatomotor cortex may reflect portions of a largerduplicated map of the cerebral cortex within the cerebellum.There is also evidence for a smaller third map in the moreposterior extent of the cerebellum. We return to the intriguingpossibility that the cerebellum possesses multiple completemaps of the cerebral cortex in the DISCUSSION.
One technical question arises: How many subjects are re-quired to estimate cerebellar topography? Although we couldnot consistently obtain stable maps of the full cerebellum inindividual subjects, the major networks could often be identi-fied (e.g., see the individual subject analyses in Krienen andBuckner 2009). Complete topographic maps that captured
Fig. 9. A fine-parcellated map of the human cerebellum based on functional connectivity to 17 networks in the cerebrum. The format and abbreviations are thesame as in Fig. 8 but in this instance are in relation to a finer cerebral parcellation involving 17 networks (from Yeo et al. 2011). These data are from the fullsample of 1,000 individuals.
2334 THE HUMAN CEREBELLUM
J Neurophysiol • VOL 106 • NOVEMBER 2011 • www.jn.org
on Novem
ber 20, 2011jn.physiology.org
Dow
nloaded from
much of the topography of the 7-network parcellation could beproduced with as few as 10 subjects. Details of the 17-networkparcellation, borders between regions, and the edge of thecerebellum near to the cerebral cortex required much largersample sizes to stabilize.
The Cerebellum Is Proportionately Mapped to the Cerebrumwith a Few Exceptions
The analyses above resulted in a complete map of theanterior and posterior cerebellar lobes. Such a map providesan opportunity to ask quantitative questions about the rela-
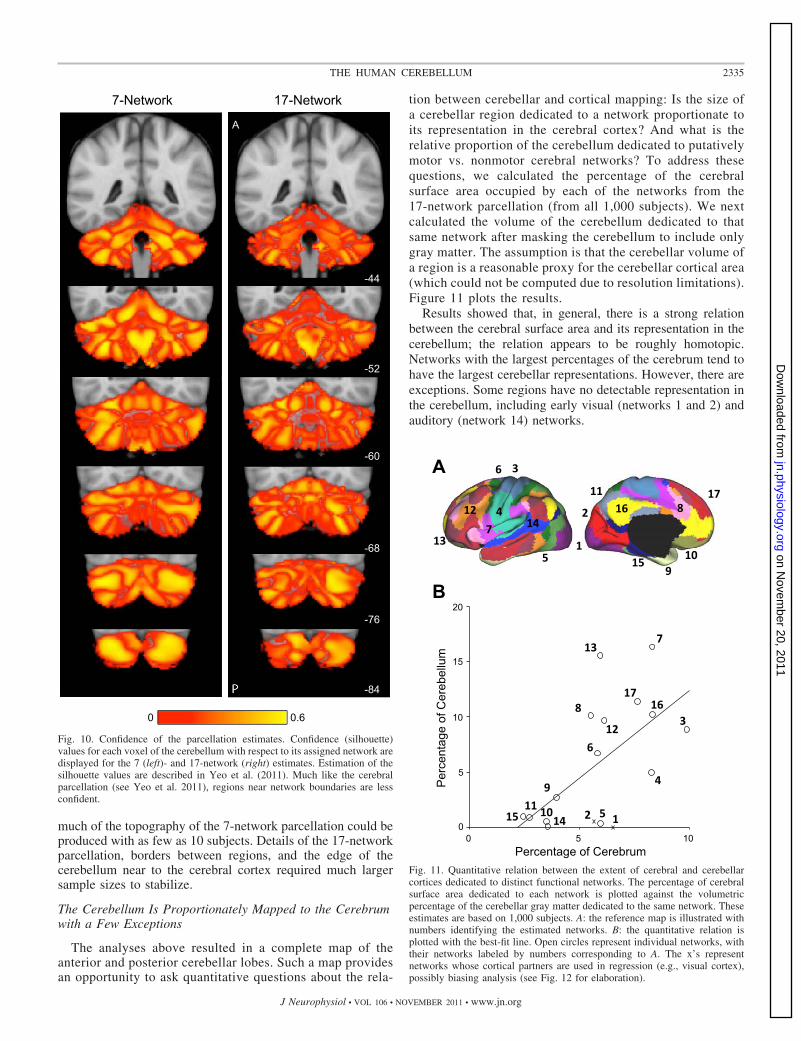
tion between cerebellar and cortical mapping: Is the size ofa cerebellar region dedicated to a network proportionate toits representation in the cerebral cortex? And what is therelative proportion of the cerebellum dedicated to putativelymotor vs. nonmotor cerebral networks? To address thesequestions, we calculated the percentage of the cerebralsurface area occupied by each of the networks from the17-network parcellation (from all 1,000 subjects). We nextcalculated the volume of the cerebellum dedicated to thatsame network after masking the cerebellum to include onlygray matter. The assumption is that the cerebellar volume ofa region is a reasonable proxy for the cerebellar cortical area(which could not be computed due to resolution limitations).Figure 11 plots the results.
Results showed that, in general, there is a strong relationbetween the cerebral surface area and its representation in thecerebellum; the relation appears to be roughly homotopic.Networks with the largest percentages of the cerebrum tend tohave the largest cerebellar representations. However, there areexceptions. Some regions have no detectable representation inthe cerebellum, including early visual (networks 1 and 2) andauditory (network 14) networks.
Fig. 11. Quantitative relation between the extent of cerebral and cerebellarcortices dedicated to distinct functional networks. The percentage of cerebralsurface area dedicated to each network is plotted against the volumetricpercentage of the cerebellar gray matter dedicated to the same network. Theseestimates are based on 1,000 subjects. A: the reference map is illustrated withnumbers identifying the estimated networks. B: the quantitative relation isplotted with the best-fit line. Open circles represent individual networks, withtheir networks labeled by numbers corresponding to A. The x’s representnetworks whose cortical partners are used in regression (e.g., visual cortex),possibly biasing analysis (see Fig. 12 for elaboration).
Fig. 10. Confidence of the parcellation estimates. Confidence (silhouette)values for each voxel of the cerebellum with respect to its assigned network aredisplayed for the 7 (left)- and 17-network (right) estimates. Estimation of thesilhouette values are described in Yeo et al. (2011). Much like the cerebralparcellation (see Yeo et al. 2011), regions near network boundaries are lessconfident.
2335THE HUMAN CEREBELLUM
J Neurophysiol • VOL 106 • NOVEMBER 2011 • www.jn.org
on Novem
ber 20, 2011jn.physiology.org
Dow
nloaded from
Primary Visual Cortex and Auditory Cortex Are NotRepresented in the Human Cerebellum
Exceptions to the general trend for cerebral areas to haveproportionate representations in the cerebellum were found forvisual and auditory cortices. However, these analyses havelimitations. First, because the cerebellar voxels are assigned totheir most strongly correlated cerebral network, it remainspossible that correlations are present but that they are over-shadowed by correlations to other networks. Second, to reduceinduction of artifactual correlations in the cerebellum fromimmediately adjacent occipital cortex, the signal from theseregions was regressed out (see METHODS). Thus it is possiblethat the extent of the cerebellum coupled to visual cortex isunderestimated.
We conducted analyses to address these issues. Regionswere defined within the central and peripheral estimates of V1based on histology. Coordinate locations of the visual seedregions are reported in Table 2. Functional connectivity witheach of these cerebral regions was then mapped within thecerebellum for the full sample of 1,000 subjects. The map wascomputed for each visual region in isolation without referenceto other cerebral networks. Furthermore, fcMRI maps werecomputed with and without regression of signal from occipitalcortex near to the cerebellum. Results are shown in Fig. 12. No
evidence for functional coupling of central or peripheral V1with the cerebellum was detected beyond coupling of cere-bellar cortex immediately adjacent to visual cortex. Thesame analysis was repeated for a region at or near auditorycortex (Fig. 12; x, y, z MNI coordinate � �51, �45, 11).Again, no evidence was found for functional couplingwithin the cerebellum.
Quantitative Measurement of Cerebrocerebellar CircuitsDemonstrates Specificity
Analyses up to this point focused on cerebellar maps basedon estimating the primary functionally coupled targets fordefined cerebral networks. Such analyses assume that thetopographies of cerebral networks are respected by the cere-brocerebellar connectivity patterns. If a region in the cerebel-lum correlated with a fundamentally different pattern in thecerebrum, it would still be assigned to the best-fitting networkand the discrepancy would go undetected. To address thisissue, we conducted a series of analyses with two goals. First,the full cerebral connectivity patterns were mapped for specificcerebellar seed regions. Such maps are not bound by assump-tions about the cerebral topography and thus serve to indepen-dently verify whether the networks described above accuratelyrepresent cerebrocerebellar circuits as measured by functionalconnectivity. Second, functional connectivity was measuredbetween multiple seed regions within the cerebellum and thecerebrum to quantitatively explore specificity of cerebrocer-ebellar circuits. As with earlier analyses, we began by focusingon somatomotor cortex because of its established properties.After analysis of somatomotor cortex, we extended the proce-dures to cerebrocerebellar circuits linked to association areas.
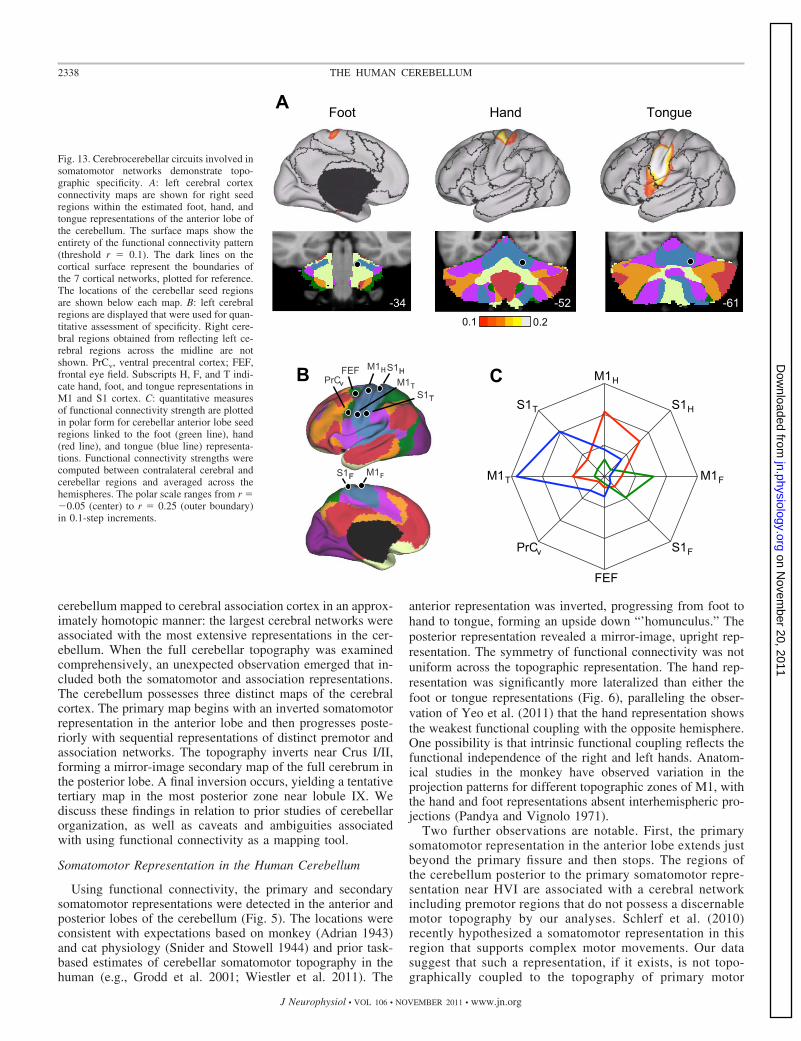
Figure 13 displays results for somatomotor cortex. Seedregions were placed along the right somatomotor representationof the cerebellar anterior lobe within the estimated foot, hand, andtongue representations. The cerebral functional connectivity mapswere then computed for each topographically specific set of seedregions (Fig. 13A). Results revealed that, at a map level, thefunctionally correlated cerebral regions are restricted to the so-matomotor cortex and march from the midline to lateral surface asexpected based on known topography. The cerebral topographyappeared specific. See http://www.youtube.com/bucknerkrienenfor animation of this observation.
Somatomotor cortex. Region-based correlations were nextcomputed to quantify these observations. Functional con-nectivity strengths between each cerebellar seed region andthe entire set of cerebral somatomotor regions were com-puted and plotted in polar form (Fig. 13, B and C). Func-tional connectivity strengths were computed between thecontralateral cerebral and cerebellar regions and averagedacross the hemispheres. The polar plot displays functionalconnectivity strength from �0.05 to 0.25. Note that thecoupling between the cerebellum and cerebral cortex ispreferential to the representations of the relevant body part.Moreover, none of the cerebellar regions associated with theprimary somatosensory representations are coupled to theputative human FEF region. These results quantitativelydemonstrate a high level of specificity between the cerebel-lum and cerebral partners in somatomotor cortex.
Association cortex. We next generalized the approach de-scribed above to explore four regions of the cerebellum
Table 2. Locations of seed regions used to quantify specificity ofassociation networks
Left Coordinates Right Coordinates
Cerebral cortexM1H �41, �20, 62 41, �20, 62S1H �42, �35, 65 42, �35, 65FEF �26, �6, 48 26, �6, 48PrCv �50, 6, 30 50, 6, 306vr� �55, 6, 11 55, 6, 11PFCda �31, 39, 30 31, 39, 30V1p �16, �74, 7 16, �74, 7V1c �13, �100, �8 13, �100, �8MT� �45, �72, 3 45, �72, 3PCC �3, �49, 25 3, �49, 25PFCd �15, 42, 46 15, 42, 46STS �55, �10, �16 55, �10, �16PFCla �41, 55, 4 41, 55, 4PFClp �45, 29, 32 45, 29, 32
CerebellumVentral attention �31, �62, �21 30, �62, �21Frontoparietal control �42, �73, �26 39, �72, �27Default network �32, �79, �31 29, �78, �32Dorsal attention �6, �76, �43 9, �75, �43
Left cerebral cortical seed regions were obtained from Yeo et al. (2011)except PFCd, which was selected from the high-confidence default networkregion in the dorsal prefrontal cortex in the discovery data set. Left cerebellarseed regions were selected from each association network based on thediscovery data set, using the confidence map as a guide. Contralateral seedregions were obtained by reflection across the midline. M1, primary motorcortex; S1, somatosensory cortex; V1, visual cortex; PCC, posterior cingulatecortex; STS, superior temporal sulcus. Labels for the regions within thecerebellum correspond to the network names as commonly used in the humanneuroimaging literature and should be used as heuristics (see Yeo et al. 2011for discussion). Alternative names and variations exist. For example, theventral attention network is most likely an aggregate of closely adjacentnetworks variably referred to as the ventral attention, salience (Seeley et al.2007), and cingulo-opercular (Dosenbach et al. 2007) networks. Similarly, thedefault network can be meaningfully fractionated (e.g., Andrews-Hanna et al.2010).
2336 THE HUMAN CEREBELLUM
J Neurophysiol • VOL 106 • NOVEMBER 2011 • www.jn.org
on Novem
ber 20, 2011jn.physiology.org
Dow
nloaded from

coupled to cerebral association cortex (Fig. 14). Again, thecerebral maps derived from functional connectivity withcerebellar seed regions reveal specific topography. Each setof cerebellar seed regions mapped to a distinct set of dis-tributed cerebral regions. Of importance, the cerebral re-gions largely fall within the networks as defined in Yeo et al.(2011). For example, cerebellar seed regions on the borderof Crus I/II (Fig. 14A) demonstrate functional connectivitywith distributed cerebral regions linked to the default net-work, including the posterior cingulate, the lateral temporalcortex, the inferior parietal lobule, and an extended regionalong medial prefrontal cortex. By contrast, distinct cere-bellar seed regions anterior in Crus I (Fig. 14B) demonstratefunctional connectivity with dorsolateral prefrontal cortex,the rostral portion of the inferior parietal lobule, and afrontal midline region bordering presupplementary motorarea and the anterior cingulate.
The four cerebrocerebellar circuits involving associationcortex were quantified. Distributed cerebral regions were se-lected as shown in Fig. 15A. The correlation strengths between
the cerebellar regions and the distributed cerebral regions aredisplayed in Fig. 15, B–E. Much like the selectivity observedfor the somatomotor regions (Fig. 13), the cerebrocerebellarcircuits involving association cortex also display selectivity.These results support the hypothesis that cerebrocerebellarcircuits arising from distinct cerebellar regions are selective forseparate and distributed cerebral networks. The selectivity doesnot divide broad lobar regions of the cerebral cortex (e.g., thefrontal lobe vs. the parietal lobe), but rather maps to distributedregions that are components of distinct functionally coupledcerebral networks (Yeo et al. 2011).
DISCUSSION
The results revealed both expected and novel organizationalproperties of the human cerebellum. Confirming known func-tional anatomy, somatomotor representations of body spacewere observed in the anterior and posterior lobes that weretopographically mapped and preferentially contralateral withrespect to the cerebrum. Somatomotor regions occupied only asmall portion of the cerebellum. The majority of the human
Fig. 12. Evidence that the human cerebellum does not show functional connectivity with primary visual and auditory cortices. Functional connectivity betweenthe primary visual cortex and the cerebellum was examined in detail. A: 2 primary visual cortex regions were selected based on postmortem histological estimateson V1 projected onto the cortical surface reference. V1p, peripheral representation of V1; V1c, central representation of V1. Shaded yellow areas represent thesurface projection of histologically estimated V1. A region near auditory cortex (right) was also selected. B: functional connectivity maps for each seed regionwithout (no regress) and with regression of the visual signal near the cerebellum (vis regress). Regression was removed to ensure that the map is notunderestimating the representation of visual or auditory regions within the cerebellum. There is no evidence for representation of primary visual or auditorycortices within the cerebellum except for cerebellar cortex just adjacent to visual cortex (marked by an asterisk in leftmost column).
2337THE HUMAN CEREBELLUM
J Neurophysiol • VOL 106 • NOVEMBER 2011 • www.jn.org
on Novem
ber 20, 2011jn.physiology.org
Dow
nloaded from
cerebellum mapped to cerebral association cortex in an approx-imately homotopic manner: the largest cerebral networks wereassociated with the most extensive representations in the cer-ebellum. When the full cerebellar topography was examinedcomprehensively, an unexpected observation emerged that in-cluded both the somatomotor and association representations.The cerebellum possesses three distinct maps of the cerebralcortex. The primary map begins with an inverted somatomotorrepresentation in the anterior lobe and then progresses poste-riorly with sequential representations of distinct premotor andassociation networks. The topography inverts near Crus I/II,forming a mirror-image secondary map of the full cerebrum inthe posterior lobe. A final inversion occurs, yielding a tentativetertiary map in the most posterior zone near lobule IX. Wediscuss these findings in relation to prior studies of cerebellarorganization, as well as caveats and ambiguities associatedwith using functional connectivity as a mapping tool.
Somatomotor Representation in the Human Cerebellum
Using functional connectivity, the primary and secondarysomatomotor representations were detected in the anterior andposterior lobes of the cerebellum (Fig. 5). The locations wereconsistent with expectations based on monkey (Adrian 1943)and cat physiology (Snider and Stowell 1944) and prior task-based estimates of cerebellar somatomotor topography in thehuman (e.g., Grodd et al. 2001; Wiestler et al. 2011). The
anterior representation was inverted, progressing from foot tohand to tongue, forming an upside down “’homunculus.” Theposterior representation revealed a mirror-image, upright rep-resentation. The symmetry of functional connectivity was notuniform across the topographic representation. The hand rep-resentation was significantly more lateralized than either thefoot or tongue representations (Fig. 6), paralleling the obser-vation of Yeo et al. (2011) that the hand representation showsthe weakest functional coupling with the opposite hemisphere.One possibility is that intrinsic functional coupling reflects thefunctional independence of the right and left hands. Anatom-ical studies in the monkey have observed variation in theprojection patterns for different topographic zones of M1, withthe hand and foot representations absent interhemispheric pro-jections (Pandya and Vignolo 1971).
Two further observations are notable. First, the primarysomatomotor representation in the anterior lobe extends justbeyond the primary fissure and then stops. The regions ofthe cerebellum posterior to the primary somatomotor repre-sentation near HVI are associated with a cerebral networkincluding premotor regions that do not possess a discernablemotor topography by our analyses. Schlerf et al. (2010)recently hypothesized a somatomotor representation in thisregion that supports complex motor movements. Our datasuggest that such a representation, if it exists, is not topo-graphically coupled to the topography of primary motor
Fig. 13. Cerebrocerebellar circuits involved insomatomotor networks demonstrate topo-graphic specificity. A: left cerebral cortexconnectivity maps are shown for right seedregions within the estimated foot, hand, andtongue representations of the anterior lobe ofthe cerebellum. The surface maps show theentirety of the functional connectivity pattern(threshold r � 0.1). The dark lines on thecortical surface represent the boundaries ofthe 7 cortical networks, plotted for reference.The locations of the cerebellar seed regionsare shown below each map. B: left cerebralregions are displayed that were used for quan-titative assessment of specificity. Right cere-bral regions obtained from reflecting left ce-rebral regions across the midline are notshown. PrCv, ventral precentral cortex; FEF,frontal eye field. Subscripts H, F, and T indi-cate hand, foot, and tongue representations inM1 and S1 cortex. C: quantitative measuresof functional connectivity strength are plottedin polar form for cerebellar anterior lobe seedregions linked to the foot (green line), hand(red line), and tongue (blue line) representa-tions. Functional connectivity strengths werecomputed between contralateral cerebral andcerebellar regions and averaged across thehemispheres. The polar scale ranges from r ��0.05 (center) to r � 0.25 (outer boundary)in 0.1-step increments.
2338 THE HUMAN CEREBELLUM
J Neurophysiol • VOL 106 • NOVEMBER 2011 • www.jn.org
on Novem
ber 20, 2011jn.physiology.org
Dow
nloaded from
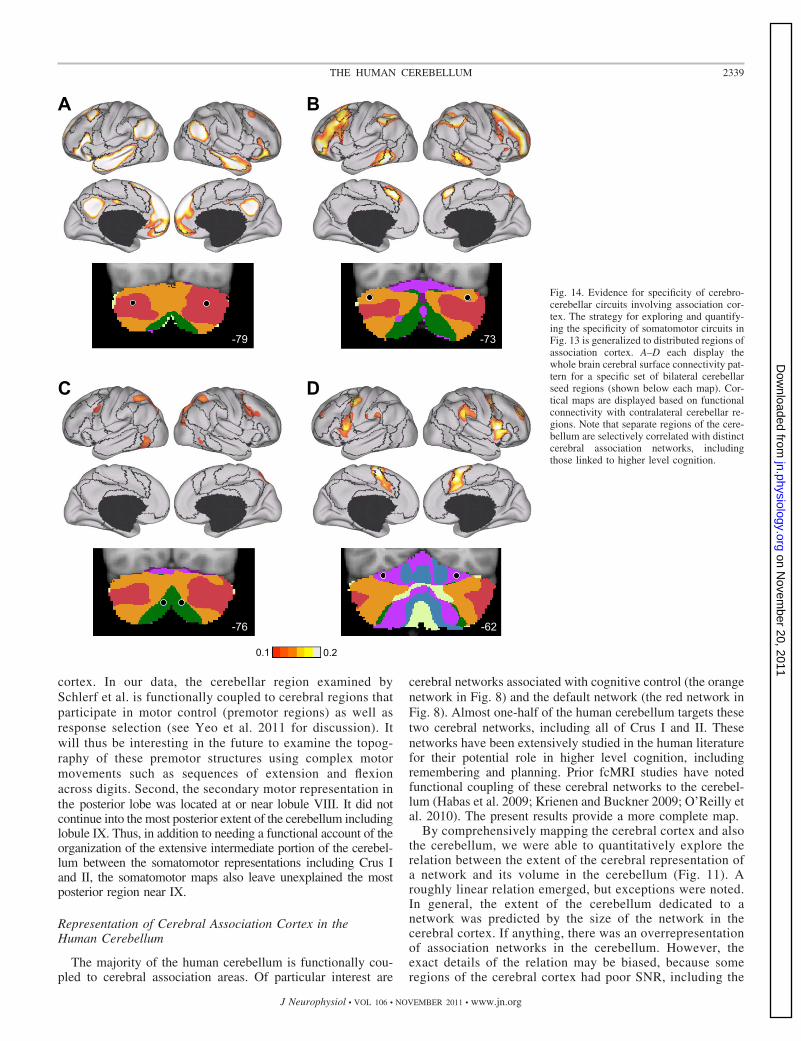
cortex. In our data, the cerebellar region examined bySchlerf et al. is functionally coupled to cerebral regions thatparticipate in motor control (premotor regions) as well asresponse selection (see Yeo et al. 2011 for discussion). Itwill thus be interesting in the future to examine the topog-raphy of these premotor structures using complex motormovements such as sequences of extension and flexionacross digits. Second, the secondary motor representation inthe posterior lobe was located at or near lobule VIII. It did notcontinue into the most posterior extent of the cerebellum includinglobule IX. Thus, in addition to needing a functional account of theorganization of the extensive intermediate portion of the cerebel-lum between the somatomotor representations including Crus Iand II, the somatomotor maps also leave unexplained the mostposterior region near IX.
Representation of Cerebral Association Cortex in theHuman Cerebellum
The majority of the human cerebellum is functionally cou-pled to cerebral association areas. Of particular interest are
cerebral networks associated with cognitive control (the orangenetwork in Fig. 8) and the default network (the red network inFig. 8). Almost one-half of the human cerebellum targets thesetwo cerebral networks, including all of Crus I and II. Thesenetworks have been extensively studied in the human literaturefor their potential role in higher level cognition, includingremembering and planning. Prior fcMRI studies have notedfunctional coupling of these cerebral networks to the cerebel-lum (Habas et al. 2009; Krienen and Buckner 2009; O’Reilly etal. 2010). The present results provide a more complete map.
By comprehensively mapping the cerebral cortex and alsothe cerebellum, we were able to quantitatively explore therelation between the extent of the cerebral representation ofa network and its volume in the cerebellum (Fig. 11). Aroughly linear relation emerged, but exceptions were noted.In general, the extent of the cerebellum dedicated to anetwork was predicted by the size of the network in thecerebral cortex. If anything, there was an overrepresentationof association networks in the cerebellum. However, theexact details of the relation may be biased, because someregions of the cerebral cortex had poor SNR, including the
Fig. 14. Evidence for specificity of cerebro-cerebellar circuits involving association cor-tex. The strategy for exploring and quantify-ing the specificity of somatomotor circuits inFig. 13 is generalized to distributed regions ofassociation cortex. A–D each display thewhole brain cerebral surface connectivity pat-tern for a specific set of bilateral cerebellarseed regions (shown below each map). Cor-tical maps are displayed based on functionalconnectivity with contralateral cerebellar re-gions. Note that separate regions of the cere-bellum are selectively correlated with distinctcerebral association networks, includingthose linked to higher level cognition.
2339THE HUMAN CEREBELLUM
J Neurophysiol • VOL 106 • NOVEMBER 2011 • www.jn.org
on Novem
ber 20, 2011jn.physiology.org
Dow
nloaded from
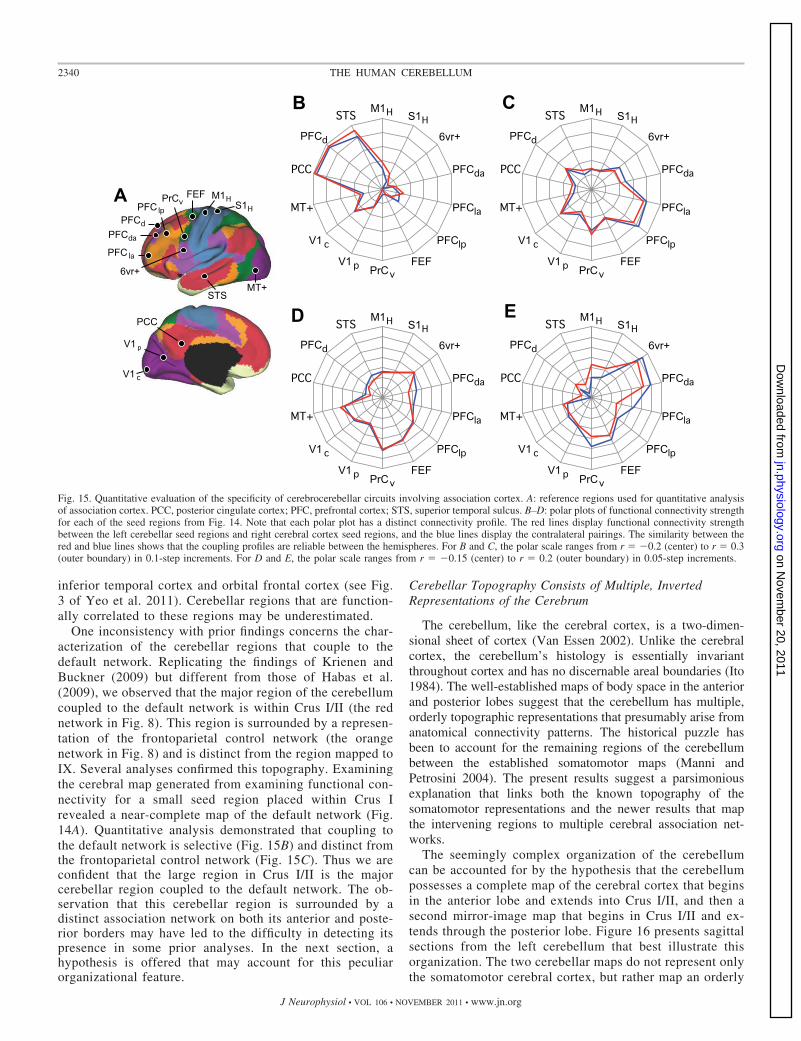
inferior temporal cortex and orbital frontal cortex (see Fig.3 of Yeo et al. 2011). Cerebellar regions that are function-ally correlated to these regions may be underestimated.
One inconsistency with prior findings concerns the char-acterization of the cerebellar regions that couple to thedefault network. Replicating the findings of Krienen andBuckner (2009) but different from those of Habas et al.(2009), we observed that the major region of the cerebellumcoupled to the default network is within Crus I/II (the rednetwork in Fig. 8). This region is surrounded by a represen-tation of the frontoparietal control network (the orangenetwork in Fig. 8) and is distinct from the region mapped toIX. Several analyses confirmed this topography. Examiningthe cerebral map generated from examining functional con-nectivity for a small seed region placed within Crus Irevealed a near-complete map of the default network (Fig.14A). Quantitative analysis demonstrated that coupling tothe default network is selective (Fig. 15B) and distinct fromthe frontoparietal control network (Fig. 15C). Thus we areconfident that the large region in Crus I/II is the majorcerebellar region coupled to the default network. The ob-servation that this cerebellar region is surrounded by adistinct association network on both its anterior and poste-rior borders may have led to the difficulty in detecting itspresence in some prior analyses. In the next section, ahypothesis is offered that may account for this peculiarorganizational feature.
Cerebellar Topography Consists of Multiple, InvertedRepresentations of the Cerebrum
The cerebellum, like the cerebral cortex, is a two-dimen-sional sheet of cortex (Van Essen 2002). Unlike the cerebralcortex, the cerebellum’s histology is essentially invariantthroughout cortex and has no discernable areal boundaries (Ito1984). The well-established maps of body space in the anteriorand posterior lobes suggest that the cerebellum has multiple,orderly topographic representations that presumably arise fromanatomical connectivity patterns. The historical puzzle hasbeen to account for the remaining regions of the cerebellumbetween the established somatomotor maps (Manni andPetrosini 2004). The present results suggest a parsimoniousexplanation that links both the known topography of thesomatomotor representations and the newer results that mapthe intervening regions to multiple cerebral association net-works.
The seemingly complex organization of the cerebellumcan be accounted for by the hypothesis that the cerebellumpossesses a complete map of the cerebral cortex that beginsin the anterior lobe and extends into Crus I/II, and then asecond mirror-image map that begins in Crus I/II and ex-tends through the posterior lobe. Figure 16 presents sagittalsections from the left cerebellum that best illustrate thisorganization. The two cerebellar maps do not represent onlythe somatomotor cerebral cortex, but rather map an orderly
Fig. 15. Quantitative evaluation of the specificity of cerebrocerebellar circuits involving association cortex. A: reference regions used for quantitative analysisof association cortex. PCC, posterior cingulate cortex; PFC, prefrontal cortex; STS, superior temporal sulcus. B–D: polar plots of functional connectivity strengthfor each of the seed regions from Fig. 14. Note that each polar plot has a distinct connectivity profile. The red lines display functional connectivity strengthbetween the left cerebellar seed regions and right cerebral cortex seed regions, and the blue lines display the contralateral pairings. The similarity between thered and blue lines shows that the coupling profiles are reliable between the hemispheres. For B and C, the polar scale ranges from r � �0.2 (center) to r � 0.3(outer boundary) in 0.1-step increments. For D and E, the polar scale ranges from r � �0.15 (center) to r � 0.2 (outer boundary) in 0.05-step increments.
2340 THE HUMAN CEREBELLUM
J Neurophysiol • VOL 106 • NOVEMBER 2011 • www.jn.org
on Novem
ber 20, 2011jn.physiology.org
Dow
nloaded from

progression from somatomotor cortex to premotor cortex toassociation cortex. On the basis of quantitative analysispresented in Fig. 11, we can further hypothesize that thetopographic mapping between the cerebrum and cerebellumis roughly homotopic, with the few exceptions discussedearlier and also the meager representation of the greennetwork in the anterior lobe. Within this hypothesis, theestablished somatomotor maps are the end points of a muchlarger representation of the entire cerebral cortex.
There is also tentative evidence for a third map, as illustratedin Fig. 16. The tertiary map is mirrored relative to the adjacentsecondary map, meaning its topography is inverted like that ofthe primary map beginning in the anterior lobe. We are not asconfident about this tertiary map, because clear evidence for atertiary somatomotor representation could not be detected(noted by the question mark in Fig. 16). However, the possi-bility of a tertiary representation may help to explain the robustrepresentation of association cortex near lobule IX (e.g., Fig. 8,x � �8), in particular, association cortex coupled to the defaultnetwork (Habas et al. 2009; Krienen and Buckner 2009). Thelarge association region of the cerebellum near Crus I and IImay represent the intersection of the primary and secondarymaps; the cerebellar region near lobule IX may represent theassociation portion of the tertiary map. The hypothesizedtertiary map may also explain a critical detail of prior anatom-ical work. In addition to extensive labeling of Crus II, Kellyand Strick (2003) also noted a small group of labeled neuronsin IX/X in the monkey following anterograde transneuronaltracing of efferents from prefrontal area 46. This distinct regionof labeled neurons is predicted by the hypothesis that thecerebellum possesses three topographic maps of the cerebralcortex. The neurons labeled in IX/X fall within the tertiarymap.
Caveats and Limitations
In considering the possibility that the cerebellum hasmultiple, complete maps of the cerebral cortex, we mustdiscuss several caveats and limitations. In particular, func-tional connectivity measures do not only reflect direct anat-omy (Fox and Raichle 2007; Moeller et al. 2009; Buckner etal. 2010; Cole et al. 2010). Functional connectivity is basedon correlated functional signals and thus cannot disambig-uate whether a correlation reflects a direct coupling or anindirect effect of coupling among polysynaptically con-nected regions. This creates a specific ambiguity when pro-posing that the cerebellum has multiple maps of the cerebralcortex. A plausible alternative explanation is that one of thecerebellar maps represents coupling with frontal cortex andthe other with parietal cortex, or some other combination ofdistributed cerebral areas. This ambiguity arises becauseeach cerebral network has strongly coupled regions in bothfrontal and parietal cortices, including the somatomotornetworks that span precentral (motor) and postcentral (so-matosensory) gyrus. The functional connectivity data thusdo not disambiguate whether the separate cerebellar mapsarise from distinct cerebral areas or whether each map isinterconnected with a distributed cerebral network. Furtheradding to this uncertainty, functional connectivity measures
Fig. 16. The cerebellum possesses multiple representations of the cerebralcortex. The topographic orderings of the cerebral networks are illustrated for2 sagittal sections of the left cerebellum (x � �24 and x � �12). Theparcellation is derived from the full data sample (n � 1,000). Letters aredisplayed to aid visualization of the representation ordering. F, foot; H, hand;T, tongue; P, purple network; G, green network; O, orange network; R, rednetwork. The colored networks refer to the 7-network parcellation (Fig. 8), andthe somatomotor topography refers to the ordering as estimated in Fig. 5. G*refers to the minimal green network in the x � �24 section, which is betterillustrated in Fig. 8 (x ��8). G� is highlighted because it does not follow theexpected topographic pattern but rather may be an erroneous mapping, becauseit is located on the border between the cerebellum and cerebral cortex withina region of uncertain mapping (see Fig. 10). The white lines demarcateestimated boundaries between the maps and do not have significance inrelation to sulcal boundaries. Three distinct representations are observed,labeled the primary, secondary, and tertiary representations. Each is a mirror-image ordering of the adjacent map. The question mark in the tertiaryrepresentation indicates the uncertain beginning point, if it does exist, of a thirdsomatomotor representation. R* refers to the red network, which can be seenin the x � �12 section but not the x � �24 section. What appears initially asa complex pattern may be parsimoniously explained by the hypothesis that themajor portion of the cerebellum contains a double, inverted representation ofthe entire cerebral cortex and then a potential tertiary representation in its mostposterior extent. The classic observation of primary and secondary somatomo-tor representation in the anterior and posterior lobes may be the beginning andend points of much larger maps.
2341THE HUMAN CEREBELLUM
J Neurophysiol • VOL 106 • NOVEMBER 2011 • www.jn.org
on Novem
ber 20, 2011jn.physiology.org
Dow
nloaded from
also presently cannot disambiguate efferents from affer-ents.2
The transneuronal tracing data provide some insight. Injec-tions of anterograde viral tracers in monkey M1 label distinctregions in the anterior and posterior lobes, suggesting that theindividual frontal areas possess efferents to both the primaryand secondary somatomotor representations within the cere-bellum (see Fig. 8 of Kelly and Strick 2003). Similarly, area 46efferents demonstrate dense labeling in Crus II and also adistinct second region in lobule IX/X. The presence of multiplecerebellar targets for each cerebral area is consistent with thepossibility that multiple cerebellar maps form circuits with thesame cerebral areas.
It will be important to assess in the future whether distrib-uted cerebral areas converge on the same cerebellar regions.For example, parietal association cortex near 7a/opt is expectedto project to the same cerebellar region as the prefrontal areaslinked to the default network. Convergence of this form is seenfor the thalamus. Double-labeling techniques reveal that mul-tiple distributed cortical association areas—that are intercon-nected with each other—also receive convergent projectionsfrom the medial pulvinar (Goldman-Rakic 1988). We suspectthat the cerebellum will possess a similar form of orderlytopography.
The question of whether distributed cerebral areas within thesame network converge on the same cerebellar regions isparticularly critical, because the functional connectivity resultsdo not directly tell us that prefrontal areas project to thecerebellum. The present results demonstrate that correlatednetworks of prefrontal and parietal association regions arecoupled to the cerebellum. It seems unlikely, but remains apossibility, that the coupling is entirely driven by the parietal orother nonfrontal association areas. That is, the strong prefrontalcoupling may be fully mediated through indirect correlationswith posterior cerebral areas. The transneuronal tracing find-ings of Strick and colleagues (Middleton and Strick 1994,2001; Kelly and Strick 2003) and the anterograde tracingstudies of Schmahmann and Pandya (1997b), discussed earlier,suggest the presence of anatomical connections with prefrontalcortex. Nonetheless, anatomical studies of the distributed ce-rebral networks are required to determine which associationareas directly form circuits with the cerebellum and whichcomponents of cerebral networks only interact indirectly withthe cerebellum. Certain prefrontal regions that have shownlower densities of cerebellar projections (e.g., ventral area 46;Glickstein et al. 1985) may show functional coupling in ouranalyses via polysynaptic corticocortical connections.
A further open issue arises because we detected minimalevidence for medial to lateral organization within the cerebel-
lum, as might be expected given the extensive evidence forlongitudinal zones (see Ito 1984 for review). In this regard, itis important to note that the present work is cortical centric.The cerebellar cortex, particularly the intermediate zone, is thetarget of substantial ascending pathways that originate in thespinal cord. Our analyses did not explore these pathways, andimportant features of cerebellar organization may have beenmissed. The topographic maps estimated at present may also beof low resolution relative to other features of cerebellar orga-nization such as those suggested by the observation of frac-tured somatotopy (Shambes et al. 1978; Manni and Petrosini2004) and examination of topography in relation to the deepcerebellar nuclei. Similarly, assuming that some level of inter-digitation of cerebral projection regions exists in the cerebel-lum, as in the striatum (Eblen and Graybiel 1995; Selemon andGoldman-Rakic 1985), our methods will obscure these detailsof the topography and assign the cerebellar regions to theirmost dominant principal cerebral targets. The specificity of theresults in Figs. 13 and 15 suggests that the topography isunlikely to contain large amounts of overlap between distinctprincipal target regions. However, the low resolution of thetechnique may miss important features of cerebellar topogra-phy and the results should be interpreted accordingly.
Conclusions
Our results reveal that regions of the cerebellum are func-tionally coupled to specific cerebral networks. The resultsfurther suggest that a relatively simple principle might explainthe global topographic organization of the cerebellum. Thecomplete cerebral cortex (including somatomotor, premotor,and association cortices) may project to a homotopic map inthe cerebellum that begins in the anterior lobe somatomotorrepresentation and ends near Crus I/II. A mirror-image second-ary map may then begin in Crus I/II and end with the secondsomatomotor representation near HVIII. Provisional evidenceis also provided for a tertiary map at the farthest extent of theposterior lobe.
ACKNOWLEDGMENTS
We thank Jeremy Schmahmann for discussion, the Harvard Center forBrain Science Neuroimaging Core and the Athinoula A. Martinos Center forimaging support, the Harvard FAS Research Computing Group (in particularJames Cuff, Jerry Lotto, and Jeff Chang), and the Neuroinformatics ResearchGroup (Gabriele Fariello, Timothy O’Keefe, and Victor Petrov). We thankHaderer & Müller Biomedical Art for assistance with Fig. 5. F. M. Krienenwas supported by fellowships from the Department of Defense, an AshfordGraduate Fellowship in the Sciences, and the Sackler Scholars Program inPsychobiology. A. Castellanos and J. C. Diaz were supported by the HowardHughes Medical Institute Exceptional Research Opportunities Program.
GRANTS
This work was supported by National Institutes of Health GrantsAG021910, P41 RR14074, and K08 MH067966, the Massachusetts GeneralHospital-University of California, Los Angeles Human Connectome Project(U54MH091665), the Howard Hughes Medical Institute, and the SimonsFoundation.
DISCLAIMER
The content is solely the responsibility of the authors and does notnecessarily represent the official views of the National Institutes of Health(NIH).
2 As far as we have been able to surmise to date, the intrinsic functionalcorrelations between the cerebellum and cerebral cortex are symmetrical. Wehave been unable to distinguish the cortico-pontocerebellar pathway from thecerebello-thalamocortical pathway. Focal pontine lesions disrupt fcMRI cou-pling between the cerebrum and cerebellum (Lu et al. in press). However,preliminary evidence also suggests that thalamic lesions do, as well (Lu J, LiuH, Buckner RL, and Li K, unpublished observations). Intrinsic fluctuations inthe cerebellum may be coupled to intrinsic fluctuations in the cerebral cortexvia an emergent property of the closed-loop circuit that involves both excit-atory and inhibitory influences between the structures. Within this possibility,the correlated activity fluctuations between the structures should not beinterpreted to differentially reflect the efferent or afferent projections, butrather the fluctuating activity of the full circuit.
2342 THE HUMAN CEREBELLUM
J Neurophysiol • VOL 106 • NOVEMBER 2011 • www.jn.org
on Novem
ber 20, 2011jn.physiology.org
Dow
nloaded from
DISCLOSURES
No conflicts of interest, financial or otherwise, are declared by the author(s).
REFERENCES
Adrian ED. Afferent areas in the cerebellum connected with the limbs. Brain66: 289–315, 1943.
Allen G, McColl R, Barnard H, Ringe WK, Fleckenstein J, Cullum CM.Magnetic resonance imaging of the cerebellar-prefrontal and cerebellar-parietal functional connectivity. Neuroimage 28: 39–48, 2005.
Amunts K, Malikovic A, Mohlberg H, Schormann T, Zilles K. Brodmann’sareas 17 and 18 brought into stereotaxic space—where and how variable?Neuroimage 11: 66–84, 2000.
Andrews-Hanna JR, Reidler JS, Sepulcre J, Poulin R, Buckner RL.Functional-anatomic fractionation of the brain’s default network. Neuron65: 550–562, 2010.
Balsters JH, Cussans E, Diedrichsen J, Phillips KA, Preuss TM, RillingJK, Ramnani N. Evolution of the cerebellar cortex: the selective expansionof prefrontal-projecting cerebellar lobules. Neuroimage 49: 2045–2052,2010.
Ben-Yehudah G, Guediche S, Fiez JA. Cerebellar contributions to verbalworking memory: beyond cognitive theory. Cerebellum 6: 193–201, 2007.
Birn RM, Diamond JB, Smith MA, Bandettini PA. Separating respiratory-variation-related fluctuations from neuronal-activity-related fluctuations infMRI. Neuroimage 31: 1536–1548, 2006.
Biswal B, Yetkin FZ, Haughton VM, Hyde JS. Functional connectivity inthe motor cortex of resting human brain using echo-planar MRI. MagnReson Med 34: 537–541, 1995.
Biswal BB, Mennes M, Zuo XN, Gohel S, Kelly C, Smith SM, BeckmannCF, Adelstein JS, Buckner RL, Colcombe S, Dogonowski AM, Ernst M,Fair D, Hampson M, Hoptman MJ, Hyde JS, Kiviniemi VJ, Kotter R,Li SJ, Lin CP, Lowe MJ, Mackay C, Madden DJ, Madsen KH,Margulies DS, Mayberg HS, McMahon K, Monk CS, MostofskySH, Nagel BJ, Pekar JJ, Peltier SJ, Petersen SE, Riedl V, RomboutsSARB, Rypma B, Schlaggar BL, Schmidt S, Seidler RD, Siegle GJ, SorgC, Teng GJ, Veijola J, Villringer A, Walter M, Wang L, Weng XC,Whitfield-Gabrieli S, Williamson P, Windischberger C, Zang YF,Zhang HY, Castellanos FX, Milham MP. Toward discovery science ofhuman brain function. Proc Natl Acad Sci USA 107: 4734–4739, 2010.
Brodal P. The corticopontine projection in rhesus-monkey: origin and princi-ples of organization. Brain 101: 251–283, 1978.
Buckner RL. Human functional connectivity: new tools, unresolved ques-tions. Proc Natl Acad Sci USA 107: 10769–10770, 2010.
Buckner RL, Andrews-Hanna JR, Schacter DL. The brain’s default net-work: anatomy, function, and relevance to disease. Ann NY Acad Sci 1124:1–38, 2008.
Cole DM, Smith SM, Beckmann CF. Advances and pitfalls in the analysisand interpretation of resting-state FMRI data. Front Syst Neurosci 4: 8,2010.
Cowey A. Projection of retina on to striate and prestriate cortex in squirrelmonkey, Saimiri sciureus. J Neurophysiol 27: 366–393, 1964.
Dale AM, Fischl B, Sereno MI. Cortical surface-based analysis. I. Segmen-tation and surface reconstruction. Neuroimage 9: 179–194, 1999.
Desmond JE, Fiez JA. Neuroimaging studies of the cerebellum: language,learning and memory. Trends Cogn Sci 2: 355–362, 1998.
Di Martino A, Scheres A, Margulies DS, Kelly AMC, Uddin LQ, ShehzadZ, Biswal B, Walters JR, Castellanos FX, Milham MP. Functionalconnectivity of human striatum: a resting state fMRI study. Cereb Cortex18: 2735–2747, 2008.
Dickson J, Drury H, Van Essen DC. ‘The surface management system’(SuMS) database: a surface-based database to aid cortical surface recon-struction, visualization and analysis. Philos Trans R Soc Lond B Biol Sci356: 1277–1292, 2001.
Diedrichsen J, Balsters JH, Flavell J, Cussans E, Ramnani N. A probabi-listic MR atlas of the human cerebellum. Neuroimage 46: 39–46, 2009.
Dosenbach NUF, Fair DA, Miezin FM, Cohen AL, Wenger KK, Dosen-bach RAT, Fox MD, Snyder AZ, Vincent JL, Raichle ME, SchlaggarBL, Petersen SE. Distinct brain networks for adaptive and stable taskcontrol in humans. Proc Natl Acad Sci USA 104: 11073–11078, 2007.
Durisko C, Fiez JA. Functional activation in the cerebellum during workingmemory and simple speech tasks. Cortex 46: 896–906, 2010.
Eblen F, Graybiel AM. Highly restricted origin of prefrontal cortical inputs tostriosomes in the macaque monkey. J Neurosci 15: 5999–6013, 1995.
Evans AC, Collins DL, Mills SR, Brown ED, Kelly RL, Peters TM. 3Dstatistical neuroanatomical models from 305 MRI volumes. ProceedingsIEEE Nuclear Science Symposium and Medical Imaging Conference. Lon-don: MTP, 1993, vol. 95, p. 1813–1817.
Evarts EV, Thach WT. Motor mechanisms of the CNS: cerebrocerebellarinterrelations. Annu Rev Physiol 31: 451–498, 1969.
Fischl B, Liu A, Dale AM. Automated manifold surgery: constructing geo-metrically accurate and topologically correct models of the human cerebralcortex. IEEE Trans Med Imaging 20: 70–80, 2001.
Fischl B, Rajendran N, Busa E, Augustinack J, Hinds O, Yeo BTT,Mohlberg H, Amunts K, Zilles K. Cortical folding patterns and predictingcytoarchitecture. Cereb Cortex 18: 1973–1980, 2008.
Fischl B, Salat DH, Busa E, Albert M, Dieterich M, Haselgrove C, van derKouwe A, Killiany R, Kennedy D, Klaveness S, Montillo A, Makris N,Rosen B, Dale AM. Whole brain segmentation: automated labeling ofneuroanatomical structures in the human brain. Neuron 33: 341–355, 2002.
Fischl B, Salat DH, van der Kouwe AJW, Makris N, Ségonne F, QuinnBT, Dale AM. Sequence-independent segmentation of magnetic resonanceimages. Neuroimage 23: S69–S84, 2004.
Fischl B, Sereno MI, Dale AM. Cortical surface-based analysis. II: Inflation,flattening, and a surface-based coordinate system. Neuroimage 9: 195–207,1999a.
Fischl B, Sereno MI, Tootell RBH, Dale AM. High-resolution intersubjectaveraging and a coordinate system for the cortical surface. Hum Brain Mapp8: 272–284, 1999b.
Fonov V, Evans AC, Botteron K, Almli CR, McKinstry RC, Collins DL,Brain Development Cooperative Group. Unbiased average age-appropri-ate atlases for pediatric studies. Neuroimage 54: 313–327, 2011.
Fox MD, Raichle ME. Spontaneous fluctuations in brain activity observedwith functional magnetic resonance imaging. Nat Rev Neurosci 8: 700–711,2007.
Fox MD, Zhang DY, Snyder AZ, Raichle ME. The global signal andobserved anticorrelated resting state brain networks. J Neurophysiol 101:3270–3283, 2009.
Friston KJ, Ashburner J, Frith CD, Poline JB, Heather JD, FrackowiakRSJ. Spatial registration and normalization of images. Hum Brain Mapp 3:165–189, 1995.
Geyer S, Ledberg A, Schleicher A, Kinomura S, Schormann T, Bürgel U,Klingberg T, Larsson J, Zilles K, Roland PE. Two different areas withinthe primary motor cortex of man. Nature 382: 805–807, 1996.
Glickstein M, May JG, Mercier BE. Corticopontine projection in the ma-caque: the distribution of labeled cortical cells after large injections ofhorseradish-peroxidase in the pontine nuclei. J Comp Neurol 235: 343–359,1985.
Glickstein M. What does the cerebellum really do? Curr Biol 17: R824–R827,2007.
Goldman-Rakic PS. Topography of cognition: parallel distributed networksin primate association cortex. Annu Rev Neurosci 11: 137–156, 1988.
Grefkes C, Geyer S, Schormann T, Roland P, Zilles K. Human somatosen-sory area 2: observer-independent cytoarchitectonic mapping, interindi-vidual variability and population map. Neuroimage 14: 617–631, 2001.
Greve DN, Fischl B. Accurate and robust brain image alignment usingboundary-based registration. Neuroimage 48: 63–72, 2009.
Grodd W, Hulsmann E, Lotze M, Wildgruber D, Erb M. Sensorimotormapping of the human cerebellum: fMRI evidence of somatotopic organi-zation. Hum Brain Mapp 13: 55–73, 2001.
Habas C, Kamdar N, Nguyen D, Prater K, Beckmann CF, Menon V,Greicius MD. Distinct cerebellar contributions to intrinsic connectivitynetworks. J Neurosci 29: 8586–8594, 2009.
Hill J, Inder T, Neil J, Dierker D, Harwell J, Van Essen D. Similar patternsof cortical expansion during human development and evolution. Proc NatlAcad Sci USA 107: 13135–13140, 2010.
Holmes G. The cerebellum of man. Brain 62: 1–30, 1939.Ito M. The Cerebellum and Neural Control. New York: Raven, 1984.Jenkinson M, Bannister P, Brady M, Smith S. Improved optimization for
the robust and accurate linear registration and motion correction of brainimages. Neuroimage 17: 825–841, 2002.
Kahn I, Andrews-Hanna JR, Vincent JL, Snyder AZ, Buckner RL.Distinct cortical anatomy linked to subregions of the medial temporal loberevealed by intrinsic functional connectivity. J Neurophysiol 100: 129–139,2008.
Kelly RM, Strick PL. Cerebellar loops with motor cortex and prefrontalcortex of a nonhuman primate. J Neurosci 23: 8432–8444, 2003.
2343THE HUMAN CEREBELLUM
J Neurophysiol • VOL 106 • NOVEMBER 2011 • www.jn.org
on Novem
ber 20, 2011jn.physiology.org
Dow
nloaded from

Kemp JM, Powell TPS. The connexions of the striatum and globus pallidus:synthesis and speculation. Philos Trans R Soc Lond B Biol Sci 262:441–457, 1971.
Krienen FM, Buckner RL. Segregated fronto-cerebellar circuits revealed byintrinsic functional connectivity. Cereb Cortex 19: 2485–2497, 2009.
Kwong KK, Belliveau JW, Chesler DA, Goldberg IE, Weisskoff RM,Poncelet BP, Kennedy DN, Hoppel BE, Cohen MS, Turner R, ChengHM, Brady TJ, Rosen BR. Dynamic magnetic resonance imaging ofhuman brain activity during primary sensory stimulation. Proc Natl Acad SciUSA 89: 5675–5679, 1992.
Laird AR, Fox PM, Price CJ, Glahn DC, Uecker AM, Lancaster JL,Turkeltaub PE, Kochunov P, Fox PT. ALE meta-analysis: controlling thefalse discovery rate and performing statistical contrasts. Hum Brain Mapp25: 155–64, 2005.
Larsell O. The Comparative Anatomy and Histology of the Cerebellum FromMonotremes Through Apes. Minneapolis, MN: The University of MinnesotaPress, 1970.
Leiner HC, Leiner AL, Dow RS. Does the cerebellum contribute to mentalskills? Behav Neurosci 100: 443–454, 1986.
Leiner HC. Solving the mystery of the human cerebellum. Neuropsychol Rev20: 229–235, 2010.
Lu J, Liu H, Zhang M, Wang D, Cao Y, Ma Q, Rong D, Wang X, BucknerRL, Li K. Focal pontine lesions provide evidence that resting-state func-tional connectivity reflects polysynaptic anatomical pathways. J Neurosci.In press.
Malikovic A, Amunts K, Schleicher A, Mohlberg H, Eickhoff SB, WilmsM, Palomero-Gallagher N, Armstrong E, Zilles K. Cytoarchitectonicanalysis of the human extrastriate cortex in the region of V5/MT�: aprobabilistic, stereotaxic map of area hOc5. Cereb Cortex 17: 562–574,2007.
Manni E, Petrosini L. A century of cerebellar somatotopy: a debated repre-sentation. Nat Rev Neurosci 5: 241–249, 2004.
Marcus DS, Fotenos AF, Csernansky JG, Morris JC, Buckner RL. Openaccess series of imaging studies: longitudinal MRI data in nondemented anddemented older adults. J Cogn Neurosci 22: 2677–2684, 2010.
Marcus DS, Wang TH, Parker J, Csernansky JG, Morris JC, BucknerRL. Open access series of imaging studies (OASIS): cross-sectional MRIdata in young, middle aged, nondemented, and demented older adults. JCogn Neurosci 19: 1498–1507, 2007.
Margulies DS, Kelly AMC, Uddin LQ, Biswal BB, Castellanos FX, Mil-ham MP. Mapping the functional connectivity of anterior cingulate cortex.Neuroimage 37: 579–588, 2007.
Marvel CL, Desmond JE. The contributions of cerebro-cerebellar circuitry toexecutive verbal working memory. Cortex 46: 880–895, 2010.
Middleton FA, Strick PL. Anatomical evidence for cerebellar and basalganglia involvement in higher cognitive function. Science 266: 458–461,1994.
Middleton FA, Strick PL. Cerebellar projections to the prefrontal cortex ofthe primate. J Neurosci 21: 700–712, 2001.
Moeller S, Nallasamy N, Tsao DY, Freiwald WA. Functional connectivity ofthe macaque brain across stimulus and arousal states. J Neurosci 29:5897–5909, 2009.
Murphy K, Birn RM, Handwerker DA, Jones TB, Bandettini PA. Theimpact of global signal regression on resting state correlations: are anti-correlated networks introduced? Neuroimage 44: 893–905, 2009.
Ogawa S, Tank DW, Menon R, Ellermann JM, Kim SG, Merkle H,Ugurbil K. Instrinsic signal changes accompanying sensory stimulation:functional brain mapping with magnetic resonance imaging. Proc Natl AcadSci USA 89: 5951–5955, 1992.
O’Reilly JX, Beckmann CF, Tomassini V, Ramnani N, Johansen-Berg H.Distinct and overlapping functional zones in the cerebellum defined byresting state functional connectivity. Cereb Cortex 20: 953–965, 2010.
O’Reilly JX, Mesulam MM, Nobre AC. The cerebellum predicts the timingof perceptual events. J Neurosci 28: 2252–2260, 2008.
Pandya DN, Vignolo LA. Intra- and interhemispheric projections of theprecentral, premotor and arcuate areas in the rhesus monkey. Brain Res 26:217–233, 1971.
Petersen SE, Fox PT, Posner MI, Mintun M, Raichle ME. Positronemission tomographic studies of the processing of single words. J CognNeurosci 1: 153–170, 1989.
Preuss TM. What is it like to be human? In: The Cognitive Neurosciences III,edited by Gazzaniga M. Cambridge, MA: MIT Press, 2004, p. 5–22.
Raichle ME, MacLeod AM, Snyder AZ, Powers WJ, Gusnard DA, Shul-man GL. A default mode of brain function. Proc Natl Acad Sci USA 98:676–682, 2001.
Raichle ME. The restless brain. Brain Connect 1: 3–12, 2011.Roy AK, Shehzad Z, Margulies DS, Kelly AMC, Uddin LQ, Gotimer K,
Biswal BB, Castellanos FX, Milham MP. Functional connectivity of thehuman amygdala using resting state fMRI. Neuroimage 45: 614–626, 2009.
Schlerf JE, Verstynen TD, Ivry RB, Spencer RMS. Evidence of a novelsomatotopic map in the human neocerebellum during complex actions. JNeurophysiol 103: 3330–3336, 2010.
Schmahmann JD, Doyon J, McDonald D, Holmes C, Lavoie K, HurwitzAS, Kabani N, Toga A, Evans AC, Petrides M. Three-dimensional MRIatlas of the human cerebellum in proportional stereotaxic space. Neuroimage10: 233–260. 1999.
Schmahmann JD, Doyon J, Toga AW, Petrides M, Evans AC. MRI Atlasof the Human Cerebellum. San Diego, CA: Academic, 2000.
Schmahmann JD, Pandya DN. The cerebrocerebellar system. Int Rev Neu-robiol 41: 31–60, 1997a.
Schmahmann JD, Pandya DN. Anatomic organization of the basilar pontineprojections from prefrontal cortices in rhesus monkey. J Neurosci 17:438–458, 1997b.
Schmahmann JD, Rosene DL, Pandya DN. Motor projections to the basispontis in the rhesus monkey. J Comp Neurol 478: 248–268, 2004a.
Schmahmann JD, Rosene DL, Pandya DN. Ataxia after pontine stroke:insights from pontocerebellar fibers in monkey. Ann Neurol 55: 585–589,2004b.
Schmahmann JD, Weilburg JB, Sherman JC. The neuropsychiatry of thecerebellum—insights from the clinic. Cerebellum 6: 254–267, 2007.
Seeley WW, Menon V, Schatzberg AF, Keller J, Glover GH, Kenna H,Reiss AL, Greicius MD. Dissociable intrinsic connectivity networks forsalience processing and executive control. J Neurosci 27: 2349–2356, 2007.
Ségonne F, Dale AM, Busa E, Glessner M, Salat D, Hahn HK, Fischl B. Ahybrid approach to the skull stripping problem in MRI. Neuroimage 22:1060–1075, 2004.
Ségonne F, Pacheco J, Fischl B. Geometrically accurate topology-correctionof cortical surfaces using nonseparating loops. IEEE Trans Med Imaging 26:518–529, 2007.
Selemon LD, Goldman-Rakic PS. Longitudinal topography and interdigita-tion of corticostriatal projections in the rhesus monkey. J Neurosci 5:776–794, 1985.
Shambes GM, Gibson JM, Welker W. Fractured somatotopy in granule celltactile areas of rat cerebellar hemispheres revealed by micromapping. BrainBehav Evol 15: 94–140, 1978.
Smith SM, Jenkinson M, Woolrich MW, Beckmann CF, Behrens TEJ,Johansen-Berg H, Bannister PR, De Luca M, Drobnjak I, Flitney DE,Niazy RK, Saunders J, Vickers J, Zhang Y, De Stefano N, Brady JM,Matthews PM. Advances in functional and structural MR image analysisand implementation as FSL. Neuroimage 23: S208–S219, 2004.
Snider RS, Eldred E. Cerebro-cerebellar relationships in the monkey. JNeurophysiol 15: 27–40, 1952.
Snider RS, Stowell A. Receiving areas of the tactile, auditory and visualsystems in the cerebellum. J Neurophysiol 7: 331–357, 1944.
Spencer RMC, Verstynen T, Brett M, Ivry R. Cerebellar activation duringdiscrete and not continuous timed movements: an fMRI study. Neuroimage36: 378–387, 2007.
Stoodley CJ, Schmahmann JD. Functional topography in the human cere-bellum: a meta-analysis of neuroimaging studies. Neuroimage 44: 489–501,2009.
Strick PL, Dum RP, Fiez JA. Cerebellum and nonmotor function. Annu RevNeurosci 32: 413–434, 2009.
Strick PL. How do the basal ganglia and cerebellum gain access to the corticalmotor areas? Behav Brain Res 18: 107–123, 1985.
Timmann D, Daum I. Cerebellar contributions to cognitive functions: aprogress report after two decades of research. Cerebellum 6: 159 –162,2007.
van der Kouwe AJW, Benner T, Fischl B, Schmitt F, Salat DH, Harder M,Sorensen AG, Dale AM. On-line automatic slice positioning for brain MRimaging. Neuroimage 27: 222–230, 2005.
van der Kouwe AJW, Benner T, Salat DH, Fischl B. Brain morphometrywith multiecho MPRAGE. Neuroimage 40: 559–569, 2008.
Van Dijk KRA, Hedden T, Venkataraman A, Evans KC, Lazar SW,Buckner RL. Intrinsic functional connectivity as a tool for human connec-tomics: theory, properties, and optimization. J Neurophysiol 103: 297–321,2010.
2344 THE HUMAN CEREBELLUM
J Neurophysiol • VOL 106 • NOVEMBER 2011 • www.jn.org
on Novem
ber 20, 2011jn.physiology.org
Dow
nloaded from

Van Essen DC. A population-average, landmark-and surface-based (PALS)atlas of human cerebral cortex. Neuroimage 28: 635–662, 2005.
Van Essen DC. Surface-based atlases of cerebellar cortex in the human,macaque and mouse. Ann NY Acad Sci 978: 468–479, 2002.
Van Essen DC, Dierker DL. Surface-based and probabilistic atlases ofprimate cerebral cortex. Neuron 56: 209–225, 2007.
Van Essen DC, Newsome WT, Bixby JL. The pattern of interhemisphericconnections and its relationship to extrastriate visual areas in the macaquemonkey. J Neurosci 2: 265–283, 1982.
Vincent JL, Snyder AZ, Fox MD, Shannon BJ, Andrews JR, Raichle ME,Buckner RL. Coherent spontaneous activity identifies a hippocampal-parietal memory network. J Neurophysiol 96: 3517–3531, 2006.
Wandell BA, Dumoulin SO, Brewer AA. Visual field maps in human cortex.Neuron 56: 366–383, 2007.
Wiestler T, McGonigle DJ, Diedrichsen J. Integration of sensory and motorrepresentations of single fingers in the human cerebellum. J Neurophysiol105: 3042–3053, 2011.
Wilms M, Eickhoff SB, Specht K, Amunts K, Shah NJ, Malikovic A, FinkGR. Human V5/MT�: comparison of functional and cytoarchitectonic data.Anat Embryol 210: 485–495, 2005.
Wise RG, Ide K, Poulin MJ, Tracey I. Resting fluctuations in arterial carbondioxide induce significant low frequency variations in BOLD signal. Neu-roimage 21: 1652–1664, 2004.
Yeo BTT, Krienen FM, Sepulcre J, Sabuncu MR, Lashkari L, HollinsheadM, Roffman JL, Smoller JW, Zöllei L, Polimeni JR, Fischl B, Liu H,Buckner RL. The organization of the human cerebral cortex estimated byintrinsic functional connectivity. J Neurophysiol 106: 1125–1165, 2011.
Yeo BTT, Sabuncu MR, Vercauteren T, Holt DJ, Amunts K, Zilles K,Golland P, Fischl B. Learning task-optimal registration cost functions forlocalizing cytoarchitecture and function in the cerebral cortex. IEEE TransMed Imaging 29: 1424–1441, 2010.
Zhang D, Snyder AZ, Fox MD, Sansbury MW, Shimony JS, Raichle ME.Intrinsic functional relations between human cerebral cortex and thalamus.J Neurophysiol 100: 1740–1748, 2008.
2345THE HUMAN CEREBELLUM
J Neurophysiol • VOL 106 • NOVEMBER 2011 • www.jn.org
on Novem
ber 20, 2011jn.physiology.org
Dow
nloaded from