the public employees’ retirement system of new jersey ... version:...
TRANSCRIPT

The Public Employees’ Retirement System
of New Jersey
Information Required Under Governmental Accounting Standards Board Statement No. 68 as of June 30, 2014

©2014 Xerox Corporation and Buck Consultants, LLC. All rights reserved. Xerox® and Xerox and Design® are trademarks of Xerox Corporation in the United States and/or other countries. Buck Consultants® is a registered trademark of Buck Consultants, LLC in the United States and/or other countries. BRXXXX.
Other company trademarks are also acknowledged.
Document Version: R:\TOBIN\2015\November\NJ11122015AS_PERS GASB 68 report.docx

Aaron Shapiro Principal, Consulting Actuary Buck Consultants, LLC 500 Plaza Drive Secaucus, NJ 07096 [email protected] tel 201.902.2300 fax 201.633.5168
November 20, 2015
Board of Trustees Public Employees’ Retirement System of New Jersey Trenton, New Jersey Members of the Board: This valuation provides information concerning the Public Employees’ Retirement System of New Jersey (PERS) in accordance with the Governmental Accounting Standards Board (GASB) Statement No. 68. This Statement is an amendment of Statements No. 27, Accounting for Pensions by State and Local Government Employers effective for the fiscal year ending June 30, 2015. We certify that the information contained in this Actuarial Report has been prepared in accordance with generally accepted actuarial principles and practices. To the best of our knowledge, the information fairly presents the actuarial position of the PERS in accordance with the requirements of GASB Statement No. 68 as of June 30, 2015. Information necessary to comply with the reporting requirements of GASB Statement No. 67 was provided in a separate Actuarial Report, which is available on the Division of Pensions and Benefits web site. Please refer to that separate Actuarial Report for supplementary information documentation and support for the actuarial analysis and information presented herein. The Board of Trustees and staff of the Division of Pensions and Benefits, its auditors, and PERS employers may use this report for the review of the operation of the Plan. The report may also be used in the preparation of the audited financial statements of the State of New Jersey and PERS employers. Use of this report for any other purpose or by anyone other than the Board of Trustees or the staff of the Division of Pensions and Benefits or employers or its auditors may not be appropriate and may result in mistaken conclusions because of failure to understand applicable assumptions, methods, or inapplicability of the report for that purpose. No one may make any representations or warranties based on any statements or conclusions contained in this report without Buck Consultants’ prior written consent. Future actuarial measurements may differ significantly from current measurements due to Plan experience differing from that anticipated by the economic and demographic assumptions, increases or decreases expected as part of the natural operation of the methodology used for these measurements, and changes in Plan provisions or applicable law. An analysis of the potential range of such future differences is beyond the scope of this valuation. In preparing the actuarial results, we have relied upon information provided by the Division of Pensions and Benefits regarding Plan provisions, Plan participants, Plan assets, contribution rates and other matters used in the actuarial valuation. Although we did not audit the data, we reviewed the data for reasonableness and consistency with the prior year’s information. The accuracy of the results presented herein is dependent on the accuracy of the data.

In my opinion, the actuarial assumptions used are appropriate for purposes of the valuation and are reasonably related to the experience of the Plan and to reasonable long-term expectations. This report was prepared under my supervision. I am a Fellow of the Society of Actuaries and a Member of the American Academy of Actuaries. I meet the Academy’s qualification Standards to issue this Statement of Actuarial Opinion. This report has been prepared in accordance with all applicable Actuarial Standards of Practice. I am available to answer questions and supply any additional information. Buck Consultants, LLC
Aaron Shapiro, FSA, EA, MAAA Principal, Consulting Actuary

Table of Contents
Section I
GASB 68 Information ................................................................................................ 1
Section II
Actuarial Assumptions and Methods ......................................................................... 8
Section III
Summary of Plan Provisions ................................................................................... 11
Appendix
Schedule A – Reconciliation of Local Employer Contributions Used to Determine the Fiscal Year 2013 and Fiscal Year 2014 Proportionate Shares

Page 1
Section I – GASB 68 Information
Plan Description Plan Administration
The State of New Jersey Division of Pensions and Benefits administers the Public Employees’ Retirement System of New Jersey (Plan), a governmental cost sharing multiple-employer defined benefit pension plan. Under the terms of Chapter 71, P.L. 1966, most public employees in New Jersey not required to become members of another contributory retirement program are required to enroll in the Plan.
The general responsibility for the proper operation of the Plan is vested in the Board of Trustees (Board), and the pension committees established pursuant to Chapter 78 P.L. 2011.
The Board of Trustees consists of two trustees appointed by the Governor, the State Treasurer or the Deputy State Treasurer, three trustees elected by the member employees of the State from among the active or retired State members of the retirement system, one trustee elected by the member employees of counties from among the active or retired county members of the retirement system, two trustees elected by the member employees of municipalities from among the active or retired municipal members of the retirement system. The Director of the Division of Pensions and Benefits of the State Department of the Treasury shall appoint a qualified employee of the division who shall be the secretary of the Board.
In accordance with Chapter 78, P.L. 2011, a pension committee is to be established for the State portion of the Plan and the Local employers’ portion of the Plan when the employer’s "target funded ratio" is achieved. The “target funded ratio” is defined as the ratio of the actuarial value of assets over the actuarially determined accrued liabilities expressed as a percentage that will be 75% in State fiscal year 2012, and increased annually by equal increments in each of the subsequent seven fiscal years, until the ratio reaches 80% at which time it is to remain for all subsequent fiscal years. The Local employers’ portion of the Plan attained the required "target funded ratio" in Fiscal Year 2012, thus establishing the committee for the Local employers’ portion of the Plan. The State portion of the Plan has not attained the required “target funded ratio” and thus the pension committee has not been established for the State portion of the Plan.
The pension committees consist of four members who were appointed by the Governor as representatives of public employers whose employees are enrolled in the retirement system, and four members who were appointed by the Public Employee Committee of the AFL-CIO.
Chapter 78, P.L. 2011 grants the authority to amend the benefit terms of the Plan to the pension committees. The pension committees will have the discretionary authority to modify the member contribution rate, formula for calculation of final compensation and the fraction of compensation applied to service credited after the modification, age at which a member may be eligible and the benefits for service and special retirement and benefits provided for disability benefit. The pension committees will have the authority to reactivate the cost of living adjustment and set the duration and extent of the activation. The pension committees must give priority consideration to the reactivation of the cost of living adjustment. No decision of the pension committees shall be implemented if the direct or indirect result of the decision will be that the Plan’s funded ratio falls below the target funded ratio in any valuation period during the 30 years following the implementation of the decision. As required under Chapter 84, P.L. 1954, experience studies are performed once in every three-year period. The valuation was prepared on the basis of the demographic assumptions recommended on the basis of the July 1, 2008 – June 30, 2011 Experience Study and approved by the Board of Trustees at the September 19, 2012 Board meeting. The valuation reflects the economic assumptions recommended by the Treasurer, which
Page 2
include a rate of investment return of 7.90% per annum and assumed future salary increases reduced by 2.00% per annum through fiscal year ending 2021 and 1.00% per annum for fiscal years ending 2022 and thereafter. These assumptions will remain in effect for valuation purposes until such time as the Board or the Treasurer recommends revised economic assumptions. Measurement Date The net pension liability for fiscal year ending June 30, 2015 is determined at a measurement date of June 30, 2014. The total pension liability as of June 30, 2014 was determined by rolling forward the Plan’s total pension liability as of July 1, 2013 to June 30, 2014. The plan fiduciary net position is the market value of plan assets as of June 30, 2014. Data for Valuation In preparing the actuarial valuation as of June 30, 2013, the actuary has relied on data and assets provided by the Division of Pensions and Benefits. While not verifying the data at their source, the actuary has performed tests for consistency and reasonableness.
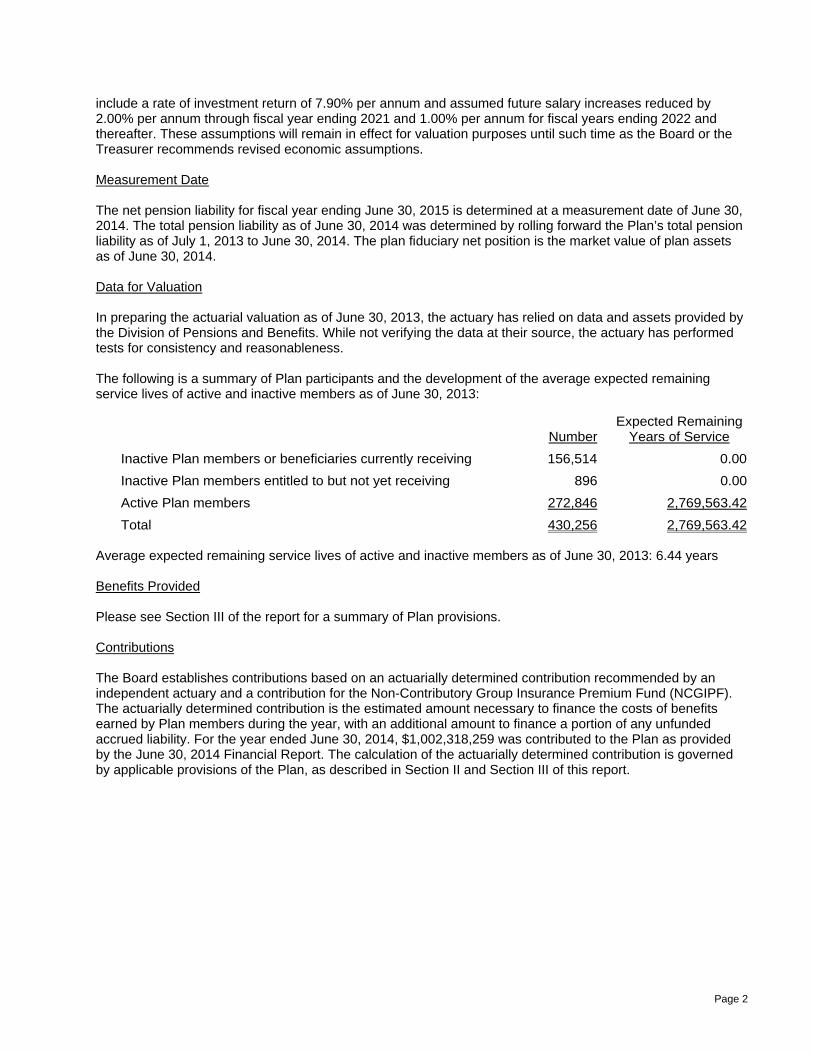
The following is a summary of Plan participants and the development of the average expected remaining service lives of active and inactive members as of June 30, 2013:
Number Expected Remaining
Years of Service
Inactive Plan members or beneficiaries currently receiving 156,514 0.00
Inactive Plan members entitled to but not yet receiving 896 0.00
Active Plan members 272,846 2,769,563.42
Total 430,256 2,769,563.42 Average expected remaining service lives of active and inactive members as of June 30, 2013: 6.44 years Benefits Provided Please see Section III of the report for a summary of Plan provisions. Contributions The Board establishes contributions based on an actuarially determined contribution recommended by an independent actuary and a contribution for the Non-Contributory Group Insurance Premium Fund (NCGIPF). The actuarially determined contribution is the estimated amount necessary to finance the costs of benefits earned by Plan members during the year, with an additional amount to finance a portion of any unfunded accrued liability. For the year ended June 30, 2014, $1,002,318,259 was contributed to the Plan as provided by the June 30, 2014 Financial Report. The calculation of the actuarially determined contribution is governed by applicable provisions of the Plan, as described in Section II and Section III of this report.
Page 3
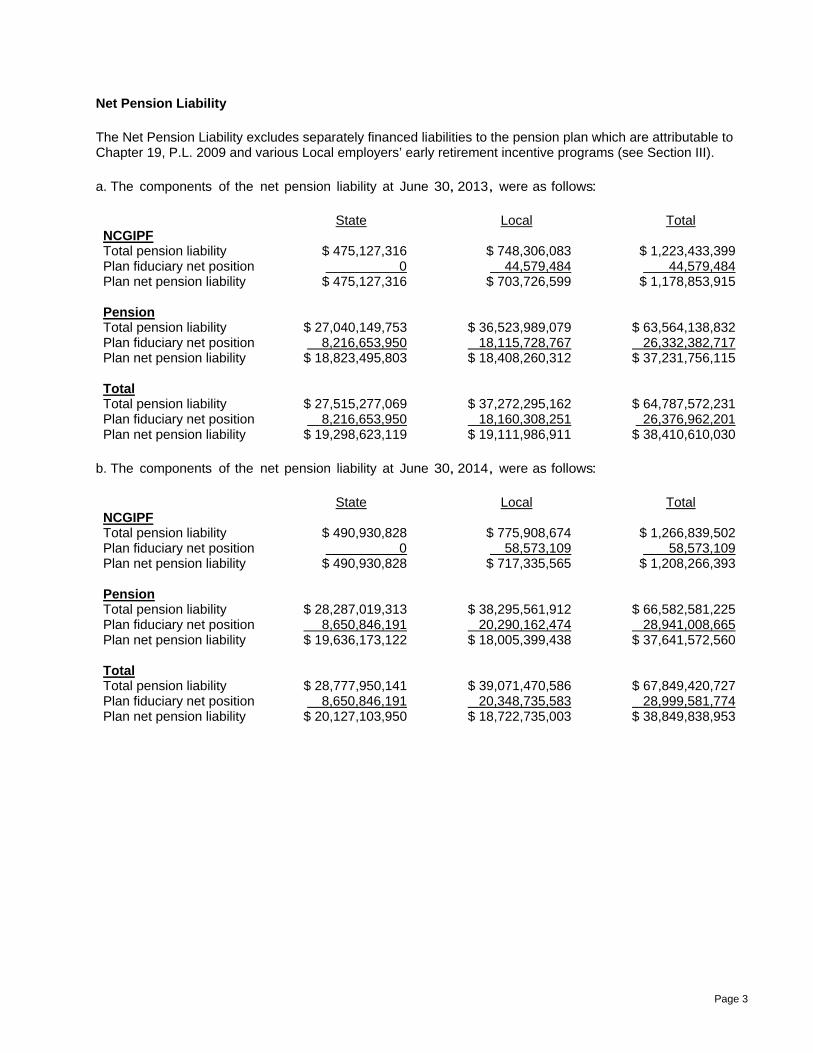
Net Pension Liability
The Net Pension Liability excludes separately financed liabilities to the pension plan which are attributable to Chapter 19, P.L. 2009 and various Local employers’ early retirement incentive programs (see Section III).
a. The components of the net pension liability at June 30, 2013, were as follows:
State Local Total NCGIPF Total pension liability $ 475,127,316 $ 748,306,083 $ 1,223,433,399 Plan fiduciary net position 0 44,579,484 44,579,484 Plan net pension liability $ 475,127,316 $ 703,726,599 $ 1,178,853,915 Pension Total pension liability $ 27,040,149,753 $ 36,523,989,079 $ 63,564,138,832 Plan fiduciary net position 8,216,653,950 18,115,728,767 26,332,382,717 Plan net pension liability $ 18,823,495,803 $ 18,408,260,312 $ 37,231,756,115 Total Total pension liability $ 27,515,277,069 $ 37,272,295,162 $ 64,787,572,231 Plan fiduciary net position 8,216,653,950 18,160,308,251 26,376,962,201 Plan net pension liability $ 19,298,623,119 $ 19,111,986,911 $ 38,410,610,030
b. The components of the net pension liability at June 30, 2014, were as follows:
State Local Total NCGIPF Total pension liability $ 490,930,828 $ 775,908,674 $ 1,266,839,502 Plan fiduciary net position 0 58,573,109 58,573,109 Plan net pension liability $ 490,930,828 $ 717,335,565 $ 1,208,266,393 Pension Total pension liability $ 28,287,019,313 $ 38,295,561,912 $ 66,582,581,225 Plan fiduciary net position 8,650,846,191 20,290,162,474 28,941,008,665 Plan net pension liability $ 19,636,173,122 $ 18,005,399,438 $ 37,641,572,560 Total Total pension liability $ 28,777,950,141 $ 39,071,470,586 $ 67,849,420,727 Plan fiduciary net position 8,650,846,191 20,348,735,583 28,999,581,774 Plan net pension liability $ 20,127,103,950 $ 18,722,735,003 $ 38,849,838,953

Page 4
c. Sensitivity to Discount Rate: The following presents the net pension liability calculated using a discount rate that is 1-percentage-point lower or 1-percentage-point higher than the current rate.
June 30, 2013 1% Decrease (4.55%) Current (5.55%) 1% Increase (6.55%) State $ 22,822,255,839 $ 19,298,623,119 $ 16,351,193,705 Local 23,791,905,551 19,111,986,911 15,190,834,283 Total $ 46,614,161,390 $ 38,410,610,030 $ 31,542,027,988
June 30, 2014 1% Decrease (4.39%) Current (5.39%) 1% Increase (6.39%) State $ 23,772,450,916 $ 20,127,103,950 $ 17,069,920,644 Local 23,553,838,159 18,722,735,003 14,665,837,859 Total $ 47,326,289,075 $ 38,849,838,953 $ 31,735,758,503
Pension Expense as of June 30, 2014 State Local Total
Service cost $ 632,499,148 $ 875,994,297 $ 1,508,493,4451
Interest cost 1,523,365,320 2,066,842,291 3,590,207,6111
Expected return on assets (606,214,099) (1,338,461,356) (1,944,675,455)
Current period effect of benefit changes 0 0 0
Current period difference between expected and actual experience
0
0
0
Current period effect of changes in assumptions 81,594,626 108,224,870 189,819,496 Current period difference between projected and actual investment earnings
(152,714,563)
(278,943,320)
(431,657,883)
Member contributions (318,083,247) (479,734,978) (797,818,225)
Administrative expenses 6,581,063 14,610,604 21,191,667
Current period recognition of prior years’ deferred outflows of resources
0
0
0
Current period recognition of prior years’ deferred inflows of resources
0
0
0
Sub Total $ 1,167,028,248 $ 968,532,408 $ 2,135,560,656 Pension expense related to specific liabilities of individual employers:
Employer contribution - retroactive 0 (5,942,185) (5,942,185)
Employer contribution - additional 0 (6,366) (6,366)
Pension expense subject to allocation $ 1,167,028,248 $ 962,583,857 $ 2,129,612,105
1. The Service Cost and Interest Cost components have been revised from the amounts previously reported for the fiscal year ending June 30, 2014 GASB 67 actuary’s report to reallocate interest accrued on the Service Cost of $83,721,386 to the Interest Cost component
The pension expense for the fiscal year ending June 30, 2014 is based on the June 30, 2013 valuation.
The effect of the change in assumptions and change in employers’ proportion are recognized over the average expected remaining service lives of active and inactive members as of June 30, 2013 (6.44 years).
The difference between projected and actual investment earnings is recognized over 5 years.

Page 5
Deferred Outflows of Resources and Deferred Inflows of Resources Related to Pensions For the year ended June 30, 2014, the System has a collective pension expense of $2,135,560,656 ($1,167,028,248 for State and $968,532,408 for Local employers). At June 30, 2014, there are deferred outflows of resources and deferred inflows of resources related to pensions from the following sources: State
Deferred Outflow of Resources
Deferred Inflow of Resources
Changes in assumptions
$ 443,874,767 $ 0
Difference between projected and actual investment earnings
0
610,858,254
Total $ 443,874,767 $ 610,858,254 Local
Deferred Outflow of Resources
Deferred Inflow of Resources
Changes in assumptions
$ 588,743,291 $ 0
Difference between projected and actual investment earnings
0
1,115,773,278
Total $ 588,743,291 $ 1,115,773,278 Total
Deferred Outflow of Resources
Deferred Inflow of Resources
Changes in assumptions
$ 1,032,618,058 $ 0
Difference between projected and actual investment earnings
0
1,726,631,532
Total $ 1,032,618,058 $ 1,726,631,532 Amounts reported as deferred outflows of resources and deferred inflows of resources related to pensions will be recognized in the State’s pension expense as follows:
Fiscal Year ending June 30
State
Local
Total
2015
$ (71,119,937)
$ (170,718,450)
$ (241,838,387)
2016
(71,119,937) (170,718,450) (241,838,387)
2017
(71,119,937) (170,718,450) (241,838,387)
2018
(71,119,937) (170,718,450) (241,838,387)
2019
81,594,626
108,224,870
189,819,496
Thereafter 35,901,635
47,618,943
83,520,578

Page 6
Actuarial Assumptions The total pension liability as of June 30, 2014 was determined by rolling forward the total pension liability as of July 1, 2013 to June 30, 2014 using the following actuarial assumptions, applied to all periods included in the measurement. All other methods and assumptions used to determine the total pension liability are set forth in Section II. The demographic assumptions were selected on the basis of the experience study that was performed for the three-year period ending June 30, 2011 and were adopted by the Board at its September 19, 2012 Board meeting. The economic assumptions were recommended by the Treasurer. These assumptions were effective beginning with the July 1, 2012 actuarial valuation. Long-Term Expected Rate of Return The arithmetic mean return on the portfolio was determined using a building block method in which best-estimate ranges of expected future real rates of return (expected returns, net of pension plan investment expense and inflation) are developed for each major asset class. These ranges are combined to produce the long-term expected rate of return by weighting the expected future real rates of return by the target asset allocation percentage and by adding expected inflation. Best estimates of arithmetic rates of return for each major asset class included in the pension plan's target asset allocation as of June 30, 2014 are summarized in the following table. The capital market assumptions are per Buck’s investment consulting practice for 2014.
Asset Class
Index
Target Allocation*
Long-Term Expected Real Rate of Return
Cash Citigroup 90-Day T-Bills 6.00% 0.80% Core Bonds Barclays Gov/Cred 1.00% 2.49% Intermediate-Term Bonds Barclays Intermediate Gov/Cred 11.20% 2.26% Mortgages Barclays Mortgage 2.50% 2.17% High Yield Bonds Barclays High Yield 5.50% 4.82% Inflation-Indexed Bonds ML Index 2.50% 3.51% Broad US Equities Wilshire 5000/Russell 3000 25.90% 8.22% Developed Foreign Equities MSCI EAFE 12.70% 8.12% Emerging Market Equities MSCI Emerging Markets 6.50% 9.91% Private Equity Cambridge Associates 8.25% 13.02% Hedge Funds/Absolute Return HFRI Fund of Funds 12.25% 4.92% Real Estate (Property) NCREIF/TBI Property 3.20% 5.80% Commodities DJ UBS 2.50% 5.35% Assumed Inflation – Mean 3.01% Assumed Inflation – Standard Deviation 2.72% Portfolio Arithmetic Mean Return 9.54% Portfolio Standard Derivation 11.17% Long-Term Expected Rate of Return selected by State Treasurer
7.90%
*Based on target asset allocation for 2014.

Page 7
Discount rate The discount rate used to measure the total pension liability as of June 30, 2013 was 5.55% and as of June 30, 2014 was 5.39%. As discussed with the Division of Pensions and Benefits and in accordance with Paragraph 42 of the GASB Statement No. 67, the projection of cash flows used to determine the discount rate assumed that the Local employers will contribute 100.0% of their actuarially determined contribution and the NCGIPF contribution and the State will contribute 11.4% of its actuarially determined contribution and 100% of its NCGIPF contribution. The contribution percentage is the average percentage of the annual actual contribution paid over the annual actuarially determined contribution during the most recent five-year period. Based on those assumptions, the pension Plan's fiduciary net position was projected to be available to make projected future benefit payments of current Plan members until fiscal year 2033. Municipal bond rates of 4.63% as of June 30, 2013 and 4.29% as of June 30, 2014 were used in the development of the blended GASB discount rate after that point. As selected by the State Treasurer, the rates are based on the Bond Buyer Go 20-Bond Municipal Bond Index. Based on the long-term rate of return of 7.90% and the municipal bond rates of 4.63% and 4.29%, the blended GASB discount rates are 5.55% as of June 30, 2013 and 5.39% as of June 30, 2014. The assumed discount rate has been determined in accordance with the method prescribed by GASB Statement No. 67. We believe this assumption is reasonable for the purposes of the measurements required by the Statement. The discount rate is the single rate that reflects (1) the long-term expected rate of return on Plan investments that are expected to be used to finance the payment of benefits, to the extent that the Plan’s fiduciary net position is projected to be sufficient to make projected benefit payments and Plan assets are expected to be invested using a strategy to achieve that return, and (2) a yield or index rate for 20-year, tax-exempt general obligation municipal bonds with an average rating of AA/Aa or higher (or equivalent quality on another scale), to the extent that the conditions for use of the long-term expected rate of return are not met. Should contributions to the Plan be different from those outlined above, the results would reflect the new contribution policy and may result in the Fiduciary Net Plan Position not being sufficient to cover the Plan’s benefit payments at some future date and thus changing the discount rate used to determine the Plan’s Total Pension Liability.
Actuarial Cost Method
Entry Age Normal – Level Percentage of Pay
Asset Valuation Method
Invested assets are reported at fair value.
Schedule of Local Employer Contributions The reconciliation of Local Employer contributions used to determine the fiscal year 2013 and fiscal year 2014 proportionate shares is shown in Schedule A in the Appendix.
Page 8
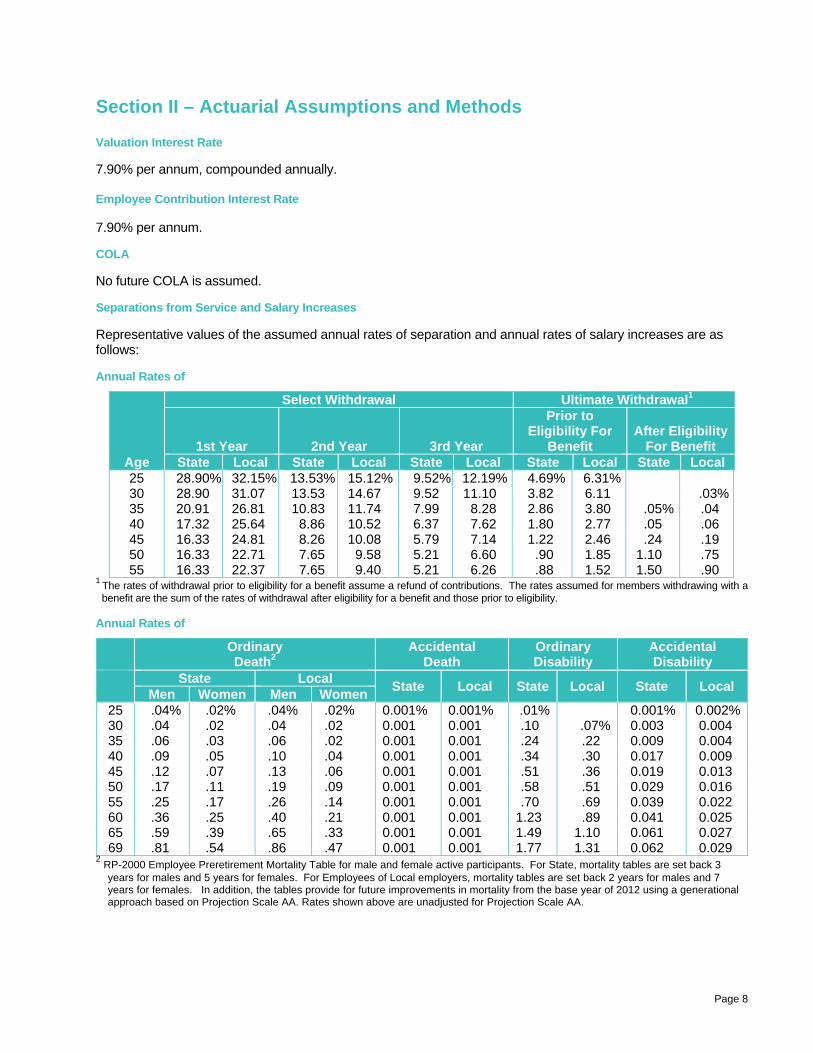
Section II – Actuarial Assumptions and Methods
Valuation Interest Rate 7.90% per annum, compounded annually. Employee Contribution Interest Rate 7.90% per annum. COLA No future COLA is assumed. Separations from Service and Salary Increases Representative values of the assumed annual rates of separation and annual rates of salary increases are as follows: Annual Rates of
Age
Select Withdrawal Ultimate Withdrawal1
1st Year 2nd Year 3rd Year
Prior to Eligibility For
Benefit After Eligibility
For Benefit State Local State Local State Local State Local State Local
25 28.90% 32.15% 13.53% 15.12% 9.52% 12.19% 4.69% 6.31% 30 28.90 31.07 13.53 14.67 9.52 11.10 3.82 6.11 .03%35 20.91 26.81 10.83 11.74 7.99 8.28 2.86 3.80 .05% .04 40 17.32 25.64 8.86 10.52 6.37 7.62 1.80 2.77 .05 .06 45 16.33 24.81 8.26 10.08 5.79 7.14 1.22 2.46 .24 .19 50 16.33 22.71 7.65 9.58 5.21 6.60 .90 1.85 1.10 .75 55 16.33 22.37 7.65 9.40 5.21 6.26 .88 1.52 1.50 .90
1 The rates of withdrawal prior to eligibility for a benefit assume a refund of contributions. The rates assumed for members withdrawing with a benefit are the sum of the rates of withdrawal after eligibility for a benefit and those prior to eligibility.
Annual Rates of
Ordinary Death2
Accidental Death
Ordinary Disability
Accidental Disability
State Local State Local State Local State Local
Men Women Men Women 25 .04% .02% .04% .02% 0.001% 0.001% .01% 0.001% 0.002%30 .04 .02 .04 .02 0.001 0.001 .10 .07% 0.003 0.004 35 .06 .03 .06 .02 0.001 0.001 .24 .22 0.009 0.004 40 .09 .05 .10 .04 0.001 0.001 .34 .30 0.017 0.009 45 .12 .07 .13 .06 0.001 0.001 .51 .36 0.019 0.013 50 .17 .11 .19 .09 0.001 0.001 .58 .51 0.029 0.016 55 .25 .17 .26 .14 0.001 0.001 .70 .69 0.039 0.022 60 .36 .25 .40 .21 0.001 0.001 1.23 .89 0.041 0.025 65 .59 .39 .65 .33 0.001 0.001 1.49 1.10 0.061 0.027 69 .81 .54 .86 .47 0.001 0.001 1.77 1.31 0.062 0.029
2 RP-2000 Employee Preretirement Mortality Table for male and female active participants. For State, mortality tables are set back 3
years for males and 5 years for females. For Employees of Local employers, mortality tables are set back 2 years for males and 7 years for females. In addition, the tables provide for future improvements in mortality from the base year of 2012 using a generational approach based on Projection Scale AA. Rates shown above are unadjusted for Projection Scale AA.

Page 9
Annual Rates of
Service
Retirement Salary
Increases
Age
State
Local FY2012 to
FY2021 FY2022 and thereafter
25 4.40% 5.40% 30 4.15 5.15 35 3.90 4.90 40 3.65 4.65 45 3.40 4.40 50 3.15 4.15 55 17.50% 11.70% 2.90 3.90 60 9.00 7.80 2.65 3.65 65 18.00 16.54 2.15 3.15 69 15.00 11.55 2.15 3.15
Prosecutors Part (Chapter 366, P.L. 2001) This legislation introduced special retirement eligibility for certain benefits. The valuation used the following annual rates of service retirement:
Less than 20 Years 25 or More Years Age State Local 20 Years 21 to 24 Years State Local 40 0.00% 0.00% 2.50% 0.00% 23.10% 15.40% 45 0.00 0.00 2.50 0.00 23.10 15.40 50 0.00 0.00 3.75 0.00 23.10 15.40 55 2.59 3.06 5.00 0.00 26.22 17.48 60 2.63 3.06 5.00 0.00 34.17 22.78 65 2.63 3.06 37.50 0.00 100.00 100.00 69 2.63 3.06 37.50 0.00 100.00 100.00
Deaths After Retirement The RP-2000 Combined Healthy Male and Female Mortality Tables (set back 1 year for males and females) for service retirement and beneficiaries of former members. The RP-2000 Disabled Mortality Tables (set back 3 years for males and set back 1 year for females) are used to value disabled retirees. In addition, the tables for service retirement and beneficiaries of former members provide for future improvements in mortality from the base year of 2012 using a generational approach based on Projection Scale AA. Illustrative rates of mortality unadjusted for Projection Scale AA are shown below:
Age
Service Retirements
Age
Disability Retirements
Men Women Men Women
55 0.32% 0.24% 35 2.26% 0.75% 60 0.60 0.44 40 2.26 0.75 65 1.13 0.86 45 2.26 0.75 70 1.98 1.49 50 2.51 1.06 75 3.39 2.55 55 3.16 1.55 80 5.79 4.15 60 3.80 2.08 85 9.98 6.95 65 4.50 2.66

Page 10
Marriage Husbands are assumed to be 3 years older than wives. Among the active population, 100% of participants are assumed married. Actuarial Cost Method for Pension Funding Projected Unit Credit Method. This method essentially funds the Plan’s benefits accrued to the valuation date. Experience gains or losses are recognized in future accrued liability contributions. In accordance with Chapter 78, P.L. 2011, beginning with the July 1, 2010 actuarial valuation, the accrued liability contribution shall be computed so that if the contribution is paid annually in level dollars, it will amortize the unfunded accrued liability over an open 30 year period. Beginning with the July 1, 2019 actuarial valuation, the accrued liability contribution shall be computed so that if the contribution is paid annually in level dollars it will amortize the unfunded accrued liability over a closed 30 year period (i.e., for each subsequent actuarial valuation, the amortization period shall decrease by one year). Beginning with the July 1, 2029 actuarial valuation when the remaining amortization period reaches 20 years, any increase or decrease in the unfunded accrued liability as a result of actuarial losses or gains for subsequent valuation years shall serve to increase or decrease, respectively, the amortization period for the unfunded accrued liability, unless an increase in the amortization period will cause it to exceed 20 years. If an increase in the amortization period as a result of actuarial losses for a valuation year would exceed 20 years, the accrued liability contribution shall be computed for the valuation year using a 20 year amortization period. Asset Valuation Method for Pension Funding A five year average of market values with write-up was used. This method takes into account appreciation (depreciation) in investments in order to smooth asset values by averaging the excess of the actual over the expected income, on a market value basis, over a five-year period.

Page 11
Section III – Summary of Plan Provisions
New Jersey Statutes, Title 43, Chapter 15A.
1. Definitions Final Compensation (FC) Average annual compensation for the three years of creditable service
immediately preceding retirement or the highest three fiscal years of membership service. Effective June 30, 1996, Chapter 113, P.L. 1997 provided that the amount of compensation used for employer and member contributions and benefits under the program cannot exceed the compensation limitation of Section 401(a)(17) of the Internal Revenue Code. Chapter 103, P.L. 2007 provides that for Class D, Class E, Class F and Class G members, the amount of compensation used for employer and member contributions and benefits under the Plan cannot exceed the annual maximum wage contribution base for Social Security, pursuant to the Federal Insurance Contributions Act. Chapter 1, P.L. 2010 provides that for Class F and Class G members FC is the average annual compensation for the five years of creditable service immediately preceding retirement or the highest five fiscal years of membership service.
Accumulated Deductions Sum of all required amounts deducted from the compensation of a
member or contributed by him. Class B Member Any member who was hired prior to July 1, 2007. Class D Member Any member who was hired on or after July 1, 2007 but prior to
November 2, 2008. Class E Member Any member who was hired after November 1, 2008 but prior to May
22, 2010. Class F Member Any member who was hired on or after May 22, 2010 but prior to June
28, 2011. Class G Member Any member who was hired on or after June 28, 2011. 2. Benefits* Service Retirement Eligible at age 60. Benefit equals a member annuity plus an employer
pension, which together, equal 1/55th of FC for each year of service. Chapter 89, P.L. 2008 changed the eligibility age to age 62 for Class E members, Chapter 1, P.L. 2010 changed the eligibility age to age 62 for Class F members and changed the basic accrual rate from 1/55th to 1/60th of FC for each year of service for Class F and Class G members and Chapter 78, P.L. 2011 changed the eligibility age to age 65 for Class G members.

Page 12
Ordinary Disability Retirement Eligible after 10 years of service. Benefit equals a member annuity plus
an employer pension which, together, equal 1.64% of FC for each year of service; minimum benefit of 43.6% of FC. Class F and Class G members are not eligible for an Ordinary Disability Retirement benefit in accordance with Chapter 3, P.L. 2010.
*Special benefits for veterans, law enforcement officers, legislators, prosecutors and workers compensation judges are summarized at the end of this section.
Accidental Disability Eligible upon total and permanent disability prior to age 65 as a result of
a duty injury. Benefit equals a member annuity plus an employer pension which, together, equal 72.7% of contributory compensation at the date of injury. Class F and Class G members are not eligible for an Accidental Disability Retirement benefit in accordance with Chapter 3, P.L. 2010.
Lump Sum Withdrawal Eligible upon service termination prior to age 60 (age 62 for Class E
and Class F members and age 65 for Class G members) and prior to 10 years of service. Benefit equals refund of accumulated deductions plus, if the member has completed three years of service, interest allowed thereon.
Vested Retirement Eligible after 10 years of service. Benefit equals the lump sum benefit
described above or a deferred retirement benefit, commencing at age 60 (age 62 for Class E and Class F members and age 65 for Class G members), equal to the service retirement benefit based on service and FC at date of termination.
Early Retirement Eligible after 25 years of service (30 years of service for Class G
members). Benefit equals the lump sum benefit described above or the vested benefit reduced by 1/4 percent for each month the retirement date precedes age 55. Chapter 103, P.L. 2007 provides that for Class D members, the reduction shall be 1/12 percent for each month (up to 60 months) the retirement date precedes age 60 plus 1/4 percent for each month the retirement date precedes age 55. Chapter 89, P.L. 2008 and Chapter 1, P.L. 2010 provides that for Class E and Class F members, the reduction shall be 1/12 percent for each month (up to 84 months) the retirement date precedes age 62 plus 1/4 percent for each month the retirement date precedes age 55. Chapter 78, P.L. 2011 provides that for Class G members, the reduction shall be 1/4 percent for each month the retirement date precedes age 65.
Ordinary Death (NCGIPF) Before Retirement Eligible if active. Benefit equals accumulated deductions with interest
plus an amount equal to 1-1/2 times contributory compensation at date of death.
After Retirement Before Age 60 Eligible if disabled or vested terminated. Benefit equals 1-1/2 times last
contributory compensation if disabled, accumulated deductions only if vested terminated.
After Age 60 or Early Retirement

Page 13
Eligible after early retirement or after attainment of age 60 for other types of retirement (if not disabled, 10 years of service credit required on members enrolling after July 1, 1971). Benefit equals 3/16 of last contributory compensation.
Voluntary Death Benefit (CGIPF) An additional, employee-paid, death benefit is also available through
the purchase of group insurance with an outside carrier. Accidental Death Eligible upon death resulting during performance of duty. Benefit varies
as follows: Widow(er) - 50% of contributory compensation paid as pension. Child(ren) - No spouse - 20% (1 child), 35% (2 children), 50% (3 or
more children) of contributory compensation paid as pension to age 18 or life if disabled.
Surviving dependent parent - No spouse or child - 25% (1 parent) or
40% (2 parents) of contributory compensation paid as pension.
No relation above - Accumulated deductions paid to other
beneficiary or estate. In addition the employer-paid lump sum ordinary death benefit is paid. Optional Benefits Various forms of payment of equivalent actuarial value are available to
retirees. Special Benefits Veterans Service Retirement Eligible if member on January 2, 1955, attains age 60, completes 20
years of service. Benefit equals 54.5% of final contributory compensation (veteran members after January 2, 1955 must attain age 55 with 25 years of service or age 60 with 20 years of service).
Chap 220 Benefit Eligible if age 55 and completes 35 years of service. Benefit equals
1/55th of the compensation for the 12-month period of membership that provides the largest possible benefit multiplied by the member’s total years of service.
Law Enforcement Service Retirement Eligible at age 55 after 20 years of service. Benefit equals a member
annuity plus an employer pension which, together, equal 2% of final contributory compensation for each of the first 25 years of service plus 1% of such compensation for non-contributory service or service over 25 years plus 1-2/3% for non-law enforcement service.
Chapter 4, P.L. 2001 Special Retirement After completion of 25 years of service, an additional retirement benefit
equal to 5% of final contributory pay is added to the above service

Page 14
related retirement benefit. There is a maximum total benefit of 70% of final contributory pay.
Ordinary Disability Eligible after 5 years of service. Benefit is the same as for regular
members. Death After Retirement Eligible upon death after an accidental disability retirement. Benefit is
the same as for a regular member with a $5,000 minimum. Legislators Service Retirement Eligible at age 60 and termination of all public service. Benefit is equal
to a member annuity plus an employer pension which, together, equal 3% of final contributory compensation for each year of service to a maximum of 2/3 of final compensation.
Vested Retirement Eligible after 8 years of legislative service. Benefit is a service
retirement benefit deferred to age 60 or, alternatively, a lump sum equal to his accumulated deductions.
Prosecutors Part (Chapter 366, P.L. 2001) Service Retirement Eligibility means age 55 or 20 years of credited service. Mandatory
retirement at age 70. Benefit is an annual retirement allowance equal to a member annuity plus an employer pension, which together equals the greater of:
(i) 1/60th of FC for each year service; or
(ii) 2% of FC multiplied by years of service up to 30 plus 1% of FC
multiplied by years of service over 30; or
(iii) 50% of final contributory compensation if the member has 20 or more years of service.
Chapter 366 also requires that, in addition to the 50% of final
contributory compensation benefit, any member as of January 7, 2002 who will have 20 or more years of service and is required to retire upon attaining age 70, shall receive an additional benefit equal to 3% of final contributory compensation for each year of service over 20 years but not over 25 years.
Special Retirement After completion of 25 years of service. The annual retirement benefit
is equal to a member annuity plus an employer pension which together equal 65% of final contributory compensation plus 1% of final contributory compensation for each year of service over 25. There is a maximum benefit of 70% of final contributory compensation.
Vested Termination Eligible upon termination of service prior to age 55 and after 10 years of
Service (but less than 20 years). The benefit is a deferred retirement benefit, commencing at age 55, equal to a member annuity plus an employer pension which together provide a retirement allowance equal to 2% of final contributory compensation multiplied by service up to 30 plus 1% of final contributory compensation multiplied by years of service in excess of 30.

Page 15
Death Benefits Ordinary Death Benefit – Lump Sum After retirement but prior to age 55, the benefit is as follows:
(i) For death while a Disabled Retiree the benefit is equal to 1 ½ times Compensation.
(ii) For death while a Deferred Retiree the benefit is equal to his
Accumulated Deductions.
(iii) For death while a Retiree who has completed 20 years of Service, the benefit is equal to ½ times final contributory compensation.
(3) After retirement and after age 55, the benefit payable is equal to ½
times final contributory compensation.
Chapter 1, P.L. 2010 closes the Prosecutors Part of the Plan to new members enrolled on or after May 22, 2010.
Workers Compensation Judges Part (Chapter 259, P.L. 2001) Service Retirement (A) Mandatory retirement at age 70. Voluntary retirement prior to age 70
as follows: (a) Age 70 and 10 years of service as a judge of
compensation; (b) Age 65 and 15 years of service as a judge of
compensation; or (c) Age 60 and 20 years of as of judge of compensation
service.
Benefit is an annual retirement allowance equal to the greater of 75% of final salary or the regular service retirement benefit above.
(B) Age 65 while serving as a judge of compensation, 5 consecutive
years of service as a judge of compensation and 15 years in the aggregate of public service; or
Age 60 while serving as a judge, 5 consecutive years of service as a
judge of compensation and 20 years in the aggregate of public service.
Benefit is an annual retirement allowance equal to the greater of 50%
of final salary or the regular service retirement benefit above. (C) Age 60 while serving as a judge of compensation, 5 consecutive
years of service as a judge of compensation and 15 years in the aggregate of public service. Benefit is an annual retirement allowance equal to the greater of 2% of final salary for each year of public service up to 25 years plus 1% of final salary for each year in excess of 25 years or the regular service retirement benefit above.
(D) Age 60 while serving as a judge of compensation. Benefit is an
annual retirement allowance equal to the greater of 2% of final salary
Page 16
for each year of service as a judge of compensation up to 25 years plus 1% for each year in excess of 25 years or the regular service retirement benefit above.
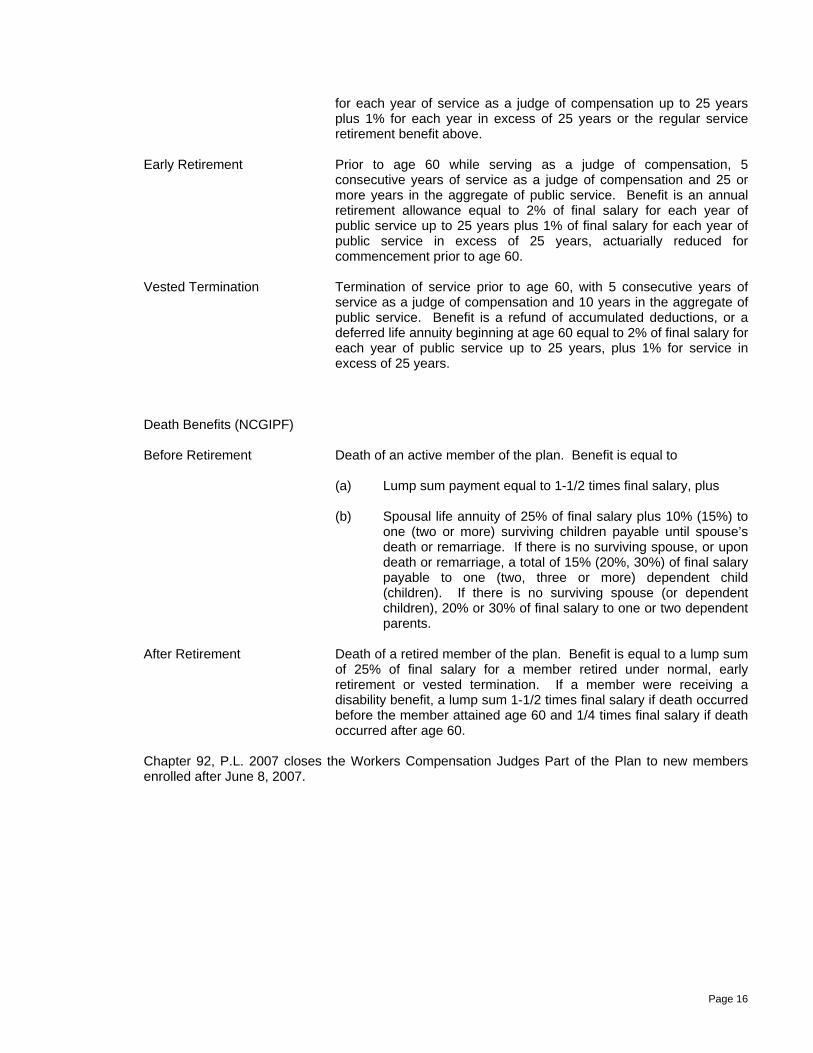
Early Retirement Prior to age 60 while serving as a judge of compensation, 5
consecutive years of service as a judge of compensation and 25 or more years in the aggregate of public service. Benefit is an annual retirement allowance equal to 2% of final salary for each year of public service up to 25 years plus 1% of final salary for each year of public service in excess of 25 years, actuarially reduced for commencement prior to age 60.
Vested Termination Termination of service prior to age 60, with 5 consecutive years of
service as a judge of compensation and 10 years in the aggregate of public service. Benefit is a refund of accumulated deductions, or a deferred life annuity beginning at age 60 equal to 2% of final salary for each year of public service up to 25 years, plus 1% for service in excess of 25 years.
Death Benefits (NCGIPF) Before Retirement Death of an active member of the plan. Benefit is equal to (a) Lump sum payment equal to 1-1/2 times final salary, plus (b) Spousal life annuity of 25% of final salary plus 10% (15%) to
one (two or more) surviving children payable until spouse’s death or remarriage. If there is no surviving spouse, or upon death or remarriage, a total of 15% (20%, 30%) of final salary payable to one (two, three or more) dependent child (children). If there is no surviving spouse (or dependent children), 20% or 30% of final salary to one or two dependent parents.
After Retirement Death of a retired member of the plan. Benefit is equal to a lump sum
of 25% of final salary for a member retired under normal, early retirement or vested termination. If a member were receiving a disability benefit, a lump sum 1-1/2 times final salary if death occurred before the member attained age 60 and 1/4 times final salary if death occurred after age 60.
Chapter 92, P.L. 2007 closes the Workers Compensation Judges Part of the Plan to new members
enrolled after June 8, 2007.

Page 17
3. Contributions By Members Members enrolling in the retirement system on or after July 1, 1994 will
contribute 5% of compensation. Members enrolled prior to July 1, 1994 will contribute 5% of compensation to the retirement system effective July 1, 1995 unless they previously had contributed less than 6% in which case they will contribute 4% of compensation beginning July 1, 1995 and 5% of compensation beginning July 1, 1996. Chapter 103, P.L. 2007 increases the contribution rate to 5.5% of compensation effective, generally, July 1, 2007 for State employees and July 1, 2008 for Local employees. Chapter 78, P.L. 2011 increases the contribution rate from 5.5% to 6.5% of compensation with the increase effective October 2011. Further, beginning July 2012, the member contribution rate will increase by 1/7th of 1% each July until a 7.5% member contribution rate is reached in July 2018.
A 7.50% member contribution rate for members who are eligible to
retire under the Prosecutors Part of the Retirement System as provided by Chapter 366, P.L. 2001 was used prior to July 1, 2008. Effective July 1, 2008 the member contribution rate was increased to 8.50%. Chapter 78, P.L. 2011 increases the contribution rate from 8.5% to 10.0% of compensation with the increase effective October 2011.
By Employers Normal Contribution The State and Local employers pay annually a normal contribution to
the retirement Plan. This contribution is determined each year on the basis of the annual valuation and represents the value of the benefits to be earned in the year following the valuation date. The normal contributions for active members’ COLA are being phased in. Chapter 78, P.L. 2011 suspended future COLAs for current and future retirees and beneficiaries until reactivated as permitted by law.
In accordance with the provisions of Chapter 79, P.L. 1960, the monies
appropriated for payment of the non-contributory life insurance coverage shall be held separate from the retirement Plan monies.
In accordance with the provisions of Chapter 133, P.L. 2001, the
Benefit Enhancement Fund (BEF) was established to fund the additional annual employer normal contribution due to the law’s increased benefits. (Chapter 353, P.L. 2001 extended this coverage to this law’s additional annual employer normal contribution.) If the assets in the BEF are insufficient to cover the normal contribution for the increased benefits for a valuation period, the State will pay such amount for both the State and local employers.
In accordance with the provisions of Chapter 259, P.L. 2001, the
additional normal contributions for increased benefits to judges of compensation for a valuation period will be funded by transfers from the Second Injury Fund.
Chapter 19, P.L. 2009 provides that the State Treasurer will reduce for
Local employers the normal contribution to 50% of the amount certified for fiscal year 2009. This unfunded liability will be paid by the Local employers in level annual payments over a period of 15 years with the first payment due in the fiscal year ending June 30, 2012. The unfunded liability will be adjusted by the rate of return on the actuarial value of assets. The legislation also provides that a Local employer

Page 18
may pay 100% of the recommended contribution for fiscal year 2009. Local employers who were eligible but did not elect to take advantage of Chapter 19, P.L. 2009 were permitted to elect to defer 50% of the 2010 fiscal year required contribution with the first payment due in the fiscal year ending June 30, 2012.
Accrued Liability Contributions The State and Local employers pay contributions to cover any
unfunded accrued liability. An unfunded accrued liability was established for active life COLAs. The amortization periods for funding these liabilities were set initially at 40 years. Experience gains or losses for the 10 valuation years following the March 31, 1992 valuation will increase or decrease the unfunded accrued liability. Thereafter, actuarial gains or losses will increase or decrease the amortization period unless an increase will cause it to exceed 30 years. Chapter 78, P.L. 2011 suspended future COLAs for current and future retirees and beneficiaries until reactivated as permitted by law and changed the methodology used to amortize the unfunded accrued liability. Beginning with the July 1, 2010 actuarial valuation, the accrued liability contribution shall be computed so that if the contribution is paid annually in level dollars, it will amortize the unfunded accrued liability over an open 30 year period. Beginning with the July 1, 2019 actuarial valuation, the accrued liability contribution shall be computed so that if the contribution is paid annually in level dollars it will amortize the unfunded accrued liability over a closed 30 year period (i.e., for each subsequent actuarial valuation, the amortization period shall decrease by one year). Beginning with the July 1, 2029 actuarial valuation when the remaining amortization period reaches 20 years, any increase or decrease in the unfunded accrued liability as a result of actuarial losses or gains for subsequent valuation years shall serve to increase or decrease, respectively, the amortization period for the unfunded accrued liability, unless an increase in the amortization period will cause it to exceed 20 years. If an increase in the amortization period as a result of actuarial losses for a valuation year would exceed 20 years, the accrued liability contribution shall be computed for the valuation year using a 20 year amortization period.
Chapter 366, P.L. 2001 requires the State be liable for any increase in
pension costs to a county that results from the enrollment of prosecutors in the Prosecutors Part. Any increase in the unfunded accrued liability in the Retirement System arising from the benefits established for the Prosecutors Part are to be amortized over a period of 30 years in the manner provided for other such liability in the Retirement System.
In accordance with the provisions of Chapter 259, P.L. 2001, the
additional accrued liability contribution for increased benefits to judges of compensation for a valuation period will be funded by transfers from the Second Injury Fund.
Chapter 19, P.L. 2009 provides that the State Treasurer will reduce for
Local employers the accrued liability contribution to 50% of the amount certified for fiscal year 2009. This unfunded liability will be paid by the Local employers in level annual payments over a period of 15 years with the first payment due in the fiscal year ending June 30, 2012. The unfunded liability will be adjusted by the rate of return on the actuarial value of assets. The legislation also provides that a Local employer

Page 19
may pay 100% of the recommended contribution for fiscal year 2009. Local employers who were eligible but did not elect to defer 50% of the 2009 fiscal year contribution were permitted to elect to defer 50% of the 2010 fiscal year contribution with the first payment due in the fiscal year ending June 30, 2012.
The following legislation provides additional retirement benefits to
certain employees of Local employers: Chapter 137, P.L. 1991, Chapter 229, P.L. 1991, Chapter 231, P.L. 1991, Chapter 138, P.L. 1993, Chapter 163, P.L. 1993, Chapter 44, P.L. 1993, Chapter 59, P.L. 1999, Chapter 126, P.L. 2000, Chapter 23, P.L. 2002, Chapter 127, P.L. 2003, Chapter 128, P.L. 2003 and Chapter 129, P.L. 2003. The cost of the enhanced pension benefits will be funded by employer contributions to the retirement system and paid by the employer that elected to participate. The additional pension liability shall be paid by each electing employer entity over a period of years provided by the legislation.

Page 20
APPENDIX
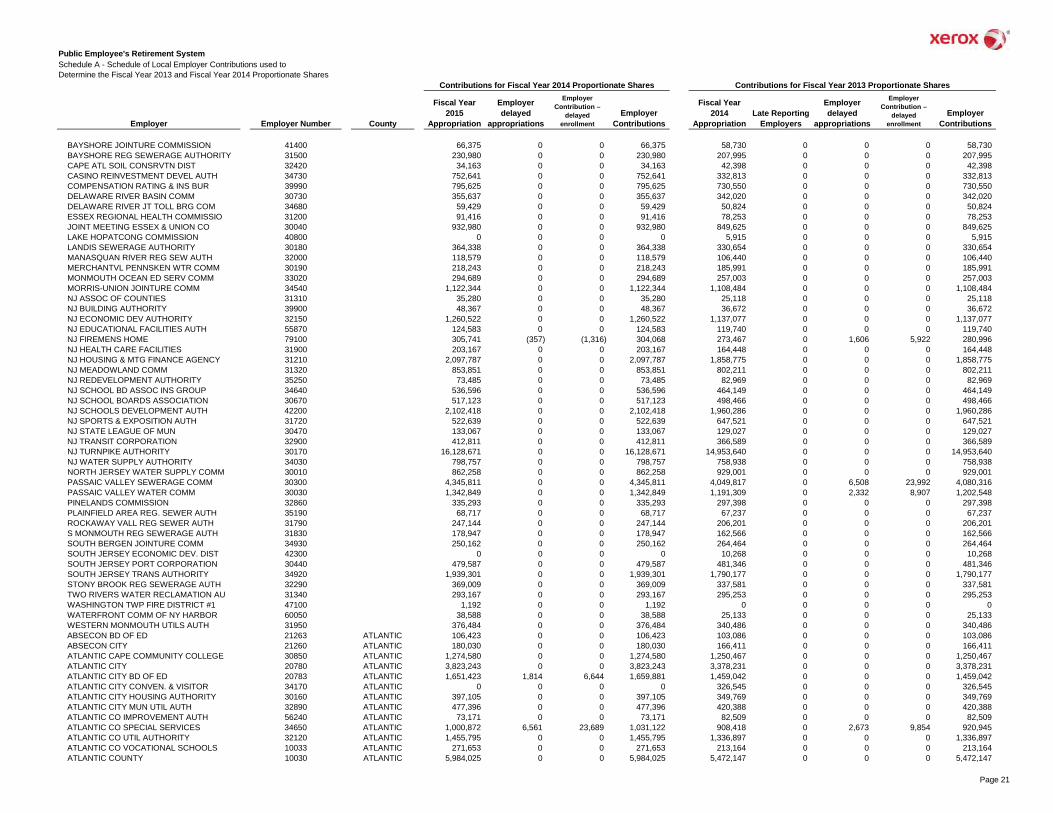
Public Employee's Retirement SystemSchedule A - Schedule of Local Employer Contributions used toDetermine the Fiscal Year 2013 and Fiscal Year 2014 Proportionate Shares
Employer EmployerEmployer Employer Number County Contributions Contributions
BAYSHORE JOINTURE COMMISSION 41400 66,375 0 0 66,375 58,730 0 0 0 58,730 BAYSHORE REG SEWERAGE AUTHORITY 31500 230,980 0 0 230,980 207,995 0 0 0 207,995 CAPE ATL SOIL CONSRVTN DIST 32420 34,163 0 0 34,163 42,398 0 0 0 42,398 CASINO REINVESTMENT DEVEL AUTH 34730 752,641 0 0 752,641 332,813 0 0 0 332,813 COMPENSATION RATING & INS BUR 39990 795,625 0 0 795,625 730,550 0 0 0 730,550 DELAWARE RIVER BASIN COMM 30730 355,637 0 0 355,637 342,020 0 0 0 342,020 DELAWARE RIVER JT TOLL BRG COM 34680 59,429 0 0 59,429 50,824 0 0 0 50,824 ESSEX REGIONAL HEALTH COMMISSIO 31200 91,416 0 0 91,416 78,253 0 0 0 78,253 JOINT MEETING ESSEX & UNION CO 30040 932,980 0 0 932,980 849,625 0 0 0 849,625 LAKE HOPATCONG COMMISSION 40800 0 0 0 0 5,915 0 0 0 5,915 LANDIS SEWERAGE AUTHORITY 30180 364,338 0 0 364,338 330,654 0 0 0 330,654 MANASQUAN RIVER REG SEW AUTH 32000 118,579 0 0 118,579 106,440 0 0 0 106,440 MERCHANTVL PENNSKEN WTR COMM 30190 218,243 0 0 218,243 185,991 0 0 0 185,991 MONMOUTH OCEAN ED SERV COMM 33020 294,689 0 0 294,689 257,003 0 0 0 257,003 MORRIS-UNION JOINTURE COMM 34540 1,122,344 0 0 1,122,344 1,108,484 0 0 0 1,108,484 NJ ASSOC OF COUNTIES 31310 35,280 0 0 35,280 25,118 0 0 0 25,118 NJ BUILDING AUTHORITY 39900 48,367 0 0 48,367 36,672 0 0 0 36,672 NJ ECONOMIC DEV AUTHORITY 32150 1,260,522 0 0 1,260,522 1,137,077 0 0 0 1,137,077 NJ EDUCATIONAL FACILITIES AUTH 55870 124,583 0 0 124,583 119,740 0 0 0 119,740 NJ FIREMENS HOME 79100 305,741 (357) (1,316) 304,068 273,467 0 1,606 5,922 280,996 NJ HEALTH CARE FACILITIES 31900 203,167 0 0 203,167 164,448 0 0 0 164,448 NJ HOUSING & MTG FINANCE AGENCY 31210 2,097,787 0 0 2,097,787 1,858,775 0 0 0 1,858,775 NJ MEADOWLAND COMM 31320 853,851 0 0 853,851 802,211 0 0 0 802,211 NJ REDEVELOPMENT AUTHORITY 35250 73,485 0 0 73,485 82,969 0 0 0 82,969 NJ SCHOOL BD ASSOC INS GROUP 34640 536,596 0 0 536,596 464,149 0 0 0 464,149 NJ SCHOOL BOARDS ASSOCIATION 30670 517,123 0 0 517,123 498,466 0 0 0 498,466 NJ SCHOOLS DEVELOPMENT AUTH 42200 2,102,418 0 0 2,102,418 1,960,286 0 0 0 1,960,286 NJ SPORTS & EXPOSITION AUTH 31720 522,639 0 0 522,639 647,521 0 0 0 647,521 NJ STATE LEAGUE OF MUN 30470 133,067 0 0 133,067 129,027 0 0 0 129,027 NJ TRANSIT CORPORATION 32900 412,811 0 0 412,811 366,589 0 0 0 366,589 NJ TURNPIKE AUTHORITY 30170 16,128,671 0 0 16,128,671 14,953,640 0 0 0 14,953,640 NJ WATER SUPPLY AUTHORITY 34030 798,757 0 0 798,757 758,938 0 0 0 758,938 NORTH JERSEY WATER SUPPLY COMM 30010 862,258 0 0 862,258 929,001 0 0 0 929,001 PASSAIC VALLEY SEWERAGE COMM 30300 4,345,811 0 0 4,345,811 4,049,817 0 6,508 23,992 4,080,316 PASSAIC VALLEY WATER COMM 30030 1,342,849 0 0 1,342,849 1,191,309 0 2,332 8,907 1,202,548 PINELANDS COMMISSION 32860 335,293 0 0 335,293 297,398 0 0 0 297,398 PLAINFIELD AREA REG. SEWER AUTH 35190 68,717 0 0 68,717 67,237 0 0 0 67,237 ROCKAWAY VALL REG SEWER AUTH 31790 247,144 0 0 247,144 206,201 0 0 0 206,201 S MONMOUTH REG SEWERAGE AUTH 31830 178,947 0 0 178,947 162,566 0 0 0 162,566 SOUTH BERGEN JOINTURE COMM 34930 250,162 0 0 250,162 264,464 0 0 0 264,464 SOUTH JERSEY ECONOMIC DEV. DIST 42300 0 0 0 0 10,268 0 0 0 10,268 SOUTH JERSEY PORT CORPORATION 30440 479,587 0 0 479,587 481,346 0 0 0 481,346 SOUTH JERSEY TRANS AUTHORITY 34920 1,939,301 0 0 1,939,301 1,790,177 0 0 0 1,790,177 STONY BROOK REG SEWERAGE AUTH 32290 369,009 0 0 369,009 337,581 0 0 0 337,581 TWO RIVERS WATER RECLAMATION AU 31340 293,167 0 0 293,167 295,253 0 0 0 295,253 WASHINGTON TWP FIRE DISTRICT #1 47100 1,192 0 0 1,192 0 0 0 0 0 WATERFRONT COMM OF NY HARBOR 60050 38,588 0 0 38,588 25,133 0 0 0 25,133 WESTERN MONMOUTH UTILS AUTH 31950 376,484 0 0 376,484 340,486 0 0 0 340,486 ABSECON BD OF ED 21263 ATLANTIC 106,423 0 0 106,423 103,086 0 0 0 103,086 ABSECON CITY 21260 ATLANTIC 180,030 0 0 180,030 166,411 0 0 0 166,411 ATLANTIC CAPE COMMUNITY COLLEGE 30850 ATLANTIC 1,274,580 0 0 1,274,580 1,250,467 0 0 0 1,250,467 ATLANTIC CITY 20780 ATLANTIC 3,823,243 0 0 3,823,243 3,378,231 0 0 0 3,378,231 ATLANTIC CITY BD OF ED 20783 ATLANTIC 1,651,423 1,814 6,644 1,659,881 1,459,042 0 0 0 1,459,042 ATLANTIC CITY CONVEN. & VISITOR 34170 ATLANTIC 0 0 0 0 326,545 0 0 0 326,545 ATLANTIC CITY HOUSING AUTHORITY 30160 ATLANTIC 397,105 0 0 397,105 349,769 0 0 0 349,769 ATLANTIC CITY MUN UTIL AUTH 32890 ATLANTIC 477,396 0 0 477,396 420,388 0 0 0 420,388 ATLANTIC CO IMPROVEMENT AUTH 56240 ATLANTIC 73,171 0 0 73,171 82,509 0 0 0 82,509 ATLANTIC CO SPECIAL SERVICES 34650 ATLANTIC 1,000,872 6,561 23,689 1,031,122 908,418 0 2,673 9,854 920,945 ATLANTIC CO UTIL AUTHORITY 32120 ATLANTIC 1,455,795 0 0 1,455,795 1,336,897 0 0 0 1,336,897 ATLANTIC CO VOCATIONAL SCHOOLS 10033 ATLANTIC 271,653 0 0 271,653 213,164 0 0 0 213,164 ATLANTIC COUNTY 10030 ATLANTIC 5,984,025 0 0 5,984,025 5,472,147 0 0 0 5,472,147
Contributions for Fiscal Year 2014 Proportionate Shares Contributions for Fiscal Year 2013 Proportionate Shares
Fiscal Year 2015
Appropriation
Employer delayed
appropriations
Employer Contribution –
delayed enrollment
Fiscal Year 2014
AppropriationLate Reporting
Employers
Employer delayed
appropriations
Employer Contribution –
delayed enrollment
Page 21

Public Employee's Retirement SystemSchedule A - Schedule of Local Employer Contributions used toDetermine the Fiscal Year 2013 and Fiscal Year 2014 Proportionate Shares
Employer EmployerEmployer Employer Number County Contributions Contributions
Contributions for Fiscal Year 2014 Proportionate Shares Contributions for Fiscal Year 2013 Proportionate Shares
Fiscal Year 2015
Appropriation
Employer delayed
appropriations
Employer Contribution –
delayed enrollment
Fiscal Year 2014
AppropriationLate Reporting
Employers
Employer delayed
appropriations
Employer Contribution –
delayed enrollment
ATLANTIC COUNTY WELFARE BD 10031 ATLANTIC 990,894 0 0 990,894 863,211 0 0 0 863,211 BRIGANTINE CITY 20340 ATLANTIC 510,250 0 0 510,250 473,242 0 0 0 473,242 BRIGANTINE CITY BD OF ED 20343 ATLANTIC 183,718 0 0 183,718 168,850 0 0 0 168,850 BUENA BORO HOUSING AUTH 33040 ATLANTIC 8,336 0 0 8,336 8,202 0 0 0 8,202 BUENA BORO MUN UTIL AUTH 31450 ATLANTIC 63,738 0 0 63,738 56,425 0 0 0 56,425 BUENA BOROUGH 50420 ATLANTIC 58,709 0 0 58,709 59,329 0 0 0 59,329 BUENA REGIONAL SCHOOL DIST 57480 ATLANTIC 409,148 0 0 409,148 361,085 0 0 0 361,085 BUENA VISTA TOWNSHIP 23300 ATLANTIC 103,614 0 0 103,614 82,534 0 0 0 82,534 CORBIN CITY 50640 ATLANTIC 9,134 0 0 9,134 7,788 0 0 0 7,788 EGG HARBOR CITY 20180 ATLANTIC 104,979 0 0 104,979 99,679 0 0 0 99,679 EGG HARBOR CITY BD OF ED 20183 ATLANTIC 104,860 0 0 104,860 87,927 0 0 0 87,927 EGG HARBOR TOWNSHIP 23570 ATLANTIC 770,080 0 0 770,080 691,785 0 0 0 691,785 EGG HARBOR TWP BD OF ED 23573 ATLANTIC 1,503,286 0 0 1,503,286 1,328,210 0 0 0 1,328,210 EGG HARBOR TWP MUN UTIL AUTH 31460 ATLANTIC 35,547 0 0 35,547 35,035 0 0 0 35,035 ESTELL MANOR BD OF ED 50953 ATLANTIC 29,107 0 0 29,107 25,842 0 0 0 25,842 ESTELL MANOR CITY 50950 ATLANTIC 18,037 0 0 18,037 16,731 0 0 0 16,731 FOLSOM BOROUGH 51040 ATLANTIC 32,862 0 0 32,862 30,013 0 0 0 30,013 FOLSOM BOROUGH BD OF ED 51043 ATLANTIC 54,334 0 0 54,334 48,252 0 0 0 48,252 GALLOWAY COMMUNITY CHARTER SCH 38800 ATLANTIC 17,084 0 0 17,084 13,251 0 0 0 13,251 GALLOWAY TOWNSHIP 22970 ATLANTIC 413,178 0 0 413,178 400,226 0 574 2,812 403,613 GALLOWAY TOWNSHIP BD OF ED 22973 ATLANTIC 761,011 0 0 761,011 642,888 0 0 0 642,888 GREATER EGG HARBOR REGIONAL 40190 ATLANTIC 765,364 0 0 765,364 693,725 0 1,481 5,459 700,665 HAMILTON TOWNSHIP (ATLANTIC) 23210 ATLANTIC 405,658 0 0 405,658 381,415 0 0 0 381,415 HAMILTON TWP BD ED (ATLANTIC) 23213 ATLANTIC 532,785 0 0 532,785 472,244 0 5,841 21,534 499,619 HAMILTON TWP MUN UTIL AUTHORITY 31220 ATLANTIC 90,805 0 0 90,805 83,789 0 0 0 83,789 HAMMONTON TOWN 22750 ATLANTIC 260,178 0 0 260,178 231,785 0 0 0 231,785 HAMMONTON TOWN BD OF ED 22753 ATLANTIC 572,931 0 0 572,931 512,082 0 0 0 512,082 LINWOOD BD OF ED 51803 ATLANTIC 158,827 0 0 158,827 141,641 0 0 0 141,641 LINWOOD CITY 51800 ATLANTIC 168,586 0 0 168,586 171,685 0 0 0 171,685 LONGPORT BOROUGH 22980 ATLANTIC 132,812 0 0 132,812 101,819 0 0 0 101,819 MAINLAND REGIONAL H S 57220 ATLANTIC 325,752 0 0 325,752 296,261 0 0 0 296,261 MARGATE CITY 23620 ATLANTIC 646,990 0 0 646,990 606,183 0 0 0 606,183 MARGATE CITY BD OF ED 23623 ATLANTIC 122,623 0 0 122,623 112,938 0 0 0 112,938 MULLICA TOWNSHIP 52330 ATLANTIC 74,073 0 0 74,073 72,081 0 0 0 72,081 MULLICA TWP BD OF ED 52333 ATLANTIC 118,424 0 0 118,424 111,016 0 0 0 111,016 NORTHFIELD BD OF ED 20073 ATLANTIC 134,735 0 0 134,735 111,441 0 793 2,925 115,159 NORTHFIELD CITY 20070 ATLANTIC 168,540 0 0 168,540 151,351 0 0 0 151,351 OCEANSIDE CHARTER SCHOOL 36600 ATLANTIC 50,535 0 0 50,535 51,071 0 0 0 51,071 PLEASANTECH ACADEMY CHARTER SCH 35570 ATLANTIC 0 0 0 0 60,938 0 0 0 60,938 PLEASANTVILLE BD OF ED 23073 ATLANTIC 1,071,139 0 0 1,071,139 996,061 0 0 0 996,061 PLEASANTVILLE CITY 23070 ATLANTIC 410,722 0 0 410,722 376,565 0 0 0 376,565 PLEASANTVILLE HOUSING AUTH 55970 ATLANTIC 65,221 0 0 65,221 54,877 0 0 0 54,877 PORT REPUBLIC CITY 52760 ATLANTIC 20,264 0 0 20,264 18,019 0 0 0 18,019 PORT REPUBLIC CITY BD OF ED 52763 ATLANTIC 9,810 0 0 9,810 12,143 0 0 0 12,143 SOMERS POINT CITY 22370 ATLANTIC 310,395 0 0 310,395 284,798 0 0 0 284,798 SOMERS POINT CITY BD OF ED 22373 ATLANTIC 168,466 0 0 168,466 148,725 0 0 0 148,725 STOCKTON AFFILIATED SVCS INC 49500 ATLANTIC 23,216 0 0 23,216 8,858 0 0 0 8,858 VENTNOR CITY 20370 ATLANTIC 438,894 0 0 438,894 382,744 0 0 0 382,744 VENTNOR CITY BD OF ED 20373 ATLANTIC 137,767 0 0 137,767 112,618 0 0 0 112,618 WEYMOUTH TOWNSHIP 23550 ATLANTIC 27,510 0 0 27,510 29,380 0 0 0 29,380 WEYMOUTH TOWNSHIP BD OF ED 23553 ATLANTIC 28,879 0 0 28,879 28,931 0 0 0 28,931 WEYMOUTH TWP MUN UTIL AUTHORITY 31710 ATLANTIC 779 0 0 779 1,033 0 0 0 1,033 ALLENDALE BORO BD OF ED 22283 BERGEN 151,844 0 0 151,844 167,379 0 0 0 167,379 ALLENDALE BOROUGH 22280 BERGEN 198,027 0 0 198,027 211,920 0 0 0 211,920 ALPINE BD OF ED 23443 BERGEN 41,909 0 0 41,909 46,583 0 0 0 46,583 ALPINE BOROUGH 23440 BERGEN 72,443 0 0 72,443 65,707 0 0 0 65,707 BERGEN ARTS & SCIENCE CHRTR SCH 47200 BERGEN 172,980 0 0 172,980 148,263 0 0 0 148,263 BERGEN CO BD OF SOC SERV 10011 BERGEN 1,658,528 0 0 1,658,528 1,555,169 0 (2,474) (8,922) 1,543,773 BERGEN CO BD OF SPECIAL SERVS 40480 BERGEN 1,960,564 0 0 1,960,564 1,768,336 0 0 0 1,768,336 BERGEN CO HOUSING AUTHORITY 31360 BERGEN 440,787 0 0 440,787 356,467 0 0 0 356,467 BERGEN CO UTILTIES AUTHORITY 30240 BERGEN 1,635,505 0 0 1,635,505 1,446,739 0 0 0 1,446,739
Page 22

Public Employee's Retirement SystemSchedule A - Schedule of Local Employer Contributions used toDetermine the Fiscal Year 2013 and Fiscal Year 2014 Proportionate Shares
Employer EmployerEmployer Employer Number County Contributions Contributions
Contributions for Fiscal Year 2014 Proportionate Shares Contributions for Fiscal Year 2013 Proportionate Shares
Fiscal Year 2015
Appropriation
Employer delayed
appropriations
Employer Contribution –
delayed enrollment
Fiscal Year 2014
AppropriationLate Reporting
Employers
Employer delayed
appropriations
Employer Contribution –
delayed enrollment
BERGEN CO VOCATIONAL SCHOOL 10013 BERGEN 1,576,279 3,333 11,955 1,591,566 1,442,334 0 (890) (3,208) 1,438,236 BERGEN COMMUNITY COLLEGE 31060 BERGEN 2,498,920 1,441 5,168 2,505,529 2,292,228 0 0 0 2,292,228 BERGEN COUNTY 10010 BERGEN 9,523,674 0 0 9,523,674 8,717,624 0 0 0 8,717,624 BERGEN COUNTY IMPROVEMENT AUTH 35500 BERGEN 17,205 0 0 17,205 14,808 0 0 0 14,808 BERGEN COUNTY SOIL CONSER DIST 32460 BERGEN 38,605 0 0 38,605 34,386 0 0 0 34,386 BERGENFIELD BD OF ED 20623 BERGEN 591,009 0 0 591,009 555,640 0 0 0 555,640 BERGENFIELD BOROUGH 20620 BERGEN 668,791 0 0 668,791 632,433 0 0 0 632,433 BOGOTA BORO BD OF ED 21473 BERGEN 50,721 1,471 5,276 57,468 48,569 0 0 0 48,569 BOGOTA BOROUGH 21470 BERGEN 92,786 0 0 92,786 104,166 0 0 0 104,166 CARLSTADT BOROUGH 50500 BERGEN 391,295 0 0 391,295 378,260 0 0 0 378,260 CARLSTADT BOROUGH BD OF ED 50503 BERGEN 111,504 0 0 111,504 102,187 0 0 0 102,187 CARLSTADT E.RUTHERFORD BD OF ED 57500 BERGEN 105,789 0 0 105,789 94,547 0 0 0 94,547 CARLSTADT SEWERAGE AUTHORITY 31520 BERGEN 17,241 0 0 17,241 16,150 0 0 0 16,150 CLIFFSIDE PARK BD OF ED 20423 BERGEN 447,932 0 0 447,932 413,213 0 0 0 413,213 CLIFFSIDE PARK BOROUGH 20420 BERGEN 542,709 0 0 542,709 458,424 0 0 0 458,424 CLIFFSIDE PARK HOUSING 31300 BERGEN 108,383 0 0 108,383 96,904 0 0 0 96,904 CLOSTER BOARD OF EDUCATION 21983 BERGEN 179,172 0 0 179,172 157,151 0 0 0 157,151 CLOSTER BOROUGH 21980 BERGEN 323,615 0 0 323,615 272,133 0 0 0 272,133 CRESSKILL BD OF ED 22303 BERGEN 272,381 0 0 272,381 246,419 0 0 0 246,419 CRESSKILL BOROUGH 22300 BERGEN 403,640 0 0 403,640 351,287 0 0 0 351,287 DEMAREST BORO BD OF ED 22743 BERGEN 184,399 0 0 184,399 153,430 0 0 0 153,430 DEMAREST BOROUGH 22740 BERGEN 97,913 0 0 97,913 112,433 0 0 0 112,433 DUMONT BOROUGH 20870 BERGEN 436,015 0 0 436,015 387,246 0 0 0 387,246 DUMONT BOROUGH BD OF ED 20873 BERGEN 372,422 0 0 372,422 404,732 0 0 0 404,732 EAST RUTHERFORD BORO BD OF ED 50853 BERGEN 157,808 0 0 157,808 141,766 0 0 0 141,766 EAST RUTHERFORD BOROUGH 50850 BERGEN 330,932 6,567 26,634 364,133 308,157 0 15,936 56,255 380,348 EDGEWATER BORO BD OF ED 21673 BERGEN 119,870 0 0 119,870 90,563 0 0 0 90,563 EDGEWATER BOROUGH 21670 BERGEN 416,429 0 0 416,429 383,192 0 0 0 383,192 EDGEWATER HOUSING AUTHORITY 31730 BERGEN 33,189 0 0 33,189 29,310 0 0 0 29,310 ELMWOOD PARK BOROUGH 20880 BERGEN 367,754 0 0 367,754 318,974 0 2,357 8,689 330,020 ELMWOOD PARK BOROUGH BD OF ED 20883 BERGEN 289,037 0 0 289,037 255,860 0 0 0 255,860 EMERSON BOROUGH 22190 BERGEN 206,142 0 0 206,142 184,397 0 1,280 4,719 190,396 EMERSON BOROUGH BD OF ED 22193 BERGEN 199,550 0 0 199,550 183,305 0 0 0 183,305 ENGLEWOOD CITY 20580 BERGEN 1,050,531 0 0 1,050,531 939,929 0 0 0 939,929 ENGLEWOOD CITY BD OF ED 20583 BERGEN 234,318 0 0 234,318 549,604 0 0 0 549,604 ENGLEWOOD CLIFFS BD OF ED 50933 BERGEN 125,361 0 0 125,361 101,302 0 0 0 101,302 ENGLEWOOD CLIFFS BOROUGH 50930 BERGEN 138,637 0 0 138,637 119,285 0 0 0 119,285 ENGLEWOOD HOUSING AUTH 56100 BERGEN 71,468 0 0 71,468 73,667 0 0 0 73,667 FAIR LAWN BD OF ED 20433 BERGEN 1,279,297 0 0 1,279,297 1,146,830 0 0 0 1,146,830 FAIR LAWN BOROUGH 20430 BERGEN 1,228,661 3,049 10,936 1,242,645 1,123,628 0 0 0 1,123,628 FAIRVIEW BORO BD OF ED 20653 BERGEN 172,670 0 0 172,670 139,249 0 0 0 139,249 FAIRVIEW BOROUGH 20650 BERGEN 268,126 0 0 268,126 268,389 0 0 0 268,389 FORT LEE BD OF ED 20893 BERGEN 611,780 (1,404) (5,175) 605,201 484,841 0 1,404 5,175 491,420 FORT LEE BOROUGH 20890 BERGEN 1,281,555 3,957 14,194 1,299,705 1,161,682 0 1,007 3,714 1,166,403 FORT LEE HOUSING AUTHORITY 31330 BERGEN 52,758 0 0 52,758 46,485 0 0 0 46,485 FORT LEE PARKING AUTHORITY 56390 BERGEN 84,155 0 0 84,155 72,607 0 0 0 72,607 FRANKLIN LAKES BD OF ED 22463 BERGEN 217,181 1,348 4,836 223,365 205,188 0 0 0 205,188 FRANKLIN LAKES BOROUGH 22460 BERGEN 330,187 0 0 330,187 293,065 0 0 0 293,065 GARFIELD CITY 20810 BERGEN 515,216 0 0 515,216 469,420 0 0 0 469,420 GARFIELD CITY BD OF ED 20813 BERGEN 1,219,066 0 0 1,219,066 975,730 0 0 0 975,730 GARFIELD HOUSING AUTHORITY 30550 BERGEN 110,834 0 0 110,834 101,171 0 0 0 101,171 GLEN ROCK BOROUGH 22420 BERGEN 420,991 2,548 9,142 432,681 379,199 0 916 3,378 383,494 GLEN ROCK BOROUGH BD OF ED 22423 BERGEN 392,579 0 0 392,579 363,065 0 247 910 364,222 HACKENSACK CITY 20590 BERGEN 1,264,371 0 0 1,264,371 1,122,897 0 2,042 7,529 1,132,468 HACKENSACK CITY BD OF ED 20593 BERGEN 1,251,891 0 0 1,251,891 1,049,953 0 0 0 1,049,953 HACKENSACK HOUSING AUTHORITY 30520 BERGEN 95,839 0 0 95,839 78,897 0 0 0 78,897 HARRINGTON PARK BD OF ED 22433 BERGEN 146,627 0 0 146,627 120,817 0 0 0 120,817 HARRINGTON PARK BOROUGH 22430 BERGEN 116,050 0 0 116,050 105,705 0 0 0 105,705 HASBROUCK HEIGHTS BD OF ED 20453 BERGEN 260,972 0 0 260,972 221,117 0 0 0 221,117 HASBROUCK HEIGHTS BOROUGH 20450 BERGEN 391,400 0 0 391,400 357,080 0 0 0 357,080 HAWORTH BOROUGH 22150 BERGEN 161,694 0 0 161,694 151,518 0 0 0 151,518
Page 23

Public Employee's Retirement SystemSchedule A - Schedule of Local Employer Contributions used toDetermine the Fiscal Year 2013 and Fiscal Year 2014 Proportionate Shares
Employer EmployerEmployer Employer Number County Contributions Contributions
Contributions for Fiscal Year 2014 Proportionate Shares Contributions for Fiscal Year 2013 Proportionate Shares
Fiscal Year 2015
Appropriation
Employer delayed
appropriations
Employer Contribution –
delayed enrollment
Fiscal Year 2014
AppropriationLate Reporting
Employers
Employer delayed
appropriations
Employer Contribution –
delayed enrollment
HAWORTH BOROUGH BD OF ED 22153 BERGEN 49,479 0 0 49,479 49,818 0 0 0 49,818 HILLSDALE BOROUGH 21360 BERGEN 206,955 0 0 206,955 190,129 0 0 0 190,129 HILLSDALE BOROUGH BD OF ED 21363 BERGEN 197,061 0 0 197,061 170,219 0 0 0 170,219 HO-HO-KUS BD OF ED 21603 BERGEN 95,067 0 0 95,067 86,999 0 0 0 86,999 HO-HO-KUS BOROUGH 21600 BERGEN 177,213 0 0 177,213 172,757 0 0 0 172,757 LEONIA BOROUGH 20930 BERGEN 303,231 0 0 303,231 286,044 0 8,131 29,976 324,150 LEONIA BOROUGH BD OF ED 20933 BERGEN 343,033 0 0 343,033 307,353 0 0 0 307,353 LITTLE FERRY BD OF ED 23273 BERGEN 112,134 2,009 7,205 121,347 110,907 0 0 0 110,907 LITTLE FERRY BOROUGH 23270 BERGEN 176,512 0 0 176,512 167,399 0 0 0 167,399 LODI BD OF ED 20463 BERGEN 400,716 0 0 400,716 355,803 0 0 0 355,803 LODI BOROUGH 20460 BERGEN 351,079 0 0 351,079 385,658 0 0 0 385,658 LODI HOUSING AUTHORITY 30370 BERGEN 95,841 0 0 95,841 95,204 0 0 0 95,204 LYNDHURST TOWNSHIP 22580 BERGEN 554,053 0 0 554,053 526,789 0 3,431 12,111 542,330 LYNDHURST TWP BD OF ED 22583 BERGEN 346,347 0 0 346,347 322,549 0 0 0 322,549 MAHWAH BD OF ED 22473 BERGEN 524,459 0 0 524,459 501,567 0 0 0 501,567 MAHWAH TOWNSHIP 22470 BERGEN 783,534 0 0 783,534 729,958 0 0 0 729,958 MAYWOOD BD OF ED 21803 BERGEN 123,075 0 0 123,075 125,915 0 0 0 125,915 MAYWOOD BOROUGH 21800 BERGEN 172,624 220 790 173,635 190,810 0 0 0 190,810 MID BERGEN REG HEALTH COMM 32660 BERGEN 39,583 0 0 39,583 35,902 0 0 0 35,902 MIDLAND PARK BORO BD OF ED 52143 BERGEN 214,048 0 0 214,048 175,135 0 0 0 175,135 MIDLAND PARK BOROUGH 52140 BERGEN 125,470 0 0 125,470 106,962 0 0 0 106,962 MONTVALE BOROUGH 22250 BERGEN 249,631 0 0 249,631 226,509 0 0 0 226,509 MONTVALE BOROUGH BD OF ED 22253 BERGEN 145,640 0 0 145,640 144,521 0 0 0 144,521 MOONACHIE BOROUGH 52260 BERGEN 137,467 0 0 137,467 115,749 0 0 0 115,749 MOONACHIE BOROUGH BD OF ED 52263 BERGEN 65,339 0 0 65,339 61,553 0 0 0 61,553 NEW MILFORD BD OF ED 20683 BERGEN 399,988 0 0 399,988 343,575 0 0 0 343,575 NEW MILFORD BOROUGH 20680 BERGEN 316,235 0 0 316,235 297,995 0 0 0 297,995 NORTH ARLINGTON BD OF ED 20053 BERGEN 260,498 0 0 260,498 227,383 0 0 0 227,383 NORTH ARLINGTON BOROUGH 20050 BERGEN 283,623 0 0 283,623 269,623 0 0 0 269,623 NORTHERN HIGHLANDS REG H S 40160 BERGEN 224,096 0 0 224,096 207,907 0 0 0 207,907 NORTHERN VALLEY REG H S DIST 40200 BERGEN 991,465 0 0 991,465 955,510 0 0 0 955,510 NORTHVALE BD OF ED 23153 BERGEN 91,551 0 0 91,551 85,450 0 0 0 85,450 NORTHVALE BOROUGH 23150 BERGEN 123,608 0 0 123,608 104,260 0 0 0 104,260 NORTHWEST BERGEN CENT DISPATCH 35180 BERGEN 96,687 0 0 96,687 86,041 0 0 0 86,041 NORTHWEST BERGEN CO UTIL AUTH 31230 BERGEN 406,536 0 0 406,536 368,940 0 0 0 368,940 NORTHWEST BERGEN HEALTH COMM 55180 BERGEN 41,641 0 0 41,641 35,493 0 0 0 35,493 NORWOOD BD OF ED 23353 BERGEN 94,745 0 0 94,745 94,967 0 0 0 94,967 NORWOOD BOROUGH 23350 BERGEN 128,163 0 0 128,163 126,011 0 0 0 126,011 OAKLAND BD OF ED 22073 BERGEN 277,003 0 0 277,003 252,198 0 0 0 252,198 OAKLAND BOROUGH 22070 BERGEN 385,897 0 0 385,897 331,602 0 0 0 331,602 OLD TAPPAN BD OF ED 23163 BERGEN 127,911 0 0 127,911 93,943 0 0 0 93,943 OLD TAPPAN BOROUGH 23160 BERGEN 204,074 0 0 204,074 183,767 0 1,802 6,644 192,213 ORADELL BD OF ED 21193 BERGEN 100,307 0 0 100,307 104,361 0 0 0 104,361 ORADELL BOROUGH 21190 BERGEN 244,519 0 0 244,519 219,750 0 0 0 219,750 PALISADES PARK BD OF ED 20983 BERGEN 213,991 0 0 213,991 183,046 0 0 0 183,046 PALISADES PARK BOROUGH 20980 BERGEN 343,603 0 0 343,603 322,587 0 0 0 322,587 PARAMUS BD OF ED 22773 BERGEN 1,024,215 0 0 1,024,215 903,686 0 0 0 903,686 PARAMUS BOROUGH 22770 BERGEN 1,226,483 0 0 1,226,483 1,063,009 0 1,751 6,457 1,071,217 PARK RIDGE BORO BD OF ED 21383 BERGEN 269,378 0 0 269,378 238,653 0 0 0 238,653 PARK RIDGE BOROUGH 21380 BERGEN 379,984 0 0 379,984 323,607 0 0 0 323,607 PASCACK VALLEY REG H S DIST 40120 BERGEN 537,177 0 0 537,177 476,284 0 0 0 476,284 RAMAPO INDIAN HILLS REG H S D 40130 BERGEN 491,834 0 0 491,834 429,110 0 0 0 429,110 RAMSEY BOROUGH 21710 BERGEN 493,220 0 0 493,220 435,631 0 0 0 435,631 RAMSEY BOROUGH BD OF ED 21713 BERGEN 640,940 0 0 640,940 568,443 0 0 0 568,443 RIDGEFIELD BORO BD OF ED 20483 BERGEN 466,171 8,281 30,242 504,694 445,980 0 0 0 445,980 RIDGEFIELD BOROUGH 20480 BERGEN 338,705 0 0 338,705 316,359 0 0 0 316,359 RIDGEFIELD PARK BD OF ED 20553 BERGEN 408,994 0 0 408,994 351,914 0 0 0 351,914 RIDGEFIELD PARK VILLAGE 20550 BERGEN 381,434 1,441 5,168 388,043 348,136 0 0 0 348,136 RIDGEWOOD PUBLIC LIBRARY 20564 BERGEN 158,634 1,585 5,685 165,904 143,623 0 0 0 143,623 RIDGEWOOD TWP BD OF ED 20563 BERGEN 989,952 0 0 989,952 847,187 0 0 0 847,187 RIDGEWOOD VILLAGE 20560 BERGEN 1,226,826 0 0 1,226,826 1,152,272 0 0 0 1,152,272
Page 24

Public Employee's Retirement SystemSchedule A - Schedule of Local Employer Contributions used toDetermine the Fiscal Year 2013 and Fiscal Year 2014 Proportionate Shares
Employer EmployerEmployer Employer Number County Contributions Contributions
Contributions for Fiscal Year 2014 Proportionate Shares Contributions for Fiscal Year 2013 Proportionate Shares
Fiscal Year 2015
Appropriation
Employer delayed
appropriations
Employer Contribution –
delayed enrollment
Fiscal Year 2014
AppropriationLate Reporting
Employers
Employer delayed
appropriations
Employer Contribution –
delayed enrollment
RIVER DELL REG SCHOOL DISTRICT 40060 BERGEN 308,776 0 0 308,776 282,170 0 0 0 282,170 RIVER EDGE BORO BD OF ED 21513 BERGEN 269,417 0 0 269,417 228,837 0 0 0 228,837 RIVER EDGE BOROUGH 21510 BERGEN 309,987 0 0 309,987 278,615 0 0 0 278,615 RIVER VALE TOWNSHIP 22080 BERGEN 234,336 0 0 234,336 213,833 0 0 0 213,833 RIVER VALE TWP BD OF ED 22083 BERGEN 226,888 0 0 226,888 206,666 0 0 0 206,666 ROCHELLE PARK TOWNSHIP 21620 BERGEN 123,847 0 0 123,847 116,688 0 0 0 116,688 ROCHELLE PARK TWP BD OF ED 21623 BERGEN 79,891 0 0 79,891 74,491 0 0 0 74,491 ROCKLEIGH BOROUGH 52890 BERGEN 18,340 0 0 18,340 20,653 0 0 0 20,653 RUTHERFORD BORO BD OF ED 20703 BERGEN 342,442 0 0 342,442 326,944 0 0 0 326,944 RUTHERFORD BOROUGH 20700 BERGEN 617,369 0 0 617,369 543,481 0 0 0 543,481 SADDLE BROOK BD OF ED 52963 BERGEN 319,845 0 0 319,845 276,809 0 22,016 77,721 376,546 SADDLE BROOK TOWNSHIP 52960 BERGEN 335,244 0 0 335,244 293,039 0 0 0 293,039 SADDLE RIVER BD OF ED 22863 BERGEN 80,772 0 0 80,772 73,582 0 0 0 73,582 SADDLE RIVER BOROUGH 22860 BERGEN 146,259 0 0 146,259 134,250 0 0 0 134,250 SOUTH HACKENSACK BD OF ED 20533 BERGEN 68,205 0 0 68,205 56,607 0 0 0 56,607 SOUTH HACKENSACK TOWNSHIP 20530 BERGEN 85,601 0 0 85,601 88,201 0 0 0 88,201 TEANECK BD OF ED 20033 BERGEN 1,171,003 0 0 1,171,003 1,075,875 0 0 0 1,075,875 TEANECK COMMUNITY CHARTER SCH 35630 BERGEN 44,331 0 0 44,331 44,639 0 0 0 44,639 TEANECK TOWNSHIP 20030 BERGEN 1,108,071 2,388 8,565 1,119,023 975,011 0 6,662 24,319 1,005,992 TENAFLY BD OF ED 20503 BERGEN 691,876 0 0 691,876 636,215 0 0 0 636,215 TENAFLY BOROUGH 20500 BERGEN 637,524 0 0 637,524 562,324 0 0 0 562,324 TETERBORO BOROUGH 23370 BERGEN 103,037 0 0 103,037 87,568 0 0 0 87,568 UPPER SADDLE RIVER BD OF ED 53423 BERGEN 248,869 2,372 8,509 259,750 211,432 0 0 0 211,432 UPPER SADDLE RIVER BORO 53420 BERGEN 190,476 0 0 190,476 170,051 0 2,096 7,726 179,872 WALDWICK BORO BD OF ED 21953 BERGEN 354,468 0 0 354,468 289,015 0 0 0 289,015 WALDWICK BOROUGH 21950 BERGEN 299,189 0 0 299,189 290,735 0 0 0 290,735 WALLINGTON BOROUGH 53490 BERGEN 133,317 2,776 9,959 146,052 119,492 0 0 0 119,492 WALLINGTON BOROUGH BD OF ED 53493 BERGEN 151,310 0 0 151,310 143,486 0 0 0 143,486 WASHINGTON TOWNSHIP (BERGEN) 22040 BERGEN 138,169 0 0 138,169 135,702 0 0 0 135,702 WESTWOOD BOROUGH 21530 BERGEN 352,273 0 0 352,273 317,427 0 0 0 317,427 WESTWOOD REG SCH DISTRICT 40080 BERGEN 435,803 0 0 435,803 378,683 0 0 0 378,683 WOODCLIFF LAKE BD OF ED 22483 BERGEN 146,379 0 0 146,379 118,247 0 0 0 118,247 WOODCLIFF LAKE BOROUGH 22480 BERGEN 171,797 0 0 171,797 163,745 0 0 0 163,745 WOOD-RIDGE BD OF ED 21053 BERGEN 170,822 0 0 170,822 145,692 0 0 0 145,692 WOOD-RIDGE BOROUGH 21050 BERGEN 223,435 0 0 223,435 200,773 0 0 0 200,773 WYCKOFF TOWNSHIP 22490 BERGEN 358,834 0 0 358,834 325,879 0 0 0 325,879 WYCKOFF TOWNSHIP BD OF ED 22493 BERGEN 307,321 0 0 307,321 275,377 0 0 0 275,377 BASS RIVER TWP BD OF ED 23533 BURLINGTON 19,704 0 0 19,704 19,767 0 0 0 19,767 BASS RIVER TWP MUNICIPAL BLDG 23530 BURLINGTON 33,432 0 0 33,432 34,283 0 0 0 34,283 BEVERLY CITY BD OF ED 21663 BURLINGTON 44,483 0 0 44,483 36,047 0 0 0 36,047 BEVERLY CITY HOUSING AUTHORITY 56370 BURLINGTON 30,672 0 0 30,672 23,510 0 0 0 23,510 BEVERLY CITY_MUNICIPAL BLDG 21660 BURLINGTON 30,865 2,052 7,359 40,276 17,239 0 4,108 15,147 36,494 BEVERLY SEWERAGE AUTHORITY 30280 BURLINGTON 26,784 0 0 26,784 24,020 0 0 0 24,020 BORDENTOWN CITY 22290 BURLINGTON 125,988 0 0 125,988 116,583 0 0 0 116,583 BORDENTOWN FIRE DISTRICT #1 34570 BURLINGTON 2,122 0 0 2,122 1,911 0 0 0 1,911 BORDENTOWN REG SCH DISTRICT 40150 BURLINGTON 528,273 0 0 528,273 485,193 0 0 0 485,193 BORDENTOWN SEWERAGE AUTH 34320 BURLINGTON 95,436 0 0 95,436 85,241 0 0 0 85,241 BORDENTOWN TWP 22590 BURLINGTON 140,918 1,498 5,375 147,791 136,273 0 0 0 136,273 BORDENTOWN TWP FIRE DISTRICT 2 34620 BURLINGTON 5,588 0 0 5,588 5,835 0 0 0 5,835 BURLINGTON CITY 20060 BURLINGTON 380,845 0 0 380,845 338,323 0 0 0 338,323 BURLINGTON CITY 20069 BURLINGTON 8,213 0 0 8,213 7,147 0 0 0 7,147 BURLINGTON CITY BD OF ED 20063 BURLINGTON 397,725 0 0 397,725 392,049 0 0 0 392,049 BURLINGTON CITY HOUSING AUTH 56210 BURLINGTON 17,824 0 0 17,824 15,855 0 0 0 15,855 BURLINGTON CO BD OF SOCIAL SERV 10071 BURLINGTON 1,319,171 0 0 1,319,171 1,280,694 0 0 0 1,280,694 BURLINGTON CO BD SPCL SERVICES 40490 BURLINGTON 1,275,481 3,710 13,676 1,292,867 1,142,197 0 0 0 1,142,197 BURLINGTON CO COLLEGE 31090 BURLINGTON 1,029,389 0 0 1,029,389 957,577 0 0 0 957,577 BURLINGTON CO INSTITUTE OF TECH 10073 BURLINGTON 496,242 0 0 496,242 470,494 0 0 0 470,494 BURLINGTON CO SOIL CON DIST 32720 BURLINGTON 23,493 0 0 23,493 20,532 0 0 0 20,532 BURLINGTON COUNTY BRIDGE COMM 30420 BURLINGTON 949,508 0 0 949,508 866,534 0 0 0 866,534 BURLINGTON COUNTY/PAYROLL DEPT 10070 BURLINGTON 5,747,987 (1,381) (5,091) 5,741,515 6,212,477 0 1,381 5,091 6,218,949 BURLINGTON TOWNSHIP 21970 BURLINGTON 569,514 0 0 569,514 543,389 0 0 0 543,389
Page 25

Public Employee's Retirement SystemSchedule A - Schedule of Local Employer Contributions used toDetermine the Fiscal Year 2013 and Fiscal Year 2014 Proportionate Shares
Employer EmployerEmployer Employer Number County Contributions Contributions
Contributions for Fiscal Year 2014 Proportionate Shares Contributions for Fiscal Year 2013 Proportionate Shares
Fiscal Year 2015
Appropriation
Employer delayed
appropriations
Employer Contribution –
delayed enrollment
Fiscal Year 2014
AppropriationLate Reporting
Employers
Employer delayed
appropriations
Employer Contribution –
delayed enrollment
BURLINGTON TWP BD OF ED 21973 BURLINGTON 384,104 0 0 384,104 372,171 0 0 0 372,171 BURLINGTON TWP FIRE DISTRICT 1 34880 BURLINGTON 24,110 0 0 24,110 21,771 0 0 0 21,771 CHESTERFIELD TOWNSHIP 50560 BURLINGTON 64,515 0 0 64,515 56,265 0 0 0 56,265 CHESTERFIELD TWP BD OF ED 50563 BURLINGTON 92,079 0 0 92,079 84,055 0 0 0 84,055 CINNAMINSON SEWERAGE AUTHORITY 55900 BURLINGTON 65,187 0 0 65,187 53,317 0 0 0 53,317 CINNAMINSON TOWNSHIP 22050 BURLINGTON 199,125 0 0 199,125 172,850 0 0 0 172,850 CINNAMINSON TWP BD OF ED 22053 BURLINGTON 586,679 0 0 586,679 513,435 0 0 0 513,435 DELANCO SEWERAGE AUTHORITY 55150 BURLINGTON 16,302 0 0 16,302 14,362 0 0 0 14,362 DELANCO TOWNSHIP 50680 BURLINGTON 86,226 0 0 86,226 79,661 0 0 0 79,661 DELANCO TWP BD OF ED 50683 BURLINGTON 55,919 0 0 55,919 53,649 0 0 0 53,649 DELRAN TOWNSHIP 22600 BURLINGTON 298,177 0 0 298,177 275,682 0 0 0 275,682 DELRAN TWP BD OF ED 22603 BURLINGTON 348,319 0 0 348,319 304,432 0 0 0 304,432 DELRAN TWP FIRE DISTRICT #1 34690 BURLINGTON 24,639 0 0 24,639 21,922 0 0 0 21,922 EASTAMPTON TOWNSHIP 50790 BURLINGTON 77,544 0 0 77,544 56,563 0 0 0 56,563 EASTAMPTON TOWNSHIP BD OF ED 50793 BURLINGTON 141,620 0 0 141,620 123,299 0 0 0 123,299 EDGEWATER PARK SEWERAGE AUTH 56170 BURLINGTON 0 1,608 5,767 7,374 374 0 0 0 374 EDGEWATER PARK TOWNSHIP 50870 BURLINGTON 82,304 0 0 82,304 63,941 0 0 0 63,941 EDGEWATER PARK TWP BD OF ED 50873 BURLINGTON 191,737 0 0 191,737 166,086 0 0 0 166,086 EVESHAM MUN. UTILITIES AUTH 31430 BURLINGTON 311,598 0 0 311,598 283,150 0 0 0 283,150 EVESHAM TOWNSHIP 50960 BURLINGTON 551,500 0 0 551,500 516,204 0 1,101 4,061 521,366 EVESHAM TWP BD OF ED 50963 BURLINGTON 1,195,679 0 0 1,195,679 1,052,391 0 0 0 1,052,391 FIELDSBORO BOROUGH 51010 BURLINGTON 6,571 0 0 6,571 6,021 0 0 0 6,021 FLORENCE TOWNSHIP 21860 BURLINGTON 297,793 0 0 297,793 283,652 0 0 0 283,652 FLORENCE TOWNSHIP BD OF ED 21863 BURLINGTON 311,822 0 0 311,822 298,983 0 0 0 298,983 FLORENCE TWP HOUSING AUTHORITY 56440 BURLINGTON 9,684 0 0 9,684 8,723 0 0 0 8,723 FLORENCE TWP. FIRE DIST. #1 35270 BURLINGTON 27,182 0 0 27,182 24,446 0 0 0 24,446 HAINESPORT TOWNSHIP 51280 BURLINGTON 66,394 0 0 66,394 61,335 0 0 0 61,335 HAINESPORT TOWNSHIP BD OF ED 51283 BURLINGTON 80,361 0 0 80,361 72,574 0 0 0 72,574 LENAPE REGIONAL H S DISTRICT 40420 BURLINGTON 1,620,546 0 0 1,620,546 1,454,625 0 0 0 1,454,625 LUMBERTON TOWNSHIP 51910 BURLINGTON 135,243 0 0 135,243 114,541 0 0 0 114,541 LUMBERTON TWP BD OF ED 51913 BURLINGTON 250,611 0 0 250,611 246,866 0 0 0 246,866 MANSFIELD TOWNSHIP (BURLINGTON) 23540 BURLINGTON 115,175 0 0 115,175 96,864 0 0 0 96,864 MANSFIELD TWP BD ED (BURLINGTN) 23543 BURLINGTON 127,916 0 0 127,916 104,658 0 0 0 104,658 MAPLE SHADE BD OF ED 21873 BURLINGTON 416,390 0 0 416,390 379,490 0 0 0 379,490 MAPLE SHADE TOWNSHIP 21870 BURLINGTON 210,239 0 0 210,239 208,567 0 0 0 208,567 MEDFORD LAKES BORO BD OF ED 52083 BURLINGTON 51,551 0 0 51,551 46,188 0 0 0 46,188 MEDFORD LAKES BOROUGH 52080 BURLINGTON 78,145 0 0 78,145 68,656 0 0 0 68,656 MEDFORD TOWNSHIP 52070 BURLINGTON 269,894 0 0 269,894 267,421 0 (510) (1,841) 265,070 MEDFORD TOWNSHIP BD OF ED 52073 BURLINGTON 462,563 0 0 462,563 418,712 0 0 0 418,712 MOORESTOWN TOWNSHIP 21890 BURLINGTON 632,086 1,786 6,407 640,279 600,596 0 3,209 11,832 615,637 MOORESTOWN TOWNSHIP BD OF ED 21893 BURLINGTON 714,825 0 0 714,825 625,066 0 0 0 625,066 MOORESTOWN TWP FIRE DISTRICT 1 56330 BURLINGTON 63,136 0 0 63,136 56,330 0 0 0 56,330 MOORESTOWN TWP FIRE DISTRICT 2 56410 BURLINGTON 22,082 0 0 22,082 17,086 0 0 0 17,086 MOUNT HOLLY MUN UTIL AUTH 30540 BURLINGTON 392,948 0 0 392,948 371,941 0 0 0 371,941 MOUNT HOLLY TOWNSHIP 21900 BURLINGTON 99,759 0 0 99,759 109,970 0 0 0 109,970 MOUNT HOLLY TWP BD OF ED 21903 BURLINGTON 177,045 0 0 177,045 172,525 0 0 0 172,525 MOUNT LAUREL FIRE DISTRICT #1 34370 BURLINGTON 46,162 0 0 46,162 39,751 0 0 0 39,751 MOUNT LAUREL TOWNSHIP 23430 BURLINGTON 607,076 0 0 607,076 521,971 0 0 0 521,971 MOUNT LAUREL TWP BD OF ED 23433 BURLINGTON 974,624 0 0 974,624 912,540 0 0 0 912,540 MOUNT LAUREL TWP MUN UTIL AUTH 31580 BURLINGTON 399,655 0 0 399,655 364,149 0 0 0 364,149 NEW HANOVER TOWNSHIP 52370 BURLINGTON 20,404 0 0 20,404 18,936 0 0 0 18,936 NEW HANOVER TWP BD OF ED 57530 BURLINGTON 36,346 0 0 36,346 33,821 0 0 0 33,821 NORTH HANOVER TOWNSHIP 52430 BURLINGTON 35,353 0 0 35,353 46,020 0 0 0 46,020 NORTH HANOVER TOWNSHIP BD OF ED 52433 BURLINGTON 320,018 0 0 320,018 302,688 0 0 0 302,688 NORTHERN BURLINGTON CO REG 40210 BURLINGTON 396,847 0 0 396,847 385,343 0 0 0 385,343 PALMYRA BOROUGH 20320 BURLINGTON 96,990 0 0 96,990 83,986 0 0 0 83,986 PALMYRA BOROUGH BD OF ED 20323 BURLINGTON 162,550 0 0 162,550 131,803 0 0 0 131,803 PEMBERTON BOROUGH 52590 BURLINGTON 45,743 0 0 45,743 42,141 0 0 0 42,141 PEMBERTON TOWNSHIP 52600 BURLINGTON 498,468 0 0 498,468 446,504 0 0 0 446,504 PEMBERTON TOWNSHIP BD OF ED 52603 BURLINGTON 1,755,348 0 0 1,755,348 1,576,601 0 2,242 9,138 1,587,981 PEMBERTON TWP MUN UTIL AUTH 32020 BURLINGTON 74,189 0 0 74,189 74,865 0 0 0 74,865
Page 26

Public Employee's Retirement SystemSchedule A - Schedule of Local Employer Contributions used toDetermine the Fiscal Year 2013 and Fiscal Year 2014 Proportionate Shares
Employer EmployerEmployer Employer Number County Contributions Contributions
Contributions for Fiscal Year 2014 Proportionate Shares Contributions for Fiscal Year 2013 Proportionate Shares
Fiscal Year 2015
Appropriation
Employer delayed
appropriations
Employer Contribution –
delayed enrollment
Fiscal Year 2014
AppropriationLate Reporting
Employers
Employer delayed
appropriations
Employer Contribution –
delayed enrollment
RANCOCAS VALLEY REGIONAL H S 40220 BURLINGTON 308,503 0 0 308,503 271,187 0 0 0 271,187 RENAISSANCE REG LEADERSHIP CHTR 48800 BURLINGTON 31,907 0 0 31,907 34,406 0 0 0 34,406 RIVERBANK CHTR SCHL OF EXCELL. 48500 BURLINGTON 15,377 0 0 15,377 4,205 0 0 0 4,205 RIVERSIDE SEW AUTHORITY 30330 BURLINGTON 45,230 0 0 45,230 51,371 0 0 0 51,371 RIVERSIDE TOWNSHIP 21920 BURLINGTON 64,273 9,056 32,649 105,978 69,715 0 0 0 69,715 RIVERSIDE TOWNSHIP BD OF ED 21923 BURLINGTON 237,845 0 0 237,845 209,654 0 0 0 209,654 RIVERTON BORO SCHOOL BOARD 52873 BURLINGTON 28,565 0 0 28,565 25,926 0 0 0 25,926 RIVERTON BOROUGH 52870 BURLINGTON 59,293 0 0 59,293 54,190 0 0 0 54,190 SHAMONG TOWNSHIP 53010 BURLINGTON 64,287 0 0 64,287 49,863 0 0 0 49,863 SHAMONG TWP BD OF ED 53013 BURLINGTON 158,600 0 0 158,600 143,647 0 0 0 143,647 SOUTHAMPTON TOWNSHIP 53080 BURLINGTON 148,095 0 0 148,095 124,379 0 0 0 124,379 SOUTHAMPTON TWP BD OF ED 53083 BURLINGTON 112,606 0 0 112,606 100,412 0 0 0 100,412 SPRINGFIELD TOWNSHIP(BURL) 53170 BURLINGTON 30,580 0 0 30,580 29,278 0 0 0 29,278 SPRINGFIELD TWP BD OF ED (BURL) 53173 BURLINGTON 43,783 0 0 43,783 43,883 0 0 0 43,883 TABERNACLE TOWNSHIP 53280 BURLINGTON 85,266 0 0 85,266 74,088 0 0 0 74,088 TABERNACLE TWP BD OF ED 53283 BURLINGTON 170,866 0 0 170,866 0 173,656 0 0 173,656 WASHINGTON TWP (BURLINGTON) 53550 BURLINGTON 3,670 0 0 3,670 6,361 0 0 0 6,361 WASHINGTON TWP BD OF ED (BURL) 53553 BURLINGTON 12,991 0 0 12,991 11,080 0 0 0 11,080 WESTAMPTON TOWNSHIP 23240 BURLINGTON 228,443 0 0 228,443 185,973 0 2,615 9,639 198,227 WESTAMPTON TOWNSHIP BD OF ED 23243 BURLINGTON 171,238 0 0 171,238 158,936 0 0 0 158,936 WILLINGBORO MUN UTIL AUTHORITY 30650 BURLINGTON 254,538 0 0 254,538 235,702 0 0 0 235,702 WILLINGBORO TOWNSHIP 22500 BURLINGTON 725,555 0 0 725,555 646,512 0 0 0 646,512 WILLINGBORO TWP BD OF ED 22503 BURLINGTON 747,348 1,082 3,881 752,312 716,531 0 0 0 716,531 WOODLAND TOWNSHIP 53820 BURLINGTON 19,924 0 0 19,924 19,321 0 0 0 19,321 WOODLAND TWP BD OF ED 53823 BURLINGTON 38,889 2,500 8,967 50,356 36,835 0 0 0 36,835 WRIGHTSTOWN BOROUGH 53850 BURLINGTON 33,769 0 0 33,769 24,991 0 0 0 24,991 WRIGHTSTOWN MUN UTIL AUTH 55880 BURLINGTON 16,025 0 0 16,025 22,269 0 0 0 22,269 AUDUBON BOROUGH 50130 CAMDEN 153,642 0 0 153,642 138,231 0 0 0 138,231 AUDUBON BOROUGH BD OF ED 50133 CAMDEN 250,750 0 0 250,750 232,032 0 0 0 232,032 AUDUBON PARK BOROUGH 50140 CAMDEN 9,694 0 0 9,694 0 10,091 0 0 10,091 BARRINGTON BORO BD OF ED 22613 CAMDEN 76,966 0 0 76,966 68,498 0 0 0 68,498 BARRINGTON BOROUGH 22610 CAMDEN 125,979 0 0 125,979 111,338 0 0 0 111,338 BELLMAWR BOROUGH 50230 CAMDEN 295,902 7,017 25,170 328,089 277,473 0 0 0 277,473 BELLMAWR BOROUGH BD OF ED 50233 CAMDEN 141,341 0 0 141,341 115,090 0 0 0 115,090 BERLIN BOROUGH 22990 CAMDEN 174,842 0 0 174,842 161,214 0 0 0 161,214 BERLIN BOROUGH BD OF ED 22993 CAMDEN 89,920 0 0 89,920 87,441 0 0 0 87,441 BERLIN TOWNSHIP 23220 CAMDEN 186,680 0 0 186,680 161,367 0 0 0 161,367 BERLIN TOWNSHIP BD OF ED 23223 CAMDEN 80,872 0 0 80,872 73,771 0 0 0 73,771 BLACK HORSE PIKE REG SCH DIST 40230 CAMDEN 793,774 0 0 793,774 738,328 0 0 0 738,328 BROOKLAWN BORO BD OF ED 50413 CAMDEN 50,079 0 0 50,079 42,314 0 0 0 42,314 BROOKLAWN BOROUGH 50410 CAMDEN 63,366 0 0 63,366 59,767 0 0 0 59,767 CAMDEN ACADEMY CHARTER HIGH SCH 40000 CAMDEN 39,427 0 0 39,427 30,591 0 0 0 30,591 CAMDEN CITY 21850 CAMDEN 2,118,806 0 0 2,118,806 1,790,020 0 0 0 1,790,020 CAMDEN CITY BD OF ED 21853 CAMDEN 4,023,658 1,170 4,198 4,029,026 3,818,615 0 3,131 11,230 3,832,976 CAMDEN CITY HOUSING AUTHORITY 30570 CAMDEN 436,057 0 0 436,057 402,670 0 0 0 402,670 CAMDEN CITY PARK AUTHORITY 32780 CAMDEN 141,323 0 0 141,323 136,518 0 0 0 136,518 CAMDEN CITY REDEVELOPMENT AGNCY 36500 CAMDEN 96,564 0 0 96,564 94,931 0 0 0 94,931 CAMDEN CO BD OF CHOSEN FRHLDRS 10130 CAMDEN 6,409,206 1,511 5,455 6,416,172 6,077,180 0 0 0 6,077,180 CAMDEN CO BD OF SOCIAL SRV 10131 CAMDEN 4,245,327 0 0 4,245,327 3,702,976 0 0 0 3,702,976 CAMDEN CO ED SERVICES COMM 32840 CAMDEN 108,491 0 0 108,491 87,305 0 0 0 87,305 CAMDEN CO HEALTH SERVICES CTR 34630 CAMDEN 2,870,643 0 0 2,870,643 2,826,003 0 0 0 2,826,003 CAMDEN CO IMPROVEMENT AUTHORITY 34270 CAMDEN 187,179 0 0 187,179 100,549 0 0 0 100,549 CAMDEN CO MUN UTIL AUTHORITY 32010 CAMDEN 913,312 0 0 913,312 804,362 0 0 0 804,362 CAMDEN CO POLLUTION CONTROL FIN 34760 CAMDEN 121,392 0 0 121,392 131,994 0 0 0 131,994 CAMDEN CO SOIL CONSERVATN DIST 33000 CAMDEN 32,071 0 0 32,071 28,812 0 0 0 28,812 CAMDEN COUNTY COLLEGE 31080 CAMDEN 1,998,511 0 0 1,998,511 1,802,622 0 0 0 1,802,622 CAMDEN COUNTY TECHNICAL SCHOOLS 10133 CAMDEN 592,970 0 0 592,970 531,520 0 0 0 531,520 CAMDEN'S PRIDE CHARTER SCHOOL 47800 CAMDEN 17,196 0 0 17,196 17,701 0 0 0 17,701 CAMDENS PROMISE CHARTER SCHOOL 35650 CAMDEN 18,843 0 0 18,843 24,712 0 0 0 24,712 CHERRY HILL FIRE DIST 13 35100 CAMDEN 302,732 0 0 302,732 265,964 0 0 0 265,964 CHERRY HILL TOWNSHIP 23010 CAMDEN 1,187,017 0 0 1,187,017 1,073,924 0 0 0 1,073,924
Page 27
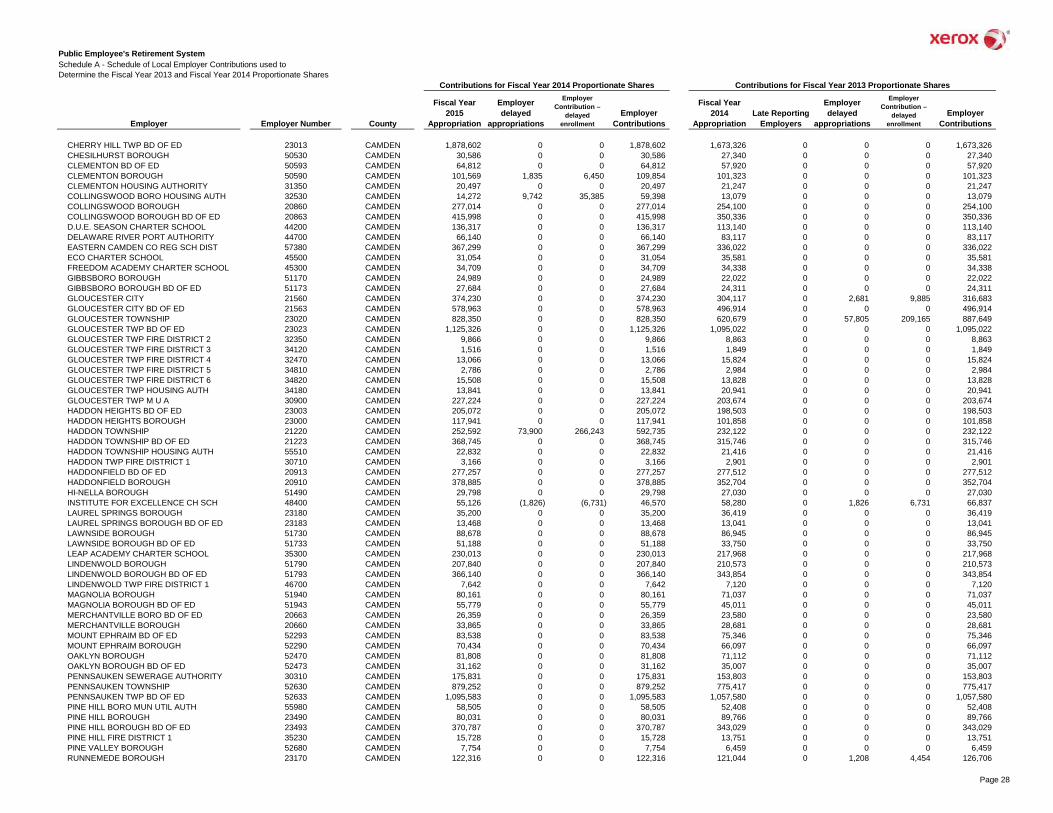
Public Employee's Retirement SystemSchedule A - Schedule of Local Employer Contributions used toDetermine the Fiscal Year 2013 and Fiscal Year 2014 Proportionate Shares
Employer EmployerEmployer Employer Number County Contributions Contributions
Contributions for Fiscal Year 2014 Proportionate Shares Contributions for Fiscal Year 2013 Proportionate Shares
Fiscal Year 2015
Appropriation
Employer delayed
appropriations
Employer Contribution –
delayed enrollment
Fiscal Year 2014
AppropriationLate Reporting
Employers
Employer delayed
appropriations
Employer Contribution –
delayed enrollment
CHERRY HILL TWP BD OF ED 23013 CAMDEN 1,878,602 0 0 1,878,602 1,673,326 0 0 0 1,673,326 CHESILHURST BOROUGH 50530 CAMDEN 30,586 0 0 30,586 27,340 0 0 0 27,340 CLEMENTON BD OF ED 50593 CAMDEN 64,812 0 0 64,812 57,920 0 0 0 57,920 CLEMENTON BOROUGH 50590 CAMDEN 101,569 1,835 6,450 109,854 101,323 0 0 0 101,323 CLEMENTON HOUSING AUTHORITY 31350 CAMDEN 20,497 0 0 20,497 21,247 0 0 0 21,247 COLLINGSWOOD BORO HOUSING AUTH 32530 CAMDEN 14,272 9,742 35,385 59,398 13,079 0 0 0 13,079 COLLINGSWOOD BOROUGH 20860 CAMDEN 277,014 0 0 277,014 254,100 0 0 0 254,100 COLLINGSWOOD BOROUGH BD OF ED 20863 CAMDEN 415,998 0 0 415,998 350,336 0 0 0 350,336 D.U.E. SEASON CHARTER SCHOOL 44200 CAMDEN 136,317 0 0 136,317 113,140 0 0 0 113,140 DELAWARE RIVER PORT AUTHORITY 44700 CAMDEN 66,140 0 0 66,140 83,117 0 0 0 83,117 EASTERN CAMDEN CO REG SCH DIST 57380 CAMDEN 367,299 0 0 367,299 336,022 0 0 0 336,022 ECO CHARTER SCHOOL 45500 CAMDEN 31,054 0 0 31,054 35,581 0 0 0 35,581 FREEDOM ACADEMY CHARTER SCHOOL 45300 CAMDEN 34,709 0 0 34,709 34,338 0 0 0 34,338 GIBBSBORO BOROUGH 51170 CAMDEN 24,989 0 0 24,989 22,022 0 0 0 22,022 GIBBSBORO BOROUGH BD OF ED 51173 CAMDEN 27,684 0 0 27,684 24,311 0 0 0 24,311 GLOUCESTER CITY 21560 CAMDEN 374,230 0 0 374,230 304,117 0 2,681 9,885 316,683 GLOUCESTER CITY BD OF ED 21563 CAMDEN 578,963 0 0 578,963 496,914 0 0 0 496,914 GLOUCESTER TOWNSHIP 23020 CAMDEN 828,350 0 0 828,350 620,679 0 57,805 209,165 887,649 GLOUCESTER TWP BD OF ED 23023 CAMDEN 1,125,326 0 0 1,125,326 1,095,022 0 0 0 1,095,022 GLOUCESTER TWP FIRE DISTRICT 2 32350 CAMDEN 9,866 0 0 9,866 8,863 0 0 0 8,863 GLOUCESTER TWP FIRE DISTRICT 3 34120 CAMDEN 1,516 0 0 1,516 1,849 0 0 0 1,849 GLOUCESTER TWP FIRE DISTRICT 4 32470 CAMDEN 13,066 0 0 13,066 15,824 0 0 0 15,824 GLOUCESTER TWP FIRE DISTRICT 5 34810 CAMDEN 2,786 0 0 2,786 2,984 0 0 0 2,984 GLOUCESTER TWP FIRE DISTRICT 6 34820 CAMDEN 15,508 0 0 15,508 13,828 0 0 0 13,828 GLOUCESTER TWP HOUSING AUTH 34180 CAMDEN 13,841 0 0 13,841 20,941 0 0 0 20,941 GLOUCESTER TWP M U A 30900 CAMDEN 227,224 0 0 227,224 203,674 0 0 0 203,674 HADDON HEIGHTS BD OF ED 23003 CAMDEN 205,072 0 0 205,072 198,503 0 0 0 198,503 HADDON HEIGHTS BOROUGH 23000 CAMDEN 117,941 0 0 117,941 101,858 0 0 0 101,858 HADDON TOWNSHIP 21220 CAMDEN 252,592 73,900 266,243 592,735 232,122 0 0 0 232,122 HADDON TOWNSHIP BD OF ED 21223 CAMDEN 368,745 0 0 368,745 315,746 0 0 0 315,746 HADDON TOWNSHIP HOUSING AUTH 55510 CAMDEN 22,832 0 0 22,832 21,416 0 0 0 21,416 HADDON TWP FIRE DISTRICT 1 30710 CAMDEN 3,166 0 0 3,166 2,901 0 0 0 2,901 HADDONFIELD BD OF ED 20913 CAMDEN 277,257 0 0 277,257 277,512 0 0 0 277,512 HADDONFIELD BOROUGH 20910 CAMDEN 378,885 0 0 378,885 352,704 0 0 0 352,704 HI-NELLA BOROUGH 51490 CAMDEN 29,798 0 0 29,798 27,030 0 0 0 27,030 INSTITUTE FOR EXCELLENCE CH SCH 48400 CAMDEN 55,126 (1,826) (6,731) 46,570 58,280 0 1,826 6,731 66,837 LAUREL SPRINGS BOROUGH 23180 CAMDEN 35,200 0 0 35,200 36,419 0 0 0 36,419 LAUREL SPRINGS BOROUGH BD OF ED 23183 CAMDEN 13,468 0 0 13,468 13,041 0 0 0 13,041 LAWNSIDE BOROUGH 51730 CAMDEN 88,678 0 0 88,678 86,945 0 0 0 86,945 LAWNSIDE BOROUGH BD OF ED 51733 CAMDEN 51,188 0 0 51,188 33,750 0 0 0 33,750 LEAP ACADEMY CHARTER SCHOOL 35300 CAMDEN 230,013 0 0 230,013 217,968 0 0 0 217,968 LINDENWOLD BOROUGH 51790 CAMDEN 207,840 0 0 207,840 210,573 0 0 0 210,573 LINDENWOLD BOROUGH BD OF ED 51793 CAMDEN 366,140 0 0 366,140 343,854 0 0 0 343,854 LINDENWOLD TWP FIRE DISTRICT 1 46700 CAMDEN 7,642 0 0 7,642 7,120 0 0 0 7,120 MAGNOLIA BOROUGH 51940 CAMDEN 80,161 0 0 80,161 71,037 0 0 0 71,037 MAGNOLIA BOROUGH BD OF ED 51943 CAMDEN 55,779 0 0 55,779 45,011 0 0 0 45,011 MERCHANTVILLE BORO BD OF ED 20663 CAMDEN 26,359 0 0 26,359 23,580 0 0 0 23,580 MERCHANTVILLE BOROUGH 20660 CAMDEN 33,865 0 0 33,865 28,681 0 0 0 28,681 MOUNT EPHRAIM BD OF ED 52293 CAMDEN 83,538 0 0 83,538 75,346 0 0 0 75,346 MOUNT EPHRAIM BOROUGH 52290 CAMDEN 70,434 0 0 70,434 66,097 0 0 0 66,097 OAKLYN BOROUGH 52470 CAMDEN 81,808 0 0 81,808 71,112 0 0 0 71,112 OAKLYN BOROUGH BD OF ED 52473 CAMDEN 31,162 0 0 31,162 35,007 0 0 0 35,007 PENNSAUKEN SEWERAGE AUTHORITY 30310 CAMDEN 175,831 0 0 175,831 153,803 0 0 0 153,803 PENNSAUKEN TOWNSHIP 52630 CAMDEN 879,252 0 0 879,252 775,417 0 0 0 775,417 PENNSAUKEN TWP BD OF ED 52633 CAMDEN 1,095,583 0 0 1,095,583 1,057,580 0 0 0 1,057,580 PINE HILL BORO MUN UTIL AUTH 55980 CAMDEN 58,505 0 0 58,505 52,408 0 0 0 52,408 PINE HILL BOROUGH 23490 CAMDEN 80,031 0 0 80,031 89,766 0 0 0 89,766 PINE HILL BOROUGH BD OF ED 23493 CAMDEN 370,787 0 0 370,787 343,029 0 0 0 343,029 PINE HILL FIRE DISTRICT 1 35230 CAMDEN 15,728 0 0 15,728 13,751 0 0 0 13,751 PINE VALLEY BOROUGH 52680 CAMDEN 7,754 0 0 7,754 6,459 0 0 0 6,459 RUNNEMEDE BOROUGH 23170 CAMDEN 122,316 0 0 122,316 121,044 0 1,208 4,454 126,706
Page 28

Public Employee's Retirement SystemSchedule A - Schedule of Local Employer Contributions used toDetermine the Fiscal Year 2013 and Fiscal Year 2014 Proportionate Shares
Employer EmployerEmployer Employer Number County Contributions Contributions
Contributions for Fiscal Year 2014 Proportionate Shares Contributions for Fiscal Year 2013 Proportionate Shares
Fiscal Year 2015
Appropriation
Employer delayed
appropriations
Employer Contribution –
delayed enrollment
Fiscal Year 2014
AppropriationLate Reporting
Employers
Employer delayed
appropriations
Employer Contribution –
delayed enrollment
RUNNEMEDE BOROUGH BD OF ED 23173 CAMDEN 133,472 0 0 133,472 117,991 0 0 0 117,991 SOMERDALE BORO BD OF ED 22443 CAMDEN 37,790 0 0 37,790 37,224 0 0 0 37,224 SOMERDALE BOROUGH 22440 CAMDEN 96,346 0 0 96,346 97,733 0 0 0 97,733 STERLING HIGH SCHOOL DISTRICT 57260 CAMDEN 397,928 2,189 7,853 407,971 349,159 0 0 0 349,159 STRATFORD BD OF ED 22793 CAMDEN 142,609 0 0 142,609 135,898 0 0 0 135,898 STRATFORD BOROUGH 22790 CAMDEN 88,751 0 0 88,751 84,140 0 0 0 84,140 TAVISTOCK BOROUGH 53290 CAMDEN 7,916 0 0 7,916 6,860 0 0 0 6,860 THE KINGDOM CH SCHL LEADERSHIP 50100 CAMDEN 10,609 0 0 10,609 0 0 0 0 0 VOORHEES FIRE DISTRICT 35170 CAMDEN 93,243 0 0 93,243 72,772 0 0 0 72,772 VOORHEES TOWNSHIP 53460 CAMDEN 606,363 0 0 606,363 543,441 0 0 0 543,441 VOORHEES TWP BD OF ED 53463 CAMDEN 549,610 0 0 549,610 473,185 0 0 0 473,185 WATERFORD TOWNSHIP 53600 CAMDEN 174,680 0 0 174,680 169,127 0 0 0 169,127 WATERFORD TWP BD OF ED 53603 CAMDEN 129,619 0 0 129,619 119,748 0 0 0 119,748 WINSLOW TOWNSHIP 23400 CAMDEN 702,582 0 0 702,582 586,641 0 0 0 586,641 WINSLOW TOWNSHIP BD OF ED 23403 CAMDEN 547,702 0 0 547,702 485,567 0 0 0 485,567 WINSLOW TWP FIRE DISTRICT 1 34720 CAMDEN 39,455 0 0 39,455 35,580 0 0 0 35,580 WOODLYNNE BD OF ED 20333 CAMDEN 44,689 0 0 44,689 36,055 0 0 0 36,055 WOODLYNNE BOROUGH 20330 CAMDEN 56,225 0 0 56,225 51,794 0 0 0 51,794 AVALON BOROUGH 23500 CAPE MAY 482,905 0 0 482,905 442,128 0 0 0 442,128 AVALON BOROUGH BD OF ED 23503 CAPE MAY 33,303 0 0 33,303 27,274 0 0 0 27,274 CAPE MAY CITY 23060 CAPE MAY 379,982 0 0 379,982 329,006 0 0 0 329,006 CAPE MAY CITY BD OF ED 23063 CAPE MAY 15,294 0 0 15,294 29,790 0 0 0 29,790 CAPE MAY CITY HOUSING AUTHORITY 55480 CAPE MAY 11,607 0 0 11,607 8,758 0 0 0 8,758 CAPE MAY CO BD SOCIAL SERVICES 10121 CAPE MAY 390,378 0 0 390,378 367,958 0 0 0 367,958 CAPE MAY CO BRIDGE COMM 55130 CAPE MAY 135,701 0 0 135,701 121,912 0 0 0 121,912 CAPE MAY CO SPECIAL SERVICES 40500 CAPE MAY 365,385 0 0 365,385 329,852 0 0 0 329,852 CAPE MAY CO TECHNICAL SCH DIST 10123 CAPE MAY 221,409 0 0 221,409 205,899 0 0 0 205,899 CAPE MAY COUNTY 10120 CAPE MAY 3,919,502 0 0 3,919,502 3,646,838 0 0 0 3,646,838 CAPE MAY COUNTY MUN UTIL AUTH 32200 CAPE MAY 1,222,788 0 0 1,222,788 1,109,934 0 0 0 1,109,934 CAPE MAY POINT BOROUGH 50490 CAPE MAY 17,436 0 0 17,436 29,016 0 0 0 29,016 CHARTER TECH 35480 CAPE MAY 36,129 0 0 36,129 40,707 0 0 0 40,707 DENNIS TOWNSHIP 50730 CAPE MAY 129,007 0 0 129,007 130,537 0 0 0 130,537 DENNIS TWP BD OF ED 50733 CAPE MAY 162,952 0 0 162,952 149,334 0 0 0 149,334 GREATER WILDWOOD TOUR.IMP & DA 35150 CAPE MAY 82,635 0 0 82,635 77,650 0 0 0 77,650 LOWER CAPE MAY REG SCHOOL DIST 40240 CAPE MAY 420,296 0 0 420,296 407,077 0 0 0 407,077 LOWER TOWNSHIP 51880 CAPE MAY 577,202 0 0 577,202 496,562 0 0 0 496,562 LOWER TOWNSHIP BD OF ED 23803 CAPE MAY 478,287 0 0 478,287 441,649 0 0 0 441,649 LOWER TWP MUNICIPAL UTIL AUTH 31630 CAPE MAY 138,157 0 0 138,157 123,023 0 0 0 123,023 MIDDLE TOWNSHIP 23190 CAPE MAY 358,914 0 0 358,914 326,762 0 233 821 327,816 MIDDLE TOWNSHIP BD OF ED 23193 CAPE MAY 446,797 0 0 446,797 448,582 0 0 0 448,582 MIDDLE TOWNSHIP FIRE DIST #1 44600 CAPE MAY 15,502 0 0 15,502 19,618 0 0 0 19,618 NORTH WILDWOOD BD OF ED 20603 CAPE MAY 79,661 0 0 79,661 68,658 0 0 0 68,658 NORTH WILDWOOD CITY 20600 CAPE MAY 333,310 0 0 333,310 303,759 0 0 0 303,759 OCEAN CITY 20820 CAPE MAY 1,355,417 0 0 1,355,417 1,181,316 0 0 0 1,181,316 OCEAN CITY BD OF ED 20823 CAPE MAY 412,835 0 0 412,835 396,889 0 0 0 396,889 OCEAN CITY HOUSING AUTHORITY 31000 CAPE MAY 20,106 17,309 60,830 98,245 18,042 0 0 0 18,042 SEA ISLE CITY 23080 CAPE MAY 616,976 0 0 616,976 547,466 0 0 0 547,466 SEA ISLE CITY BD OF ED 23083 CAPE MAY 0 0 0 0 12,079 0 0 0 12,079 STONE HARBOR BD OF ED 22873 CAPE MAY 13,209 0 0 13,209 14,200 0 0 0 14,200 STONE HARBOR BOROUGH 22870 CAPE MAY 324,393 0 0 324,393 284,191 0 0 0 284,191 UPPER TOWNSHIP 53370 CAPE MAY 427,828 7,870 29,311 465,009 388,198 0 0 0 388,198 UPPER TOWNSHIP BD OF ED 53373 CAPE MAY 221,229 0 0 221,229 197,099 0 0 0 197,099 WEST CAPE MAY BORO BD OF ED 23413 CAPE MAY 5,687 0 0 5,687 8,694 0 0 0 8,694 WEST CAPE MAY BOROUGH 23410 CAPE MAY 45,479 0 0 45,479 38,610 0 0 0 38,610 WEST WILDWOOD BOROUGH 53710 CAPE MAY 22,131 0 0 22,131 9,310 0 0 0 9,310 WILDWOOD CITY 20210 CAPE MAY 614,170 0 0 614,170 590,869 0 0 0 590,869 WILDWOOD CITY BD OF ED 20213 CAPE MAY 209,616 0 0 209,616 182,570 0 0 0 182,570 WILDWOOD CITY HOUSING AUTHORITY 31600 CAPE MAY 28,424 0 0 28,424 22,269 0 0 0 22,269 WILDWOOD CREST BD OF ED 20513 CAPE MAY 61,385 0 0 61,385 59,685 0 0 0 59,685 WILDWOOD CREST BOROUGH 20510 CAPE MAY 287,168 0 0 287,168 271,079 0 0 0 271,079 WOODBINE BOROUGH 53780 CAPE MAY 26,738 0 0 26,738 26,683 0 0 0 26,683
Page 29

Public Employee's Retirement SystemSchedule A - Schedule of Local Employer Contributions used toDetermine the Fiscal Year 2013 and Fiscal Year 2014 Proportionate Shares
Employer EmployerEmployer Employer Number County Contributions Contributions
Contributions for Fiscal Year 2014 Proportionate Shares Contributions for Fiscal Year 2013 Proportionate Shares
Fiscal Year 2015
Appropriation
Employer delayed
appropriations
Employer Contribution –
delayed enrollment
Fiscal Year 2014
AppropriationLate Reporting
Employers
Employer delayed
appropriations
Employer Contribution –
delayed enrollment
WOODBINE BOROUGH BD OF ED 53783 CAPE MAY 25,693 0 0 25,693 19,802 0 1,365 5,033 26,200 WOODBINE MUNICIPAL UTIL AUTH 31560 CAPE MAY 8,664 0 0 8,664 8,157 0 0 0 8,157 BRIDGETON BD OF ED 20793 CUMBERLAND 1,280,929 0 0 1,280,929 1,089,726 0 0 0 1,089,726 BRIDGETON CITY 20790 CUMBERLAND 591,401 0 0 591,401 515,109 0 0 0 515,109 BRIDGETON CITY HOUSING AUTH 31190 CUMBERLAND 83,651 0 0 83,651 67,959 0 0 0 67,959 COMMERCIAL TOWNSHIP 50630 CUMBERLAND 54,660 0 0 54,660 56,233 0 0 0 56,233 COMMERCIAL TWP BD OF ED 50633 CUMBERLAND 73,522 0 0 73,522 77,015 0 0 0 77,015 CUMBERLAND CO IMPROVEMENT AUTH 34190 CUMBERLAND 193,460 0 0 193,460 193,113 0 0 0 193,113 CUMBERLAND CO BD OF VOC ED 10143 CUMBERLAND 152,913 0 0 152,913 153,922 0 0 0 153,922 CUMBERLAND CO BD SOCIAL SERV 10141 CUMBERLAND 1,273,139 0 0 1,273,139 1,133,556 0 0 0 1,133,556 CUMBERLAND CO UTILITIES AUTH 32210 CUMBERLAND 200,938 0 0 200,938 178,587 0 0 0 178,587 CUMBERLAND COUNTY 10140 CUMBERLAND 2,874,928 0 0 2,874,928 2,871,164 0 0 0 2,871,164 CUMBERLAND COUNTY COLLEGE 55600 CUMBERLAND 727,432 0 0 727,432 661,593 0 0 0 661,593 CUMBERLAND REGIONAL SCHOOL DIST 57590 CUMBERLAND 210,144 0 0 210,144 172,790 0 0 0 172,790 CUMBERLAND-SALEM CONSERV. DIST. 45000 CUMBERLAND 7,517 0 0 7,517 6,888 0 0 0 6,888 DEERFIELD TOWNSHIP 50670 CUMBERLAND 40,265 0 0 40,265 32,224 0 0 0 32,224 DEERFIELD TOWNSHIP BD OF ED 50673 CUMBERLAND 36,453 0 0 36,453 32,529 0 0 0 32,529 DOWNE TOWNSHIP 50760 CUMBERLAND 15,117 0 0 15,117 11,824 0 0 0 11,824 DOWNE TWP BD OF ED 50763 CUMBERLAND 49,612 0 0 49,612 47,303 0 0 0 47,303 FAIRFIELD TOWNSHIP (CUMBERLAND) 50970 CUMBERLAND 28,362 8,575 30,135 67,072 23,986 0 0 0 23,986 FAIRFIELD TWP BD ED (CUMBERLND) 50973 CUMBERLAND 77,468 0 0 77,468 73,583 0 0 0 73,583 GREENWICH TOWNSHIP (CUMBERLAND) 51230 CUMBERLAND 2,700 0 0 2,700 3,913 0 0 0 3,913 GREENWICH TWP BD ED (CUMBRLAND) 51233 CUMBERLAND 8,591 0 0 8,591 7,695 0 0 0 7,695 HOPEWELL TOWNSHIP (CUMBERLAND) 51550 CUMBERLAND 55,086 0 0 55,086 53,829 0 0 0 53,829 HOPEWELL TWP BD ED (CUMBERLAND) 51553 CUMBERLAND 36,743 0 0 36,743 32,982 0 0 0 32,982 LAWRENCE TOWNSHIP (CUMBERLAND) 51740 CUMBERLAND 38,319 0 0 38,319 38,588 0 0 0 38,588 LAWRENCE TWP BD ED (CUMBERLAND) 51743 CUMBERLAND 58,534 0 0 58,534 53,799 0 0 0 53,799 MAURICE RIVER TOWNSHIP 52060 CUMBERLAND 67,223 0 0 67,223 53,169 0 0 0 53,169 MAURICE RIVER TOWNSHIP BD OF ED 52063 CUMBERLAND 71,060 0 0 71,060 65,104 0 0 0 65,104 MILLVILLE BD OF ED 21143 CUMBERLAND 1,503,650 0 0 1,503,650 1,327,428 0 0 0 1,327,428 MILLVILLE CITY 21140 CUMBERLAND 707,697 0 0 707,697 625,585 0 0 0 625,585 MILLVILLE HOUSING AUTHORITY 31070 CUMBERLAND 136,474 0 0 136,474 107,342 0 0 0 107,342 MILLVILLE PUBLIC CHARTER SCHOOL 50200 CUMBERLAND 7,242 0 0 7,242 0 0 0 0 0 SHILOH BOROUGH 35220 CUMBERLAND 2,302 0 0 2,302 2,109 0 0 0 2,109 STOW CREEK TOWNSHIP 53230 CUMBERLAND 7,870 0 0 7,870 7,063 0 0 0 7,063 STOW CREEK TOWNSHIP BD OF ED 53233 CUMBERLAND 17,267 0 0 17,267 15,469 0 0 0 15,469 UPPER DEERFIELD TOWNSHIP 53380 CUMBERLAND 117,844 0 0 117,844 106,302 0 0 0 106,302 UPPER DEERFIELD TWP BD OF ED 53383 CUMBERLAND 196,144 0 0 196,144 186,660 0 0 0 186,660 VINELAND CITY 20300 CUMBERLAND 2,837,737 0 0 2,837,737 2,553,604 0 0 0 2,553,604 VINELAND CITY BD OF ED 20303 CUMBERLAND 2,708,398 0 0 2,708,398 2,514,526 0 0 0 2,514,526 VINELAND HOUSING AUTHORITY 55780 CUMBERLAND 152,563 0 0 152,563 129,228 0 0 0 129,228 VINELAND PUBLIC CHARTER SCHOOL 48600 CUMBERLAND 39,093 0 0 39,093 13,784 0 0 0 13,784 100 LEGACY ACADEMY CHARTER SCHL 51700 ESSEX 14,544 0 0 14,544 0 0 0 0 0 ADELAIDE SANFORD CHARTER SCHOOL 47300 ESSEX 86,786 0 0 86,786 73,714 0 0 0 73,714 BELLEVILLE BD OF ED 20223 ESSEX 661,443 0 0 661,443 575,845 0 0 0 575,845 BELLEVILLE TOWNSHIP 20220 ESSEX 819,871 0 0 819,871 703,412 0 0 0 703,412 BLOOMFIELD PARKING AUTHORITY 45800 ESSEX 28,236 0 0 28,236 20,738 0 0 0 20,738 BLOOMFIELD TOWNSHIP 20230 ESSEX 982,496 3,338 11,973 997,807 888,702 0 2,640 9,732 901,074 BLOOMFIELD TWP BD OF ED 20233 ESSEX 903,763 0 0 903,763 825,949 0 0 0 825,949 BURCH CHTR SCHL OF EXCELLENCE 47600 ESSEX 41,236 0 0 41,236 32,484 0 0 0 32,484 CALDWELL BOROUGH 21320 ESSEX 162,437 5,198 18,645 186,280 151,279 0 2,822 10,404 164,505 CALDWELL WEST CALDWELL BD OF ED 40530 ESSEX 489,350 0 0 489,350 461,479 0 0 0 461,479 CEDAR GROVE TOWNSHIP 22180 ESSEX 371,081 0 0 371,081 326,588 0 0 0 326,588 CEDAR GROVE TWP BD OF ED 22183 ESSEX 299,270 0 0 299,270 251,427 0 0 0 251,427 DISCOVERY CHARTER SCHOOL 37700 ESSEX 4,768 0 0 4,768 4,369 0 0 0 4,369 EAST ORANGE CITY 20170 ESSEX 3,150,434 3,480 12,483 3,166,397 2,880,493 0 0 0 2,880,493 EAST ORANGE COMMUNITY CHART SCH 35620 ESSEX 177,056 0 0 177,056 160,006 0 0 0 160,006 EAST ORANGE HOUSING AUTHORITY 30640 ESSEX 105,567 0 0 105,567 78,886 0 0 0 78,886 EAST ORANGE PARKING AUTHORITY 31610 ESSEX 7,438 0 0 7,438 6,816 0 0 0 6,816 EAST ORANGE SCHOOL DISTRICT 20173 ESSEX 2,945,669 961 3,447 2,950,077 2,555,524 0 0 0 2,555,524 ENGLEWOOD ON THE PALISADES CHAR 37800 ESSEX 35,634 0 0 35,634 29,001 0 0 0 29,001
Page 30
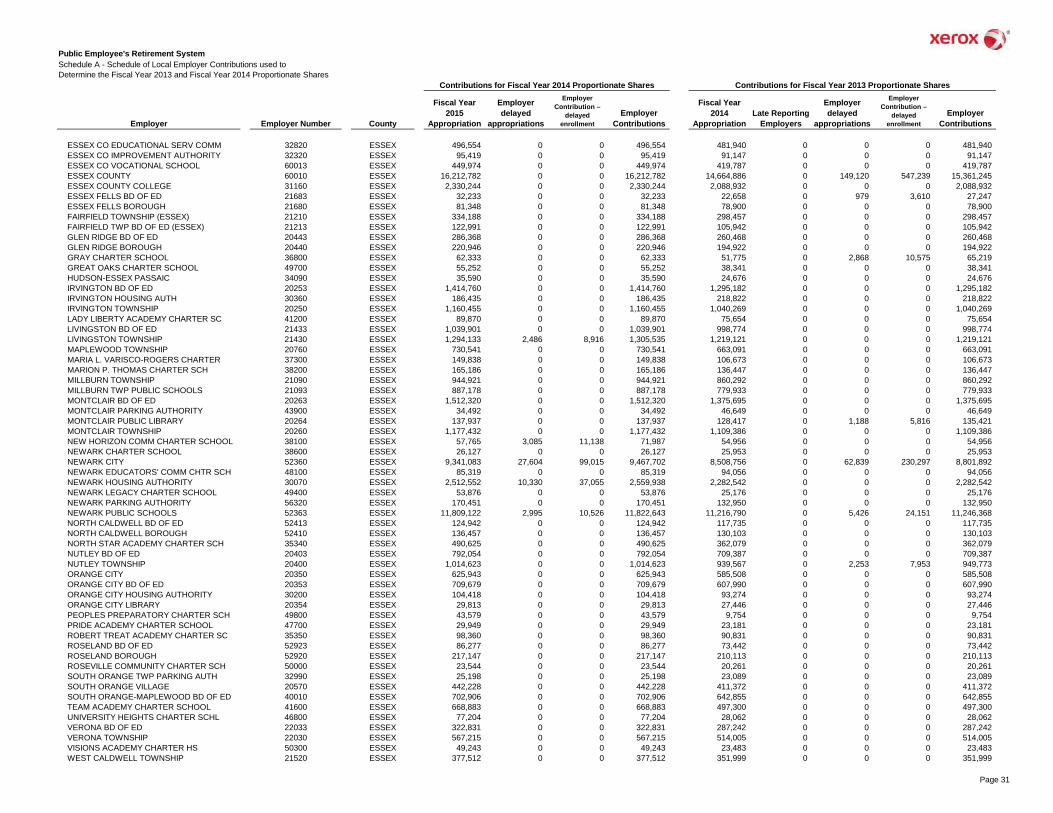
Public Employee's Retirement SystemSchedule A - Schedule of Local Employer Contributions used toDetermine the Fiscal Year 2013 and Fiscal Year 2014 Proportionate Shares
Employer EmployerEmployer Employer Number County Contributions Contributions
Contributions for Fiscal Year 2014 Proportionate Shares Contributions for Fiscal Year 2013 Proportionate Shares
Fiscal Year 2015
Appropriation
Employer delayed
appropriations
Employer Contribution –
delayed enrollment
Fiscal Year 2014
AppropriationLate Reporting
Employers
Employer delayed
appropriations
Employer Contribution –
delayed enrollment
ESSEX CO EDUCATIONAL SERV COMM 32820 ESSEX 496,554 0 0 496,554 481,940 0 0 0 481,940 ESSEX CO IMPROVEMENT AUTHORITY 32320 ESSEX 95,419 0 0 95,419 91,147 0 0 0 91,147 ESSEX CO VOCATIONAL SCHOOL 60013 ESSEX 449,974 0 0 449,974 419,787 0 0 0 419,787 ESSEX COUNTY 60010 ESSEX 16,212,782 0 0 16,212,782 14,664,886 0 149,120 547,239 15,361,245 ESSEX COUNTY COLLEGE 31160 ESSEX 2,330,244 0 0 2,330,244 2,088,932 0 0 0 2,088,932 ESSEX FELLS BD OF ED 21683 ESSEX 32,233 0 0 32,233 22,658 0 979 3,610 27,247 ESSEX FELLS BOROUGH 21680 ESSEX 81,348 0 0 81,348 78,900 0 0 0 78,900 FAIRFIELD TOWNSHIP (ESSEX) 21210 ESSEX 334,188 0 0 334,188 298,457 0 0 0 298,457 FAIRFIELD TWP BD OF ED (ESSEX) 21213 ESSEX 122,991 0 0 122,991 105,942 0 0 0 105,942 GLEN RIDGE BD OF ED 20443 ESSEX 286,368 0 0 286,368 260,468 0 0 0 260,468 GLEN RIDGE BOROUGH 20440 ESSEX 220,946 0 0 220,946 194,922 0 0 0 194,922 GRAY CHARTER SCHOOL 36800 ESSEX 62,333 0 0 62,333 51,775 0 2,868 10,575 65,219 GREAT OAKS CHARTER SCHOOL 49700 ESSEX 55,252 0 0 55,252 38,341 0 0 0 38,341 HUDSON-ESSEX PASSAIC 34090 ESSEX 35,590 0 0 35,590 24,676 0 0 0 24,676 IRVINGTON BD OF ED 20253 ESSEX 1,414,760 0 0 1,414,760 1,295,182 0 0 0 1,295,182 IRVINGTON HOUSING AUTH 30360 ESSEX 186,435 0 0 186,435 218,822 0 0 0 218,822 IRVINGTON TOWNSHIP 20250 ESSEX 1,160,455 0 0 1,160,455 1,040,269 0 0 0 1,040,269 LADY LIBERTY ACADEMY CHARTER SC 41200 ESSEX 89,870 0 0 89,870 75,654 0 0 0 75,654 LIVINGSTON BD OF ED 21433 ESSEX 1,039,901 0 0 1,039,901 998,774 0 0 0 998,774 LIVINGSTON TOWNSHIP 21430 ESSEX 1,294,133 2,486 8,916 1,305,535 1,219,121 0 0 0 1,219,121 MAPLEWOOD TOWNSHIP 20760 ESSEX 730,541 0 0 730,541 663,091 0 0 0 663,091 MARIA L. VARISCO-ROGERS CHARTER 37300 ESSEX 149,838 0 0 149,838 106,673 0 0 0 106,673 MARION P. THOMAS CHARTER SCH 38200 ESSEX 165,186 0 0 165,186 136,447 0 0 0 136,447 MILLBURN TOWNSHIP 21090 ESSEX 944,921 0 0 944,921 860,292 0 0 0 860,292 MILLBURN TWP PUBLIC SCHOOLS 21093 ESSEX 887,178 0 0 887,178 779,933 0 0 0 779,933 MONTCLAIR BD OF ED 20263 ESSEX 1,512,320 0 0 1,512,320 1,375,695 0 0 0 1,375,695 MONTCLAIR PARKING AUTHORITY 43900 ESSEX 34,492 0 0 34,492 46,649 0 0 0 46,649 MONTCLAIR PUBLIC LIBRARY 20264 ESSEX 137,937 0 0 137,937 128,417 0 1,188 5,816 135,421 MONTCLAIR TOWNSHIP 20260 ESSEX 1,177,432 0 0 1,177,432 1,109,386 0 0 0 1,109,386 NEW HORIZON COMM CHARTER SCHOOL 38100 ESSEX 57,765 3,085 11,138 71,987 54,956 0 0 0 54,956 NEWARK CHARTER SCHOOL 38600 ESSEX 26,127 0 0 26,127 25,953 0 0 0 25,953 NEWARK CITY 52360 ESSEX 9,341,083 27,604 99,015 9,467,702 8,508,756 0 62,839 230,297 8,801,892 NEWARK EDUCATORS' COMM CHTR SCH 48100 ESSEX 85,319 0 0 85,319 94,056 0 0 0 94,056 NEWARK HOUSING AUTHORITY 30070 ESSEX 2,512,552 10,330 37,055 2,559,938 2,282,542 0 0 0 2,282,542 NEWARK LEGACY CHARTER SCHOOL 49400 ESSEX 53,876 0 0 53,876 25,176 0 0 0 25,176 NEWARK PARKING AUTHORITY 56320 ESSEX 170,451 0 0 170,451 132,950 0 0 0 132,950 NEWARK PUBLIC SCHOOLS 52363 ESSEX 11,809,122 2,995 10,526 11,822,643 11,216,790 0 5,426 24,151 11,246,368 NORTH CALDWELL BD OF ED 52413 ESSEX 124,942 0 0 124,942 117,735 0 0 0 117,735 NORTH CALDWELL BOROUGH 52410 ESSEX 136,457 0 0 136,457 130,103 0 0 0 130,103 NORTH STAR ACADEMY CHARTER SCH 35340 ESSEX 490,625 0 0 490,625 362,079 0 0 0 362,079 NUTLEY BD OF ED 20403 ESSEX 792,054 0 0 792,054 709,387 0 0 0 709,387 NUTLEY TOWNSHIP 20400 ESSEX 1,014,623 0 0 1,014,623 939,567 0 2,253 7,953 949,773 ORANGE CITY 20350 ESSEX 625,943 0 0 625,943 585,508 0 0 0 585,508 ORANGE CITY BD OF ED 20353 ESSEX 709,679 0 0 709,679 607,990 0 0 0 607,990 ORANGE CITY HOUSING AUTHORITY 30200 ESSEX 104,418 0 0 104,418 93,274 0 0 0 93,274 ORANGE CITY LIBRARY 20354 ESSEX 29,813 0 0 29,813 27,446 0 0 0 27,446 PEOPLES PREPARATORY CHARTER SCH 49800 ESSEX 43,579 0 0 43,579 9,754 0 0 0 9,754 PRIDE ACADEMY CHARTER SCHOOL 47700 ESSEX 29,949 0 0 29,949 23,181 0 0 0 23,181 ROBERT TREAT ACADEMY CHARTER SC 35350 ESSEX 98,360 0 0 98,360 90,831 0 0 0 90,831 ROSELAND BD OF ED 52923 ESSEX 86,277 0 0 86,277 73,442 0 0 0 73,442 ROSELAND BOROUGH 52920 ESSEX 217,147 0 0 217,147 210,113 0 0 0 210,113 ROSEVILLE COMMUNITY CHARTER SCH 50000 ESSEX 23,544 0 0 23,544 20,261 0 0 0 20,261 SOUTH ORANGE TWP PARKING AUTH 32990 ESSEX 25,198 0 0 25,198 23,089 0 0 0 23,089 SOUTH ORANGE VILLAGE 20570 ESSEX 442,228 0 0 442,228 411,372 0 0 0 411,372 SOUTH ORANGE-MAPLEWOOD BD OF ED 40010 ESSEX 702,906 0 0 702,906 642,855 0 0 0 642,855 TEAM ACADEMY CHARTER SCHOOL 41600 ESSEX 668,883 0 0 668,883 497,300 0 0 0 497,300 UNIVERSITY HEIGHTS CHARTER SCHL 46800 ESSEX 77,204 0 0 77,204 28,062 0 0 0 28,062 VERONA BD OF ED 22033 ESSEX 322,831 0 0 322,831 287,242 0 0 0 287,242 VERONA TOWNSHIP 22030 ESSEX 567,215 0 0 567,215 514,005 0 0 0 514,005 VISIONS ACADEMY CHARTER HS 50300 ESSEX 49,243 0 0 49,243 23,483 0 0 0 23,483 WEST CALDWELL TOWNSHIP 21520 ESSEX 377,512 0 0 377,512 351,999 0 0 0 351,999
Page 31

Public Employee's Retirement SystemSchedule A - Schedule of Local Employer Contributions used toDetermine the Fiscal Year 2013 and Fiscal Year 2014 Proportionate Shares
Employer EmployerEmployer Employer Number County Contributions Contributions
Contributions for Fiscal Year 2014 Proportionate Shares Contributions for Fiscal Year 2013 Proportionate Shares
Fiscal Year 2015
Appropriation
Employer delayed
appropriations
Employer Contribution –
delayed enrollment
Fiscal Year 2014
AppropriationLate Reporting
Employers
Employer delayed
appropriations
Employer Contribution –
delayed enrollment
WEST ESSEX REGIONAL SCH DIST 40520 ESSEX 348,544 0 0 348,544 326,089 0 0 0 326,089 WEST ORANGE PUBLIC LIBRARY 20284 ESSEX 97,551 0 0 97,551 111,321 0 0 0 111,321 WEST ORANGE TOWNSHIP 20280 ESSEX 975,896 0 0 975,896 856,567 0 3,734 13,768 874,069 WEST ORANGE TOWNSHIP BD OF ED 20283 ESSEX 1,860,953 0 0 1,860,953 1,608,250 0 2,147 7,915 1,618,311 CLAYTON BOROUGH 50580 GLOUCESTER 133,908 0 0 133,908 115,940 0 0 0 115,940 CLAYTON BOROUGH BD OF ED 50583 GLOUCESTER 216,751 0 0 216,751 196,883 0 0 0 196,883 CLEARVIEW REGIONAL BD OF ED 40250 GLOUCESTER 462,374 0 0 462,374 424,678 0 0 0 424,678 DELSEA REG HIGH SCH DISTRICT 57390 GLOUCESTER 475,438 0 0 475,438 412,074 0 0 0 412,074 DEPTFORD TOWNSHIP 50740 GLOUCESTER 407,507 0 0 407,507 367,328 0 0 0 367,328 DEPTFORD TWP BD OF ED 50743 GLOUCESTER 1,076,968 0 0 1,076,968 957,998 0 0 0 957,998 DEPTFORD TWP FIRE DISTRICT 34110 GLOUCESTER 30,659 0 0 30,659 27,222 0 0 0 27,222 DEPTFORD TWP MUA 55560 GLOUCESTER 163,169 0 0 163,169 147,325 0 0 0 147,325 EAST GREENWICH BD OF EDUCATION 50823 GLOUCESTER 128,439 0 0 128,439 118,659 0 0 0 118,659 EAST GREENWICH TOWNSHIP 50820 GLOUCESTER 143,235 0 0 143,235 134,366 0 0 0 134,366 ED INFORMATION & RESOURCE CTR 32680 GLOUCESTER 275,396 0 0 275,396 188,159 0 0 0 188,159 ELK TOWNSHIP 50890 GLOUCESTER 44,545 0 0 44,545 43,611 0 0 0 43,611 ELK TWP BD OF ED 50893 GLOUCESTER 36,160 0 0 36,160 38,506 0 0 0 38,506 FRANKLIN TOWNSHIP (GLOUCESTER) 51080 GLOUCESTER 171,238 0 0 171,238 185,461 0 0 0 185,461 FRANKLIN TWP BD OF ED (GLOCSTR) 51083 GLOUCESTER 249,577 0 0 249,577 202,570 0 0 0 202,570 GATEWAY REGIONAL HIGH SCHOOL 57280 GLOUCESTER 249,946 0 0 249,946 233,112 0 0 0 233,112 GLASSBORO BD OF ED 21593 GLOUCESTER 577,802 0 0 577,802 495,947 0 0 0 495,947 GLASSBORO BOROUGH 21590 GLOUCESTER 672,156 0 0 672,156 585,992 0 0 0 585,992 GLASSBORO BOROUGH HOUSING AUTH 31010 GLOUCESTER 17,173 0 0 17,173 15,736 0 0 0 15,736 GLOUCESTER CO BD OF SOCIAL SERV 10161 GLOUCESTER 1,014,300 0 0 1,014,300 881,872 0 0 0 881,872 GLOUCESTER CO HOUSING AUTHORITY 32450 GLOUCESTER 259,422 0 0 259,422 236,378 0 0 0 236,378 GLOUCESTER CO IMPROVEMENT AUTH 34310 GLOUCESTER 981,124 0 0 981,124 865,204 0 0 0 865,204 GLOUCESTER CO SOIL CONSERV DIST 34200 GLOUCESTER 35,679 0 0 35,679 44,959 0 0 0 44,959 GLOUCESTER CO SP SERV SCH DIST 32810 GLOUCESTER 1,235,992 0 0 1,235,992 1,141,959 0 0 0 1,141,959 GLOUCESTER CO UTIL AUTHORITY 31390 GLOUCESTER 394,306 0 0 394,306 351,442 0 0 0 351,442 GLOUCESTER CO VO-TECH SCH DIST 10163 GLOUCESTER 338,933 0 0 338,933 300,149 0 0 0 300,149 GLOUCESTER COUNTY 10160 GLOUCESTER 6,270,286 0 0 6,270,286 5,564,151 0 0 0 5,564,151 GLOUCESTER COUNTY COLLEGE 31150 GLOUCESTER 865,405 0 0 865,405 777,706 0 0 0 777,706 GREENWICH TOWNSHIP (GLOUCESTER) 22200 GLOUCESTER 189,209 0 0 189,209 199,885 0 0 0 199,885 GREENWICH TWP BD ED (GLOUCSTER) 22203 GLOUCESTER 132,701 0 0 132,701 123,860 0 0 0 123,860 HARRISON TOWNSHIP (GLOUCESTER) 51400 GLOUCESTER 160,354 0 0 160,354 157,982 0 0 0 157,982 HARRISON TOWNSHIP FIRE DIST #1 46000 GLOUCESTER 6,084 0 0 6,084 0 17,822 0 0 17,822 HARRISON TWP BD ED (GLOUCESTER) 51403 GLOUCESTER 243,628 0 0 243,628 227,351 0 0 0 227,351 KINGSWAY REGIONAL SCHOOL DIST 57440 GLOUCESTER 444,098 0 0 444,098 384,693 0 0 0 384,693 LOGAN TOWNSHIP 51850 GLOUCESTER 156,671 0 0 156,671 123,639 0 1,933 7,128 132,700 LOGAN TOWNSHIP BD OF ED 51853 GLOUCESTER 109,936 0 0 109,936 99,505 0 0 0 99,505 LOGAN TWP MUN UTIL AUTHORITY 32070 GLOUCESTER 65,535 0 0 65,535 51,839 0 0 0 51,839 MANTUA TOWNSHIP 23650 GLOUCESTER 226,714 0 0 226,714 202,167 0 0 0 202,167 MANTUA TOWNSHIP BD OF ED 23653 GLOUCESTER 265,710 0 0 265,710 229,685 0 0 0 229,685 MANTUA TWP MUN UTIL AUTHORITY 32960 GLOUCESTER 70,902 0 0 70,902 65,140 0 0 0 65,140 MONROE TOWNSHIP (GLOUCESTER) 52200 GLOUCESTER 641,408 3,377 12,115 656,900 578,563 0 0 0 578,563 MONROE TWP BD OF ED (GLOUCESTR) 52203 GLOUCESTER 582,938 0 0 582,938 525,430 0 0 0 525,430 MONROE TWP MUN UT AUTH (GLOUCS) 55920 GLOUCESTER 244,706 0 0 244,706 233,394 0 0 0 233,394 NATIONAL PARK BOARD OF EDUC 26703 GLOUCESTER 36,776 0 0 36,776 38,179 0 0 0 38,179 NATIONAL PARK BOROUGH 52340 GLOUCESTER 39,202 0 0 39,202 44,849 0 0 0 44,849 NEWFIELD BOROUGH 21820 GLOUCESTER 28,632 0 0 28,632 17,922 0 0 0 17,922 NEWFIELD BOROUGH BD OF ED 21823 GLOUCESTER 28,267 0 0 28,267 0 0 0 0 0 PAULSBORO BORO BD OF ED 23293 GLOUCESTER 231,840 0 0 231,840 218,280 0 0 0 218,280 PAULSBORO BOROUGH 23290 GLOUCESTER 168,591 0 0 168,591 134,236 0 0 0 134,236 PITMAN BD OF ED 22883 GLOUCESTER 275,972 0 0 275,972 250,504 0 0 0 250,504 PITMAN BOROUGH 22880 GLOUCESTER 188,934 0 0 188,934 174,163 0 0 0 174,163 SOUTH HARRISON TOWNSHIP 53130 GLOUCESTER 28,856 0 0 28,856 25,315 0 0 0 25,315 SOUTH HARRISON TWP BD OF ED 53133 GLOUCESTER 35,478 0 0 35,478 31,631 0 0 0 31,631 SWEDESBORO BOROUGH 22270 GLOUCESTER 60,104 0 0 60,104 52,429 0 0 0 52,429 SWEDESBORO WOOLWICH BD OF ED 57520 GLOUCESTER 176,221 0 0 176,221 155,653 0 0 0 155,653 WASHINGTON TWP (GLOUCESTER) 22800 GLOUCESTER 520,555 0 0 520,555 433,303 0 1,813 6,683 441,799 WASHINGTON TWP BD OF ED (GLOUC) 22803 GLOUCESTER 1,687,775 0 0 1,687,775 1,583,100 0 0 0 1,583,100
Page 32

Public Employee's Retirement SystemSchedule A - Schedule of Local Employer Contributions used toDetermine the Fiscal Year 2013 and Fiscal Year 2014 Proportionate Shares
Employer EmployerEmployer Employer Number County Contributions Contributions
Contributions for Fiscal Year 2014 Proportionate Shares Contributions for Fiscal Year 2013 Proportionate Shares
Fiscal Year 2015
Appropriation
Employer delayed
appropriations
Employer Contribution –
delayed enrollment
Fiscal Year 2014
AppropriationLate Reporting
Employers
Employer delayed
appropriations
Employer Contribution –
delayed enrollment
WASHINGTON TWP BD OF FIRE COMM 34460 GLOUCESTER 19,410 0 0 19,410 24,489 0 0 0 24,489 WASHINGTON TWP MUA (GLOUCESTER) 55760 GLOUCESTER 160,064 0 0 160,064 145,900 0 0 0 145,900 WENONAH BOROUGH 23390 GLOUCESTER 34,410 1,781 6,260 42,451 43,774 0 0 0 43,774 WENONAH BOROUGH BD OF ED 23393 GLOUCESTER 27,365 0 0 27,365 25,853 0 0 0 25,853 WEST DEPTFORD TOWNSHIP 23660 GLOUCESTER 641,560 3,613 12,960 658,133 620,394 0 0 0 620,394 WEST DEPTFORD TWP BD OF ED 23663 GLOUCESTER 498,502 0 0 498,502 452,789 0 0 0 452,789 WESTVILLE BOARD OF ED 22893 GLOUCESTER 45,178 0 0 45,178 44,920 0 0 0 44,920 WESTVILLE BOROUGH 22890 GLOUCESTER 161,391 0 0 161,391 159,450 0 0 0 159,450 WESTVILLE FIRE DISTRICT # 1 35130 GLOUCESTER 11,126 0 0 11,126 11,231 0 0 0 11,231 WOODBURY CITY 21730 GLOUCESTER 334,008 0 0 334,008 301,649 0 0 0 301,649 WOODBURY CITY BD OF ED 21733 GLOUCESTER 307,197 0 0 307,197 271,934 0 0 0 271,934 WOODBURY HEIGHTS BOARD OF ED 53803 GLOUCESTER 27,917 0 0 27,917 25,017 0 0 0 25,017 WOODBURY HEIGHTS BOROUGH 53800 GLOUCESTER 85,914 0 0 85,914 89,786 0 0 0 89,786 WOOLWICH TOWNSHIP 53840 GLOUCESTER 123,529 0 0 123,529 118,752 0 0 0 118,752 BAYONNE BOARD OF ED 21273 HUDSON 1,636,220 2,838 10,179 1,649,237 1,502,478 0 0 0 1,502,478 BAYONNE CITY 21270 HUDSON 1,848,717 0 0 1,848,717 1,673,631 0 0 0 1,673,631 BAYONNE HOUSING AUTHORITY 30290 HUDSON 410,911 0 0 410,911 398,100 0 0 0 398,100 BAYONNE LOCAL REDEVELOP. AGENCY 41500 HUDSON 49,654 0 0 49,654 61,354 0 0 0 61,354 BAYONNE MUNICIPAL UTIL. AUTH. 36400 HUDSON 46,515 0 0 46,515 247,949 0 0 0 247,949 DR LENA EDWARDS ACAD CHRTR SCHL 49900 HUDSON 75,728 0 0 75,728 0 0 0 0 0 EAST NEWARK BOROUGH 50840 HUDSON 29,584 0 0 29,584 26,723 0 0 0 26,723 EAST NEWARK BOROUGH BD OF ED 70013 HUDSON 13,038 0 0 13,038 14,768 0 0 0 14,768 ELYSIAN CHARTER SCH OF HOBOKEN 35330 HUDSON 49,149 0 0 49,149 48,621 0 0 0 48,621 ETHICAL COMM CHRTR SCHL - J.C. 48300 HUDSON 41,134 0 0 41,134 37,892 0 0 0 37,892 GUTTENBERG BORO BD OF ED 70023 HUDSON 104,177 0 0 104,177 95,159 0 0 0 95,159 GUTTENBERG HOUSING AUTHORITY 30970 HUDSON 92,103 0 0 92,103 70,936 0 0 0 70,936 GUTTENBERG TOWN 51260 HUDSON 157,833 6,988 25,066 189,887 134,335 0 1,571 5,791 141,697 HARRISON TOWN (HUDSON) 21160 HUDSON 537,017 0 0 537,017 483,147 0 0 0 483,147 HARRISON TOWN BD OF ED(HUDSON) 21163 HUDSON 341,380 0 0 341,380 274,343 0 0 0 274,343 HARRISON TOWN HOUSING AUTHORITY 30120 HUDSON 72,281 0 0 72,281 64,825 0 0 0 64,825 HOBOKEN BOARD OF EDUCATION 21123 HUDSON 640,697 0 0 640,697 562,347 0 0 0 562,347 HOBOKEN CHARTER SCHOOL 35490 HUDSON 48,361 0 0 48,361 54,473 0 0 0 54,473 HOBOKEN CITY 21120 HUDSON 1,448,337 0 0 1,448,337 1,331,582 0 0 0 1,331,582 HOBOKEN DUAL LANGUAGE CH SCHOOL 48900 HUDSON 36,916 0 0 36,916 16,712 0 0 0 16,712 HOBOKEN HOUSING AUTHORITY 30220 HUDSON 248,815 0 0 248,815 229,799 0 0 0 229,799 HUDSON CO COMMUNITY COLLEGE 32260 HUDSON 886,640 0 0 886,640 805,467 0 0 0 805,467 HUDSON CO ECONOMIC DEVELOP CORP 38400 HUDSON 18,166 0 0 18,166 16,319 0 0 0 16,319 HUDSON CO IMPROVEMENT AUTH 34430 HUDSON 421,776 0 0 421,776 368,067 0 0 0 368,067 HUDSON CO SCHOOLS OF TECHNOLOGY 60023 HUDSON 1,279,149 0 0 1,279,149 1,180,406 0 0 0 1,180,406 HUDSON COUNTY 60020 HUDSON 10,731,206 15,762 56,539 10,803,507 9,628,663 0 5,231 18,952 9,652,846 HUDSON REG HEALTH COMMISSION 31650 HUDSON 194,751 0 0 194,751 187,664 0 0 0 187,664 JERSEY CITY 51640 HUDSON 1,966,272 0 0 1,966,272 1,771,932 0 0 0 1,771,932 JERSEY CITY COMM CHARTER SCHOOL 35420 HUDSON 168,929 0 0 168,929 164,709 0 0 0 164,709 JERSEY CITY GOLDEN DOOR CHARTER 35610 HUDSON 67,224 0 0 67,224 70,476 0 0 0 70,476 JERSEY CITY HOUSING AUTHORITY 30060 HUDSON 1,123,726 0 0 1,123,726 1,103,948 0 0 0 1,103,948 JERSEY CITY INCINERATOR AUTH 31050 HUDSON 799,598 0 0 799,598 758,786 0 0 0 758,786 JERSEY CITY MUNICIPAL UT. AUTH 31250 HUDSON 741,165 0 0 741,165 634,183 0 0 0 634,183 JERSEY CITY PARKING AUTH 56060 HUDSON 403,947 0 0 403,947 392,584 0 0 0 392,584 JERSEY CITY PUBLIC SCHOOLS 70033 HUDSON 8,563,411 61,750 221,648 8,846,808 7,973,690 0 16,792 61,909 8,052,391 JERSEY CITY REDEVEL AGENCY 30800 HUDSON 90,955 0 0 90,955 80,493 0 0 0 80,493 KEARNY MUNICIPAL UTIL AUTH 34970 HUDSON 29,972 0 0 29,972 16,269 0 0 0 16,269 KEARNY TOWN 20390 HUDSON 762,522 2,267 7,969 772,758 765,394 0 0 0 765,394 KEARNY TOWN BD OF ED 20393 HUDSON 898,543 0 0 898,543 751,858 0 0 0 751,858 LEARNING COMM. CHARTER SCHOOL 35390 HUDSON 83,162 0 0 83,162 83,549 0 0 0 83,549 LIBERTY ACADEMY CHARTER SCHOOL 37600 HUDSON 45,388 0 0 45,388 44,429 0 0 0 44,429 METS CHARTER SCHOOL 49600 HUDSON 23,148 0 0 23,148 6,554 0 0 0 6,554 NORTH BERGEN BD OF ED 21443 HUDSON 1,181,383 0 0 1,181,383 1,051,611 0 1,748 6,444 1,059,803 NORTH BERGEN HOUSING AUTHORITY 30490 HUDSON 241,955 0 0 241,955 213,021 0 0 0 213,021 NORTH BERGEN M.U.A. 34710 HUDSON 399,094 0 0 399,094 357,320 0 0 0 357,320 NORTH BERGEN PARKING AUTHORITY 41800 HUDSON 76,131 0 0 76,131 74,441 0 0 0 74,441 NORTH BERGEN TOWNSHIP 21440 HUDSON 1,239,421 0 0 1,239,421 1,149,546 0 4,012 14,791 1,168,349
Page 33

Public Employee's Retirement SystemSchedule A - Schedule of Local Employer Contributions used toDetermine the Fiscal Year 2013 and Fiscal Year 2014 Proportionate Shares
Employer EmployerEmployer Employer Number County Contributions Contributions
Contributions for Fiscal Year 2014 Proportionate Shares Contributions for Fiscal Year 2013 Proportionate Shares
Fiscal Year 2015
Appropriation
Employer delayed
appropriations
Employer Contribution –
delayed enrollment
Fiscal Year 2014
AppropriationLate Reporting
Employers
Employer delayed
appropriations
Employer Contribution –
delayed enrollment
NORTH HUDSON REG FIRE & RESCUE 36300 HUDSON 119,641 0 0 119,641 107,457 0 2,524 9,307 119,289 NORTH HUDSON SEWERAGE AUTHORITY 34850 HUDSON 29,741 0 0 29,741 27,324 0 0 0 27,324 SCHOMBURG CHARTER SCHOOL 39600 HUDSON 0 0 0 0 0 15,049 0 0 15,049 SECAUCUS HOUSING AUTHORITY 48000 HUDSON 57,390 0 0 57,390 49,052 0 0 0 49,052 SECAUCUS MUNICIPAL UTIL. AUTH. 43800 HUDSON 131,460 0 0 131,460 128,034 0 0 0 128,034 SECAUCUS TOWN 21650 HUDSON 901,532 0 0 901,532 812,921 0 0 0 812,921 SECAUCUS TOWN BD OF ED 21653 HUDSON 442,842 0 0 442,842 405,666 0 0 0 405,666 SOARING HEIGHTS CHARTER SCHOOL 35400 HUDSON 26,818 0 0 26,818 23,169 0 0 0 23,169 UNION CITY 21290 HUDSON 1,100,390 18,458 65,390 1,184,239 1,046,713 0 0 0 1,046,713 UNION CITY BD OF ED 21293 HUDSON 3,127,371 0 0 3,127,371 2,501,393 0 0 0 2,501,393 UNION CITY HOUSING AUTHORITY 30400 HUDSON 173,477 0 0 173,477 162,072 0 0 0 162,072 UNION CITY PARKING AUTHORITY 30660 HUDSON 52,774 36,629 131,497 220,899 51,700 0 3,563 12,967 68,231 UNIVERSITY ACADEMY CHARTER HS 41100 HUDSON 42,827 0 0 42,827 37,242 0 0 0 37,242 WEEHAWKEN TOWNSHIP 21110 HUDSON 696,164 0 0 696,164 608,125 0 1,996 7,358 617,479 WEEHAWKEN TWP BD OF ED 21113 HUDSON 209,654 0 0 209,654 169,035 0 0 0 169,035 WEEHAWKEN TWP HOUSING AUTHORITY 31960 HUDSON 36,007 0 0 36,007 32,796 0 0 0 32,796 WEST NEW YORK BD OF ED 21303 HUDSON 1,702,393 0 0 1,702,393 1,507,817 0 0 0 1,507,817 WEST NEW YORK HOUSING AUTHORITY 30480 HUDSON 173,219 0 0 173,219 147,671 0 0 0 147,671 WEST NEW YORK PARKING AUTHORITY 56180 HUDSON 52,025 0 0 52,025 43,395 0 0 0 43,395 WEST NEW YORK TOWN 21300 HUDSON 730,262 0 0 730,262 713,200 0 7,251 26,732 747,183 ALEXANDRIA TOWNSHIP 50020 HUNTERDON 63,678 0 0 63,678 61,582 0 0 0 61,582 ALEXANDRIA TWP BD OF ED 50023 HUNTERDON 84,241 0 0 84,241 64,654 0 0 0 64,654 BETHLEHEM TOWNSHIP 50290 HUNTERDON 57,276 0 0 57,276 55,191 0 0 0 55,191 BETHLEHEM TWP BD OF ED 50293 HUNTERDON 74,879 0 0 74,879 49,041 0 0 0 49,041 BLOOMSBURY BOROUGH 50320 HUNTERDON 14,178 0 0 14,178 12,798 0 0 0 12,798 BLOOMSBURY BOROUGH BD OF ED 50323 HUNTERDON 21,955 0 0 21,955 19,989 0 0 0 19,989 CALIFON BORO BD OF ED 50463 HUNTERDON 17,450 0 0 17,450 17,903 0 0 0 17,903 CALIFON BOROUGH 50460 HUNTERDON 16,868 0 0 16,868 15,149 0 0 0 15,149 CLINTON TOWN 50600 HUNTERDON 164,314 0 0 164,314 135,400 0 0 0 135,400 CLINTON TOWN BD OF ED 50603 HUNTERDON 70,897 0 0 70,897 56,822 0 0 0 56,822 CLINTON TOWNSHIP 23260 HUNTERDON 234,031 0 0 234,031 207,951 0 0 0 207,951 CLINTON TWP BD OF ED 23263 HUNTERDON 293,297 0 0 293,297 260,969 0 0 0 260,969 CLINTON TWP SEW AUTHORITY 32930 HUNTERDON 5,841 0 0 5,841 5,171 0 0 0 5,171 DELAWARE TOWNSHIP 23380 HUNTERDON 95,964 0 0 95,964 89,005 0 0 0 89,005 DELAWARE TWP BD OF ED 23383 HUNTERDON 99,773 0 0 99,773 93,333 0 0 0 93,333 DELAWARE TWP MUN UTIL AUTH 55850 HUNTERDON 805 0 0 805 1,955 0 0 0 1,955 DELAWARE VALLEY REG H S DIST 40280 HUNTERDON 323,972 0 0 323,972 285,081 0 0 0 285,081 EAST AMWELL TOWNSHIP 50800 HUNTERDON 53,845 0 0 53,845 49,032 0 0 0 49,032 EAST AMWELL TOWNSHIP BD OF ED 50803 HUNTERDON 77,205 0 0 77,205 76,404 0 0 0 76,404 FLEMINGTON BOROUGH 22320 HUNTERDON 101,046 1,618 5,685 108,348 90,842 0 0 0 90,842 FLEMINGTON RARITAN BD OF ED 40270 HUNTERDON 316,292 0 0 316,292 275,512 0 0 0 275,512 FRANKLIN TOWNSHIP (HUNTERDON) 51090 HUNTERDON 48,431 0 0 48,431 47,797 0 0 0 47,797 FRANKLIN TWP BD OF ED (HUNTRDN) 51093 HUNTERDON 65,842 0 0 65,842 59,449 0 0 0 59,449 FRENCHTOWN BOROUGH 51150 HUNTERDON 57,534 0 0 57,534 50,360 0 0 0 50,360 FRENCHTOWN BOROUGH BD OF ED 51153 HUNTERDON 22,451 0 0 22,451 19,992 0 0 0 19,992 GLEN GARDNER BOROUGH 51180 HUNTERDON 31,104 0 0 31,104 33,338 0 0 0 33,338 HAMPTON BOROUGH 51330 HUNTERDON 32,570 0 0 32,570 27,647 0 0 0 27,647 HAMPTON BOROUGH BD OF ED 51333 HUNTERDON 20,936 0 0 20,936 17,977 0 0 0 17,977 HIGH BRIDGE BOROUGH 51450 HUNTERDON 62,748 0 0 62,748 66,221 0 0 0 66,221 HIGH BRIDGE BOROUGH BD OF ED 51453 HUNTERDON 74,419 0 0 74,419 59,327 0 0 0 59,327 HOLLAND TOWNSHIP 23250 HUNTERDON 90,247 0 0 90,247 76,623 0 0 0 76,623 HOLLAND TWP BD OF ED 23253 HUNTERDON 129,046 0 0 129,046 120,445 0 0 0 120,445 HUNTERDON CENTRAL HIGH SCHOOL 40290 HUNTERDON 873,262 0 0 873,262 788,944 0 2,966 10,936 802,846 HUNTERDON CO BOARD SOCIAL SER. 10181 HUNTERDON 175,669 0 0 175,669 169,936 0 0 0 169,936 HUNTERDON CO EDUC SRVCS COMM 33030 HUNTERDON 679,572 0 0 679,572 647,702 0 0 0 647,702 HUNTERDON CO SOIL CONSERV DIST 32360 HUNTERDON 31,950 0 0 31,950 29,215 0 0 0 29,215 HUNTERDON COUNTY 10180 HUNTERDON 2,257,612 1,607 5,763 2,264,982 2,144,887 0 3,568 13,155 2,161,610 HUNTERDON COUNTY VOCATIONAL 35140 HUNTERDON 65,383 0 0 65,383 70,000 0 0 0 70,000 KINGWOOD TOWNSHIP 22340 HUNTERDON 90,031 0 0 90,031 81,312 0 0 0 81,312 KINGWOOD TOWNSHIP BD OF ED 22343 HUNTERDON 61,763 0 0 61,763 51,507 0 0 0 51,507 LAMBERTVILLE CITY 23700 HUNTERDON 93,630 0 0 93,630 82,649 0 0 0 82,649
Page 34

Public Employee's Retirement SystemSchedule A - Schedule of Local Employer Contributions used toDetermine the Fiscal Year 2013 and Fiscal Year 2014 Proportionate Shares
Employer EmployerEmployer Employer Number County Contributions Contributions
Contributions for Fiscal Year 2014 Proportionate Shares Contributions for Fiscal Year 2013 Proportionate Shares
Fiscal Year 2015
Appropriation
Employer delayed
appropriations
Employer Contribution –
delayed enrollment
Fiscal Year 2014
AppropriationLate Reporting
Employers
Employer delayed
appropriations
Employer Contribution –
delayed enrollment
LAMBERTVILLE CITY BD OF ED 51713 HUNTERDON 34,396 0 0 34,396 27,620 0 0 0 27,620 LAMBERTVILLE CITY FIRE DIST #1 44300 HUNTERDON 0 0 0 0 1,747 0 0 0 1,747 LAMBERTVILLE SEWERAGE AUTH 55190 HUNTERDON 49,913 0 0 49,913 43,572 0 0 0 43,572 LEBANON BOROUGH 51750 HUNTERDON 18,181 0 0 18,181 16,359 0 0 0 16,359 LEBANON BOROUGH BD OF ED 51753 HUNTERDON 21,314 0 0 21,314 14,947 0 0 0 14,947 LEBANON TOWNSHIP 23510 HUNTERDON 113,786 0 0 113,786 97,172 0 0 0 97,172 LEBANON TOWNSHIP BD OF ED 23513 HUNTERDON 150,862 0 0 150,862 134,041 0 0 0 134,041 MILFORD BOROUGH 22900 HUNTERDON 34,088 0 0 34,088 28,713 0 0 0 28,713 MILFORD BOROUGH BD OF ED 22903 HUNTERDON 17,532 0 0 17,532 17,544 0 0 0 17,544 NORTH HUNTERDON MUNICIPAL COURT 31040 HUNTERDON 0 0 0 0 25,005 0 0 0 25,005 NORTH HUNTERDON-VOORHEES 40260 HUNTERDON 622,175 0 0 622,175 585,390 0 0 0 585,390 RARITAN TOWNSHIP 52810 HUNTERDON 390,027 0 0 390,027 397,904 0 0 0 397,904 RARITAN TWP MUN UTIL AUTHORITY 31640 HUNTERDON 212,741 0 0 212,741 191,365 0 0 0 191,365 READINGTON TOWNSHIP 23470 HUNTERDON 384,139 0 0 384,139 331,735 0 0 0 331,735 READINGTON TWP BD OF ED 23473 HUNTERDON 377,389 0 0 377,389 335,444 0 0 0 335,444 READINGTON-LEBANON SEW AUTH 32550 HUNTERDON 53,357 0 0 53,357 47,754 0 0 0 47,754 SOUTH HUNTERDON REG BD OF ED 40300 HUNTERDON 134,220 0 0 134,220 119,685 0 0 0 119,685 STOCKTON BOROUGH 53210 HUNTERDON 12,482 466 1,672 14,620 11,531 0 0 0 11,531 STOCKTON BOROUGH BD OF ED 53213 HUNTERDON 2,525 0 0 2,525 2,247 0 0 0 2,247 TEWKSBURY TOWNSHIP 53310 HUNTERDON 168,835 0 0 168,835 160,077 0 0 0 160,077 TEWKSBURY TWP BD OF ED 53313 HUNTERDON 129,932 0 0 129,932 129,308 0 0 0 129,308 UNION TOWNSHIP (HUNTERDON) 23420 HUNTERDON 46,415 0 0 46,415 41,353 0 0 0 41,353 UNION TWP OF ED (HUNTERDON) 23423 HUNTERDON 79,090 0 0 79,090 79,420 0 0 0 79,420 WEST AMWELL TOWNSHIP 23560 HUNTERDON 56,192 0 0 56,192 39,877 0 0 0 39,877 WEST AMWELL TWP BD OF ED 23563 HUNTERDON 44,626 0 0 44,626 41,409 0 0 0 41,409 EAST WINDSOR MUN UTIL AUTHORITY 55470 MERCER 191,173 0 0 191,173 162,593 0 0 0 162,593 EAST WINDSOR REG SCHOOL DIST 40310 MERCER 973,210 0 0 973,210 858,511 0 0 0 858,511 EAST WINDSOR TOWNSHIP 50860 MERCER 414,338 0 0 414,338 389,429 0 0 0 389,429 EMILY FISHER CHARTER SCHOOL 35530 MERCER 0 0 0 0 159,644 0 0 0 159,644 EWING LAWRENCE SEWERAGE AUTH 30320 MERCER 433,492 0 0 433,492 382,283 0 0 0 382,283 EWING TOWNSHIP 21740 MERCER 831,343 0 0 831,343 737,415 0 0 0 737,415 EWING TOWNSHIP BD OF ED 21743 MERCER 741,679 0 0 741,679 670,877 0 0 0 670,877 FOUNDATION ACADEMY CHARTER SCHL 46900 MERCER 78,372 0 0 78,372 46,641 0 0 0 46,641 HAMILTON TOWNSHIP (MERCER) 21070 MERCER 2,866,322 1,120 5,447 2,872,889 2,608,894 0 2,415 8,903 2,620,211 HAMILTON TWP BD OF ED (MERCER) 21073 MERCER 2,306,826 0 0 2,306,826 2,057,609 0 0 0 2,057,609 HAMILTON TWP FIRE DISTRICT 4 56020 MERCER 1,442 0 0 1,442 1,322 0 0 0 1,322 HAMILTON TWP FIRE DISTRICT 5 56040 MERCER 1,580 0 0 1,580 2,348 0 0 0 2,348 HAMILTON TWP FIRE DISTRICT 6 55330 MERCER 2,860 0 0 2,860 2,622 0 0 0 2,622 HAMILTON TWP FIRE DISTRICT 7 30910 MERCER 13,793 0 0 13,793 12,536 0 0 0 12,536 HAMILTON TWP FIRE DISTRICT 8 32940 MERCER 4,829 0 0 4,829 4,424 0 0 0 4,424 HAMILTON TWP FIRE DISTRICT 9 31410 MERCER 11,329 0 0 11,329 10,301 0 0 0 10,301 HIGHTSTOWN BORO HOUSING AUTH 31180 MERCER 22,876 0 0 22,876 24,337 0 0 0 24,337 HIGHTSTOWN BOROUGH 51470 MERCER 204,791 0 0 204,791 175,929 0 2,934 10,816 189,679 HOPEWELL BOROUGH 23600 MERCER 66,688 0 0 66,688 60,609 0 0 0 60,609 HOPEWELL TOWNSHIP (MERCER) 51560 MERCER 547,760 0 0 547,760 504,358 0 0 0 504,358 HOPEWELL TWP FIRE DISTRICT 1 35260 MERCER 13,262 0 0 13,262 11,990 0 0 0 11,990 HOPEWELL VALLEY REG SCH DIST 40320 MERCER 893,953 0 0 893,953 779,328 0 0 0 779,328 INTERNATIONAL CHARTER SCHOOL 35690 MERCER 20,665 0 0 20,665 21,290 0 0 0 21,290 LAWRENCE TOWNSHIP (MERCER) 21420 MERCER 702,330 0 0 702,330 698,824 0 0 0 698,824 LAWRENCE TWP BD OF ED (MERCER) 21423 MERCER 912,453 0 0 912,453 829,480 0 0 0 829,480 MERCER CO BD OF SOCIAL SERVICE 10171 MERCER 3,467,297 0 0 3,467,297 3,211,002 0 0 0 3,211,002 MERCER CO COMMUNITY COLLEGE 55500 MERCER 1,515,646 0 0 1,515,646 1,404,953 0 0 0 1,404,953 MERCER CO IMPROVEMENT AUTHORITY 31370 MERCER 218,612 0 0 218,612 200,124 0 0 0 200,124 MERCER CO SOIL CONSERVTN DIST 33060 MERCER 50,246 0 0 50,246 45,320 0 0 0 45,320 MERCER CO SPECIAL SER SCH DIST 32670 MERCER 961,925 2,330 8,356 972,611 894,329 0 0 0 894,329 MERCER CO VOCATIONAL SCHOOLS 10173 MERCER 268,236 0 0 268,236 227,713 0 0 0 227,713 MERCER COUNTY 10170 MERCER 5,843,560 0 0 5,843,560 5,375,734 0 0 0 5,375,734 MERCER COUNTY 10178 MERCER 967,175 0 0 967,175 813,206 0 0 0 813,206 OCEAN GROVE BD OF FIRE COMM 31680 MERCER 1,873 0 0 1,873 1,671 0 0 0 1,671 PACE CHARTER SCHOOL OF HAMILTON 37400 MERCER 20,682 0 0 20,682 11,687 0 0 0 11,687 PAUL ROBESON CHTR SCHOOL 48200 MERCER 150,916 0 0 150,916 22,472 0 6,931 25,306 54,710
Page 35

Public Employee's Retirement SystemSchedule A - Schedule of Local Employer Contributions used toDetermine the Fiscal Year 2013 and Fiscal Year 2014 Proportionate Shares
Employer EmployerEmployer Employer Number County Contributions Contributions
Contributions for Fiscal Year 2014 Proportionate Shares Contributions for Fiscal Year 2013 Proportionate Shares
Fiscal Year 2015
Appropriation
Employer delayed
appropriations
Employer Contribution –
delayed enrollment
Fiscal Year 2014
AppropriationLate Reporting
Employers
Employer delayed
appropriations
Employer Contribution –
delayed enrollment
PENNINGTON BOROUGH 22910 MERCER 82,018 0 0 82,018 70,038 0 0 0 70,038 PRINCETON 51500 MERCER 1,190,584 0 0 1,190,584 0 0 0 0 0 PRINCETON BOROUGH 20020 MERCER 0 0 0 0 543,327 0 0 0 543,327 PRINCETON CHARTER SCHOOL 35310 MERCER 24,676 0 0 24,676 21,873 0 0 0 21,873 PRINCETON HOUSING AUTHORITY 55520 MERCER 38,968 0 0 38,968 38,514 0 0 0 38,514 PRINCETON JOINT PUBLIC LIBRARY 40110 MERCER 242,905 0 0 242,905 237,988 0 0 0 237,988 PRINCETON REGIONAL SCHOOL 40180 MERCER 989,595 0 0 989,595 852,830 0 0 0 852,830 PRINCETON TOWNSHIP 20140 MERCER 0 0 0 0 654,324 0 0 0 654,324 ROBBINSVILLE TOWNSHIP 53570 MERCER 401,123 0 0 401,123 347,191 0 0 0 347,191 ROBBINSVILLE TWP BD OF ED 53573 MERCER 277,928 0 0 277,928 241,474 0 0 0 241,474 TRENTON CITY 21780 MERCER 3,494,132 6,127 21,977 3,522,236 3,186,705 0 3,307 12,192 3,202,204 TRENTON CITY BD OF ED 21783 MERCER 2,552,357 2,491 8,995 2,563,843 2,104,314 0 1,745 6,300 2,112,359 TRENTON HOUSING AUTHORITY 30130 MERCER 421,743 0 0 421,743 345,592 0 0 0 345,592 TRENTON PARKING AUTHORITY 30580 MERCER 29,321 0 0 29,321 29,795 0 1,437 5,299 36,531 VILLAGE CHARTER SCHOOL 37100 MERCER 60,111 0 0 60,111 43,612 0 0 0 43,612 WEST WINDSOR PARKING AUTHORITY 32110 MERCER 39,999 0 0 39,999 35,366 0 0 0 35,366 WEST WINDSOR PLAINSBORO REG 40440 MERCER 1,284,774 0 0 1,284,774 1,214,546 0 0 0 1,214,546 WEST WINDSOR TOWNSHIP 53720 MERCER 698,964 0 0 698,964 655,094 0 0 0 655,094 ACADEMY FOR URBAN LEADERSHIP 49100 MIDDLESEX 12,103 0 0 12,103 13,010 0 0 0 13,010 CARTERET BD OF ED 21333 MIDDLESEX 481,769 0 0 481,769 435,145 0 0 0 435,145 CARTERET BOROUGH 21330 MIDDLESEX 555,736 0 0 555,736 557,928 0 0 0 557,928 CARTERET HOUSING AUTHORITY 56140 MIDDLESEX 119,862 0 0 119,862 103,642 0 0 0 103,642 CARTERET PORT AUTHORITY 45200 MIDDLESEX 476 0 0 476 437 0 0 0 437 CARTERET REDEVELOPMENT AGENCY 42000 MIDDLESEX 4,038 0 0 4,038 3,700 0 0 0 3,700 CRANBURY TOWNSHIP 50650 MIDDLESEX 177,460 0 0 177,460 174,723 0 0 0 174,723 CRANBURY TOWNSHIP BD OF ED 50653 MIDDLESEX 103,469 0 0 103,469 105,130 0 0 0 105,130 DUNELLEN BOARD OF EDUCATION 50773 MIDDLESEX 133,225 0 0 133,225 112,446 0 0 0 112,446 DUNELLEN BOROUGH 50770 MIDDLESEX 115,619 0 0 115,619 113,203 0 0 0 113,203 DUNELLEN PARKING AUTHORITY 55700 MIDDLESEX 13,657 0 0 13,657 11,664 0 0 0 11,664 EAST BRUNSWICK TOWNSHIP 22410 MIDDLESEX 1,415,354 0 0 1,415,354 1,282,017 0 558 2,056 1,284,631 EAST BRUNSWICK TWP BD OF ED 22413 MIDDLESEX 1,590,486 347 1,535 1,592,368 1,454,684 0 0 0 1,454,684 EAST BRUNSWICK TWP FIRE DIST #1 34960 MIDDLESEX 20,940 0 0 20,940 19,833 0 0 0 19,833 EAST BRUNSWICK TWP FIRE DIST #2 34840 MIDDLESEX 17,978 0 0 17,978 13,976 0 0 0 13,976 EDISON TOWNSHIP 21450 MIDDLESEX 2,151,069 3,955 14,188 2,169,212 2,018,621 0 0 0 2,018,621 EDISON TWP BD OF ED 21453 MIDDLESEX 2,362,477 0 0 2,362,477 2,039,756 0 0 0 2,039,756 EDISON TWP HOUSING AUTHORITY 30600 MIDDLESEX 63,587 0 0 63,587 53,809 0 0 0 53,809 GREATER BRUNSWICK CHART.SCHOOL 35560 MIDDLESEX 100,867 0 0 100,867 67,105 0 0 0 67,105 HATIKVAH INTERNAT'L ACAD CHRTR 49200 MIDDLESEX 33,622 0 0 33,622 28,727 0 0 0 28,727 HELMETTA BOROUGH 51440 MIDDLESEX 39,825 0 0 39,825 40,446 0 0 0 40,446 HIGHLAND PARK BD OF ED 23093 MIDDLESEX 267,746 0 0 267,746 235,682 0 0 0 235,682 HIGHLAND PARK BOROUGH 23090 MIDDLESEX 396,348 0 0 396,348 373,161 0 0 0 373,161 HIGHLAND PARK HOUSING AUTHORITY 56400 MIDDLESEX 16,026 0 0 16,026 0 25,357 0 0 25,357 JAMESBURG BOROUGH 51620 MIDDLESEX 99,094 0 0 99,094 91,495 0 0 0 91,495 JAMESBURG BOROUGH BD OF ED 51623 MIDDLESEX 80,721 0 0 80,721 74,193 0 0 0 74,193 METUCHEN BORO BD OF ED 22783 MIDDLESEX 344,972 0 0 344,972 301,637 0 0 0 301,637 METUCHEN BOROUGH 22780 MIDDLESEX 329,418 0 0 329,418 306,507 0 0 0 306,507 METUCHEN PARKING AUTHORITY 56030 MIDDLESEX 21,158 0 0 21,158 18,447 0 0 0 18,447 MIDDLE BROOK REG HEALTH COMM 31480 MIDDLESEX 30,719 0 0 30,719 27,731 0 0 0 27,731 MIDDLESEX BD OF ED 20963 MIDDLESEX 348,870 0 0 348,870 306,014 0 0 0 306,014 MIDDLESEX BOROUGH 20960 MIDDLESEX 265,022 0 0 265,022 237,763 0 0 0 237,763 MIDDLESEX CO BD OF SOCIAL SRV 10041 MIDDLESEX 2,234,338 0 0 2,234,338 2,135,752 0 0 0 2,135,752 MIDDLESEX CO ED SERV COMM 32590 MIDDLESEX 863,301 0 0 863,301 784,072 0 0 0 784,072 MIDDLESEX CO JT HEALTH INS FUND 35280 MIDDLESEX 3,501 0 0 3,501 14,118 0 0 0 14,118 MIDDLESEX CO MOSQ EXTERM COMM 10042 MIDDLESEX 109,618 0 0 109,618 102,553 0 0 0 102,553 MIDDLESEX CO MUN JT INS FUND 34490 MIDDLESEX 52,936 0 0 52,936 55,983 0 0 0 55,983 MIDDLESEX CO UTILITIES AUTH 30560 MIDDLESEX 1,515,507 0 0 1,515,507 1,345,088 0 0 0 1,345,088 MIDDLESEX CO VOCATIONAL SCHOOL 10043 MIDDLESEX 588,623 0 0 588,623 537,500 0 0 0 537,500 MIDDLESEX COUNTY 10040 MIDDLESEX 8,213,826 27,404 98,221 8,339,451 7,817,226 0 1,153 4,252 7,822,631 MIDDLESEX COUNTY COLLEGE 30940 MIDDLESEX 2,031,612 0 0 2,031,612 1,896,702 0 0 0 1,896,702 MIDDLESEX COUNTY IMPROV AUTH 35120 MIDDLESEX 2,557,184 0 0 2,557,184 2,163,845 0 0 0 2,163,845 MILLTOWN BOROUGH 22230 MIDDLESEX 279,940 0 0 279,940 236,243 0 0 0 236,243
Page 36

Public Employee's Retirement SystemSchedule A - Schedule of Local Employer Contributions used toDetermine the Fiscal Year 2013 and Fiscal Year 2014 Proportionate Shares
Employer EmployerEmployer Employer Number County Contributions Contributions
Contributions for Fiscal Year 2014 Proportionate Shares Contributions for Fiscal Year 2013 Proportionate Shares
Fiscal Year 2015
Appropriation
Employer delayed
appropriations
Employer Contribution –
delayed enrollment
Fiscal Year 2014
AppropriationLate Reporting
Employers
Employer delayed
appropriations
Employer Contribution –
delayed enrollment
MILLTOWN BOROUGH BD OF ED 22233 MIDDLESEX 101,486 0 0 101,486 89,654 0 0 0 89,654 MONROE TOWNSHIP (MIDDLESEX) 52210 MIDDLESEX 1,614,906 0 0 1,614,906 1,501,945 0 0 0 1,501,945 MONROE TWP BD OF ED (MIDDLESEX) 52213 MIDDLESEX 1,323,750 0 0 1,323,750 1,150,506 0 0 0 1,150,506 MONROE TWP FIRE DISTRICT 1 35600 MIDDLESEX 3,612 0 0 3,612 4,698 0 0 0 4,698 MONROE TWP FIRE DISTRICT 2 34510 MIDDLESEX 7,711 0 0 7,711 7,065 0 0 0 7,065 MONROE TWP FIRE DISTRICT 3 34870 MIDDLESEX 21,811 0 0 21,811 29,324 0 0 0 29,324 NEW BRUNSWICK BD OF ED 20193 MIDDLESEX 2,131,187 0 0 2,131,187 1,893,837 0 0 0 1,893,837 NEW BRUNSWICK CITY 20190 MIDDLESEX 1,517,802 0 0 1,517,802 1,334,911 0 0 0 1,334,911 NEW BRUNSWICK HOUSING AUTHORITY 30250 MIDDLESEX 144,234 0 0 144,234 122,274 0 0 0 122,274 NEW BRUNSWICK PARKING AUTHORITY 30430 MIDDLESEX 393,344 0 0 393,344 0 350,799 0 0 350,799 NORTH BRUNSWICK BD OF ED 23333 MIDDLESEX 943,417 0 0 943,417 874,371 0 0 0 874,371 NORTH BRUNSWICK TOWNSHIP 23330 MIDDLESEX 853,152 0 0 853,152 784,008 0 0 0 784,008 OLD BRIDGE BD OF ED 51933 MIDDLESEX 1,468,193 0 0 1,468,193 1,287,953 0 0 0 1,287,953 OLD BRIDGE HOUSING AUTHORITY 42600 MIDDLESEX 3,354 0 0 3,354 3,073 0 0 0 3,073 OLD BRIDGE MUNICIPAL UTIL AUTH 34340 MIDDLESEX 556,279 0 0 556,279 461,968 0 0 0 461,968 OLD BRIDGE TOWNSHIP 51930 MIDDLESEX 1,083,312 0 0 1,083,312 972,651 0 0 0 972,651 OLD BRIDGE TWP FIRE DISTRICT 2 55740 MIDDLESEX 20,957 0 0 20,957 14,622 0 0 0 14,622 OLD BRIDGE TWP FIRE DISTRICT 3 34470 MIDDLESEX 15,204 0 0 15,204 16,857 0 213 783 17,853 PERTH AMBOY BD OF ED 20203 MIDDLESEX 2,933,124 0 0 2,933,124 2,551,849 0 0 0 2,551,849 PERTH AMBOY CITY 20200 MIDDLESEX 1,144,810 0 0 1,144,810 1,078,624 0 0 0 1,078,624 PERTH AMBOY HOUSING AUTHORITY 30380 MIDDLESEX 220,407 0 0 220,407 213,944 0 0 0 213,944 PERTH AMBOY PORT AUTHORITY 34250 MIDDLESEX 0 0 0 0 3,352 0 0 0 3,352 PISCATAWAY BD OF ED ADMN BLDG 22623 MIDDLESEX 1,413,651 0 0 1,413,651 1,241,996 0 2,583 9,524 1,254,103 PISCATAWAY TOWNSHIP 22620 MIDDLESEX 1,114,117 0 0 1,114,117 1,019,485 0 0 0 1,019,485 PLAINSBORO TOWNSHIP 52720 MIDDLESEX 601,721 0 0 601,721 543,254 0 0 0 543,254 PLAINSBORO TWP FIRE DISTRICT 1 34950 MIDDLESEX 10,759 0 0 10,759 1,747 0 0 0 1,747 SAYREVILLE BD OF ED_SELOVER ELM 21023 MIDDLESEX 962,950 0 0 962,950 909,810 0 0 0 909,810 SAYREVILLE BOROUGH 21020 MIDDLESEX 1,121,887 0 0 1,121,887 1,038,721 0 2,166 7,985 1,048,872 SAYREVILLE ECON & REDEV. AGENCY 42700 MIDDLESEX 7,153 0 0 7,153 6,554 0 0 0 6,554 SAYREVILLE HOUSING AUTHORITY 34330 MIDDLESEX 6,908 0 0 6,908 19,718 0 0 0 19,718 SOUTH AMBOY BD OF ED 23633 MIDDLESEX 167,384 0 0 167,384 146,668 0 0 0 146,668 SOUTH AMBOY CITY 23630 MIDDLESEX 259,318 0 0 259,318 238,501 0 0 0 238,501 SOUTH AMBOY HOUSING AUTHORITY 56380 MIDDLESEX 33,795 0 0 33,795 22,261 0 4,712 17,373 44,347 SOUTH BRUNSWICK BD OF ED 23033 MIDDLESEX 1,848,669 0 0 1,848,669 1,610,168 0 0 0 1,610,168 SOUTH BRUNSWICK TOWNSHIP 23030 MIDDLESEX 1,649,800 0 0 1,649,800 1,508,666 0 0 0 1,508,666 SOUTH PLAINFIELD BD OF ED 21833 MIDDLESEX 506,796 0 0 506,796 459,587 0 0 0 459,587 SOUTH PLAINFIELD BOROUGH 21830 MIDDLESEX 532,110 0 0 532,110 452,389 0 0 0 452,389 SOUTH RIVER BORO BD OF ED 20493 MIDDLESEX 198,706 0 0 198,706 193,572 0 0 0 193,572 SOUTH RIVER BOROUGH 20490 MIDDLESEX 553,846 0 0 553,846 500,903 0 0 0 500,903 SPOTSWOOD BD OF ED 53163 MIDDLESEX 280,512 0 0 280,512 268,983 0 0 0 268,983 SPOTSWOOD BOROUGH 53160 MIDDLESEX 211,364 0 0 211,364 197,235 0 0 0 197,235 WOODBRIDGE HOUSING AUTHORITY 55350 MIDDLESEX 193,838 0 0 193,838 163,969 0 0 0 163,969 WOODBRIDGE TOWNSHIP 21960 MIDDLESEX 3,881,277 0 0 3,881,277 3,346,623 0 0 0 3,346,623 WOODBRIDGE TOWNSHIP BD OF ED 21963 MIDDLESEX 1,663,505 0 0 1,663,505 1,472,255 0 0 0 1,472,255 WOODBRIDGE TWP FIRE DIST 5 34910 MIDDLESEX 14,301 0 0 14,301 12,943 0 0 0 12,943 WOODBRIDGE TWP FIRE DISTRICT 1 56050 MIDDLESEX 6,627 0 0 6,627 5,954 0 0 0 5,954 WOODBRIDGE TWP FIRE DISTRICT 11 34830 MIDDLESEX 9,659 0 0 9,659 8,676 0 0 0 8,676 WOODBRIDGE TWP FIRE DISTRICT 12 35360 MIDDLESEX 5,161 0 0 5,161 4,654 0 0 0 4,654 WOODBRIDGE TWP FIRE DISTRICT 2 56230 MIDDLESEX 4,471 0 0 4,471 4,097 0 0 0 4,097 WOODBRIDGE TWP FIRE DISTRICT 7 35800 MIDDLESEX 29,439 0 0 29,439 20,139 0 0 0 20,139 WOODBRIDGE TWP FIRE DISTRICT 8 36000 MIDDLESEX 4,549 0 0 4,549 4,386 0 0 0 4,386 WOODBRIDGE TWP FIRE DISTRICT 9 32090 MIDDLESEX 27,630 0 0 27,630 25,315 0 0 0 25,315 ABERDEEN TOWNSHIP 52050 MONMOUTH 407,816 0 0 407,816 353,631 0 0 0 353,631 ABERDEEN TWP FIRE DIST 2 34150 MONMOUTH 10,709 0 0 10,709 12,562 0 0 0 12,562 ABERDEEN TWP FIRE DISTRICT 1 32620 MONMOUTH 12,428 0 0 12,428 7,825 0 0 0 7,825 ACADEMY CHARTER HIGH SCHOOL 35540 MONMOUTH 30,215 0 0 30,215 24,269 0 0 0 24,269 ALLENHURST BOROUGH 21570 MONMOUTH 104,206 0 0 104,206 97,933 0 0 0 97,933 ALLENTOWN BOROUGH 50050 MONMOUTH 27,856 0 0 27,856 26,631 0 0 0 26,631 ASBURY PARK BD OF ED 20163 MONMOUTH 870,380 0 0 870,380 753,127 0 0 0 753,127 ASBURY PARK CITY 20160 MONMOUTH 589,265 0 0 589,265 562,308 0 0 0 562,308 ASBURY PK HOUSING AUTHORITY 30230 MONMOUTH 147,111 0 0 147,111 150,943 0 0 0 150,943
Page 37
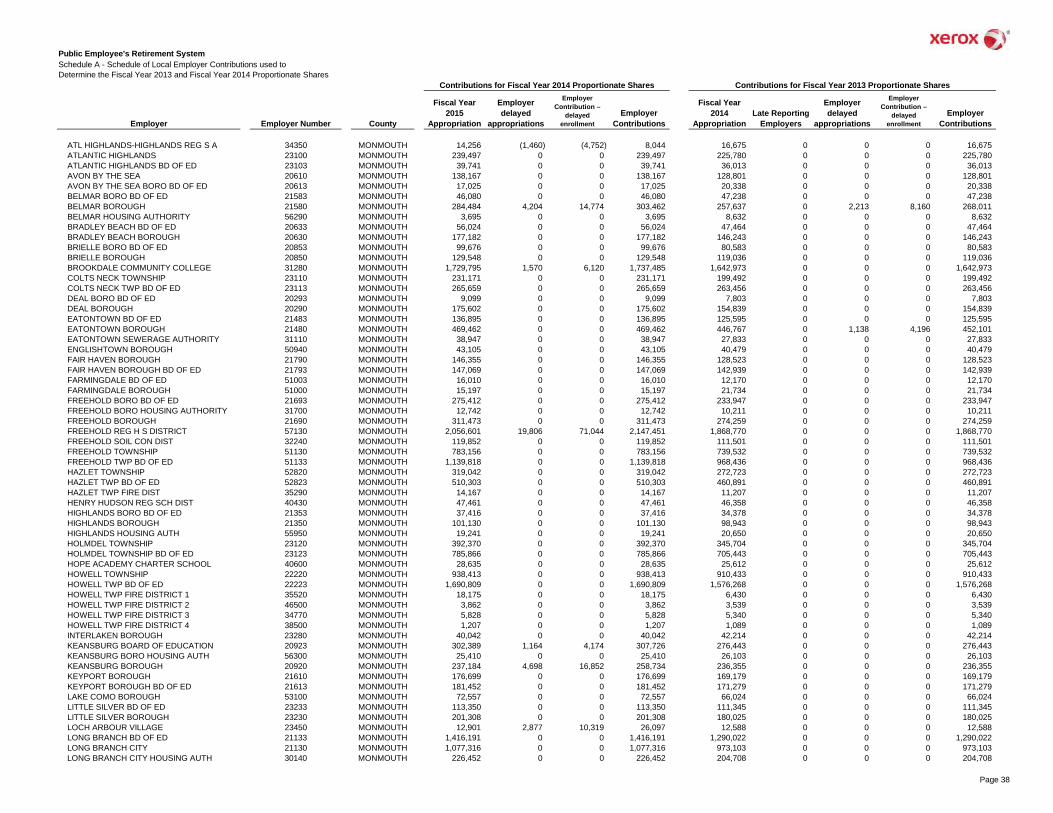
Public Employee's Retirement SystemSchedule A - Schedule of Local Employer Contributions used toDetermine the Fiscal Year 2013 and Fiscal Year 2014 Proportionate Shares
Employer EmployerEmployer Employer Number County Contributions Contributions
Contributions for Fiscal Year 2014 Proportionate Shares Contributions for Fiscal Year 2013 Proportionate Shares
Fiscal Year 2015
Appropriation
Employer delayed
appropriations
Employer Contribution –
delayed enrollment
Fiscal Year 2014
AppropriationLate Reporting
Employers
Employer delayed
appropriations
Employer Contribution –
delayed enrollment
ATL HIGHLANDS-HIGHLANDS REG S A 34350 MONMOUTH 14,256 (1,460) (4,752) 8,044 16,675 0 0 0 16,675 ATLANTIC HIGHLANDS 23100 MONMOUTH 239,497 0 0 239,497 225,780 0 0 0 225,780 ATLANTIC HIGHLANDS BD OF ED 23103 MONMOUTH 39,741 0 0 39,741 36,013 0 0 0 36,013 AVON BY THE SEA 20610 MONMOUTH 138,167 0 0 138,167 128,801 0 0 0 128,801 AVON BY THE SEA BORO BD OF ED 20613 MONMOUTH 17,025 0 0 17,025 20,338 0 0 0 20,338 BELMAR BORO BD OF ED 21583 MONMOUTH 46,080 0 0 46,080 47,238 0 0 0 47,238 BELMAR BOROUGH 21580 MONMOUTH 284,484 4,204 14,774 303,462 257,637 0 2,213 8,160 268,011 BELMAR HOUSING AUTHORITY 56290 MONMOUTH 3,695 0 0 3,695 8,632 0 0 0 8,632 BRADLEY BEACH BD OF ED 20633 MONMOUTH 56,024 0 0 56,024 47,464 0 0 0 47,464 BRADLEY BEACH BOROUGH 20630 MONMOUTH 177,182 0 0 177,182 146,243 0 0 0 146,243 BRIELLE BORO BD OF ED 20853 MONMOUTH 99,676 0 0 99,676 80,583 0 0 0 80,583 BRIELLE BOROUGH 20850 MONMOUTH 129,548 0 0 129,548 119,036 0 0 0 119,036 BROOKDALE COMMUNITY COLLEGE 31280 MONMOUTH 1,729,795 1,570 6,120 1,737,485 1,642,973 0 0 0 1,642,973 COLTS NECK TOWNSHIP 23110 MONMOUTH 231,171 0 0 231,171 199,492 0 0 0 199,492 COLTS NECK TWP BD OF ED 23113 MONMOUTH 265,659 0 0 265,659 263,456 0 0 0 263,456 DEAL BORO BD OF ED 20293 MONMOUTH 9,099 0 0 9,099 7,803 0 0 0 7,803 DEAL BOROUGH 20290 MONMOUTH 175,602 0 0 175,602 154,839 0 0 0 154,839 EATONTOWN BD OF ED 21483 MONMOUTH 136,895 0 0 136,895 125,595 0 0 0 125,595 EATONTOWN BOROUGH 21480 MONMOUTH 469,462 0 0 469,462 446,767 0 1,138 4,196 452,101 EATONTOWN SEWERAGE AUTHORITY 31110 MONMOUTH 38,947 0 0 38,947 27,833 0 0 0 27,833 ENGLISHTOWN BOROUGH 50940 MONMOUTH 43,105 0 0 43,105 40,479 0 0 0 40,479 FAIR HAVEN BOROUGH 21790 MONMOUTH 146,355 0 0 146,355 128,523 0 0 0 128,523 FAIR HAVEN BOROUGH BD OF ED 21793 MONMOUTH 147,069 0 0 147,069 142,939 0 0 0 142,939 FARMINGDALE BD OF ED 51003 MONMOUTH 16,010 0 0 16,010 12,170 0 0 0 12,170 FARMINGDALE BOROUGH 51000 MONMOUTH 15,197 0 0 15,197 21,734 0 0 0 21,734 FREEHOLD BORO BD OF ED 21693 MONMOUTH 275,412 0 0 275,412 233,947 0 0 0 233,947 FREEHOLD BORO HOUSING AUTHORITY 31700 MONMOUTH 12,742 0 0 12,742 10,211 0 0 0 10,211 FREEHOLD BOROUGH 21690 MONMOUTH 311,473 0 0 311,473 274,259 0 0 0 274,259 FREEHOLD REG H S DISTRICT 57130 MONMOUTH 2,056,601 19,806 71,044 2,147,451 1,868,770 0 0 0 1,868,770 FREEHOLD SOIL CON DIST 32240 MONMOUTH 119,852 0 0 119,852 111,501 0 0 0 111,501 FREEHOLD TOWNSHIP 51130 MONMOUTH 783,156 0 0 783,156 739,532 0 0 0 739,532 FREEHOLD TWP BD OF ED 51133 MONMOUTH 1,139,818 0 0 1,139,818 968,436 0 0 0 968,436 HAZLET TOWNSHIP 52820 MONMOUTH 319,042 0 0 319,042 272,723 0 0 0 272,723 HAZLET TWP BD OF ED 52823 MONMOUTH 510,303 0 0 510,303 460,891 0 0 0 460,891 HAZLET TWP FIRE DIST 35290 MONMOUTH 14,167 0 0 14,167 11,207 0 0 0 11,207 HENRY HUDSON REG SCH DIST 40430 MONMOUTH 47,461 0 0 47,461 46,358 0 0 0 46,358 HIGHLANDS BORO BD OF ED 21353 MONMOUTH 37,416 0 0 37,416 34,378 0 0 0 34,378 HIGHLANDS BOROUGH 21350 MONMOUTH 101,130 0 0 101,130 98,943 0 0 0 98,943 HIGHLANDS HOUSING AUTH 55950 MONMOUTH 19,241 0 0 19,241 20,650 0 0 0 20,650 HOLMDEL TOWNSHIP 23120 MONMOUTH 392,370 0 0 392,370 345,704 0 0 0 345,704 HOLMDEL TOWNSHIP BD OF ED 23123 MONMOUTH 785,866 0 0 785,866 705,443 0 0 0 705,443 HOPE ACADEMY CHARTER SCHOOL 40600 MONMOUTH 28,635 0 0 28,635 25,612 0 0 0 25,612 HOWELL TOWNSHIP 22220 MONMOUTH 938,413 0 0 938,413 910,433 0 0 0 910,433 HOWELL TWP BD OF ED 22223 MONMOUTH 1,690,809 0 0 1,690,809 1,576,268 0 0 0 1,576,268 HOWELL TWP FIRE DISTRICT 1 35520 MONMOUTH 18,175 0 0 18,175 6,430 0 0 0 6,430 HOWELL TWP FIRE DISTRICT 2 46500 MONMOUTH 3,862 0 0 3,862 3,539 0 0 0 3,539 HOWELL TWP FIRE DISTRICT 3 34770 MONMOUTH 5,828 0 0 5,828 5,340 0 0 0 5,340 HOWELL TWP FIRE DISTRICT 4 38500 MONMOUTH 1,207 0 0 1,207 1,089 0 0 0 1,089 INTERLAKEN BOROUGH 23280 MONMOUTH 40,042 0 0 40,042 42,214 0 0 0 42,214 KEANSBURG BOARD OF EDUCATION 20923 MONMOUTH 302,389 1,164 4,174 307,726 276,443 0 0 0 276,443 KEANSBURG BORO HOUSING AUTH 56300 MONMOUTH 25,410 0 0 25,410 26,103 0 0 0 26,103 KEANSBURG BOROUGH 20920 MONMOUTH 237,184 4,698 16,852 258,734 236,355 0 0 0 236,355 KEYPORT BOROUGH 21610 MONMOUTH 176,699 0 0 176,699 169,179 0 0 0 169,179 KEYPORT BOROUGH BD OF ED 21613 MONMOUTH 181,452 0 0 181,452 171,279 0 0 0 171,279 LAKE COMO BOROUGH 53100 MONMOUTH 72,557 0 0 72,557 66,024 0 0 0 66,024 LITTLE SILVER BD OF ED 23233 MONMOUTH 113,350 0 0 113,350 111,345 0 0 0 111,345 LITTLE SILVER BOROUGH 23230 MONMOUTH 201,308 0 0 201,308 180,025 0 0 0 180,025 LOCH ARBOUR VILLAGE 23450 MONMOUTH 12,901 2,877 10,319 26,097 12,588 0 0 0 12,588 LONG BRANCH BD OF ED 21133 MONMOUTH 1,416,191 0 0 1,416,191 1,290,022 0 0 0 1,290,022 LONG BRANCH CITY 21130 MONMOUTH 1,077,316 0 0 1,077,316 973,103 0 0 0 973,103 LONG BRANCH CITY HOUSING AUTH 30140 MONMOUTH 226,452 0 0 226,452 204,708 0 0 0 204,708
Page 38

Public Employee's Retirement SystemSchedule A - Schedule of Local Employer Contributions used toDetermine the Fiscal Year 2013 and Fiscal Year 2014 Proportionate Shares
Employer EmployerEmployer Employer Number County Contributions Contributions
Contributions for Fiscal Year 2014 Proportionate Shares Contributions for Fiscal Year 2013 Proportionate Shares
Fiscal Year 2015
Appropriation
Employer delayed
appropriations
Employer Contribution –
delayed enrollment
Fiscal Year 2014
AppropriationLate Reporting
Employers
Employer delayed
appropriations
Employer Contribution –
delayed enrollment
LONG BRANCH SEWERAGE AUTHORITY 30340 MONMOUTH 154,550 0 0 154,550 133,653 0 0 0 133,653 MANALAPAN ENGLISHTOWN REGIONAL 57250 MONMOUTH 1,308,745 0 0 1,308,745 1,229,830 0 0 0 1,229,830 MANALAPAN FIRE DISTRICT 2 46200 MONMOUTH 10,366 0 0 10,366 9,551 0 0 0 9,551 MANALAPAN TOWNSHIP 51960 MONMOUTH 575,519 0 0 575,519 543,969 0 0 0 543,969 MANALAPAN TWP FIRE DISTRICT 1 44800 MONMOUTH 4,123 0 0 4,123 4,666 0 0 0 4,666 MANASQUAN BORO FIRE DISTRICT 1 44900 MONMOUTH 4,842 0 0 4,842 4,349 0 0 0 4,349 MANASQUAN BOROUGH 20940 MONMOUTH 223,779 0 0 223,779 213,686 0 0 0 213,686 MANASQUAN BOROUGH BD OF ED 20943 MONMOUTH 220,577 0 0 220,577 224,159 0 0 0 224,159 MARLBORO TOWNSHIP 23360 MONMOUTH 844,947 0 0 844,947 777,213 0 0 0 777,213 MARLBORO TOWNSHIP BD OF ED 23363 MONMOUTH 921,313 0 0 921,313 860,288 0 0 0 860,288 MARLBORO TWP FIRE DISTRICT 3 46300 MONMOUTH 1,371 0 0 1,371 1,758 0 0 0 1,758 MATAWAN ABERDEEN PUBLIC LIB 31420 MONMOUTH 55,654 0 0 55,654 49,010 0 0 0 49,010 MATAWAN BOROUGH 20950 MONMOUTH 189,647 0 0 189,647 156,179 0 0 0 156,179 MATAWAN-ABERDEEN REG SCHOOL 40400 MONMOUTH 488,070 0 0 488,070 397,948 0 0 0 397,948 MIDDLETOWN TOWNSHIP 22350 MONMOUTH 1,338,907 0 0 1,338,907 1,190,893 0 (3,404) (12,017) 1,175,472 MIDDLETOWN TWP BD OF ED 22353 MONMOUTH 1,821,579 0 0 1,821,579 1,536,107 0 0 0 1,536,107 MIDDLETOWN TWP HOUSING AUTH 31980 MONMOUTH 43,987 0 0 43,987 51,569 0 0 0 51,569 MIDDLETOWN TWP SEWERAGE AUTH 55730 MONMOUTH 224,698 0 0 224,698 227,073 0 0 0 227,073 MILLSTONE TOWNSHIP 52170 MONMOUTH 143,715 0 0 143,715 126,210 0 0 0 126,210 MILLSTONE TOWNSHIP BD OF ED 23823 MONMOUTH 297,563 0 0 297,563 274,584 0 0 0 274,584 MILLSTONE TOWNSHIP FIRE DIST #1 43400 MONMOUTH 7,981 0 0 7,981 13,147 0 0 0 13,147 MNMUTH CO BAYSHORE OUTFLL AUTH 31770 MONMOUTH 44,169 0 0 44,169 40,504 0 0 0 40,504 MONMOUTH BEACH BD OF ED 21373 MONMOUTH 18,976 0 0 18,976 26,137 0 0 0 26,137 MONMOUTH BEACH BOROUGH 21370 MONMOUTH 96,475 0 0 96,475 103,445 0 0 0 103,445 MONMOUTH CO DIV OF SOCIAL SERVI 10081 MONMOUTH 2,247,777 0 0 2,247,777 2,085,811 0 0 0 2,085,811 MONMOUTH CO HEALTH DEPARTMENT 32730 MONMOUTH 308,168 0 0 308,168 278,751 0 0 0 278,751 MONMOUTH CO MOSQ EXTERM COMM 10082 MONMOUTH 122,784 0 0 122,784 133,320 0 0 0 133,320 MONMOUTH CO REG HLTH COMM 1 31130 MONMOUTH 120,823 0 0 120,823 110,710 0 0 0 110,710 MONMOUTH CO VOCATIONAL SCHOOLS 10083 MONMOUTH 417,709 0 0 417,709 381,527 0 0 0 381,527 MONMOUTH COUNTY/HALL OF RECORDS 10080 MONMOUTH 11,283,533 0 0 11,283,533 10,444,175 0 0 0 10,444,175 MONMOUTH REGIONAL SCHOOL 40090 MONMOUTH 284,458 0 0 284,458 274,054 0 0 0 274,054 NEPTUNE CITY BD OF ED 21813 MONMOUTH 61,862 0 0 61,862 51,747 0 0 0 51,747 NEPTUNE CITY BOROUGH 21810 MONMOUTH 136,596 0 0 136,596 123,105 0 0 0 123,105 NEPTUNE CITY HOUSING AUTHORITY 32950 MONMOUTH 0 0 0 0 3,474 0 0 0 3,474 NEPTUNE FIRE DISTRICT 1 45900 MONMOUTH 12,085 0 0 12,085 10,505 0 0 0 10,505 NEPTUNE TOWNSHIP 21230 MONMOUTH 860,285 5,237 18,787 884,309 794,760 0 0 0 794,760 NEPTUNE TWP BD OF ED 21233 MONMOUTH 793,774 0 0 793,774 700,029 0 0 0 700,029 NEPTUNE TWP HOUSING AUTHORITY 30690 MONMOUTH 119,197 0 0 119,197 107,608 0 0 0 107,608 NEPTUNE TWP SEWERAGE AUTHORITY 31970 MONMOUTH 180,218 0 0 180,218 171,830 0 0 0 171,830 OCEAN GROVE SEWERAGE AUTHORITY 45700 MONMOUTH 7,307 0 0 7,307 6,695 0 0 0 6,695 OCEAN TOWNSHIP (MONMOUTH) 22000 MONMOUTH 707,501 0 0 707,501 642,363 0 0 0 642,363 OCEAN TWP BD OF ED (MONMOUTH) 22003 MONMOUTH 852,645 0 0 852,645 750,592 0 0 0 750,592 OCEAN TWP FIRE DISTRICT 1 34670 MONMOUTH 38,567 0 0 38,567 35,243 0 0 0 35,243 OCEAN TWP FIRE DISTRICT 2 34260 MONMOUTH 19,560 0 0 19,560 17,656 0 0 0 17,656 OCEAN TWP SEWERAGE AUTHORITY 55540 MONMOUTH 131,611 0 0 131,611 125,304 0 0 0 125,304 OCEANPORT BOROUGH 21180 MONMOUTH 76,038 0 0 76,038 86,346 0 0 0 86,346 OCEANPORT SCHOOLS 21183 MONMOUTH 97,766 0 0 97,766 84,731 0 0 0 84,731 RED BANK BD OF ED 21723 MONMOUTH 302,708 0 0 302,708 252,504 0 0 0 252,504 RED BANK BORO HOUSING AUTH 56120 MONMOUTH 33,143 0 0 33,143 32,570 0 0 0 32,570 RED BANK BOROUGH 21720 MONMOUTH 463,554 15,904 55,895 535,353 424,083 0 0 0 424,083 RED BANK CHARTER SCHOOL 35670 MONMOUTH 48,071 0 0 48,071 30,397 0 0 0 30,397 RED BANK REGIONAL HIGH SCHOOL 40450 MONMOUTH 253,777 0 0 253,777 224,883 0 0 0 224,883 ROOSEVELT BOROUGH 52910 MONMOUTH 20,809 0 0 20,809 30,742 0 0 0 30,742 ROOSEVELT BOROUGH BD OF ED 52913 MONMOUTH 15,696 0 0 15,696 13,081 0 0 0 13,081 RUMSON BORO BD OF ED 21203 MONMOUTH 135,813 0 0 135,813 125,921 0 0 0 125,921 RUMSON BOROUGH 21200 MONMOUTH 298,293 0 0 298,293 273,411 0 1,620 5,720 280,751 RUMSON FAIR HAVEN REGIONAL H.S. 40070 MONMOUTH 133,081 0 0 133,081 120,641 0 0 0 120,641 SEA BRIGHT BORO 23590 MONMOUTH 70,627 0 0 70,627 73,100 0 0 0 73,100 SEA GIRT BD OF ED 21033 MONMOUTH 35,434 0 0 35,434 31,526 0 0 0 31,526 SEA GIRT BOROUGH 21030 MONMOUTH 131,778 1,851 6,639 140,268 158,514 0 0 0 158,514 SHORE REGIONAL H S DISTRICT 57270 MONMOUTH 107,748 0 0 107,748 96,646 0 0 0 96,646
Page 39

Public Employee's Retirement SystemSchedule A - Schedule of Local Employer Contributions used toDetermine the Fiscal Year 2013 and Fiscal Year 2014 Proportionate Shares
Employer EmployerEmployer Employer Number County Contributions Contributions
Contributions for Fiscal Year 2014 Proportionate Shares Contributions for Fiscal Year 2013 Proportionate Shares
Fiscal Year 2015
Appropriation
Employer delayed
appropriations
Employer Contribution –
delayed enrollment
Fiscal Year 2014
AppropriationLate Reporting
Employers
Employer delayed
appropriations
Employer Contribution –
delayed enrollment
SHREWSBURY BOROUGH 22630 MONMOUTH 216,496 0 0 216,496 196,721 0 0 0 196,721 SHREWSBURY BOROUGH BD OF ED 22633 MONMOUTH 87,740 0 0 87,740 73,565 0 0 0 73,565 SHREWSBURY TOWNSHIP 22090 MONMOUTH 13,149 0 0 13,149 16,367 0 0 0 16,367 SPRING LAKE BORO BD OF ED 21043 MONMOUTH 74,865 0 0 74,865 58,063 0 0 0 58,063 SPRING LAKE BOROUGH 21040 MONMOUTH 305,078 0 0 305,078 252,519 0 0 0 252,519 SPRING LAKE HEIGHTS BD OF ED 21773 MONMOUTH 48,088 0 0 48,088 50,103 0 0 0 50,103 SPRING LAKE HEIGHTS BOROUGH 21770 MONMOUTH 134,519 0 0 134,519 128,205 0 0 0 128,205 TINTON FALLS BOARD OF EDUCATION 40100 MONMOUTH 238,268 0 0 238,268 209,077 0 0 0 209,077 TINTON FALLS BOROUGH 22130 MONMOUTH 612,733 0 0 612,733 574,106 0 0 0 574,106 UNION BEACH BORO BD OF ED 53363 MONMOUTH 146,749 0 0 146,749 135,694 0 0 0 135,694 UNION BEACH BOROUGH 53360 MONMOUTH 138,475 0 0 138,475 107,717 0 0 0 107,717 UPPER FREEHOLD REGIONAL 40390 MONMOUTH 449,292 0 0 449,292 424,576 0 0 0 424,576 UPPER FREEHOLD TOWNSHIP 23710 MONMOUTH 94,896 0 0 94,896 87,142 0 0 0 87,142 WALL TOWNSHIP 22380 MONMOUTH 1,002,748 0 0 1,002,748 875,041 0 0 0 875,041 WALL TOWNSHIP BD OF ED 22383 MONMOUTH 973,741 0 0 973,741 840,499 0 935 3,447 844,880 WALL TOWNSHIP FIRE DISTRICT 2 44000 MONMOUTH 6,493 0 0 6,493 7,396 0 0 0 7,396 WALL TOWNSHIP FIRE DISTRICT 3 39800 MONMOUTH 28,726 0 0 28,726 26,112 0 0 0 26,112 WEST LONG BRANCH BD OF ED 53673 MONMOUTH 100,210 0 0 100,210 78,207 0 0 0 78,207 WEST LONG BRANCH BOROUGH 53670 MONMOUTH 139,036 0 0 139,036 133,323 0 0 0 133,323 BOONTON HOUSING AUTHORITY 56480 MORRIS 32,652 0 0 32,652 29,661 0 0 0 29,661 BOONTON TOWN 21150 MORRIS 367,417 0 0 367,417 315,056 0 0 0 315,056 BOONTON TOWN BD OF ED 21153 MORRIS 264,564 0 0 264,564 234,285 0 7,975 29,402 271,662 BOONTON TOWNSHIP 50330 MORRIS 53,303 0 0 53,303 48,164 0 0 0 48,164 BOONTON TWP BD OF ED 50333 MORRIS 84,564 0 0 84,564 72,446 0 0 0 72,446 BUTLER BORO BD OF ED 20043 MORRIS 188,384 0 0 188,384 178,213 0 0 0 178,213 BUTLER BOROUGH 20040 MORRIS 435,494 0 0 435,494 454,713 0 0 0 454,713 CHATHAM BOROUGH 20640 MORRIS 264,674 2,360 8,465 275,499 255,315 0 0 0 255,315 CHATHAM JNT FREE PUBLIC LIBRARY 20644 MORRIS 84,211 0 0 84,211 88,107 0 0 0 88,107 CHATHAM TOWNSHIP 22400 MORRIS 307,453 0 0 307,453 272,407 0 0 0 272,407 CHATHAMS SCHOOL DISTRICT 40540 MORRIS 579,208 0 0 579,208 526,549 0 0 0 526,549 CHESTER BORO/TWP PUBLIC LIBRARY 32410 MORRIS 36,513 0 0 36,513 40,693 0 0 0 40,693 CHESTER BOROUGH 50540 MORRIS 89,473 0 0 89,473 85,160 0 0 0 85,160 CHESTER TOWNSHIP 22670 MORRIS 207,431 0 0 207,431 169,441 0 0 0 169,441 CHESTER TWP BD OF ED 57420 MORRIS 206,030 0 0 206,030 188,455 0 0 0 188,455 DENVILLE TOWNSHIP 21060 MORRIS 612,033 0 0 612,033 546,963 0 0 0 546,963 DENVILLE TWP BD OF ED 21063 MORRIS 395,073 0 0 395,073 348,253 0 0 0 348,253 DOVER BD OF ED 20243 MORRIS 383,457 0 0 383,457 354,182 0 0 0 354,182 DOVER TOWN 20240 MORRIS 417,811 0 0 417,811 372,841 0 0 0 372,841 DOVER TOWN HOUSING AUTHORITY 31870 MORRIS 11,498 0 0 11,498 10,127 0 0 0 10,127 EAST HANOVER TOWNSHIP 50830 MORRIS 578,951 0 0 578,951 522,994 0 0 0 522,994 EAST HANOVER TWP BD OF ED 50833 MORRIS 192,605 0 0 192,605 172,320 0 0 0 172,320 FLORHAM PARK BD OF ED 21343 MORRIS 204,276 0 0 204,276 194,902 0 0 0 194,902 FLORHAM PARK BOROUGH 21340 MORRIS 528,459 0 0 528,459 494,294 0 0 0 494,294 HANOVER PARK REG H S DIST 57050 MORRIS 474,218 0 0 474,218 424,976 0 0 0 424,976 HANOVER SEWERAGE AUTHORITY 30720 MORRIS 187,352 0 0 187,352 173,004 0 0 0 173,004 HANOVER TOWNSHIP 22210 MORRIS 600,608 0 0 600,608 538,868 0 0 0 538,868 HANOVER TOWNSHIP BD OF ED 22213 MORRIS 426,684 0 0 426,684 384,206 0 0 0 384,206 HANOVER TWP FIRE DISTRICT 2 32970 MORRIS 8,980 0 0 8,980 7,756 0 0 0 7,756 HANOVER TWP FIRE DISTRICT 3 34100 MORRIS 12,584 0 0 12,584 11,699 0 0 0 11,699 HARDING TOWNSHIP 21410 MORRIS 133,550 0 0 133,550 123,673 0 0 0 123,673 HARDING TOWNSHIP BD OF ED 21413 MORRIS 64,241 0 0 64,241 58,984 0 0 0 58,984 JEFFERSON TOWNSHIP 22520 MORRIS 652,055 0 0 652,055 577,498 0 0 0 577,498 JEFFERSON TOWNSHIP BD OF ED 22523 MORRIS 701,548 0 0 701,548 654,162 0 0 0 654,162 KINNELON BOROUGH 22510 MORRIS 227,896 0 0 227,896 243,496 0 0 0 243,496 KINNELON BOROUGH BD OF ED 22513 MORRIS 335,040 0 0 335,040 306,487 0 0 0 306,487 LINCOLN PARK BORO BD OF ED 22763 MORRIS 130,356 0 0 130,356 120,535 0 0 0 120,535 LINCOLN PARK BOROUGH 22760 MORRIS 281,240 0 0 281,240 271,481 0 0 0 271,481 LONG HILL TOWNSHIP 20770 MORRIS 261,808 0 0 261,808 229,143 0 0 0 229,143 LONG HILL TWP BD OF ED 20773 MORRIS 117,442 1,964 7,043 126,449 113,291 0 0 0 113,291 MADISON BORO BD OF ED 20473 MORRIS 388,554 0 0 388,554 342,346 0 0 0 342,346 MADISON BORO HOUSING AUTHORITY 32870 MORRIS 80,064 0 0 80,064 72,056 0 0 0 72,056
Page 40

Public Employee's Retirement SystemSchedule A - Schedule of Local Employer Contributions used toDetermine the Fiscal Year 2013 and Fiscal Year 2014 Proportionate Shares
Employer EmployerEmployer Employer Number County Contributions Contributions
Contributions for Fiscal Year 2014 Proportionate Shares Contributions for Fiscal Year 2013 Proportionate Shares
Fiscal Year 2015
Appropriation
Employer delayed
appropriations
Employer Contribution –
delayed enrollment
Fiscal Year 2014
AppropriationLate Reporting
Employers
Employer delayed
appropriations
Employer Contribution –
delayed enrollment
MADISON BOROUGH 20470 MORRIS 777,331 0 0 777,331 701,349 0 0 0 701,349 MADISON-CHATHAM JOINT MEETING 30090 MORRIS 47,862 0 0 47,862 48,071 0 0 0 48,071 MENDHAM BORO BD OF ED 21883 MORRIS 74,738 0 0 74,738 79,770 0 0 0 79,770 MENDHAM BOROUGH 21880 MORRIS 161,272 0 0 161,272 158,973 0 0 0 158,973 MENDHAM TOWNSHIP 22120 MORRIS 157,929 0 0 157,929 151,330 0 0 0 151,330 MENDHAM TOWNSHIP BD OF ED 22123 MORRIS 208,263 0 0 208,263 205,581 0 0 0 205,581 MINE HILL TOWNSHIP 23320 MORRIS 53,394 0 0 53,394 46,942 0 0 0 46,942 MINE HILL TWP BD OF ED 23323 MORRIS 44,113 0 0 44,113 39,009 0 0 0 39,009 MONTVILLE TOWNSHIP 23580 MORRIS 570,378 0 0 570,378 544,708 0 (4,049) (14,293) 526,366 MONTVILLE TWP BD OF ED 23583 MORRIS 499,892 0 0 499,892 409,814 0 0 0 409,814 MONTVILLE TWP FD #1 49300 MORRIS 5,039 0 0 5,039 3,393 0 0 0 3,393 MONTVILLE TWP FIRE DISTRICT 3 45600 MORRIS 11,226 0 0 11,226 9,623 0 0 0 9,623 MORRIS CO EDUC SERVICES COMM 31990 MORRIS 215,591 0 0 215,591 198,459 0 11,279 41,581 251,319 MORRIS CO SOIL CONSER DIST 32430 MORRIS 35,490 0 0 35,490 30,890 0 0 0 30,890 MORRIS CO VOCATIONAL SCH DIST 10063 MORRIS 288,151 0 0 288,151 251,742 0 10,672 39,344 301,757 MORRIS COUNTY 10060 MORRIS 8,972,613 0 0 8,972,613 8,399,318 0 2,541 9,369 8,411,228 MORRIS COUNTY COLLEGE 31020 MORRIS 1,125,901 0 0 1,125,901 1,064,169 0 0 0 1,064,169 MORRIS COUNTY HOUSING AUTHORITY 34600 MORRIS 142,135 0 0 142,135 138,634 0 0 0 138,634 MORRIS HILLS REGIONAL DISTRICT 40030 MORRIS 793,820 0 0 793,820 677,199 0 1,130 4,166 682,495 MORRIS PLAINS BD OF ED 21493 MORRIS 109,743 0 (1) 109,743 86,696 0 731 3,428 90,855 MORRIS PLAINS BOROUGH 21490 MORRIS 215,358 0 0 215,358 202,006 0 0 0 202,006 MORRIS SCHOOL DISTRICT 40470 MORRIS 1,287,855 0 0 1,287,855 1,229,850 0 0 0 1,229,850 MORRIS TOWNSHIP 21100 MORRIS 828,018 0 0 828,018 729,783 0 0 0 729,783 MORRISTOWN HOUSING AUTHORITY 30450 MORRIS 100,862 0 0 100,862 104,060 0 0 0 104,060 MORRISTOWN PARKING AUTHORITY 55220 MORRIS 100,847 0 0 100,847 79,462 0 0 0 79,462 MORRISTOWN TOWN 20270 MORRIS 675,248 0 0 675,248 600,251 0 0 0 600,251 MORRISTOWN/MORRIS JOINT LIBRARY 31140 MORRIS 168,536 0 0 168,536 167,550 0 0 0 167,550 MOUNT ARLINGTON BD OF ED 22813 MORRIS 69,062 0 0 69,062 53,012 0 0 0 53,012 MOUNT ARLINGTON BOROUGH 22810 MORRIS 116,815 0 0 116,815 94,567 0 0 0 94,567 MOUNT OLIVE TOWNSHIP 22660 MORRIS 763,438 0 0 763,438 679,146 0 0 0 679,146 MOUNT OLIVE TWP BD OF ED 22663 MORRIS 1,122,897 0 0 1,122,897 1,009,976 0 0 0 1,009,976 MOUNTAIN LAKES BORO BD OF ED 20673 MORRIS 447,286 0 0 447,286 409,150 0 0 0 409,150 MOUNTAIN LAKES BOROUGH 20670 MORRIS 110,053 0 0 110,053 98,392 0 0 0 98,392 NETCONG BOROUGH 52350 MORRIS 73,421 0 0 73,421 70,838 0 0 0 70,838 NETCONG BOROUGH BD OF ED 52353 MORRIS 30,264 0 0 30,264 16,254 0 0 0 16,254 PARSIPPANY TROY HILLS BD OF ED 20543 MORRIS 1,804,750 0 0 1,804,750 1,576,627 0 0 0 1,576,627 PARSIPPANY TROY HILLS TOWNSHIP 20540 MORRIS 1,936,784 0 0 1,936,784 1,795,187 0 0 0 1,795,187 PEQUANNOCK TOWNSHIP 22360 MORRIS 430,102 3,703 13,284 447,090 401,322 0 0 0 401,322 PEQUANNOCK TWP BD OF ED 22363 MORRIS 334,259 0 0 334,259 337,837 0 0 0 337,837 PEQUANNOCK, LINC PARK&FAIRFIELD 32340 MORRIS 232,360 0 0 232,360 205,183 0 0 0 205,183 RANDOLPH TOWNSHIP 22650 MORRIS 736,037 0 0 736,037 673,019 0 0 0 673,019 RANDOLPH TOWNSHIP BD OF ED 22653 MORRIS 1,157,701 0 0 1,157,701 1,015,693 0 0 0 1,015,693 RIVERDALE BOROUGH 22820 MORRIS 157,162 0 0 157,162 143,035 0 0 0 143,035 RIVERDALE BOROUGH BD OF ED 22823 MORRIS 43,333 0 0 43,333 37,356 0 0 0 37,356 ROCKAWAY BOROUGH 21000 MORRIS 152,233 0 0 152,233 145,954 0 0 0 145,954 ROCKAWAY BOROUGH BD OF ED 21003 MORRIS 92,856 0 0 92,856 90,518 0 0 0 90,518 ROCKAWAY TOWNSHIP 21460 MORRIS 858,171 0 0 858,171 776,087 0 0 0 776,087 ROCKAWAY TOWNSHIP BD OF ED 21463 MORRIS 642,563 0 0 642,563 604,552 0 0 0 604,552 ROXBURY TOWNSHIP 22640 MORRIS 636,306 0 0 636,306 581,786 0 0 0 581,786 ROXBURY TWP BD OF ED 22643 MORRIS 724,701 0 0 724,701 728,815 0 0 0 728,815 SOUTHEAST MORRIS CO MUA 32480 MORRIS 371,689 0 0 371,689 333,609 0 0 0 333,609 VICTORY GARDENS BOROUGH 53450 MORRIS 22,053 0 0 22,053 20,376 0 0 0 20,376 WASHINGTON TWP (MORRIS) 21630 MORRIS 442,547 0 0 442,547 403,852 0 0 0 403,852 WASHINGTON TWP BD ED (MORRIS) 21633 MORRIS 584,132 0 0 584,132 539,635 0 0 0 539,635 WASHINGTON TWP MUA (MORRIS) 32560 MORRIS 56,598 0 0 56,598 44,806 0 0 0 44,806 WEST MORRIS REG H S DIST 40410 MORRIS 405,770 0 0 405,770 358,086 0 0 0 358,086 WHARTON BOROUGH 20730 MORRIS 188,434 0 0 188,434 170,274 0 0 0 170,274 WHARTON BOROUGH BD OF ED 20733 MORRIS 58,284 0 0 58,284 46,139 0 0 0 46,139 BARNEGAT LIGHT BOROUGH 23050 OCEAN 58,895 0 0 58,895 51,520 0 0 0 51,520 BARNEGAT TOWNSHIP 23040 OCEAN 442,169 0 0 442,169 430,371 0 0 0 430,371 BARNEGAT TWP BD OF ED 23043 OCEAN 623,281 0 0 623,281 578,481 0 0 0 578,481
Page 41

Public Employee's Retirement SystemSchedule A - Schedule of Local Employer Contributions used toDetermine the Fiscal Year 2013 and Fiscal Year 2014 Proportionate Shares
Employer EmployerEmployer Employer Number County Contributions Contributions
Contributions for Fiscal Year 2014 Proportionate Shares Contributions for Fiscal Year 2013 Proportionate Shares
Fiscal Year 2015
Appropriation
Employer delayed
appropriations
Employer Contribution –
delayed enrollment
Fiscal Year 2014
AppropriationLate Reporting
Employers
Employer delayed
appropriations
Employer Contribution –
delayed enrollment
BAY HEAD BD OF ED 50193 OCEAN 30,671 0 0 30,671 25,495 0 0 0 25,495 BAY HEAD BOROUGH 50190 OCEAN 62,627 0 0 62,627 57,385 0 0 0 57,385 BEACH HAVEN BOROUGH 21840 OCEAN 221,653 0 0 221,653 190,914 0 0 0 190,914 BEACH HAVEN BOROUGH BD OF ED 21843 OCEAN 10,078 0 0 10,078 9,053 0 0 0 9,053 BEACH HAVEN SEWERAGE AUTHORITY 55820 OCEAN 18,311 0 0 18,311 16,404 0 0 0 16,404 BEACHWOOD BOROUGH 22160 OCEAN 222,669 0 0 222,669 194,471 0 0 0 194,471 BEACHWOOD SEWERAGE AUTHORITY 32520 OCEAN 27,020 0 0 27,020 24,758 0 0 0 24,758 BERKELEY TOWNSHIP MUNICIPAL BLD 50250 OCEAN 828,915 0 0 828,915 785,816 0 0 0 785,816 BERKELEY TWP BD OF ED 50253 OCEAN 454,413 0 0 454,413 399,845 0 0 0 399,845 BERKELEY TWP HOUSING AUTHORITY 55890 OCEAN 34,901 0 0 34,901 31,359 0 0 0 31,359 BERKELEY TWP SEWERAGE AUTHORITY 55450 OCEAN 111,067 0 0 111,067 107,572 0 0 0 107,572 BERKELEY_TOWNSHIP MUNI UTIL AUT 34900 OCEAN 44,929 0 0 44,929 39,785 0 0 0 39,785 BRICK TOWNSHIP 22680 OCEAN 1,755,635 0 0 1,755,635 1,506,198 0 0 0 1,506,198 BRICK TOWNSHIP FIRE DIST 2 45100 OCEAN 3,052 0 0 3,052 2,796 0 0 0 2,796 BRICK TWP BD OF ED 22683 OCEAN 1,980,707 (1,123) (4,140) 1,975,445 1,824,321 0 1,123 4,140 1,829,583 BRICK TWP FIRE DISTRICT 1 39100 OCEAN 715 0 0 715 2,622 0 0 0 2,622 BRICK TWP HOUSING AUTHORITY 31240 OCEAN 58,403 0 0 58,403 44,115 0 3,417 12,598 60,130 BRICK TWP JOINT BD OF FIRE COMM 34400 OCEAN 48,360 0 0 48,360 46,679 0 0 0 46,679 BRICK TWP MUN UTILITIES AUTH 31510 OCEAN 899,459 0 0 899,459 859,887 0 0 0 859,887 CENTRAL REGIONAL H S DIST 57100 OCEAN 494,145 0 0 494,145 440,206 0 0 0 440,206 DOVER MUNICIPAL UTILITIES AUTH 31120 OCEAN 294,485 0 0 294,485 279,114 0 0 0 279,114 DOVER TWP PARKING AUTHORITY 32300 OCEAN 40,905 0 0 40,905 31,139 0 0 0 31,139 EAGLESWOOD TOWNSHIP 50780 OCEAN 42,056 0 0 42,056 32,760 0 0 0 32,760 EAGLESWOOD TWP BD OF ED 50783 OCEAN 28,328 0 0 28,328 19,796 0 0 0 19,796 HARVEY CEDARS BOROUGH 22700 OCEAN 95,144 0 0 95,144 84,687 0 0 0 84,687 ISLAND HEIGHTS BORO BD OF ED 51603 OCEAN 14,971 0 0 14,971 13,156 0 0 0 13,156 ISLAND HEIGHTS BOROUGH 51600 OCEAN 50,389 0 0 50,389 48,279 0 0 0 48,279 JACKSON BD FIRE DISTRICT 2 34070 OCEAN 7,391 0 0 7,391 17,093 0 0 0 17,093 JACKSON TOWNSHIP 22550 OCEAN 757,906 0 0 757,906 694,662 0 3,921 14,454 713,036 JACKSON TOWNSHIP BD OF ED 22553 OCEAN 2,106,087 0 0 2,106,087 1,900,230 0 0 0 1,900,230 JACKSON TOWNSHIP M.U.A. 55690 OCEAN 252,053 0 0 252,053 222,274 0 0 0 222,274 JACKSON TWP FIRE DISTRICT 3 32060 OCEAN 12,583 0 0 12,583 10,618 0 0 0 10,618 LACEY MUNICIPAL UTIL AUTHORITY 32180 OCEAN 144,997 0 0 144,997 132,222 0 0 0 132,222 LACEY TOWNSHIP 23520 OCEAN 466,080 0 0 466,080 452,920 0 0 0 452,920 LACEY TOWNSHIP BD OF ED 23523 OCEAN 889,866 0 0 889,866 760,179 0 1,390 5,124 766,692 LAKEHURST BOROUGH 22560 OCEAN 106,314 0 0 106,314 87,124 0 0 0 87,124 LAKEHURST BOROUGH BD OF ED 22563 OCEAN 80,940 0 0 80,940 69,868 0 0 0 69,868 LAKEWOOD HOUSING AUTHORITY 30760 OCEAN 104,831 0 0 104,831 91,626 0 0 0 91,626 LAKEWOOD TOWNSHIP 20090 OCEAN 1,201,020 0 0 1,201,020 1,063,871 0 0 0 1,063,871 LAKEWOOD TWP BD OF ED 20093 OCEAN 624,846 0 0 624,846 601,811 0 0 0 601,811 LAKEWOOD TWP FIRE DISTRICT 1 34560 OCEAN 8,820 0 0 8,820 21,933 0 0 0 21,933 LAKEWOOD TWP MUN UTILITS AUTH 32220 OCEAN 147,751 0 0 147,751 125,572 0 0 0 125,572 LAVALLETTE BOROUGH 20100 OCEAN 239,166 0 0 239,166 214,201 0 0 0 214,201 LAVALLETTE BOROUGH BD OF ED 20103 OCEAN 21,871 0 0 21,871 22,475 0 0 0 22,475 LITTLE EGG HARBOR MUN UTIL AUTH 32230 OCEAN 135,461 0 0 135,461 118,471 0 0 0 118,471 LITTLE EGG HARBOR TOWNSHIP 23680 OCEAN 391,703 0 0 391,703 345,415 0 0 0 345,415 LITTLE EGG HARBOR TWP BD OF ED 23683 OCEAN 364,608 0 0 364,608 323,211 0 0 0 323,211 LONG BEACH ISLAND BD OF ED 40350 OCEAN 75,679 0 0 75,679 74,614 0 0 0 74,614 LONG BEACH TOWNSHIP 20120 OCEAN 512,816 1,294 4,641 518,751 454,586 0 0 0 454,586 MANCHESTER TOWNSHIP 51970 OCEAN 660,588 0 0 660,588 625,882 0 0 0 625,882 MANCHESTER TOWNSHIP BD OF ED 51973 OCEAN 848,064 0 0 848,064 730,143 0 0 0 730,143 MANTOLOKING BOROUGH 20010 OCEAN 64,385 0 0 64,385 54,250 0 0 0 54,250 OCEAN CO BD OF HEALTH 32760 OCEAN 1,168,259 0 0 1,168,259 1,003,959 0 0 0 1,003,959 OCEAN CO BOARD OF SOC SERV 10021 OCEAN 2,631,755 0 0 2,631,755 2,366,855 0 0 0 2,366,855 OCEAN CO MOSQUITO COMM 10022 OCEAN 115,245 0 0 115,245 103,415 0 0 0 103,415 OCEAN CO SOIL CONSRV DISTRICT 32310 OCEAN 56,775 0 0 56,775 49,888 0 0 0 49,888 OCEAN CO UTILITIES AUTHORITY 31660 OCEAN 1,858,283 0 0 1,858,283 1,670,490 0 0 0 1,670,490 OCEAN COUNTY 10020 OCEAN 9,703,304 0 0 9,703,304 8,938,472 0 0 0 8,938,472 OCEAN COUNTY COLLEGE 31670 OCEAN 1,125,921 0 0 1,125,921 1,064,223 0 0 0 1,064,223 OCEAN COUNTY VOCATIONAL SCHOOL 10023 OCEAN 425,873 0 0 425,873 375,668 0 0 0 375,668 OCEAN GATE BD OF ED 21753 OCEAN 19,194 0 0 19,194 19,610 0 0 0 19,610
Page 42

Public Employee's Retirement SystemSchedule A - Schedule of Local Employer Contributions used toDetermine the Fiscal Year 2013 and Fiscal Year 2014 Proportionate Shares
Employer EmployerEmployer Employer Number County Contributions Contributions
Contributions for Fiscal Year 2014 Proportionate Shares Contributions for Fiscal Year 2013 Proportionate Shares
Fiscal Year 2015
Appropriation
Employer delayed
appropriations
Employer Contribution –
delayed enrollment
Fiscal Year 2014
AppropriationLate Reporting
Employers
Employer delayed
appropriations
Employer Contribution –
delayed enrollment
OCEAN GATE BOROUGH 21750 OCEAN 28,641 0 0 28,641 34,849 0 0 0 34,849 OCEAN TOWNSHIP (OCEAN) 52490 OCEAN 248,195 0 0 248,195 225,259 0 0 0 225,259 OCEAN TWP BD OF ED (OCEAN) 52493 OCEAN 147,261 0 0 147,261 128,507 0 0 0 128,507 PINE BEACH BOROUGH 52660 OCEAN 51,943 0 0 51,943 46,310 0 0 0 46,310 PINELANDS REG SCHOOL DISTRICT 40510 OCEAN 414,543 0 0 414,543 374,248 0 531 1,958 376,738 PLUMSTEAD FIRE DISTRICT # 1 47500 OCEAN 4,924 0 0 4,924 4,294 0 0 0 4,294 PLUMSTED MUNICIPAL UTILITY AUTH 51200 OCEAN 0 0 0 0 0 0 7,478 26,999 34,477 PLUMSTED TOWNSHIP 52740 OCEAN 59,351 0 0 59,351 55,815 0 0 0 55,815 PLUMSTED TWP BD OF ED 52743 OCEAN 193,889 0 0 193,889 173,361 0 2,256 8,316 183,932 POINT PLEASANT BEACH BD OF ED 20083 OCEAN 174,446 0 0 174,446 163,766 0 0 0 163,766 POINT PLEASANT BEACH BOROUGH 20080 OCEAN 291,050 2,776 9,957 303,783 284,915 0 0 0 284,915 POINT PLEASANT BORO BD OF ED 20993 OCEAN 319,453 0 0 319,453 301,433 0 0 0 301,433 POINT PLEASANT BOROUGH 20990 OCEAN 460,330 0 0 460,330 408,107 0 0 0 408,107 SEASIDE HEIGHTS BD OF ED 20153 OCEAN 52,978 0 0 52,978 52,052 0 0 0 52,052 SEASIDE HEIGHTS BOROUGH 20150 OCEAN 319,841 0 0 319,841 300,510 0 0 0 300,510 SEASIDE PARK BD OF ED 21403 OCEAN 5,964 0 0 5,964 6,286 0 0 0 6,286 SEASIDE PARK BOROUGH 21400 OCEAN 171,114 0 0 171,114 157,427 0 0 0 157,427 SHIP BOTTOM BOROUGH 53030 OCEAN 106,048 0 0 106,048 88,612 0 0 0 88,612 SOUTH TOMS RIVER BOROUGH 53140 OCEAN 48,495 0 0 48,495 49,670 0 0 0 49,670 SOUTH TOMS RIVER SEWERAGE AUTH 34500 OCEAN 6,608 0 0 6,608 3,316 0 0 0 3,316 SOUTHERN REGIONAL H S DISTRICT 40330 OCEAN 826,694 0 0 826,694 724,129 0 0 0 724,129 STAFFORD TOWNSHIP 22920 OCEAN 1,156,366 8,743 31,363 1,196,473 1,067,305 0 0 0 1,067,305 STAFFORD TOWNSHIP BD OF ED 22923 OCEAN 651,169 0 0 651,169 582,478 0 0 0 582,478 SURF CITY BOROUGH 22140 OCEAN 97,152 0 0 97,152 89,045 0 0 0 89,045 TOMS RIVER FIRE DISTRICT # 2 32440 OCEAN 21,945 0 0 21,945 19,210 0 0 0 19,210 TOMS RIVER SCHOOL DIST 40340 OCEAN 3,438,594 0 0 3,438,594 3,028,822 0 0 0 3,028,822 TOMS RIVER TOWNSHIP 22690 OCEAN 2,384,831 0 0 2,384,831 2,072,099 0 4,084 15,055 2,091,238 TOMS RIVER TWP FIRE DISTRICT 1 32770 OCEAN 147,569 0 0 147,569 135,683 0 0 0 135,683 TUCKERTON BORO BD OF ED 53333 OCEAN 47,549 0 0 47,549 38,319 0 0 0 38,319 TUCKERTON BOROUGH 53330 OCEAN 105,493 0 0 105,493 99,463 0 0 0 99,463 BLOOMINGDALE BD OF ED 22733 PASSAIC 131,151 0 0 131,151 129,346 0 0 0 129,346 BLOOMINGDALE BOROUGH 22730 PASSAIC 285,775 0 0 285,775 276,305 0 0 0 276,305 CLASSICAL ACAD. CHARTER SCHOOL 35900 PASSAIC 4,901 0 0 4,901 0 0 0 0 0 CLIFTON CITY 20800 PASSAIC 1,654,947 0 0 1,654,947 1,532,446 0 9,123 33,022 1,574,591 CLIFTON CITY BD OF ED 20803 PASSAIC 1,442,674 4,046 14,512 1,461,231 1,373,433 0 0 0 1,373,433 COMMUNITY CH SCHOOL OF PATERSON 48700 PASSAIC 85,915 0 0 85,915 69,905 0 0 0 69,905 HALEDON BOROUGH 51290 PASSAIC 179,178 0 0 179,178 163,948 0 0 0 163,948 HALEDON BOROUGH BD OF ED 51293 PASSAIC 126,264 0 0 126,264 116,337 0 0 0 116,337 HAWTHORNE BD OF ED 22113 PASSAIC 516,484 0 0 516,484 485,055 0 0 0 485,055 HAWTHORNE BOROUGH 22110 PASSAIC 418,260 0 0 418,260 369,797 0 0 0 369,797 JOHN P HOLLAND CHARTER SCHOOL 50700 PASSAIC 26,227 0 0 26,227 0 0 0 0 0 LAKELAND REGIONAL H S DIST 40370 PASSAIC 286,297 0 0 286,297 257,175 0 0 0 257,175 LITTLE FALLS BD OF ED 22933 PASSAIC 161,344 0 0 161,344 165,408 0 0 0 165,408 LITTLE FALLS TWP 22930 PASSAIC 259,852 0 0 259,852 232,548 0 0 0 232,548 MANCHESTER UTILITIES AUTHORITY 47900 PASSAIC 1,073 0 0 1,073 983 0 0 0 983 NORTH HALEDON BORO BD OF ED 23133 PASSAIC 69,855 0 0 69,855 65,833 0 0 0 65,833 NORTH HALEDON BOROUGH 23130 PASSAIC 228,541 0 0 228,541 202,669 0 0 0 202,669 PASSAIC ARTS & SCIENCE CHTR SCH 51100 PASSAIC 58,231 0 0 58,231 0 0 0 0 0 PASSAIC BOARD OF EDUCATION 20833 PASSAIC 3,408,190 4,236 15,245 3,427,671 2,957,155 0 0 0 2,957,155 PASSAIC CITY 20830 PASSAIC 1,344,159 0 0 1,344,159 1,218,149 0 1,730 6,380 1,226,259 PASSAIC CITY HOUSING AUTHORITY 30460 PASSAIC 235,457 0 0 235,457 200,517 0 0 0 200,517 PASSAIC CO BD OF SOCIAL SERVICE 60031 PASSAIC 4,159,694 2,520 9,039 4,171,253 3,729,769 0 0 0 3,729,769 PASSAIC CO MANCHESTER REG HIGH 57240 PASSAIC 164,481 0 0 164,481 162,674 0 0 0 162,674 PASSAIC CO REGIONAL HS DIST 1 40360 PASSAIC 217,827 0 0 217,827 209,003 0 0 0 209,003 PASSAIC CO VOCATIONAL SCHOOL 30870 PASSAIC 903,997 0 0 903,997 854,725 0 0 0 854,725 PASSAIC CO. ED SERV COMMISION 34890 PASSAIC 255,206 0 0 255,206 184,388 0 0 0 184,388 PASSAIC COUNTY 60030 PASSAIC 8,824,424 0 0 8,824,424 8,105,240 0 0 0 8,105,240 PASSAIC COUNTY COMMUNITY COLLEG 31550 PASSAIC 948,021 0 0 948,021 883,178 0 0 0 883,178 PASSAIC COUNTY IMPROVEMENT AUTH 47000 PASSAIC 10,855 0 0 10,855 9,945 0 0 0 9,945 PATERSON BD OF ED 21913 PASSAIC 5,701,280 3,016 10,820 5,715,116 5,130,575 0 3,199 11,793 5,145,567 PATERSON CHART SCH-SCIENCE/TECH 42400 PASSAIC 221,724 0 0 221,724 189,750 0 0 0 189,750
Page 43
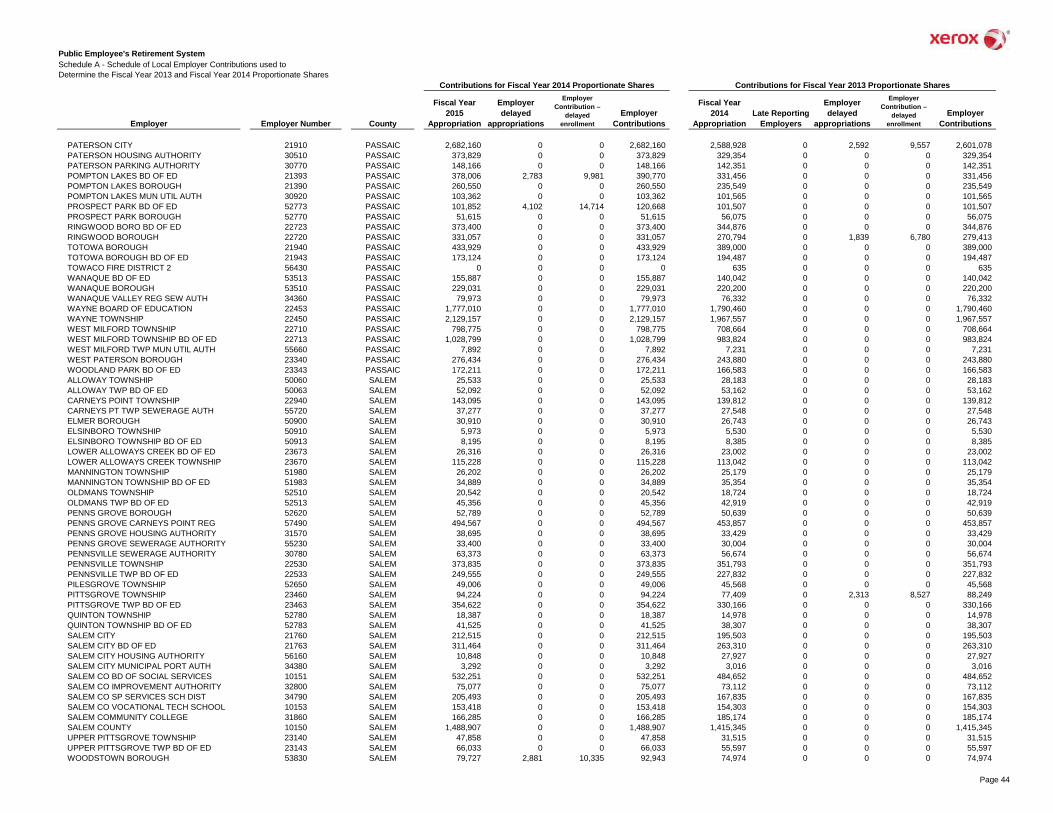
Public Employee's Retirement SystemSchedule A - Schedule of Local Employer Contributions used toDetermine the Fiscal Year 2013 and Fiscal Year 2014 Proportionate Shares
Employer EmployerEmployer Employer Number County Contributions Contributions
Contributions for Fiscal Year 2014 Proportionate Shares Contributions for Fiscal Year 2013 Proportionate Shares
Fiscal Year 2015
Appropriation
Employer delayed
appropriations
Employer Contribution –
delayed enrollment
Fiscal Year 2014
AppropriationLate Reporting
Employers
Employer delayed
appropriations
Employer Contribution –
delayed enrollment
PATERSON CITY 21910 PASSAIC 2,682,160 0 0 2,682,160 2,588,928 0 2,592 9,557 2,601,078 PATERSON HOUSING AUTHORITY 30510 PASSAIC 373,829 0 0 373,829 329,354 0 0 0 329,354 PATERSON PARKING AUTHORITY 30770 PASSAIC 148,166 0 0 148,166 142,351 0 0 0 142,351 POMPTON LAKES BD OF ED 21393 PASSAIC 378,006 2,783 9,981 390,770 331,456 0 0 0 331,456 POMPTON LAKES BOROUGH 21390 PASSAIC 260,550 0 0 260,550 235,549 0 0 0 235,549 POMPTON LAKES MUN UTIL AUTH 30920 PASSAIC 103,362 0 0 103,362 101,565 0 0 0 101,565 PROSPECT PARK BD OF ED 52773 PASSAIC 101,852 4,102 14,714 120,668 101,507 0 0 0 101,507 PROSPECT PARK BOROUGH 52770 PASSAIC 51,615 0 0 51,615 56,075 0 0 0 56,075 RINGWOOD BORO BD OF ED 22723 PASSAIC 373,400 0 0 373,400 344,876 0 0 0 344,876 RINGWOOD BOROUGH 22720 PASSAIC 331,057 0 0 331,057 270,794 0 1,839 6,780 279,413 TOTOWA BOROUGH 21940 PASSAIC 433,929 0 0 433,929 389,000 0 0 0 389,000 TOTOWA BOROUGH BD OF ED 21943 PASSAIC 173,124 0 0 173,124 194,487 0 0 0 194,487 TOWACO FIRE DISTRICT 2 56430 PASSAIC 0 0 0 0 635 0 0 0 635 WANAQUE BD OF ED 53513 PASSAIC 155,887 0 0 155,887 140,042 0 0 0 140,042 WANAQUE BOROUGH 53510 PASSAIC 229,031 0 0 229,031 220,200 0 0 0 220,200 WANAQUE VALLEY REG SEW AUTH 34360 PASSAIC 79,973 0 0 79,973 76,332 0 0 0 76,332 WAYNE BOARD OF EDUCATION 22453 PASSAIC 1,777,010 0 0 1,777,010 1,790,460 0 0 0 1,790,460 WAYNE TOWNSHIP 22450 PASSAIC 2,129,157 0 0 2,129,157 1,967,557 0 0 0 1,967,557 WEST MILFORD TOWNSHIP 22710 PASSAIC 798,775 0 0 798,775 708,664 0 0 0 708,664 WEST MILFORD TOWNSHIP BD OF ED 22713 PASSAIC 1,028,799 0 0 1,028,799 983,824 0 0 0 983,824 WEST MILFORD TWP MUN UTIL AUTH 55660 PASSAIC 7,892 0 0 7,892 7,231 0 0 0 7,231 WEST PATERSON BOROUGH 23340 PASSAIC 276,434 0 0 276,434 243,880 0 0 0 243,880 WOODLAND PARK BD OF ED 23343 PASSAIC 172,211 0 0 172,211 166,583 0 0 0 166,583 ALLOWAY TOWNSHIP 50060 SALEM 25,533 0 0 25,533 28,183 0 0 0 28,183 ALLOWAY TWP BD OF ED 50063 SALEM 52,092 0 0 52,092 53,162 0 0 0 53,162 CARNEYS POINT TOWNSHIP 22940 SALEM 143,095 0 0 143,095 139,812 0 0 0 139,812 CARNEYS PT TWP SEWERAGE AUTH 55720 SALEM 37,277 0 0 37,277 27,548 0 0 0 27,548 ELMER BOROUGH 50900 SALEM 30,910 0 0 30,910 26,743 0 0 0 26,743 ELSINBORO TOWNSHIP 50910 SALEM 5,973 0 0 5,973 5,530 0 0 0 5,530 ELSINBORO TOWNSHIP BD OF ED 50913 SALEM 8,195 0 0 8,195 8,385 0 0 0 8,385 LOWER ALLOWAYS CREEK BD OF ED 23673 SALEM 26,316 0 0 26,316 23,002 0 0 0 23,002 LOWER ALLOWAYS CREEK TOWNSHIP 23670 SALEM 115,228 0 0 115,228 113,042 0 0 0 113,042 MANNINGTON TOWNSHIP 51980 SALEM 26,202 0 0 26,202 25,179 0 0 0 25,179 MANNINGTON TOWNSHIP BD OF ED 51983 SALEM 34,889 0 0 34,889 35,354 0 0 0 35,354 OLDMANS TOWNSHIP 52510 SALEM 20,542 0 0 20,542 18,724 0 0 0 18,724 OLDMANS TWP BD OF ED 52513 SALEM 45,356 0 0 45,356 42,919 0 0 0 42,919 PENNS GROVE BOROUGH 52620 SALEM 52,789 0 0 52,789 50,639 0 0 0 50,639 PENNS GROVE CARNEYS POINT REG 57490 SALEM 494,567 0 0 494,567 453,857 0 0 0 453,857 PENNS GROVE HOUSING AUTHORITY 31570 SALEM 38,695 0 0 38,695 33,429 0 0 0 33,429 PENNS GROVE SEWERAGE AUTHORITY 55230 SALEM 33,400 0 0 33,400 30,004 0 0 0 30,004 PENNSVILLE SEWERAGE AUTHORITY 30780 SALEM 63,373 0 0 63,373 56,674 0 0 0 56,674 PENNSVILLE TOWNSHIP 22530 SALEM 373,835 0 0 373,835 351,793 0 0 0 351,793 PENNSVILLE TWP BD OF ED 22533 SALEM 249,555 0 0 249,555 227,832 0 0 0 227,832 PILESGROVE TOWNSHIP 52650 SALEM 49,006 0 0 49,006 45,568 0 0 0 45,568 PITTSGROVE TOWNSHIP 23460 SALEM 94,224 0 0 94,224 77,409 0 2,313 8,527 88,249 PITTSGROVE TWP BD OF ED 23463 SALEM 354,622 0 0 354,622 330,166 0 0 0 330,166 QUINTON TOWNSHIP 52780 SALEM 18,387 0 0 18,387 14,978 0 0 0 14,978 QUINTON TOWNSHIP BD OF ED 52783 SALEM 41,525 0 0 41,525 38,307 0 0 0 38,307 SALEM CITY 21760 SALEM 212,515 0 0 212,515 195,503 0 0 0 195,503 SALEM CITY BD OF ED 21763 SALEM 311,464 0 0 311,464 263,310 0 0 0 263,310 SALEM CITY HOUSING AUTHORITY 56160 SALEM 10,848 0 0 10,848 27,927 0 0 0 27,927 SALEM CITY MUNICIPAL PORT AUTH 34380 SALEM 3,292 0 0 3,292 3,016 0 0 0 3,016 SALEM CO BD OF SOCIAL SERVICES 10151 SALEM 532,251 0 0 532,251 484,652 0 0 0 484,652 SALEM CO IMPROVEMENT AUTHORITY 32800 SALEM 75,077 0 0 75,077 73,112 0 0 0 73,112 SALEM CO SP SERVICES SCH DIST 34790 SALEM 205,493 0 0 205,493 167,835 0 0 0 167,835 SALEM CO VOCATIONAL TECH SCHOOL 10153 SALEM 153,418 0 0 153,418 154,303 0 0 0 154,303 SALEM COMMUNITY COLLEGE 31860 SALEM 166,285 0 0 166,285 185,174 0 0 0 185,174 SALEM COUNTY 10150 SALEM 1,488,907 0 0 1,488,907 1,415,345 0 0 0 1,415,345 UPPER PITTSGROVE TOWNSHIP 23140 SALEM 47,858 0 0 47,858 31,515 0 0 0 31,515 UPPER PITTSGROVE TWP BD OF ED 23143 SALEM 66,033 0 0 66,033 55,597 0 0 0 55,597 WOODSTOWN BOROUGH 53830 SALEM 79,727 2,881 10,335 92,943 74,974 0 0 0 74,974
Page 44

Public Employee's Retirement SystemSchedule A - Schedule of Local Employer Contributions used toDetermine the Fiscal Year 2013 and Fiscal Year 2014 Proportionate Shares
Employer EmployerEmployer Employer Number County Contributions Contributions
Contributions for Fiscal Year 2014 Proportionate Shares Contributions for Fiscal Year 2013 Proportionate Shares
Fiscal Year 2015
Appropriation
Employer delayed
appropriations
Employer Contribution –
delayed enrollment
Fiscal Year 2014
AppropriationLate Reporting
Employers
Employer delayed
appropriations
Employer Contribution –
delayed enrollment
WOODSTOWN-PILESGROVE REG SCH 40380 SALEM 290,824 0 0 290,824 249,747 0 1,576 5,809 257,132 BEDMINSTER & FAR HILLS PUB LIB 34020 SOMERSET 43,705 0 0 43,705 41,230 0 0 0 41,230 BEDMINSTER TOWNSHIP 23200 SOMERSET 180,992 0 0 180,992 163,367 0 0 0 163,367 BEDMINSTER TWP BD OF ED 23203 SOMERSET 87,509 0 0 87,509 93,810 0 1,179 5,525 100,514 BERNARDS TOWNSHIP 22170 SOMERSET 851,381 0 0 851,381 758,774 0 0 0 758,774 BERNARDS TWP BD OF ED 22173 SOMERSET 893,254 2,107 7,560 902,921 812,491 0 1,801 6,639 820,931 BERNARDS TWP SEWERAGE AUTHORITY 30930 SOMERSET 86,160 0 0 86,160 75,592 0 0 0 75,592 BERNARDSVILLE BORO 21310 SOMERSET 363,723 0 0 363,723 312,258 0 0 0 312,258 BOUND BROOK BORO BD OF ED 22543 SOMERSET 263,524 0 0 263,524 233,734 0 0 0 233,734 BOUND BROOK BOROUGH 22540 SOMERSET 147,544 0 0 147,544 143,038 0 0 0 143,038 BRANCHBURG TOWNSHIP 22950 SOMERSET 490,433 0 0 490,433 422,027 0 0 0 422,027 BRANCHBURG TWP BD OF ED 22953 SOMERSET 313,253 0 0 313,253 283,659 0 0 0 283,659 BRIDGEWATER TWP 22830 SOMERSET 927,802 0 0 927,802 844,663 0 3,389 12,495 860,547 BRIDGEWATER-RARITAN REG SCH DIS 40170 SOMERSET 1,210,560 0 0 1,210,560 1,085,625 0 0 0 1,085,625 CENTRAL JERSEY COLL PREP CHRTR 46600 SOMERSET 77,358 0 0 77,358 60,911 0 0 0 60,911 FAR HILLS BOROUGH 50990 SOMERSET 16,333 0 0 16,333 22,845 0 0 0 22,845 FRANKLIN TOWNSHIP (SOMERSET) 22330 SOMERSET 1,080,369 0 0 1,080,369 969,457 0 0 0 969,457 FRANKLIN TWP BD OF ED (SOMERST) 22333 SOMERSET 1,874,537 0 0 1,874,537 1,675,625 0 0 0 1,675,625 FRANKLIN TWP HOUSING AUTHORITY 31030 SOMERSET 6,349 0 0 6,349 0 5,817 0 0 5,817 FRANKLIN TWP SEWERAGE AUTH 30790 SOMERSET 151,020 0 0 151,020 130,377 0 0 0 130,377 GREEN BROOK BD OF ED 22843 SOMERSET 195,988 0 0 195,988 192,267 0 0 0 192,267 GREEN BROOK TOWNSHIP 22840 SOMERSET 124,135 0 0 124,135 111,619 0 0 0 111,619 HILLSBOROUGH TOWNSHIP 22960 SOMERSET 767,505 0 0 767,505 654,602 0 0 0 654,602 HILLSBOROUGH TWP BD OF ED 22963 SOMERSET 1,093,973 0 0 1,093,973 981,615 0 6,366 23,468 1,011,448 HILLSBOROUGH TWP MUA 32050 SOMERSET 116,425 0 0 116,425 91,966 0 0 0 91,966 MANVILLE BOROUGH 21700 SOMERSET 280,825 0 0 280,825 280,816 0 0 0 280,816 MANVILLE BOROUGH BD OF ED 21703 SOMERSET 231,773 0 0 231,773 215,011 0 0 0 215,011 MILLSTONE BOROUGH 52160 SOMERSET 4,481 0 0 4,481 4,107 0 0 0 4,107 MONTGOMERY TOWNSHIP 22240 SOMERSET 699,708 0 0 699,708 628,305 0 0 0 628,305 MONTGOMERY TWP BD OF ED 22243 SOMERSET 919,030 0 0 919,030 810,129 0 0 0 810,129 NORTH PLAINFIELD BD OF ED 21173 SOMERSET 616,178 0 0 616,178 543,998 0 0 0 543,998 NORTH PLAINFIELD BOROUGH 21170 SOMERSET 288,267 0 0 288,267 247,645 0 0 0 247,645 PEAPACK & GLADSTONE BOROUGH 22020 SOMERSET 119,612 0 0 119,612 110,367 0 0 0 110,367 RARITAN BOROUGH 22260 SOMERSET 155,421 0 0 155,421 149,874 0 0 0 149,874 RARITAN VALL COMMUNITY COLLEGE 31170 SOMERSET 821,764 2,651 9,508 833,922 835,859 0 0 0 835,859 ROCKY HILL BOROUGH 52900 SOMERSET 10,831 0 0 10,831 9,924 0 0 0 9,924 SOMERSET CO BD OF SOCIAL SRVS 10091 SOMERSET 898,686 0 0 898,686 849,531 0 0 0 849,531 SOMERSET CO ED CTNL SRVC COMM 32830 SOMERSET 359,005 0 0 359,005 337,398 0 0 0 337,398 SOMERSET CO PK COMMISSION 10098 SOMERSET 1,020,349 0 0 1,020,349 888,214 0 1,160 4,278 893,652 SOMERSET CO VOCATIONAL SCHOOL 10093 SOMERSET 244,214 0 0 244,214 220,070 0 0 0 220,070 SOMERSET COUNTY_FINANCE OFFICE 10090 SOMERSET 6,742,966 0 0 6,742,966 6,276,782 0 0 0 6,276,782 SOMERSET HILLS BD OF ED 21313 SOMERSET 381,319 0 0 381,319 339,413 0 0 0 339,413 SOMERSET RARITAN VALL SEW AUTH 30630 SOMERSET 398,049 0 0 398,049 352,110 0 0 0 352,110 SOMERVILLE BD OF ED 20713 SOMERSET 404,327 0 0 404,327 352,928 0 0 0 352,928 SOMERVILLE BOROUGH 20710 SOMERSET 263,063 0 0 263,063 246,568 0 0 0 246,568 SOUTH BOUND BROOK BD OF ED 53113 SOMERSET 46,041 0 0 46,041 45,762 0 0 0 45,762 SOUTH BOUND BROOK BOROUGH 53110 SOMERSET 74,095 0 0 74,095 83,829 0 0 0 83,829 WARREN TOWNSHIP 53530 SOMERSET 405,609 0 0 405,609 364,864 0 0 0 364,864 WARREN TOWNSHIP BD OF ED 23693 SOMERSET 480,782 0 0 480,782 441,937 0 0 0 441,937 WATCHUNG BOROUGH 22390 SOMERSET 172,309 0 0 172,309 157,326 0 0 0 157,326 WATCHUNG BOROUGH BD OF ED 22393 SOMERSET 128,198 0 0 128,198 120,693 0 0 0 120,693 WATCHUNG HILLS REGIONAL H S 57210 SOMERSET 355,130 0 0 355,130 314,019 0 0 0 314,019 ANDOVER BOROUGH 50090 SUSSEX 12,664 0 0 12,664 11,526 0 0 0 11,526 ANDOVER REGIONAL BD OF ED 57080 SUSSEX 113,211 0 0 113,211 103,076 0 0 0 103,076 ANDOVER TOWNSHIP 23640 SUSSEX 151,403 0 0 151,403 144,308 0 0 0 144,308 BRANCHVILLE BOROUGH 50380 SUSSEX 20,041 0 0 20,041 19,265 0 0 0 19,265 BYRAM TOWNSHIP 50450 SUSSEX 155,905 0 0 155,905 142,613 0 0 0 142,613 BYRAM TWP BD OF ED 50453 SUSSEX 131,595 0 0 131,595 116,237 0 0 0 116,237 FRANKFORD TOWNSHIP 51050 SUSSEX 106,024 0 0 106,024 96,020 0 0 0 96,020 FRANKFORD TOWNSHIP BD OF ED 51053 SUSSEX 102,692 0 0 102,692 99,827 0 0 0 99,827 FRANKLIN BORO BD OF ED 21993 SUSSEX 87,415 0 0 87,415 81,440 0 0 0 81,440
Page 45

Public Employee's Retirement SystemSchedule A - Schedule of Local Employer Contributions used toDetermine the Fiscal Year 2013 and Fiscal Year 2014 Proportionate Shares
Employer EmployerEmployer Employer Number County Contributions Contributions
Contributions for Fiscal Year 2014 Proportionate Shares Contributions for Fiscal Year 2013 Proportionate Shares
Fiscal Year 2015
Appropriation
Employer delayed
appropriations
Employer Contribution –
delayed enrollment
Fiscal Year 2014
AppropriationLate Reporting
Employers
Employer delayed
appropriations
Employer Contribution –
delayed enrollment
FRANKLIN BOROUGH 21990 SUSSEX 123,805 0 0 123,805 105,890 0 0 0 105,890 FREDON TOWNSHIP 51120 SUSSEX 51,199 0 0 51,199 47,078 0 0 0 47,078 FREDON TOWNSHIP BD OF ED 51123 SUSSEX 55,823 0 0 55,823 60,876 0 0 0 60,876 GREEN TOWNSHIP 51210 SUSSEX 79,971 0 0 79,971 74,858 0 0 0 74,858 GREEN TOWNSHIP BD OF ED 51213 SUSSEX 75,969 0 0 75,969 63,248 0 0 0 63,248 HAMBURG BOROUGH 51300 SUSSEX 59,800 0 0 59,800 51,365 0 0 0 51,365 HAMBURG BOROUGH BD OF ED 51303 SUSSEX 40,679 0 0 40,679 51,212 0 0 0 51,212 HAMPTON TOWNSHIP 23610 SUSSEX 81,979 0 0 81,979 72,822 0 0 0 72,822 HAMPTON TOWNSHIP BD OF ED 23613 SUSSEX 53,934 0 0 53,934 52,123 0 0 0 52,123 HARDYSTON TOWNSHIP 51370 SUSSEX 249,650 0 0 249,650 221,398 0 0 0 221,398 HARDYSTON TOWNSHIP BD OF ED 51373 SUSSEX 90,056 0 0 90,056 101,364 0 0 0 101,364 HIGH POINT REG HIGH SCHOOL 57340 SUSSEX 251,361 0 0 251,361 214,620 0 0 0 214,620 HOPATCONG BOARD OF EDUCATION 51523 SUSSEX 442,884 0 0 442,884 408,621 0 0 0 408,621 HOPATCONG BOROUGH 51520 SUSSEX 391,752 0 0 391,752 346,549 0 0 0 346,549 KITTATINNY REGIONAL H S 57560 SUSSEX 184,756 0 0 184,756 158,568 0 0 0 158,568 LAFAYETTE BOARD OF EDUCATION 51693 SUSSEX 39,368 0 0 39,368 40,340 0 0 0 40,340 LAFAYETTE TOWNSHIP 51690 SUSSEX 51,945 0 0 51,945 46,821 0 0 0 46,821 LENAPE VALLEY REG H S DIST 57540 SUSSEX 124,366 0 0 124,366 119,134 0 0 0 119,134 MONTAGUE BD OF ED 52223 SUSSEX 44,173 0 0 44,173 40,538 0 0 0 40,538 MONTAGUE TOWNSHIP 52220 SUSSEX 42,584 0 0 42,584 44,444 0 0 0 44,444 MUSCONETCONG SEWERAGE AUTHORITY 31400 SUSSEX 77,573 0 0 77,573 65,069 0 0 0 65,069 NEWTON BD OF ED 22063 SUSSEX 296,506 0 0 296,506 285,959 0 0 0 285,959 NEWTON TOWN 22060 SUSSEX 309,859 0 0 309,859 272,307 0 0 0 272,307 NEWTON TOWN HOUSING AUTHORITY 32250 SUSSEX 21,582 0 0 21,582 17,531 0 0 0 17,531 OGDENSBURG BD OF ED 22013 SUSSEX 50,196 0 0 50,196 43,382 0 0 0 43,382 OGDENSBURG BOROUGH 22010 SUSSEX 31,917 0 0 31,917 33,651 0 0 0 33,651 SANDYSTON TOWNSHIP 52970 SUSSEX 27,891 0 0 27,891 29,731 0 0 0 29,731 SANDYSTON WALPACK SCHOOL DIST 57570 SUSSEX 33,627 0 0 33,627 31,446 0 0 0 31,446 SPARTA BD OF ED 21933 SUSSEX 619,725 0 0 619,725 511,165 0 0 0 511,165 SPARTA TOWNSHIP 21930 SUSSEX 590,724 0 0 590,724 533,094 0 0 0 533,094 STANHOPE BOROUGH 53190 SUSSEX 97,121 0 0 97,121 83,457 0 0 0 83,457 STANHOPE BOROUGH BD OF ED 53193 SUSSEX 43,033 0 0 43,033 34,305 0 0 0 34,305 STILLWATER TOWNSHIP 53200 SUSSEX 45,868 0 0 45,868 40,800 0 1,829 6,744 49,373 STILLWATER TOWNSHIP BD OF ED 53203 SUSSEX 47,839 0 0 47,839 50,214 0 0 0 50,214 SUSSEX BOROUGH 53260 SUSSEX 15,809 0 0 15,809 11,528 0 0 0 11,528 SUSSEX CO ED SERV COMM BD OF ED 32790 SUSSEX 53,681 0 0 53,681 39,816 0 3,387 12,487 55,690 SUSSEX CO MUN UTILITIES AUTH 32750 SUSSEX 335,581 6,757 24,238 366,577 279,694 0 0 0 279,694 SUSSEX CO SOIL CONSERVATION 32510 SUSSEX 17,498 0 0 17,498 15,565 0 0 0 15,565 SUSSEX COUNTY 10050 SUSSEX 2,514,426 0 0 2,514,426 2,624,386 0 0 0 2,624,386 SUSSEX COUNTY CHARTER SCHOOL 35460 SUSSEX 17,602 0 0 17,602 19,194 0 0 0 19,194 SUSSEX COUNTY COMM. COLLEGE 34050 SUSSEX 342,592 0 0 342,592 336,517 0 0 0 336,517 SUSSEX COUNTY VOCATIONAL 10053 SUSSEX 227,936 0 0 227,936 204,152 0 0 0 204,152 SUSSEX-WANTAGE REG SCH DIST 57550 SUSSEX 264,872 0 0 264,872 256,769 0 595 2,195 259,560 UNITY CHARTER SCHOOL 35580 SUSSEX 15,679 0 0 15,679 18,249 0 0 0 18,249 VERNON TOWNSHIP 53430 SUSSEX 445,121 0 0 445,121 397,811 0 0 0 397,811 VERNON TOWNSHIP BD OF ED 53433 SUSSEX 695,687 0 0 695,687 652,241 0 0 0 652,241 WALLKILL VALL REG H S 57580 SUSSEX 84,025 0 0 84,025 80,940 0 0 0 80,940 WALLPACK TOWNSHIP 53500 SUSSEX 2,205 0 0 2,205 2,207 0 0 0 2,207 WANTAGE TOWNSHIP 53520 SUSSEX 154,302 0 0 154,302 135,661 0 0 0 135,661 BARACK OBAMA GREEN CHARTER H.S. 49000 UNION 15,527 0 0 15,527 22,376 0 0 0 22,376 BERKELEY HEIGHTS BD OF ED 21243 UNION 506,903 0 0 506,903 467,256 0 0 0 467,256 BERKELEY HEIGHTS TOWNSHIP 21240 UNION 315,396 0 0 315,396 315,060 0 0 0 315,060 CENTRAL JERSEY ARTS CHARTER SCH 46100 UNION 47,407 0 0 47,407 50,579 0 1,425 5,255 57,259 CLARK TOWNSHIP 21540 UNION 406,251 0 0 406,251 355,959 0 0 0 355,959 CLARK TWP BD OF ED 21543 UNION 270,885 0 0 270,885 265,771 0 0 0 265,771 CRANFORD TOWNSHIP 20750 UNION 521,469 5,433 19,489 546,391 0 435,709 7,275 26,663 469,647 CRANFORD TWP BD OF ED 20753 UNION 680,898 0 0 680,898 585,090 0 0 0 585,090 ELIZABETH BD OF ED 21283 UNION 7,953,792 0 0 7,953,792 6,915,027 0 0 0 6,915,027 ELIZABETH CITY 21280 UNION 3,635,403 0 0 3,635,403 3,226,562 0 0 0 3,226,562 ELIZABETH CITY HOUSING AUTH 30410 UNION 377,624 0 0 377,624 323,161 0 0 0 323,161 ELIZABETH CITY PARKING AUTH 30530 UNION 119,092 0 0 119,092 112,412 0 0 0 112,412
Page 46

Public Employee's Retirement SystemSchedule A - Schedule of Local Employer Contributions used toDetermine the Fiscal Year 2013 and Fiscal Year 2014 Proportionate Shares
Employer EmployerEmployer Employer Number County Contributions Contributions
Contributions for Fiscal Year 2014 Proportionate Shares Contributions for Fiscal Year 2013 Proportionate Shares
Fiscal Year 2015
Appropriation
Employer delayed
appropriations
Employer Contribution –
delayed enrollment
Fiscal Year 2014
AppropriationLate Reporting
Employers
Employer delayed
appropriations
Employer Contribution –
delayed enrollment
ELIZABETH PUBLIC LIBRARY 21284 UNION 172,256 0 0 172,256 182,005 0 0 0 182,005 FANWOOD BOROUGH 22310 UNION 181,173 0 0 181,173 164,134 0 0 0 164,134 GARWOOD BOROUGH 20900 UNION 137,669 0 0 137,669 126,721 0 0 0 126,721 GARWOOD BOROUGH BD OF ED 20903 UNION 54,090 0 0 54,090 47,848 0 0 0 47,848 HILLSIDE BOARD OF EDUCATION 21083 UNION 626,723 0 0 626,723 567,908 0 0 0 567,908 HILLSIDE PUBLIC LIBRARY 21084 UNION 44,269 0 0 44,269 41,442 0 0 0 41,442 HILLSIDE TOWNSHIP 21080 UNION 514,315 0 0 514,315 484,172 0 0 0 484,172 KENILWORTH BOROUGH 21640 UNION 264,818 0 0 264,818 247,259 0 0 0 247,259 KENILWORTH BOROUGH BD OF ED 21643 UNION 157,288 0 0 157,288 147,568 0 0 0 147,568 LINDEN CITY 20110 UNION 1,949,700 0 0 1,949,700 1,748,690 0 0 0 1,748,690 LINDEN CITY BD OF ED 20113 UNION 1,339,885 0 0 1,339,885 1,167,607 0 0 0 1,167,607 LINDEN CITY HOUSING AUTHORITY 31260 UNION 156,773 0 0 156,773 149,428 0 0 0 149,428 LINDEN CTY FREE PUBLIC LIBRARY 20114 UNION 120,648 0 0 120,648 110,896 0 0 0 110,896 LINDEN ROSELLE SEWERAGE AUTH 30270 UNION 311,025 0 0 311,025 292,041 0 0 0 292,041 MOUNTAINSIDE BORO BD OF ED 21503 UNION 99,933 0 0 99,933 95,357 0 0 0 95,357 MOUNTAINSIDE BOROUGH 21500 UNION 183,068 0 0 183,068 168,601 0 0 0 168,601 NEW PROVIDENCE BD OF ED 20973 UNION 411,320 0 0 411,320 366,185 0 0 0 366,185 NEW PROVIDENCE BOROUGH 20970 UNION 355,925 0 0 355,925 318,562 0 0 0 318,562 PLAINFIELD BD OF ED 20133 UNION 1,852,681 0 0 1,852,681 1,705,847 0 0 0 1,705,847 PLAINFIELD CITY 20130 UNION 1,311,276 0 0 1,311,276 1,150,826 0 0 0 1,150,826 PLAINFIELD HOUSING AUTHORITY 30590 UNION 165,788 0 0 165,788 145,849 0 0 0 145,849 PLAINFIELD MUN. UTILITIES AUTH. 35240 UNION 602,821 0 0 602,821 612,399 0 0 0 612,399 QUEEN CITY ACADEMY CHARTER SCH 39200 UNION 29,604 0 0 29,604 26,265 0 0 0 26,265 RAHWAY CITY 20840 UNION 751,264 2,051 7,356 760,670 676,787 0 0 0 676,787 RAHWAY CITY BD OF ED 20843 UNION 562,984 0 0 562,984 522,017 0 830 3,061 525,909 RAHWAY CITY HOUSING AUTHORITY 56070 UNION 109,234 0 0 109,234 98,677 0 0 0 98,677 RAHWAY CITY REDEVELOPMENT AG 41000 UNION 6,402 0 0 6,402 4,500 0 0 0 4,500 RAHWAY PARKING AUTHORITY 34980 UNION 13,492 0 0 13,492 12,362 0 0 0 12,362 RAHWAY PUBLIC LIBRARY 20844 UNION 95,450 0 0 95,450 93,234 0 0 0 93,234 RAHWAY VALLEY SEWERAGE AUTH 30050 UNION 439,514 0 0 439,514 401,235 0 0 0 401,235 ROSELLE BORO BD OF ED 21013 UNION 442,847 4,282 15,360 462,489 369,322 0 10,132 37,353 416,806 ROSELLE BOROUGH 21010 UNION 412,626 0 0 412,626 364,850 0 9,116 33,606 407,572 ROSELLE BOROUGH LIBRARY 21014 UNION 29,926 0 0 29,926 28,349 0 0 0 28,349 ROSELLE PARK BORO BD OF ED 20693 UNION 327,106 789 2,830 330,725 308,705 0 0 0 308,705 ROSELLE PARK BOROUGH 20690 UNION 251,541 0 0 251,541 238,095 0 0 0 238,095 SCOTCH PLAINS FANWOOD BD OF ED 40140 UNION 953,637 0 0 953,637 849,103 0 0 0 849,103 SCOTCH PLAINS TOWNSHIP 22570 UNION 493,761 0 0 493,761 453,450 0 0 0 453,450 SPRINGFIELD TOWNSHIP (UNION) 20310 UNION 457,157 0 0 457,157 445,766 0 0 0 445,766 SPRINGFIELD TWP BD ED (UNION) 20313 UNION 441,785 0 0 441,785 393,940 0 0 0 393,940 SUMMIT BOARD OF EDUCATION 20363 UNION 813,406 0 0 813,406 724,187 0 0 0 724,187 SUMMIT CITY 20360 UNION 1,074,137 0 0 1,074,137 1,020,821 0 0 0 1,020,821 UNION CO BD OF SOCIAL SERVICES 10101 UNION 3,398,583 0 0 3,398,583 3,122,002 0 0 0 3,122,002 UNION CO EDUC SERV COMMISSION 31440 UNION 424,815 0 0 424,815 364,136 0 0 0 364,136 UNION CO UTILITIES AUTHORITY 34420 UNION 88,804 0 0 88,804 103,855 0 0 0 103,855 UNION CO VOCATIONAL SCHOOLS 10103 UNION 122,132 0 0 122,132 144,516 0 0 0 144,516 UNION COUNTY 10100 UNION 9,228,669 0 0 9,228,669 9,352,891 0 0 0 9,352,891 UNION COUNTY COLLEGE 34040 UNION 1,172,664 0 0 1,172,664 1,007,426 0 0 0 1,007,426 UNION COUNTY TEAMS CHARTER SCHL 45400 UNION 39,430 0 0 39,430 34,097 0 0 0 34,097 UNION TOWNSHIP (UNION) 21250 UNION 1,401,060 0 0 1,401,060 1,274,715 0 0 0 1,274,715 UNION TOWNSHIP LIBRARY 21254 UNION 142,687 0 0 142,687 127,057 0 0 0 127,057 UNION TWP BD OF ED (UNION) 21253 UNION 1,456,208 14,782 53,081 1,524,071 1,301,774 0 0 0 1,301,774 WESTFIELD TOWN 20410 UNION 825,839 0 0 825,839 784,967 0 0 0 784,967 WESTFIELD TOWN BD OF ED 20413 UNION 1,028,361 0 0 1,028,361 888,172 0 0 0 888,172 WINFIELD TOWNSHIP 22850 UNION 14,566 0 0 14,566 11,596 0 0 0 11,596 WINFIELD TOWNSHIP BD OF ED 22853 UNION 26,353 0 0 26,353 23,597 0 0 0 23,597 ALLAMUCHY BD OF ED 50033 WARREN 102,075 0 0 102,075 87,800 0 0 0 87,800 ALLAMUCHY TOWNSHIP 50030 WARREN 55,225 0 0 55,225 59,374 0 0 0 59,374 ALPHA BD OF ED 50073 WARREN 26,296 0 0 26,296 29,787 0 0 0 29,787 ALPHA BOROUGH 50070 WARREN 44,698 0 0 44,698 43,995 0 0 0 43,995 BELVIDERE TOWN 50240 WARREN 80,481 0 0 80,481 78,284 0 0 0 78,284 BELVIDERE TOWN BD OF ED 50243 WARREN 111,400 96 426 111,922 104,151 0 0 0 104,151
Page 47

Public Employee's Retirement SystemSchedule A - Schedule of Local Employer Contributions used toDetermine the Fiscal Year 2013 and Fiscal Year 2014 Proportionate Shares
Employer EmployerEmployer Employer Number County Contributions Contributions
Contributions for Fiscal Year 2014 Proportionate Shares Contributions for Fiscal Year 2013 Proportionate Shares
Fiscal Year 2015
Appropriation
Employer delayed
appropriations
Employer Contribution –
delayed enrollment
Fiscal Year 2014
AppropriationLate Reporting
Employers
Employer delayed
appropriations
Employer Contribution –
delayed enrollment
BLAIRSTOWN TOWNSHIP 23310 WARREN 85,273 0 0 85,273 73,032 0 0 0 73,032 BLAIRSTOWN TWP BD OF ED 23313 WARREN 62,143 0 0 62,143 56,168 0 0 0 56,168 FRANKLIN TOWNSHIP (WARREN) 51110 WARREN 51,948 0 0 51,948 46,925 0 0 0 46,925 FRANKLIN TWP BD OF ED (WARREN) 51113 WARREN 55,459 0 0 55,459 54,487 0 0 0 54,487 FRELINGHUYSEN TWP 51140 WARREN 32,647 0 0 32,647 29,313 0 0 0 29,313 FRELINGHUYSEN TWP BD OF ED 23813 WARREN 7,593 0 0 7,593 9,941 0 0 0 9,941 GREAT MEADOWS REGIONAL BD OF ED 35000 WARREN 138,876 0 0 138,876 115,036 0 0 0 115,036 GREENWICH TOWNSHIP (WARREN) 51250 WARREN 57,401 0 0 57,401 52,769 0 0 0 52,769 GREENWICH TWP BD OF ED (WARREN) 51253 WARREN 99,257 0 0 99,257 88,403 0 0 0 88,403 HACKETTSTOWN BD OF ED 20383 WARREN 293,409 0 0 293,409 244,893 0 0 0 244,893 HACKETTSTOWN MUN UTIL AUTHORITY 30980 WARREN 141,739 0 0 141,739 126,819 0 0 0 126,819 HACKETTSTOWN TOWN 20380 WARREN 174,013 0 0 174,013 152,639 0 0 0 152,639 HARDWICK TOWNSHIP 51360 WARREN 26,470 0 0 26,470 24,852 0 0 0 24,852 HARMONY TOWNSHIP 51380 WARREN 33,938 0 0 33,938 30,804 0 0 0 30,804 HARMONY TOWNSHIP BD OF ED 51383 WARREN 37,973 0 0 37,973 38,558 0 0 0 38,558 HOPE TOWNSHIP 51530 WARREN 46,960 0 0 46,960 41,206 0 0 0 41,206 HOPE TWP BD OF ED 51533 WARREN 35,853 0 0 35,853 33,843 0 0 0 33,843 INDEPENDENCE TWP 21550 WARREN 67,272 0 0 67,272 63,989 0 0 0 63,989 KNOWLTON TOWNSHIP 51670 WARREN 48,086 0 0 48,086 41,844 0 0 0 41,844 KNOWLTON TWP BD OF ED 51673 WARREN 36,924 0 0 36,924 32,687 0 0 0 32,687 LIBERTY TOWNSHIP 51770 WARREN 33,062 0 0 33,062 32,695 0 0 0 32,695 LOPATCONG TOWNSHIP 23480 WARREN 115,626 0 0 115,626 109,467 0 0 0 109,467 LOPATCONG TOWNSHIP BD OF ED 23483 WARREN 117,140 0 0 117,140 90,839 0 0 0 90,839 MANSFIELD TOWNSHIP (WARREN) 52000 WARREN 89,338 0 0 89,338 87,818 0 0 0 87,818 MANSFIELD TWP BD ED (WARREN) 52003 WARREN 63,796 0 0 63,796 58,617 0 0 0 58,617 NORTH WARREN REG HIGH SCHOOL 57510 WARREN 113,323 0 0 113,323 108,784 0 0 0 108,784 OXFORD TOWNSHIP 52530 WARREN 33,914 0 0 33,914 38,120 0 0 0 38,120 OXFORD TWP BD OF ED 52533 WARREN 64,717 0 0 64,717 48,074 0 0 0 48,074 PHILLIPSBURG HOUSING AUTHORITY 30390 WARREN 163,321 0 0 163,321 153,235 0 0 0 153,235 PHILLIPSBURG TOWN 20740 WARREN 369,477 0 0 369,477 346,227 0 0 0 346,227 PHILLIPSBURG TOWN BD OF ED 20743 WARREN 805,710 0 0 805,710 730,310 0 0 0 730,310 POHATCONG TOWNSHIP 52750 WARREN 83,833 0 0 83,833 75,037 0 3,950 14,564 93,551 POHATCONG TWP BOE 52753 WARREN 48,534 0 0 48,534 46,508 0 0 0 46,508 RIDGE AND VALLEY CHARTER SCHOOL 42900 WARREN 18,881 1,193 4,280 24,355 18,436 0 0 0 18,436 WARREN CO BD OF CHOSEN FRHLDRS 10110 WARREN 3,339,241 0 0 3,339,241 3,114,044 0 0 0 3,114,044 WARREN CO MOSQ EXTERM COMM 10112 WARREN 33,324 0 0 33,324 40,218 0 0 0 40,218 WARREN CO MUNICIPAL UTIL AUTH 33010 WARREN 34,109 0 0 34,109 29,940 0 0 0 29,940 WARREN CO POLLUTION CONTROL 34610 WARREN 62,725 0 0 62,725 58,474 0 0 0 58,474 WARREN CO SOIL CONSERVATN DIST 32380 WARREN 16,368 0 0 16,368 14,583 0 0 0 14,583 WARREN CO SP SERVICES SCH DIST 34800 WARREN 118,046 0 0 118,046 110,550 0 0 0 110,550 WARREN CO VOCATIONAL SCHOOL 10113 WARREN 64,859 0 0 64,859 67,364 0 0 0 67,364 WARREN COUNTY COMMUNITY COLLEGE 33090 WARREN 211,132 0 0 211,132 201,490 0 0 0 201,490 WARREN HILLS REG SCHOOLS 57310 WARREN 322,304 0 0 322,304 274,054 0 0 0 274,054 WASHINGTON BORO BD OF ED 20723 WARREN 77,649 0 0 77,649 64,859 0 0 0 64,859 WASHINGTON BOROUGH 20720 WARREN 79,775 0 0 79,775 85,194 0 0 0 85,194 WASHINGTON TWP (WARREN) 53580 WARREN 113,927 5,962 21,386 141,275 114,301 0 0 0 114,301 WASHINGTON TWP BD ED (WARREN) 53583 WARREN 113,649 0 0 113,649 112,810 0 0 0 112,810 WHITE TOWNSHIP 53740 WARREN 50,531 0 0 50,531 41,573 0 0 0 41,573 WHITE TOWNSHIP BD OF ED 53743 WARREN 38,682 0 0 38,682 31,121 0 0 0 31,121
Total Local Group 821,590,638 608,260 2,186,679 824,385,577 749,523,699 1,034,300 624,844 2,296,735 753,479,575
Page 48