research report.docx
DESCRIPTION
research reportTRANSCRIPT
CHAPTER 1
INTRODUCTION
1.1 INTRODUCTION
Bloch (1984) defined a healthy lifestyle as an orientation toward the prevention of health problems and
the maximization of personal wellbeing. While this could legitimately encompass a wide variety of
behaviors from flossing after meals to applying sunscreen, most healthy lifestyle research has focused
on diet and exercise (Kraft and Goodell, 1993). Healthy Lifestyle is important in daily life. Nowadays,
people are concern to create healthy lifestyle in their daily life. The immense influence of this market is
underscored by Roger Deromedi, CEO of Kraft Foods, who said: “The growing importance of health
and wellness has altered buying patterns to a degree that I have not seen before in the food business”
(Howell, 2004). Poor healthy lifestyle will give bad impact to our body. This is because when they did
not apply healthy lifestyle in their daily life, it is easy for them to get danger dieses. So, with regard to
this particular market, demand has being driven by a large customer needed segment that bases a
number of its purchase decisions on its desire to adopt or maintain a healthy lifestyle (Berry, 2004;
Weiss, 2002,Beverage Industry, 2004; National Petroleum News, 2002). This study will attempt to
better define the profile for this segment by analyzing associations between maintaining a healthy
lifestyle and a number of demographic, personal value and psychological characteristics (Lepisto, 2005).
Healthy lifestyle can starts from home. Parents are role models to their children in apply healthy
lifestyle. For example, if children always practice live healthy lifestyle from home, they will apply it at
outside or where ever they go. Research has shown that children's behavior is learned mostly thorough
the observation of others. So parents are in a prime position to influence their children's habits and play
a vital role in shaping their future healthy habits. Parents need to be healthy role models for their kids
(Keogh, 2011). So, every parent behavior will be followed by their children either good behavior or bad
behavior. Parents must show good roles to hat their children. So, children can follow them based on
what they learn from their parent.
1

Nowadays, parent always busy with their works. As a nation they're working longer hours compare to
spending less time at home. They prefer struggle to get that important work-life balance anywhere near
right and their children are suffering as a result (Keogh, 2011). This is one of the reason parent do not
have enough time to encourage their children to practice their healthy lifestyle. So, their children cannot
manage their activity and healthy food by themselves. Parents more influence their children to play
indoor games. So, their children always play indoor games such as computer games, play station and
others. This kind of games may influence them to become obesity. It is because they just sit and play.
Children did not do any exercise when they play indoor game. Other than that, when playing indoor
games, they will not produce any sweat or burn their fat that contained in their bodies.
Children become overweight when the energy they ‘take in’ (through food and drink) is greater than the
energy they ‘put out’ (through physical activity and exercise). A diet high in energy and fat, combined
with low levels of physical activity and exercise, will lead to a person becoming overweight. Children
inherit body type and shape from their parents. Parents cannot change these factors but they can
influence their child’s eating habits and activity patterns, which will also affect their body weight
(Victoria, 2012). In addition, daily activities also affect overweight factors. This is because if children
less to move or exercise, food consumed by them will turn to fat. Fat stores will result in overweight. So,
parents should always control nutrition and their children activities so that this matter can be resolved.
The main factor of overweight begins with indoor games. Indoor games do not require much movement.
So, if not balance their children and activity feeds, it will influence them up to become overweight.
Aware parent also have to control their children. They have to think how to avoid their children from
overweight. Other than that, they have to alert or control an effective activity to their children.
To overcome it, parents need to change this pattern and influence their children's activity levels by
providing opportunities, support and encouragement for them to play sports. So, parents need to once
more become role models to their children (Keogh, 2011). Physical activity can be a part of daily
routine. It is good for parents who use or apply it wisely. For example, every evening weekend, they will
do some exercise together compare with spend too much time in front of the television or computer
screen. It will not only nourish the body. It also can strengthen the tassel silaturahin between parents
and children.
2
1.2 PROBLEM STATEMENT AND RESEARCH QUESTION
Changes nowadays can have adverse effects on us. Changes in terms of technology to further reduce
outside activities of a person. Nowadays, children prefer to play indoor games compare to outdoor
games. This is because they always fanatic with technology nowadays. Their parents also feel easy to
monitor their children if their children play indoor games such as computer game, play station and
others. They did not feel worried when they children play indoor games because they easy to guide
them. Parents did not have to think about the danger that they have to think.
This problem may influence obesity to children. This thing will happen when they did not do any
exercise. When they play computer games, what they need to do is just sit and click at the computer. So,
they did not do a lot of movement when they play computer games. Playing indoor games will affect
less air to children. This is because they do not get fresh air because they just sit at home alone. When
they get less fresh air, it will influence them easy to get danger dieses. Other than that, children will be
less social with other people. They just stay at home and did not see or connect with other people.
Factors that we need to overcome in order to prevent it from becoming worse. It will give another bad
impact that will affect others.
Therefore several questions need to be answered such as:-
1) Did the parent aware with their children choices of food?
2) Did the unbalance nutrition will affect our body?
3) Did the parent control their children activities?
4) Did the parent applied healthy lifestyle in their daily life?
5) Did the right choices of food is important for our body?
3
1.3 RESEARCH OBJECTIVE
i. To identify eating habit of people in Seri Iskandar.
The purpose of the study is to identify the factors toward eating habit of people in Seri Iskandar. From
the purpose researcher can know what factor is influence eating habit of people in Seri Iskandar.
Researcher also can know how they applied it in their daily life.
ii. To analyze the important of healthy lifestyle in Seri Iskandar across gender and position.
The purpose of the study is to analyze the important of healthy lifestyle in Seri Iskandar. Researcher
wants to know whether they applied their healthy lifestyle in daily routine. That is means through the
purpose the important of healthy lifestyle can be measure.
iii. To evaluate the awareness of choices of food.
The purpose of the study is to evaluate the awareness of choices of food. It means that from the purpose,
researcher can know what kind of awareness that parents will aware to their children choices of food.
4
CHAPTER 2
LITERATURE REVIEW
2.1 LITERITURE REVIEW
Obesity is a global problem afflicting all age groups, bringing social and economic burdens (Kara Chan,
2009). Government makes a lot of activities to overcome this problem. People have to control their diet
and activities. Lack of exercise may people to become obesity. So, to prevent it, they have to reschedule
their activity and their diet. If they can control their diet wisely, they can live in healthy life.
DEMOGRAPHIC
Gender is important in create healthy lifestyle. This is because the activity and quantity of food taken by
children and adulthood is different. Nutrition for older people are likely to eat more daily servings of
fruit and vegetables, younger people are less likely to be overweight and more likely to be on a diet
(Richard L. Divine, 2005). Different gender also has different needs and different quantity of food. It
based on their daily activity or daily routine that they do every day. The situation will be different for
children. For example, adult male need to eat more compare to children male. Other than that, active
children need to eat more compare to children who is playing indoor activity. This is because if their
parents do not control their diet and activity, it will influence them to become obesity. Regard to
exercise, aging baby boomers have been identified as the driving force behind the resurgence in the
fitness industry (Weiss, 2002), while an industry study found that people over 55 were the fastest
growing segment in the health club market (Maquire, 1999).
5
Higher income people are more likely to exercise and are more likely to be using exercise as a means of
losing weight. They will spend their money to go to gym or buy any exercise machine so that they can
use it to do an exercise. Other than that, they will conscious with regard to nutrition. Income is
positively or high income linked to fruit and vegetable consumption (Richard L. Divine, 2005). So, they
are who most have the high income more easily apply healthy lifestyle compare to those who has lower
incomes. This happens because, who has higher income people are more concern with their health and
family health. They also will buy a high quality of fruit and vegetable with full of vitamin and nutrient.
They can balance their family healthy diet so that they will life in healthy lifestyle.
Lastly is about education. With regard to education, all the data suggest that healthy lifestyle consumers
are likely to be more educated. People with higher education are more likely to exercise and are more
likely to watch their diet. They also are more likely to manage they diet in systematically so that they are
always apply healthy diet. In addition, Nayga (1997) found a positive link between education and
interest in nutrition, while Goldsmith et al. (1995) found a negative link between education and attitudes
toward snacking. It means parent who is more educated will concern with their children healthy
lifestyle. They will choose suitable food and activity that is suitable for their children. This is because
they want their children to stay healthy and avoid from danger dieses.
6
AWARENESS
From the research that the researcher get, Results show that four in ten parents think they do not have
enough information about providing their child with a healthy diet. Bearing in mind that
raisingkids.co.uk is a website for parents and we can assume a high level of interest in nurturing
children, this figure suggests a widespread lack of knowledge of nutritional guidelines (Pat Spungin,
2004). So, tells that parents do not concern with the health of their children. To prevent this from
happening, they need to change their way of upbringing of their children. Important things that should
be changed are activities of their children. Their children have to be more active in sports or outdoor
games compare to indoor game. Healthy exercise behavior influencing lifestyle. This is because if the
Children did not do exercise, they may be susceptible to disease. Their weight will easily go up. This
will make them easy to get fat.
Governments worldwide are bracing themselves with the issue of an “obesity epidemic” soon. If they do
not curb this issue, the situation will become worse. This condition can potentially lead to a range of
health problems such as heart disease, diabetes and even premature death (Kulasagaran, 2009). So,
parents do not to be surprised if now their children easy susceptible to danger disease compare with the
past. Parents should endeavor to address the "obesity epidemic" in order to avoid their children in faced
from health problems. Worryingly, there has been a rise in cases of obesity among children. Many
studies indicate a link between the consumption of junk food to obesity in children (Kulasagaran, 2009).
It will also contribute to the deadly disease that will be faced by children. So, parent has to improve their
knowledge about this. When they know what happen, they will more conscious with their children food
and activity.
7
Next is about media. The more a child is exposed to television, the more they will accept the images
depicted are real (Solomon, 1996). A factor supported by Hastings et al. (2003) who argues that
advertising to children depicts messages of fantasy and fun. They will more use their imagination and
try it if they think it is not danger for them. Through the use of cartoon characters, media personalities
and snappy jingles, adverts can be effective in establishing consumer loyalty at a very young age (Keane
and Willetts, 1994). It can be difficult for a parent in the supermarket environment to resist the insistent
demands of a child to buy new food that they have seen on television (Darian, 1998; Moore and
Moschis, 1983; Moschis et al., 1980). For example, Ribena ads. They use different ads to attract children
to buy their product. They use cartoon and jingle for their advertising based on children imagination.
When children see Ribena at supermarket, they will ask their parent to buy it. Advertising aimed at
children is of particular concern (Keane and Willetts, 1994; Moore and Moschis, 1983; Moschis et al.,
1980).Nowadays, advertising may influence children food buying behavior. The survey established that
parents believe children are influenced by advertising. They take their children foods shopping with
them and in the store the children ask for food products they’ve seen advertised (Pat Spungin, 2004). In
addition, advertising is also affecting children to buy their product seen by. Children are easily
influenced by the ads they saw. They will follow the advertisement. Nowadays, company uses many
ways to attract children to buy their product. They will make some ads those children easy to remember.
So, children are influence to buy their product.
HEALTHY DIET
Healthy eating practices and indicates the problems involved in determining whether or not the British
consumer has adopted a nutritious and healthy diet. Healthy eating messages were widely received and
understood; however, there was some confusion over their content, skepticism regarding the veracity
and motivation of some sources and a growing resentment of boring and puritanical themes (Sarah
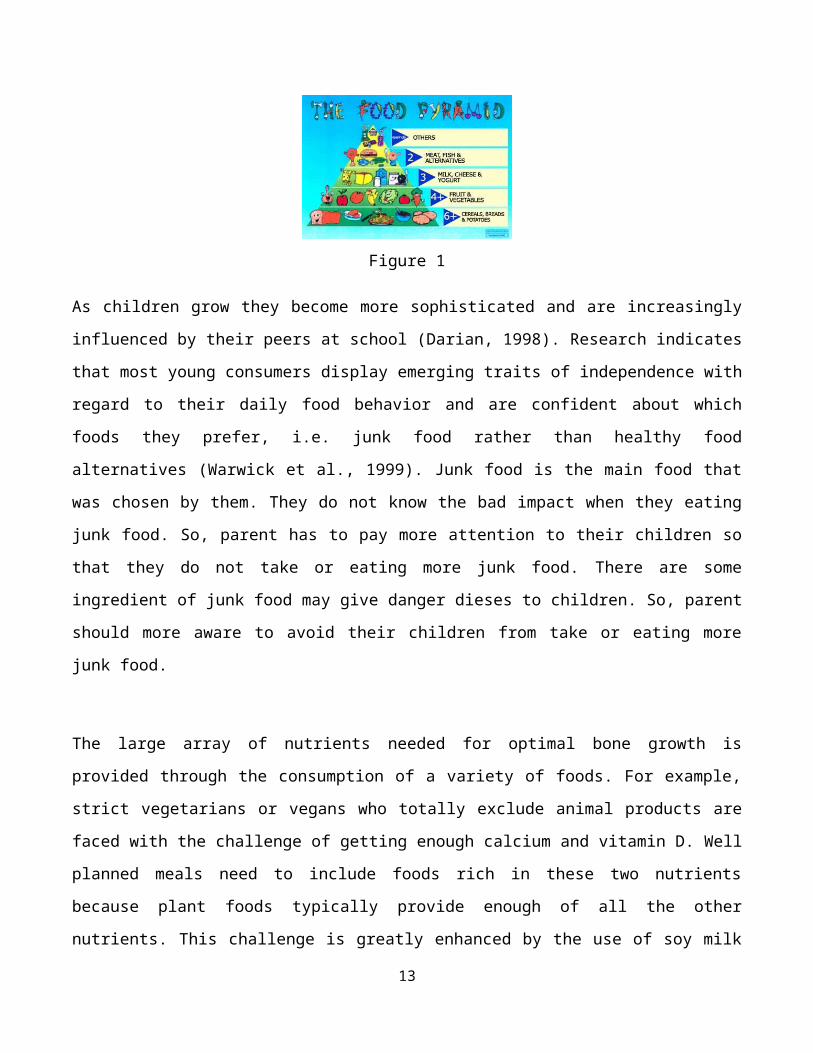
Maddock, 1999). There are people that one choose or define a healthy diet is. A healthy diet is a
balanced diet selection as there are in the food pyramid. Figure 1 show some food pyramid that must
follow by parents to their children.
8
Figure 1
As children grow they become more sophisticated and are increasingly influenced by their peers at
school (Darian, 1998). Research indicates that most young consumers display emerging traits of
independence with regard to their daily food behavior and are confident about which foods they prefer,
i.e. junk food rather than healthy food alternatives (Warwick et al., 1999). Junk food is the main food
that was chosen by them. They do not know the bad impact when they eating junk food. So, parent has
to pay more attention to their children so that they do not take or eating more junk food. There are some
ingredient of junk food may give danger dieses to children. So, parent should more aware to avoid their
children from take or eating more junk food.
The large array of nutrients needed for optimal bone growth is provided through the consumption of a
variety of foods. For example, strict vegetarians or vegans who totally exclude animal products are faced
with the challenge of getting enough calcium and vitamin D. Well planned meals need to include foods
rich in these two nutrients because plant foods typically provide enough of all the other nutrients. This
challenge is greatly enhanced by the use of soy milk fortified with vitamin D and calcium (Sarah
Maddock, 1999). A balance of nutrient also a rate is important in Healthy diet. Because this is, if we
provide enough nutrients from children, it will help our health as adults. Besides, it also strengthens our
spine. Sufficient protein and energy is needed to support the growth of all organs of the body, not simply
the skeleton. In fact, body growth may be optimal with adequate protein and energy, even when the
accumulation of mineral mass during skeletal growth is suboptimal because of insufficient intakes of
calcium and vitamin D. Rickets, for example, often occurs in young children with relatively normal
height and weight for age (Sarah Maddock, 1999).
9
2.2 THEORETICAL FRAMEWORK
Figure 2
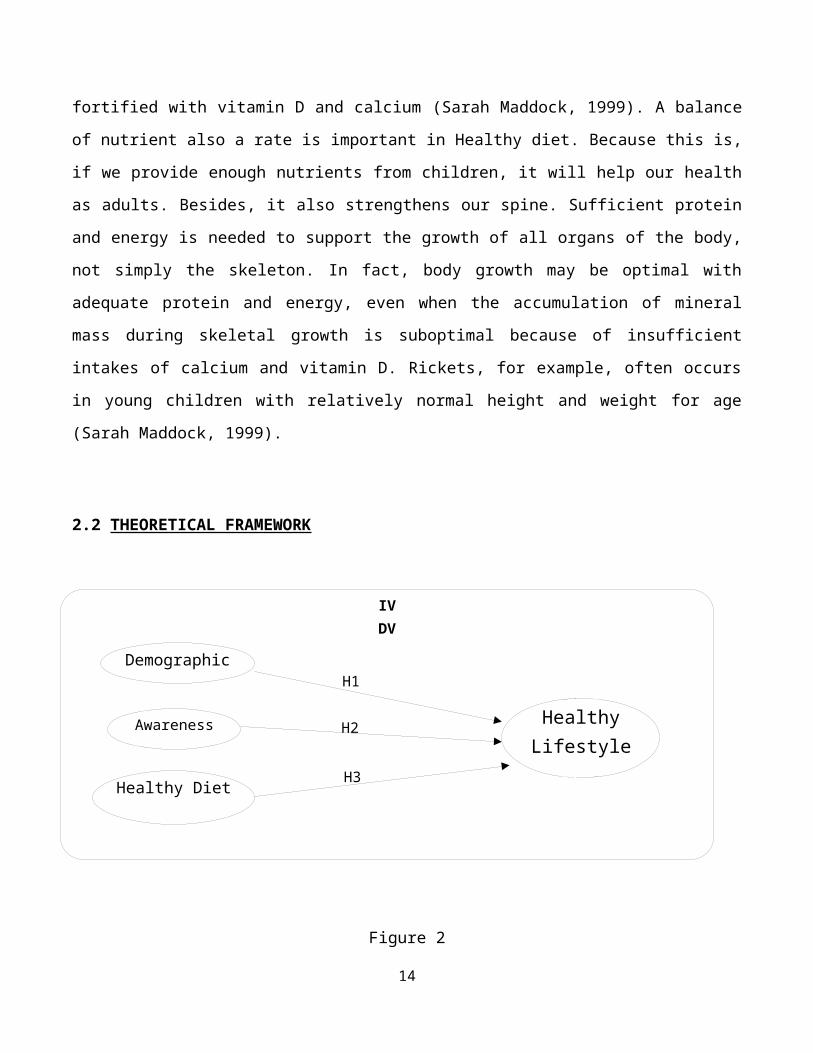
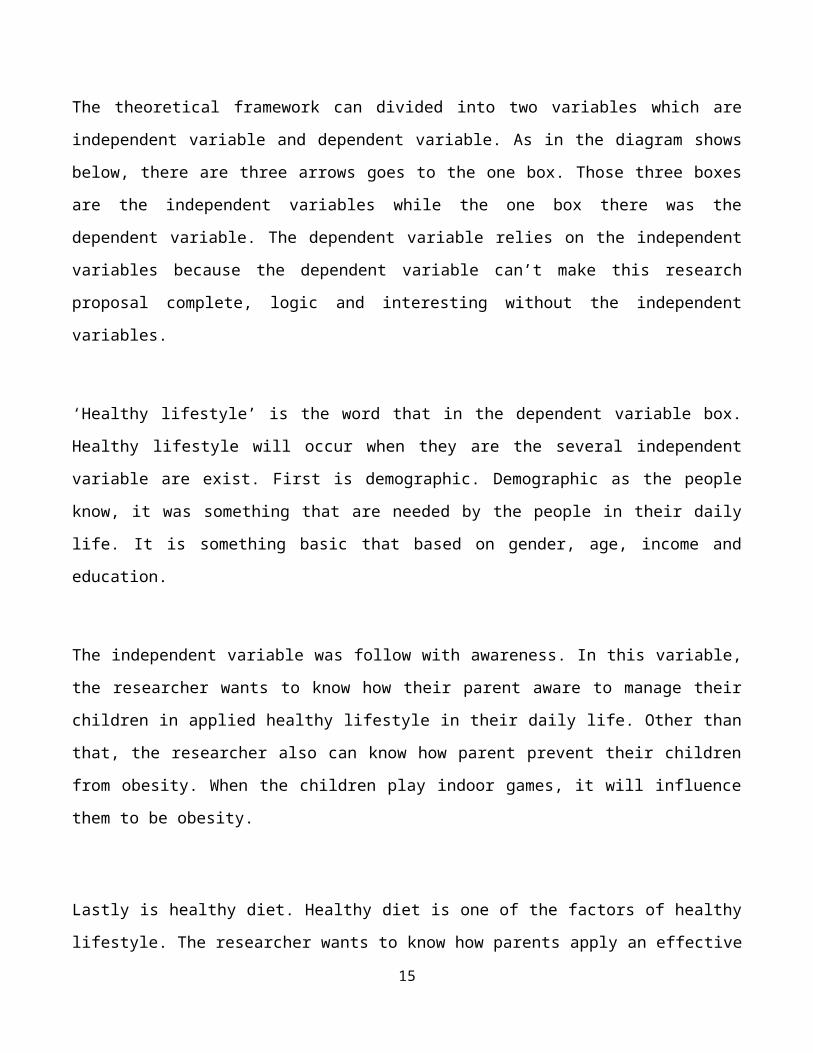
The theoretical framework can divided into two variables which are independent variable and dependent
variable. As in the diagram shows below, there are three arrows goes to the one box. Those three boxes
are the independent variables while the one box there was the dependent variable. The dependent
variable relies on the independent variables because the dependent variable can’t make this research
proposal complete, logic and interesting without the independent variables.
‘Healthy lifestyle’ is the word that in the dependent variable box. Healthy lifestyle will occur when they
are the several independent variable are exist. First is demographic. Demographic as the people know, it
was something that are needed by the people in their daily life. It is something basic that based on
gender, age, income and education.
The independent variable was follow with awareness. In this variable, the researcher wants to know how
their parent aware to manage their children in applied healthy lifestyle in their daily life. Other than that,
the researcher also can know how parent prevent their children from obesity. When the children play
indoor games, it will influence them to be obesity.
10
Demographic
Awareness
Healthy Diet
Healthy Lifestyle
IV DV
H1
H2
H3
Lastly is healthy diet. Healthy diet is one of the factors of healthy lifestyle. The researcher wants to
know how parents apply an effective food pyramid to their children. Besides that, they have to control
the quantity of nutrition of their children meal.
2.3 HYPOTHESES AND QUESTION
Hypothesis:
Based on the theoretical framework, the researcher wants to know whether independent variable and
dependent variables have a relationship. There are some hypotheses that can be use on this research such
as:
H1: There is a positive relationship between demographic and healthy lifestyle.
H2: There is a positive relationship between awareness and healthy lifestyle.
H3: There is a positive relationship between healthy diet and healthy lifestyle.
Question:
The following research questions will be explored:
Q1: Does demographic will help parent to applied healthy lifestyle?
Q2: Does awareness interest to motivate parent in healthy lifestyle?
Q3: Does healthy diet may help children to motivate in healthy lifestyle?
11
CHAPTER 3
RESEARCH METHOLOGY
3.1 POPULATION AND SAMPLE
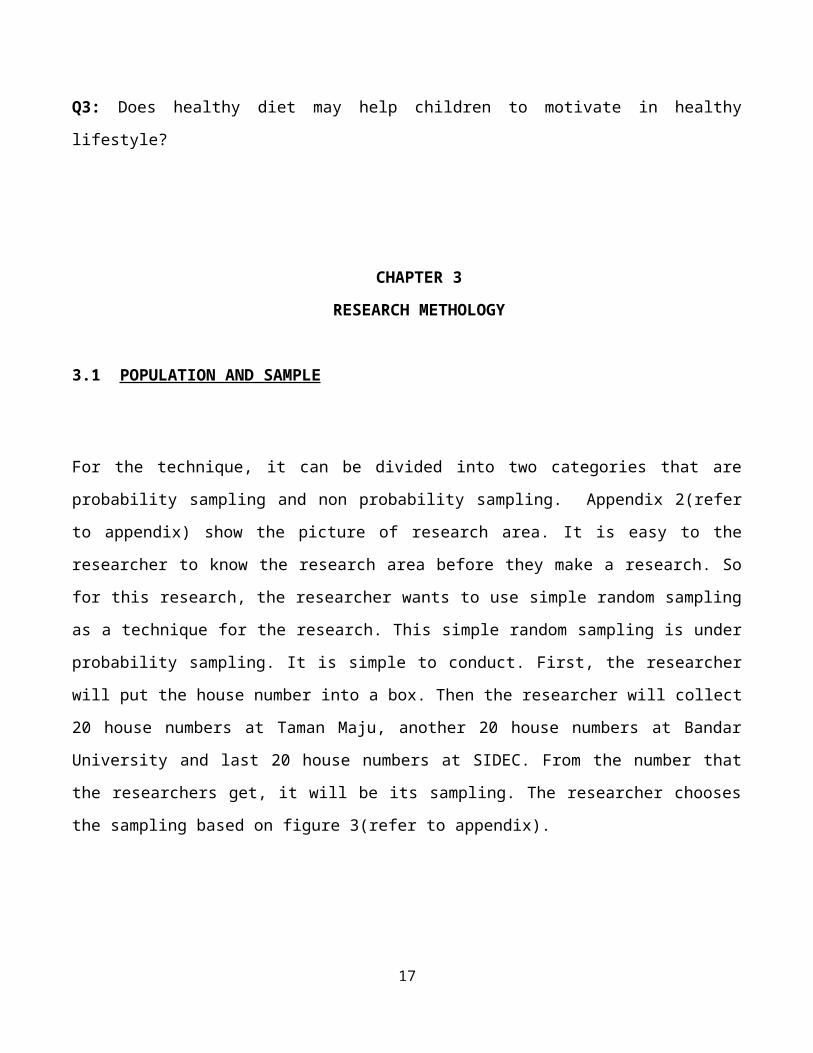
For the technique, it can be divided into two categories that are probability sampling and non probability
sampling. Appendix 2(refer to appendix) show the picture of research area. It is easy to the researcher to
know the research area before they make a research. So for this research, the researcher wants to use
simple random sampling as a technique for the research. This simple random sampling is under
probability sampling. It is simple to conduct. First, the researcher will put the house number into a box.
Then the researcher will collect 20 house numbers at Taman Maju, another 20 house numbers at Bandar
University and last 20 house numbers at SIDEC. From the number that the researchers get, it will be its
sampling. The researcher chooses the sampling based on figure 3(refer to appendix).
This research is conduct at Seri Iskandar, Perak. The questionnaire will be distributed to the resident of
Seri Iskandar. This is because of the sampling is around Seri Iskandar. The researcher reduce the
sampling scope where focus on parents. 60 questionnaires will be dividing into three parts, where 20
questionnaires for parents at Taman Maju, another 20 for parents at Bandar University and last 20
questionnaire for parents at SIDEC. The questionnaire will be distributed to parents where this can make
easy for researcher to get the information directly from the respondent.
12
3.2 INSTRUMENTATION
The instrumentation that can be applied in this study is by the questionnaires. This is really suitable
instrument that can be applied for this research to make them easy to collect the data. Questionnaire is
a research instrument consisting of a series of questions and other prompts for the purpose of gathering
information from respondents. The researcher provides 21 questions to answer the research.
There are many questions can be ask for this research study. But need to remember that the questions
must relate to the topic of the study. The questions also must be suitable for the students to answer it. In
a questionnaire, the researcher may divide the questions in the questionnaires into several parts. For the
questionnaire there will be 5 sections of the questions, which is section A, section B, section C, section
D and lastly section E.
For the section A, require respondents to fill up their background details such as gender, parent
education, parent occupation, parent income and parent position. This type of question is using close
ended questions. While for section B, question is based on the demographic (IV). From here, the
researcher can know income, parent position and their education level that may influence healthy
lifestyle. This type of question is using likert-type questions based on the five point ranging from
strongly disagree to strongly agree. In section C, questions based on the awareness (IV) about how
parent aware to apply healthy lifestyle to their children. The important of the question will be on five-
point likert-type questions ranging from strongly disagree to strongly agree. Next is section D. It based
on healthy diet (IV). The researcher wants to know how they apply an effective healthy diet to their
children. Question will be on; five point liket-type questions ranging from strongly disagree to strongly
agree. Lastly is section E. In this section the researcher use likert-type question ranging from strongly
disagree to strongly agree. The researcher creates questions based on healthy lifestyle (DV). From this
question the researcher can know whether resident agree or disagree in apply healthy lifestyle in their
daily life.
13
3.3 DATA COLLECTION
Data collection is the process of acquiring subjects and gathering information needed for a study,
methods of collection will vary depending on the study design. The data collection for my research is
from Primary data and Secondary data. Where for the primary data is data from the questionnaire that
has been answer by the respondent. Which is the data is get directly from the respondent and mostly data
from the primary data is more accurate and informative. This data the researcher get from SPSS. From
this data, the researcher will analyze it. Hence, for the secondary data, the researcher has been referring
to the journal, article and internet that based on research topic. Moreover, the secondary data that the
researcher gets from the journal is helping me in guiding me to make a research. Basically, the journal
that guides the researcher to done the research is a research from the previous researcher that related
with the topic. From that, it will help researcher in make a perfect research, where researcher can use the
previous research by using the framework that already have in the previous research and make a new
research based on the new scope and respondent related to the topic.
The main journals that researcher use for this research are:
i. Analysis of the healthy lifestyle consumer
ii. Parent power, not pester power
iii. Attitude toward organic foods among Taiwanese as related to health consciousness,
environmental attitudes, and the mediating effects of a healthy lifestyle
14
CHAPTER 4
DATA ANALYSIS
4.1 DATA ANALYSIS
Data analysis needs to be analyzes from the data collection. To analyses the data collections, the
researcher needs to use the Statistical Package for Social Science (SPSS) which a computer program
used for survey authoring and deployment. In other words, the SPSS is the system that will make the
researcher easy to calculate the data collection. Data type that will be analyzed is based on frequency,
cronbach`s alpha, descriptive statistic, pearson`s correlation and crosstab. For the frequency the data
investigate four variables only meanwhile crosstab will be investigated for one variable with two types
of demographic question. Generally, SPSS is a good for first statistical package for researcher that
wanting to carry out quantitative research in healthy lifestyle because it is simple to use. The advantages
of applying SPSS are discover unusual data. Other than that, the researcher also can know whether all
the data is enough or not enough fill up. Researcher wants to generate the data into crosstab because
from the crosstab it can show whether the independent variable and the dependent variable have a
relationship through the use of the healthy lifestyle. Hence, for the frequency, to measure based on the
independent variable itself.
Through data analysis researcher can analyze the data based on the respondent’s answer. By using this
SPSS, researcher can identify the factor which are demographic, awareness and healthy diet whether this
three factors influence toward the use of healthy lifestyle. The data will be performing in the frequency
data. From that, the researcher can determine whether factors have relationship with the dependent
variable or not. Besides that, from this data analysis, researcher also can analyze based on demographic
toward the healthy lifestyle. This kind of data will be performing by using crosstab. Lastly, researcher
also can measure the data of healthy diet toward the healthy lifestyle. The data also will be perform in
crosstab; from that researcher can determine what kind of healthy diet that influences them to create
healthy lifestyle. By analyze the data; the purpose of the study will be answer.
15
4.1 DESCRIPTIVE ANALYSIS
4.1.1 DEMOGRAPHIC PROFILE
Table 4.1 Demographic Profile
No Content Frequency PercentageQ1 Gender
Male 20 33.3Female 40 66.7
Q2 Parent education levelSPM 6 10.0DIPLOMA 17 28.3DEGREE 24 40.0MASTER 10 16.7PHD 3 5.0
Q3 Parent occupationStudent 5 8.3Government Sector 29 48.3Private Sector 17 28.3Freelance 6 10.0Others 3 5.0
Q4 Income Below than RM1 000 6 10.0RM1 000 - RM2 000 2 3.3RM2 000 - RM3 000 25 41.7RM3 000 - RM4 000 21 35.0More than RM4 000 6 10.0
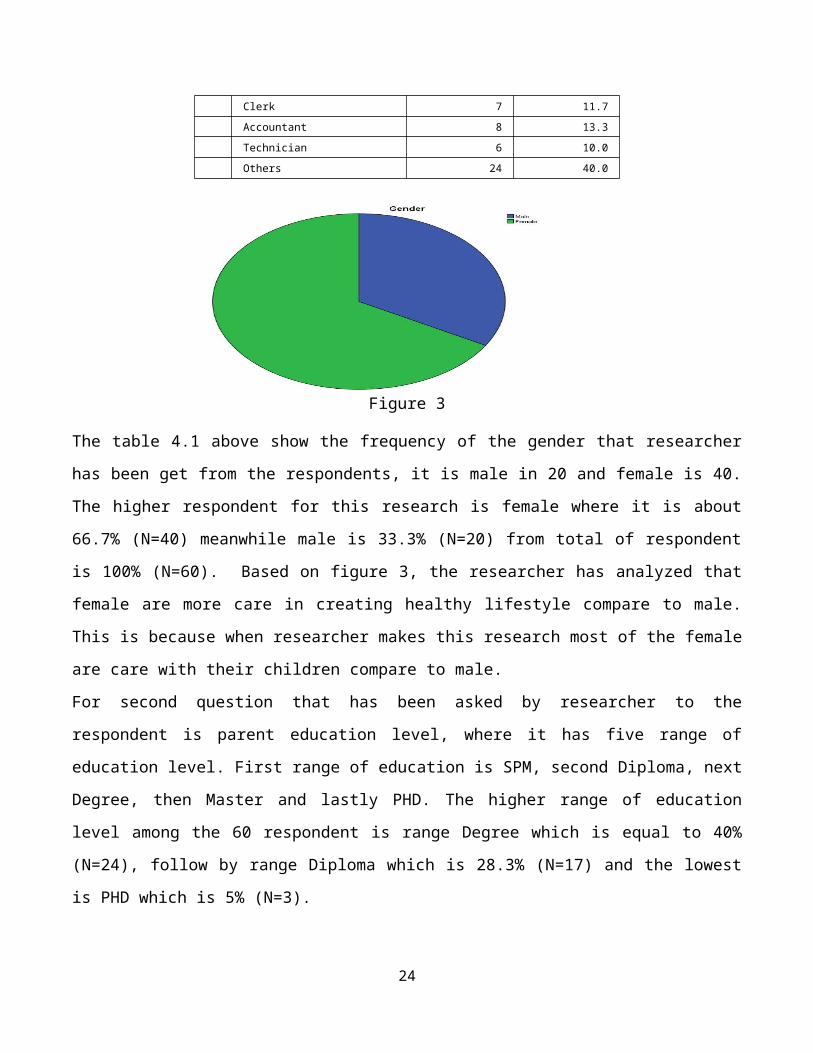
Q5 Parent positionManager 15 25.0Clerk 7 11.7Accountant 8 13.3Technician 6 10.0Others 24 40.0
Figure 3
The table 4.1 above show the frequency of the gender that researcher has been get from the respondents,
it is male in 20 and female is 40. The higher respondent for this research is female where it is about
66.7% (N=40) meanwhile male is 33.3% (N=20) from total of respondent is 100% (N=60). Based on
figure 3, the researcher has analyzed that female are more care in creating healthy lifestyle compare to
male. This is because when researcher makes this research most of the female are care with their
children compare to male.
16
For second question that has been asked by researcher to the respondent is parent education level, where
it has five range of education level. First range of education is SPM, second Diploma, next Degree, then
Master and lastly PHD. The higher range of education level among the 60 respondent is range Degree
which is equal to 40% (N=24), follow by range Diploma which is 28.3% (N=17) and the lowest is PHD
which is 5% (N=3).
For third questions is about parents occupation. The data show the same frequency of the five types of
occupation which is student, government sector, private sector, freelance and others. The data show
different result because researcher chooses the respondent based on simple random sampling that
research does it. The result show that the higher respondent is from government sector which is 48.3%
(N=29). It was followed by private sector which is 28.3% (N=17) and the minimum respondent parent
occupation is other which is 5% (N=3). The others respondent are working as housewife.
For fourth questionnaire is the respondent income. There has five range of income that was provided by
researcher. There are below than RM1 000, RM1 000 – RM2 000, RM2 000 – RM3 000, RM 3 000 –
RM4 000 and lastly more than RM4 000. The result show that maximum respondent income is RM2 000
– RM3 000 which is 41.7% (N=25) and it was followed by income RM3 000 –RM4 000 which is 35%
(N=21). The minimum respondent income is RM1 000 – RM2 000 which is 3.3% (N=2).
17
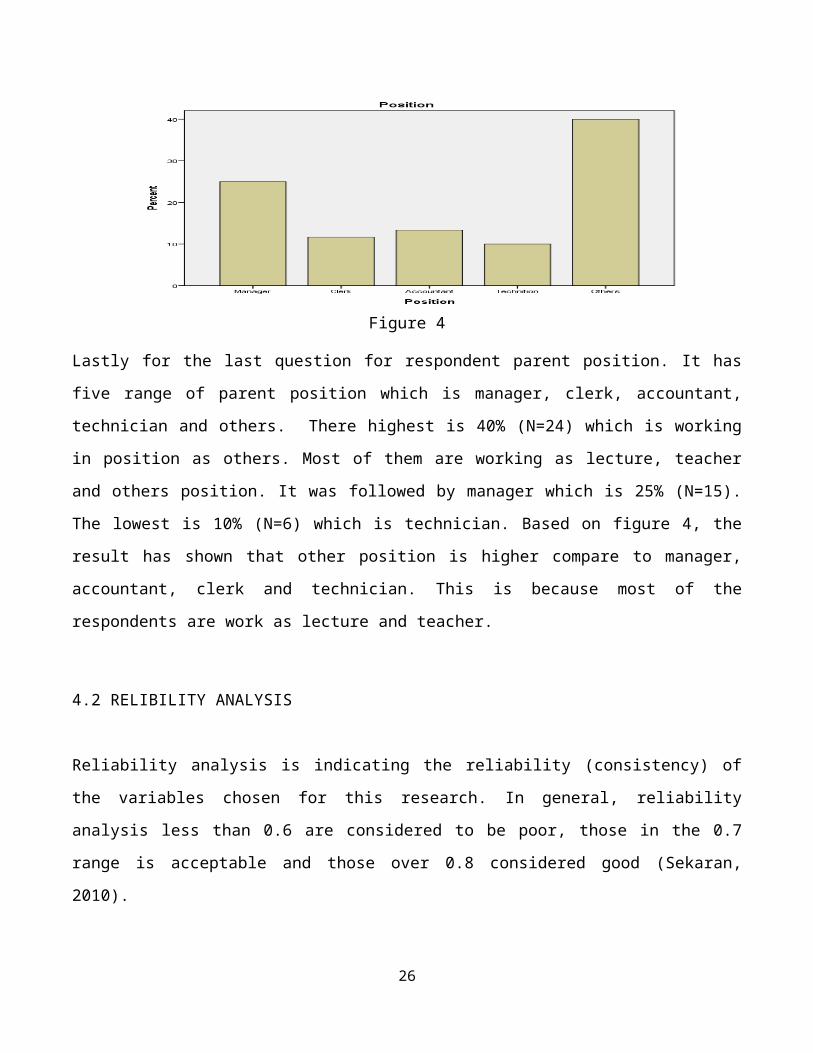
Figure 4
Lastly for the last question for respondent parent position. It has five range of parent position which is
manager, clerk, accountant, technician and others. There highest is 40% (N=24) which is working in
position as others. Most of them are working as lecture, teacher and others position. It was followed by
manager which is 25% (N=15). The lowest is 10% (N=6) which is technician. Based on figure 4, the
result has shown that other position is higher compare to manager, accountant, clerk and technician. This
is because most of the respondents are work as lecture and teacher.
4.2 RELIBILITY ANALYSIS
Reliability analysis is indicating the reliability (consistency) of the variables chosen for this research. In
general, reliability analysis less than 0.6 are considered to be poor, those in the 0.7 range is acceptable
and those over 0.8 considered good (Sekaran, 2010).
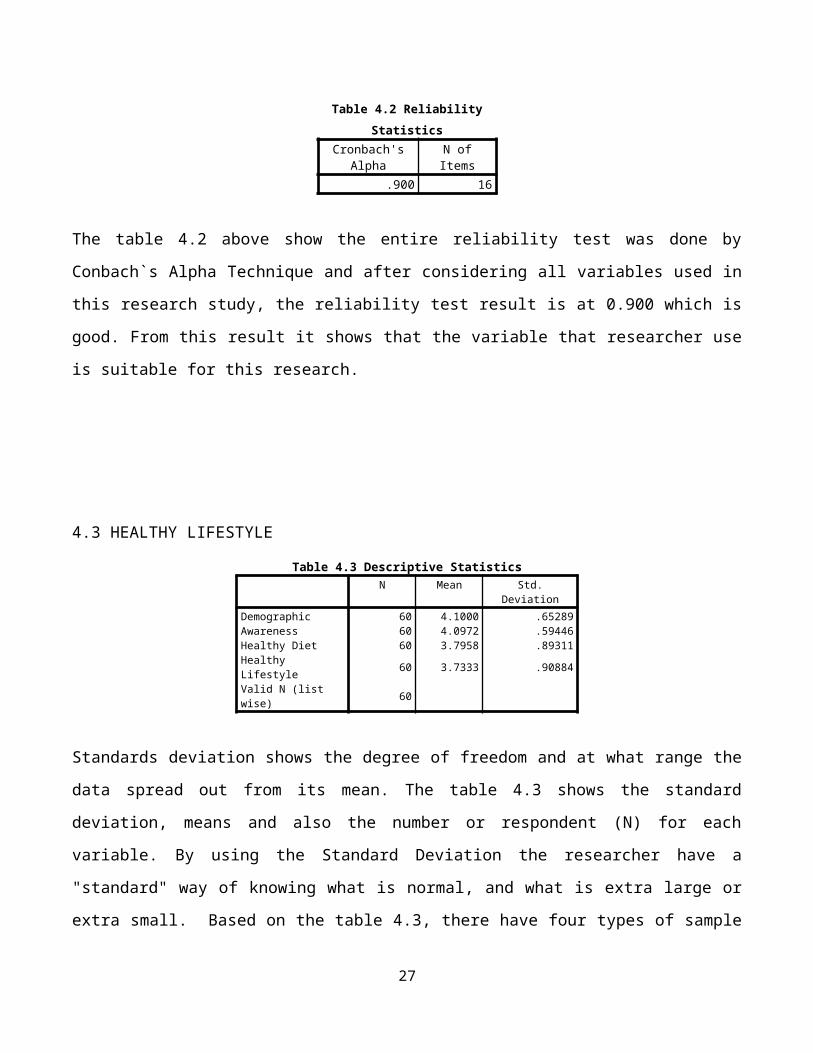
Table 4.2 Reliability StatisticsCronbach's Alpha N of Items
.900 16
The table 4.2 above show the entire reliability test was done by Conbach`s Alpha Technique and after
considering all variables used in this research study, the reliability test result is at 0.900 which is good.
From this result it shows that the variable that researcher use is suitable for this research.
18
4.3 HEALTHY LIFESTYLE
Table 4.3 Descriptive StatisticsN Mean Std. Deviation
Demographic 60 4.1000 .65289Awareness 60 4.0972 .59446Healthy Diet 60 3.7958 .89311Healthy Lifestyle 60 3.7333 .90884Valid N (list wise) 60
Standards deviation shows the degree of freedom and at what range the data spread out from its mean.
The table 4.3 shows the standard deviation, means and also the number or respondent (N) for each
variable. By using the Standard Deviation the researcher have a "standard" way of knowing what is
normal, and what is extra large or extra small. Based on the table 4.3, there have four types of sample
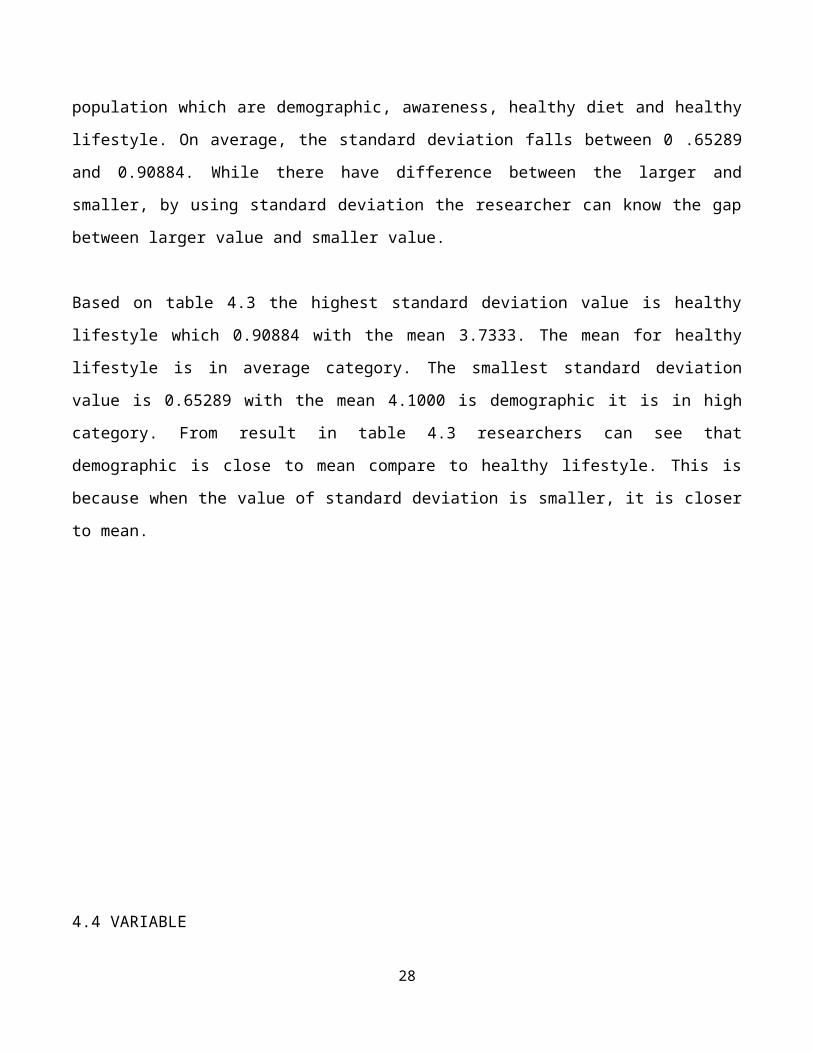
population which are demographic, awareness, healthy diet and healthy lifestyle. On average, the
standard deviation falls between 0 .65289 and 0.90884. While there have difference between the larger
and smaller, by using standard deviation the researcher can know the gap between larger value and
smaller value.
Based on table 4.3 the highest standard deviation value is healthy lifestyle which 0.90884 with the mean
3.7333. The mean for healthy lifestyle is in average category. The smallest standard deviation value is
0.65289 with the mean 4.1000 is demographic it is in high category. From result in table 4.3 researchers
can see that demographic is close to mean compare to healthy lifestyle. This is because when the value
of standard deviation is smaller, it is closer to mean.
19
4.4 VARIABLE
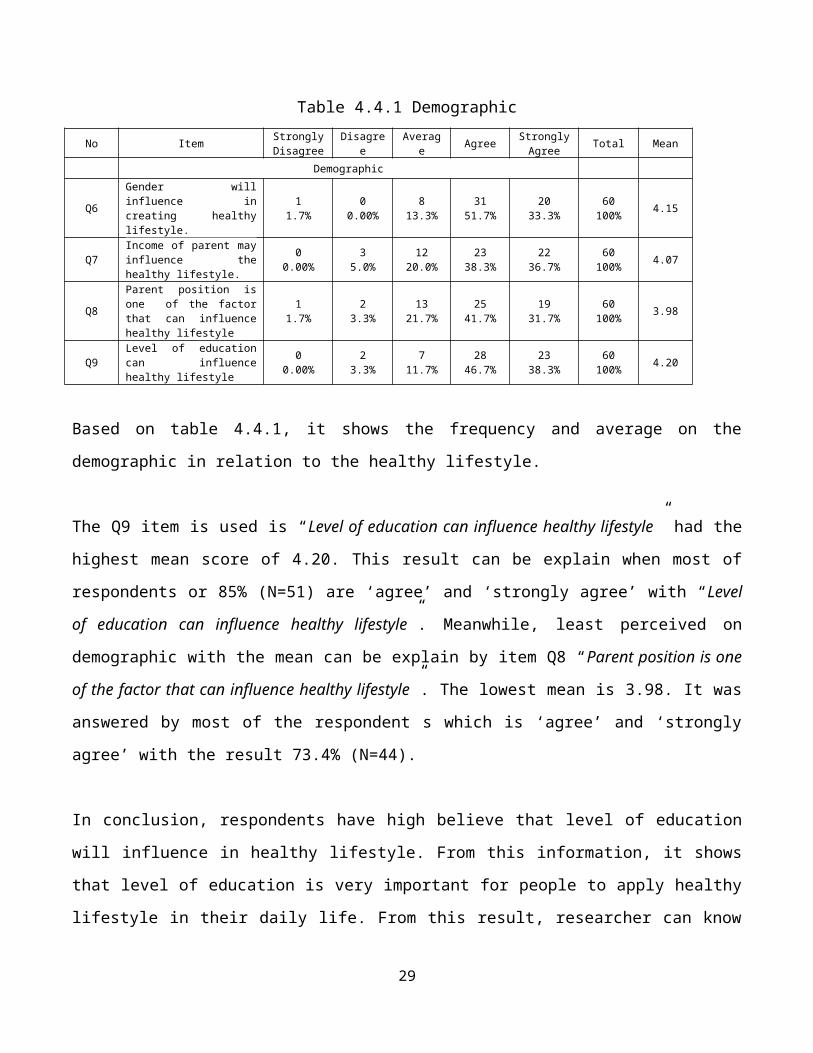
Table 4.4.1 Demographic
No ItemStrongly Disagree
Disagree Average AgreeStrongly Agree
Total Mean
Demographic
Q6Gender will influence in creating healthy lifestyle.
11.7%
00.00%
813.3%
3151.7%
2033.3%
60100%
4.15
Q7Income of parent may influence the healthy lifestyle.
00.00%
35.0%
1220.0%
2338.3%
2236.7%
60100%
4.07
Q8Parent position is one of the factor that can influence healthy lifestyle
11.7%
23.3%
1321.7%
2541.7%
1931.7%
60100%
3.98
Q9Level of education can influence healthy lifestyle
00.00%
23.3%
711.7%
2846.7%
2338.3%
60100%
4.20
Based on table 4.4.1, it shows the frequency and average on the demographic in relation to the healthy
lifestyle.
The Q9 item is used is “Level of education can influence healthy lifestyle” had the highest mean score of
4.20. This result can be explain when most of respondents or 85% (N=51) are ‘agree’ and ‘strongly
agree’ with “Level of education can influence healthy lifestyle”. Meanwhile, least perceived on
demographic with the mean can be explain by item Q8 “Parent position is one of the factor that can
influence healthy lifestyle”. The lowest mean is 3.98. It was answered by most of the respondent s which
is ‘agree’ and ‘strongly agree’ with the result 73.4% (N=44).
In conclusion, respondents have high believe that level of education will influence in healthy lifestyle.
From this information, it shows that level of education is very important for people to apply healthy
lifestyle in their daily life. From this result, researcher can know that most of respondents are conscious
that education is important because they can live in healthy lifestyle. Its means that, with the education
that they have, they can used or apply healthy lifestyle for their family.
20
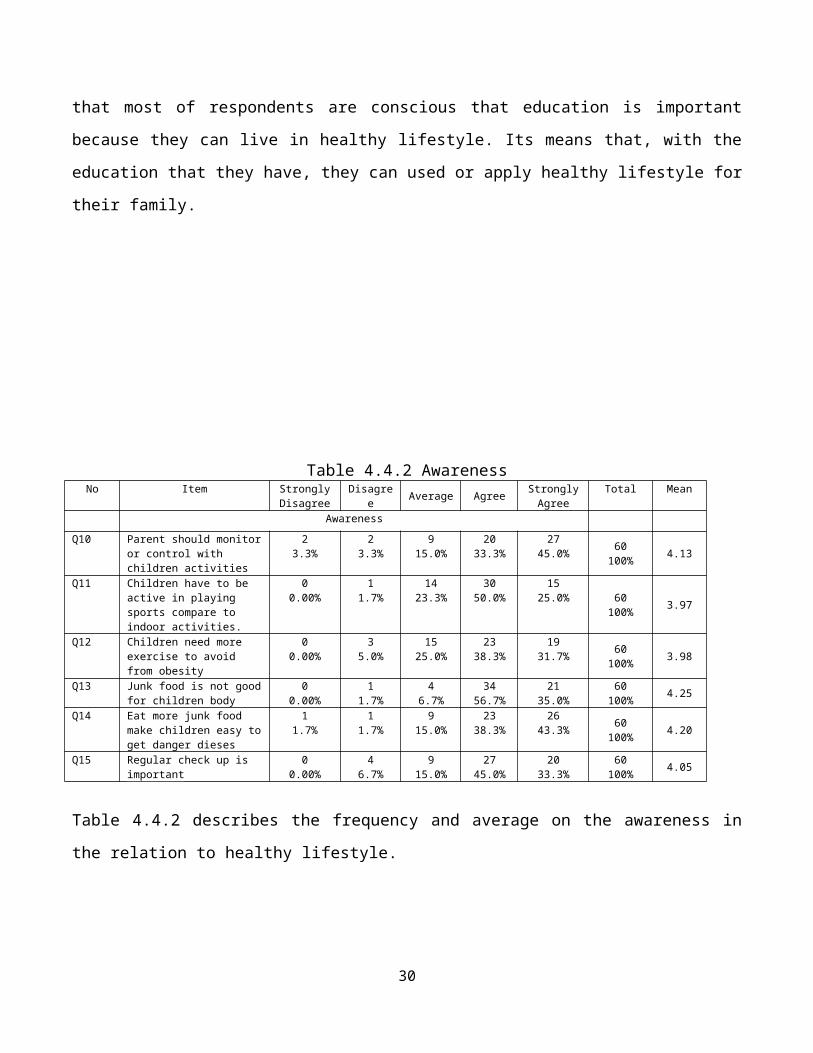
Table 4.4.2 AwarenessNo Item Strongly
DisagreeDisagree Average Agree
Strongly Agree
Total Mean
AwarenessQ10 Parent should monitor or
control with children activities2
3.3%2
3.3%9
15.0%20
33.3%27
45.0%60
100%4.13
Q11 Children have to be active in playing sports compare to indoor activities.
00.00%
11.7%
1423.3%
3050.0%
1525.0%
60100%
3.97
Q12 Children need more exercise to avoid from obesity
00.00%
35.0%
1525.0%
2338.3%
1931.7%
60100%
3.98
Q13 Junk food is not good for children body
00.00%
11.7%
46.7%
3456.7%
2135.0%
60100%
4.25
Q14 Eat more junk food make children easy to get danger dieses
11.7%
11.7%
915.0%
2338.3%
2643.3%
60100%
4.20
Q15Regular check up is important
00.00%
46.7%
915.0%
2745.0%
2033.3%
60100%
4.05
Table 4.4.2 describes the frequency and average on the awareness in the relation to healthy lifestyle.
The Q13 item is used is “Junk food is not good for children body” had the highest mean score of 4.25.
This result can be explain when most of respondents or 91.7% (N=55) are ‘agree’ and ‘strongly agree’
with the awareness that was gathered from junk food. This result was answered the research question of
“did the parent aware with their children choices of food?” Meanwhile, least perceived on awareness
with the mean can be explain by item Q11 “Children have to be active in playing sports compare to
indoor activities.” The mean is only 3.97. This result was explain by most of respondents or 75%
(N=45) is ‘agree’ and ‘strongly agree’. This result has showed that “did parent control their children
activities?” was less control compare with children choices of food. For the research question “did the
unbalance nutrition will affect our body?” it was answer by item Q14. From the result, it show that
81.6% (N=49) are ‘agree’ and ‘strongly agree’ with mean 4.20. It is the second highest value that
researcher get.
In conclusion, researcher can see that parents are aware with their children choices of food and they are
concerned to their children activities. It is good because they have to look all aspect of living in healthy
lifestyle. They also apply that in their daily routine.
21
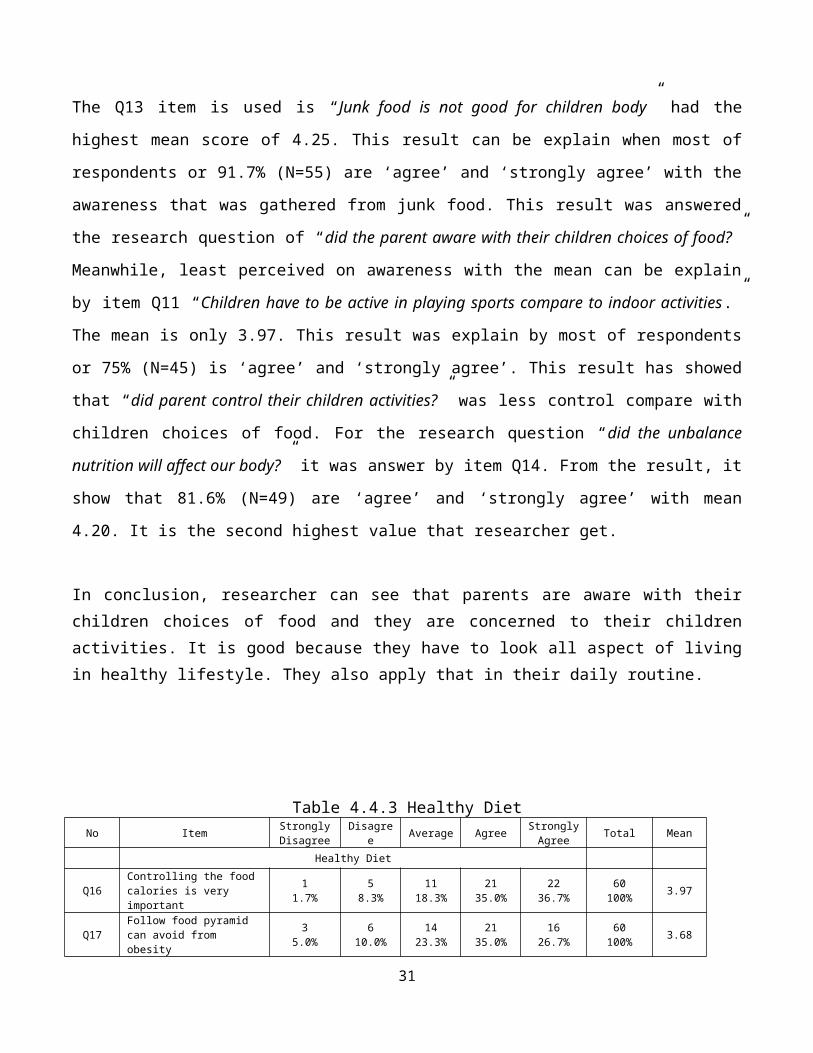
Table 4.4.3 Healthy DietNo Item
Strongly Disagree
Disagree Average AgreeStrongly Agree
Total Mean
Healthy Diet
Q16Controlling the food calories is very important
11.7%
58.3%
1118.3%
2135.0%
2236.7%
60100%
3.97
Q17Follow food pyramid can avoid from obesity
35.0%
610.0%
1423.3%
2135.0%
1626.7%
60100%
3.68
Q18Control number of calories is very important in manage diet
35.0%
71.7%
1728.3%
1931.7%
1423.3%
60100%
3.73
Q19The large size of family will affect the family diet
35.0%
610.0%
711.7%
2846.7%
1626.7%
60100%
3.80
Based on table 4.4.3, it shows the frequency and average on the healthy diet in relation to the healthy
lifestyle.
The Q16 item is used is “Controlling the food calories is very important” had the highest mean score of
3.97. This result can be explain when most of respondents or 71.7% (N=43) are ‘agree’ and ‘strongly
agree’ with the gathered from controlling the food calories. Meanwhile, least perceived on healthy diet
with the mean can be explain by item Q17 “Follow food pyramid can avoid from obesity”. The lowest
mean is 3.68. It was answered by most of the respondent s which is ‘agree’ and ‘strongly agree’ with the
result 61.7% (N=37). This result was answered the research question of “did the right choices of food is
important for our body?” From the result that the researcher gets, it shows those parents are not aware
in control their children choices of food. They did not care what their children eat.
In conclusion, the researcher sees those parents are conscious in creating healthy diet to their children.
They are caring with what their children eat. Although they are busy with their work, they will spent
little time to manage their children in eating for healthy diet.
22
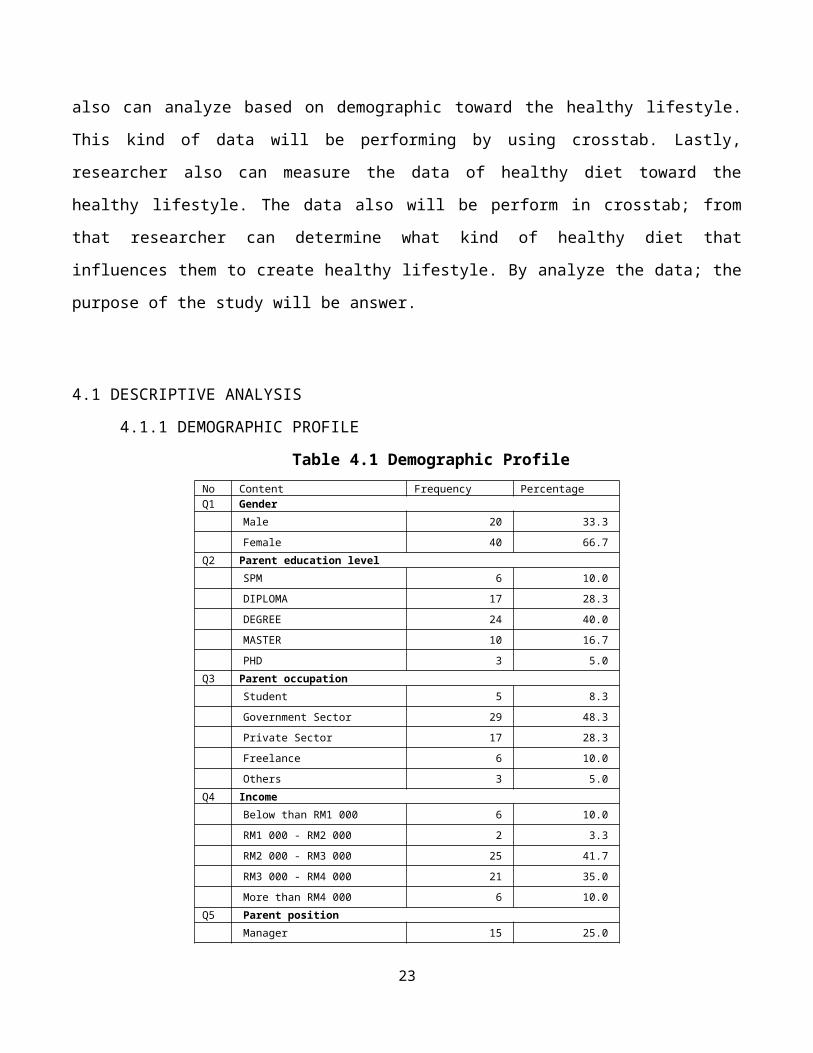
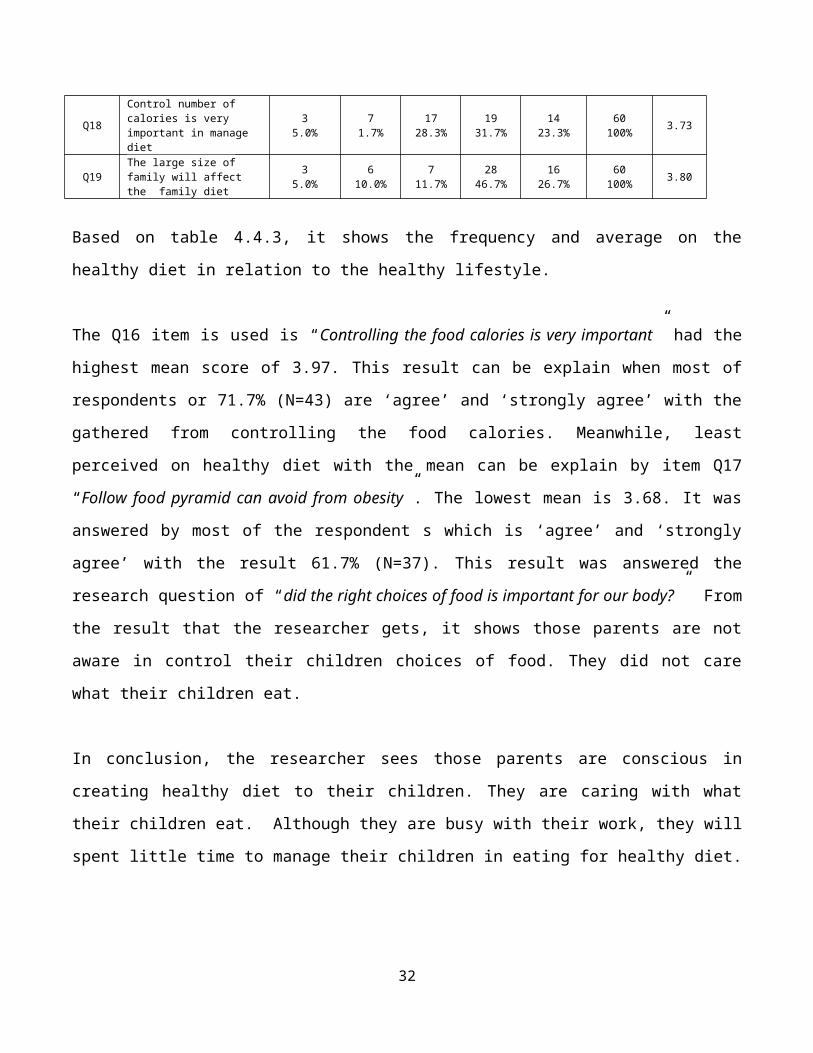
Table 4.4.4 Healthy lifestyleNo Item Strongly
DisagreeDisagree Average Agree
Strongly Agree
Total Mean
Healthy Lifestyle20 Healthy lifestyle is important
in my daily life0
0.00%5
8.3%15
25.0%21
35.0%19
31.7%60
100%3.90
21 I am full of supportive towards healthy lifestyle
35.0%
711.7%
1728.3%
1931.7%
1423.3%
60100%
3.57
Based on table 4.4.1, it shows the frequency and average on the healthy lifestyle.
The Q20 item is used is “Healthy lifestyle is important in my daily life” had the highest mean score of
3.90. This result can be explain when most of respondents or 66.7% (N=40) are ‘agree’ and ‘strongly
agree’ with the healthy lifestyle. Meanwhile, least perceived on healthy lifestyle with the mean can be
explain by item Q21 “I am full of supportive towards healthy lifestyle”. The lowest mean is 3.57. It was
answered by most of the respondent s which is ‘agree’ and ‘strongly agree’ with the result 55% (N=33).
This result was answered the research question of “did the parent applied healthy lifestyle in their daily
life?” From the result only 33 of 60 respondents are applied healthy lifestyle. It means only half of the
respondents are applied healthy lifestyle but others did not applied it.
In conclusion, researcher can say that most of parents are supportive with applied healthy lifestyle in
their daily life. They know that applied healthy lifestyle is important. They will spend little money in
applied healthy lifestyle for their family.
23
4.5 CROSS TABULATION
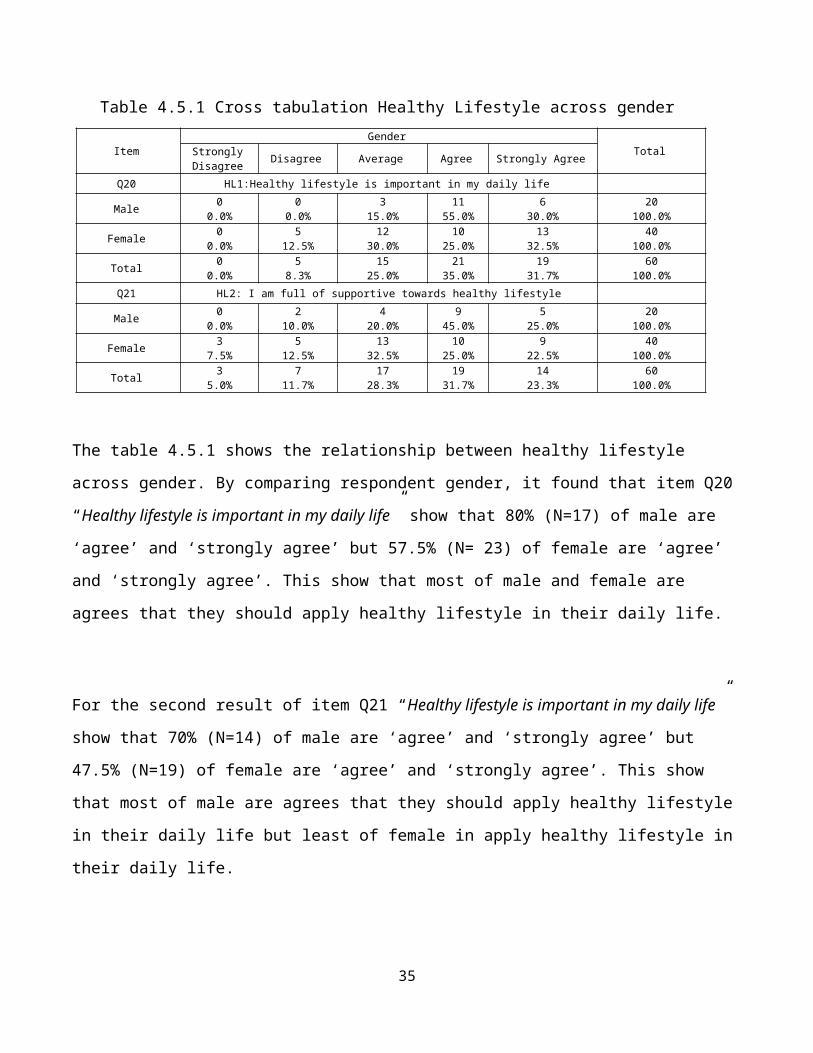
Table 4.5.1 Cross tabulation Healthy Lifestyle across gender
Item Gender
TotalStrongly Disagree
Disagree Average Agree Strongly Agree
Q20 HL1:Healthy lifestyle is important in my daily life
Male0
0.0%0
0.0%3
15.0%11
55.0%6
30.0%20
100.0%
Female0
0.0%5
12.5%12
30.0%10
25.0%13
32.5%40
100.0%
Total0
0.0%5
8.3%15
25.0%21
35.0%19
31.7%60
100.0%Q21 HL2: I am full of supportive towards healthy lifestyle
Male0
0.0%2
10.0%4
20.0%9
45.0%5
25.0%20
100.0%
Female3
7.5%5
12.5%13
32.5%10
25.0%9
22.5%40
100.0%
Total3
5.0%7
11.7%17
28.3%19
31.7%14
23.3%60
100.0%
The table 4.5.1 shows the relationship between healthy lifestyle across gender. By comparing respondent
gender, it found that item Q20 “Healthy lifestyle is important in my daily life” show that 80% (N=17) of
male are ‘agree’ and ‘strongly agree’ but 57.5% (N= 23) of female are ‘agree’ and ‘strongly agree’. This
show that most of male and female are agrees that they should apply healthy lifestyle in their daily life.
For the second result of item Q21 “Healthy lifestyle is important in my daily life” show that 70% (N=14)
of male are ‘agree’ and ‘strongly agree’ but 47.5% (N=19) of female are ‘agree’ and ‘strongly agree’.
This show that most of male are agrees that they should apply healthy lifestyle in their daily life but least
of female in apply healthy lifestyle in their daily life.
24
Table 4.5.2 Cross tabulation Healthy Lifestyle across position
PositionTotalStrongly
DisagreeDisagree Average Agree Strongly Agree
Q20 HL1:Healthy lifestyle is important in my daily life
Manager0
0.0%1
6.7%2
13.3%6
40.0%6
40.0%15
100.0%
Clerk0
0.0%1
14.3%3
42.9%3
42.9%0
0.0%7
100.0%
Accountant0
0.0%0
0.0%2
25.0%1
12.5%5
62.5%8
100.0%
Technician0
0.0%0
0.0%1
16.7%3
50.0%2
33.3%6
100.0%
Others0
0.0%3
12.5%7
29.2%8
33.3%6
25.0%24
100.0%
Total0
0.0%5
8.3%15
25.0%21
35.0%19
31.7%60
100.0%Q21 HL2: I am full of supportive towards healthy lifestyle
Manager0
0.0%2
13.3%1
6.7%7
46.7%5
33.3%15
100.0%
Clerk0
0.0%1
14.3%1
14.3%4
57.1%1
14.3%7
100.0%
Accountant0
0.0%1
12.5%1
12.5%2
25.0%4
50.0%8
100.0%
Technician0
0.0%1
16.7%3
50.0%2
33.3%0
0.0%6
100.0%
Others3
12.5%2
8.3%11
45.8%4
16.7%4
16.7%24
100.0%
Total3
5.0%7
11.7%17
28.3%19
31.7%14
23.3%60
100.0%
The table 4.5.1 shows the relationship between healthy lifestyle across position. By comparing
respondent position, it found that others position are agree with item Q20 which is “Healthy lifestyle is
important in my daily life” with the result 58.3% (N=14) it respondent is more than others. It was
followed by manager which is 80% (N=12). The decline result is clerk which is 80 %( N=3).
The result is different in item Q21 which is “I am full of supportive towards healthy lifestyle”. Most of
manager are ‘agree’ and ‘strongly agree’ with item Q21 with the result 80% (N=12). It was followed by
other which is 33.4(N=8) are ‘agree’ and ‘strongly agree’. The least show that technician are ‘agree’
and ‘strongly agree’ with the result 33.3% (N=2) with item Q21.
25
4.6 HYPOTHESIS ANALYSIS
The method test used was Pearson correlation coefficient (r) and measures the strength of a dependent
variable by an independent variable.
The Pearson correlation coefficient is a number between +1 and -1. The rules of thumb as proposed by
Lukas, Hair, Bush and Ortinau (2004) that the significant relationship in range ±0.81 to ±1.00 is strong,
±0.41 to ±0.61 is moderate, ±0.21 to ±0.4 is weak and ±0.00 to ±0.20 is not significant.
Table 4.6 CorrelationsDemographic Awareness Healthy Diet Healthy Lifestyle
Demographic
Pearson Correlation
1 .698** .528** .517**
Sig. (2-tailed) .000 .000 .000N 60 60 60 60
Awareness
Pearson Correlation
.698** 1 .465** .478**
Sig. (2-tailed) .000 .000 .000N 60 60 60 60
Healthy Diet
Pearson Correlation
.528** .465** 1 .601**
Sig. (2-tailed) .000 .000 .000N 60 60 60 60
Healthy Lifestyle
Pearson Correlation
.517** .478** .601** 1
Sig. (2-tailed) .000 .000 .000N 60 60 60 60
**. Correlation is significant at the 0.01 level (2-tailed).
4.6.1 HYPOTHESIS ONE
H1: There is a positive relationship between demographic and healthy lifestyle.
Based on table 4.6, the output represent that the result of Pearson correlation coefficient demographic
and healthy lifestyle is at 0. 517 (r=0.517). It was in strong. From the result that researcher get, it show
that there have a strong relationship between demographic and healthy lifestyle. Based on the result, it
shows that there has significant relationship between this two variable and indicate that the hypothesis is
acceptable.
26
4.6.2 HYPOTHESIS TWO
H2: There is a positive relationship between awareness and healthy lifestyle.
Based on table 4.6, the output represent that the result of Pearson correlation coefficient awareness and
healthy lifestyle is at 0.478 (r=0.478). It was in moderate. From the result that researcher get, it show
that there have a moderate relationship between awareness and healthy lifestyle. Based on the result, it
shows that there has significant relationship between this two variable and indicate that the hypothesis is
acceptable. This variable has to make some improvement if researcher wants to use for the next
research.
4.6.3 HYPOTHESIS THREE
H3: There is a positive relationship between healthy diet and healthy lifestyle.
Based on table 4.6, the output represent that the result of Pearson correlation coefficient healthy diet and
healthy lifestyle is at 0.601 (r=0.601). It was in moderate. From the result that researcher get, it show
that there have a moderate relationship between healthy diet and healthy lifestyle. Based on the result, it
shows that there has significant relationship between this two variable and indicate that the hypothesis is
acceptable. This variable has to make some improvement if researcher wants to use for the next
research.
27
CHAPTER 5
CONCLUSION
5.1 LIMITATION
Limitation basically is a barrier that will be face by researcher due to the study. There are some
limitations as stated as following:
i. Time constraint
Due to time constraint, in the limited time given which is only 16 weeks, it is quite difficult to the
researcher to accomplish this project. The researcher need to collect the data and also needs to study a
lot of research study regarding the project title in order to more strengthen the study title. Due to limited
of time, the researcher faced with a lot of difficulties to accomplish this project. Because of the time
constraint, researcher cannot make a perfect research according to the topic research.
ii. Scope
Since the research has been conduct at Seri Iskandar, so the questionnaire is distribute for residents of
Seri Iskandar only. The area of Seri Iskandar is starts from Tronoh to Felcra Nasaruddin. Not all the area
of Seri Iskandar will get this questionnaire. It is because the researcher was dividing to distribute the
research question into the small scope within Taman Maju, Bandar University, and SIDEC. The idea or
opinion is based on parent in Seri Iskandar only. The researcher cannot get the opinion and the idea from
the other resident because of the researcher scope is around parents in Seri Iskandar only. So there will
be no generous idea, opinion and the view from other resident. Hence the idea, opinion or view is only
around parents in Seri Iskandar.
28
iii. Cost constrain
To complete this task, it requires a high cost. This is because the researcher has to go door-to-door to
distribute this questionnaire. It will take high cost to do it. Other than that, the researcher also has to
print out about 80 the questionnaire. It is because some of the questionnaire has to be rejected.
There have some respondents that did not answer all of question that was provided. Other than that,
there also has missing question that was not answers and question that was answered wisely.
iv. Commitment and cooperation from the respondent
Respondents were not giving the good commitment and cooperation to the researcher. When
researcher asks them to answer the questionnaire the will give some excuse to answer it. Besides
that, some of the target user that has been selected refuses to answer the questionnaire. Some of the
respondents also, give a reasons that they doesn’t have a time to answer the questions and also said
that they were rush to go to other place.
29
SIGNNIFICANT OF THE STUDY
i. Researcher
It can be as a reference or guideline to other researcher if they want to make a research with the related
topic. So, it also can give knowledge to the other research on how to conduct the research in the future.
From this research, other researcher can make some improvement when they want to make the same
topic of research.
ii. Parent
Based on the education, it can enhance the parent knowledge through the important to create healthy
lifestyle where can give a positive impact through their performance. This is because parent can easily
solve their problem with change their children eating habit and control their activities. This way also can
improve them to be more awareness to their children. Based on this research, parent will gain more
knowledge in apply healthy lifestyle. Other than that, they will be more aware to their children about
living in healthy lifestyle. They will try to maintain them changing in eating habit and control their
activities.
iii. Society
For the society, they can implement the healthy lifestyle among the parent and children. Beside can gain
knowledge from the healthy lifestyle, society also can improve their family knowledge through the
healthy lifestyle. They also can learn and know about the effective way to reduce obesity among
children. This is because parents also, can guide their children in education by explaining and practice
the important of healthy lifestyle in their family.
30
5.2 SUMMARY AND CONCLUSION
From the research that has been made, what can be summarize is, objective and hypotheses of the study
is very important part of the research where, researcher must make sure all of the objective were achieve
and identify all the hypotheses whether accepted or not. All of the result of the objective of the study and
the hypotheses of the research has been made by referring to the data analysis.
All finding from the research can be concluded that, the entire objective is achieved. The first objective
of this research is to identify eating habit of people in Seri Iskandar is achieve. Where from the first
objective, it was answered in the data that I get from question of healthy diet independent variable. The
data that the researcher is closer and it was in average category. For the second objective is to analyze
the important of healthy lifestyle across gender and position. From this result, the researcher can know
which types of respondent is aware in apply healthy lifestyle in their daily life. Some of the respondents
are aware with healthy lifestyle and they apply it in their daily life. For the last objective is to evaluate
the awareness of choices of food. This objective was evaluated based of the question of healthy lifestyle
independent variable. All questions about choices of food were provided because it can answer this
objective.
Besides objective, there also have some question that was answered by research question. For example,
question “did the parent aware with their children choices of food?”, “did the unbalance nutrition will
affect our body?” and “did the parent control their children activities?” It was answered in awareness
question on the question 13, question 14 and question 11. Then, for “did the parent applied healthy
lifestyle in their daily life?” was answers in question 21. Lastly for “did the right choices of food is
important for our body?” was answered by question 17. The result that show is different and it based on
its category.
31
All hypotheses for this research are acceptable. But for hypothesis two and three, is show average result.
As recommendation, for the next research if the researcher wants to make the same research, they can
make some improvement based on factor or change the new variable that can look more strengthen for
their variable.
Other suggestion is researcher can change the method of the research. Researcher can use the interview.
This is because by using the interview, researcher can get the accurate data directly from the respondent.
Since in this research, researcher has using a questionnaire in getting the data, but some of the
respondent not giving the cooperation and commitment when ask to answer the questionnaire. So if
using the interview, the data that will get is more true and accurate, because researcher will face to face
with the respondent when answering the related questions.
Besides that, other suggestion is for the questionnaire, where researcher can use a multi-language. As an
example, use English and Malay language for the questionnaire, where from that it’s easy to the
respondent who do not expert in English can answer by using Malay language that provided in the
questionnaire. So it is would be easy to them in answering the questionnaire. Where they can answer the
questionnaire with more true and understanding, compare to using the single language which is English,
where person who not understand English will answer the questionnaire based on their understanding
and it will not get the accurate data.
32
5.3 REFERENCE
Bloch, P. (1984), “The wellness movement: Imperatives for health care marketers”, Journal of
Health Care Marketing, Vol. 4, Winter, pp. 9-16.
Kraft, F. and Goodell, P. (1993), “Identifying the health conscious consumer”, Journal of Health
Care Marketing, Vol. 13 No. 3, pp. 18-26.
Howell, D. (2004), “Wellness trend touches all categories”, DSN Retailing Today, Vol. 43 No. 9,
pp. 4-5.
Berry, D. (2004), “In pursuit of wellness”, Dairy Foods, Vol. 105 No. 5, pp. 34-8.
Weiss, M. (2002), “Chasing youth”, American Demographics, Vol. 24 No. 9, pp. 34-43.
Beverage Industry (2004), “Around the beverage cooler”, Vol. 95 No. 9, pp. 73-9.
National Petroleum News (2002), “Energy, diet bars show high growth”, National Petroleum
News, Vol. 94 No. 6, p. 20.
Sekaran, Umar and Bougie, R. (2009). Research Methods for Business: a skill-building
approach. Fifth edition. New York: John Wiley & Sons, Ltd. Publication.
Lukas, B., Hair, J.Jr. Bush, R., Ortinau, D.(2004). Marketing
Research. Australia: McGraw-Hill
Maquire, T. (1999), “Pre- boom to a boon to gyms”,American Demographics, Vol. 21 No. 1, pp.
17-18.
Nayga, R. (1997), “Impact of sociodemographic factors on perceived importance of nutrition in
food shopping”,Journal of Consumer Affairs, Vol. 31, Summer, pp. 1-9.
Goldsmith, R., Freiden, J. and Hendereson, K. (1995), “The impact of social values on food-
related attitudes”, The Journal of Product & Brand Manangement, Vol. 4 No. 4,pp. 6-14.
Darian, J.C. (1998), “Parent-child decision making in children’s clothing stores”, International
Journal of Retail & Distribution Management, Vol. 26 No. 11, pp. 421-8.
Moore, R. and Moschis, G.P. (1983), “Role of mass media and the family in development of
consumption norms”, Journalism Quarterly, Vol. 60 No. 1, pp. 67-73.
Moschis, G.P., Lawton, J.T. and Stampfl, R.W. (1980), “Preschool children’s consumer
learning”,Home Economics Research Journal, Vol. 9 No. 1, pp. 64-71.
Warwick, J., McIlveen, H. and Strugnell, C. (1999), “Food choices of 9-17- year olds in
Northern Ireland – influences and challenges”, Nutrition & Food Science, Vol. 99 No. 5, pp.
229-38.
33
Hastings, G.B., Stead, M., McDermott, L., Forsyth, A., MacKintosh, A.M., Rayner, M.,
Godfrey,G., Carahar, M. and Angus, K. (2003), “Review of research on the effects of food
promotion to children”, Centre for Social Marketing, University of Strathclyde, Glasgow, pp. 1-
218.
Solomon, M.R. (1996), Consumer Behavior, 3rd ed., Prentice-Hall International Editions,
London.
Keane, A. and Willetts, A. (1994), “Factors that affect food choice”, Nutrition & Food Science,
Vol. 94 No. 4, pp. 15-17.
Kara Chan, G. P.-L. (2009). Communicating healthy eating to adolescents. p. 6.
Keogh, D. (2011, March 31). Retrieved September 2, 2012, from Parents as role models for a
healthy lifestyle: http://www.greentimes.com.au/lifestyle/parents-as-role-models-for-a-healthy-
lifestyle.html
Kulasagaran, P. (2009, July 26). A Big Fat Problem.
Lepisto, R. L. (2005). Analysis of the healthy. Journal of Consumer Marketing , 10.
Pat Spungin, F. (2004). Parent Power, Not Pester Power. 38.
Richard L. Divine, L. L. (2005). Analysis of the healthy lifestyle consumer. p. 276.
Sarah Maddock, S. L. (1999). Healthy eating or chips with everything? p. 270.
Victoria, S. G. (2012, Jun 14). Overweight children - healthy lifestyle tips. Retrieved September
2012, from Better Health Channel:
http://www.betterhealth.vic.gov.au/bhcv2/bhcarticles.nsf/pages/Overweight_children_healthy_lif
estyle_tips
Breaking barriers to healthy food choice and physical activity in young children. (2008, Julay). Retrieved from Europian Food Information Council: http://www.eufic.org/article/en/health-and-lifestyle/physical-activity/artid/Breaking-barriers-to-healthy-food-choice-physical-activity-in-young-children/
Guidelines for physical activity. (2009, March). Retrieved from http://www.eufic.org/article/en/health-and-lifestyle/physical-activity/artid/Guidelines-physical-activity/
34
How to eat healthily on a budget. (2011, March). Retrieved from European Food Information Concil: http://www.eufic.org/article/en/health-and-lifestyle/healthy-eating/artid/How-to-eat-healthily-on-a-budget/
35