pop report.docx
DESCRIPTION
Production operation management REPORTTRANSCRIPT

The project Report:
Course title: Production and Operation Management (pop-301)
Report on
Bangladesh Garment textile Industry of ( forecasting)
Prepared for
Dost Md.Samsuzzaman (Ronik)
CBA
Faulty of College of Business Administration
Prepared By
FOCUS
Submition date
25th nov ,2013
IUBAT :International university of business agriculture and technology
Group member list
SI NAME ID
01. Md.Abu Hasan 12102494
02. Md.Toufiquzzaman 12102495
03. Md.Shahidul Islam 12102496
04. Tanzin Khan(Tarin) 12102502
05. Rupa Akter 1210

Letter of Transmittal
FOCUS
Bachelor of Business Administration,(BBA)
IUBAT, Uttara, Dhaka
25th nov ,2013
Dost Md.Samsuzzaman (Ronik)
Faulty of College of Business Administration
IUBAT
Subject: Report on Bangladesh Garment textile Industry of ( forecasting)
Dear Sir,
We are much pleased to submit the project Report on .”. Report on Bangladesh Garment
textile Industry of ( forecasting) For increasing knowledge from this report which is
essential requirement for the completion of business department. This report is a result of the
Project program that we have conducted during specified time. All the presented here is done
with utmost sincerely and honesty. We have tried our best to make this report holistic and
informative enough.
Apart from the academic knowledge gained, this project report and preparation of this report
has given us the opportunity to acquaint our self with the term of compare brand attributes
that influence customer choice.
Yours faithfully

Leader of FOCUS
Md.Toufiquzzam
Letter of Authorization
IUBAT
4,Embankment Drive road, uttara.
Md.Toufiquzzaman
25th ,nov,2013
Program: BBA
Dear sir,
You will be happy to know that project Report on Bangladesh Garment textile Industry of
( forecasting. we have received your proposal last month . Based on your proposal you will have to
submit it as soon as possible. I hope you will successfully complete the project on time. After
successful completion of the project you are requested to write a report based on the project.
For any kind of needs don’t hesitate to contact with me.
Thank you
Sincerely
Dost Md.Samsuzzaman (Ronik)
…

Bangladesh Garment textile Industry ( forecasting).
MAHMOOD TEXTILE MILLS ltd.
MAHMOOD GROUP OF INDUSTRIES: Garment textile Industry
VISION STATEMENT
To be recognized internationally and locally as dynamic, quality conscious and ever progressive Textile Product manufacturer in the Textile Industry of Bangladesh.
MISSION STATEMENT
Mahmood Group is committed to: Be ethical in its practices.
Excel through continuous improvement by adopting most modernized technology in production.
Operate through professional Team work. Retain our position as leading and innovative in the Textile Industry. Achieve Excellence in the quality of our product. Be a part of country's economic development and social Prosperity.
COMPANY INFORMATION
BOARD OF DIRECTORS:
Chairman : MD.MUHAMMAD MASOOD
Chief Executive: AMINUL MUHAMMAD IQBAL
Directors : RUHUL AMIN
KHAWAJA MUHAMMAD YOUNUS
JALAL-UD-DIN ROOMI
25th nov,2013.
Dost Md.Samsuzzaman (Ronik)
…
Faculty of
CBA-College of Business Administration .
IUBAT: International University of Business Agriculture and Technology.
Uttara,Dhaka.
Letter of Transmittal
Teacher: Operation and production management
Dear Sir,
We are pleased to submit this report on Mahmood Cotton Mills, part of Mahmood Group of Industries.
This report is submitted as a term report for the 6th semester of BBA. Our main focus in this report is the germent industry on forcasting .The management of processing sales and demand forcasting is the main focus of this report. However keeping in mind the details of our course of operation and production management the report has many other operations aspects of the cotton mill sales forcasting ,demand forcasting and proses of all those things .
Your most obedient
Md.Abu Hasan

ID. 12102494
Group Member (FOCUS)
Section:
Program:BBA
Acknowledgement:
First of all we would like to thank the almighty because of successful completion of this work with a complete attentive and without any illness we have complete our report . also we would like to thank our honourable faculty Dost Md.Samsuzzaman (Ronik)
providing us with the opportunity to work on this subject and gain a real life project experience as well as his giving valuable time and cooperation and support in performing our task.
Executive Summary:
Readymade Garments Industry is the leading foreign currency earning sectors of Bangladesh. Now-a-days Bangladesh financial sector is very much dependent upon this sector. The annual export income of garments sector is driven from two sources one is woven garments and others is knit wear. Radimet garments is a 100% export oriented garments. Rdimet garments exports various garments product in foreign market. The company makes shirts, ladies dress, shorts, trousers, and others for U.S.A, U.K, European countries countries.
Actually ,in this report we explain so many important things details about forecasting of Bangladesh garment industry. We try to show many types of classification of forecasting ,process of forecasting , table and some important graph .for making this report we selected a reputed garments textile industry .in this report we try to discus or explain all those thing with huge discussion . we also give theoretical framework and many chart as a simple design for batter understanding . this are all about our report .

Introduction:
The tremendous success of readymade garment exports from Bangladesh over the last two decades has surpassed the most optimistic expectations. Today the apparel export sector is a multi-billion-dollar manufacturing and export industry in the country. The overall impact of the readymade garment exports is certainly one of the most significant social and economic developments in contemporary Bangladesh. With over one and a half million women workers employed in semi-skilled and skilled jobs producing clothing for exports, the development of the apparel export industry has had far-reaching implications for the society and economy of Bangladesh.
Objectives of the Report:
Each & every study should have objectives. The objectives of my project have divided into two parts.
Broad objective:

To know the overall forecasting activities of “Garments Industry of Bangladesh:
Specific objective:
The key objectives of this report are as follows:
To know the duties and responsibilities of top level authority about the forecasting . To know the overall internal and external environment of “Garments Industry of
Bangladesh: Identify the major opportunity and threats of Forecasting “Garments Industry of
Bangladesh: ”
different chart and tables in the analysis part.
To prepare this report I use different news papers, books which are secondary information. Especially I use various websites as well as Bangladesh garments industry.
1.6. Limitations of the Report
Since our study is based on both primary and secondary data, there is a possibility of getting fake information. If the surveyed personnel provide us with any fabricated information about their opinion of their organization, then the report findings may be erroneous. Above all, this study is weak in some points. The notable ones are as under:
The survey was conducted in a very short time so we were not able to collect more information.
This survey made on crisis situation of Bangladesh, so it was difficult to collect more samples.
Only the big and the reputed Garments Company consider here as sample.
The questionnaire contains some questions that, if answered properly, might damage the company’s image. In this type of questions, the respondents might provide socially acceptable answers. This risk was unavoidable.
Another limitation of this study is the person’s private information were not disclosing some, data and information for obvious reasons, which could be very much useful.
Lack of experience in this field.
Lack of proper authority to conduct the interview program
Introduction To Mahmood Group Of Industries

The Group is in cotton business for the last 20 years. The projects include five Spinning Units, Two Weaving Units, Captive Power Project, and Number of cotton Ginning Factories composite with Oil Mills, Leather Tanning Unit, a company for trading operations, Agricultural & Fruit Farms.
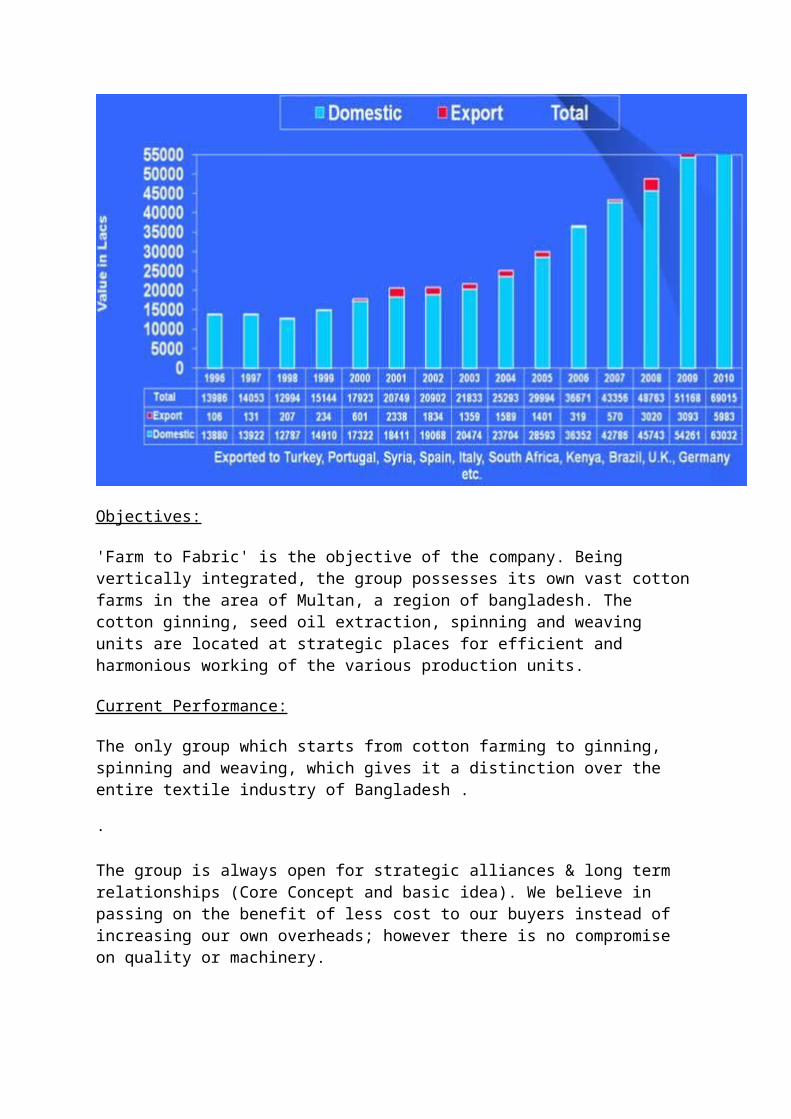
The total turnover of Mahmood Group is around Rs.4 Billion (US$: 70 Million). Domestic sales of 3.5 Billion Rupees a little portion into export Figure 1. The Group owns and operates seven companies located in various parts of the country, comprising of twelve modern production units. The group is currently employing 3500 personnel in its different projects..
Objectives:
'Farm to Fabric' is the objective of the company. Being vertically integrated, the group possesses its own vast cotton farms in the area of Multan, a region of bangladesh. The cotton ginning, seed oil extraction, spinning and weaving units are located at strategic places for efficient and harmonious working of the various production units.

Current Performance:
The only group which starts from cotton farming to ginning, spinning and weaving, which gives it a distinction over the entire textile industry of Bangladesh .
·
The group is always open for strategic alliances & long term relationships (Core Concept and basic idea). We believe in passing on the benefit of less cost to our buyers instead of increasing our own overheads; however there is no compromise on quality or machinery.
Forecasting has impacts on multiple areas of the operations management
chain. Take a look at some of the key areas of the chain impacted by
forecasting:
Sales – a forecast of what the company will sale.
Production – a forecast of what should be made to meet the sales forecast.
Inventory – a forecast of how much the company should have in finished goods to meet
normal demands and to cover fluctuations in demand.
Facilities – a forecast of how large the facility should be and where should the facility
be.
Raw Materials – a forecast of how much should the company have in raw materials to
meet the production forecast
People – a forecast of how many people are required to support the customer and to
make the products necessary to support the production forecast.
Profits – a forecast of how much profits the company will make based on the other
forecasts.

Products – a forecast of what products the company should make now and in the future,
as well as a forecast of what products should be retired or eliminated as they reach their
planned end of life.
What is Forecasting?
Forecasting is a process of predicting or estimating the future based on past and present data. Forecasting provides information about the potential future events and their consequences for the organisation
Forecasting is the science and art of predicting future events. It may involve taking historical data and projecting them into the future with some sort of mathematical model or forecasting may involve combination of these i.e. a mathematical model adjusted by manager’s good judgment. Effective planning depends on a forecast of demand of the company products.
Major Steps in the Forecast Process
• Data Collection• Quality Control• Data Assimilation• Model Integration• Post Processing of Model Forecasts• Human Interpretation (sometimes)• Product and graphics generation
Importance Of Forecasting:
Forecasting help in adjusting three main functions:
Ø Human Resource
Ø Capacity
Ø Supply Chain Management
Forecasting Approach:
Generally two approaches are used for forecasting activities. These approaches are: Qualitative Approach:

This approach incorporates some important factors like decision maker intuition emotion, experience and judgement. This approach include following techniques:
Ø Jury of executive opinion Ø Sales force opinion Ø Delphi Technique Ø Consumer market surveys

Qualitative ModelsQualitative models have generally been successful with short-term predictions, where the scope of the forecast is limited. Qualitative forecasts can be thought of as expert-driven, in that they depend on market mavens or the market as a whole to weigh in with an informed consensus. Qualitative models can be useful in predicting the short-term success of companies, products and services, but meets limitations due to its reliance on opinion over measurable data. Qualitative models include:
Market Research Polling a large number of people on a specific product or service to predict how many people will buy or use it once launched.
Delphi Method : Asking field experts for general opinions and then compiling them into a forecast. (For more on qualitative modeling,
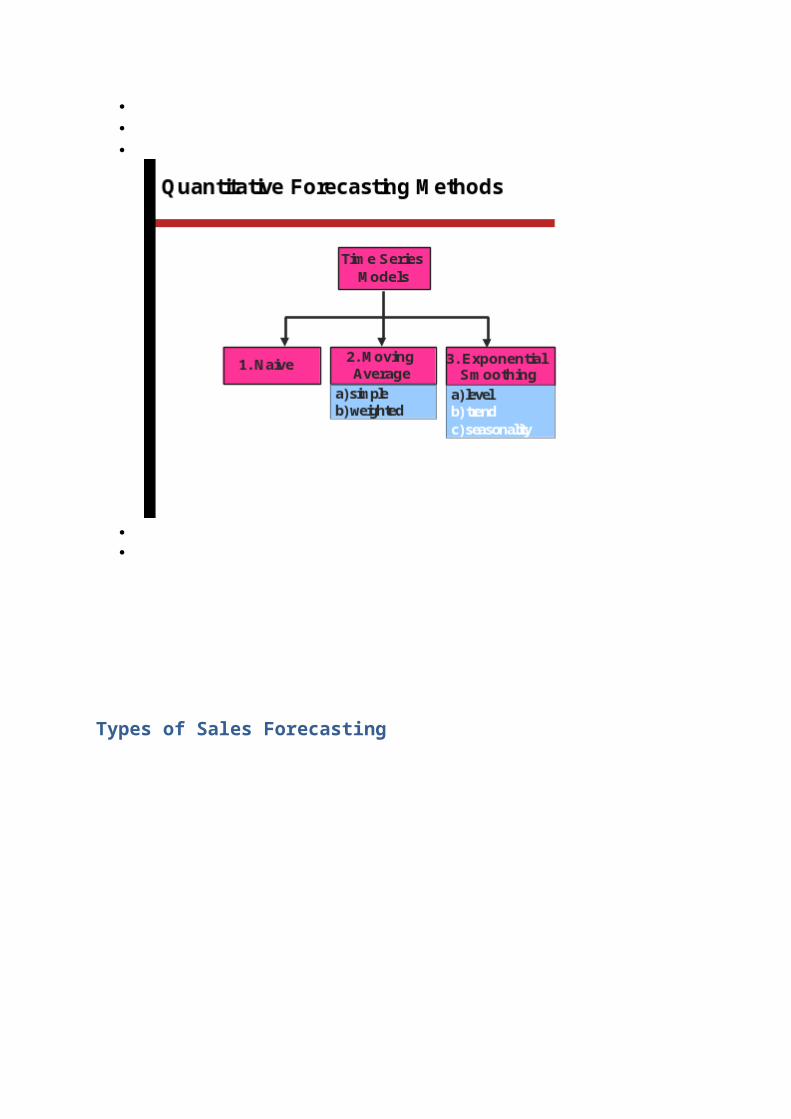
Quantitative Models
Quantitative models discount the expert factor and try to take the human element out of the analysis. These approaches are concerned solely with data and avoid the fickleness of the people underlying the numbers.
Time-series forecasting relies on the assumption that you can extract a trend or pattern from historical data, and extrapolate the trend into the future. For example, use historical sales to

predict future sales. This is a very useful technique for short-range forecasts because it is easy to apply. Also, in the absence of any substantial change in business practices, time-series forecasts can be quite accurate.
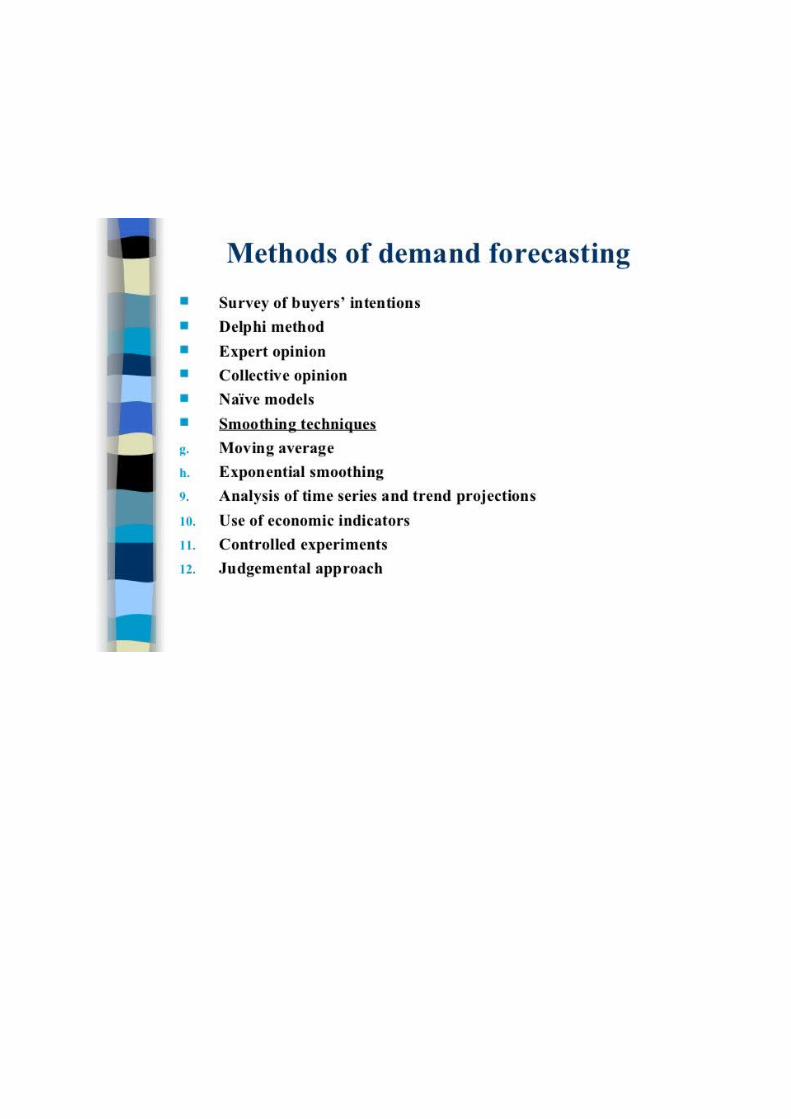
Methods that rely on qualitative assessment
Forecasting demand based on expert opinion. Some of the types in this method are,
Unaided judgment Prediction market Delphi technique Game theory Judgmental bootstrapping Simulated interaction Intentions and expectations surveys Conjoint analysis jury of executive method
Methods that rely on quantitative data
Discrete Event Simulation Extrapolation Reference class forecasting Quantitative analogies Rule-based forecasting Neural networks Data mining Causal models Segmentation
some of the other methods
a) time series projection methods this includes:
moving average method exponential smoothing method trend projection methods
b) casual methods this includes:
chain-ratio method consumption level method


Types of Sales Forecasting
Importance of Sales Forecasting
1. Supply and demand for the products can easily be adjusted, by overcoming temporary demand, in the light of the anticipated estimate and regular supply is facilitated.
2. A good inventory control is advantageously benefited by avoiding the weakness of under stocking and overstocking.
3. Allocation and reallocation of sales territories are facilitated.
4. It is a forward planner as all other requirements of raw materials, labour, plant layout, financial needs, warehousing, transport facility etc., depend in accordance with sales volume expected in advance.

5. Sales opportunities are searched out on the basis of forecast, and thus discovery of selling success is made.
6. It is a gear, by which all other activities are controlled as a basis of forecasting.
7. Advertisement programmes are beneficially adjusted with full advantage to the firm.
8. It is an indicator to the department of finance as to how much and when finance is needed; and it helps to overcome difficult situations.
9. It Is a measuring rod by which the efficiency of the sales personnel or the sales department, as a whole, can be measured.
Factors Influencing a Sales Forecasting
A sales manager should consider all the factors affecting the sales, while predicting their frm's sales in the market. An accurate sales forecast can be made, if the following factors are considered carefully :
1. General economic condition
It is essential to consider all economic conditions relating to the firm and the consumers. The forecaster must see the general economic trend-inflation or deflation, which affect the business favourably or adversely. A thorough knowledge of the economic, political and the general trend of the business facilitates to build a forecast more accurately.
2. Consumers
Products like, wearing apparel, luxurious goods, furniture, vehicles, the size of population by its composition customers by age, sex, type, economic condition etc., have an Important role to determine the sales volume.
3. Industrial behaviour
Markets are full of similar products manufactured by different firms, which compete among themselves to increase the sales. As such, the pricing policy, design, advanced technological improvements, promotional activities etc., of similar industries must be carefully observed. A new firm may come up with products to the markets and naturally affect the market share of the existing firms.
4. Changes within firm
Future sales are greatly affected by the changes in pricing, advertising policy. quality of products etc. A careful study in relation to the changes of the sales volume may be studied carefully. Sales can be increased by price cut, enhancing advertising policies, increased sales promotions, concessions to customers etc.
5. Periods

The required information must be collected on the basis of period short run, medium run or long run forecasts
Types of Sales Forecasting
Approaches to forecasting techniques and procedures vary from firm to firm. There are many methods. A firm may manufacture the products or distribute the products.
The following are the various methods of sales forecasting:
1. Jury of Executive Opinion.
2. Sales Force Opinion.
3. Test Marketing Result.
4. Consumer's Buying Plan.
5. Market Factor Analysis.
6. Expert Opinion.
7. Econometric Model Building.
8. Past Sales (Historical Method).
9. Other Factors.
1. Jury of executive opinion
This method of sales forecasting is the oldest. One, or more of the executives, who are experienced and have good knowledge of the market factors make out the expected sales. The executives are responsible while forecasting sales figures through estimates and experiences. All the factors-internal and external are taken into account.
2. Sales force opinion
Under this method, salesmen or intermediaries are required to make out an estimate sales in their respective territories for a given period. Salesmen are in close touch with the consumers and possess good knowledge about the future demand trend.
3. Test marketing result
Under the market test method, products are introduced in a limited, geographical area and the result is studied. Taking this result as a base, sales forecast is made. This test is conducted as a sample or pre-test basis in order to understand the market response.
4. Consumer's buying plan
Consumers, as a source of information, are approached to know their likely purchases during the period under a given set of conditions.This method is suitable when there are few customers This type of forecasting is generally adopted for industrial goods. It is suitable for industries, which produce costly goods to a limited number of buyers - wholesalers, retailers, potential consumers, etc. .A survey is conducted on face to face basis or survey method. It is because changes are constant while buyer behaviour and buying decisions change frequently.
5. Market factor analysis
A company's sales may depend on the behaviour of certain market factors. The principal factors which affect the sales may be determined. By studying the behaviours of the factors, forecasting should be made. Correlation is the statistical analysis which analyses, the degree of extent to which two variables fluctuate with reference to each other.The word 'relationship' is of importance and indicates that there is some connection between the variable under observation. In the same way, regression analysis, is a statistical device, which helps us to estimate or predict the unknown value of one variable from the unknown values of another variable.
6. Expert opinion

Many types of consultancy agencies have entered into the field of sales. The consultancy agency has specialised experts in the respective field. This includes dealers, trade associations, etc. They may conduct market researches and possess readymade statistical data. Firms may make use of the opinions of such experts. These opinions may be carefully analysed by the company and a sound forecasting is made.
2.3 The process of product order and getting into garments production
Product Management System and its business have changed considerably over some few years. Before implementing and designing this project, several steps were to be taken that were conducted through a combination of research equipments. Understanding product management system (e.g. cutting, swing, washing, finishing etc) and their limitations of information access were some of our considerations. For this purpose we have discussed with Opex Group workers, managers for understanding the system [1].
Most of the ready made garments factories do as follow:
Buyers send a color visual or Original Sample to follow or a book let of their detail design to follow with the order.
Factory (manufacturers) sends the price accordingly and asks for approval from the buyer.
After approval, the factory develops the proto (development) sample and gets the approval.
Within this period buyer sends the purchase order along with the LC (Letter of Credits).
After getting the proto and LC, the factory goes for size wise fit sample (for approval of the measurement).
After the approval, the factory develops the Pre-Production (PP) sample and gets these approved. Pre production sample goes with all original brandings like actual fabric in actual color, actual color print and embroidery, all actual accessories like labels, buttons, packing etc.
After receiving the approval on Pre Production samples, the factory goes for final bulk production.
After final production, either buyer does the inspection or the factory do the inspection on behalf of buyers and produces an inspection certificate which is a compulsory with the shipping document.
The factory does the packing as per buyer’s instruction. Commercial department contacts the buyer’s nominated shipping agent.


how trends and forecast sales with chartsCreating a sales forecast for an upcoming year can be a daunting task — especially when you're busy trying to hit your current sales numbers. Fortunately, you can use prior sales data and tools in Excel 2003 to help predict future sales within a chart. The best part is that you don't have to be a math or programming wizard to come up with your forecast — Excel does it for you!
In this article, you'll learn how to:
Create a chart in Excel by using the Chart Wizard. Understand trendlines and how they can help you in sales forecasting. Use sample sales data to create a trendline in a chart and to forecast sales four quarters into
the future. Find the right trendline for your data. Name a trendline.
Forecasting the future
Have you ever wanted a crystal ball to look into the future and see what your sales might look like a year from now? It's not really magic (it's just math), and trendlines can help you do it.
Before you start forecasting, remember that revenue projections are only as meaningful as your baseline data. Make sure that:
You have enough data to show a meaningful trend. Insufficient baseline data might skew results. For example, seasonal fluctuations might be mistaken for long-term trends if baseline data is from only one year.
The data is ordered from earliest to most recent. No data is missing. If data is unavailable for a period, enter an estimate. All periods are for comparable amounts of time, such as weeks, months, or years.
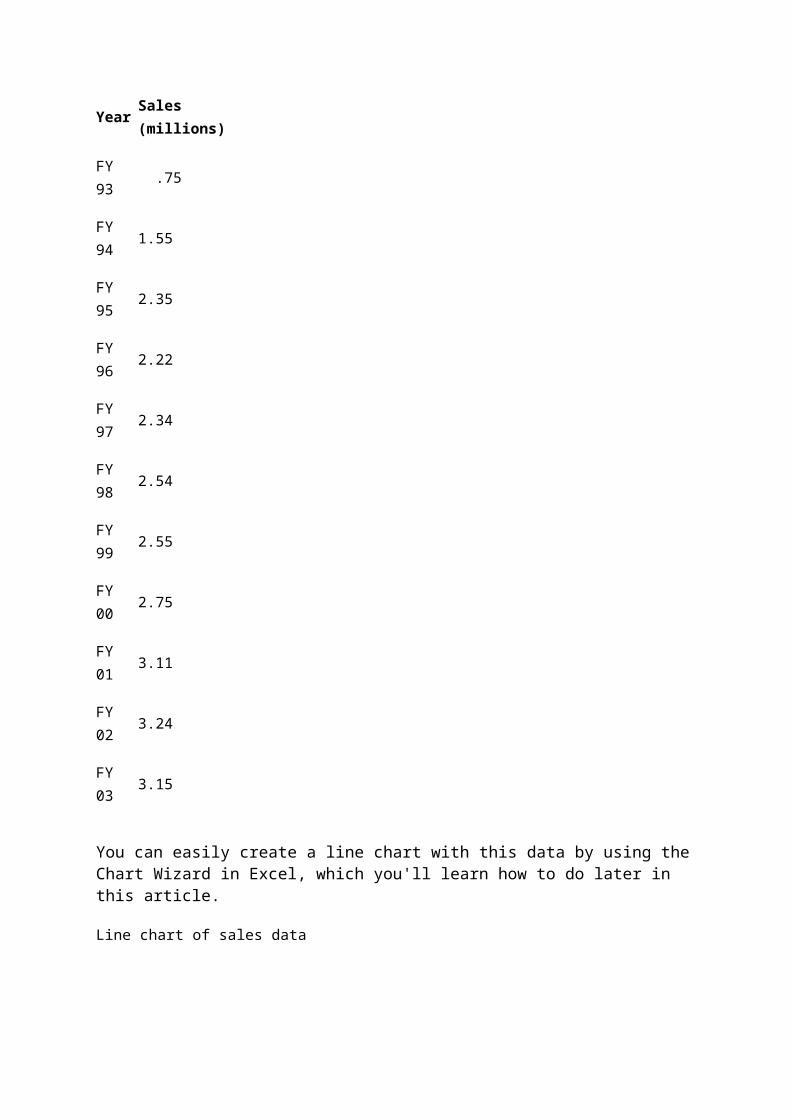
For example, say you have the following data on your past sales:
Sales data
Year Sales (millions)
FY 93 .75
FY 94 1.55
FY 95 2.35
FY 96 2.22
FY 97 2.34
FY 98 2.54
FY 99 2.55

FY 00 2.75
FY 01 3.11
FY 02 3.24
FY 03 3.15
You can easily create a line chart with this data by using the Chart Wizard in Excel, which you'll learn how to do later in this article.
Line chart of sales data
Then, using trendlines, you can project your sales into the future based on your past four quarters. The following is an example of a chart that has a sales projection trendline.
Chart with sales projection trendline
You don't have to understand all about R-squared values — just remember: A trendline is most reliable when its R-squared value is at or near 1. When you fit a trendline to your existing data, Excel automatically calculates its R-squared value based on a formula. The

more closely a trendline fits your existing data, the more accurate a forecast that uses this trendline is likely to be. If you want, you can display this value on your chart.
The best trendline for your data
Choosing the right trendline for your data is very important. Checking the R-squared value can help you choose the best trendline for your data. It also helps to understand the types of trendlines that are likely to fit different scenarios.
A linear trendline is a best-fit straight line that is used with simple linear data sets. Your data is linear if the pattern in its data points resembles a line. A linear trendline usually shows that something is increasing or decreasing at a steady rate.
A logarithmic trendline is a best-fit curved line that is most useful when the rate of change in the data increases or decreases quickly and then levels out. For example, when you start a business, sales might increase quickly. As the business matures, increases in sales are likely to be more gradual.
A moving average trendline works well for data that fluctuates higher and lower. It smoothes out fluctuations in data to show patterns or trends more clearly. You select the number of data points that you want the trendline to average and use as a point in the line.
To learn more about the different trendline types, click "Choosing the best trendline for your data" in the See Also section.
Calculate a linear trendline in a chart
Before you can calculate a trendline, you need to have your data in a chart.
1. Start Excel, and type or copy the sample data, including the headers, in the Sales data table that appeared earlier in this article.
Now the R-squared value is .9459, which tells you that the logarithmic trendline fits your data better than the linear trendline with an R-squared value of .8351. You can also tell by looking at the chart that the trendline fits your sales data better. Because sales are not likely to

grow as quickly in the next four years as they did in the early years, this trendline is a better predictor of future sales.
View a moving average trendline
Moving average trendlines smooth out fluctuating values, so trends are displayed. You might be familiar with moving average trendlines in stock analysis, but these trendlines can also be useful for analyzing sales.
1. Click the trendline on the chart.2. On the Format menu, click Selected Trendline.3. Under Trend/Regression type on the Type tab, select Moving Average, and under Period,
select 3.
Note Period is the number of data points that is used to calculate the sequence of averages. For example, if Period is 3, the moving average is the average of the last three data points.
4. Click OK.
You can experiment with different periods. Generally, lower period values show more immediate trends, and higher period values show longer-term trends.
The R-squared value is not available with the moving average trendline.
Trendlines can help you make sense of your sales and improve your planning with better sales forecasting.

Demand Forecasting Methods
Demand forecasting is used to determine the number of products or services that will be purchased by consumers in the future. Numerous methods can be used when integrating demand forecasting into any business. Most demand forecasting methods fall under four basic categories or methods. These categories include, but are not limited to: quantitative, qualitative, time series methods, and casual methods.

Quantitative Assessment Method
Quantitative forecasting methods take numbers or quantities sold in the past to forecast how much will be sold in the near future. This is usually a forecast that will provide numbers for the next sales year. Some examples of quantitative forecasting methods include last period demand, multiplicative seasonal indexes, and simple and weighted moving averages. Each of these use quantities sold in different types of mathematical formulas to determine how many products or services will be sold at the same times in the future year’s sales that is being predicted.
Qualitative Assessment Method
Qualitative assessment is a subjective method used and is based upon how customers and experts think or feel a product will sell. This method incorporates strategies such as the Delphi method, historical life cycles of similar products, and market research. This method is not as reliable on its own and should be combined with other types of methods. However, it is typically used when there is no historical data to perform a quantitative method approach when forecasting sales. Many new businesses use this method when writing business plans and projecting first year sales.
Methods Using Time Series
Demand forecasting typically does use strategies in the time series method to forecast the demand of products and services. The time series method can be split up into two different types of methods. These include frequency domain methods and time domain methods. Even though the frequency domain method is classified as a time series method, it is not based on time, but on frequency of the occurrence happening or a product being bought. Time domain will show quantities purchases with respect to time.
Casual Methods
Other methods included in demand forecasting include casual methods. These methods work under the assumption that underlying incidents can affect sales numbers of products and services. Examples of casual methods include holidays and seasons that boost sales of certain items. For instance, a candy store may sell more candy canes during the holiday season than other parts of the year. These casual methods also may use linear relationships between sales and another component that remain consistent over time. If the linear relationship remains consistent, then it is a safe prediction.
Demand forecasting encompasses many types of methods and is not limited to those listed here. This forecasting helps those in businesses to determine projected quantities of products or labor needed to provide services for future sales. In addition, demand forecasting can be an effective tool for those new to certain business industries. These methods can assist in writing business plans and obtaining the funds needed to fund a new business venture.
Demand forecasting
Demand forecasting is the activity of estimating the quantity of a product or service that consumers will purchase. Demand forecasting involves techniques including both informal methods, such as educated guesses, and quantitative methods, such as the use of historical sales data or current data from test markets. Demand forecasting may be used in making pricing decisions, in assessing future capacity requirements, or in making decisions on whether to enter a new market.
How to Forecast DemandForecasting demand is an important task for just about any type of business. Accurately projecting the demand for specific goods and services helps companies to order raw materials and schedule production of those products in a timely manner, making it possible to fill consumer orders quickly and efficiently without the need to build up a large inventory that adds to the tax burden of the business. While the process may vary in detail from one setting to another, there are a few basic steps that can make demand forecasting a much simpler process.
Identify the products that are to be considered as part of the forecast process. Doing so helps to create a sense of focus for the effort and make it easier to gauge the public's recognition and attraction to those products, rather than simply relying on the overall reaction of consumers to the brand name or the overall product line.
2
Set parameters for the demand forecast. Establish a specific time frame for the projection, such as the beginning of the second quarter to the end of that same quarter
in the upcoming business year. This makes it easier to include events that are highly likely to occur in that time frame and have some effect on consumer demand for the product under consideration.
Determine the target market or markets for the product. The market may be composed of demographics that have to do with age, gender, location or any other set of identifying characteristics desired. This can also add focus to the demand forecast since it helps the business understand the level of business volume that can be reasonably anticipated from that demographic.

Gather data relevant to the effort to forecast demand. Information such as a breakdown in population within targeted areas, dividing by age groups or economic classes, can often help make it easier to determine the approximate number of sales to anticipate during the period under consideration.

Calculate the actual forecast. While there are several different formulas used for this process, most will require assuming that a fixed percentage of the target market will consume the product a certain number of times during the forecast period. Typically, those percentages are based on either industry standards relevant to the product or the actual history of past periods associated with the actual good or service offered by the business.
Conclusion
Mahmood Group of Industries is a big name in Pakistan, their cotton mills are also set up on a fairly large scale which makes the management of it’s operations a fairly difficult task. However as seen in the report state of art technology is being adapted in the production process.
Mahmood cotton mills have been passing on the benefit of less cost to our buyers instead of increasing our own overheads; however there is no compromise on quality or machinery for cotton yarn processing.
With Peak capacity of 410,000 lbs and effective capacity of 300,000 lbs the A-grade raw material being used causes less waste during extraction in the manufacturing process and more production is being obtained. Wastage of material at different manufacturing stages is controlled by effective management practices. The items which are re-useable are also put to reuse which is another edge and proof of effective operation management.

The company is demonstrating sustained growth over the period of last 3 decades with reasonably good return on investment which have been utilized to give high quality products to customers at least possible prices. Being vertically integrated, the cotton ginning, seed oil extraction, spinning and weaving units are located at strategic places which proved efficient and harmonious working of the various production units which has helped the company in being recognized internationally and locally as dynamic, quality conscious and ever progressive Textile Product manufacturer in the textile Industry of Pakistan.
References:
Miss ParveenAbida, 2004, Production Accounting & Management System, Inspection System, Introduction, Report on Colony Textile Mills Ltd. Lahore
Miss JavedIffat, 2006, Analysis Report on Mahmood Textile Mills Ltd. Faisalabad. Faisalabad
Mr. BhattiJamil Muhammad, 2006, Cotton Production Report on Mahmood Group of Industry.
Research and Training
The country has no dedicated research institute related to the apparel sector. RMG is highly fashion oriented and constant market research is necessary to become successful in the business. BGMEA has already established an institute which offers bachelor’s degree in

fashion designing and BKMEA is planning on setting up a research and training institute. These and related initiatives need encouragement possibly intermediated by donor-assisted technology and knowledge transfer. A facilitating public sector role can be very relevant here.
Supportive Government Policy
In contrast to the public sector-led import-substituting industrialization strategy pursued during the first few years after independence, the industrialization philosophy of the government changed rather dramatically from the late 1970s when the emphasis was on export-oriented growth to be spearheaded by the private sector. Towards this end, various policy reforms were implemented in the 1980s and 1990s. Some of these reformed policies contributed considerably to the growth of the RMG industry in Bangladesh.
During the 1980s, a number of incentives were introduced to encourage export activities. Some of them were new like the Bonded Warehouse Facility (BWF), while others like the Export Performance License (XPL) Scheme
37 were already in operation and were improved upon. Also, rebates were given on import duties and indirect taxes, there were tax reductions on export income, and export financing was arranged. Under the XPL scheme, exporters of non-traditional products received import licenses for specific products over and above their normal percentage allotment based on the f.o.b. value of their exports. Under the Duty Drawback System, exporters of manufactured goods were entitled to get refund of duties and taxes paid on imported inputs used in export production, and also all excise duties paid on exported finished goods. For certain fast-moving items such as RMG, a notional system of duty payments was adopted in 1982-83. Under this system, exporters were exempted from paying duties and taxes on imports used in export production at the time of importation, but were required to keep records of raw and 21packaging materials imported. The duties and taxes payable on the imports were kept in a suspense account. Liabilities to pay the amounts in suspense were removed on proof of exports.
The discussion in this section clearly points to the positive contribution made by policy reforms to the growth of the RMG industry in Bangladesh. In particular, two policies– the SBW facility and the back-to-back L/C system- led to significant reduction in cost of producing garments and enhanced competitiveness of Bangladesh’s garments exports. It also allowed garment manufacturers to earn more profit which, when necessary, could be used to overcome difficulties arising from weak governance. Furthermore, poor governance, reflected in the leakage of duty-free imported fabrics in the domestic market, paradoxically enough also helped the garment manufacturers to earn extra ‘profit’ and thereby enabled them to absorb the ‘high cost of doing businesses – a fall out of bad governance.
Things to be done for solving the problem:
Bangladesh economy at present is more globally integrated than at any time in the past. The MFA phase-out will lead to more efficient global realignments of the Garments and Clothing
industry. The phase out was expected to have negative impact on the economy of Bangladesh. Recent data reveals that Bangladesh absorbed the shock successfully and indeed RMG exports grew significantly both in FY06 and (especially) in FY07. Due to a number of steps taken by the industry, Bangladesh still remains competitive in RMG exports even in this post phase-out period.
Our Garments Industries can improve their position in the world map by reducing the overall problems. Such as management labor conflict, proper management policy, efficiency of the manager, maintainable time schedule for the product, proper strategic plan etc.
Limitation or Problems of Garments industry:
The history of the Readymade Garments Sector in Bangladesh is a fairly recent one. Nonetheless it is a rich and varied tale. The recent struggle to realize Workers’ Rights adds an important episode to the story.
The RMG industry of Bangladesh has expanded dramatically over the last three decades. Traditionally, the jute industry dominated the industrial sector of the country until the 1970s. Since the early 1980s, the RMG industry has emerged as an important player in the economy of the country and has gradually replaced the jute industry.
Although Bangladesh is not developed in industry, it has been enriched in Garment industries in the recent past years. In the field of Industrialization garment industry is a promising step. The sector now dominates the modern economy in export earnings, secondary impact and employment generated. It has given the opportunity of employment to millions of unemployed, specially innumerable uneducated women of the country. It is making significant contribution in the field of our export income.
Bangladesh exports 35 types of garment products to about 31 countries around the world. The RMG sector is a 100% export-oriented industry.
That Bangladesh today is considered an economic competitor in terms of international garment manufacturing by other countries of the region and beyond is the country since gaining independence in 1971. it appers much of the socio-economic development in the first decade of the twenty-first century for Bangladesh and its approximately 1.5 million women workers depends on the continuing success of the RMG industry.
Problems surrounding ready made garments sector:

The garment industry of Bangladesh has been the key export division and a main source of foreign exchange for the last 25 years. National labor laws do not apply in the EPZs, leaving BEPZA in full control over work conditions, wages and benefits. Garment factories in Bangladesh provide employment to 40 percent of industrial workers. But without the proper laws the worker are demanding their various wants and as a result conflict is began with the industry
1. Raw materials:
2. Unskilled workers:
3. Improper working environment:
3. Lack of managerial knowledge:
4. Gendered division of labor:
5. Wages:
6. Insufficient of loan:
7. Unit labor cost:
8. Working hours:
9. Poor accommodation facilities:
10. Safety Problems:
Because of the carelessness of the factory management and for their arrogance factory doors used to be kept locked for security reason defying act
Refference:.......................................................................................................................................................................................................