the relationship between diesel engine maintenance and exhaust
TRANSCRIPT

TTTHHHEEE RRREEELLLAAATTTIIIOOONNNSSSHHHIIIPPP BBBEEETTTWWWEEEEEENNN
DDDIIIEEESSSEEELLL EEENNNGGGIIINNNEEE MMMAAAIIINNNTTTEEENNNAAANNNCCCEEE
AAANNNDDD EEEXXXHHHAAAUUUSSSTTT EEEMMMIIISSSSSSIIIOOONNNSSS
FFFIIINNNAAALLL RRREEEPPPOOORRRTTT
SSSEEEAAANNN MMMCCCGGGIIINNNNNN
NNNOOORRRAAANNNDDDAAA TTTEEECCCHHHNNNOOOLLLOOOGGGYYY CCCEEENNNTTTRRREEE
FFFOOORRR TTTHHHEEE DDDIIIEEESSSEEELLL EEEMMMIIISSSSSSIIIOOONNNSSS EEEVVVAAALLLUUUAAATTTIIIOOONNN PPPRRROOOGGGRRRAAAMMM (((DDDEEEEEEPPP)))

Page 2
TTTAAABBBLLLEEE OOOFFF CCCOOONNNTTTEEENNNTTTSSS
THE RELATIONSHIP BETWEEN DIESEL ENGINE MAINTENANCE AND EXHAUSTEMISSIONS .................................................................................................................................................. 6
EXECUTIVE SUMMARY ................................................................................................................................ 6
INTRODUCTION TO RESEARCH......................................................................................................... 11
ENGINE MAINTENANCE AUDIT AND SITE SELECTION.............................................................. 12
MAINTENANCE GUIDELINES AND BEST PRACTICES ................................................................. 15
EMISSIONS TEST EQUIPMENT............................................................................................................ 17
INTRODUCTION .......................................................................................................................................... 17UNDILUTED EXHAUST GAS MEASUREMENT.............................................................................................. 17UNDILUTED DIESEL PARTICULATE MEASUREMENT .................................................................................. 23ANALYSIS OF PARTICULATE SAMPLES....................................................................................................... 26CALIBRATION OF INSTRUMENTATION ........................................................................................................ 27
ACQUIRING BASELINE EMISSIONS................................................................................................... 29
INTRODUCTION .......................................................................................................................................... 29VEHICLES AND ENGINES............................................................................................................................ 29BASELINE EMISSIONS ................................................................................................................................ 30
IMPLEMENTING IMPROVED ENGINE MAINTENANCE............................................................... 35
INTRODUCTION .......................................................................................................................................... 35MAINTENANCE PROCESS IMPROVEMENTS ................................................................................................. 35NEW TOOLS FOR MAINTAINING ENGINES.................................................................................................. 41TRAINING .................................................................................................................................................. 46
CASE STUDIES.......................................................................................................................................... 48
CASE STUDY I – DEUTZ BF4M 1013 ENGINE.................................................................................... 49
INTRODUCTION .......................................................................................................................................... 49INTAKE SYSTEM ........................................................................................................................................ 50EXHAUST SYSTEM ..................................................................................................................................... 52FUEL INJECTION SYSTEM........................................................................................................................... 52COOLING SYSTEM...................................................................................................................................... 54LUBRICATION SYSTEM .............................................................................................................................. 54EMISSIONS RESULTS.................................................................................................................................. 55CONCLUSIONS AND SUMMARY .................................................................................................................. 58
CASE STUDY II – EXHAUST AFTERTREATMENT SYSTEMS ...................................................... 59
INTRODUCTION .......................................................................................................................................... 59CLASSROOM THEORY SESSION .................................................................................................................. 60PRACTICAL HANDS ON SESSION................................................................................................................ 61EMISSIONS RESULTS.................................................................................................................................. 63SUMMARY ................................................................................................................................................. 64
CASE STUDY III – DETROIT DIESEL SERIES 60 ENGINE ............................................................. 65
INTRODUCTION .......................................................................................................................................... 65INTAKE SYSTEM ........................................................................................................................................ 66EXHAUST SYSTEM ..................................................................................................................................... 68

Page 3
FUEL INJECTION SYSTEM........................................................................................................................... 68COOLING SYSTEM...................................................................................................................................... 70LUBRICATION SYSTEM .............................................................................................................................. 71EMISSIONS RESULTS.................................................................................................................................. 71SUMMARY ................................................................................................................................................. 74
CASE STUDY IV – CATERPILLAR 3304T ENGINE........................................................................... 75
INTRODUCTION .......................................................................................................................................... 75INTAKE SYSTEM ........................................................................................................................................ 76EXHAUST SYSTEM ..................................................................................................................................... 77FUEL SYSTEM ............................................................................................................................................ 79COOLING SYSTEM...................................................................................................................................... 81LUBRICATION SYSTEM .............................................................................................................................. 81EMISSIONS RESULTS.................................................................................................................................. 82SUMMARY ................................................................................................................................................. 86
PROJECT RECOMMENDATIONS AND CONCLUSION................................................................... 87
RECOMMENDATIONS BASED ON FINDINGS ................................................................................................ 87CONCLUSION ............................................................................................................................................. 88
BIBLIOGRAPHY....................................................................................................................................... 89
ACKNOWLEDGEMENT.......................................................................................................................... 90
APPENDIX I – MECHANIC FEEDBACK.............................................................................................. 91
APPENDIX II – MAINTENANCE AUDIT TEMPLATE ...................................................................... 92
APPENDIX III – GUIDELINES AND BEST PRACTICES................................................................... 93

Page 4
TTTaaabbbllleee ooofff FFFiiiggguuurrreeesss
FIGURE 1 - EMISSIONS TESTING SYSTEM....................................................................................................... 18
FIGURE 2 - ECOM GAS ANALYZER .............................................................................................................. 19
FIGURE 3 - UGAS SOFTWARE....................................................................................................................... 20
FIGURE 4 - SIMULTANEOUS GAS AND PARTICULATE SAMPLING............................................................... 23
FIGURE 5 - PARTICULATE SAMPLING SYSTEM............................................................................................... 24
FIGURE 6 - UPSS SCHEMATIC ....................................................................................................................... 25
FIGURE 7 - CALIBRATION OF GILIAN PUMP ................................................................................................... 28
FIGURE 8 - LUBE CUBE BEFORE SERVICE...................................................................................................... 36
FIGURE 9 - LUBE CUBE AFTER SERVICE........................................................................................................ 36
FIGURE 10 - ENGINE SYSTEM PM - PAGE 1 ................................................................................................... 38
FIGURE 11 - ENGINE SYSTEM PM - PAGE 2 ................................................................................................... 39
FIGURE 12 - CATBASE ELECTRONIC PARTS CATALOG .................................................................................. 40
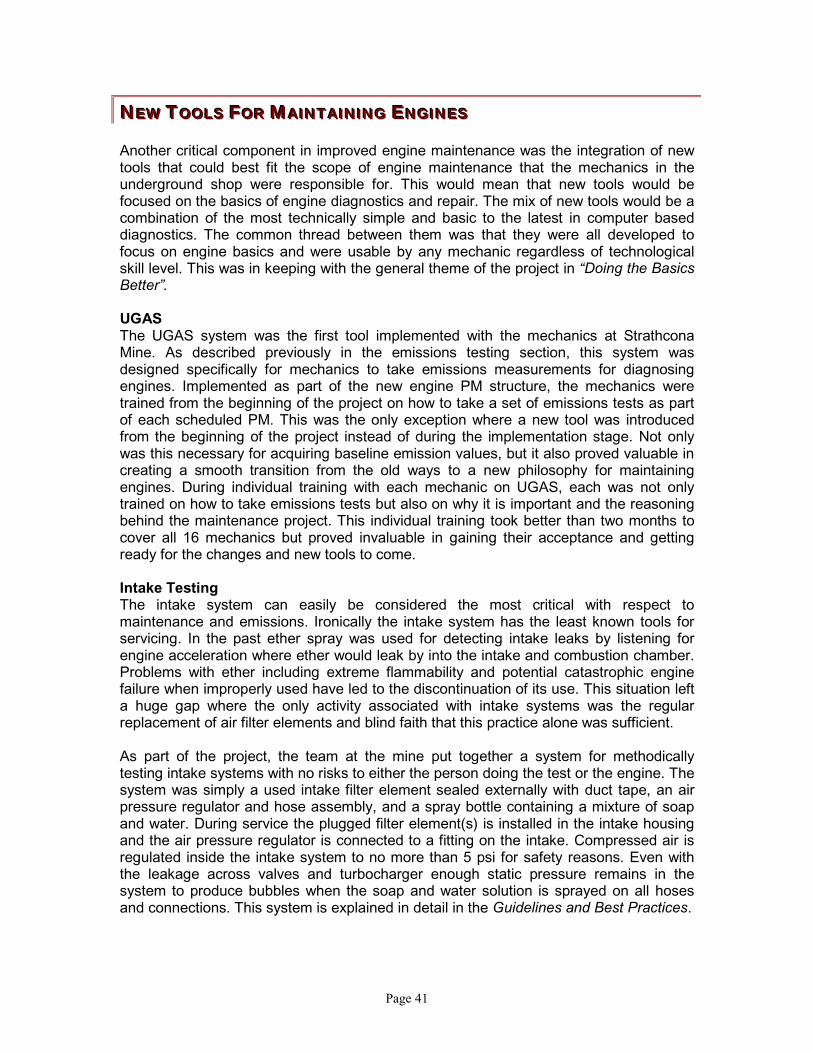
FIGURE 13 - INTAKE TESTING SYSTEM.......................................................................................................... 42
FIGURE 14 - MAGNEHELIC GAUGE FOR INTAKE AND EXHAUST.................................................................... 43
FIGURE 15 - INTAKE SERVICE INDICATOR GAUGES ON ST8-B ...................................................................... 43
FIGURE 16 - DDDL ....................................................................................................................................... 45
FIGURE 17 - EQUIPMENT SPECIFICATION LOOKUP......................................................................................... 46
FIGURE 18 - DEUTZ ENGINE CASE STUDY..................................................................................................... 50
FIGURE 19 - PRESSURE TESTING INTAKE SYSTEM ......................................................................................... 51
FIGURE 20 - INTAKE LEAKS........................................................................................................................... 51
FIGURE 21 - PRESSURE TESTING INJECTOR NOZZLES .................................................................................... 53
FIGURE 22 - SERVICING INJECTORS AND VALVES.......................................................................................... 53
FIGURE 23 - THEORY SESSION AT 3900 CLASSROOM .................................................................................... 61
FIGURE 24 - CLEANING PURIFIER IN DIESEL FUEL......................................................................................... 62
FIGURE 25 - INSPECTION USING BACKLIGHTING ........................................................................................... 62
FIGURE 26 - TURBOCHARGER TROUBLESHOOTING TECHNIQUES .................................................................. 67
FIGURE 27 - INTAKE LEAKS........................................................................................................................... 67
FIGURE 28 - SETTING INJECTORS AND VALVES ............................................................................................. 69
FIGURE 29 - DETROIT DIESEL DIAGNOSTIC LINK .......................................................................................... 70
FIGURE 38 - DPM SAMPLES BEFORE AND AFTER ......................................................................................... 85

Page 5
TTTaaabbbllleee ooofff TTTaaabbbllleeesss
TABLE 1 - SUMMARY OF MAINTENANCE AUDITS ......................................................................................... 13
TABLE 2 - PROFILE OF VEHICLES IN PROJECT................................................................................................ 30
TABLE 3 - BASELINE EMISSIONS 207 SCOOP ................................................................................................. 31
TABLE 4 - BASELINE EMISSIONS 818 SCOOP ................................................................................................. 32
TABLE 5 - BASELINE EMISSIONS 820 SCOOP ................................................................................................. 33
TABLE 6 - BASELINE EMISSIONS GR002 GRADER......................................................................................... 33
TABLE 7 - DEUTZ CASE STUDY EMISSIONS DATA ......................................................................................... 55
TABLE 8 - AFTERTREATMENT CASE STUDY EMISSIONS DATA ...................................................................... 63
TABLE 9 - DETROIT DIESEL - 818 CASE STUDY EMISSIONS DATA ................................................................ 71
TABLE 10 - DETROIT DIESEL - 820 CASE STUDY EMISSIONS DATA .............................................................. 71
TABLE 11 - CAT GRADER CASE STUDY EMISSIONS DATA ........................................................................... 82

Page 6
TTTHHHEEE RRREEELLLAAATTTIIIOOONNNSSSHHHIIIPPP BBBEEETTTWWWEEEEEENNN DDDIIIEEESSSEEELLL EEENNNGGGIIINNNEEE
MMMAAAIIINNNTTTEEENNNAAANNNCCCEEE AAANNNDDD EEEXXXHHHAAAUUUSSSTTT EEEMMMIIISSSSSSIIIOOONNNSSS
EEEXXXEEECCCUUUTTTIIIVVVEEE SSSUUUMMMMMMAAARRRYYY
In the first months of the DEEP program the Technical Committee solicited ideas forprojects that would fulfill the 3-year mandate to provide a toolbox of technologies andinformation on control and reduction of diesel particulate matter in the undergroundmining environment. The third project to be proposed to the Technical Committee wasone investigating the relationship between improved diesel engine maintenance andassociated reductions in emissions. Noranda Technology Centre in Pointe Claire,Québec submitted a project proposal to conduct the project based on previousexperience with related work at Noranda and Falconbridge mining operations. In early1998 the Technical Committee approved the project proposal with stated objectives to:
1. Drawing on previous research and in consultation with industry authorities, identify theprincipal engine maintenance procedures and practices which reduce diesel emissions
2. Establish a maintenance review process to determine the current status of amaintenance operation and recommendations for improvements to reduce engineemissions
3. Test and evaluate this process in an underground mine(s)
4. Develop a model of good maintenance practice with an emphasis on reduced emissions
5. Perform before and after implementation sampling of exhaust gases and DPM toestablish relationship between improved maintenance and reduced emissions and DPM
6. Educate and train maintenance personnel on the importance of effective maintenanceon diesel engines and exhaust emissions
To accomplish these objectives a plan was laid out that would involve a wide range ofresource participation from several mining companies, engine manufacturers, emissioncontrol manufacturers, and research organisations. The project plan was broken intomajor stages, which were:
! Construct a review model for engine maintenance and conduct reviews at 2 minesfor selection of a suitable host site for the project
! Develop guidelines and best practices for engine maintenance that would serve as afoundation to implement improvements at the mine
! Begin field work by implementing emissions testing equipment and acquiringbaseline emissions values for mobile equipment included in the study
! Implement an improved engine maintenance strategy through a combination ofchanges to process, tools and training
! Analysis and recommendations resulting from field work
Page 7
Auditing Engine Maintenance and Site Selection
Based on an existing audit framework, an audit model for diesel engine maintenancewas constructed that could be taken to a mine site and conducted over a one-weekperiod. Common maintenance practices such as condition based and scheduledmaintenance activity were built into the evaluation along with focus on the 6 systems ofdiesel engines identified from previous research. The completed model became an easyto use tool that proved effective in identifying strengths and weaknesses and providinginstant value to the host site for the audit even before any corrective actions. By the endof the summer two mine sites had participated in the site review process. The 5 dayaudits were conducted at Hudson Bay Mining & Smelting’s Ruttan Mine in Leaf Rapids,Manitoba and Falconbridge Ltd’s Strathcona Mine in Onaping, Ontario. From the finalreports of both reviews based on a combination of strengths, weaknesses, opportunitiesand threats, the Technical Committee approved the recommended selection ofStrathcona Mine as the most suitable site to host the project.
Guidelines and Best Practices for Diesel Engine Maintenance
In parallel to the review model and selection process the guidelines and best practicesfor maintaining engines was put together. Once again the 6 system approach to dieselengines was followed along with the other categories in the audit model. By doing bothin parallel the results from the audit could be directly applied to the guidelines and bestpractices and solutions easily identified. The foundation for the guidelines and bestpractices was laid down by a five person technical panel of specialists in the field ofdiesel engine maintenance in the mining industry. Through group brainstorming andcompilation of reference information materials from all members the document was builtin time to be used for the implementation stage of the project against the results from theaudit.
Acquiring an Emissions Baseline
The first phase of the field work at the mine was to move the emissions testingequipment into the shop on 3900 level at Strathcona and begin training and testing withthe group of mechanics. The emissions test equipment consisted of a gaseousemissions test system from Noranda Technology Centre called the Undiluted GasAnalysis System (UGAS) and a particulate emissions test system from CANMET calledthe Undiluted Particulate Sampling System (UPSS). The two systems were integratedinto one package situated on the shop floor as a tool for the mechanics to use. In total13 vehicles were tested and 16 mechanics and leaders were trained over the baselineperiod of 3 months. Each of the vehicles was tested at least once but in most casesseveral times over this period. This also permitted enough time for every mechanic to gothrough the emissions training aspect of the project and at least one mechanic fromeach of the 4 crews to be trained to an advanced level where he could take emissionstests on his own on shift.

Page 8
Implementing Change to Process – Tools – Training
At the completion of the baseline stage a meeting was held with the project team andmine management to discuss the implementation of change to the existing enginemaintenance system. The results from the audit were presented once again and a shortlist of the most implementable items yielding the most significant potential was outlined.From this a plan was put together to approach the problem from three directions.Changes would be made to the existing process such as the structure of preventivemaintenance with respect to engines. This would be a process with considerableplanning and intervention on the part of the mine and would be ongoing through the restof the fieldwork in the project. The implementation of new tools was immediate andproduced both a change in engine performance and positive feedback from mechanics.The mechanics were introduced to the new tools through a training strategy that was thethird component to the implementation. The primary level of training was done on a oneto one basis between the mechanic and the project leader. To complement this, grouptraining sessions were conducted as individual case studies where a specific vehiclewas used for a one-day hands on training session with a small group of four to fivemechanics. Training was provided by service representatives from the enginemanufacturers. During each case study the mechanics were also shown how toincorporate the new process and new tools along with the training to improveperformance and reduce emissions. It was the case studies where the impact toemissions was measured and qualified from a before and after perspective.
Evaluating the Impact of Improved Maintenance
The most effective way to evaluate the effects of the improved maintenance processwas through the results in the four case studies. For each case study the vehicleemissions were measured at the start of the day session before any changes were madeor maintenance activity. As the session progressed emissions were measured with afinal set of tests once the case study was complete and the vehicle was ready to returnto work. This gave a comparison of emissions values from when the vehicle arrived atthe shop for the study to when it was released back to production.
Results from the case studies showed that gaseous and particulate emissions could bereduced significantly depending on engine design technology and condition. Gaseousemissions reductions (carbon monoxide) as high as 65% were proven and particulateemissions reductions as high as 55% were seen as well.
Conclusions and Recommendations
With the fieldwork and testing behind the focus shifted to analysing the considerableemissions data gathered over the seven-month period at the mine. When looking back tothe original project objectives in the proposal the work would appear to have satisfiedthese and more. Each stage of the project all the way back to the audit model proved tobe very effective in application and in educating not only the mine personnel but everyperson involved with the project at every stage. The modular approach to the projectalso leads well to succeeding in transferring the knowledge gained through deliverables

Page 9
such as the Guidelines and Best Practices for Diesel Engine Maintenance and theDiesel Engine Maintenance Audit Model included as part of the final report.
As the first level of control in reducing diesel exhaust emissions, the followingrecommendations for improved diesel engine maintenance can be adopted as the firststeps in achieving reduced emissions.
1. Build a team focussed on implementing an improved maintenance strategy.The team should have members including mechanics, operators, supervision,planning, and management from the mine. Responsibilities can be delegatedaccording to an implementation plan and followed up through a report andmeeting structure. Ensure that sufficient resources are made available to theteam with respect to time, tools, and training.
2. Construct an engine maintenance audit program using the model provided inthis report as a template. Select an auditing team from both internal andexternal to the mine maintenance system. Sometimes it takes anunaccustomed eye to uncover what is obvious and overlooked by someonecloser to home. A good audit program has follow up mechanisms built in to itand should be conducted at least annually.
3. Utilize the Guidelines and Best Practices included in this report along with thesix system approach to engine maintenance as a foundation in building astrategy for improving existing maintenance practices.
4. Put a program together for testing undiluted tailpipe emissions onunderground vehicles. Integrate the program with a structured MaintenanceManagement record and planning system – preferably computer based. Setaction limits on emissions within the system to ensure response to problems.The critical factor in the emissions testing program is not so much in thetechnology used to measure but in the structured protocol in taking the tests.In order to be useful the emissions must be compared against a knownbaseline at a known operating state consistently.
5. Make use of the suppliers of diesel engines and related equipment for trainingand follow up with new tools and other developments. The best way for anengine supplier to improve the relationship with the mine is to providesolutions to problems. The best way to do this is to have servicerepresentatives come to the mine and provide hands on instruction with smallgroups or one on one as described in the case studies for this project.

Page 10
RRRRRRRRRRRREEEEEEEEEEEEPPPPPPPPPPPPOOOOOOOOOOOORRRRRRRRRRRRTTTTTTTTTTTT OOOOOOOOOOOONNNNNNNNNNNN RRRRRRRRRRRREEEEEEEEEEEESSSSSSSSSSSSEEEEEEEEEEEEAAAAAAAAAAAARRRRRRRRRRRRCCCCCCCCCCCCHHHHHHHHHHHH
AAAAAAAAAAAAUUUUUUUUUUUUDDDDDDDDDDDDIIIIIIIIIIIITTTTTTTTTTTT AAAAAAAAAAAANNNNNNNNNNNNDDDDDDDDDDDD SSSSSSSSSSSSIIIIIIIIIIIITTTTTTTTTTTTEEEEEEEEEEEE SSSSSSSSSSSSEEEEEEEEEEEELLLLLLLLLLLLEEEEEEEEEEEECCCCCCCCCCCCTTTTTTTTTTTTIIIIIIIIIIIIOOOOOOOOOOOONNNNNNNNNNNN
AAAAAAAAAAAASSSSSSSSSSSSSSSSSSSSSSSSEEEEEEEEEEEEMMMMMMMMMMMMBBBBBBBBBBBBLLLLLLLLLLLLIIIIIIIIIIIINNNNNNNNNNNNGGGGGGGGGGGG GGGGGGGGGGGGUUUUUUUUUUUUIIIIIIIIIIIIDDDDDDDDDDDDEEEEEEEEEEEELLLLLLLLLLLLIIIIIIIIIIIINNNNNNNNNNNNEEEEEEEEEEEESSSSSSSSSSSS AAAAAAAAAAAANNNNNNNNNNNNDDDDDDDDDDDD BBBBBBBBBBBBEEEEEEEEEEEESSSSSSSSSSSSTTTTTTTTTTTT PPPPPPPPPPPPRRRRRRRRRRRRAAAAAAAAAAAACCCCCCCCCCCCTTTTTTTTTTTTIIIIIIIIIIIICCCCCCCCCCCCEEEEEEEEEEEESSSSSSSSSSSS
EEEEEEEEEEEEMMMMMMMMMMMMIIIIIIIIIIIISSSSSSSSSSSSSSSSSSSSSSSSIIIIIIIIIIIIOOOOOOOOOOOONNNNNNNNNNNNSSSSSSSSSSSS TTTTTTTTTTTTEEEEEEEEEEEESSSSSSSSSSSSTTTTTTTTTTTT EEEEEEEEEEEEQQQQQQQQQQQQUUUUUUUUUUUUIIIIIIIIIIIIPPPPPPPPPPPPMMMMMMMMMMMMEEEEEEEEEEEENNNNNNNNNNNNTTTTTTTTTTTT
AAAAAAAAAAAACCCCCCCCCCCCQQQQQQQQQQQQUUUUUUUUUUUUIIIIIIIIIIIIRRRRRRRRRRRRIIIIIIIIIIIINNNNNNNNNNNNGGGGGGGGGGGG BBBBBBBBBBBBAAAAAAAAAAAASSSSSSSSSSSSEEEEEEEEEEEELLLLLLLLLLLLIIIIIIIIIIIINNNNNNNNNNNNEEEEEEEEEEEE EEEEEEEEEEEEMMMMMMMMMMMMIIIIIIIIIIIISSSSSSSSSSSSSSSSSSSSSSSSIIIIIIIIIIIIOOOOOOOOOOOONNNNNNNNNNNNSSSSSSSSSSSS
IIIIIIIIIIIIMMMMMMMMMMMMPPPPPPPPPPPPLLLLLLLLLLLLEEEEEEEEEEEEMMMMMMMMMMMMEEEEEEEEEEEENNNNNNNNNNNNTTTTTTTTTTTTIIIIIIIIIIIINNNNNNNNNNNNGGGGGGGGGGGG IIIIIIIIIIIIMMMMMMMMMMMMPPPPPPPPPPPPRRRRRRRRRRRROOOOOOOOOOOOVVVVVVVVVVVVEEEEEEEEEEEEDDDDDDDDDDDD MMMMMMMMMMMMAAAAAAAAAAAAIIIIIIIIIIIINNNNNNNNNNNNTTTTTTTTTTTTEEEEEEEEEEEENNNNNNNNNNNNAAAAAAAAAAAANNNNNNNNNNNNCCCCCCCCCCCCEEEEEEEEEEEE
CCCCCCCCCCCCAAAAAAAAAAAASSSSSSSSSSSSEEEEEEEEEEEE SSSSSSSSSSSSTTTTTTTTTTTTUUUUUUUUUUUUDDDDDDDDDDDDIIIIIIIIIIIIEEEEEEEEEEEESSSSSSSSSSSS
RRRRRRRRRRRREEEEEEEEEEEECCCCCCCCCCCCOOOOOOOOOOOOMMMMMMMMMMMMMMMMMMMMMMMMEEEEEEEEEEEENNNNNNNNNNNNDDDDDDDDDDDDAAAAAAAAAAAATTTTTTTTTTTTIIIIIIIIIIIIOOOOOOOOOOOONNNNNNNNNNNNSSSSSSSSSSSS AAAAAAAAAAAANNNNNNNNNNNNDDDDDDDDDDDD CCCCCCCCCCCCOOOOOOOOOOOONNNNNNNNNNNNCCCCCCCCCCCCLLLLLLLLLLLLUUUUUUUUUUUUSSSSSSSSSSSSIIIIIIIIIIIIOOOOOOOOOOOONNNNNNNNNNNN

Page 11
IIINNNTTTRRROOODDDUUUCCCTTTIIIOOONNN TTTOOO RRREEESSSEEEAAARRRCCCHHH
The research in the maintenance project is a combination of a foundation that wasestablished in previous research work and the application of fundamentals andexperience from several resources within the mining industry.
The foundation established by the work done by Waytulonis and the former U.S. Bureauof Mines was used as a platform from which to build from for this project. In the previouswork six primary engine systems were identified as critical to focus on improvedmaintenance. [1] The six systems are:
1. Air Intake System2. Cooling System3. Diesel Fuel Handling and Quality4. Fuel Injection System5. Lubrication System6. Exhaust System
These same systems were used in a new order of priority to assist in the construction ofboth the engine maintenance audit template and the guidelines and best practices thathave been produced as part of the research. From this platform two separate groupsparticipated in brainstorming sessions and information gathering to come up with thebasic templates that would become the audit model and engine maintenance guidelinesand best practices.
With these basic tools in place the project moved to the mine site where the first phasewas to conduct the audit to determine the status of current diesel engine maintenancepractices. Before any changes could be made the equipment for measuring exhaustemissions as put into place, the mechanics were trained on testing emissions, andbaseline emissions values were acquired for the underground production fleet. Once thebaseline had been completed and the mechanics had been trained the implementationof improved maintenance practices was undertaken. This involved taking the guidelinesand best practices and comparing against the results of the audit to come up with anaction plan. The action plan used a combination of changes to existing internalprocesses, new tools, training, and four case studies to put all components together as apackage to improve maintenance and reduce emissions.

Page 12
EEENNNGGGIIINNNEEE MMMAAAIIINNNTTTEEENNNAAANNNCCCEEE AAAUUUDDDIIITTT AAANNNDDD SSSIIITTTEEE SSSEEELLLEEECCCTTTIIIOOONNN
The first major task in the project was to identify potential mines for participation andthen make a selection using an audit process specific to diesel engine maintenance.While the project team was constructing the audit model to be used, the process ofsoliciting mines for participation in the project was begun. Ironically, the identification oftwo potential site candidates to even consider participation in the project through theaudit process would be one of the biggest challenges in the entire project. After severalmonths of communication with mining companies across Canada two candidates wereidentified for participation in the audit process. From this process the most suitable sitewould be chosen based on a combination of strengths and weaknesses specific to sitemaintenance performance and opportunities and threats specific to the success of theproject. The two mine sites chosen to participate were:
! Hudson Bay Mining and Smelting – Ruttan Mine, Leaf Rapids, Manitoba! Falconbridge Ltd. – Strathcona Mine, Onaping, Ontario
While this process of soliciting candidate mine sites was ongoing the audit model forevaluating and selecting the most suitable site was built. The model was constructedfrom an existing audit framework used for conducting industrial hygiene audits within theNoranda and Falconbridge group of operations. The basic framework and techniquesfrom this model were taken and modified to fit the diesel engine maintenance process foran underground mining operation.
The audit model template has been included in the appendix section of the report. Thisis the actual model that was used for conducting identical site audits at both Ruttan andStrathcona Mines.
Site Selection
For confidentiality reasons and the public nature of this document, the details of the finalreports from each site audit are not included in this report. The following summaryoutlines the results presented to the DEEP Technical Committee including the key pointsdiscovered from the audits and justification for selection of Strathcona Mine as the hostsite for the project.
Executive Summary - Site Review Process
The team for the DEEP Maintenance Project completed two site reviews of potentialcandidates for hosting this project. The HBM&S Ruttan Mine in Leaf Rapids, MB wasreviewed in mid July ’98 and Falconbridge's Strathcona Mine in Onaping, Ont wasreviewed in mid August ‘98. The final reports for each site were completed andpresented to each mine individually and the DEEP Technical Committee.
The summary section at the end of each final report outlined the strengths, weaknesses,opportunities and threats that were established from each review. These were presented

Page 13
at each site with a draft report and closing presentation of findings on the last day ofeach review. The strengths and weaknesses are findings that are specific to the site andhow effective they are at maintaining diesel engines. The opportunities and threats arespecific to how this project could potentially succeed or fail based on findings of thereview. The following table outlines a comparison summary of the opportunities andthreats from each site review as a guideline for decision on the most suitable site to hostthe project.
HBM&S - Ruttan Mine Falconbridge Ltd - Strathcona MineOpportunity Threat Opportunity Threat
Replacement of LHDfleet this fall - loss of
baseline
Training - There isconsiderable training
infrastructureavailable in Sudburyfor implementing into
this projectLocation -Leaf Rapidsis difficult and costly
for travel
Location - Sudbury iswithin driving distance
and 1/4 the cost oftravel to Leaf Rapids
Absence of a highimpact maintenance
issue
Absence of a highimpact maintenance
issueEngine Profile - there
is a near perfectprofile of different
engines to include inthe study
Marcam and CatBaseExisting CMMS and
electronic partssystems that can be
utilized andimplemented for this
project
Existing EmissionsData - Potential for
including existing COtest data in baseline
data study
CANMET - SudburyThe laboratories herecould be utilized forsupport of the DPM
apparatus andgravimetric analysis
Table 1 - Summary of Maintenance Audits

Page 14
Based on the above summary, the selection of Falconbridge Ltd - Strathcona Mine wasrecommended as the most suitable site for hosting this project. This decision was basedon the total number of potential threats to project success at Ruttan compared to thetotal number of potential opportunities for project success at Strathcona.
Regardless of which site was chosen to host this project, the review process addedvalue to both mines and all parties involved. It added educational value to DEEP as anew tool and added value to the operations at each site with respect to understandingdiesel engine maintenance practices and where their specific needs lie.

Page 15
MMMAAAIIINNNTTTEEENNNAAANNNCCCEEE GGGUUUIIIDDDEEELLLIIINNNEEESSS AAANNNDDD BBBEEESSSTTT PPPRRRAAACCCTTTIIICCCEEESSS
A critical component in implementing improved engine maintenance practices was tohave a guide to assist in building an implementation plan. In parallel to the work on theaudit template a set of guidelines and best practices was put together. The foundationfor this was based on the previous research from the Bureau of Mines and the six enginesystem approach as was the case with the audit template.
The first step was to assemble a small group of people with extensive experience inmaintaining diesel engines on underground equipment. [2] This group had the task oflaying out the framework for the guidelines and providing input based on accumulatedexperience. The bulk of this work was done during a face to face brainstorming sessionwith all five members in the group with follow up afterwards in assembling the actualmaterials. The framework for the guidelines was broken down from two main categories,engine systems and operational issues. Each category was divided evenly in terms ofrelevance and importance to engine maintenance. The prioritized order of enginesystems became:
1) INTAKE2) EXHAUST3) FUEL INJECTION4) COOLING5) FUEL QUALITY AND HANDLING6) LUBRICATION
Beyond the six-system approach the group identified additional key areas that are criticalto proper engine maintenance. These are broken down under operational issues:
1) ATTITUDES2) TRAINING3) TOOLS4) PROCESS AND PRACTICES5) PM & ENGINE REPAIRS
The first version of the guidelines and best practices was brought into use at the mineafter the first 2 months of measuring emissions and gathering baseline values. Ameeting was held with mine staff to discuss the results of the baseline emissions and tore visit the results from the audit. The guidelines and best practices were brought out atthis time to compare against the audit and build an action plan for implementingimproved maintenance. The action plan consisted of:
1) IMPROVE FUEL AND LUBE HANDLING2) REWORK PM STRUCTURE AROUND ENGINE SYSTEM APPROACH3) NEW TOOLS4) TRAINING – INDIVIDUAL AND CASE STUDY APPROACHES5) FOCUS ON EACH ENGINE SYSTEM AND IMPROVING ON EACH

Page 16
Each point in the action plan had a link back to the guidelines and best practices. Fueland lube handling was well defined in the guidelines and used as a start in planning howto clean up the existing system for handling fuel and lube cubes. The engine PMstructure was very unspecific in nature and was rebuilt with particular focus on eachsystem in accordance with the guidelines. New tools were included in the project fromthose described in the guidelines as well as some that were developed as a result ofdiscussion with the mine team and later added to the guidelines. The best example ofthis is the intake testing system described in the current version of the guidelines andbest practices. The use of ether spray was not possible for testing intake systems so analternative method was required. The team at the mine came up with the idea ofpressurized testing with soap and water, which proved to be extremely effective.
The guidelines and best practices has been a continuous work in progress with newideas added as the project moved on and even beyond the completion of the field work.A document of this nature should, and will continue to evolve as ideas are sharedamongst peers and technologies evolve. The guidelines and best practices are includedin the appendix section of the report.

Page 17
EEEMMMIIISSSSSSIIIOOONNNSSS TTTEEESSSTTT EEEQQQUUUIIIPPPMMMEEENNNTTT
IIINNNTTTRRROOODDDUUUCCCTTTIIIOOONNN
The first step in doing the field work at Strathcona Mine was to set up the emissionstesting equipment that would be used throughout the project as the method ofmeasurement for progress from start to finish. A system was assembled that was basicenough in design for mechanics to be able to train and perform regular emissions testson their own at scheduled maintenance intervals.
The emissions testing system was comprised of a component for measuring undilutedgas emissions in parallel with a component for measuring undiluted particulateemissions. The most critical component was the testing protocol which brought thesampling components together in a repeatable sequence that the mechanics couldfollow to perform consistent tests throughout the project on their own.
UUUNNNDDDIIILLLUUUTTTEEEDDD EEEXXXHHHAAAUUUSSSTTT GGGAAASSS MMMEEEAAASSSUUURRREEEMMMEEENNNTTT
The framework for the emissions testing was built around the Undiluted Gas AnalysisSystem (UGAS) developed by Noranda Technology Centre.[3] This system incorporatesan ECOM AC electronic gas analyzer for measurement of gases using electro-chemicalsensor technology as well as sensors for temperatures and pressures. The analyzer iscapable of communicating data through an RS-232 communication interface. The UGASsoftware application was developed specifically for communicating with the ECOManalyzer. The Windows interface was developed to be an intuitive tool for mechanics touse in diagnosing engines. A testing protocol was built into the testing system so as toguide the mechanics through the sampling process so that the tests could be repeatableand accurate for comparison purposes. The gas analyzer, personal computer andrelated hardware are all assembled in an industrial enclosure on wheels capable ofbeing rolled to a vehicle for engine and emissions diagnostics.

Page 18
Figure 1 - Emissions Testing System
ECOM AC+ Gas AnalyzerThe first component is a commercially available ECOM AC+ electronic gas analyzer,which measures oxygen, carbon monoxide, nitrogen oxide, nitrogen dioxide, gastemperature, and gas pressure. All gas sensors are electro-chemical with athermocouple and RTD sensor for temperatures, and a piezo resistive sensor forpressure. From the measured parameters the analyzer also calculates additionalparameters such as carbon dioxide, total oxides of nitrogen and combustion efficiency.The instrument can incorporate up to six gas sensors, however sulphur dioxide andhydrocarbons sensors are not being used in the UGAS system. A probe and 15 feet ofnon-heated sampling line connect the analyzer to the exhaust system. Each exhaustsystem is fitted with ¼” NPT fittings for measuring undiluted exhaust through the probe.

Page 19
Parameter Description
Measured Parameters Range Accuracy ResolutionOxygen (O2) 0 - 21% 2% of reading 0.1%Carbon Monoxide (CO) 0 - 4000 ppm 4% of reading 1 ppmNitric Oxide (NO) 0 - 4000 ppm 4% of reading 1 ppmNitrogen Dioxide 0 - 500 ppm 4% of reading 1 ppmSulfur Dioxide (SO2) 0 - 5000 ppm 4% of reading 1 ppmCombustibles (CxHy -Hydrocarbons)
0 - 6 % 4% of reading 0.01%
Ambient Temperature 0 - 250° F 3 degrees 1° FStack Temperature 0 - 1600° F 3 degrees 1° FStack Draft 0 - 40.0” H2O 2% of reading 0.01” H2O
Calculated Parameters Range ResolutionCombustion Efficiency 0 - 100% 1.0%Carbon Dioxide (CO2) 0 - 40% 0.1%Lambda (λ) 0 - 50% 0.01%Losses 0 - 100% 1.0%O2 Correction 0 - 10,000 ppm 1 ppm
The instrument is capable of operation as a stand-alone device, which can acquire gasparameters and print out results. Operations can be performed using the membranekeypad and LCD display. Instantaneous snapshots can be saved into analyzer memoryand printed out. Each subsequent sample erases the previous sample from memory. Asa stand-alone device the instrument lacks the flexibility to acquire time weighted averagesamples and store historical data in memory. To overcome this the RS232 serialcommunication port on the analyzer was utilized. This port communicates all data in realtime as it is acquired from the sensors. Communicating this real time data to a softwareinterface permits the flexibility required to store time weighted average samples to anintegrated database.
Figure 2 - ECOM Gas Analyzer

Page 20
UGAS Software ApplicationThe second module of the system is a custom designed Windows software applicationthat communicates directly with the analyzer displaying in real time all measured andcalculated values. The interface was designed to be as intuitive as possible for theintended end users, underground mobile mechanics. The gauge controls in the softwareas shown in figure 3, permit the user to configure warning and alarm display levels foreach parameter. The gauge control display window has the flexibility to configure anycombination of parameters up to a maximum of eight on each of the two windows.
Figure 3 - UGAS Software
The remaining three main display windows are for graphic chart analysis, customfunction editing, and databases. The chart analysis window has a list of query filters toselect from in querying historical databases. Filters include vehicle number, vehicle type,location, dates and other related fields. The results of each query are displayed in anadjacent graphic analysis screen with flexibility to arrange the data in several differentformats.
A function calculator screen is provided to the user for customizing parameters. Thefunction calculator screen allows the creation of custom mathematical functions betweenthe acquired parameters in the database. An example of this is NOx, which is the sum ofNO +NO2. As functions are created they are added to the list of parameters and draw on

Page 21
the historical data to calculate individual values. Another feature of the function screen isa configuration menu for target values for each parameter on each type of engine.
The database is a series of tables that combine to provide functionality to the software,as well as detailed and descriptive historical data. Multi-level security access has beenbuilt into the application to ensure consistency in testing and protect the databases frompossible loss due to corruption.
Mechanics log into the application under low level security access and are provided withall necessary tools to conduct the sampling process from start to finish. They are alsoprovided with access to the graphic analysis tools for troubleshooting and evaluatingtrends. All configuration and database access tools are disabled under low level access.An integrated testing procedure has been built into the software to assist the mechanicsin testing emissions. A sequence of screens and menus guides the mechanic from startto finish in the testing process.
Lookup tables from the database provide automated entry of data such as descriptionidentifiers for each test. At the completion of a test the final screen provides a test reportfor the mechanic with measured values, target values, time, date, and user and vehicleinformation. He then has the option of printing the report and or saving the values to thelocal database.
A system administrator is responsible for maintaining the software configuration anddatabases. A large part of this responsibility is ensuring that the databases are backedup on a regular basis to protect the historical data. The software is capable of running ona network where other users are able to access the historical data to view emissionshistories and perform filtered searches on the database.
Testing ProtocolThe third and most critical component is the test protocol. In collaboration with CANMET,a standardized protocol for performing a complete undiluted exhaust test on U/G dieselengines was developed. The protocol accounts for all factors from pre test conditionsthrough engine loading factors to time weighted average sampling. Both pamphlets andon-line multimedia tutorials are provided to assist the mechanics and make the protocolas intuitive as possible. The test protocol is designed to ensure, to the greatest degreepossible, accurate and consistent testing of diesel exhaust emissions on undergroundmobile equipment.
Pre Test Conditions
Before taking tests the mechanic must ensure three basic conditions before proceeding:! Engine is at full operating temperature.! The vehicle exhaust is equipped with ¼” NPT fittings on each side of the exhaust
purifier(s). These fittings allow for the insertion of the analyzer probe to acquireundiluted exhaust samples.
! An instrument such as a hand held photoelectric tachometer is available formeasuring engine rpm during tests.

Page 22
Emissions Testing Protocol
Note:Exceeding a 60 second stall condition can potentially cause damage totransmission and hydraulic systems. Use of caution and careful monitoringof all temperatures is advised!
Start Analyzer and LogOn to UGAS Software3 Minute Calibration
Steady State Engine StallConverter & Hydraulics
Perform BacharachSmoke Test60 SecondsRead RPM
Enter Bacharach SmokeValue – RPM – Test ID
Proceed to GasSampling
Steady State Engine StallConverter & Hydraulics
Start Gas Sampling60 Seconds
Print and Save ResultsRepeat Test Opposite
Side
OOORRRExit

Page 23
UUUNNNDDDIIILLLUUUTTTEEEDDD DDDIIIEEESSSEEELLL PPPAAARRRTTTIIICCCUUULLLAAATTTEEE MMMEEEAAASSSUUURRREEEMMMEEENNNTTT
In addition to diesel exhaust gases which are easily and commonly measured, theparticulate component was also required to be measured and included for the project.Other than opacity instruments with a correlation to particulate, a portable instrument formeasuring undiluted diesel particulate is not commercially available.
Figure 4 - Simultaneous Gas and Particulate Sampling
CANMET has developed a simple portable system for sampling of undiluted particulatematter from vehicles in production. In this system the DPM sample is collected on a pre-weighted filter. After the sample collection, the filter is weighed again to get the totalweight of the sample collected during a fixed cycle. The sample is drawn using aconstant flow pump for the duration of a cycle. The volume of exhaust gas passedthrough the filter is obtained by the pump flow rate and sampling duration. The DPMconcentration is obtained by dividing particulate mass by the volume of exhaust gaspassed through the filter. In the original configuration, a sampling duration of 10 to 20minutes was employed at a flow rate of 2.5 LPM. However, for this project a higher flowrate for a shorter duration was required. To accomplish this the system was modified toaccommodate a Gilian high volume pump calibrated to 12 LPM for a 60 second duration.This was done so the mechanics would be able to take both the gas and particulatesamples simultaneously for the 60 second steady state stall condition.

Page 24
The system uses a stainless steel sampling probe which is inserted in the exhaust pipe.The sample probe is connected to a 15 foot heated line and to a filter cassette. Thesampling line is heated continuously using power from the vehicle battery. A properheated line is essential to make sure that there is no condensation in the sampling line.The sample on the filter is drawn using a calibrated constant flow pump. The systemincludes sampling probe, heated lines, filter cassette, moisture drier, constant flowpump, and temperature sensor. The temperature of the exhaust gas at the pumplocation is recorded by the ambient thermocouple form the ECOM analyzer which issimply fitted into the system. As with all other points from the ECOM analyzer, ambienttemperature was recorded as a time weighted average over the 60 second stall test. Inthis system no attempt was made for isokinetic sampling as bulk of the DPM is insubmicron size and, therefore, errors introduced due to partial inertia are consideredsmall and non-isokinetic sampling significantly simplifies the sampling system.
Figure 5 - Particulate Sampling System

Page 25
Figure 6 - UPSS Schematic

Page 26
AAANNNAAALLLYYYSSSIIISSS OOOFFF PPPAAARRRTTTIIICCCUUULLLAAATTTEEE SSSAAAMMMPPPLLLEEESSS
Measurement and analysis of the particulate sample filters was done at the NRCanCANMET laboratories in Sudbury and Bells Corners, Ontario. Weight analysis for totalmass was done at the Bells Corners facility and the analysis by NIOSH 5040 ThermalOptical method [4] was performed at the Sudbury laboratory.
Weight Analysis! Sample filters (silver membrane) were conditioned in an environment chamber for at
least 1 hr at 45% RH +-8%, 22oC +_3oC.! A Mettler 183 balance, accuracy 1g +-0.00001 g was calibrated using internal
calibration procedures.! A blank filter pair were weighed for determining filter weight changes due to
variations in conditions within the weighing chamber between initial and final sampleweight determinations.
! Sample filters were weighed and placed in plastic sample holders which were thencapped.
! Upon the sample filter's return, filters were removed from plastic sample holders,placed in petrie dishes, covered and conditioned in an environment chamber for atleast 1 hr at 45% RH +-8%, 22oC +_3oC.
! The Mettler 183 balance was calibrated using internal calibration procedures.! The blank filter pair were weighed.! Sample filters were then weighed.! DPM mass was determined by subtracting initial from the final sample weights,
correcting each DPM for changes in blank filter weights.! During the field testing 3 batches of sample cassettes were assembled with blanks
and shipped to the mine. The numbered cassettes were stored in a locker in theunderground shop and brought to the office on surface after sample capture.Cassettes including blanks were sent to the CANMET laboratory in Bells Corners foranalysis.
Thermal Optical Method
In brief, NIOSH method 5040, speciation of organic and elemental carbon isaccomplished through temperature and atmosphere control, and by an optical featurethat corrects for pyrolitically generated “EC” (or char) formed during the analysis of somematerials (e.g., cigarette and wood smoke). A light from a pulsed diode laser is passedthrough the filter to allow continuos monitoring of filter transmittance. The analysisprocess is done in two stages.
In the first stage, organic carbon and carbonate carbon (if present) are volatized from thesample in a pure helium atmosphere the temperature is stepped to a maximum (about860oC). Evolved carbon is catalytically oxidized to CO2 in a bed of granular MnO2,reduced to CH4 in a Ni/firebrick methanator, and quantified as CH4 by a flame ionizationdetector (FID).

Page 27
During the second stage of the analysis, a pyrolysis correction (if needed) and ECmeasurement are made. The oven temp is reduced, an Oxygen (2%)-helium mix isintroduced, and the oven temperature is again raised. As oxygen enters the oven,pyrolitically generated EC is oxydized and a concurrent increase in filter transmittanceoccurs. Correction for the char contribution to EC is accomplished by identifying thetime at which the filter transmittance reaches its initial value. This point is defined as the“split” between organic and elemental carbon. Carbon evolved prior to the split isconsidered “organic” (including carbonate), and carbon after the split and prior to thepeak used for instrument calibration (final peak) is considered “elemental.”
The 5040 method was used to analyze the first set of samples that were taken on quartzfiber filters. This was done due to inconsistencies measuring total weight due to highhumidity combined with quartz fiber filters. There were 21 samples in the first setanalyzed with 5040 and quartz fiber filters. For correlation purposes and verification ofaccuracy, three samples with silver membrane filters were measured with 5040 andcorrelated to previous samples on the same vehicles with quartz fiber.
CCCAAALLLIIIBBBRRRAAATTTIIIOOONNN OOOFFF IIINNNSSSTTTRRRUUUMMMEEENNNTTTAAATTTIIIOOONNN
ECOM AC+ Gas Analyzer
The electro-chemical gas sensors used in the ECOM unit are recommended forcalibration every 6 months. The analyzer for the project was purchased new from ECOMAmerica and was delivered with all sensors calibrated. The calibration gases used are:
Carbon Monoxide – 1000 ppmNitrogen Oxide – 100 ppmNitrogen Dioxide – 100 ppmOxygen – Verified against O2 concentration in NO or NO2 cal gas
The ECOM analyzer incorporates a 3-minute calibration each time the unit is started. Allgas sensors are “zeroed” against the ambient air drawn through the probe for the 3-minute period. For this reason it is critical that each time the analyzer is turned on theprobe remains in as fresh an ambient environment as possible and nowhere near anyrunning exhaust gases.
Particulate Sampling – Gilian Pump
The undiluted particulate sampling system incorporated a Gillan high volume 30 LPMpump for drawing the exhaust through the 37 mm cassettes. Under ideal conditions thisinstrument would be calibrated for each sampling session. In the case of this projecthowever, the mechanics were relied upon to conduct the tests on their own, unassisted.Calibration of this instrument was beyond the scope of the mechanics expected workand therefore had to be performed by project leader
Over the 6 month period of field work where the particulate sampling system wasemployed, the Gilian pump was calibrated a total of 7 times. A Gilibrator primary

Page 28
standard airflow calibrator was used for calibrating the pump. A 2 – 30 LPM flow cell wasused for generating pulsation bubbles to calibrate the pump at 12 LPM for the exhaustsampling. Calibration marks were put on the flow scale of the pump for the mechanics tocentre the flow ball for each test. The calibration setup included a 37 mm cassette filterassembly and a desiccant drier in line with the pump. All pump calibrations through theproject were found to be within + - 5% of the flow rate setpoint.
Figure 7 - Calibration of Gilian Pump
Page 29
AAACCCQQQUUUIIIRRRIIINNNGGG BBBAAASSSEEELLLIIINNNEEE EEEMMMIIISSSSSSIIIOOONNNSSS
IIINNNTTTRRROOODDDUUUCCCTTTIIIOOONNN
With the emissions testing equipment in place the next step in the project was to acquirean emissions baseline. A significant advantage in hosting the project at Strathcona Minewas the wide spectrum of engine technologies and manufacturers. The vehicles chosento be included in the study were all scooptrams with mid to high range horsepowerengines. This decision was taken in order to cover the highest horsepower range in themine as well as facilitating the emissions testing protocol of full load steady state –converter and hydraulic stall. Many light duty vehicles either use manual transmissionsand or do not incorporate a hydraulic system for loading the engines. The one exceptionto this case was the inclusion of a Caterpillar M120 grader with a 3304T engine. Thisvehicle was included for a broader spectrum with a Caterpillar mechanically injectedengine in the project.
In parallel to acquiring the emissions baseline the mechanics were individually trained totake accurate and repeatable tests. In total 16 mechanics and leaders were trained touse the emissions testing equipment and follow the test protocol. On average, trainingfor each mechanic took four hours. During the training for each person the project goalswere explained and specifically the baselining stage of the project. Each mechanic wasmade aware that for this first stage we would only be measuring emissions withoutmaking any changes to current maintenance practices. The instinct to investigate andsolve problems detected with emissions testing would come into play later in theimplementation stage of the project. This point of not making any changes orimprovements during baselining was strongly emphasized with each mechanic.
VVVEEEHHHIIICCCLLLEEESSS AAANNNDDD EEENNNGGGIIINNNEEESSS
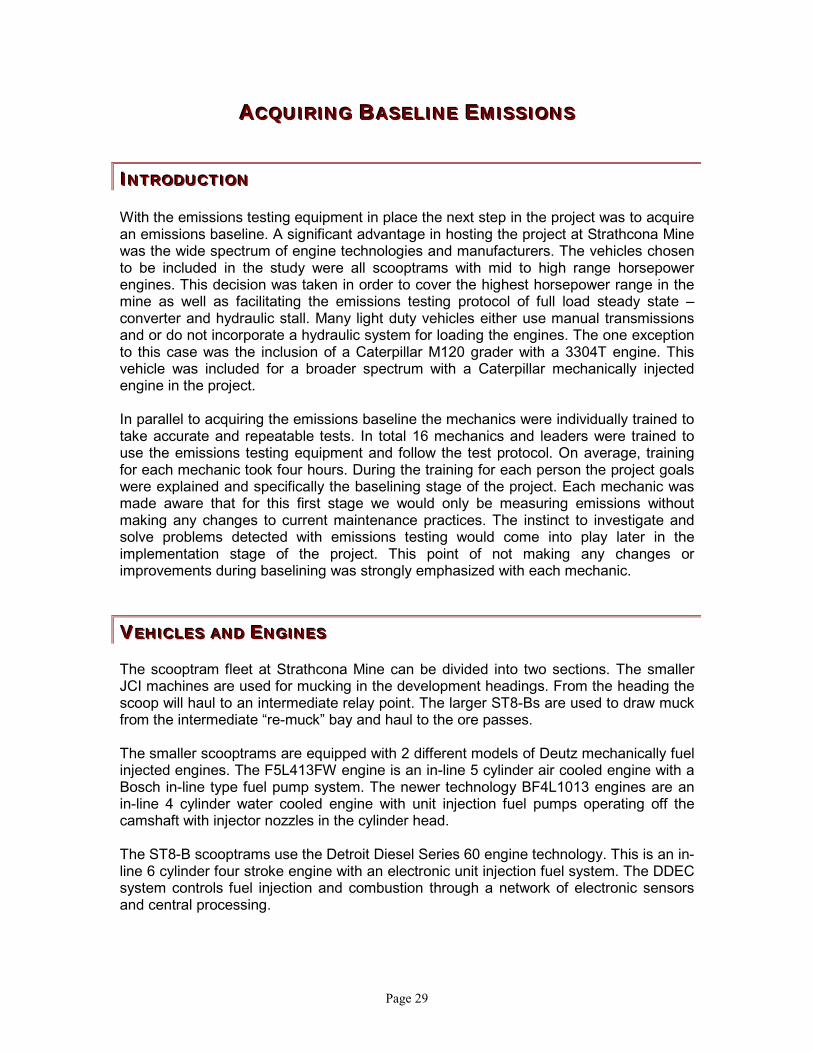
The scooptram fleet at Strathcona Mine can be divided into two sections. The smallerJCI machines are used for mucking in the development headings. From the heading thescoop will haul to an intermediate relay point. The larger ST8-Bs are used to draw muckfrom the intermediate “re-muck” bay and haul to the ore passes.
The smaller scooptrams are equipped with 2 different models of Deutz mechanically fuelinjected engines. The F5L413FW engine is an in-line 5 cylinder air cooled engine with aBosch in-line type fuel pump system. The newer technology BF4L1013 engines are anin-line 4 cylinder water cooled engine with unit injection fuel pumps operating off thecamshaft with injector nozzles in the cylinder head.
The ST8-B scooptrams use the Detroit Diesel Series 60 engine technology. This is an in-line 6 cylinder four stroke engine with an electronic unit injection fuel system. The DDECsystem controls fuel injection and combustion through a network of electronic sensorsand central processing.
Page 30
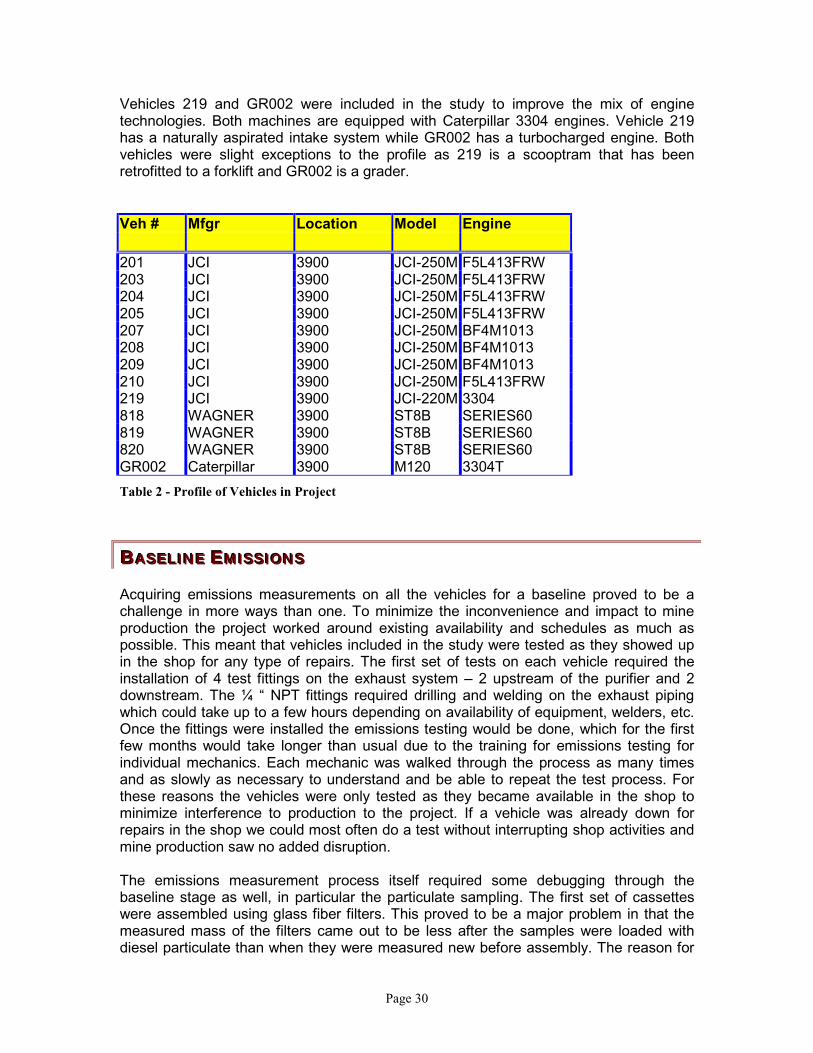
Vehicles 219 and GR002 were included in the study to improve the mix of enginetechnologies. Both machines are equipped with Caterpillar 3304 engines. Vehicle 219has a naturally aspirated intake system while GR002 has a turbocharged engine. Bothvehicles were slight exceptions to the profile as 219 is a scooptram that has beenretrofitted to a forklift and GR002 is a grader.
Veh # Mfgr Location Model Engine
201 JCI 3900 JCI-250M F5L413FRW203 JCI 3900 JCI-250M F5L413FRW204 JCI 3900 JCI-250M F5L413FRW205 JCI 3900 JCI-250M F5L413FRW207 JCI 3900 JCI-250M BF4M1013208 JCI 3900 JCI-250M BF4M1013209 JCI 3900 JCI-250M BF4M1013210 JCI 3900 JCI-250M F5L413FRW219 JCI 3900 JCI-220M 3304818 WAGNER 3900 ST8B SERIES60819 WAGNER 3900 ST8B SERIES60820 WAGNER 3900 ST8B SERIES60GR002 Caterpillar 3900 M120 3304T
Table 2 - Profile of Vehicles in Project
BBBAAASSSEEELLLIIINNNEEE EEEMMMIIISSSSSSIIIOOONNNSSS
Acquiring emissions measurements on all the vehicles for a baseline proved to be achallenge in more ways than one. To minimize the inconvenience and impact to mineproduction the project worked around existing availability and schedules as much aspossible. This meant that vehicles included in the study were tested as they showed upin the shop for any type of repairs. The first set of tests on each vehicle required theinstallation of 4 test fittings on the exhaust system – 2 upstream of the purifier and 2downstream. The ¼ “ NPT fittings required drilling and welding on the exhaust pipingwhich could take up to a few hours depending on availability of equipment, welders, etc.Once the fittings were installed the emissions testing would be done, which for the firstfew months would take longer than usual due to the training for emissions testing forindividual mechanics. Each mechanic was walked through the process as many timesand as slowly as necessary to understand and be able to repeat the test process. Forthese reasons the vehicles were only tested as they became available in the shop tominimize interference to production to the project. If a vehicle was already down forrepairs in the shop we could most often do a test without interrupting shop activities andmine production saw no added disruption.
The emissions measurement process itself required some debugging through thebaseline stage as well, in particular the particulate sampling. The first set of cassetteswere assembled using glass fiber filters. This proved to be a major problem in that themeasured mass of the filters came out to be less after the samples were loaded withdiesel particulate than when they were measured new before assembly. The reason for

Page 31
this was determined to be a problem with the compression of the 37 mm plastic cassetteassemblies and a crushing action on the glass fiber filters. The end result was a negativemass value for each of the glass fiber samples taken in the first set. To compensate forthis each of the samples was also analyzed using the Thermal Optical – NIOSH 5040method to determine the total carbon value along with the split between elemental andorganic carbon. For this reason some of the DPM values shown in the tables below willbe indicated as total carbon (TC) instead of the standard mass measurement.
There were also some problems for the first month or two with getting repeatablesampling for every sample on particulates. The mechanics were able to go through theprocess for testing gas emissions because the process was heavily integrated andautomated, although there was the occasional case of improper steady state stallconditions or advance warm up. Following the steps for particulate sampling at the sametime as gas sampling proved to be more of a challenge for the first while. While themechanic took the gas test he had to perform several steps such as positioning thecassette in the sampling line, setting the pump flow, and timing the start and finish of thesample. When the mechanics were on afternoon or night shift and tried to do tests ontheir own some of the samples would be either taken improperly or not at all. The testslogged in the database would show up as gas emissions values only with nothingentered for particulates. Through the course of the baselining stage we were able tocorrect these problems with better training and instructions for the mechanics.
All of the situations described above should help explain any obvious discrepancies inthe baseline emissions tables below. Some of the vehicles show very few tests doneover the baseline period while others have many. This is due to the availability in theshop for these vehicles to have tests performed. The vehicle emissions baselines shownbelow are for those vehicles that were selected for the case studies later in theimplementation stage of the project. This gives a comparison of the baseline values hereto the emissions with improved maintenance in the case study. The emissions values forall vehicles in the project were formatted in an Excel spreadsheet file. Due to the sheersize of the amount of raw data for all emissions tests on all vehicles in this file, only thefour vehicles from the case studies are explained in detail here.
207 Scooptram
Test Desc O2 CO CO2 NO NO2 Smoke DPM% ppm % ppm ppm Index mg/m3
1 UPSTR 11.80 184.17 6.73 442.37 32.47 9 6.00
2 DNSTR 12.97 32.00 5.88 374.77 25.37 9 143.00
Table 3 - Baseline Emissions 207 Scoop
Unfortunately 207 was one of the rare situations where we were only able to performone set of emissions tests in the baseline stage. The gas emissions values appear to befairly consistent with other 1013 series Deutz engines that were tested in the project.The excellent CO conversion efficiency is certainly consistent with all scooptrams of thismodel. The DPM values however, are definitely inconsistent. Both samples were takenusing silver membrane filters, which proved to be very consistent through the project, but

Page 32
the extremely low value for the first sample indicates a problem possibly with the takingof the sample. On the other hand, the second DPM value would appear to be higherthan normal, which could also be explained as before.
818 Scooptram
Test Desc O2 CO CO2 NO NO2 Smoke DPM% ppm % ppm ppm Index mg/m3
1 No DOC 10.88 170.9 7.43 2322.27 35.53 6 *5.6
2 No DOC 11.1 116.83 7.3 1439.13 24.2 7 *5.5
3 No DOC 12.51 118.2 461.7 15.5 7
4 No DOC 13.23 127.13 5.69 307.03 17.53 7
5 No DOC 10.83 95.233 7.48 617.47 22.3 8
6 No DOC 12.67 100 6.12 392.43 22.47 6
7 No DOC 12.15 123.44 6.48 393.53 16.95 9 7.5
8 No DOC 13.02 130.31 5.83 289.98 18.42 6 9.17
9 No DOC 12.81 156.08 6.02 401.64 12.73 9
10 No DOC 13.36 175.55 5.59 432.39 13.11 7
11 No DOC 12.58 126.27 6.16 802.62 17.82 9 8.33 Total Carbon measured using Thermal Optical method *
Table 4 - Baseline Emissions 818 Scoop
In the instance of 818 we were able to take many tests. What appears to be 11 separatetests is actually 5 sets of tests (upstream / downstream) and 1 separate test. Originally itwas thought that this machine was equipped with a diesel oxidation catalyst (DOC)identical to all the rest. Later in the project but before the case study it was discoveredthat in fact under the insulation wrap on the exhaust system there was only a silencerwith no purifier. Therefore on tests 1 thru 10 although they indicate simply “No DOC”they are in fact 5 sets of tests upstream and downstream of the silencer!
The gaseous emissions show fairly good consistency both with respect to this individualmachine as well as others with Series 60 Detroit Diesel engines. The particulateemissions are fairly representative as well and certainly consistent with the other Series60 engines. It is also interesting to note the fairly good correlation between the ThermalOptical samples at the top compared to mass – total weight analysis.

Page 33
820 Baseline
Test Desc O2 CO CO2 NO NO2 Smoke DPM% ppm % ppm ppm Index mg/m3
1 UPSTR 10.39 82.97 7.8033 537.53 27.33 6 *2.9
2 DNSTR 10.28 62.47 7.82 569.3 30.23 7 *3.9
3 UPSTR 9.6 70.33 8.4 1811.77 151.77 3 13.33
4 DNSTR 18.2 0 2.1 55.57 2.2 6 5.83
5 UPSTR 19.37 25.6 1.1933 129 12.47
6 DNSTR 14.92 46.13 4.4627 291.93 26.36* Total Carbon measured using Thermal Optical method
Table 5 - Baseline Emissions 820 Scoop
We had the opportunity to acquire 3 sets of emissions tests on 820 during the baseline.Once again the DPM values correlate fairly well between Thermal Optical and massmeasurement as well as consistent with other Series 60 engines.
GR002 Baseline
Test Desc O2 CO CO2 NO NO2 Smoke DPM% ppm % ppm ppm Index mg/m3
1 UPSTR 14.60 284.27 4.68 188.53 50.70 9
2 DNSTR 14.70 215.30 4.60 208.47 27.00 9
3 UPSTR 15.13 319.40 4.29 235.90 49.83 9 151
4 DNSTR 15.25 259.60 4.25 252.83 24.60 9 116
5 UPSTR 15.51 201.16 4.04 247.31 33.18 8 135.83
6 DNSTR 15.57 193.34 3.96 225.01 17.42 8 114.17
7 UPSTR 15.30 288.67 4.20 271.58 63.31 9
8 DNSTR 15.22 179.69 4.28 294.99 36.18 9
Table 6 - Baseline Emissions GR002 Grader

Page 34
In total there were 4 sets of tests done on the grader during baselining. The gaseousemissions values are very consistent between all sets. This was the only engine in thestudy of its type so there are no other engines to compare against in this case. Theparticulate emissions, although only sampled for 2 of the 4 sets also show goodconsistency. The DPM samples were acquired using silver membrane filters and totalmass measurement.

Page 35
IIIMMMPPPLLLEEEMMMEEENNNTTTIIINNNGGG IIIMMMPPPRRROOOVVVEEEDDD EEENNNGGGIIINNNEEE MMMAAAIIINNNTTTEEENNNAAANNNCCCEEE
IIINNNTTTRRROOODDDUUUCCCTTTIIIOOONNN
Upon completion of the baselining phase of the project a team meeting at Strathconawas held to discuss what the next steps would be in implementing improvements to thecurrent engine maintenance system. The first step was to review the results of thebaseline emissions testing and have a second look at the results from the enginemaintenance audit that had been done at Strathcona a few months earlier. The secondstep was to make a short list from the audit results of the most easily do-ableimprovements with respect to time, resources, cost and complexity. The final step was totake the list of improvements and look to the Guidelines and Best Practices for a solutionto each.
MMMAAAIIINNNTTTEEENNNAAANNNCCCEEE PPPRRROOOCCCEEESSSSSS IIIMMMPPPRRROOOVVVEEEMMMEEENNNTTTSSS
Changes to the existing process for maintaining engines at Strathcona would be thelargest in scope and therefore the most challenging to implement. In some caseshowever, the items addressed had been internally discussed by mine management inthe past and therefore were simply justification for completing past commitments.
Fuel and Lubrication Oil Management and HandlingThis was one of the more obvious weaknesses discovered during the audit and was anitem that had been addressed by mine management in the past. A survey of thehandling and storage system for managing fuel and lube oils revealed that there waslittle if any accountability for any mine department in maintaining the plastic cubereservoirs. These reservoirs are moved between surface and the underground fuel bays.Empty cubes are brought to surface where they are refilled from bulk storage and thenbrought back underground. The problem was that no responsibility and follow up hadbeen given to maintaining and cleaning the cubes between emptying and filling. A tour ofthe underground fuel bays revealed both fuel and lube cubes contaminated with dirt,garbage and water inside as well as fill covers cracked or broken leaving the contentsexposed to contamination from the atmosphere. Discussions with mechanics revealedchronic problems with this system and reports of water contamination while filling enginecrankcases with fresh lube oil during PM service.
The solution to the problem was quite simple and easy to implement. A service contractwas given to an off site contractor to maintain the cubes on a scheduled basis. Eachcube was given an identification code and scheduled to be sent out for service. Servicewould include complete inspection, cleaning inside and out, and structural repairs asrequired. The entire inventory of fuel and lube cubes was set into a rotating schedule forservice.

Page 36
Figure 8 - Lube Cube Before Service
Figure 9 - Lube Cube After Service

Page 37
Engine Lube OilIt was discovered that Strathcona had two separate engine lube oils in use. The primaryengine lube oil was a recycled 30 grade oil supplied from Breslube. This oil was used forengine crankcases in all mobile equipment except for the Detroit Diesel Series 60engines in the ST8-B scooptrams. The recycled 30 oil was managed in bulk with thecube reservoirs explained above. The second lube oil in use was a 15W40 multi gradeoil used for the Series 60 engines only based on the strong recommendations fromDetroit Diesel. This oil was managed in both 5 gallon plastic pails as well as 1 liter plasticcontainers. The oils classifications for each were applied to the chart in the Guidelinesand Best Practices for applicability.
! Recycled 30 Oil CC Rating! 15W40 Oil CH-4 Rating
Classification“Commercial”
Application Meets OEMRequirements for:
CC Moderate to severe duty diesel and gasoline MIL-L-2104B; 1964CH-4 Severe duty diesel engine service High speed, 4-stroke
engines since 1998
Upon further investigation it was discovered that the CC rated oil was currentlyrecommended for topping up purposes only and not for primary engine crankcaselubrication oil.
For these reasons the decision was taken to discontinue the use of the recycled 30 oil atStrathcona in favour of one standard premium multi grade oil maintaining a CH-4 rating.
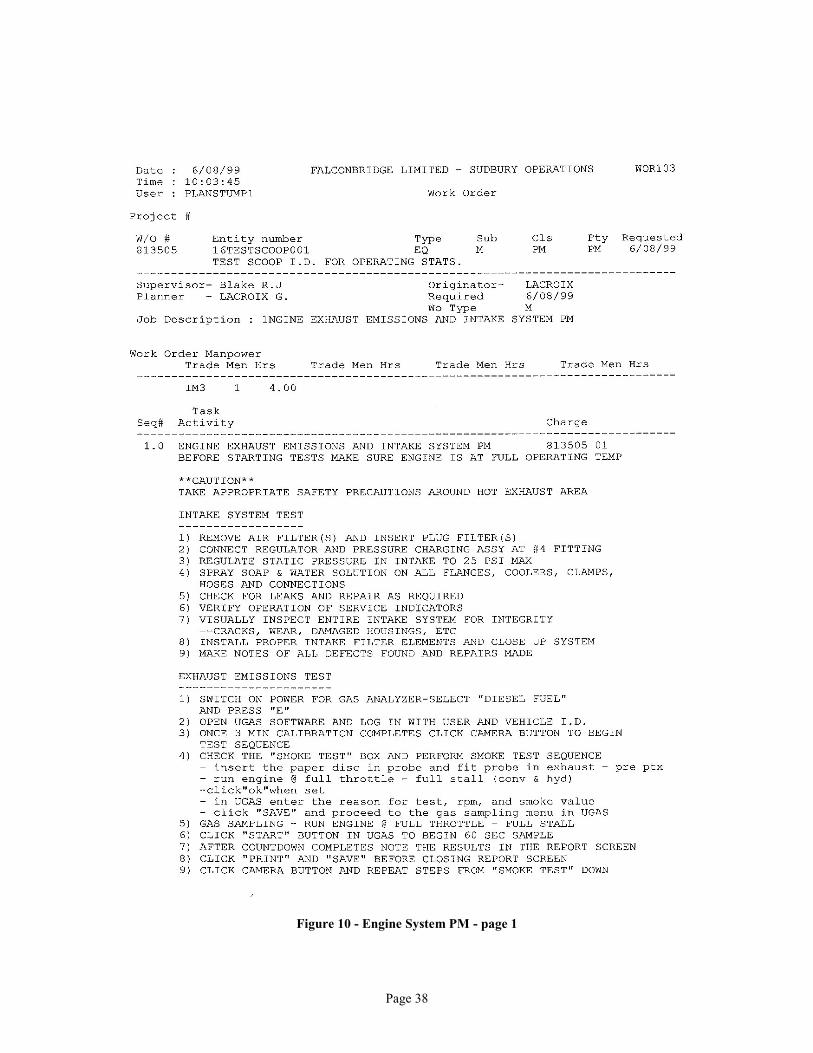
Restructuring Engine PMs – System ApproachThe existing scheduled Preventive Maintenance (PM) routine on mobile equipment atStrathcona was felt to lack the proper focus on specific systems with respect to engines.It was agreed that the existing PM details remained valid and necessary but thatadditional points had to be added specifically to deal with engine system diagnostics.The new knowledge, skills, training and tools that were implemented as part of thisproject needed to be incorporated into the PM structure. In order that this would workeffectively and be accepted by the mechanics a separate engine diagnostic evaluationPM was created to allow mechanics sufficient time and focus to prove and practice thecondition based maintenance principles. The engine system diagnostic PMs werescheduled separately from the other standard PM and allowed the mechanics sufficienttime to make all the checks on the list and objective evaluations. The list wasconstructed based on the engine system approach in the Guidelines and Best Practicesand the new tools implemented as part of the project. Frequency for the enginediagnostic PMs was set at 250 hours in parallel with the vehicle PMs and in accordancewith engine manufacturers recommended service intervals.
Page 38
Figure 10 - Engine System PM - page 1

Page 39
Figure 11 - Engine System PM - page 2
Page 40
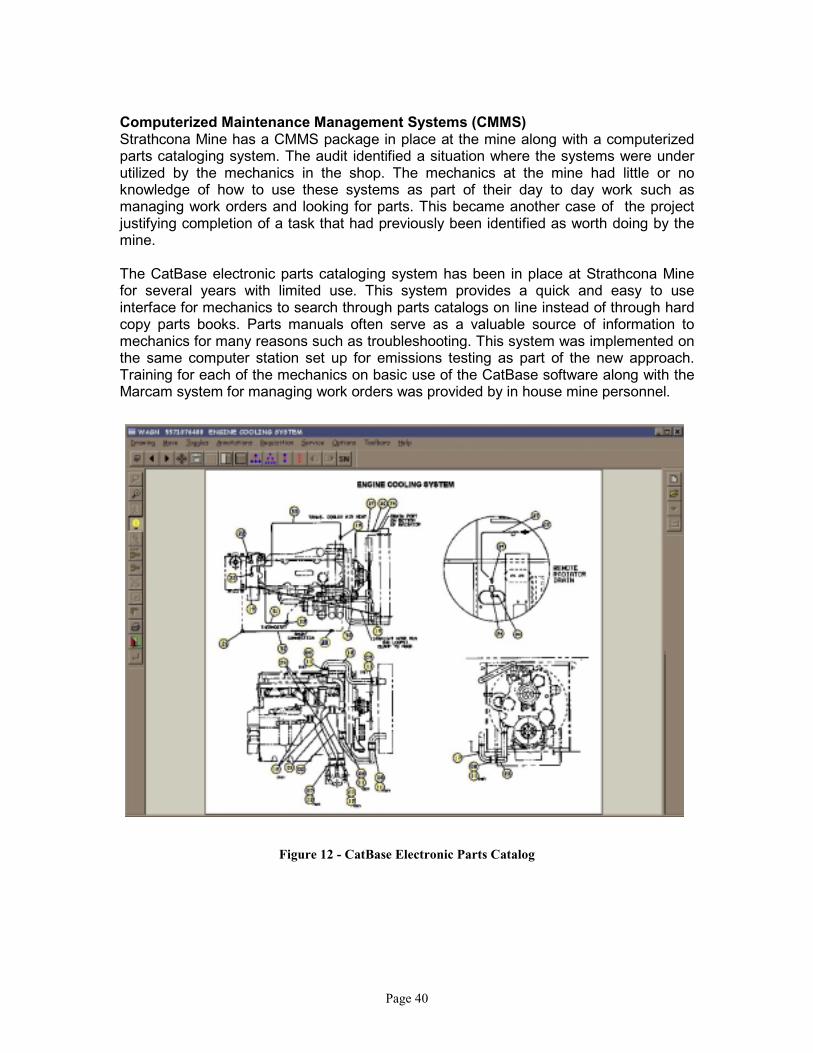
Computerized Maintenance Management Systems (CMMS)Strathcona Mine has a CMMS package in place at the mine along with a computerizedparts cataloging system. The audit identified a situation where the systems were underutilized by the mechanics in the shop. The mechanics at the mine had little or noknowledge of how to use these systems as part of their day to day work such asmanaging work orders and looking for parts. This became another case of the projectjustifying completion of a task that had previously been identified as worth doing by themine.
The CatBase electronic parts cataloging system has been in place at Strathcona Minefor several years with limited use. This system provides a quick and easy to useinterface for mechanics to search through parts catalogs on line instead of through hardcopy parts books. Parts manuals often serve as a valuable source of information tomechanics for many reasons such as troubleshooting. This system was implemented onthe same computer station set up for emissions testing as part of the new approach.Training for each of the mechanics on basic use of the CatBase software along with theMarcam system for managing work orders was provided by in house mine personnel.
Figure 12 - CatBase Electronic Parts Catalog
Page 41
NNNEEEWWW TTTOOOOOOLLLSSS FFFOOORRR MMMAAAIIINNNTTTAAAIIINNNIIINNNGGG EEENNNGGGIIINNNEEESSS
Another critical component in improved engine maintenance was the integration of newtools that could best fit the scope of engine maintenance that the mechanics in theunderground shop were responsible for. This would mean that new tools would befocused on the basics of engine diagnostics and repair. The mix of new tools would be acombination of the most technically simple and basic to the latest in computer baseddiagnostics. The common thread between them was that they were all developed tofocus on engine basics and were usable by any mechanic regardless of technologicalskill level. This was in keeping with the general theme of the project in “Doing the BasicsBetter”.
UGASThe UGAS system was the first tool implemented with the mechanics at StrathconaMine. As described previously in the emissions testing section, this system wasdesigned specifically for mechanics to take emissions measurements for diagnosingengines. Implemented as part of the new engine PM structure, the mechanics weretrained from the beginning of the project on how to take a set of emissions tests as partof each scheduled PM. This was the only exception where a new tool was introducedfrom the beginning of the project instead of during the implementation stage. Not onlywas this necessary for acquiring baseline emission values, but it also proved valuable increating a smooth transition from the old ways to a new philosophy for maintainingengines. During individual training with each mechanic on UGAS, each was not onlytrained on how to take emissions tests but also on why it is important and the reasoningbehind the maintenance project. This individual training took better than two months tocover all 16 mechanics but proved invaluable in gaining their acceptance and gettingready for the changes and new tools to come.
Intake TestingThe intake system can easily be considered the most critical with respect tomaintenance and emissions. Ironically the intake system has the least known tools forservicing. In the past ether spray was used for detecting intake leaks by listening forengine acceleration where ether would leak by into the intake and combustion chamber.Problems with ether including extreme flammability and potential catastrophic enginefailure when improperly used have led to the discontinuation of its use. This situation lefta huge gap where the only activity associated with intake systems was the regularreplacement of air filter elements and blind faith that this practice alone was sufficient.
As part of the project, the team at the mine put together a system for methodicallytesting intake systems with no risks to either the person doing the test or the engine. Thesystem was simply a used intake filter element sealed externally with duct tape, an airpressure regulator and hose assembly, and a spray bottle containing a mixture of soapand water. During service the plugged filter element(s) is installed in the intake housingand the air pressure regulator is connected to a fitting on the intake. Compressed air isregulated inside the intake system to no more than 5 psi for safety reasons. Even withthe leakage across valves and turbocharger enough static pressure remains in thesystem to produce bubbles when the soap and water solution is sprayed on all hosesand connections. This system is explained in detail in the Guidelines and Best Practices.
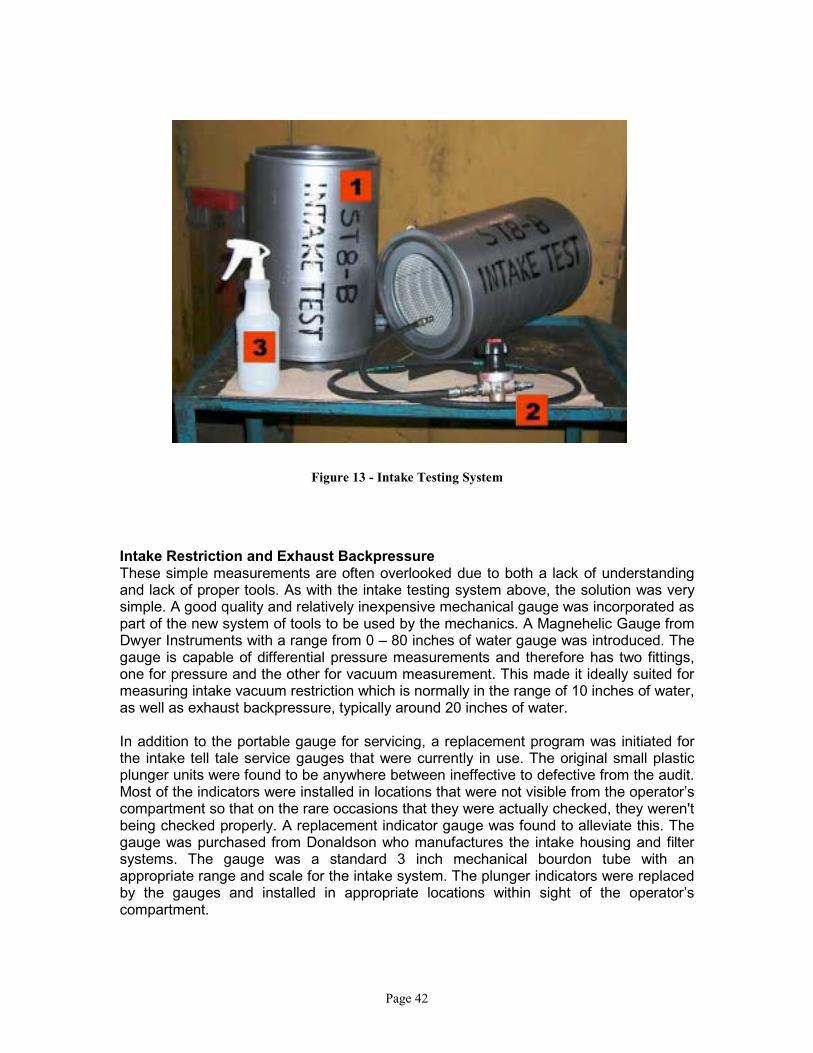
Page 42
Figure 13 - Intake Testing System
Intake Restriction and Exhaust BackpressureThese simple measurements are often overlooked due to both a lack of understandingand lack of proper tools. As with the intake testing system above, the solution was verysimple. A good quality and relatively inexpensive mechanical gauge was incorporated aspart of the new system of tools to be used by the mechanics. A Magnehelic Gauge fromDwyer Instruments with a range from 0 – 80 inches of water gauge was introduced. Thegauge is capable of differential pressure measurements and therefore has two fittings,one for pressure and the other for vacuum measurement. This made it ideally suited formeasuring intake vacuum restriction which is normally in the range of 10 inches of water,as well as exhaust backpressure, typically around 20 inches of water.
In addition to the portable gauge for servicing, a replacement program was initiated forthe intake tell tale service gauges that were currently in use. The original small plasticplunger units were found to be anywhere between ineffective to defective from the audit.Most of the indicators were installed in locations that were not visible from the operator’scompartment so that on the rare occasions that they were actually checked, they weren'tbeing checked properly. A replacement indicator gauge was found to alleviate this. Thegauge was purchased from Donaldson who manufactures the intake housing and filtersystems. The gauge was a standard 3 inch mechanical bourdon tube with anappropriate range and scale for the intake system. The plunger indicators were replacedby the gauges and installed in appropriate locations within sight of the operator’scompartment.

Page 43
Figure 14 - Magnehelic Gauge For Intake And Exhaust
Figure 15 - Intake Service Indicator Gauges on ST8-B

Page 44
Temperature ProbeA portable infrared temperature probe was introduced to the mechanics specifically fordiagnosing cooling systems. This was a simple hand held instrument that measuressurface temperature with a simple point and shoot operation. An LCD display on theinstrument updates the value instantly or is capable of logging the value to memory. Thiswas particularly effective in demonstrating and diagnosing cooling systems. In secondsthe efficiency of a radiator could be verified by measuring the differential temperaturefrom top to bottom. Thermostat operation was easily verified by pointing at thethermostat housing and observing the temperature transition as the thermostat openedand closed.
Detroit Diesel Diagnostic LinkThe challenge of measuring and analyzing engine performance has grown and at thesame time been simplified with the implementation of electronically controlled engines.Detroit Diesel has long been a leader in this area and the use of DDEC enginetechnology in underground mining equipment has been growing rapidly. Other enginemanufacturers are also providing electronically controlled engine technology as well.While the technology has proven to be very effective from a performance and costperspective, maintaining these engines requires a new approach with special knowledgeand special tools.
In order to diagnose the DDEC system a communication interface is required to translatethe electronic signals into meaningful information that mechanics can understand. Themost popular system in use until recently was the ProLink hand held reader whichinterpreted DDEC signals onto an LCD screen display. The mechanic would read theinformation and transmit commands to the engine from the keypad and screen menuson the reader. Although this is a very powerful tool that provides total communicationand control capability with the engine, it lacks an intuitive interface and is oftenintimidating to mechanics.
The next generation for this tool is now commercially available from Detroit Diesel and isknown as Detroit Diesel Diagnostic Link (DDDL). It takes the exact same communicationprotocol from the engine and replaces the interface with a Windows software applicationand graphic user interface that is much more intuitive to mechanics. The dynamicdisplays and visual controls present the information in a manner that is easy to read andunderstand. Navigation is very straightforward and can be mastered by mosttradespeople in less than an hour of training. The software has the added benefit ofincorporating the diagnostic flowcharts form the engine service manuals into thepackage as a standard help file to guide the mechanics through the troubleshootingprocess online without leaving the engine. The primary components of the tool are:
! Display of measured and cumulative engine data! Integrated diagnostics and troubleshooting – eg: Cylinder Cutout Test! Engine configuration and calibration! Integrated technical and service information
The tool comes with the software package and a communications translator box thatconnects the engine diagnostic connector to an RS232 serial connection on a PC. The

Page 45
system was incorporated into the project and installed on the diagnostic workstation PCwith the emissions testing apparatus. Mechanics from all four crews were trained onbasic use of the system. It was then implemented as part of the engine systemdiagnostic PM for the Series 60 DDEC engines. The PM checkpoints for the DDDL areshown on the Engine System PM form back in Figure 11.
Figure 16 - DDDL
Information UtilitiesA common problem in underground mobile maintenance facilities is readily accessibleinformation. Mechanics are often frustrated by time consuming searches for serviceinformation, specifications, or simple calculations.
Noranda Technology Centre had developed a set of basic software utilities in previousmaintenance work. The set was made available for this project and installed with the restof the software tools on the diagnostic workstation PC. While the tools are very basic bynature, they provide quick and easy access to a wide range of information. The utilitiesincluded:
! An equipment specification lookup tool! A conversion utility for units of measure! A conversion utility for taps and drill bits! The standard Windows calculator

Page 46
Figure 17 - Equipment Specification Lookup
TTTRRRAAAIIINNNIIINNNGGG
At the post baseline meeting the project team put together a general plan for training themechanics within the project objectives. Once again this was an issue that overlappedan existing commitment at the mine for providing training and upgrading. The projectwas a good fit within the company training objectives and it was agreed that the trainingmodules within the project could be added to the employee file as with any othercompany sponsored training program. The costs to the mine with respect to equipmentand labour resources would easily be offset by the benefits of fulfilling existing trainingcommitments and especially by the increased level of technical skills.
The training approach followed the Guidelines and Best Practices with respect to smallgroups in a hands on environment as well as using supplier service representatives forproviding training. It was decided that the training should follow a two level approach.The new process and tools within the project would be introduced first on an individualtraining basis in the shop between the project leader and the mechanic. The follow up toprocess and tools would be the training in group sessions for the case studies. Theengine profile at Strathcona provided the opportunity to have several case studies whereseparate engine manufacturers could be approached to bring in service representativesand provide a short hands on training session to a small group of mechanics. In total 3engine manufacturers and 1 exhaust aftertreatment manufacturer participated in hands

Page 47
on training sessions with small groups of 4 to 5 mechanics in each. In addition to themanufacturer specific training the mechanics were also shown how to incorporate thenew process and tools as part of improved maintenance. Each of the training casestudies is described in detail later in this report.
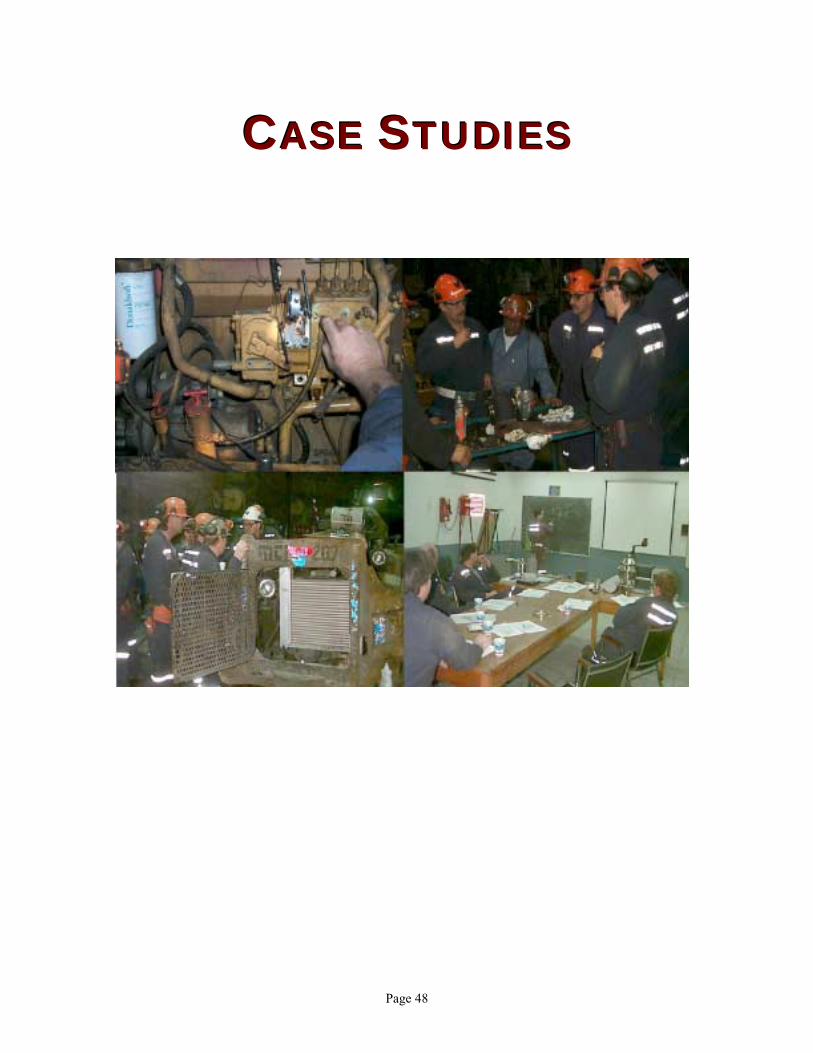
Page 48
CCCAAASSSEEE SSSTTTUUUDDDIIIEEESSS
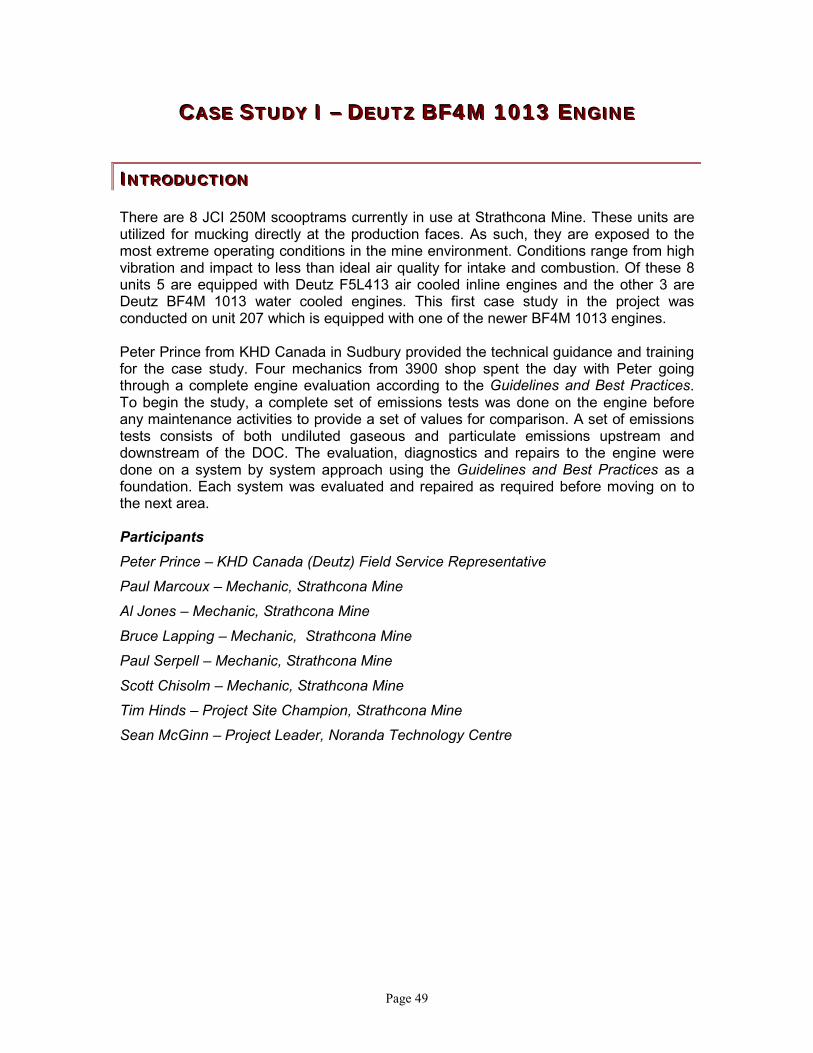
Page 49
CCCAAASSSEEE SSSTTTUUUDDDYYY III ––– DDDEEEUUUTTTZZZ BBBFFF444MMM 111000111333 EEENNNGGGIIINNNEEE
IIINNNTTTRRROOODDDUUUCCCTTTIIIOOONNN
There are 8 JCI 250M scooptrams currently in use at Strathcona Mine. These units areutilized for mucking directly at the production faces. As such, they are exposed to themost extreme operating conditions in the mine environment. Conditions range from highvibration and impact to less than ideal air quality for intake and combustion. Of these 8units 5 are equipped with Deutz F5L413 air cooled inline engines and the other 3 areDeutz BF4M 1013 water cooled engines. This first case study in the project wasconducted on unit 207 which is equipped with one of the newer BF4M 1013 engines.
Peter Prince from KHD Canada in Sudbury provided the technical guidance and trainingfor the case study. Four mechanics from 3900 shop spent the day with Peter goingthrough a complete engine evaluation according to the Guidelines and Best Practices.To begin the study, a complete set of emissions tests was done on the engine beforeany maintenance activities to provide a set of values for comparison. A set of emissionstests consists of both undiluted gaseous and particulate emissions upstream anddownstream of the DOC. The evaluation, diagnostics and repairs to the engine weredone on a system by system approach using the Guidelines and Best Practices as afoundation. Each system was evaluated and repaired as required before moving on tothe next area.
Participants
Peter Prince – KHD Canada (Deutz) Field Service Representative
Paul Marcoux – Mechanic, Strathcona Mine
Al Jones – Mechanic, Strathcona Mine
Bruce Lapping – Mechanic, Strathcona Mine
Paul Serpell – Mechanic, Strathcona Mine
Scott Chisolm – Mechanic, Strathcona Mine
Tim Hinds – Project Site Champion, Strathcona Mine
Sean McGinn – Project Leader, Noranda Technology Centre

Page 50
Figure 18 - Deutz Engine Case Study
IIINNNTTTAAAKKKEEE SSSYYYSSSTTTEEEMMM
In the Guidelines and Best Practices the intake system was assigned the highest priorityof the 6 engine systems. The case study on the engine in #207 validated this rankingand the use of the intake testing tools described there as well.
Checkpoints:" Checked operation of filter indicator and measured restriction" Measure turbo boost pressure with gauge – 8 psi" Pressure test intake system for leaks
Deficiencies:# Low turbo boost pressure# Intake piping leaks at hoses and clamps# Damaged air to air cooler – leaking# Secondary intake filter plugged
Actions:! Replaced damaged connector hose and sealed intake connections! Replaced air to air cooler (Figure 18)! Replaced secondary air filter
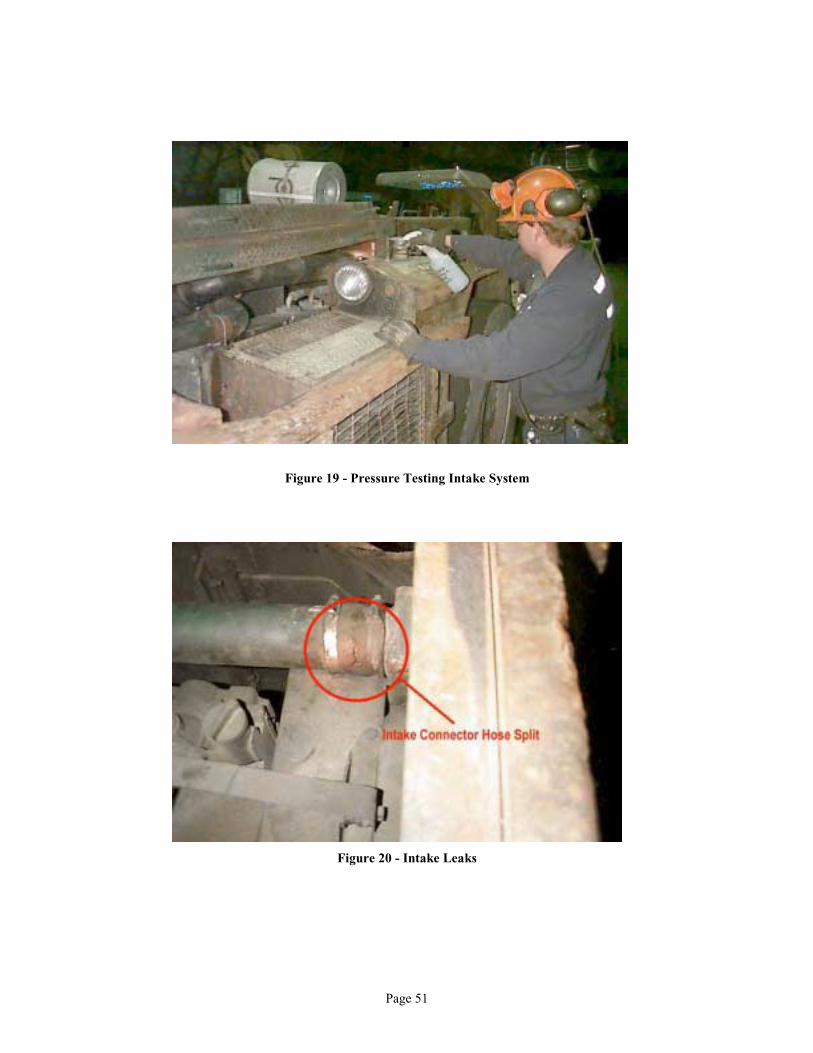
Page 51
Figure 19 - Pressure Testing Intake System
Figure 20 - Intake Leaks

Page 52
EEEXXXHHHAAAUUUSSSTTT SSSYYYSSSTTTEEEMMM
Before any maintenance activities were undertaken a set of emissions tests wereperformed, taken upstream and downstream of the purifier. This provided a set of valuesfrom which to compare the impact of the maintenance activities through the day. Inaddition to the emissions the exhaust backpressure was also measured with a standardmechanical gauge.
Checkpoints:" Emissions tests before and after exhaust purifier" Check exhaust backpressure" Visual inspection of complete system for leaks, cracks, etc
Deficiencies:# None
Actions:! Noted the excellent performance of the exhaust purifier in converting CO
FFFUUUEEELLL IIINNNJJJEEECCCTTTIIIOOONNN SSSYYYSSSTTTEEEMMM
The fuel injection system on the 1013 series engines at Strathcona are equipped withmechanical unit pump injectors that are actuated off of the camshaft. The unit pumpssupply high pressure fuel through short lines to the injector nozzles mounted in thecylinder head. The only regular service points on this system are to verify RPM settings,pressure test the nozzles, and setting the intake and exhaust valves at the same timewhile the valve covers are removed.
Checkpoints:" Hi and Lo idle RPM settings" Fuel boost pressure" Pressure (pop) test injector nozzles" Intake and exhaust valves" Water separator
Deficiencies:# 3 of 4 nozzles leaking at tip# No water separator on unit
Actions:! Replaced all 4 injector nozzles! Generated work request to have water separator installed
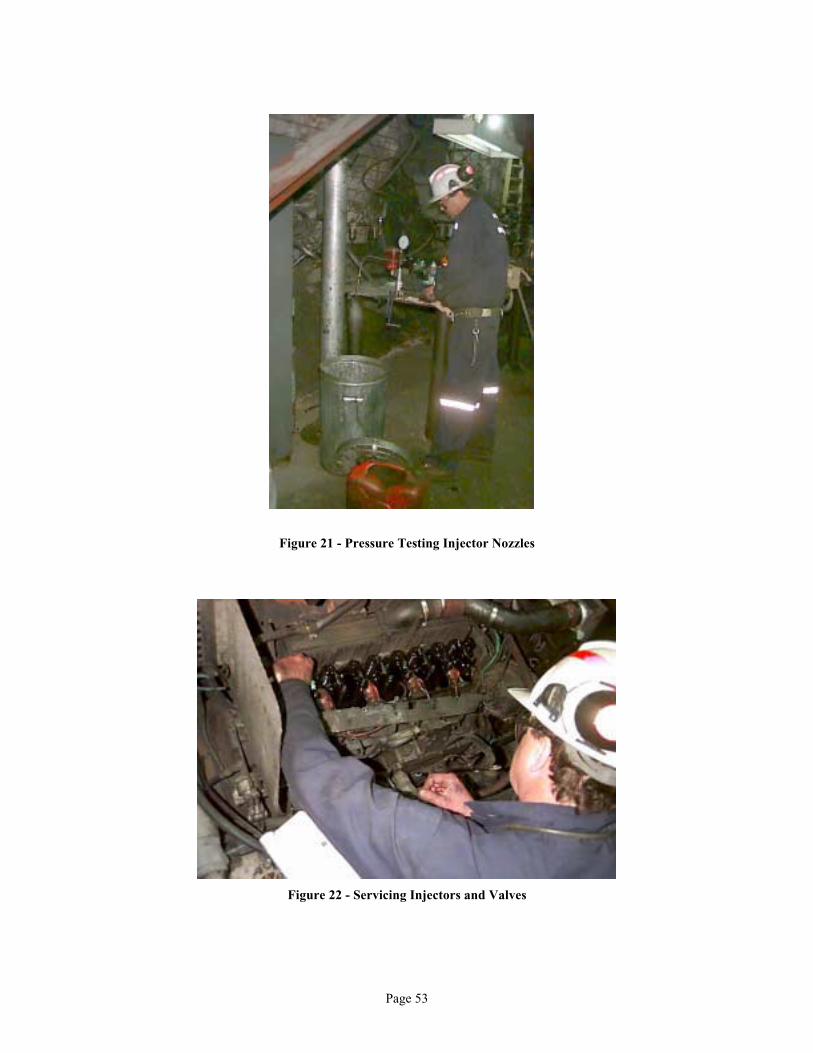
Page 53
Figure 21 - Pressure Testing Injector Nozzles
Figure 22 - Servicing Injectors and Valves

Page 54
CCCOOOOOOLLLIIINNNGGG SSSYYYSSSTTTEEEMMM
The 1013 engine has an integrated cooling system mounted to the side of the engine forcompact installation. The side installation protects the radiator from extreme operatingconditions such as dirt and impacts associated with rear mounted installations. Thecooling system checked out well with no action items required.
Checkpoints:" Thermostat operation (I.R. temperature gun)" Radiator cleanliness and flow through" Pressure test" Fan and belt adjustment and condition
Actions:! None
LLLUUUBBBRRRIIICCCAAATTTIIIOOONNN SSSYYYSSSTTTEEEMMM
Before conducting the final set of emissions tests to evaluate the change in emissionsdue to the repairs on the engine that day we had a short discussion session onlubrication and best practices. It was emphasized that maintaining a proper oil level inthe crankcase is essential to minimizing emissions. The practice of overfilling acrankcase at the start of a shift to compensate for leaks or oil consumption creates moreproblems than it solves, especially with respect to emissions. This issue is more of aneducation practice that the mechanics were encouraged to follow up on with operators.

Page 55
EEEMMMIIISSSSSSIIIOOONNNSSS RRREEESSSUUULLLTTTSSS
Test Desc O2 CO CO2 NO NO2 Smoke DPM % ppm % ppm ppm index mg/m3
1 UPSTR-Pre Mtce 7.49 590.06 9.90 653.28 13.80 9 61.67 2 DNSTR-Pre Mtce 9.56 36.27 8.39 424.37 10.29 9 69.17 3 UPSTR-Mid Mtce 9.01 302.67 8.81 514.59 15.11 9 25.83 4 DNSTR-Mid Mtce 11.85 11.82 6.71 341.75 6.59 9 30.83 5 UPSTR-Post Mtce 10.56 203.30 7.65 467.41 21.91 9 29.17 6 DNSTR-Post Mtce 12.35 35.36 6.34 384.07 9.53 9 34.17
Table 7 - Deutz Case Study Emissions Data
Note that pre, mid and post maintenance indicated in Table 7 refers to a the sequence oftesting. A set of tests was taken at the start of the case study before any evaluation orrepairs, another set in the middle of the day half way through the list of engine systems,and the last set after all engine systems had been evaluated and all repairs made. AllDPM samples were taken on silver membrane filters and analyzed for total weight.

Page 56
0
100
200
300
400
500
600
700
1 2 3
Pre to Post Mtce
Deutz Engine Study - Gaseous Emissions Upstream of Purifier
CO - ppmNO - ppmNO2 - ppm
0
50
100
150
200
250
300
350
400
450
1 2 3
Pre to Post Mtce
Deutz Engine Case Study - Gaseous Emissions Downstream of Purifier
CO - ppmNO - ppmNO2 - ppm

Page 57
9999 9999 9999
010203040506070
1 2 3
Pre to Post Mtce
Deutz Engine Case Study - Particulate Emissions Upstream of Purifier
Smoke IndexDPM - mg/m3
9999 9999 9999
010203040506070
1 2 3
Pre to Post Mtce
Deutz Engine Case Study - Particulate Emissions Downstream of Purifier
Smoke IndexDPM - mg/m3
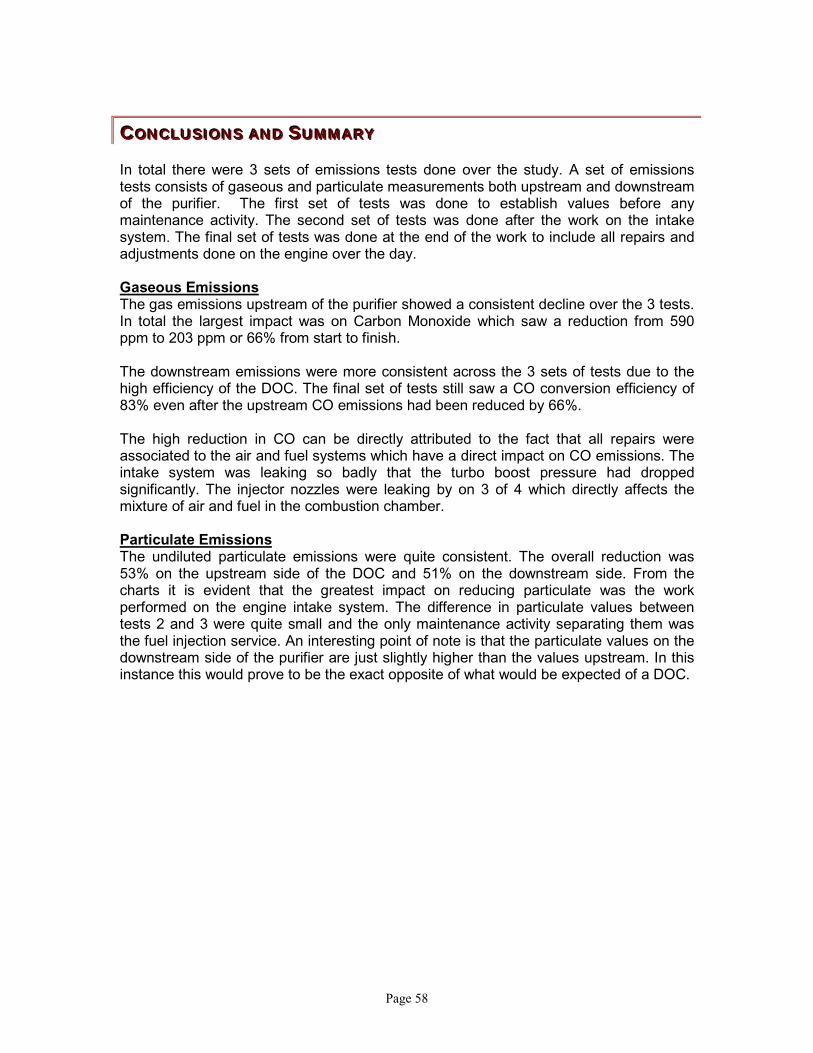
Page 58
CCCOOONNNCCCLLLUUUSSSIIIOOONNNSSS AAANNNDDD SSSUUUMMMMMMAAARRRYYY
In total there were 3 sets of emissions tests done over the study. A set of emissionstests consists of gaseous and particulate measurements both upstream and downstreamof the purifier. The first set of tests was done to establish values before anymaintenance activity. The second set of tests was done after the work on the intakesystem. The final set of tests was done at the end of the work to include all repairs andadjustments done on the engine over the day.
Gaseous EmissionsThe gas emissions upstream of the purifier showed a consistent decline over the 3 tests.In total the largest impact was on Carbon Monoxide which saw a reduction from 590ppm to 203 ppm or 66% from start to finish.
The downstream emissions were more consistent across the 3 sets of tests due to thehigh efficiency of the DOC. The final set of tests still saw a CO conversion efficiency of83% even after the upstream CO emissions had been reduced by 66%.
The high reduction in CO can be directly attributed to the fact that all repairs wereassociated to the air and fuel systems which have a direct impact on CO emissions. Theintake system was leaking so badly that the turbo boost pressure had droppedsignificantly. The injector nozzles were leaking by on 3 of 4 which directly affects themixture of air and fuel in the combustion chamber.
Particulate EmissionsThe undiluted particulate emissions were quite consistent. The overall reduction was53% on the upstream side of the DOC and 51% on the downstream side. From thecharts it is evident that the greatest impact on reducing particulate was the workperformed on the engine intake system. The difference in particulate values betweentests 2 and 3 were quite small and the only maintenance activity separating them wasthe fuel injection service. An interesting point of note is that the particulate values on thedownstream side of the purifier are just slightly higher than the values upstream. In thisinstance this would prove to be the exact opposite of what would be expected of a DOC.

Page 59
CCCAAASSSEEE SSSTTTUUUDDDYYY IIIIII ––– EEEXXXHHHAAAUUUSSSTTT AAAFFFTTTEEERRRTTTRRREEEAAATTTMMMEEENNNTTT SSSYYYSSSTTTEEEMMMSSS
IIINNNTTTRRROOODDDUUUCCCTTTIIIOOONNN
All underground vehicles at Strathcona Mine are equipped with an exhaustaftertreatment device. Each vehicle is equipped with a DOC for gaseous emissions andin some cases a fume diluter as well. There are systems in place from several differentmanufacturers. From the audit at the beginning of the project it was apparent that therewas no program in place for evaluating and maintaining these systems and a lack ofunderstanding as to how they work, what they do, and how to maintain them.
Mr. Brent Rubeli from DCL International in Toronto came to Strathcona for a daylonghands on training session focussed solely on exhaust aftertreatment systems. The entiremorning was spent in the training classroom on 3900 level. Brent went through allaftertreatment technologies that are currently used on underground mobile equipment.For each technology he explained the function and design, intended effects, and servicetips. In the afternoon the group moved next door to the shop on 3900 to put theknowledge to practice. A vehicle was randomly selected from those available in the shopthat afternoon. A Marcotte platform truck with a Deutz F6L912 air-cooled engine wasavailable for our use. The vehicle had approximately 460 total operating hours on it.
Participants
Brent Rubeli – Technical Representative, DCL International
Paul Marcoux – Mechanic, Strathcona Mine
Al Jones – Mechanic, Strathcona Mine
Bruce Lapping – Mechanic, Strathcona Mine
Paul Serpell – Mechanic, Strathcona Mine
Scott Chisolm – Mechanic, Strathcona Mine
Tim Hinds – Project Site Champion, Strathcona Mine
Sean McGinn – Project Leader, Noranda Technology Centre
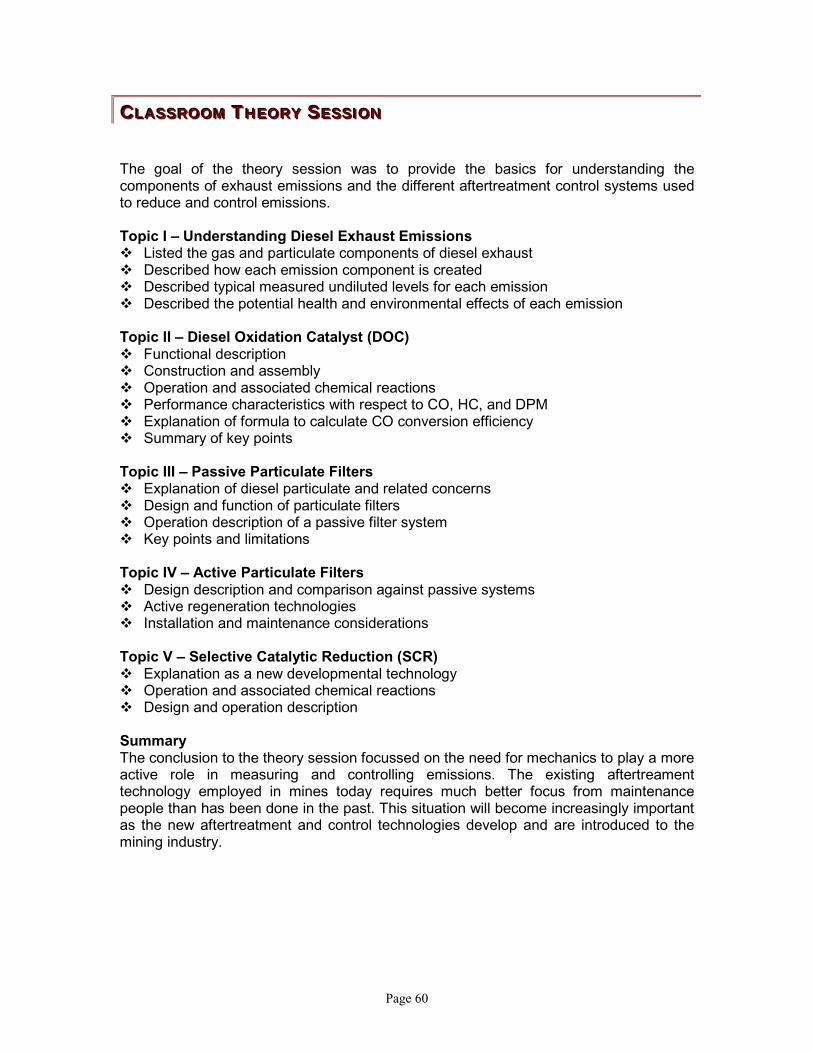
Page 60
CCCLLLAAASSSSSSRRROOOOOOMMM TTTHHHEEEOOORRRYYY SSSEEESSSSSSIIIOOONNN
The goal of the theory session was to provide the basics for understanding thecomponents of exhaust emissions and the different aftertreatment control systems usedto reduce and control emissions.
Topic I – Understanding Diesel Exhaust Emissions! Listed the gas and particulate components of diesel exhaust! Described how each emission component is created! Described typical measured undiluted levels for each emission! Described the potential health and environmental effects of each emission
Topic II – Diesel Oxidation Catalyst (DOC)! Functional description! Construction and assembly! Operation and associated chemical reactions! Performance characteristics with respect to CO, HC, and DPM! Explanation of formula to calculate CO conversion efficiency! Summary of key points
Topic III – Passive Particulate Filters! Explanation of diesel particulate and related concerns! Design and function of particulate filters! Operation description of a passive filter system! Key points and limitations
Topic IV – Active Particulate Filters! Design description and comparison against passive systems! Active regeneration technologies! Installation and maintenance considerations
Topic V – Selective Catalytic Reduction (SCR)! Explanation as a new developmental technology! Operation and associated chemical reactions! Design and operation description
SummaryThe conclusion to the theory session focussed on the need for mechanics to play a moreactive role in measuring and controlling emissions. The existing aftertreamenttechnology employed in mines today requires much better focus from maintenancepeople than has been done in the past. This situation will become increasingly importantas the new aftertreatment and control technologies develop and are introduced to themining industry.
Page 61
Figure 23 - Theory Session at 3900 Classroom
PPPRRRAAACCCTTTIIICCCAAALLL HHHAAANNNDDDSSS OOONNN SSSEEESSSSSSIIIOOONNN
The afternoon was spent in the shop putting the morning’s theory into practice. Aplatform truck was in the shop waiting for parts and thus available for our group toperform a few tests on the exhaust system.
The mechanics performed a set of gas emissions tests upstream and downstream of thepurifier. The critical CO gas component was taken and applied to the CO conversionformula. With 102 ppm upstream and 56 ppm downstream, the resulting CO conversionfactor was 45%. It was explained once again that DOCs should maintain a minimum of65% conversion efficiency and that this particular unit was in need of service orreplacement.
The group disassembled the purifier and did a visual inspection of the element. Therewas considerable buildup of soot and carbon under inspection with a light from behind.The element was steam cleaned and blown through with compressed air before beingsoaked in a container of clean diesel fuel. Although it is recommended to soak theelement for 2 hours or more, we opted to clean out and re-install after 20 minutes due toour tight schedule constraints that day.

Page 62
After half an hour of service and cleaning our final set of emissions tests revealed thatour upstream CO value was consistent at 100 ppm, but the downstream value had nowdropped to 22 ppm. This calculated to 78% CO conversion efficiency after only 30minutes service.
Figure 24 - Cleaning Purifier in Diesel Fuel
Figure 25 - Inspection Using Backlighting

Page 63
EEEMMMIIISSSSSSIIIOOONNNSSS RRREEESSSUUULLLTTTSSS
Test Desc O2 CO CO2 NO NO2 Smoke% ppm % ppm ppm index
1 UPSTR-Pre Service 12.44 102.16 6.28 630.55 28.22 9
2 DNSTR-Pre Service 12.38 56.62 6.32 669.02 18.24 8
3 UPSTR-Post Service 12.38 100.81 6.32 585.99 29.67 7
4 DNSTR-Post Service 12.36 22.85 6.34 586.99 32.35 7
Table 8 - Aftertreatment Case Study Emissions Data
9 8 7 7
0
20
40
60
80
100
120
Purifier Service Results
CO - ppm
NO2 - ppm
Smoke Index
45% COConversion
78% COConversion
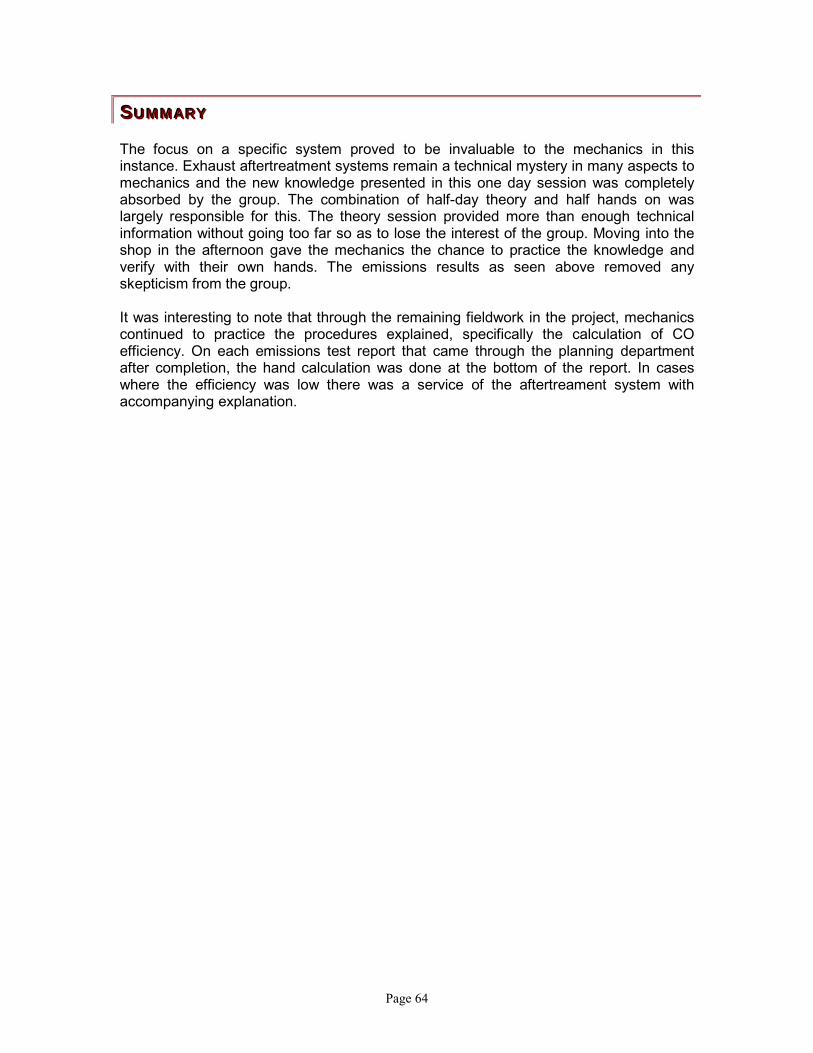
Page 64
SSSUUUMMMMMMAAARRRYYY
The focus on a specific system proved to be invaluable to the mechanics in thisinstance. Exhaust aftertreatment systems remain a technical mystery in many aspects tomechanics and the new knowledge presented in this one day session was completelyabsorbed by the group. The combination of half-day theory and half hands on waslargely responsible for this. The theory session provided more than enough technicalinformation without going too far so as to lose the interest of the group. Moving into theshop in the afternoon gave the mechanics the chance to practice the knowledge andverify with their own hands. The emissions results as seen above removed anyskepticism from the group.
It was interesting to note that through the remaining fieldwork in the project, mechanicscontinued to practice the procedures explained, specifically the calculation of COefficiency. On each emissions test report that came through the planning departmentafter completion, the hand calculation was done at the bottom of the report. In caseswhere the efficiency was low there was a service of the aftertreament system withaccompanying explanation.

Page 65
CCCAAASSSEEE SSSTTTUUUDDDYYY IIIIIIIII ––– DDDEEETTTRRROOOIIITTT DDDIIIEEESSSEEELLL SSSEEERRRIIIEEESSS 666000 EEENNNGGGIIINNNEEE
IIINNNTTTRRROOODDDUUUCCCTTTIIIOOONNN
Strathcona Mine uses 3 ST8-B scooptrams for primary heavy haulage of mine ore to theore pass system. The ST8-Bs draw the ore from re-muck bays which are kept full by thesmaller scooptrams working in the production headings. As such, the ST8-Bs areworking in good conditions with well maintained roadways and a good supply ofventilation. For this reason the majority of the maintenance activity with these machinesis predictive or scheduled as opposed to more of the breakdown or emergencymaintenance associated with the smaller machines operating under more extremeconditions. A Detroit Diesel Series 60 engine –11.1 Liter – 325 horsepower powers eachof the ST8-Bs.
Mike Meadows from Detroit Diesel Canada in London, Ontario spent 2 days providingtraining, troubleshooting and evaluation of the Series 60 engines. Tom Serpell fromHarper Detroit Diesel in Sudbury also assisted on both days. The 2-day format permittedthe evaluation of 2 separate vehicles with 2 groups of mechanics for training. It alsopermitted having a chance for a large group of mechanics to get a closer look at theSeries 60 DDEC technology, which is increasingly becoming more common as a powerchoice in heavy mobile power applications in Canadian mines.
Participants
Mike Meadows – Service Representative, Detroit Diesel Canada
Tom Serpell – Service Representative, Harper Detroit Diesel Sudbury
Blair Sagle – Mechanic, Strathcona Mine
Mike Lalonde – Mechanic, Strathcona Mine
Maurice Mainville – Mechanic, Strathcona Mine
Scott Chisolm – Mechanic, Strathcona Mine
Pat Sweeney – Mechanic, Strathcona Mine
Paul Serpell – Mechanic, Strathcona Mine
Al Jones – Mechanic, Strathcona Mine
Tim Hinds – Project Site Champion, Strathcona Mine
Heather Langfeld – Industrial Hygiene Specialist, Falconbridge Ltd
Dr. Mahe Gangal – CANMET, Diesel Laboratories – Bells Corners Complex
Sean McGinn – Project Leader, Noranda Technology Centre

Page 66
IIINNNTTTAAAKKKEEE SSSYYYSSSTTTEEEMMM
The engine system approach was used to evaluate the engines in both 818 and 820scooptrams. The approach to evaluating the intake system was identical on bothmachines with separate results. In addition to the basic checklist points a detailedexplanation on the Series 60 intake system was given with specific focus onturbocharger operation and diagnostics. The intake system evaluation for both vehiclesis listed below.
Checkpoints:" Measured restriction with magnehelic precision gauge" Measured turbo boost on DDDL system" Pressure test intake system for leaks
Deficiencies:# 818 – intake restriction near limit# 818 – intake leaks at hoses# 820 – no deficiencies found
Actions:! Replaced air filter elements and re-checked restriction! Repaired leak at hose to cooler
The only deficiencies were encountered on 818 scooptram. Although the intake filterrestriction was still below the limit (measured 10 “wg – limit 20” wg), the outer elementswere replaced and a 2nd set of emissions tests performed afterward to determine theeffect of reduced intake restriction. The measured restriction afterward was down to 5”wg. The most noticeable effect was a reduction in CO from 175 ppm before replacing thefilters to 115 ppm with new filters. It was also interesting to note that although both filterelements were visibly loaded with dirt, the intake restriction was still only half of the limitspecification. This was explained by the vehicle design application where double therequired filtration capacity for the Series 60 engine has been installed on the vehicle.Where a normal Series 60 application would have only one of the Donaldson intakecanister / filter systems, the ST8-Bs have been equipped with two.
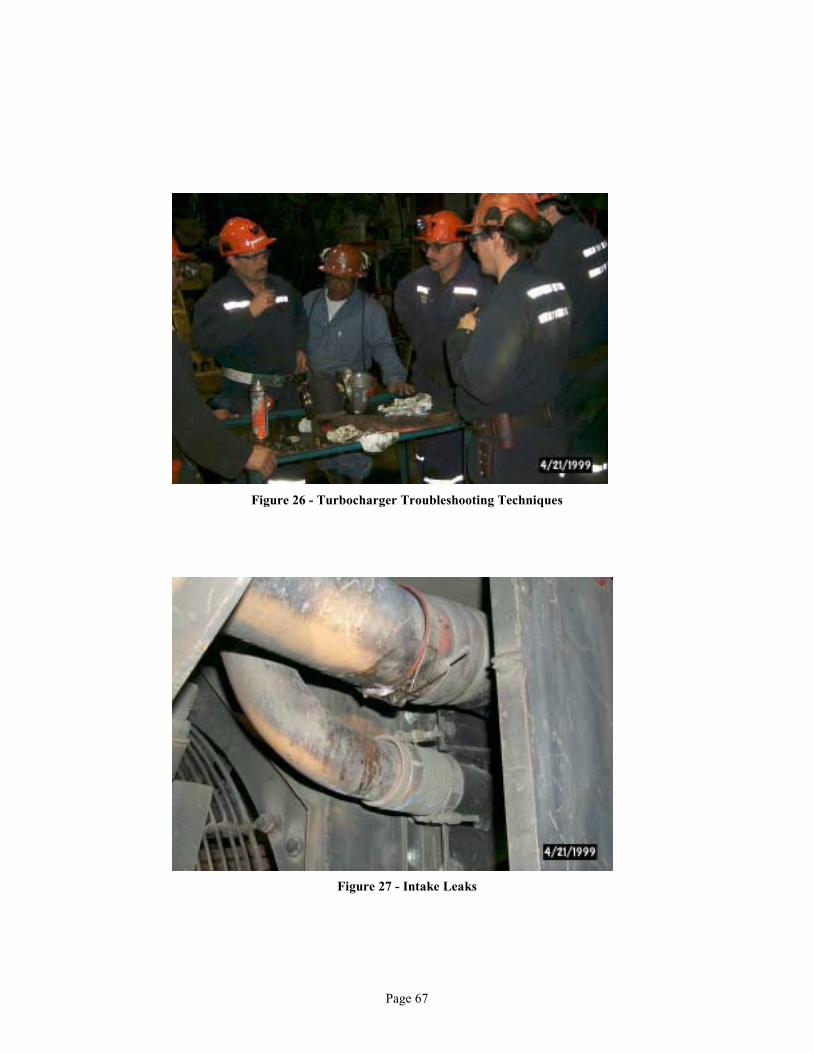
Page 67
Figure 26 - Turbocharger Troubleshooting Techniques
Figure 27 - Intake Leaks
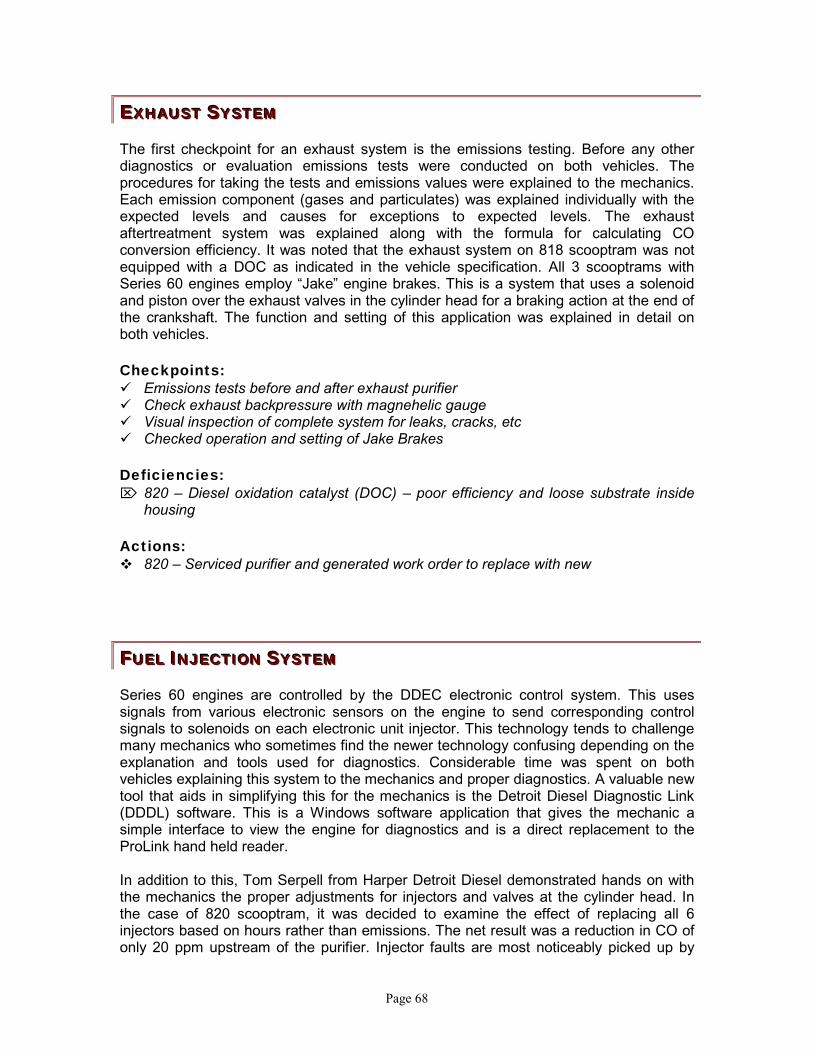
Page 68
EEEXXXHHHAAAUUUSSSTTT SSSYYYSSSTTTEEEMMM
The first checkpoint for an exhaust system is the emissions testing. Before any otherdiagnostics or evaluation emissions tests were conducted on both vehicles. Theprocedures for taking the tests and emissions values were explained to the mechanics.Each emission component (gases and particulates) was explained individually with theexpected levels and causes for exceptions to expected levels. The exhaustaftertreatment system was explained along with the formula for calculating COconversion efficiency. It was noted that the exhaust system on 818 scooptram was notequipped with a DOC as indicated in the vehicle specification. All 3 scooptrams withSeries 60 engines employ “Jake” engine brakes. This is a system that uses a solenoidand piston over the exhaust valves in the cylinder head for a braking action at the end ofthe crankshaft. The function and setting of this application was explained in detail onboth vehicles.
Checkpoints:" Emissions tests before and after exhaust purifier" Check exhaust backpressure with magnehelic gauge" Visual inspection of complete system for leaks, cracks, etc" Checked operation and setting of Jake Brakes
Deficiencies:# 820 – Diesel oxidation catalyst (DOC) – poor efficiency and loose substrate inside
housing
Actions:! 820 – Serviced purifier and generated work order to replace with new
FFFUUUEEELLL IIINNNJJJEEECCCTTTIIIOOONNN SSSYYYSSSTTTEEEMMM
Series 60 engines are controlled by the DDEC electronic control system. This usessignals from various electronic sensors on the engine to send corresponding controlsignals to solenoids on each electronic unit injector. This technology tends to challengemany mechanics who sometimes find the newer technology confusing depending on theexplanation and tools used for diagnostics. Considerable time was spent on bothvehicles explaining this system to the mechanics and proper diagnostics. A valuable newtool that aids in simplifying this for the mechanics is the Detroit Diesel Diagnostic Link(DDDL) software. This is a Windows software application that gives the mechanic asimple interface to view the engine for diagnostics and is a direct replacement to theProLink hand held reader.
In addition to this, Tom Serpell from Harper Detroit Diesel demonstrated hands on withthe mechanics the proper adjustments for injectors and valves at the cylinder head. Inthe case of 820 scooptram, it was decided to examine the effect of replacing all 6injectors based on hours rather than emissions. The net result was a reduction in CO ofonly 20 ppm upstream of the purifier. Injector faults are most noticeably picked up by

Page 69
high CO readings during testing and should produce a sizeable drop when injectors arereplaced. This served to reinforce the fact that a critical decision such as injectorreplacement should be based only on performance and emissions rather than apredictive decision based on hours.
Checkpoints:" Hi and Lo idle RPM settings" Fuel temperature and coolers" Injector setting and calibration" Intake and exhaust valves" Fuel filters and water separator
Deficiencies:# None
Actions:! 820 – Replaced injectors based on hours – net zero effect
Figure 28 - Setting Injectors and Valves
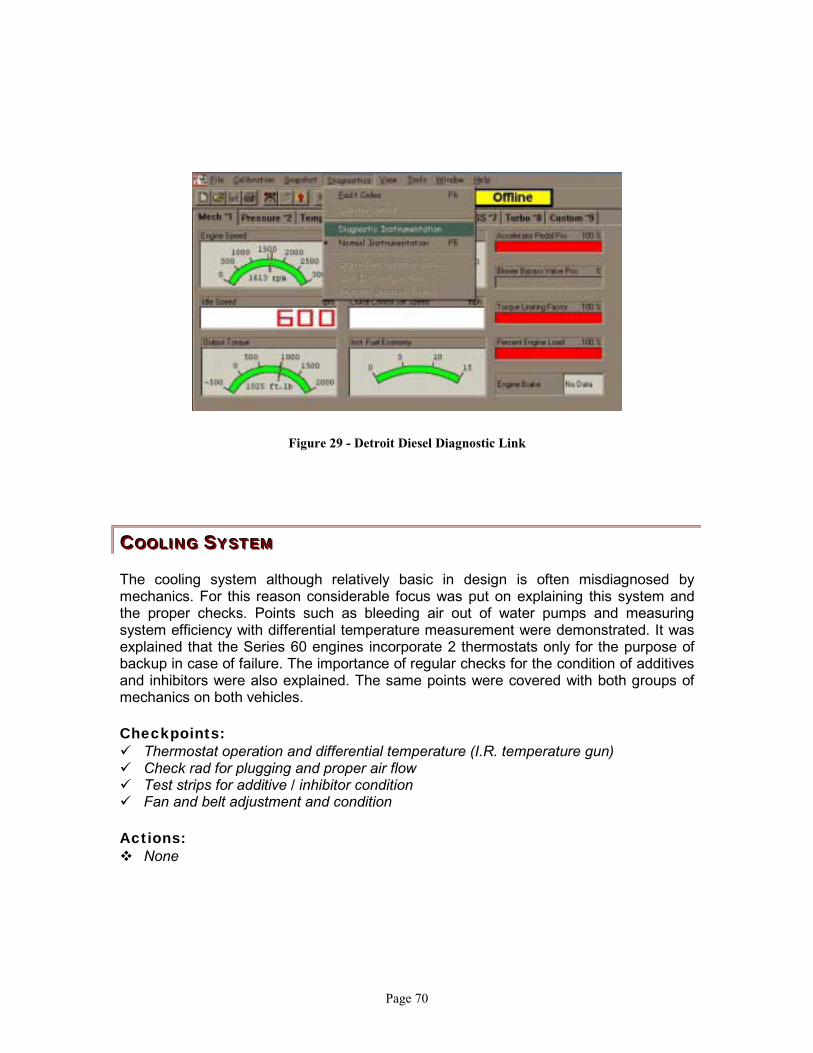
Page 70
Figure 29 - Detroit Diesel Diagnostic Link
CCCOOOOOOLLLIIINNNGGG SSSYYYSSSTTTEEEMMM
The cooling system although relatively basic in design is often misdiagnosed bymechanics. For this reason considerable focus was put on explaining this system andthe proper checks. Points such as bleeding air out of water pumps and measuringsystem efficiency with differential temperature measurement were demonstrated. It wasexplained that the Series 60 engines incorporate 2 thermostats only for the purpose ofbackup in case of failure. The importance of regular checks for the condition of additivesand inhibitors were also explained. The same points were covered with both groups ofmechanics on both vehicles.
Checkpoints:" Thermostat operation and differential temperature (I.R. temperature gun)" Check rad for plugging and proper air flow" Test strips for additive / inhibitor condition" Fan and belt adjustment and condition
Actions:! None
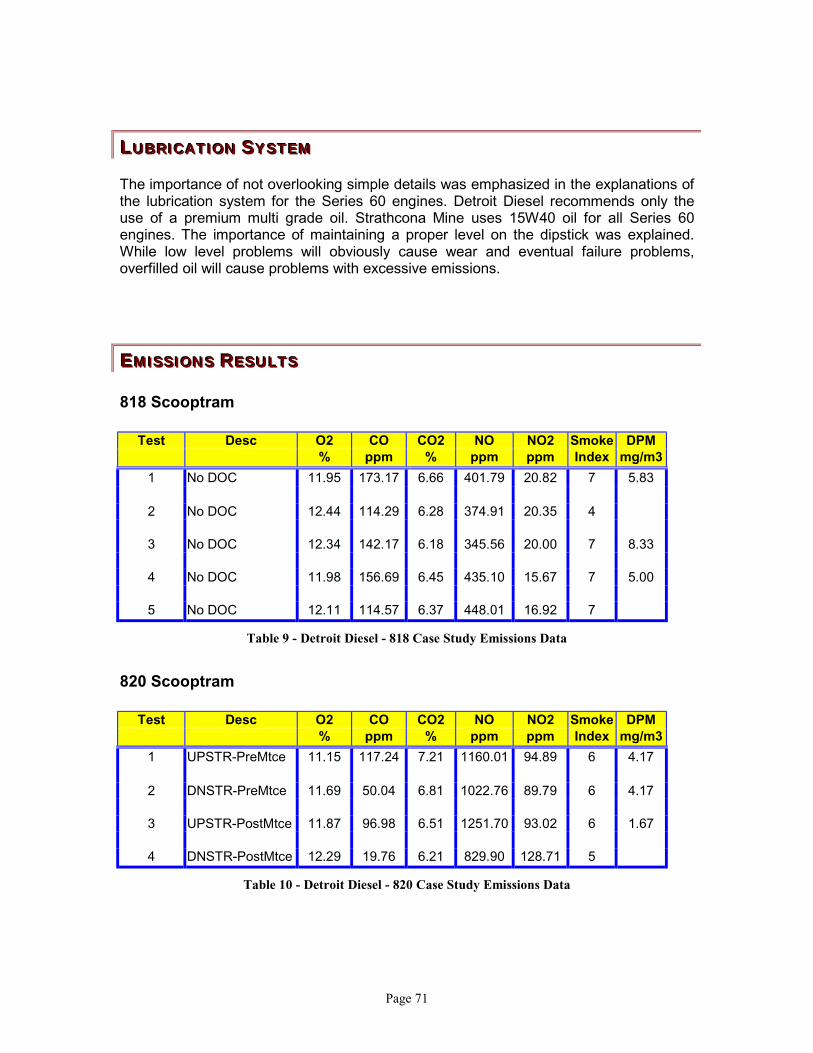
Page 71
LLLUUUBBBRRRIIICCCAAATTTIIIOOONNN SSSYYYSSSTTTEEEMMM
The importance of not overlooking simple details was emphasized in the explanations ofthe lubrication system for the Series 60 engines. Detroit Diesel recommends only theuse of a premium multi grade oil. Strathcona Mine uses 15W40 oil for all Series 60engines. The importance of maintaining a proper level on the dipstick was explained.While low level problems will obviously cause wear and eventual failure problems,overfilled oil will cause problems with excessive emissions.
EEEMMMIIISSSSSSIIIOOONNNSSS RRREEESSSUUULLLTTTSSS
818 Scooptram
Test Desc O2 CO CO2 NO NO2 Smoke DPM% ppm % ppm ppm Index mg/m3
1 No DOC 11.95 173.17 6.66 401.79 20.82 7 5.83
2 No DOC 12.44 114.29 6.28 374.91 20.35 4
3 No DOC 12.34 142.17 6.18 345.56 20.00 7 8.33
4 No DOC 11.98 156.69 6.45 435.10 15.67 7 5.00
5 No DOC 12.11 114.57 6.37 448.01 16.92 7
Table 9 - Detroit Diesel - 818 Case Study Emissions Data
820 Scooptram
Test Desc O2 CO CO2 NO NO2 Smoke DPM% ppm % ppm ppm Index mg/m3
1 UPSTR-PreMtce 11.15 117.24 7.21 1160.01 94.89 6 4.17
2 DNSTR-PreMtce 11.69 50.04 6.81 1022.76 89.79 6 4.17
3 UPSTR-PostMtce 11.87 96.98 6.51 1251.70 93.02 6 1.67
4 DNSTR-PostMtce 12.29 19.76 6.21 829.90 128.71 5
Table 10 - Detroit Diesel - 820 Case Study Emissions Data

Page 72
818 Scooptram Emissions Graphic Analysis
! 818 Scooptram is not equipped with a DOC so the results above appear as individualtests instead of upstream and downstream of the purifier on the other vehicles
0.00
100.00
200.00
300.00
400.00
500.00
1 2 3 4 5
Pre to Post Mtce
Detroit Diesel Engine StudyGaseous Emissions - #818 Scooptram
CO
NO
NO2
7
4
7 7 7
0123456789
1 2 3 4 5
Pre to Post Mtce
Detroit Diesel Engine StudyParticulate Emissions - #818 Scooptram
Smoke Index
DPM - mg/m3
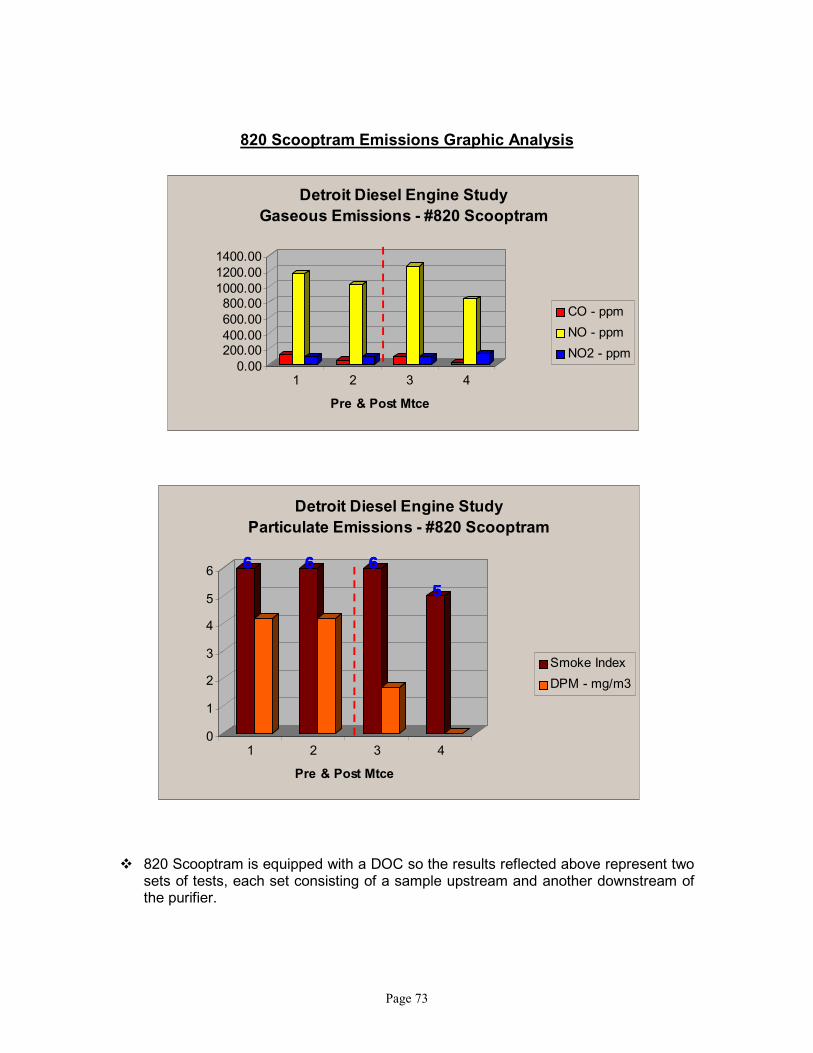
Page 73
820 Scooptram Emissions Graphic Analysis
! 820 Scooptram is equipped with a DOC so the results reflected above represent twosets of tests, each set consisting of a sample upstream and another downstream ofthe purifier.
0.00200.00400.00600.00800.00
1000.001200.001400.00
1 2 3 4
Pre & Post Mtce
Detroit Diesel Engine StudyGaseous Emissions - #820 Scooptram
CO - ppm
NO - ppm
NO2 - ppm
6666 6666 6666
5555
0
1
2
3
4
5
6
1 2 3 4
Pre & Post Mtce
Detroit Diesel Engine Study Particulate Emissions - #820 Scooptram
Smoke Index
DPM - mg/m3
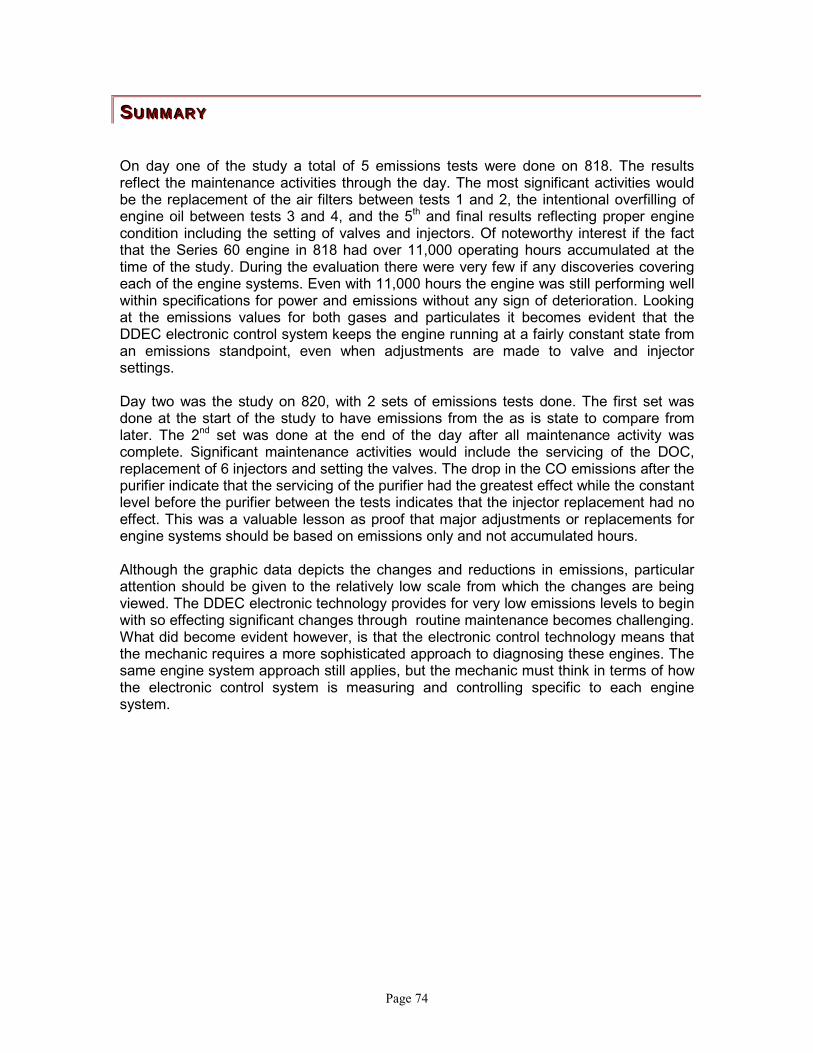
Page 74
SSSUUUMMMMMMAAARRRYYY
On day one of the study a total of 5 emissions tests were done on 818. The resultsreflect the maintenance activities through the day. The most significant activities wouldbe the replacement of the air filters between tests 1 and 2, the intentional overfilling ofengine oil between tests 3 and 4, and the 5th and final results reflecting proper enginecondition including the setting of valves and injectors. Of noteworthy interest if the factthat the Series 60 engine in 818 had over 11,000 operating hours accumulated at thetime of the study. During the evaluation there were very few if any discoveries coveringeach of the engine systems. Even with 11,000 hours the engine was still performing wellwithin specifications for power and emissions without any sign of deterioration. Lookingat the emissions values for both gases and particulates it becomes evident that theDDEC electronic control system keeps the engine running at a fairly constant state froman emissions standpoint, even when adjustments are made to valve and injectorsettings.
Day two was the study on 820, with 2 sets of emissions tests done. The first set wasdone at the start of the study to have emissions from the as is state to compare fromlater. The 2nd set was done at the end of the day after all maintenance activity wascomplete. Significant maintenance activities would include the servicing of the DOC,replacement of 6 injectors and setting the valves. The drop in the CO emissions after thepurifier indicate that the servicing of the purifier had the greatest effect while the constantlevel before the purifier between the tests indicates that the injector replacement had noeffect. This was a valuable lesson as proof that major adjustments or replacements forengine systems should be based on emissions only and not accumulated hours.
Although the graphic data depicts the changes and reductions in emissions, particularattention should be given to the relatively low scale from which the changes are beingviewed. The DDEC electronic technology provides for very low emissions levels to beginwith so effecting significant changes through routine maintenance becomes challenging.What did become evident however, is that the electronic control technology means thatthe mechanic requires a more sophisticated approach to diagnosing these engines. Thesame engine system approach still applies, but the mechanic must think in terms of howthe electronic control system is measuring and controlling specific to each enginesystem.

Page 75
CCCAAASSSEEE SSSTTTUUUDDDYYY IIIVVV ––– CCCAAATTTEEERRRPPPIIILLLLLLAAARRR 333333000444TTT EEENNNGGGIIINNNEEE
IIINNNTTTRRROOODDDUUUCCCTTTIIIOOONNN
Strathcona Mine employs one Caterpillar grader for maintaining roadways, in particularthe ramp between 3700 and 4200 levels. There is generally only one operator who usesthe grader between the four crews. When in use, the vehicle duty cycle is quite light dueto the fact that most of the work is performed facing down ramp with a light load on themouldboard. For this reason the engine exhaust temperatures would be somewhat lowerthan ideal for the majority of operating hours on the engine.
Toromont Caterpillar in Sudbury supplied the services of a field technician for the two-day study. Four mechanics actively participated for both days under the guidance of theToromont representative. A complete set of emissions tests was done followed by anevaluation of the engine on a system by system approach using the Guidelines and BestPractices as a foundation. As defects were discovered and explained, they wererepaired before moving to the next system.
Participants
Robert Lafond – Toromont Caterpillar Field Technician
Paul Marcoux – Mechanic, Strathcona Mine
Larry Thompson – Mechanic, Strathcona Mine
Maurice Mainville – Mechanic, Strathcona Mine
Denis Laplante – Mechanic, Strathcona Mine
Tim Hinds – Site Champion, Strathcona Mine
Sean McGinn – Project Leader, Noranda Technology Centre
Figure 30 - Caterpillar M-1 Grader

Page 76
IIINNNTTTAAAKKKEEE SSSYYYSSSTTTEEEMMM
Evaluation of the engine intake system was done using checkpoints, techniques andtools from the guidelines and best practices along with the critical know how of theCaterpillar field technician.
Checkpoints:" Measure intake restriction with vacuum gauge" Pressure test intake system for leaks" Inspect intake manifold for dirt and leaks" Inspect turbocharger for visual defects
Deficiencies:# Leaks at intake filter housing# Intake housing contaminated with dirt and oil# Turbocharger bearings and seals blown (blowing oil)
Actions:! Repaired leaks at intake filter housing and rechecked! Replaced turbocharger
Figure 31 - Testing For Intake Leaks
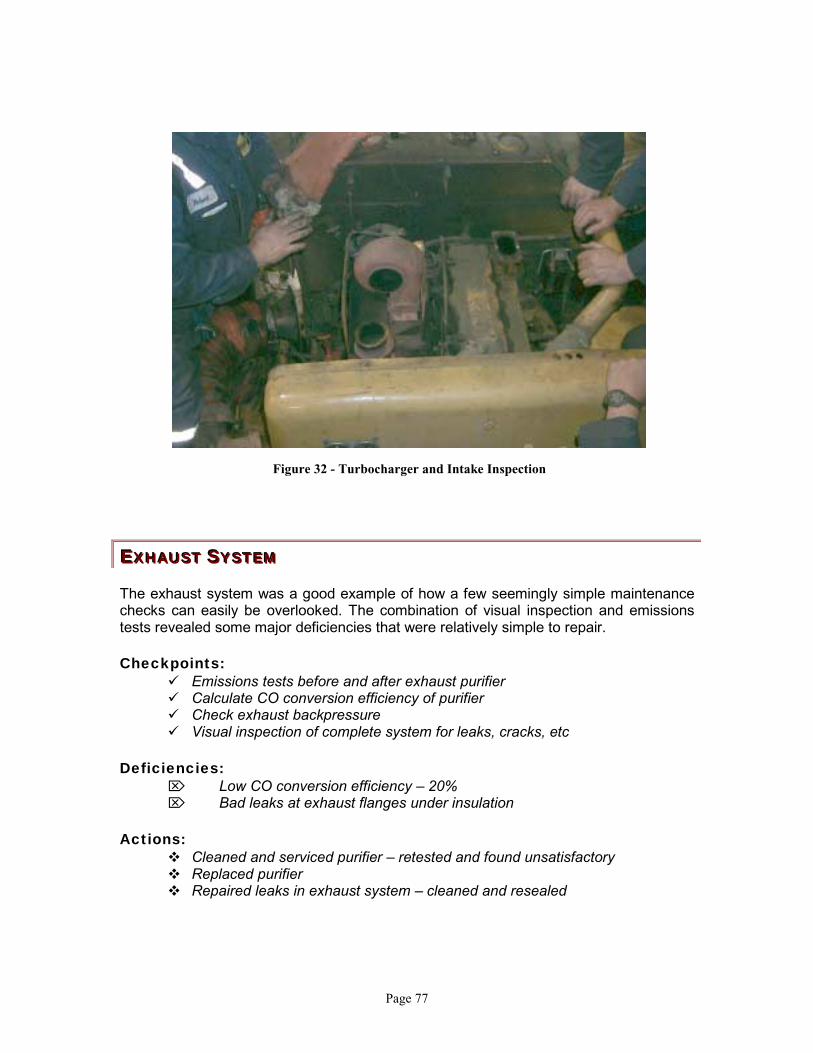
Page 77
EEEXXXHHHAAAUUUSSSTTT SSSYYYSSSTTTEEEMMM
The exhaust system was a good example of how a few seemingly simple maintenancechecks can easily be overlooked. The combination of visual inspection and emissionstests revealed some major deficiencies that were relatively simple to repair.
Checkpoints:" Emissions tests before and after exhaust purifier" Calculate CO conversion efficiency of purifier" Check exhaust backpressure" Visual inspection of complete system for leaks, cracks, etc
Deficiencies:# Low CO conversion efficiency – 20%# Bad leaks at exhaust flanges under insulation
Actions:! Cleaned and serviced purifier – retested and found unsatisfactory! Replaced purifier! Repaired leaks in exhaust system – cleaned and resealed
Figure 32 - Turbocharger and Intake Inspection

Page 78
Figure 33 - Purifier Before Service
Figure 34 - Leaks in Exhaust System

Page 79
FFFUUUEEELLL SSSYYYSSSTTTEEEMMM
The fuel system evaluation on the 3304T engine clearly showed how critical it is to focuson details with mechanically fuel injected engines. Verification and adjustments weremade to idle settings, rack setting, timing and injectors. The adjustment of the intake andexhaust valves was also included, although technically not part of the fuel system.
Checkpoints:" High and Low idle RPM settings" Pin timing" Fuel rack setting" API fuel density" Water separator" Pressure group" Intake and exhaust valves
Deficiencies:# High idle off by 200 RPM# Rack setting off# Valves out of adjustment (tight)
Actions:! Adjusted and checked RPM! Re-set rack from 5.50 to 3.50! Set valves! Replaced 4 injector nozzles (based on emissions tests)
Figure 35 - Pin Timing Fuel Pump
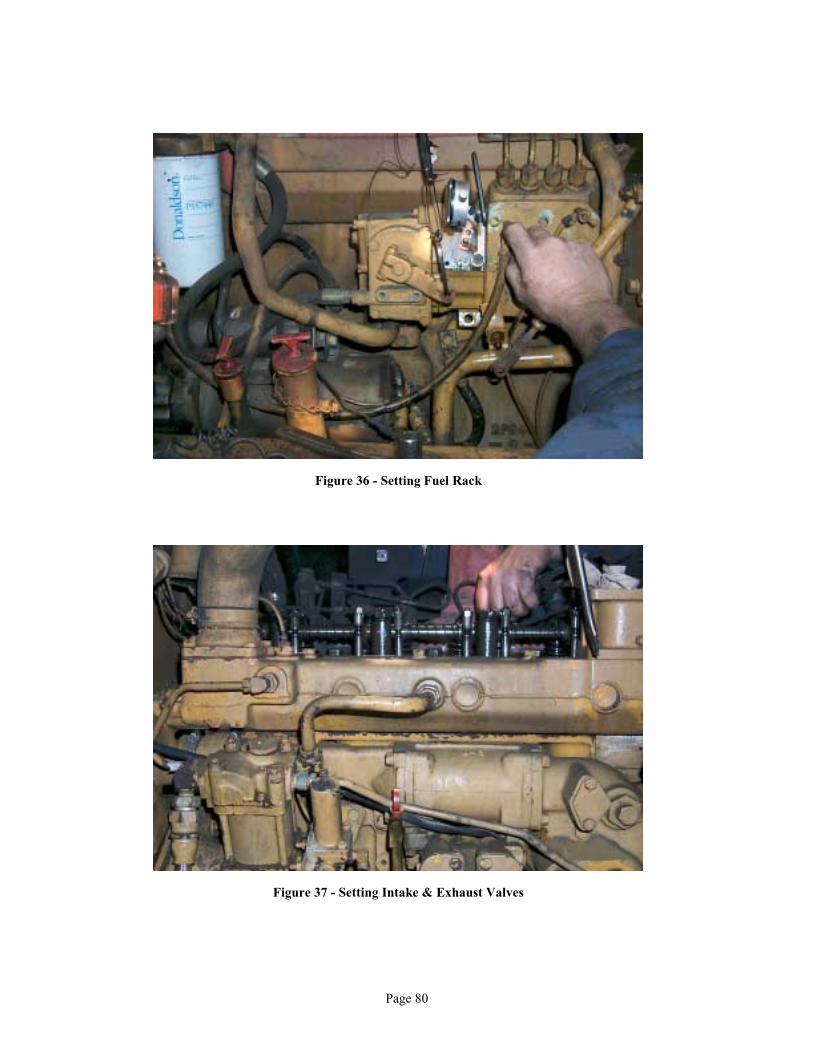
Page 80
Figure 36 - Setting Fuel Rack
Figure 37 - Setting Intake & Exhaust Valves

Page 81
CCCOOOOOOLLLIIINNNGGG SSSYYYSSSTTTEEEMMM
As mentioned earlier, this vehicle application tends to run at cooler engine temperaturesthan recommended. This accounts for much of the emissions problem complaints andexplains the malfunction of the exhaust DOC. The explanation of the cooling system wasa good opportunity to explain how different approaches can control engine temperatureproblems and what to look for in maintaining cooling systems.
Checkpoints:" Thermostat operation (I.R. temperature gun)" Air flow through radiator" Conditioner / Additive level" Fan and belt adjustment and condition
Actions:! Demonstrated effectiveness of shutterstats with cardboard restriction for
controlling engine temperature
LLLUUUBBBRRRIIICCCAAATTTIIIOOONNN SSSYYYSSSTTTEEEMMM
This section was more of a discussion area rather than hands on although of no lessimportance. One of the often-overlooked points by both operators and mechanics is theimportance of maintaining a proper level on the engine oil dipstick. An overfilledcrankcase can cause an engine to burn excess oil in the combustion chamber producinghigher emissions. Also discussed was the importance of proper replacement of oil filters– and fuel also. The oft used practice of pre filling the filters on the workbench beforeinstalling can possibly lead to inadvertent contamination entering the system on theoutlet side of the filter. The importance of using clean fill cans and nozzles was alsostressed.

Page 82
EEEMMMIIISSSSSSIIIOOONNNSSS RRREEESSSUUULLLTTTSSS
Test Desc O2 CO CO2 NO NO2 Smoke DPM% ppm % ppm ppm index mg/m3
1 UPSTR-Pre Mtce 14.76 277.46 4.54 309.13 63.08 9 121.67
2 DNSTR-Pre Mtce 14.74 224.77 4.57 310.03 25.55 9 94.17
3 UPSTR- Mid Mtce 15.23 224.53 4.26 252.87 53.76 9 114.17
4 DNSTR-Mid Mtce 15.71 129.91 3.89 283.97 33.97 9 95.83
5 UPSTR-Post Mtce 14.90 208.98 4.50 346.53 82.92 7 77.50
6 DNSTR-Post Mtce 14.92 76.55 4.48 371.60 21.29 7 94.17
Table 11 - CAT Grader Case Study Emissions Data

Page 83
0.0050.00
100.00
150.00
200.00
250.00
300.00
350.00
1 2 3
Pre to Post Mtce
CAT Engine Study - Gaseous Emissions Upstream of Purifier
CO - ppm
NO - ppm
NO2 - ppm
0.0050.00
100.00150.00200.00250.00300.00350.00400.00
1 2 3
Pre to Post Mtce
CAT Engine Study - Gaseous Emissions Downstream of Purifier
CO - ppm
NO - ppm
NO2 - ppm
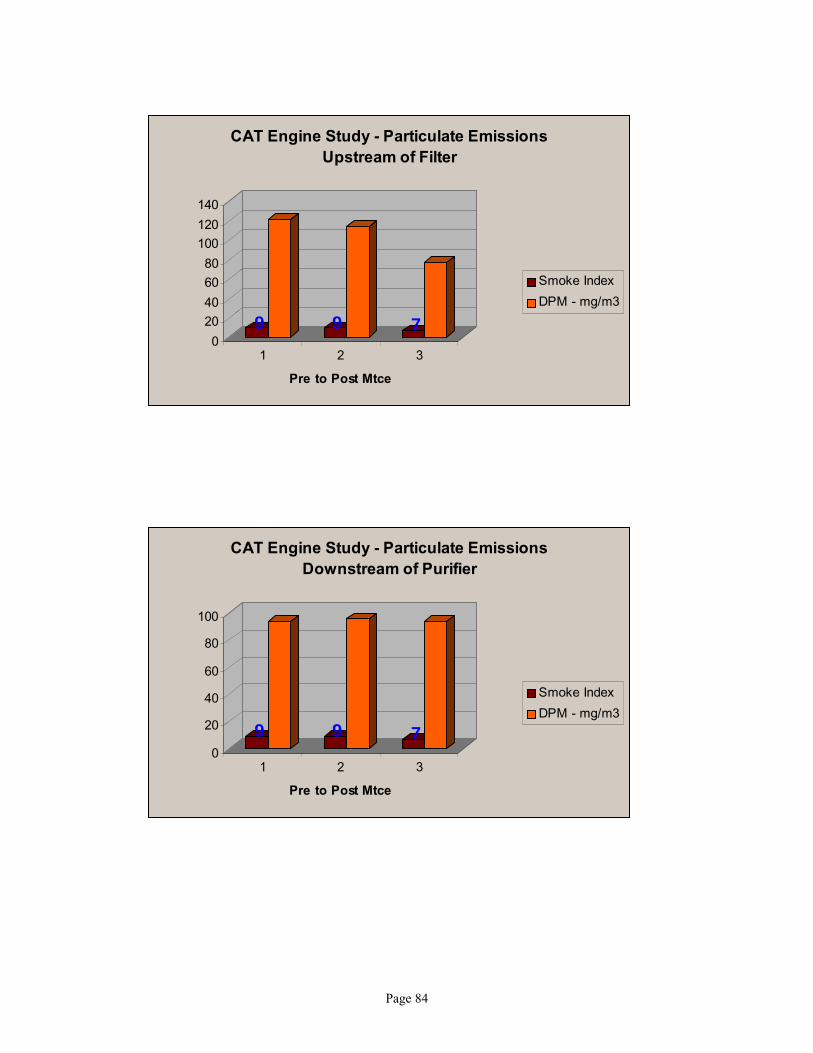
Page 84
9 9 70
20
40
60
80
100120
140
1 2 3
Pre to Post Mtce
CAT Engine Study - Particulate EmissionsUpstream of Filter
Smoke Index
DPM - mg/m3
9 9 70
20
40
60
80
100
1 2 3
Pre to Post Mtce
CAT Engine Study - Particulate Emissions Downstream of Purifier
Smoke Index
DPM - mg/m3

Page 85
Figure 38 - DPM Samples Before and After

Page 86
SSSUUUMMMMMMAAARRRYYY
Of the four case studies the engine in the grader provided the best example of what canbe found looking at all of the engine systems. The intake system had leaks, theturbocharger was defective, the exhaust system was in need of service, the fuel injectionsystem was badly out of tune, and the cooling system required modifications. Thougheach of these problems are significant individually, the maintenance of the fuel injectionsystem made the largest single difference to emissions. This is primarily because therack setting was so far out of adjustment. This can be seen in the emissions analysis asthe associated difference between the 3 sets of tests. The difference between the firstand second is attributable to intake and exhaust repairs. The difference between secondand third and overall is attributable to the fuel injection system.
The gaseous emissions show a reduction on the upstream side of the purifier of 25%and on the downstream side 66%. This is primarily due to the servicing of theaftertreatment system. The particulate emissions show a reduction on the upstream sidefrom 121 mg/m3 to 77 mg/m3 or 37% total. The graphic in Figure 38 demonstratesvisually the real impact on particulates. The scanned images are of the actual silvermembrane filters with loaded DPM from the first and third set of tests.

Page 87
PPPRRROOOJJJEEECCCTTT RRREEECCCOOOMMMMMMEEENNNDDDAAATTTIIIOOONNNSSS AAANNNDDD CCCOOONNNCCCLLLUUUSSSIIIOOONNN
RRREEECCCOOOMMMMMMEEENNNDDDAAATTTIIIOOONNNSSS BBBAAASSSEEEDDD OOONNN FFFIIINNNDDDIIINNNGGGSSS
When looking back at the work done within this project it becomes obvious that it wasreally more of a review in proving what was already known than a demonstration of newtechnology or philosophy. With the exception of a few of the new tools that wereintroduced, the work described in this report brings together a lot of what the heavy-dutymechanics and shop foremen in our mining industry have known for many years. Whatis new here is that much (but not all) of the knowledge has been pulled together andapplied as a uniform strategy without exception. The project mandate forced us to beconsistent with the new strategy and not slip back to the more familiar and comfortableways of the past. The ultimate goal of reduced emissions in applying this strategy hasbeen proven with the data. A possible bonus that was never included in the scope of theproject was the strongly suspected improvement in the bottom line for the mine inoperating cost savings.
As the first level of control in reducing diesel exhaust emissions, the followingrecommendations for improved diesel engine maintenance can be adopted as the firststeps in achieving reduced emissions.
! Recommendation # 1Build a team focussed on implementing an improved maintenance strategy. The teamshould have members including mechanics, supervision, planning, and managementfrom the mine. Responsibilities can be delegated according to an implementation planand followed up through a report and meeting structure. Ensure that sufficient resourcesare made available to the team with respect to time, tools, and training.
! Recommendation # 2Construct an engine maintenance audit program using the model provided in this reportas a template. Select an auditing team from both internal and external to the minemaintenance system. Sometimes it takes an unaccustomed eye to uncover what isobvious and overlooked by someone closer to home. A good audit program has followup mechanisms built in to it and should be conducted at least annually.
! Recommendation # 3Utilize the Guidelines and Best Practices included in this report along with the six systemapproach to engine maintenance as a foundation in building a strategy for improvingexisting maintenance practices.
! Recommendation # 4Put a program together for testing undiluted tailpipe emissions on underground vehicles.Integrate the program into the existing scheduled maintenance program with set actionlimits on emissions to ensure response to problems. The critical factor in the emissionstesting program is not so much in the technology used to measure but in the structuredprotocol in taking the tests. In order to be useful the emissions must be comparedagainst a known baseline at a known operating state consistently.

Page 88
! Recommendation # 5Make use of the suppliers of diesel engines and related equipment for training and followup with new tools and other developments. The best way for an engine supplier toimprove the relationship with the mine is to provide solutions to problems. The best wayto do this is to have service representatives come to the mine and provide hands oninstruction with small groups or one on one as described in the case studies for thisproject.
CCCOOONNNCCCLLLUUUSSSIIIOOONNN
The DEEP maintenance project brought together resources from every corner of themining industry to participate in some way however large or small. This in itself could beseen as the greatest success factor in the project. Every person who participated in theproject gained valuable knowledge on the issue of diesel engine maintenance that somany continue to believe to be a non-issue. At the end of the project it is clear to all of uswho participated that improved maintenance practices on diesel engines is the first lineof control to reductions in emissions. The challenge now ahead is to pass thisknowledge on to others in the mining industry. With all of the new technologies anddevelopments that are presented to the mining industry it sometimes becomes difficult tolook back to the fundamentals before moving ahead. Before the mining industry adoptsnew technologies as bolt on solutions it must ensure first that it understands thetechnology it already has and can maintain it to an acceptable level of performance.
To simply re-state the objectives of the project and how the work has achieved successon each point would be further repetition of what would by now be obvious. The finaljudgement should be left to those who actually did the work with this project andcontinue to carry on with the monitoring of emissions and practicing improved enginemaintenance long after the project has been completed. During the case studies in theproject the mechanics were asked to provide feedback as to their thoughts on the newmaintenance practices and the future. The thoughts from the mechanics from 3900 shopat Strathcona Mine in the following appendix serve as the best gauge of success for theDEEP Maintenance Project.
Page 89
BBBIIIBBBLLLIIIOOOGGGRRRAAAPPPHHHYYY
[1] Waytulonis, R. W., An Overview Of The Effects Of Diesel Engine MaintenanceOn Emissions And Performance. Diesels In Underground Mines: MeasurementAnd Control of Particulate Emissions. Proceedings: Bureau of MinesInformation and Technology Transfer Seminar, Minneapolis, MN, September29-30, 1992.
[2] Technical Panel on Diesel Engine Maintenance – Auclair, G., M. Meadows, R.Huzij, B. Huston, S. McGinnn, Group Focus Session to Establish Guidelines andBest Practices, Noranda Technology Centre, Pointe Claire, Quebec, March 31,1998.
[3] McGinn, S. Philippe Gaultier, Ken Gavel, Ralph Johnson, and Dale Petrie,Understanding Equipment Condition and Affects on Ventilation , 100thCIMAnnual General Meeting, Montreal, Quebec, May, 1998.
[4] Birch, M.E. and R.A. Cary, Elemental Carbon-Based Method forMonitoring Occupational Exposures to Particulate Diesel Exhaust.Aerosol Science and Tech., 68(3): 221-241; (1996).

Page 90
AAACCCKKKNNNOOOWWWLLLEEEDDDGGGEEEMMMEEENNNTTT
Thank you to the following for their assistance in making theDEEP Maintenance Project a success!
Project FundingThe contributing members of the Diesel Emissions Evaluation Program (DEEP) and the
Workers Compensation Board of Manitoba
Technical Panel for Guidelines and Best PracticesBob Huzij – INCO Ltd.
Barry Huston - Williams Operating Corp.Mike Meadows – Detroit Diesel Canada
Gaston Auclair – Deutz Canada
Diesel Engine Maintenance Audit ModelPhilippe Gaultier - Compañía Minera Antamina
Sheri Weeks – Nexfor Inc.Jennifer Penney – USWA
Implementation of Improved Maintenance and Case StudiesPeter Prince – Deutz Canada Sudbury
Brent Rubeli – DCL InternationalMike Meadows – Detroit Diesel Canada
Tom Serpell – Harper Detroit Diesel SudburyBob Whitcher – Toromont Caterpillar SudburyRobert Lafond – Toromont Caterpillar Sudbury
Emissions Measurement and AnalysisMichel Grenier and the group at NRCan – CANMET laboratories in Sudbury, OntarioDr. Mahe Gangal and the group at NRCan – CANMET laboratories in Bells Corners.
Ontario
The management and employees of Hudson Bay Mining & Smelting - Ruttan Mine
Falconbridge Ltd. – Strathcona MineHeather Langfeld, Parviz Farsangi, Rick Allair, Tom Semadeni, and Tim Hinds
and most importantly…..the mechanics from 3900 Shop!Scott Chisolm, Paul Chouinard, Ron DeCou, Phil Dube, Al Jones, Mike Lalonde, Denis
Laplante, Bruce Lapping, Norm Leger, Maurice Mainville, Paul Marcoux, Mike Robinson,Blair Sagle, Paul Serpell, Pat Sweeney, and Larry Thompson

Page 91
AAAPPPPPPEEENNNDDDIIIXXX III ––– MMMEEECCCHHHAAANNNIIICCC FFFEEEEEEDDDBBBAAACCCKKK
The following is a sample of written feedback from Strathcona Mine mechanicswho participated in the case studies. They were asked to respond to thequestions below following the completion of the case study.
How has the training changed your approach towards enginemaintenance?
“ Particulates is everyone’s concern for health reasons. It is interesting to seetraining courses like this offered when the mechanic’s feedback will belooked at or addressed. We should succeed by monitoring emissions on amonthly basis with the help and technology and cooperation.”
“ Last two days showed us how we can make improvements in our dailymaintenance with very little effort or cost to use”
“ My approach to engine maintenance and emissions will change now byhaving a better idea of what is involved in the emissions and knowing thatI can play a role in the reduction of emissions for my own benefit and thatof others. By understanding the maintenance of diesel engines and otherdevices at our disposal we can measure and reduce emissions greatly.”
Will you continue to use the new knowledge and approach afterthis course?
“Yes, especially the controls devices section. Again, the only limitation tousing this information may be a time factor but this is an area where Iwould be able to see an actual difference. I need to contribute to thequality of the environment down here.”
“ We must continue to use our new found knowledge if we are to continuerunning equipment U/G due to the new laws coming into effect, and to helpreduce maintenance costs.”
“Yes, for health reasons.”
“ I think I will, but the company will have to allow the time and not let itgo by the way side.”
Page 92
AAAPPPPPPEEENNNDDDIIIXXX IIIIII ––– MMMAAAIIINNNTTTEEENNNAAANNNCCCEEE AAAUUUDDDIIITTT TTTEEEMMMPPPLLLAAATTTEEE
The template for auditing diesel engine maintenance has been attached as a separatedocument.

Page 93
AAAPPPPPPEEENNNDDDIIIXXX IIIIIIIII ––– GGGUUUIIIDDDEEELLLIIINNNEEESSS AAANNNDDD BBBEEESSSTTT PPPRRRAAACCCTTTIIICCCEEESSS
The Guidelines and Best Practices for Diesel Engine Maintenance have been attachedas a separate document.