the state of the unions 2017 - midwest economic … · state-level policies designed to weaken...
TRANSCRIPT

September 4, 2017
Jill Manzo Midwest Economic Policy Institute
Monica Bielski Boris, Ph.D.
University of Minnesota
Frank Manzo IV, M.P.P.
Illinois Economic Policy Institute
Robert Bruno, Ph.D.
University of Illinois at Urbana-Champaign
A Profile of Unionization in Minnesota and in America
THE STATE OF THE UNIONS 2017

The State of the Unions 2017 i
Research Report September 4, 2017
THE STATE OF THE UNIONS 2017 A Profile of Unionization in Minnesota and in America
About the Authors
Jill Manzo is a Midwest Researcher at the Midwest Economic Policy Institute (MEPI), a division of the Illinois Economic Policy Institute. Her research focuses broadly on transportation infrastructure, economic development, and social justice and inequality. She earned a Bachelor of Arts in Political Science and International Studies from Iowa State University. She can be contacted at [email protected].
Monica Bielski Boris, Ph.D. is the director of the University of Minnesota Labor Education Service. She is an experienced labor educator who conducts research on union revitalization and worker diversity. Monica earned a Ph.D. and Master of Science in Industrial Relations from Rutgers University and a Bachelor of Arts from Oberlin College. She can be contacted at [email protected].
Frank Manzo IV, M.P.P. is the Policy Director of the Illinois Economic Policy Institute (ILEPI). His research focuses on labor market policies, income inequality, community and economic development, infrastructure investment, and public finance. He earned his Master of Public Policy from the University of Chicago Harris School of Public Policy and his Bachelor of Arts in Economics and Political Science from the University of Illinois at Urbana-Champaign. He can be contacted at [email protected].
Robert Bruno, Ph.D. is a Professor at the University of Illinois at Urbana-Champaign School of Labor and Employment Relations and is the Director of the School’s Labor Education Program. He also serves as Director of the Project for Middle Class Renewal at the University of Illinois at Urbana-Champaign. His research focuses broadly on working-class and union studies issues. He earned his Doctor of Philosophy in Political Theory from New York University and his Master of Arts in Political Science from Bowling Green State University. He can be contacted at [email protected].
MIDWEST ECONOMIC POLICY INSTITUTE
“A Higher Road for a Better Tomorrow”
P.O. Box 2378
La Grange, Illinois 60525 Phone: 708-375-1002 www.midwestepi.org
UNIVERSITY OF MINNESOTA
Labor Education Service, Carlson School of Management
321 19th Avenue South Minneapolis, MN 55455 Phone: 612-625-0027
www.carlsonschool.umn.edu
UNIVERSITY OF ILLINOIS AT URBANA-CHAMPAIGN
Labor Education Program &
Project for Middle Class Renewal
815 W. Van Buren Street, Suite 110 Chicago, Illinois 60607 Phone: 312-996-2624
www.illinoislabored.org

The State of the Unions 2017 ii
EXECUTIVE SUMMARY Labor unions increase individual incomes by lifting hourly wages. In Minnesota, unions raise worker wages by an average of 8.0 percent. The union wage differential, however, is higher for low-income workers in the state.
• The union wage premium is higher for the median income worker (10.7 percent) than the richest 10 percent of workers (7.2 percent).
• The union wage premium is particularly high for middle-class occupations, such as construction and extraction careers (30.6 percent), transportation and material moving jobs (25.2 percent), and service positions (12.3 percent).
• Unions help sustain a strong middle class and reduce income inequality. Unions also help to close racial and gender income gaps in the state.
• Unions increase the wages of white workers by 7.4 percent but boost the hourly earnings of non-white workers by 13.9 percent.
• The personal benefit to being a union member is 7.7 percent for men and 8.7 percent for women.
• Unions are one of the most effective anti-poverty institutions in Minnesota. Unionization has declined in Minnesota and in America since 2007.
• There are approximately 36,000 fewer union members in Minnesota today than there were in 2007.
• The decline in union membership has occurred in both the public sector and the private sector.
• The total number of labor unions and similar labor organizations declined from 324 to 314 worker establishments from 2006 to 2015.
As of 2016, the overall union membership rate is 14.2 percent in Minnesota:
• The number of union members has increased from 351,000 in 2012 to about 364,000 in 2016.
• Workers 45 to 54 years of age are the most unionized age cohort, with a union membership rate of 17.3 percent.
• Approximately 15.9 percent of workers who reside in the city center are unionized, 15.4 percent of workers who reside in rural areas are unionized, and 12.8 percent of workers who reside in the suburbs are unionized.
• By educational attainment, the most unionized workers in Minnesota hold Master’s degrees (29.9 percent) and associate’s degrees (17.3 percent).
Almost one half of all public sector workers are unionized in Minnesota. Meanwhile, slightly more than one-third of all public sector workers are unionized across the nation. In comparison, just one-in-12 (8.3 percent) Minnesotans who work in the private sector are union members and only 6.4 percent of private sector workers are now unionized across America. Union membership is influenced by a number of factors. Employment in the public sector, in construction, in transportation and utilities, in mining, in information, in educational and health services, and public administration all raise the chances that a given worker is a union member. On the other hand, workers employed in sales, management, business, financial, and professional positions, and those with professional or doctorate degrees are less likely to be unionized. Unions play a vital role in Minnesota’s economy and communities. The Minnesota labor movement, however, will continue to face both short- and long-term challenges. Reversing the trend of declining union membership rates remains a critical if uncertain task. Labor’s response to these challenges could define its influence and effectiveness in the decades to come.

The State of the Unions 2017 iii
TABLE OF CONTENTS Executive Summary ii
Introduction
1
Data and Limitations 2
Unionization Rates and Trends
3
Unionization by Demographics
4
Unionization by Education
7
Unionization by Sector, Industry, and Occupation
8
Predicting Union Membership in Minnesota 12
Union Wages Union and Nonunion Wages by Demographic Group Union Wage Premium by Industry and Occupation Data on Labor Union Establishments New in 2017: Collective-Bargaining States vs. “Right-to-Work” States
13
16
16
18
19 Conclusions
19
References Cover Photo Credits
20
22 Appendix
23

The State of the Unions 2017 1
INTRODUCTION An annual assessment of the institutional footprint of organized labor in Minnesota and America requires an acknowledgment that over the past six years there has been a partisan assault on worker organizing rights in many states. For example, since 2010 there have been 16 states that have passed laws restricting public employees’ collective bargaining rights (Lafer, 2013; Bruno, 2015). The most recent was a draconian law passed in Iowa that mirrors the damaging prohibitions enacted in Wisconsin in 2011 (Murphy, 2017). Another 19 states introduced “right-to-work” (RTW) bills and six states (Indiana, Michigan, Wisconsin, West Virginia, Kentucky and Missouri) have passed RTW laws (Manzo & Bruno, 2017). The nature of a state’s political environment directly corresponds to partisan control of the governorship and legislative branches. Where Republican governors and a majority of Republican legislators are in power, organized labor faces sustained political opposition. In every such case worker rights have been diluted, roll-backed or largely eliminated. Wisconsin serves as the most dramatic example of political retribution. In 2010, Republican Scott Walker was elected governor and the GOP took control of both legislative chambers. The next year, Walker successfully pushed a bill through the assembly (i.e., Act 10) that reduced public sector worker benefits and hollowed out the bargaining rights of government employees. Republicans subsequently passed a RTW law. Prior to Walker’s “crusade” and the Republican takeover, 14.2 percent of Wisconsin's workforce belonged to a union. By 2015, that figure had dropped to 8.3 percent, significantly below the national average for the first time in decades (Caldwell, 2017). Only in states where Democrats hold one or more of the branches of government– such as in Illinois, Minnesota, California, and New York– have unions not suffered political defeats. It is important to note the hostile political reality because it dramatically diverges from a far more bi-partisan framework that existed prior to the Great Recession of 2007. It also is a critical backdrop that cannot be ignored to the ways we interpret the changes in union membership and its associational effects. Union membership can fluctuate for many reasons, including economic restructuring, technological advancements, foreign trade deals, corporate domestic insourcing, employer opposition, and the level of new labor organizing. But it is undeniable that union membership has also been negatively impacted by state-level policies designed to weaken collective bargaining. While this report does not chronicle or assign responsibility to the changing union data, readers should examine the findings with an awareness of the relationship between political power and union membership. The labor movement has endured a gradual decline in both membership and influence. Almost one-in-four American workers (23.0 percent) were members of labor unions in 1980. Three and a half decades later, in 2016, only one-in-10 employed persons in America (10.7 percent) are unionized (Hirsch & Macpherson, 2017). Concurrently, as unionization rates have waned, income inequality has soared. Declining unionization and falling worker incomes are linked: The decline of organized labor accounts for between one-fifth and one-third of the growth in inequality (Western & Rosenfeld, 2011). The divergence between worker productivity and worker pay has also been largest in states where collective bargaining coverage has declined the most (Cooper & Mishel, 2015). Unions, however, continue to play a vital role in Minnesota’s economy and communities. While unionization has continued to decline in Minnesota, the state still has a higher unionization rate than the national average. This is in part due to labor-friendly administrations under current Governor Mark Dayton, past Governors, and the Minnesota Legislature. Additionally, the vibrant 15 Now Minnesota movement has increased activism and organizing in the state. On June 30, 2017, Minneapolis became one of the first cities in the nation to adopt a $15 minimum wage ordinance (Nelson, 2017). Moreover, in 2016, St. Paul and Minneapolis passed city ordinances that require private employers to provide their employees with paid sick leave. The ordinances allow employees to accrue an hour of earned sick leave for every 30 hours worked, earning up to six days of sick leave each year worked (Wagner, 2017). These organizing efforts have lifted thousands of workers’ wages and provided workers with necessary paid time off.
The State of the Unions 2017 2 This report, conducted by researchers at the Midwest Economic Policy Institute, the Illinois Economic Policy Institute, the University of Illinois Project for Middle Class Renewal, and the University of Minnesota, analyzes the course of unionization in Minnesota and in the United States from 2007 to 2016. It is the second annual report of its kind for union members in Minnesota. The report is modeled off of The State of the Unions 2016: A Profile of Unionization in Chicago, in Illinois, and in America (Manzo et al., 2016). That study is itself a replication of both The State of the Unions 2016: A Profile of Organized Labor in New York City, New York State, and the United States by the Joseph S. Murphy Institute for Worker Education and Labor Studies at the City University of New York Graduate Center (Milkman & Luce, 2016) and From ’15 to $15: The State of the Unions in California and its Key Cities in 2015 by the Institute for Research on Labor and Employment at the University of California, Los Angeles (Adler et al., 2015). The report tracks unionization rates and investigates union membership across demographic, educational, sectoral, industry, and occupational classifications. The study subsequently evaluates the impact that labor union membership has on a worker’s hourly wage in Minnesota and in America. Additionally, data on labor unions and similar labor organizations are included and analyzed. The report concludes by recapping key findings.
DATA AND LIMITATIONS This Research Report utilizes data from the Current Population Survey Outgoing Rotation Groups (CPS-ORG). The CPS-ORG is collected, analyzed, and released by the U.S. Department of Labor Bureau of Labor Statistics (BLS). CPS-ORG data reports individual-level information on 25,000 respondents nationwide each month. The records include data on wages, unionization, hours worked, sector, industry, and occupation, as well as other demographic, geographic, education, and work variables. The data was extracted from the user-friendly Center for Economic and Policy Research Uniform Data Extracts (CEPR, 2017). The 10-year dataset from 2007 to 2016 captures information on 3,174,846 individuals aged 16 to 85 in the United States. These observations include 1,897,393 persons with a job, of whom 195,476 reported that they were union members. Survey responses include information from 46,004 employed individuals in Minnesota. In 2016, respondents with at least one job totaled 2,627 in Minnesota and 185,630 nationwide. Analytic weights are provided by the Department of Labor to match the sample to the actual U.S. population 16 years of age or greater. These weights adjust the influence of an individual respondent’s answers on a particular outcome to compensate for demographic groups that are either underrepresented or overrepresented compared to the total population. The weights are applied throughout the analysis. There are limitations to the CPS-ORG dataset. First, the data reports a worker’s state of residence rather than state of employment, so the results may be biased by workers who live in one state but work in another (e.g., living in Wisconsin but working in Minnesota) and vice-versa. CPS-ORG data is also based on household survey responses, so the potential exists for respondents to be untruthful. Certain individuals such as undocumented workers may also be underreported if they are more difficult to reach by survey officials. Finally, every surveyed worker does not reply to the union membership question. For example, in 2016, union membership data was only available for 2,325 of the 2,627 surveyed workers (88.5 percent) in Minnesota. While this does not impact unionization rates, estimates are underreported for both total union workers and total nonunion employees. Economic data from the County Business Patterns (CBP) series from the U.S. Census Bureau is also used (Census, 2017). The CBP provides annual statistics for businesses with paid employees that are used to study economic activity and market trends. The data are published between 18 months and 24 months after the reference year, so there is a longer time lag compared to the release of CPS-ORG information.

The State of the Unions 2017 3
UNIONIZATION RATES AND TRENDS Since 2007, unionization has declined in Minnesota and the United States (Figure 1). The total union membership rate was 16.3 percent in Minnesota and 12.1 percent nationwide in 2007. Ten years later, both rates have fallen to 14.2 percent and 10.7 percent, respectively. The gradual decline in the unionization rate has translated into a decrease in union membership of about 36,000 workers in Minnesota since 2007, contributing to the 1.1 million-member national decline in union workers over that time (Figure 2).
FIGURE 1: UNIONIZATION RATES AND TOTAL UNION MEMBERSHIP, 2007-2016
Over the past 10 years, the peak of union membership in Minnesota was right before the Great Recession. In 2007, Minnesota had a unionization rate of 16.3 percent and over 400,000 total members. Membership reached a low in 2012, when only about 351,000 workers belonged to a union. Since 2012, the number of union members has increased by about 14,000 workers to 364,000 total members in 2016 (Figure 2). The size of the labor force has grown in Minnesota as the population has grown, making it harder for labor unions to maintain union density levels. An increase in the total number of members with a decrease in the unionization rate demonstrates active organizing among labor unions in Minnesota.
FIGURE 2: TOTAL UNION MEMBERS AND OVERALL UNIONIZATION RATES, 2007-2016
Minnesota USA
Year Members Rate Members Rate
2007 400,369 16.27% 15,670,352 12.08%
2008 391,663 16.12% 16,097,535 12.44%
2009 361,907 15.08% 15,327,280 12.31%
2010 384,570 15.58% 14,715,061 11.86%
2011 370,522 15.06% 14,754,673 11.78%
2012 350,503 14.22% 14,349,358 11.25%
2013 361,909 14.29% 14,515,755 11.24%
2014 360,297 14.18% 14,569,936 11.08%
2015 361,831 14.12% 14,786,281 11.05%
2016 364,143 14.21% 14,549,640 10.69%
Average 370,771 14.91% 14,933,587 11.58%
Finally, despite the decline in unionization, Minnesota’s union membership rate has consistently been above the national average. The 10-year combined Minnesota unionization rate was 14.9 percent, 3.3
0%
5%
10%
15%
20%
20
07
20
08
20
09
20
10
20
11
20
12
20
13
20
14
20
15
20
16
Unionization Rates by Region
USA Minnesota
250,000
300,000
350,000
400,000
450,000
20
07
20
08
20
09
20
10
20
11
20
12
20
13
20
14
20
15
20
16
Union Membership
Minnesota Trend

The State of the Unions 2017 4 percentage points higher than the 11.6 percent national rate. On a year-by-year basis, Minnesota’s union membership rate has ranged from 2.7 to 4.2 percentage points higher than the national average (Figure 2).
UNIONIZATION BY DEMOGRAPHICS Falling rates of unionization have reflected declines in union membership among both men and women in Minnesota (Figure 3). An estimated 17.8 percent of employed men were unionized in 2007, but the 2016 male unionization rate in Minnesota fell to 14.6 percent, a 2.2 percentage-point drop. The male unionization rate has also decreased in the nation as a whole. Since 2007, male union density has dropped by 1.8 percentage points in the United States.
Furthermore, female union membership has also dropped in Minnesota and nationwide. Female union density in Minnesota was 14.7 percent in 2007 but fell to 13.8 percent in 2016, a 0.9 percentage-point decrease over the past 10 years (Figure 3). Nationwide, female union membership has also dipped by 0.9 percentage point since 2007.
FIGURE 3: GRAPHS OF UNIONIZATION RATES BY GENDER, 2007-2016
As of 2016, 14.6 percent of men and 13.8 percent of women are union members in Minnesota. Male unionization slightly increased for males from 2015 to 2016 (+0.4 percentage point) in Minnesota, while
0%
5%
10%
15%
20%
25%
20
07
20
08
20
09
20
10
20
11
20
12
20
13
20
14
20
15
20
16
Male
Minnesota USA
0%
5%
10%
15%
20%
25%
20
07
20
08
20
09
20
10
20
11
20
12
20
13
20
14
20
15
20
16
Female
Minnesota USA
0%
5%
10%
15%
20%
20
07
20
08
20
09
20
10
20
11
20
12
20
13
20
14
20
15
20
16
Unionization Rates by Gender
Male Female Trends
14.6% 13.8%11.5% 10.6%
0%
5%
10%
15%
20%
Male Female
2016 Unionization Rates by Gender
Minnesota USA

The State of the Unions 2017 5 unionization slightly decreased for females from 2015 to 2016 (-0.2 percentage point) in the state. Unionization rates are higher in Minnesota than the U.S. average for both men and women.
White, non-Latinos are more unionized than their non-white counterparts (Figure 4). The unionization rate for white, non-Latino workers is 14.6 percent in Minnesota and 11.0 percent in the United States. In comparison, non-white union density is 12.4 percent in the state and 10.2 percent across the nation.
Over time, union membership has fallen for white/non-Latino workers, but has slightly risen for non-white workers (Figure 5). From 2007 to 2016, unionization in Minnesota fell by 2.4 percentage points for white, non-Latino workers and rose by 0.6 percentage point for all other non-white workers. This may be a result of an effort by building trades unions to recruit more workers of color; the rates of People of Color in apprenticeship programs has steadily increased in Minnesota (St. Anthony, 2016). It is worth noting, however, that non-white union membership estimates fluctuate from year to year due to relatively smaller sample sizes. Nonetheless, Minnesota continues to have more unionized white, non-Latino workers and more unionized non-white workers than the national average.
FIGURE 4: UNIONIZATION RATES BY RACIAL OR ETHNIC IDENTIFICATION, 2016
FIGURE 5: GRAPHS OF UNIONIZATION RATES BY RACIAL OR ETHNIC IDENTIFICATION, 2007-2016
Unionization rates are much higher for middle-aged workers than young workers (Figure 6). Unionization rates are highest for workers between the ages of 35 and 64 years old. Specifically, the most unionized
14.6%12.4%
11.0%10.2%
0%
5%
10%
15%
20%
White non-Latino Non-White
2016 Unionization Rates by Race/Ethnicity
Minnesota USA
0%
5%
10%
15%
20%
25%
20
07
20
08
20
09
20
10
20
11
20
12
20
13
20
14
20
15
20
16
White/Non-Latino
Minnesota USA
0%
5%
10%
15%
20%
25%
20
07
20
08
20
09
20
10
20
11
20
12
20
13
20
14
20
15
20
16
Non-White
Minnesota USA

The State of the Unions 2017 6 age groups are those aged 45 to 54. Of workers in this age cohort, 17.3 percent are unionized in Minnesota and 13.4 percent are unionized across the United States. The second-most unionized age cohort in Minnesota is those between the ages of 55 and 64, with a unionization rate of 16.4 percent. Aside from the workers aged 65 and older, unionization rates in Minnesota exceed the comparable U.S. average by age (Figure 6).
FIGURE 6: UNIONIZATION RATES BY AGE GROUP, 2016
FIGURE 7: AVERAGE AGE OF UNION AND NONUNION WORKERS, 2016 2016 Age (Years)
Variable Nonunion Union
Minnesota 41.27 43.68
USA 40.95 44.38
FIGURE 8: UNIONIZATION RATES OF SELECT DEMOGRAPHIC VARIABLES, 2015
Union organizing of young workers in the labor force has been relatively limited. For young workers aged 16 to 24, unionization rates are about 5 percent for Minnesota and the nation (Figure 6). Additionally, the average age of union workers is around 44 years old and the average age of nonunion workers is just under 41 years old, regardless of region studied (Figure 7).
5.1%
15.5% 14.8%
17.3% 16.4%
8.9%
4.4%
9.2%
12.0%13.4% 13.4%
9.5%
0%
5%
10%
15%
20%
25%
Age: 16-24 Age: 25-34 Age: 35-44 Age: 45-54 Age: 55-64 Age: 65+
2016 Unionization Rates by Age
Minnesota USA
10.2%
14.6%12.7%
16.2%
8.3%
11.3%
14.6%12.2%
0%
5%
10%
15%
20%
Foreign-Born Native-Born andNaturalized Citzens
Veteran Married
2016 Unionization Rates by Demographic
Minnesota USA
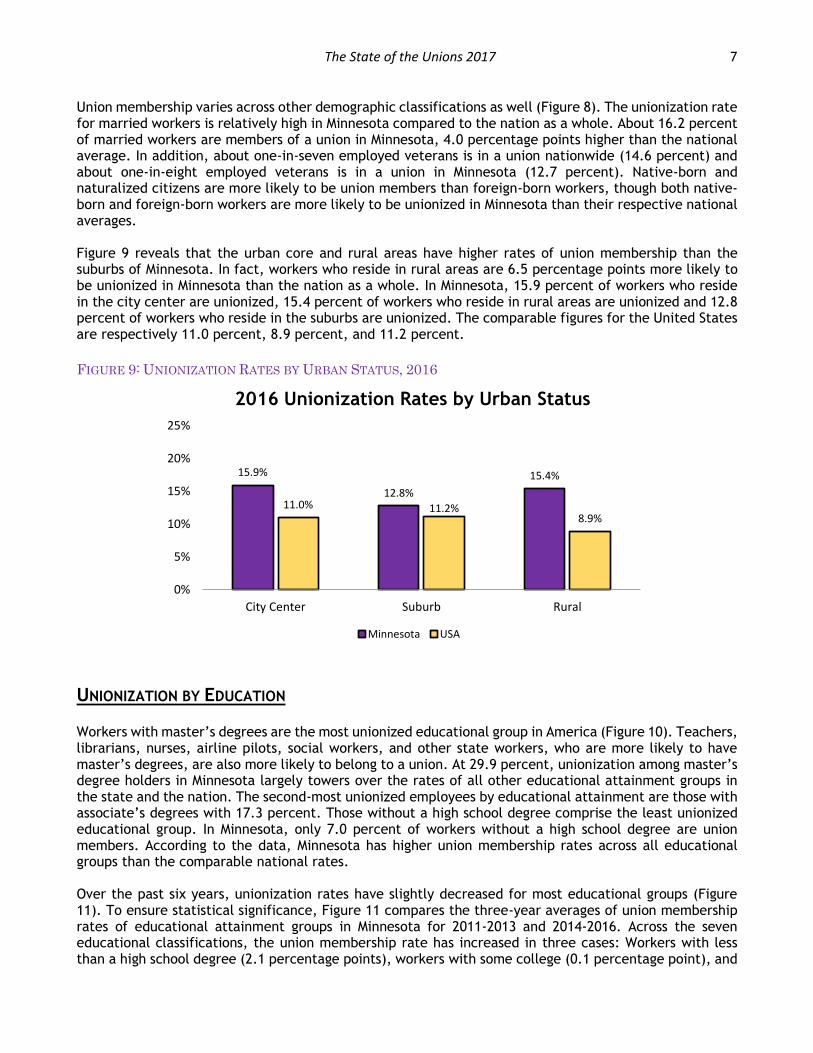
The State of the Unions 2017 7 Union membership varies across other demographic classifications as well (Figure 8). The unionization rate for married workers is relatively high in Minnesota compared to the nation as a whole. About 16.2 percent of married workers are members of a union in Minnesota, 4.0 percentage points higher than the national average. In addition, about one-in-seven employed veterans is in a union nationwide (14.6 percent) and about one-in-eight employed veterans is in a union in Minnesota (12.7 percent). Native-born and naturalized citizens are more likely to be union members than foreign-born workers, though both native-born and foreign-born workers are more likely to be unionized in Minnesota than their respective national averages. Figure 9 reveals that the urban core and rural areas have higher rates of union membership than the suburbs of Minnesota. In fact, workers who reside in rural areas are 6.5 percentage points more likely to be unionized in Minnesota than the nation as a whole. In Minnesota, 15.9 percent of workers who reside in the city center are unionized, 15.4 percent of workers who reside in rural areas are unionized and 12.8 percent of workers who reside in the suburbs are unionized. The comparable figures for the United States are respectively 11.0 percent, 8.9 percent, and 11.2 percent.
FIGURE 9: UNIONIZATION RATES BY URBAN STATUS, 2016
UNIONIZATION BY EDUCATION Workers with master’s degrees are the most unionized educational group in America (Figure 10). Teachers, librarians, nurses, airline pilots, social workers, and other state workers, who are more likely to have master’s degrees, are also more likely to belong to a union. At 29.9 percent, unionization among master’s degree holders in Minnesota largely towers over the rates of all other educational attainment groups in the state and the nation. The second-most unionized employees by educational attainment are those with associate’s degrees with 17.3 percent. Those without a high school degree comprise the least unionized educational group. In Minnesota, only 7.0 percent of workers without a high school degree are union members. According to the data, Minnesota has higher union membership rates across all educational groups than the comparable national rates. Over the past six years, unionization rates have slightly decreased for most educational groups (Figure 11). To ensure statistical significance, Figure 11 compares the three-year averages of union membership rates of educational attainment groups in Minnesota for 2011-2013 and 2014-2016. Across the seven educational classifications, the union membership rate has increased in three cases: Workers with less than a high school degree (2.1 percentage points), workers with some college (0.1 percentage point), and
15.9%
12.8%
15.4%
11.0% 11.2%8.9%
0%
5%
10%
15%
20%
25%
City Center Suburb Rural
2016 Unionization Rates by Urban Status
Minnesota USA

The State of the Unions 2017 8 workers with a Master’s degree (1.0 percentage point). The largest declines in unionization were for individuals with a high school degree (-1.5 percentage points) and individuals with a professional or doctorate degree (-2.2 percentage points).
FIGURE 10: UNIONIZATION RATES BY EDUCATIONAL ATTAINMENT OR STATUS, 2016
FIGURE 11: CHANGE IN UNIONIZATION RATES BY EDUCATION, THREE-YEAR AVERAGES, 2011-2016 Minnesota
Variable 2011-13 2014-16 Change
Less than High School 4.79% 6.83% +2.1%
High School 13.18% 11.71% -1.5%
Some College, No Degree 11.49% 11.58% +0.1%
Associates 18.42% 17.76% -0.7%
Bachelors 13.70% 12.59% -1.1%
Masters 27.25% 28.21% +1.0%
Professional/Doctorate 14.00% 11.84% -2.2%
UNIONIZATION BY SECTOR, INDUSTRY, AND OCCUPATION Unionization rates are significantly higher for public sector workers (Figure 12). Almost one half of all public sector workers are unionized in Minnesota (46.0 percent) compared to one out of every 12 private sector workers in the state (8.3 percent). Minnesota has a significantly higher unionization rate in the public sector than the nation (34.4 percent); public sector unionization is almost 12 percentage points higher in Minnesota. Minnesota also has slightly more unionized workers in the private sector than the national average. In general, the most unionized public sector group is local government employees, including teachers, with just over half of workers belonging to a union in Minnesota (50.7 percent). Federal government employees command the second-highest unionization rate in Minnesota (45.0 percent). About 39.4 percent of all state government workers belong to a union. Unionization is higher in Minnesota across all sectors and all levels of government compared to the United States average. Public sector unionization is over five times as high as private sector unionization (Figure 12).
7.0%
11.2% 10.7%
17.3%
12.4%
29.9%
16.3%
5.7%
10.0% 9.8%12.1%
10.4%
18.1%
9.7%
0%
5%
10%
15%
20%
25%
30%
35%
Less than HighSchool
High School Some College,No Degree
Associates Bachelors Masters Professional orDoctorate
2016 Unionization Rates by Education
Minnesota USA

The State of the Unions 2017 9
FIGURE 12: UNIONIZATION RATES BY SECTOR OR LEVEL OF GOVERNMENT, 2016
Public sector unionization in Minnesota has fluctuated over time (Figure 13). While private sector unionization has gradually decreased in Minnesota and the United States, public sector union membership experienced gains in Minnesota from 2009 to 2011, but has since declined. Nationwide, public sector unionization has marginally declined throughout the last 10 years. In Minnesota, 2007 union membership rates were 54.9 percent for public sector workers and 9.6 percent for private sector workers. Today, the union membership rate for public sector workers is 8.9 percentage points lower and the analogous private sector rate is 1.2 percentage point lower than in 2007. There has been variability in the public sector unionization rates over the past 10 years, with both growth and decline. Nevertheless, both public sector unionization and private sector unionization have consistently been higher than their respective national averages.
FIGURE 13: UNIONIZATION RATES BY SECTOR, 2007-2016
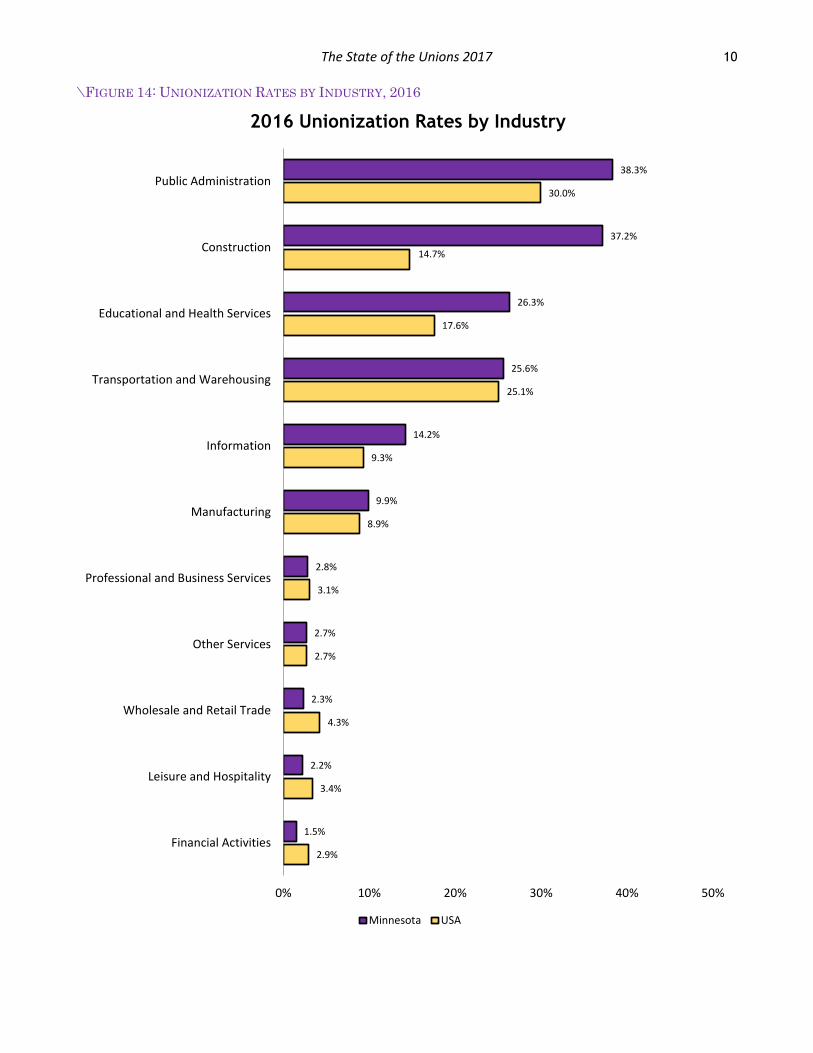
Union membership varies significantly by industry of employment (Figure 14). The top five industries by unionization rates in Minnesota are public administration (38.3 percent); construction (37.2 percent); educational and health services (26.3 percent); transportation and warehousing (25.6 percent); and information (14.2 percent). The least-unionized industries generally are wholesale and retail trade; leisure and hospitality; and financial activities.
8.3%
46.0% 45.0%
50.7%
39.4%
6.4%
34.4%
27.4%
40.3%
29.6%
0%
10%
20%
30%
40%
50%
60%
Private Sector Public Sector Federal government Local government State government
2016 Unionization Rates by Sector
Minnesota USA
0%
10%
20%
30%
40%
50%
60%
70%
20
07
20
08
20
09
20
10
20
11
20
12
20
13
20
14
20
15
20
16
Public vs. Private
MinnesotaPublic
MinnesotaPrivate
USA Public
USA Private0%
10%
20%
30%
40%
50%
60%
70%
20
07
20
08
20
09
20
10
20
11
20
12
20
13
20
14
20
15
20
16
Unionization Rates by Sector
Private Sector Public Sector Trends
The State of the Unions 2017 10 \FIGURE 14: UNIONIZATION RATES BY INDUSTRY, 2016
38.3%
37.2%
26.3%
25.6%
14.2%
9.9%
2.8%
2.7%
2.3%
2.2%
1.5%
30.0%
14.7%
17.6%
25.1%
9.3%
8.9%
3.1%
2.7%
4.3%
3.4%
2.9%
0% 10% 20% 30% 40% 50%
Public Administration
Construction
Educational and Health Services
Transportation and Warehousing
Information
Manufacturing
Professional and Business Services
Other Services
Wholesale and Retail Trade
Leisure and Hospitality
Financial Activities
2016 Unionization Rates by Industry
Minnesota USA

The State of the Unions 2017 11 Figures 15 and 16 present industry breakdowns of total union membership in Minnesota compared to total employment in the state. In Figure 15, industries are organized in descending order by unionization rate and weighted estimates are rounded to the nearest thousand. Note that the estimates include all occupations within an industry. The construction industry, for example, includes white-collar workers who typically are not union members, such as lawyers, office support workers, and architects. The top five industries with the most union members in Minnesota are educational and health services (176,000 members), construction (50,000 members), manufacturing (42,000 members), public administration (36,000 members), and transportation and warehousing (28,000 members) (Figure 15). Together, union members from these five industries account for over 90 percent of all union workers in Minnesota (Figure 16).
FIGURE 15: MINNESOTA INDUSTRY UNIONIZATION RATES, EMPLOYMENT, AND UNION MEMBERS, 2016 Minnesota
(2016)
Unionization
Rate
Total
Employment
Total Union
Members
Total
Sample
Public Administration 38.32% 95,000 36,000 88
Construction 37.15% 134,000 50,000 120
Educational & Health Services 26.33% 667,000 176,000 616
Transportation & Warehousing 25.62% 110,000 28,000 103
Information 14.20% 33,000 5,000 31
Manufacturing 9.87% 423,000 42,000 387
Professional & Business Services 2.84% 240,000 7,000 267
Other Services 2.69% 94,000 3,000 83
Wholesale & Retail Trade 2.33% 325,000 8,000 292
Leisure & Hospitality 2.23% 210,000 5,000 183
Financial Activities 1.48% 224,000 3,000 201
FIGURE 16: COMPOSITION OF MINNESOTA UNION WORKFORCE BY INDUSTRY, 2016
10.1%
13.8%
48.6%
7.8%
1.3%
11.5%
1.9%
0.7% 2.1%
1.3%
0.9%
Union Members by Industry
Public Administration
Construction
Educational and Health Services
Transportation and Warehousing
Information
Manufacturing
Professional and Business Services
Other Services
Wholesale and Retail Trade
Leisure and Hospitality
Financial Activities

The State of the Unions 2017 12 A cautionary note: Grouping the data by industry results in relatively small sample sizes. Thus, the statistics in Figures 16 through 18 are simply estimates. Nevertheless, they are informative in that they shed light on the state’s union membership and provide general parameters on the composition of the union workforce. Lastly, Figure 17 depicts unionization rates by occupation. In Minnesota, the most unionized occupation groups are construction and extraction occupations such as carpenters and operating engineers (45.6 percent); installation, maintenance, and repair occupations such as mechanics (30.8 percent); and professional and related occupations including teachers (25.3 percent). Compared to the nation, unionization rates in these three occupations are significantly higher in Minnesota. Union membership in construction and extraction occupations, as an example, is 27.2 percentage points higher in Minnesota than the comparable United States average. The least-unionized occupations are sales and related jobs; management, business, and financial careers; and service occupations in Minnesota.
FIGURE 17: UNIONIZATION RATES BY OCCUPATION, 2016
Occupation (2016) Minnesota USA
Management, Business, & Financial 5.2% 4.6%
Professional & Related 25.3% 16.1%
Service 7.9% 9.6%
Sales & Related 3.9% 3.1%
Office & Administrative Support 11.3% 9.4%
Construction & Extraction 45.6% 18.4%
Installation, Maintenance, & Repair 30.8% 13.3%
Production 12.5% 11.8%
Transportation & Material Moving 12.3% 15.6%
PREDICTING UNION MEMBERSHIP IN MINNESOTA An advanced analytic model is developed to predict the chances that any given worker is a union member in Minnesota, using data from 2014 through 2016. The model, which is detailed in the Table A of the Appendix, reports how statistically significant variables increase or decrease one’s probability of being a union member. The analysis includes data on 8,151 Minnesota workers, and weights are applied to match the sample to the actual Minnesota population. Given that Minnesota averaged about 2.9 million workers over this time, the sample size would yield a normal ±1.1 percent margin of error in a standard survey report. Many factors increase the likelihood that an employed person is a union member in Minnesota (Figure 18). Relative to workers in the private sector, employment in state government, the largest contributor to an individual’s chances of being a union member, raises the probability by 20.2 percentage points on average. Local and federal government employment respectively increase the union probability by 19.2 percentage points and 17.7 percentage points. Relative to a comparable individual in manufacturing, a Minnesota worker’s chance of being a union member is between 4 and 17 percentage points more likely in each of the following industries: mining, transportation and utilities, educational and health services, construction, public administration, and information. Being a United States citizen also increases the chances of being a union member in Minnesota by about 5 percentage points. Some educational, occupational, and industry factors contribute negatively to the probability that a worker is in a union. Holding a professional or doctorate degree reduces the likelihood that a worker is a union member by 8.7 percentage points. Compared to the manufacturing industry, the financial activities, professional and related services, other services industries reduce the chances of unionization by between 5 and 6 percentage points. Additionally, workers in service, office, administrative support, sales,

The State of the Unions 2017 13 management, business, financial, and professional positions are all 6 to 17 percentage points less likely to be union members than similar workers in production occupations.
FIGURE 18: PROBABILITY OF BEING A UNION MEMBER IN MINNESOTA, LARGEST FACTORS, 2014-2016
Probability of Union Membership Minnesota Mean
Predictor Percentage Point Change
Sector: State government +20.20%
Sector: Local government +19.22%
Sector: Federal government +17.69%
Industry: Mining +16.72%
Industry: Transportation & utilities +9.41%
Occupation: Construction & extraction +8.34%
Industry: Educational & health services +8.25%
Industry: Construction +6.33%
Industry: Public Administration +5.00%
Status: Citizen +4.96%
Industry: Information +4.16%
Industry: Professional & business services -4.67%
Industry: Financial activities -5.37%
Occupation: Sales & related -5.65%
Industry: Other services -5.78%
Occupation: Professional & related -5.94%
Occupation: Service -6.63%
Education: Professional or doctorate degree -8.71%
Occupation: Office & administrative support -8.73%
Occupation: Management, business, & financial -16.81%
Constant 13.77%
Observations 8,151
Source: CPS-ORG, Center for Economic and Policy Research Uniform Data Extracts, 2014-2016. Only statistically significant variables with a coefficient over ±5.0 percent are displayed in the figure. Occupation dummies are relative to “production” occupations and industry dummies are relative to “manufacturing.” For more, see the Appendix.
UNION WAGES Unionized workers typically earn more than their nonunion counterparts (Figure 19). Figure 19 graphically illustrates the difference between the average union wage and the average nonunion wage in Minnesota and the United States by both percentage benefit and actual per-hour dollar benefit. The results do not control for other factors which may increase a worker’s wages (e.g., education, occupation, industry, age, etc.). The raw averages show that, regardless of geography and time, union membership has been positively correlated with increased worker wages. Nationwide, union membership continues to raise worker wages by about $4.00 per hour, or by about 17 percent. The gap between union and nonunion wages appears to be smaller in Minnesota. Over the past three years, the union wage difference in Minnesota has been $2.62 per hour, $1.64 per hour, and $2.95 per hour (Figure 20). Unions raise individual incomes by lifting wages per hour. The data presented in Figure 19 may overstate or understate the union wage effect because union members may be more or less likely to have characteristics associated with higher wages such as age, education, job experience, and geographic location. Regression analyses (OLS and quantile regressions) are utilized to control for these and similar factors in order to isolate the effect of unionization on wages and report them in Figure 20. The national average further controls for an individual respondent’s state

The State of the Unions 2017 14 of residence. Data are for employed persons aged 16 and older from 2014 through 2016 and are based on the natural logarithm of hourly wages to “normalize the data” and analyze the results in percentage terms. For more on the union wage premium regressions, see Table B in the Appendix.
FIGURE 19: UNION WAGE DIFFERENCES, PERCENTAGE AND DOLLAR VALUES, 2007-2016
FIGURE 20: WAGES OF UNION AND NONUNION WORKERS, 2016
Minnesota USA
Variable Nonunion Union Nonunion Union
Wage $25.59 $28.54 $23.81 $27.73
Union Difference, % +11.54% +16.49%
Union Difference, $ +$2.95 +$3.93
After controlling for education, demographics, and employment factors, the union wage premium is higher but aligns with the differences reported in Figures 19 and 20 (Figure 21). On average, unions are found to increase a worker’s per-hour wage by 10.6 percent in the United States. In Minnesota, the union wage premium is an estimated 8.0 percent on average as well, holding all else constant (including occupation and industry). Both results are significant, even at the 1-percent level – which means they are statistically meaningful with 99 percent confidence.
FIGURE 21: REGRESSIONS OF UNION WAGE PREMIUMS FOR AMERICA AND MINNESOTA, 2014-2016 Union Wage Premium: Ordinary Least Squares (OLS) and Quantile Regressions, 2014-2016
USA Minnesota
Mean Mean Bottom 10% Bottom 25% Median Top 25% Top 10% Top 1%
10.58%*** 7.97%*** 8.04%*** 8.87%*** 10.72%*** 10.84%*** 7.18%*** -16.95%***
R2=0.449 R2=0.471 R2=0.212 R2=0.294 R2=0.325 R2=0.325 R2=0.313 R2=0.187
Three asterisks (***) indicate significance at the 1-percent level. Two asterisks (**) indicates significance at the 5-percent level. Source: CPS-ORG, Center for Economic and Policy Research Uniform Data Extracts, 2014-2016. Statistics are adjusted by the outgoing rotation group earnings weight to match the total population 16 years of age or older. For more, see the Appendix.
A unique analytical tool, called a quantile regression, permits evaluation of the union wage premium across the wage distribution. While union membership is statistically associated with an 8.0 percent increase in the average Minnesota worker’s wage, the benefit is actually higher for those at the middle-to-bottom of the state’s hourly income distribution (Figure 21). In fact, over the past three years, the union wage effects produced hourly earnings that were 8.9 percent higher for the bottom 25 percent of workers and 10.7 percent for the median worker. But the union wage premium for the richest 10 percent
0%
5%
10%
15%
20%
25%
20
07
20
08
20
09
20
10
20
11
20
12
20
13
20
14
20
15
20
16
Union Wage Premiums, %
Minnesota USA
$0.00
$1.00
$2.00
$3.00
$4.00
$5.00
20
07
20
08
20
09
20
10
20
11
20
12
20
13
20
14
20
15
20
16
Union Wage Premiums, $
Minnesota USA
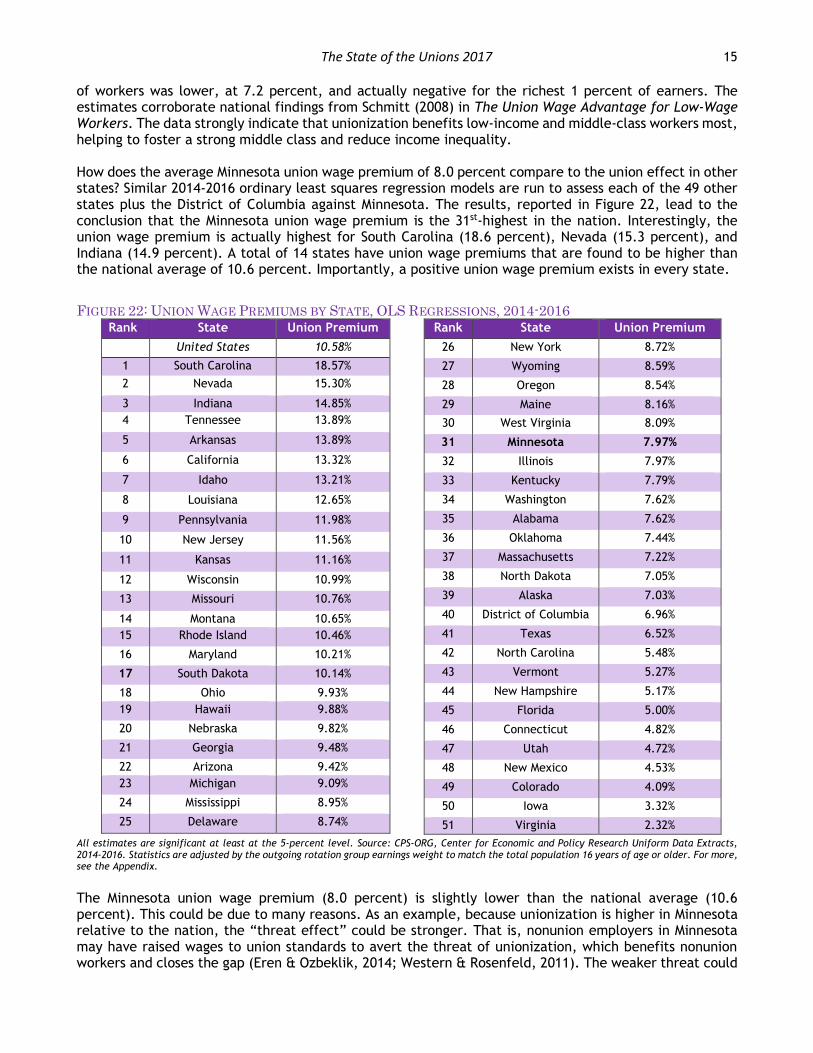
The State of the Unions 2017 15 of workers was lower, at 7.2 percent, and actually negative for the richest 1 percent of earners. The estimates corroborate national findings from Schmitt (2008) in The Union Wage Advantage for Low-Wage Workers. The data strongly indicate that unionization benefits low-income and middle-class workers most, helping to foster a strong middle class and reduce income inequality. How does the average Minnesota union wage premium of 8.0 percent compare to the union effect in other states? Similar 2014-2016 ordinary least squares regression models are run to assess each of the 49 other states plus the District of Columbia against Minnesota. The results, reported in Figure 22, lead to the conclusion that the Minnesota union wage premium is the 31st-highest in the nation. Interestingly, the union wage premium is actually highest for South Carolina (18.6 percent), Nevada (15.3 percent), and Indiana (14.9 percent). A total of 14 states have union wage premiums that are found to be higher than the national average of 10.6 percent. Importantly, a positive union wage premium exists in every state.
FIGURE 22: UNION WAGE PREMIUMS BY STATE, OLS REGRESSIONS, 2014-2016Rank State Union Premium
United States 10.58%
1 South Carolina 18.57%
2 Nevada 15.30%
3 Indiana 14.85%
4 Tennessee 13.89%
5 Arkansas 13.89%
6 California 13.32%
7 Idaho 13.21%
8 Louisiana 12.65%
9 Pennsylvania 11.98%
10 New Jersey 11.56%
11 Kansas 11.16%
12 Wisconsin 10.99%
13 Missouri 10.76%
14 Montana 10.65%
15 Rhode Island 10.46%
16 Maryland 10.21%
17 South Dakota 10.14%
18 Ohio 9.93%
19 Hawaii 9.88%
20 Nebraska 9.82%
21 Georgia 9.48%
22 Arizona 9.42%
23 Michigan 9.09%
24 Mississippi 8.95%
25 Delaware 8.74%
Rank State Union Premium
26 New York 8.72%
27 Wyoming 8.59%
28 Oregon 8.54%
29 Maine 8.16%
30 West Virginia 8.09%
31 Minnesota 7.97%
32 Illinois 7.97%
33 Kentucky 7.79%
34 Washington 7.62%
35 Alabama 7.62%
36 Oklahoma 7.44%
37 Massachusetts 7.22%
38 North Dakota 7.05%
39 Alaska 7.03%
40 District of Columbia 6.96%
41 Texas 6.52%
42 North Carolina 5.48%
43 Vermont 5.27%
44 New Hampshire 5.17%
45 Florida 5.00%
46 Connecticut 4.82%
47 Utah 4.72%
48 New Mexico 4.53%
49 Colorado 4.09%
50 Iowa 3.32%
51 Virginia 2.32%
All estimates are significant at least at the 5-percent level. Source: CPS-ORG, Center for Economic and Policy Research Uniform Data Extracts, 2014-2016. Statistics are adjusted by the outgoing rotation group earnings weight to match the total population 16 years of age or older. For more, see the Appendix.
The Minnesota union wage premium (8.0 percent) is slightly lower than the national average (10.6 percent). This could be due to many reasons. As an example, because unionization is higher in Minnesota relative to the nation, the “threat effect” could be stronger. That is, nonunion employers in Minnesota may have raised wages to union standards to avert the threat of unionization, which benefits nonunion workers and closes the gap (Eren & Ozbeklik, 2014; Western & Rosenfeld, 2011). The weaker threat could

The State of the Unions 2017 16 also explain why the union premium is particularly in some right-to-work states such as South Carolina or Indiana.
UNION AND NONUNION WAGES BY DEMOGRAPHIC GROUP By benefiting low-income and middle-class workers most, unionization also helps close the racial and gender inequality gap in Minnesota. After controlling for education, demographics, and employment factors, the union wage premium is higher for non-white workers in Minnesota (Figure 23). While the union wage premium is 8.0 percent in Minnesota, the personal benefit to being a union member is 13.9 percent on average for non-white workers. The union wage premium is also a strong 7.4 percent advantage for white, non-Latino workers in Minnesota. Accordingly, one of the most effective ways to reduce racial income inequality in the state would be to increase the relatively low unionization rate of non-white workers. Unions are one of the most effective anti-poverty institutions in Minnesota.
FIGURE 23: REGRESSIONS OF UNION WAGE PREMIUMS BY RACIAL IDENTIFICATION, 2014-2016
Union Wage Premium: Ordinary Least Squares (OLS), 2013-2015
State Mean Racial Identification: White Racial Identification: Nonwhite
7.97%*** 7.37%*** 13.91%***
R2=0.471 R2=0.461 R2=0.462
Three asterisks (***) indicate significance at the 1-percent level. Two asterisks (**) indicates significance at the 5-percent level. Source: CPS-ORG, Center for Economic and Policy Research Uniform Data Extracts, 2014-2016. Statistics are adjusted by the outgoing rotation group earnings weight to match the total population 16 years of age or older. For more, see the Appendix.
Similarly, after controlling for other observable factors, the union wage premium is positive for both genders but is larger for female workers (Figure 24). While the union wage premium is 8.0 percent in Minnesota, the personal benefit to being a union member is 7.7 percent on average for men and a strong 8.7 percent advantage for women. Unionization helps female workers close the gender-based wage gap, especially compared to nonunion male workers.
FIGURE 24: REGRESSIONS OF UNION WAGE PREMIUMS BY GENDER IDENTIFICATION, 2014-2016
Union Wage Premium: Ordinary Least Squares (OLS), 2013-2015
State Mean Gender Identification: Male Gender Identification: Female
7.97%*** 7.71%*** 8.68%***
R2=0.471 R2=0.469 R2=0.467
Three asterisks (***) indicate significance at the 1-percent level. Two asterisks (**) indicates significance at the 5-percent level. Source: CPS-ORG, Center for Economic and Policy Research Uniform Data Extracts, 2014-2016. Statistics are adjusted by the outgoing rotation group earnings weight to match the total population 16 years of age or older. For more, see the Appendix.
UNION WAGE PREMIUM BY INDUSTRY AND OCCUPATION
Certain industries and occupations have higher union wage premiums than others. The sizeable differences in wage premiums by major industry and major occupation are displayed in Figures 25 and 26. Notably, the most-unionized industries and occupations tend to have the highest wage premiums.
Industries are defined as a group of establishments, firms, and occupations which produce similar products or provide similar services. Industries include all occupational classifications. Therefore, Minnesota’s transportation and utilities industry includes truck drivers, transit and grounds workers, airplane pilots, CEOS and owners of transportation companies, and administrative office workers, among other positions. It must be noted that there are some limitations to the data since every Minnesota employee that works for a transportation or utility company is included in the wage premium analysis. This is true of all industries in this section.
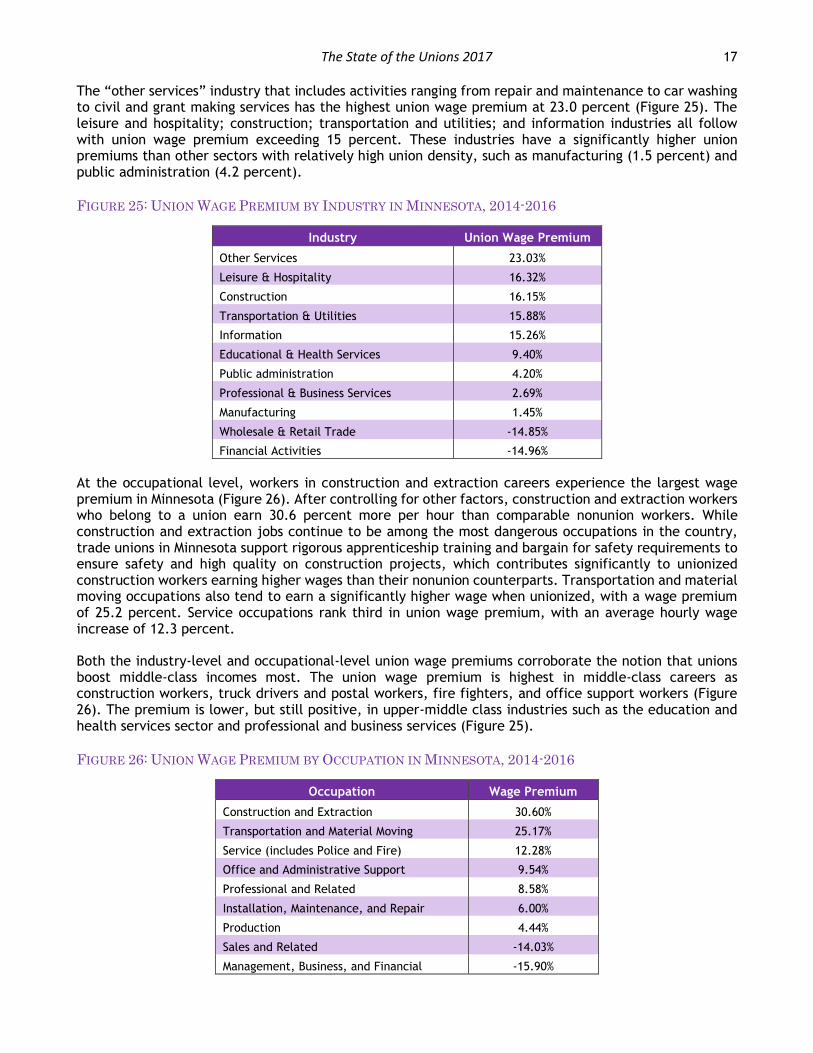
The State of the Unions 2017 17 The “other services” industry that includes activities ranging from repair and maintenance to car washing to civil and grant making services has the highest union wage premium at 23.0 percent (Figure 25). The leisure and hospitality; construction; transportation and utilities; and information industries all follow with union wage premium exceeding 15 percent. These industries have a significantly higher union premiums than other sectors with relatively high union density, such as manufacturing (1.5 percent) and public administration (4.2 percent).
FIGURE 25: UNION WAGE PREMIUM BY INDUSTRY IN MINNESOTA, 2014-2016
Industry Union Wage Premium
Other Services 23.03%
Leisure & Hospitality 16.32%
Construction 16.15%
Transportation & Utilities 15.88%
Information 15.26%
Educational & Health Services 9.40%
Public administration 4.20%
Professional & Business Services 2.69%
Manufacturing 1.45%
Wholesale & Retail Trade -14.85%
Financial Activities -14.96%
At the occupational level, workers in construction and extraction careers experience the largest wage premium in Minnesota (Figure 26). After controlling for other factors, construction and extraction workers who belong to a union earn 30.6 percent more per hour than comparable nonunion workers. While construction and extraction jobs continue to be among the most dangerous occupations in the country, trade unions in Minnesota support rigorous apprenticeship training and bargain for safety requirements to ensure safety and high quality on construction projects, which contributes significantly to unionized construction workers earning higher wages than their nonunion counterparts. Transportation and material moving occupations also tend to earn a significantly higher wage when unionized, with a wage premium of 25.2 percent. Service occupations rank third in union wage premium, with an average hourly wage increase of 12.3 percent.
Both the industry-level and occupational-level union wage premiums corroborate the notion that unions boost middle-class incomes most. The union wage premium is highest in middle-class careers as construction workers, truck drivers and postal workers, fire fighters, and office support workers (Figure 26). The premium is lower, but still positive, in upper-middle class industries such as the education and health services sector and professional and business services (Figure 25).
FIGURE 26: UNION WAGE PREMIUM BY OCCUPATION IN MINNESOTA, 2014-2016
Occupation Wage Premium
Construction and Extraction 30.60%
Transportation and Material Moving 25.17%
Service (includes Police and Fire) 12.28%
Office and Administrative Support 9.54%
Professional and Related 8.58%
Installation, Maintenance, and Repair 6.00%
Production 4.44%
Sales and Related -14.03%
Management, Business, and Financial -15.90%
The State of the Unions 2017 18 But the union wage premium is negative in two industries and two closely-related occupations: the financial activities industry (-15.0 percent) and the management, business, and financial occupational group (-15.9 percent) as well as the wholesale and retail trade industry (-14.9 percent) and the sales and related occupational group (-14.0 percent). These sectors and jobs generally include the highest-paid workers in Minnesota, such as investment bankers and retail CEOs, and the lowest-paid workers in the state, such as cashiers and other retail workers. Thus, unions bolster and support Minnesota’s middle class but have smaller impacts on workers at the extreme ends of the income distribution in the state.
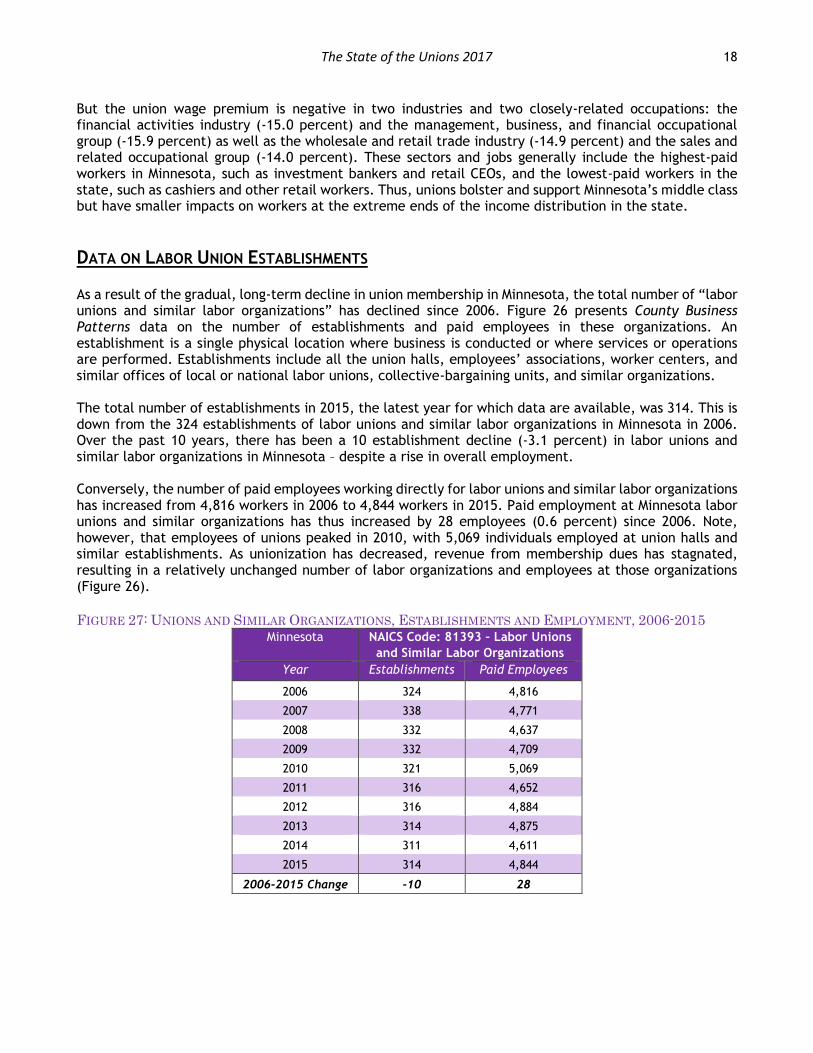
DATA ON LABOR UNION ESTABLISHMENTS As a result of the gradual, long-term decline in union membership in Minnesota, the total number of “labor unions and similar labor organizations” has declined since 2006. Figure 26 presents County Business Patterns data on the number of establishments and paid employees in these organizations. An establishment is a single physical location where business is conducted or where services or operations are performed. Establishments include all the union halls, employees’ associations, worker centers, and similar offices of local or national labor unions, collective-bargaining units, and similar organizations. The total number of establishments in 2015, the latest year for which data are available, was 314. This is down from the 324 establishments of labor unions and similar labor organizations in Minnesota in 2006. Over the past 10 years, there has been a 10 establishment decline (-3.1 percent) in labor unions and similar labor organizations in Minnesota – despite a rise in overall employment. Conversely, the number of paid employees working directly for labor unions and similar labor organizations has increased from 4,816 workers in 2006 to 4,844 workers in 2015. Paid employment at Minnesota labor unions and similar organizations has thus increased by 28 employees (0.6 percent) since 2006. Note, however, that employees of unions peaked in 2010, with 5,069 individuals employed at union halls and similar establishments. As unionization has decreased, revenue from membership dues has stagnated, resulting in a relatively unchanged number of labor organizations and employees at those organizations (Figure 26).
FIGURE 27: UNIONS AND SIMILAR ORGANIZATIONS, ESTABLISHMENTS AND EMPLOYMENT, 2006-2015
Minnesota NAICS Code: 81393 – Labor Unions
and Similar Labor Organizations
Year Establishments Paid Employees
2006 324 4,816
2007 338 4,771
2008 332 4,637
2009 332 4,709
2010 321 5,069
2011 316 4,652
2012 316 4,884
2013 314 4,875
2014 311 4,611
2015 314 4,844
2006-2015 Change -10 28

The State of the Unions 2017 19
NEW IN 2017: COLLECTIVE-BARGAINING STATES VS. “RIGHT-TO-WORK” STATES The movement to implement “right-to-work” (RTW) legislation has accelerated over recent years. From 2007 to 2016, Indiana, Michigan, Wisconsin, and West Virginia passed “right-to-work” laws. Missouri and Kentucky followed in 2017. Today, 28 states have “right-to-work” laws. A “right-to-work” law is a government regulation which prohibits workers and employers from including union security clauses into collective bargaining contracts. Union security clauses ensure that each member from a collective bargaining unit pays a fair share of dues or fees for the services provided. RTW makes the payment of dues or fees optional, allowing workers in any bargaining unit to “free ride” on the efforts and contributions of others. Consequently, workers can benefit from higher wages, better health and retirement benefits, legal and grievance representation, and other perks earned by the union without paying anything for the services provided (Manzo & Bruno, 2015). Conversely, in a fair-share collective bargaining (CB) state, employers and labor unions are at liberty to negotiate a range of union security clauses. They may, but are not mandated to, agree to a union security clause that requires all persons covered by the contract to pay dues or fees to cover the cost of bargaining activities and grievance administration. In these states, covered employees are only required to pay for bargaining costs and are not forced to finance political or other non-bargaining activities (Manzo & Bruno, 2015). One of the main policy changes contributing to the decline of unionization across the United States is the ratification of “right-to-work” legislation (Figure 25). From 2015 to 2016, union membership in RTW states declined by over 293,000 members. In CB states, overall union membership improved by over 56,000 workers. Minnesota, a CB state, contributed to this gain in union membership with over 2,000 new members on net. At the state-level, union membership declined in 20 out of 26 RTW states (76.9 percent) but only 9 out of 25 CB states (36.0 percent), which includes the District of Columbia, over the year.
FIGURE 28: CHANGE IN UNION MEMBERSHIP, MINNESOTA VS. CB STATES VS. RTW STATES, 2015-2016
Union Members 2015 2016 Change
Minnesota 361,831 364,143 2,312
Other Collective-Bargaining States 10,205,197 10,259,253 54,056
All Right-to-Work States 4,219,252 3,926,238 -293,014
United States 14,786,281 14,549,634 -236,647
CONCLUSIONS Since 2007, unionization has declined in Minnesota and in America. There are approximately 36,000 fewer union members in Minnesota today than there were in 2007, contributing to the 1.1 million-member drop in union workers across the nation over that time. The decline in union membership has occurred in both the public sector and the private sector in Minnesota. Consequently, the total number of labor unions and similar labor organizations has declined over the past 10 years. There are 314 labor unions and similar organizations in Minnesota, a decline of 10 worker establishments since 2006. However, there are 28 more individuals working for labor unions and similar organizations today than there were 10 years ago. As of 2016, the overall union membership rate is 14.2 percent in Minnesota. The number of union members has increased from 351,000 in 2012 to about 364,000 in 2016. White, non-Latino workers are more likely to be unionized (14.6 percent) than non-white workers (10.2 percent) in the state. In addition, by educational attainment, the most unionized workers in Minnesota hold Master’s degrees (29.9 percent) and associate’s degrees (17.3 percent).

The State of the Unions 2017 20 Almost one half of all public sector workers are unionized in Minnesota. Meanwhile, slightly more than one-third of all public sector workers are unionized across the nation. In comparison, just one-in-12 (8.3 percent) Minnesotans who work in the private sector are union members and only 6.4 percent of private sector workers are now unionized across America. Union membership is influenced by a number of factors. Employment in the public sector, in construction, in transportation and utilities, in mining, in information, in educational and health services, and public administration all raise the chances that a given worker is a union member. On the other hand, workers employed in sales, management, business, financial, and professional positions, and those with professional or doctorate degrees are less likely to be unionized. Labor unions increase individual incomes by lifting hourly wages, particularly for middle-class workers. In Minnesota, unions raise worker wages by an average of 8.0 percent. The state’s union wage effect is the 31st-highest in the nation. The union wage differential is higher for the median worker (10.7 percent) than the richest 10 percent of workers (7.2 percent). Moreover, the union wage premium is particularly high for middle-class occupations, such as construction and extraction careers (30.6 percent), transportation and material moving jobs (25.2 percent), and service positions – such as firefighters (12.3 percent). The data strongly indicate that unionization benefits low-income and middle-class workers most, helping to foster a strong middle class and reduce income inequality. Unions also help to close racial and gender income gaps in the state. On average, unions increase the wages of white workers by 7.4 percent but boost the hourly earnings of non-white workers by 13.9 percent. Similarly, while the union wage premium is 8.0 percent in Minnesota, the personal benefit to being a union member is 7.7 percent on average for men and a strong 8.7 percent advantage for women. One of the most effective ways to reduce racial income inequality in the state would be to increase the relatively low unionization rate of non-white workers. Unions are therefore one of the most effective anti-poverty institutions in Minnesota and work to close the racial and gender wage gaps. Unions play a vital role in Minnesota’s economy and communities. Although the Minnesota labor movement will continue to face both short- and long-term challenges that will define unions’ effectiveness in decades to come, the vibrant 15 Now Minnesota movement has increased activism and organizing in the state. As a result of the movement’s efforts, Minneapolis has adopted a $15 minimum wage ordinance, while St. Paul has joined Minneapolis in passing paid sick leave ordinances. While reversing the trend of declining union membership rates remain a critical if uncertain task, Minnesota’s organizing efforts have lifted thousands of workers’ wages, improved employee benefits, and provided workers with necessary paid time off.
REFERENCES Adler, Patrick, Chris Tilly, and Trevor Thomas. (2015). From ’15 to $15: The State of the Unions in California
and its Key Cities in 2015. Institute for Research on Labor and Employment, University of California- Los Angeles, available at http://www.irle.ucla.edu/publications/documents/SOU2015.pdf.
Barry T. Hirsch and David A. Macpherson. (2016). "Union Membership, Coverage, Density, and Employment
Among All Wage and Salary Workers, 1973-2015.” Unionstats.com. Georgia State University and Trinity University, Database from the Current Population Survey, available at www.unionstats.com.
Bruno, Robert. (2015). “The Changing Landscape and future of Labor Relations: A View from Organized Labor.”
Illinois Public Employee Relations Report, 32, 3, available at https://www.kentlaw.iit.edu/institutes-centers/institute-for-law-and-the-workplace/publications/illinois-public-employee-relations-report.

The State of the Unions 2017 21 Caldwell, Patrick. (2017) “Who Moved My Teachers?” Mother Jones, available at
http://www.motherjones.com/politics/2017/03/scott-walker-trump-wisconsin-teacher-union. Census. (2017). Business Patterns. 2005-2014. American FactFinder, available at factfinder.census.gov. Center for Economic and Policy Research (CEPR). (2017). 2007-2016 CPS ORG Uniform Extracts, Version 2.2.1.
Washington, DC. Cooper, David and Lawrence Mishel. (2015). The Erosion of Collective Bargaining Has Widened the Gap Between
Productivity and Pay. Economic Policy Institute, available at http://www.epi.org/publication/collective-bargainings-erosion-expanded-the-productivity-pay-gap/.
Eren, Ozkan and I. Serkan Ozbeklik. (2014). “Union Threat and Nonunion Wages: Evidence from the Case Study
of Oklahoma.” Louisiana State University Working Paper, Submitted to Economic Inquiry, available at http://faculty.unlv.edu/oeren/eren_ozbeklik_paper3.pdf.
Gordon, Lafer. (2013). “The Legislative Attack on American Wages and Labor Standards, 2011-2012.” Economic
Policy Institute Briefing Paper #364, available at http://www.epi.org/publication/attack-on-american-labor-standards/.
Hirsch, Barry T. and David A. Macpherson. (2017). “Union Membership, Coverage, Density, and Employment
Among All Wage and Salary Workers, 1973-2016.” Unionstats.com. Georgia State University and Trinity University. Database from the Current Population Survey, available at www.unionstats.com.
Manzo IV, Frank. (2015). Unions Can Increase Efficiency: Ten Examples. Illinois Economic Policy Institute.
Available at https://illinoisepi.org/countrysidenonprofit/wp-content/uploads/2013/10/ILEPI-Economic-Commentary-Unions-Increasing-Efficiency-Ten-Examples.pdf.
Manzo IV, Frank and Robert Bruno. (2016). The Application and Impact of Labor Union Dues in Illinois: An
Organizational and Individual-Level Analysis. Illinois Economic Policy Institute; Project for Middle Class Renewal, University of Illinois at Urbana-Champaign, available at http://illinoisepi.org/countrysidenonprofit/wp-content/uploads/2013/10/ILEPI-PMCR-Application-and-Impact-of-Union-Dues-in-Illinois-FINAL.pdf.
Manzo IV, Frank, Robert Bruno, and Virginia Parks. (2016). The State of the Unions 2016: A Profile of
Unionization in Chicago, in Illinois, and in America. Illinois Economic Policy Institute; Labor Education Program, University of Illinois at Urbana-Champaign; Occidental College, available at http://illinoisepi.org/policy-briefs-countryside/.
Milkman, Ruth and Stephanie Luce. (2016). The State of the Unions 2016: A Profile of Organized Labor in New
York City, New York State, and the United States. Joseph S. Murphy Institute for Worker Education and Labor Studies and the Center for Urban Research, City University of New York Graduate Center, available at https://www.gc.cuny.edu/CUNY_GC/media/CUNY-Graduate-Center/PDF/Communications/Union_Density2016_C5.pdf.
Murphy, Erin. (2017). “Iowa's Public-Sector Unions Brace for Impact of New Collective Bargaining Law.” The
Gazette. Available at http://www.thegazette.com/subject/news/iowas-public-sector-unions-brace-for-impact-of-new-collective-bargaining-law-20170220.
Nelson, Emma. (2017). “Minneapolis Vote for $15 Minimum Wage Called 'Victory for Workers'.” Star Tribune, available at http://www.startribune.com/minneapolis-city-council-to-take-final-vote-on-15-minimum-wage-friday/431761843/#1.
Schmitt, John. (2008). The Union Wage Advantage for Low-Wage Workers. Center for Economic and Policy
Research, available at http://www.cepr.net/documents/publications/quantile_2008_ 05.pdf.
The State of the Unions 2017 22 Sommeiller, Estelle and Mark Price. (2015). The Increasingly Unequal States of America: Income Inequality by
State, 1917 to 2012. Economic Analysis and Research Network, available at http://www.epi.org/publication/income-inequality-by-state-1917-to-2012/.
St. Anthony, Neal. (2016). “Members of Minorities Making Modest Inroads in the Trades.” Star Tribune, available
at http://www.startribune.com/members-of-minorities-making-modest-inroads-in-the-trades/364715481/.
Wagner, Jeff. (2017). “Who’s Eligible for Mandatory Paid Sick Leave in Mpls., St. Paul?” CBS Minnesota,
available at http://minnesota.cbslocal.com/2017/06/15/paid-sick-leave-eligibility/. Western, Bruce and Jake Rosenfeld. (2011). “Unions, Norms, and the Rise in U.S. Wage Inequality.” American Sociological Review, 76(4). 513-537, available at http://www.asanet.org/images/journals/docs/pdf/asr/WesternandRosenfeld.pdf.
COVER PHOTO CREDITS Goebel, Mark. (2007). “Minnesota State Capitol Building.” Flickr Creative Commons User. Available at
https://goo.gl/iYkd5P. Moore, Michael. (2017). “A rally kicking off the SPFT’s contract campaign from Union Advocate.” Workday
Minnesota. Available at http://workdayminnesota.org/articles/teachers-kick-contract-campaign-targeting-corporate-tax-dodgers.
Moore, Michael. (2016). “Cottage Grove Steelworkers Overwhelmingly Reject 3M’s Contract Proposal.” AFL-CIO
Minnesota. Available at http://www.mnaflcio.org/updates/cottage-grove-steelworkers-overwhelmingly-reject-3m%E2%80%99s-contract-proposal.
Roeder, Phil. (2011). “We Are One Rally.” Flickr Creative Commons User. Available at https://goo.gl/lfZUoV.
Union Advocate. (2016). “Nurses and supporters picketed outside United Hospital in St. Paul.” Available at https://advocate.stpaulunions.org/2016/06/19/photos-picket-lines-go-up-as-5000-allina-nurses-begin-strike/.

The State of the Unions 2017 23
APPENDIX TABLE A: PROBIT REGRESSION ON PROBABILITY OF UNION MEMBERSHIP, AVERAGE MARGINAL EFFECTS, MINNESOTA WORKERS, 2013-2015
Minnesota
Prob(Union Member) Coefficient (St. Err.)
Age 0.0073*** (0.0001)
Age2 -0.0001*** (0.0000)
Female -0.0113*** (0.0005)
Citizen 0.0496*** (0.0011)
White, non-Latino 0.0061*** (0.0009)
African-American -0.0102*** (0.0012)
Latino or Latina 0.0027** (0.0013)
Center City 0.0212*** (0.0006)
Suburb 0.0134*** (0.0004)
Federal government 0.1769*** (0.0013)
State government 0.1922*** (0.0008)
Local government 0.2020*** (0.0006)
Usual hours worked 0.0016*** (0.0000)
Less than high school 0.0125*** (0.0011)
Some college, no degree 0.0053*** (0.0007)
Associate’s 0.0197*** (0.0006)
Bachelor’s -0.0064*** (0.0007)
Master’s 0.0353*** (0.0008)
Professional/Doctorate -0.0871*** (0.0014)
Industry/Occupation Dummies Y
Constant 0.1377*** (0.0002)
R2 0.2775
Observations 8,151 Three asterisks (***) indicate significance at the 1% level, two asterisks (**) indicates significance at the 5% level, and one asterisk (*) indicates significance at the 10% level. Source: CPS-ORG, Center for Economic and Policy Research Uniform Data Extracts, 2014-2016. The total number of observations of employed persons was 10,359 in Minnesota. Importance weights are applied to the probit model.
A probit regression model allows for analysis of the probability of a “binary” yes-or-no variable occurring. In this case, the model reports the (positive or negative) direction of the effect that a factor has on the probability of being a union member and whether the output is statistically significant. To determine the magnitude of statistically significant factors, average marginal effects (AMEs) are generated and reported using the dydx, margins command in STATA. Importance weights to match the sample size to the actual
population are applied.
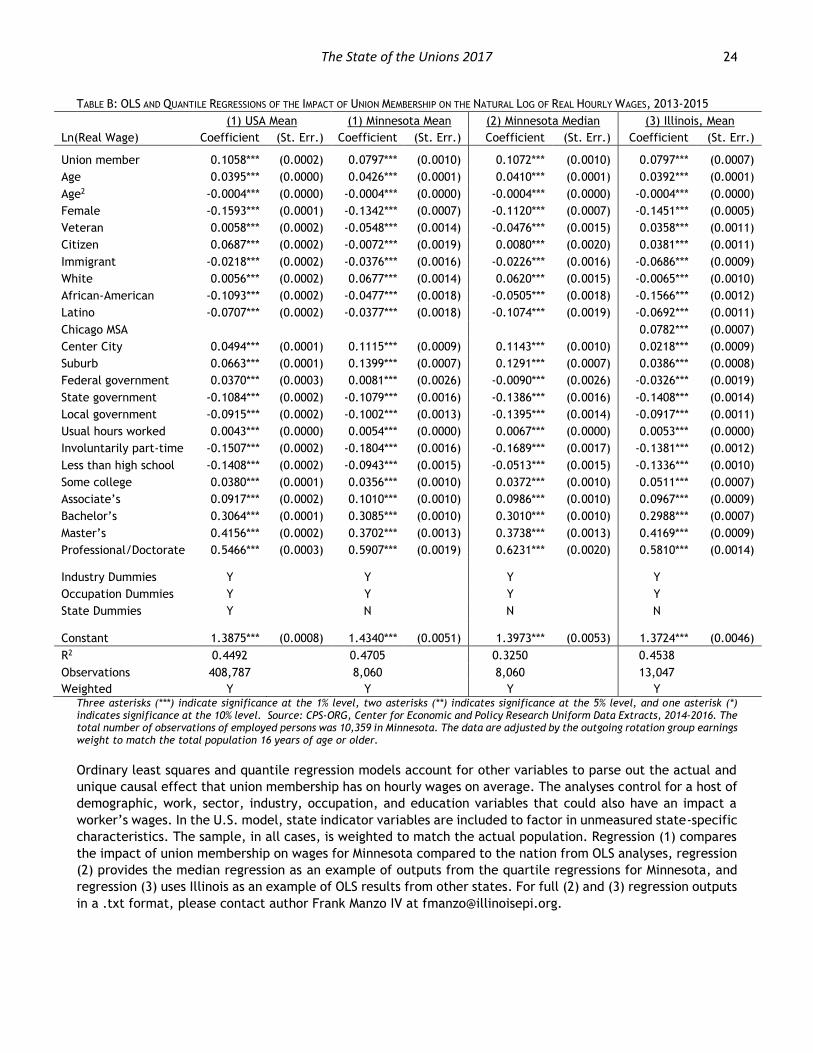
The State of the Unions 2017 24 TABLE B: OLS AND QUANTILE REGRESSIONS OF THE IMPACT OF UNION MEMBERSHIP ON THE NATURAL LOG OF REAL HOURLY WAGES, 2013-2015
(1) USA Mean (1) Minnesota Mean (2) Minnesota Median (3) Illinois, Mean
Ln(Real Wage) Coefficient (St. Err.) Coefficient (St. Err.) Coefficient (St. Err.) Coefficient (St. Err.)
Union member 0.1058*** (0.0002) 0.0797*** (0.0010) 0.1072*** (0.0010) 0.0797*** (0.0007)
Age 0.0395*** (0.0000) 0.0426*** (0.0001) 0.0410*** (0.0001) 0.0392*** (0.0001)
Age2 -0.0004*** (0.0000) -0.0004*** (0.0000) -0.0004*** (0.0000) -0.0004*** (0.0000)
Female -0.1593*** (0.0001) -0.1342*** (0.0007) -0.1120*** (0.0007) -0.1451*** (0.0005)
Veteran 0.0058*** (0.0002) -0.0548*** (0.0014) -0.0476*** (0.0015) 0.0358*** (0.0011)
Citizen 0.0687*** (0.0002) -0.0072*** (0.0019) 0.0080*** (0.0020) 0.0381*** (0.0011)
Immigrant -0.0218*** (0.0002) -0.0376*** (0.0016) -0.0226*** (0.0016) -0.0686*** (0.0009)
White 0.0056*** (0.0002) 0.0677*** (0.0014) 0.0620*** (0.0015) -0.0065*** (0.0010)
African-American -0.1093*** (0.0002) -0.0477*** (0.0018) -0.0505*** (0.0018) -0.1566*** (0.0012)
Latino -0.0707*** (0.0002) -0.0377*** (0.0018) -0.1074*** (0.0019) -0.0692*** (0.0011)
Chicago MSA 0.0782*** (0.0007)
Center City 0.0494*** (0.0001) 0.1115*** (0.0009) 0.1143*** (0.0010) 0.0218*** (0.0009)
Suburb 0.0663*** (0.0001) 0.1399*** (0.0007) 0.1291*** (0.0007) 0.0386*** (0.0008)
Federal government 0.0370*** (0.0003) 0.0081*** (0.0026) -0.0090*** (0.0026) -0.0326*** (0.0019)
State government -0.1084*** (0.0002) -0.1079*** (0.0016) -0.1386*** (0.0016) -0.1408*** (0.0014)
Local government -0.0915*** (0.0002) -0.1002*** (0.0013) -0.1395*** (0.0014) -0.0917*** (0.0011)
Usual hours worked 0.0043*** (0.0000) 0.0054*** (0.0000) 0.0067*** (0.0000) 0.0053*** (0.0000)
Involuntarily part-time -0.1507*** (0.0002) -0.1804*** (0.0016) -0.1689*** (0.0017) -0.1381*** (0.0012)
Less than high school -0.1408*** (0.0002) -0.0943*** (0.0015) -0.0513*** (0.0015) -0.1336*** (0.0010)
Some college 0.0380*** (0.0001) 0.0356*** (0.0010) 0.0372*** (0.0010) 0.0511*** (0.0007)
Associate’s 0.0917*** (0.0002) 0.1010*** (0.0010) 0.0986*** (0.0010) 0.0967*** (0.0009)
Bachelor’s 0.3064*** (0.0001) 0.3085*** (0.0010) 0.3010*** (0.0010) 0.2988*** (0.0007)
Master’s 0.4156*** (0.0002) 0.3702*** (0.0013) 0.3738*** (0.0013) 0.4169*** (0.0009)
Professional/Doctorate 0.5466*** (0.0003) 0.5907*** (0.0019) 0.6231*** (0.0020) 0.5810*** (0.0014)
Industry Dummies Y Y Y Y
Occupation Dummies Y Y Y Y
State Dummies Y N N N
Constant 1.3875*** (0.0008) 1.4340*** (0.0051) 1.3973*** (0.0053) 1.3724*** (0.0046)
R2 0.4492 0.4705 0.3250 0.4538
Observations 408,787 8,060 8,060 13,047
Weighted Y Y Y Y Three asterisks (***) indicate significance at the 1% level, two asterisks (**) indicates significance at the 5% level, and one asterisk (*) indicates significance at the 10% level. Source: CPS-ORG, Center for Economic and Policy Research Uniform Data Extracts, 2014-2016. The total number of observations of employed persons was 10,359 in Minnesota. The data are adjusted by the outgoing rotation group earnings weight to match the total population 16 years of age or older.
Ordinary least squares and quantile regression models account for other variables to parse out the actual and
unique causal effect that union membership has on hourly wages on average. The analyses control for a host of
demographic, work, sector, industry, occupation, and education variables that could also have an impact a
worker’s wages. In the U.S. model, state indicator variables are included to factor in unmeasured state-specific
characteristics. The sample, in all cases, is weighted to match the actual population. Regression (1) compares
the impact of union membership on wages for Minnesota compared to the nation from OLS analyses, regression
(2) provides the median regression as an example of outputs from the quartile regressions for Minnesota, and
regression (3) uses Illinois as an example of OLS results from other states. For full (2) and (3) regression outputs
in a .txt format, please contact author Frank Manzo IV at [email protected].

The State of the Unions 2017 25