the state of the unions 2017 - the illinois update · the state of the unions 2017 i ... level...
TRANSCRIPT

THE STATE OF THE UNIONS 2017
May 22, 2017
Frank Manzo IV, M.P.P. Illinois Economic Policy Institute
Robert Bruno, Ph.D. University of Illinois at Urbana-Champaign
Virginia Parks, Ph.D.
Occidental College
A Profile of Unionization in Chicago, in Illinois, and in America

The State of the Unions 2017 i
Research Report May 22, 2017
THE STATE OF THE UNIONS 2017 A Profile of Unionization in Chicago, in Illinois, and in America
About the Authors
Frank Manzo IV, M.P.P. is the Policy Director of the Illinois Economic Policy Institute (ILEPI). His research focuses on labor market policies, income inequality, community and economic development, infrastructure investment, and public finance. He earned his Master of Public Policy from the University of Chicago Harris School of Public Policy and his Bachelor of Arts in Economics and Political Science from the University of Illinois at Urbana-Champaign. He can be contacted at [email protected].
Robert Bruno, Ph.D. is a Professor at the University of Illinois at Urbana-Champaign School of Labor and Employment Relations and is the Director of the School’s Labor Education Program. He also serves as Director of the Project for Middle Class Renewal at the University of Illinois at Urbana-Champaign. His research focuses broadly on working-class and union studies issues. He earned his Doctor of Philosophy in Political Theory from New York University and his Master of Arts in Political Science from Bowling Green State University. He can be contacted at [email protected].
Virginia Parks, Ph.D. is the Madeline McKinnie Professor of Urban & Environmental Policy at Occidental College. Formerly, she was an Associate Professor at the University of Chicago School of Social Service Administration. Her research focuses on labor, employment, and inequality in cities. Her fields of special interest include urban geography, urban labor markets, immigration, racial and gender inequality, and community organizing and development. She earned her Doctor of Philosophy in Geography and her Master of Arts in Urban Planning from the University of California, Los Angeles. She can be contacted at [email protected].
ILLINOIS ECONOMIC POLICY INSTITUTE
“A Higher Road for a Better Tomorrow”
P.O. Box 2378
La Grange, Illinois 60525 Phone: 708-375-1002 www.illinoisepi.org
UNIVERSITY OF ILLINOIS AT URBANA-CHAMPAIGN
Labor Education Program & Project for Middle Class Renewal
815 W. Van Buren Street, Suite 110
Chicago, Illinois 60607 Phone: 312-996-2624
www.illinoislabored.org
OCCIDENTAL COLLEGE
Urban & Environmental Policy Department
1600 Campus Road
Los Angeles, California 90041 Phone: 323-259-2500
www.oxy.edu

The State of the Unions 2017 ii
EXECUTIVE SUMMARY Since 2007, unionization has declined in Illinois, in the Chicago region, and in America. There are approximately 30,000 fewer union members in Illinois today than there were in 2007, contributing to the 1.1 million-member drop in union workers across the nation over that time. Declining union membership in Illinois has primarily been the result of decreases in male unionization. Consequently, the total number of labor unions and similar labor organizations has declined over the past 10 years. There are 881 labor unions and similar organizations in Illinois, a decline of nearly 70 worker establishments over the past 10 years. There are also 1,765 fewer individuals working for labor unions and similar organizations today than there were one decade ago. The long-term downward trends continued for Illinois’ labor movement last year. From 2015 to 2016:
The unionization rate declined from 15.2 percent to 14.5 percent;
Union members declined from about 847,000 to about 812,000;
Workers between the ages of 35 and 44 and workers between the ages of 55 and 64 saw drops in union membership.
Although there continue to be downward trends, there are some positives for Illinois’ labor movement:
While Illinois’ public sector saw a slight decline in unionization rates from 2015 to 2016, the union membership rate for public sector workers is 5.5 percentage points higher in 2016 than it was in 2007.
From 2015 to 2016, unionization rates marginally increased for Latino and Latina workers, African American workers, workers between the ages of 16 and 25, and private sector workers.
About half of all public sector workers continue to be unionized in both Illinois and the Chicago metropolitan area. Meanwhile, slightly more than one-third of all public sector workers are unionized across the nation. In comparison, fewer than one-in-10 (9.7 percent) workers in Illinois’ private sector are now union members, though this exceeds the 6.4 percent unionization rate for private sector workers across America. Union membership is influenced by a number of factors. Employment in the public sector, construction, transportation and utilities, mining, educational and health services, and public administration industries all raise the chances that a given worker is a union member. African-American workers are also statistically more likely to be union members than their racial or ethnic counterparts. On the other hand, workers employed in professional and related, management, business, and financial occupations, workers employed in sales and related occupations, and those with professional or doctorate degrees are less likely to be unionized. Labor unions increase individual incomes by lifting hourly wages – particularly for low-income workers. In Illinois, unions raise worker wages by an average of 8 percent. The state’s union wage effect is the 32nd-highest in the nation. The union wage differential is higher for the bottom 25 percent of workers (9.3 percent) than the richest 25 percent of workers (7.2 percent), helping to reduce income inequality. Unions play a vital role in Illinois’ economy and communities. The Illinois labor movement, however, will continue to face both short- and long-term challenges. Reversing the trend of declining union membership rates remains a critical if uncertain task. Labor’s response to these challenges could define its influence and effectiveness in the decades to come.

The State of the Unions 2017 iii
TABLE OF CONTENTS Executive Summary ii
Introduction
1
Data and Limitations 2
Unionization Rates and Trends
2
Unionization by Demographics and Geography
3
Unionization by Education
9
Unionization by Sector, Industry, and Occupation
10
Predicting Union Membership in Illinois 13
Union Wages Recent Data on Labor Union Establishments
14
17
New in 2015: Collective-Bargaining States vs. “Right-to-Work” States 18
Conclusions
19
References Cover Photo Credits
20
21 Appendix
22 Industry Profiles: Union and Nonunion Workers in Illinois, 2014-2016
24

The State of the Unions 2017 1
INTRODUCTION An annual assessment of the institutional footprint of organized labor in America, Illinois, and Chicago requires an acknowledgment that over the past six years there has been a partisan assault on worker organizing rights in many states. For example, since 2010 there have been 16 states that have passed laws restricting public employees’ collective bargaining rights (Lafer, 2013; Bruno, 2015). The most recent was a draconian law passed in Iowa that mirrors the damaging prohibitions enacted in Wisconsin in 2011 (Murphy, 2017). Another 19 states introduced “right-to-work” (RTW) bills and six states (Indiana, Michigan, Wisconsin, West Virginia, Kentucky and Missouri) have passed RTW laws (Manzo & Bruno, 2017). The nature of a state’s political environment directly corresponds to partisan control of the governorship and legislative branches. Where Republican governors and a majority of Republican legislators are in power, organized labor faces sustained political opposition. In every such case worker rights have been diluted, roll-backed or largely eliminated. Wisconsin serves as the most dramatic example of political retribution. In 2010, Republican Scott Walker was elected governor and the GOP took control of both legislative chambers. The next year, Walker successfully pushed a bill through the assembly (i.e., Act 10) that reduced public sector worker benefits and hollowed out the bargaining rights of government employees. Republicans subsequently passed a RTW law. Prior to Walker’s “crusade” and the Republican takeover, 14.2 percent of Wisconsin's workforce belonged to a union. By 2015, that figure had dropped to 8.3 percent, significantly below the national average for the first time in decades (Caldwell, 2017). Only in states where Democrats hold one or more of the branches of government– such as in Illinois, Minnesota, California, and New York– have unions not suffered political defeats. This hostile political reality dramatically diverges from a far more bi-partisan framework that existed prior to the Great Recession of 2007. It is also a critical backdrop that cannot be ignored in interpreting the changes in union membership and its associational effects. Union membership can fluctuate for many reasons, including economic restructuring, technological advancements, foreign trade deals, corporate domestic insourcing, employer opposition, and the level of new labor organizing. Undeniably, however, union membership has been negatively impacted by state-level policies designed to weaken collective bargaining. While this report does not chronicle or assign responsibility for shifts in unionized employment, readers should examine the findings with an awareness of the relationship between political power and union membership. The labor movement has endured a gradual decline in both membership and influence. Almost one-in-four American workers (23.0 percent) were members of labor unions in 1980. Three and a half decades later, in 2016, only about one-in-10 employed persons in America (10.7 percent) are unionized (Hirsch & Macpherson, 2017). Concurrently, as unionization rates have waned, income inequality has soared. Declining unionization and polarizing worker incomes are linked: The decline of organized labor accounts for between one-fifth and one-third of the growth in inequality (Western & Rosenfeld, 2011). The divergence between worker productivity and worker pay has also been largest in states where collective bargaining coverage has declined the most (Cooper & Mishel, 2015). Despite partisan efforts to restrict worker organizing, unions remain a good worker investment. For example, a 2016 report found that for every $1 paid in membership dues and fees, an estimated $6.12 in after-tax income is returned to union members in Illinois (Manzo & Bruno, 2016). Unions also increase the likelihood that an Illinois worker has health insurance by 14 percentage points. These benefits translate into 43,000 additional jobs that are independently created by the higher earnings and increased consumer spending of union households.
This report, conducted by researchers at the Illinois Economic Policy Institute, the University of Illinois Project for Middle Class Renewal, and Occidental College, analyzes the course of unionization in Illinois, in the Chicago metropolitan statistical area (MSA), and in the United States from 2007 to 2016. It is the fourth annual report of its kind for union members in the Chicago area and in Illinois, following the May 2016 release of The State of the Unions 2016: A Profile of Unionization in Chicago, in Illinois, and in

The State of the Unions 2017 2 America (Manzo et al., 2016). The report is modeled off of The State of the Unions 2016: A Profile of Organized Labor in New York City, New York State, and the United States by the Joseph S. Murphy Institute for Worker Education and Labor Studies at the City University of New York Graduate Center (Milkman & Luce, 2016) and From ’15 to $15: The State of the Unions in California and its Key Cities in 2015 by the Institute for Research on Labor and Employment at the University of California, Los Angeles (Adler et al., 2015). The report tracks unionization rates and investigates union membership across demographic, educational, sectoral, industry, and occupational classifications. The study subsequently evaluates the impact that labor union membership has on a worker’s hourly wage in Illinois, in the Chicago MSA, and in America. Additionally, data on labor unions and similar labor organizations are included and analyzed, new for the 2017 version of this report. The report concludes by recapping key findings.
DATA AND LIMITATIONS This report utilizes data from the Current Population Survey Outgoing Rotation Groups (CPS-ORG). The CPS-ORG is collected, analyzed, and released by the U.S. Department of Labor Bureau of Labor Statistics (BLS). CPS-ORG data reports individual-level information on 25,000 respondents nationwide each month. The records include data on wages, unionization, hours worked, sector, industry, and occupation, as well as other demographic, geographic, education, and work variables. The data were extracted from the user-friendly Center for Economic and Policy Research Uniform Data Extracts (CEPR, 2017). The 10-year dataset from 2007 to 2016 captures information on 3,174,846 individuals aged 16 to 85 in the United States. These observations include 1,897,393 persons with a job, of whom 195,476 reported that they were union members. Survey responses include information from 57,841 employed individuals in Illinois and 39,591 employed persons in the Chicago MSA since 2007. In 2016, respondents with at least one job totaled 5,571 in Illinois, 3,860 in the Chicago MSA, and 185,630 nationwide. “Chicago MSA” workers are defined as only those who live in the Illinois component of the Chicago-Naperville-Joliet Metropolitan Statistical Area (i.e., no Indiana or Wisconsin residents are included). Analytic weights are provided by the Department of Labor to match the sample to the actual U.S. population 16 years of age or greater. These weights adjust the influence of an individual respondent’s answers on a particular outcome to compensate for demographic groups that are either underrepresented or overrepresented compared to the total population. The weights are applied throughout the analysis. There are limitations to the CPS-ORG dataset. First, the data reports a worker’s state of residence rather than state of employment, so the results may be biased by workers who live in one state but work in another (e.g., living in Illinois but working in Missouri) and vice-versa. CPS-ORG data is also based on household survey responses. Certain individuals such as undocumented workers may also be underreported if they are more difficult to reach by survey officials. Finally, every surveyed worker does not reply to the union membership question. For example, in 2016, union membership data was only available for 5,039 of the 5,571 surveyed workers (90.5 percent) in Illinois. While this does not impact unionization rates, estimates are underreported for both total union workers and total nonunion employees. Economic data from the County Business Patterns (CBP) series from the U.S. Census Bureau is used in this report (Census, 2017). The CBP provides annual statistics for businesses with paid employees that are used to study economic activity and market trends. The data are published between 18 months and 24 months after the reference year, so there is a longer time lag compared to the release of CPS-ORG information.
UNIONIZATION RATES AND TRENDS Since 2007, unionization has declined in Illinois, the Chicago metropolitan area, and the United States (Figure 1). The total union membership rate was 14.5 percent in Illinois, 13.8 percent in the Chicago region, and 12.1 percent nationwide in 2007. Ten years later, the Chicago metropolitan area (12.9 percent) and the United States (10.7 percent) rates have fallen, while Illinois rates have remained the

The State of the Unions 2017 3 same (14.5 percent). The gradual decline in the unionization rate has translated into a decrease in union membership of about 30,000 workers in Illinois since 2007, contributing to the 1.1 million-member national decline in union workers over that time (Figure 2). Unionization rates in both Illinois and the Chicagoland area declined between 2015 and 2016. The Illinois unionization rate in 2015 (15.2 percent) was the highest since 2012 (14.6 percent). However, the state experienced a 0.7 percentage point decline and the Chicago metropolitan area experienced a 0.9 percentage point decline in unionization between 2015 and 2016. The Chicago area’s union membership rate in 2016 was lower than at any other point during the decade. One the other hand, despite fluctuations in unionization and the general downward trend, Illinois’ union membership rate has consistently been above the national average. The 10-year combined Illinois unionization rate was 15.6 percent, 4.0 percentage points higher than the 11.6 percent national rate. On a year-by-year basis, Illinois’ union membership rate has ranged from 2.4 to 5.2 percentage points higher than the national average (Figure 2).
FIGURE 1: UNIONIZATION RATES AND TOTAL UNION MEMBERSHIP BY REGION, 2007-2016
FIGURE 2: TOTAL UNION MEMBERS AND OVERALL UNIONIZATION RATES BY REGION, 2007-2016
Illinois Chicago MSA USA
Year Members Rate Members Rate Members Rate
2007 842,189 14.51% 525,343 13.77% 15,670,352 12.08%
2008 939,212 16.59% 581,955 15.70% 16,097,535 12.44%
2009 950,586 17.49% 609,460 17.06% 15,327,280 12.31%
2010 843,807 15.53% 549,528 15.57% 14,715,061 11.86%
2011 875,891 16.19% 537,637 15.18% 14,754,673 11.78%
2012 800,434 14.58% 490,023 13.36% 14,349,358 11.25%
2013 850,557 15.74% 570,390 15.55% 14,515,755 11.24%
2014 829,757 15.09% 543,428 14.67% 14,569,936 11.08%
2015 846,984 15.22% 544,064 13.82% 14,786,281 11.05%
2016 812,397 14.54% 508,058 12.89% 14,549,640 10.69%
Average 859,181 15.55% 545,925 14.84% 14,933,587 11.58%
UNIONIZATION BY DEMOGRAPHICS AND GEOGRAPHY From 2015 to 2016, the unionization rate increased for male workers and decreased for female workers in Illinois. The male unionization rate improved 1.0 percentage point over the year from 15.6 percent to
0%
5%
10%
15%
20%
20
07
20
08
20
09
20
10
20
11
20
12
20
13
20
14
20
15
20
16
Unionization Rates by Region
Illinois Chicago USA
400,000
500,000
600,000
700,000
800,000
900,000
1,000,000
20
07
20
08
20
09
20
10
20
11
20
12
20
13
20
14
20
15
20
16
Union Membership by Region
Illinois Chicago MSA Trends

The State of the Unions 2017 4 16.6 percent. These gains, however, were offset by a significant decrease in the female unionization rate. Female union density in Illinois declined by 2.5 percentage points over the year, from 14.8 percent to 12.3 percent (Figure 3). The 2015 to 2016 changes in unionization by gender bucked the decadal trend in which falling rates of unionization have reflected declines in union membership for men and gains for women (Figure 3). An estimated 17.9 percent of employed men were unionized in 2007, but the 2016 male unionization rate in Illinois fell to 16.6 percent. The male unionization rate has also decreased in both the Chicago region and the nation as a whole. Since 2007, male union density has dropped by 1.7 percentage points in the Chicago area and by 1.8 percentage points in the United States. Similarly, the 2015 to 2016 changes were counter to the 10-year trend for female workers in Illinois and the Chicago metropolitan area; female unionization rates have actually increased over the decade. The female unionization rate increased from 10.8 percent Illinois in 2007 to 12.3 percent in the state today, a 1.5 percentage-point gain. In the Chicago region, female unionization increased by 0.6 percentage point over that time. Nationwide, female union membership has dipped slightly, from 11.1 percent in 2007 to 10.2 percent today.
FIGURE 3: GRAPHS OF UNIONIZATION RATES BY GENDER, 2007-2016
The gap between male and female union membership rates increased over the year (Figure 3). In 2015, male union membership exceeded its female equivalent by just 0.8 percentage point in Illinois. In 2016,
0%
5%
10%
15%
20%
25%
30%
20
07
20
08
20
09
20
10
20
11
20
12
20
13
20
14
20
15
20
16
Male
Illinois Chicago USA
0%
5%
10%
15%
20%
25%
30%
20
07
20
08
20
09
20
10
20
11
20
12
20
13
20
14
20
15
20
16
Female
Illinois Chicago USA
0%
5%
10%
15%
20%
25%
20
07
20
08
20
09
20
10
20
11
20
12
20
13
20
14
20
15
20
16
Unionization Rates by Gender
Male Female Trends
16.6%
12.3%14.6%
11.1%11.5% 10.6%
0%
5%
10%
15%
20%
Male Female
2016 Unionization Rates by Gender
Illinois Chicago MSA USA

The State of the Unions 2017 5 male union membership exceeded its female counterpart by 4.3 percentage points in Illinois. On the other hand, the Illinois gap has narrowed since 2007, when it was 7.1 percentage points. Nevertheless, the gap between male and female union membership rates in 2016 is closer to the 2007 level than the 2015 level.
FIGURE 4: UNIONIZATION RATES BY RACIAL OR ETHNIC IDENTIFICATION BY REGION, 2016
FIGURE 5: GRAPHS OF UNIONIZATION RATES BY RACIAL OR ETHNIC IDENTIFICATION, 2007-2016
14.7%
22.0%
12.0%12.0%
22.1%
11.9%11.0% 12.7%
8.8%
0%
5%
10%
15%
20%
25%
White non-Latino African-American Latino/a
2016 Unionization Rates by Race/Ethnicity
Illinois Chicago MSA USA
0%
5%
10%
15%
20%
25%
30%
20
07
20
08
20
09
20
10
20
11
20
12
20
13
20
14
20
15
20
16
White, non-Latino
Illinois Chicago USA
0%
5%
10%
15%
20%
25%
30%
20
07
20
08
20
09
20
10
20
11
20
12
20
13
20
14
20
15
20
16
Latino or Latina
Illinois Chicago USA
0%
5%
10%
15%
20%
25%
30%
20
07
20
08
20
09
20
10
20
11
20
12
20
13
20
14
20
15
20
16
African-American
Illinois Chicago USA
0%
5%
10%
15%
20%
25%
30%
20
07
20
08
20
09
20
10
20
11
20
12
20
13
20
14
20
15
20
16
Other Races
Illinois Chicago USA

The State of the Unions 2017 6 African Americans have the highest rate of unionization among workers from all racial and ethnic groups (Figure 4). The unionization rate for African-American workers is 22.0 percent in Illinois, 22.1 percent in the Chicago MSA, and 12.7 percent in the United States. In comparison, white non-Latino union density is 14.7 percent in the state, 12.0 percent in Illinois’ largest metropolitan area, and 11.0 percent across the nation. Respective unionization rates for Latino and Latina workers are much lower, at 12.0 percent, 11.9 percent, and 8.8 percent. Over time, union membership has marginally risen for every racial and ethnic group except for Latino/a workers in Illinois (Figure 5). From 2007 to 2016, unionization in Illinois rose by 0.4 percentage point for white, non-Latino workers, 0.2 percentage point for African-American workers, and 0.6 percentage point for all other races. The Latino/a union membership rate, however, has slightly declined over time by 0.6 percentage point. The unionization rates in Illinois by race have remained essentially unchanged from 2007 to 2016. In the Chicago area, trends have mostly mirrored the overall state labor market except for white/non-Latino workers who have seen a 0.9 percentage-point decline in unionization in Chicago. Over the 10-year period of analysis, the African-American union membership rate has generally been higher in the Chicago area than the rest of the state. Unionization rates are much higher for middle-aged workers than for young workers (Figure 6). Regardless of region studied, unionization rates are highest for workers between the ages of 35 and 64 years old. Specifically, the most unionized age group is 45 to 54. Of workers in this age cohort, 18.9 percent are unionized in Illinois, 16.3 percent are unionized in the Chicago MSA, and 13.4 percent are unionized across the United States. For young workers aged 16-24, unionization rates are less than 7.2 percent for Illinois, the Chicago MSA, and the nation.
FIGURE 6: UNIONIZATION RATES BY AGE GROUP BY REGION, 2016
Over the past four years, unionization rates have only significantly increased for one age group: workers aged 16 to 24. From 2013 to 2016, the unionization rate of those 16 years old to 24 years old increased by 2.3 percentage points. Unionization rates declined, on the other hand, for all other age cohorts 25 years and older by an average of 2.5 percentage points. Workers 65 years or older saw the largest decline over the four-year period of 6.0 percentage points (Figure 7). From 2015 to 2016, unionization rates have remained about the same for workers 25 to 34 years of age and workers 45 to 54 years of age, and have declined for workers 35 to 44 years of age and 55 to 64 years of age. Overall, the average age of union workers is about 44 years old and the average age of nonunion workers is around 41 years old, regardless of region studied (Figure 8).
7.2%
13.4%14.9%
18.9%
16.7%
10.9%
6.0%
12.5%13.3%
16.3%14.7%
10.2%
4.4%
9.2%
12.0%13.4% 13.4%
9.5%
0%
5%
10%
15%
20%
25%
Age: 16-24 Age: 25-34 Age: 35-44 Age: 45-54 Age: 55-64 Age: 65+
2016 Unionization Rates by Age
Illinois Chicago MSA USA

The State of the Unions 2017 7 FIGURE 7: ILLINOIS UNIONIZATION RATES BY AGE GROUP, 2013-2016
FIGURE 8: AVERAGE AGE OF UNION AND NONUNION WORKERS BY REGION, 2016 2016 Age (Years)
Variable Nonunion Union
Illinois 41.58 44.20
Chicago MSA 41.31 43.56
USA 40.95 44.38
Union membership varies across other demographic classifications as well (Figure 9). Among the most unionized groups are military veterans. About one-in-four employed veterans are unionized in the Chicago area (24.4 percent) and in Illinois (24.6 percent). For the United States, approximately 14.6 percent of employed veterans are members of unions. The unionization rate for married workers is also above the national overall average for the Chicago MSA and Illinois. Illinois and the Chicago MSA have higher unionization rates for foreign-born workers and native-born and naturalized citizens than the national average. Native-born and naturalized citizens are more likely to be union members than foreign-born workers in Illinois, Chicago MSA, and the nation.
FIGURE 9: UNIONIZATION RATES OF SELECT DEMOGRAPHIC VARIABLES BY REGION, 2016
0%
5%
10%
15%
20%
25%
2013 2014 2015 2016
Unionization Rates by Age
Age: 16-24
Age: 25-34
Age: 35-44
Age: 45-54
Age: 55-64
Age: 65+
10.0%
15.2%
24.6%
16.4%
10.1%
13.5%
24.4%
14.4%
8.3%
11.3%
14.6%12.2%
0%
5%
10%
15%
20%
25%
Foreign-Born Native-Born andNaturalized Citzens
Veteran Married
2016 Unionization Rates by Demographic Group
Illinois Chicago MSA USA

The State of the Unions 2017 8 Figure 10 reveals that geographic distance from an urban core is a minor factor in union membership. In the Chicago area, workers who reside in the central city are more likely to be unionized (13.4 percent) than those who live in the suburbs (12.6 percent). In Illinois overall, 13.4 percent of urban workers are members of unions, 13.4 percent of suburban workers are unionized, and 16.9 percent of rural workers reportedly belong to a union. The comparable figures for the United States are respectively 11.0 percent, 11.2 percent, and 8.9 percent.
FIGURE 10: UNIONIZATION RATES BY URBAN STATUS BY REGION, 2016
Union membership is likely higher in rural Illinois (16.9 percent) than in urban and suburban Illinois (both 13.4 percent) due to the industry profile of each geography (Figure 11). According to the Current Population Survey data, rural Illinois has proportionately higher employment shares in industries with historically high levels of unionization. An estimated 7.2 percent of workers from rural Illinois are employed in construction compared to 4.8 percent in urban Illinois and 6.1 percent in suburban Illinois. The manufacturing share of employment is 14.2 percent in the rural portions of the state compared to 11.0 percent in city centers and 12.6 percent in suburbs. Educational and health services (23.3 percent) and public administration (5.1 percent) also account for higher shares of employment in rural Illinois than they do in urban and suburb areas in the state. Conversely, industries with low levels of union density – such as professional and business services, financial activities, and leisure and hospitality – comprise a significantly larger share of employment in urban and suburban Illinois
FIGURE 11: INDUSTRY OF EMPLOYMENT BY REGION, 2016
Industry (2016) City Center Suburb Rural
Agriculture, Forestry, Fishing, & Hunting 0.3% 0.8% 5.2%
Mining 0.0% 0.0% 0.7%
Construction 4.8% 6.1% 7.2%
Manufacturing 11.0% 12.6% 14.2%
Wholesale & Retail Trade 12.2% 14.4% 15.4%
Transportation & Utilities 5.3% 6.2% 5.2%
Information 2.1% 2.2% 2.7%
Financial Activities 8.2% 8.2% 7.0%
Professional & Business Services 17.4% 12.8% 5.3%
Educational & Health Services 21.7% 21.2% 23.3%
Leisure & Hospitality 9.5% 8.3% 4.8%
Other Services 4.2% 4.3% 3.8%
Public Administration 3.3% 2.9% 5.1%
13.4% 13.4%
16.9%
13.4%12.6%
11.0% 11.2%8.9%
0%
5%
10%
15%
20%
City Center Suburb Rural
2016 Unionization Rates by Urban Status
Illinois Chicago MSA USA

The State of the Unions 2017 9
UNIONIZATION BY EDUCATION Workers with master’s degrees are the most unionized educational group in America (Figure 12). At 23.1 percent, unionization among master’s degree holders in Illinois towers over the rates of all other educational groups. Workers with associate’s degrees are the second-most unionized group in Illinois, the Chicago area, and the United States. Workers without a high school degree and those with a bachelor’s degree comprise the two least unionized educational groups. In Illinois, only 9.1 percent of workers without a high school degree and 11.6 percent of workers with a bachelor’s degree are union members. Union membership rates are lower, or the same, nationwide at every level of educational attainment compared to Illinois and Chicago.
FIGURE 12: UNIONIZATION RATES BY EDUCATIONAL ATTAINMENT OR STATUS BY REGION, 2016
Over the past six years, unionization rates have slightly declined for most educational groups (Figure 13). To ensure statistical significance, Figure 13 compares the three-year averages of union membership rates by educational attainment groups in Illinois for 2011-2013 and 2014-2016. Across the seven educational classifications, the union membership rate has decreased in four cases: Workers with a high school degree (-2.6 percentage points), with some college but no degree (-0.3 percentage point), with associate’s degrees (-0.7 percentage point), and with bachelor’s degrees (-0.7 percentage point). The largest increase in unionization was for individuals with a professional or doctorate degree (+4.8 percentage points).
FIGURE 13: CHANGE IN UNIONIZATION RATES BY EDUCATION, THREE-YEAR AVERAGES, 2011-2016 Illinois
Variable 2011-13 2014-16 Change
Less than High School 8.9% 10.0% +1.1%
High School 17.7% 15.1% -2.6%
Some College, No Degree 15.0% 14.7% -0.3%
Associates 17.6% 16.9% -0.7%
Bachelors 12.8% 12.1% -0.7%
Masters 23.3% 24.2% +1.0%
Professional/Doctorate 7.3% 12.1% +4.8%
9.1%
14.4% 14.6%
17.2%
11.6%
23.1%
11.9%
5.7%
10.1%
14.3% 14.3%15.7%
10.4%
22.0%
10.5%
6.1%5.7%
10.0% 9.8%12.1%
10.4%
18.1%
9.7%
3.9%
0%
5%
10%
15%
20%
25%
Less thanHigh School
High School Some College,No Degree
Associates Bachelors Masters Professionalor Doctorate
In School,Full-time
2016 Unionization Rates by Education
Illinois Chicago MSA USA

The State of the Unions 2017 10
0%
10%
20%
30%
40%
50%
60%
20
07
20
08
20
09
20
10
20
11
20
12
20
13
20
14
20
15
20
16
Unionization Rates by Sector
Private Sector Public Sector Trends
UNIONIZATION BY SECTOR, INDUSTRY, AND OCCUPATION Unionization rates are significantly higher for public sector workers (Figure 14). About half of all public sector workers are unionized in both Illinois (49.7 percent) and the Chicago region (53.0 percent), as are over one-third nationwide (34.4 percent). In comparison, fewer than one-in-10 private sector workers is now a union member in both Illinois (9.7 percent), the Chicago MSA (8.6 percent), the United States (6.4 percent).
FIGURE 14: UNIONIZATION RATES BY SECTOR OR LEVEL OF GOVERNMENT BY REGION, 2016
Across all regions studied, local government employees comprise the most unionized segment of public sector employment, with nearly six-in-10 workers belonging to a union in Illinois (54.9 percent) and the Chicago MSA (59.3 percent). State government commands the second-highest unionization rate among workers across the three levels of American government. Among public sector workers in Illinois, the unionization rate is lowest for federal government employees. Federal government union membership rates are still almost three times as high as the private sector workforce, however, at 28.3 percent in Illinois.
FIGURE 15: UNIONIZATION RATES BY SECTOR BY REGION, 2007-2016
9.7%
49.7%
28.3%
54.9%
48.6%
8.6%
53.0%
31.6%
59.3%
45.2%
6.4%
34.4%
27.4%
40.3%
29.6%
0%
10%
20%
30%
40%
50%
60%
Private Sector Public Sector Federal government Local government State government
2016 Unionization Rates by Sector
Illinois Chicago MSA USA
0%
10%
20%
30%
40%
50%
60%
70%
20
07
20
08
20
09
20
10
20
11
20
12
20
13
20
14
20
15
20
16
Public vs. Private
Illinois Public
Illinois Private
Chicago Public
Chicago Private
USA Public
USA Private

The State of the Unions 2017 11 FIGURE 16: UNIONIZATION RATES BY INDUSTRY BY REGION, 2016
47.5%
37.7%
29.0%
22.0%
11.6%
10.6%
7.1%
6.3%
4.6%
4.1%
2.8%
50.7%
32.8%
26.3%
21.1%
7.6%
11.8%
8.0%
4.8%
4.6%
3.4%
2.4%
30.0%
14.7%
25.1%
17.6%
8.9%
9.3%
4.3%
2.7%
3.4%
3.1%
2.9%
0% 10% 20% 30% 40% 50% 60%
Public Administration
Construction
Transportation and Warehousing
Educational and Health Services
Manufacturing
Information
Wholesale and Retail Trade
Other Services
Leisure and Hospitality
Professional and Business Services
Financial Activities
2016 Unionization Rates by Industry
Illinois Chicago MSA USA
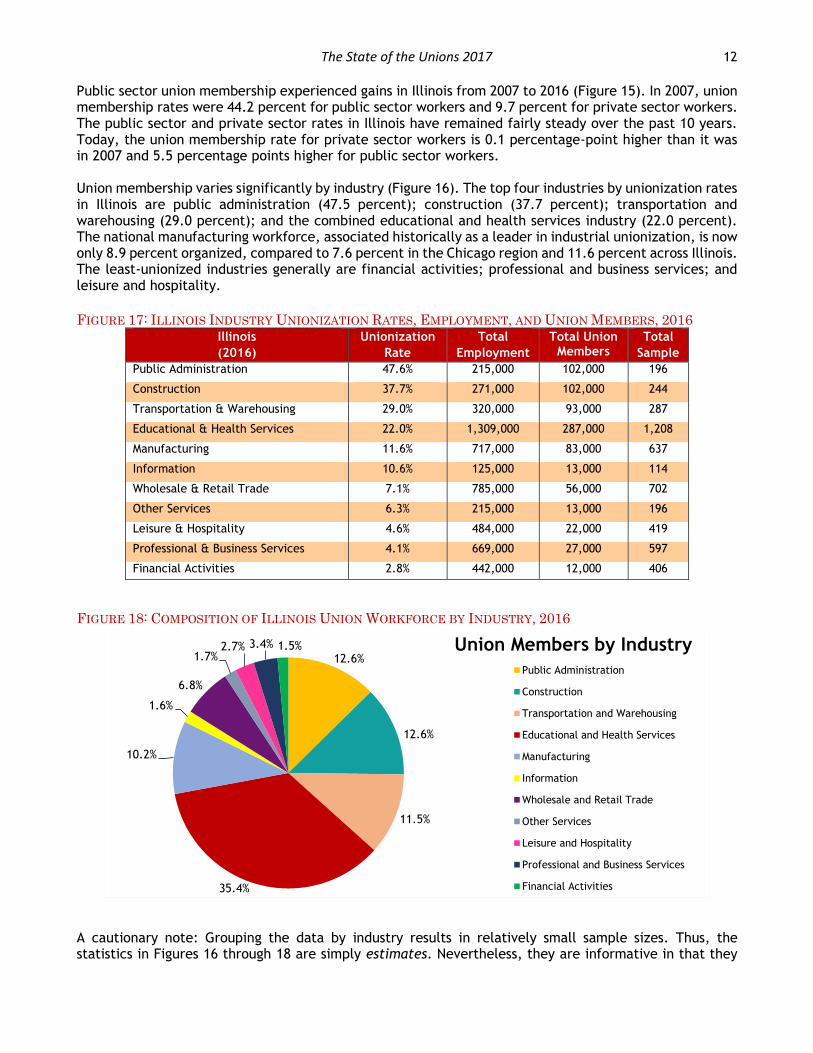
The State of the Unions 2017 12 Public sector union membership experienced gains in Illinois from 2007 to 2016 (Figure 15). In 2007, union membership rates were 44.2 percent for public sector workers and 9.7 percent for private sector workers. The public sector and private sector rates in Illinois have remained fairly steady over the past 10 years. Today, the union membership rate for private sector workers is 0.1 percentage-point higher than it was in 2007 and 5.5 percentage points higher for public sector workers. Union membership varies significantly by industry (Figure 16). The top four industries by unionization rates in Illinois are public administration (47.5 percent); construction (37.7 percent); transportation and warehousing (29.0 percent); and the combined educational and health services industry (22.0 percent). The national manufacturing workforce, associated historically as a leader in industrial unionization, is now only 8.9 percent organized, compared to 7.6 percent in the Chicago region and 11.6 percent across Illinois. The least-unionized industries generally are financial activities; professional and business services; and leisure and hospitality.
FIGURE 17: ILLINOIS INDUSTRY UNIONIZATION RATES, EMPLOYMENT, AND UNION MEMBERS, 2016 Illinois
(2016)
Unionization
Rate
Total
Employment
Total Union Members
Total
Sample
Public Administration 47.6% 215,000 102,000 196
Construction 37.7% 271,000 102,000 244
Transportation & Warehousing 29.0% 320,000 93,000 287
Educational & Health Services 22.0% 1,309,000 287,000 1,208
Manufacturing 11.6% 717,000 83,000 637
Information 10.6% 125,000 13,000 114
Wholesale & Retail Trade 7.1% 785,000 56,000 702
Other Services 6.3% 215,000 13,000 196
Leisure & Hospitality 4.6% 484,000 22,000 419
Professional & Business Services 4.1% 669,000 27,000 597
Financial Activities 2.8% 442,000 12,000 406
FIGURE 18: COMPOSITION OF ILLINOIS UNION WORKFORCE BY INDUSTRY, 2016
A cautionary note: Grouping the data by industry results in relatively small sample sizes. Thus, the statistics in Figures 16 through 18 are simply estimates. Nevertheless, they are informative in that they
12.6%
12.6%
11.5%
35.4%
10.2%
1.6%
6.8%
1.7%2.7% 3.4% 1.5% Union Members by Industry
Public Administration
Construction
Transportation and Warehousing
Educational and Health Services
Manufacturing
Information
Wholesale and Retail Trade
Other Services
Leisure and Hospitality
Professional and Business Services
Financial Activities

The State of the Unions 2017 13 shed light on the state’s union membership and provide general parameters on the composition of the union workforce. Lastly, Figure 19 depicts unionization rates by occupation. In Illinois, the most unionized occupation groups are construction and extraction occupations such as carpenters and operating engineers (48.1 percent); installation, maintenance, and repair occupations such as mechanics (26.2 percent); professional and related occupations including teachers (19.7 percent); transportation and moving jobs such as public transit workers and truck drivers (19.4 percent); and production workers such as welders (19.2 percent). Compared to the nation, unionization rates in these five occupations are significantly higher in Illinois. Union membership in construction and extraction occupations, as an example, is 29.7 percentage points higher in Illinois than the comparable United States average. The least-unionized occupations are sales and related; management, business, and financial; and office and administrative support jobs in Illinois.
FIGURE 19: UNIONIZATION RATES BY OCCUPATION BY REGION, 2016 Occupation (2016) Illinois Chicago MSA USA
Management, Business, & Financial 5.7% 4.0% 4.6%
Professional & Related 19.7% 17.7% 16.1%
Service 14.4% 13.8% 9.6%
Sales & Related 4.4% 4.5% 3.1%
Office & Administrative Support 8.8% 8.4% 9.4%
Construction & Extraction 48.1% 43.6% 18.4%
Installation, Maintenance, & Repair 26.2% 21.1% 13.3%
Production 19.2% 17.1% 11.8%
Transportation & Material Moving 19.4% 19.6% 15.6%
PREDICTING UNION MEMBERSHIP IN ILLINOIS A statistical model is used to predict the chances that any given worker is a union member in Illinois, using data from 2014 through 2016. The model, which is detailed in the Table A of the Appendix, reports how statistically significant variables increase or decrease one’s probability of being a union member. The analysis includes data on over 13,000 Illinois workers, and weights are applied to match the sample to the actual Illinois population. Given that Illinois averaged about 6.11 million workers over this time, the sample size would yield a normal ±0.9 percent margin of error in a standard survey report. Many factors increase the likelihood that an employed person is a union member in Illinois (Figure 20). Employment in local government is the largest contributor to an individual’s chances of being a union member. Relative to employment in the private sector, employment in local government raises the probability of being a union member by 22.3 percentage points. State and federal government employment, respectively, increase the probability of union membership by 19.2 and 13.2 percentage points relative to private sector workers. Employment in the construction industry lifts the likelihood that a worker is a union member by 11.3 percentage points relative to workers in the manufacturing industry. There is also evidence that working in transportation and utilities, mining, educational and health services, and public administration all improve the chances of being a union member by between 4.8 and 9.3 percentage points, relative to manufacturing. Note that the industry variables include both public and private sector workers, and the independent effects of public sector employment are captured in the local government, state government, and federal government variables. The industry factors reveal that employment growth in the public sector or through infrastructure investment (which would primarily affect construction, transportation, utilities, and mining) would likely increase overall unionization in Illinois.

The State of the Unions 2017 14 Beyond sector and industry influencers, race and ethnicity factor into the chances that a given worker in Illinois is unionized. African-American workers are statistically the most likely racial or ethnic group to be union members in Illinois. African Americans are 9.3 percentage points more likely, on average, to be union members than all other non-white groups. White, non-Latino workers are also 4.1 percentage points more likely to be unionized than all other non-black groups. Some educational, occupational, and industry factors contribute negatively to the probability that a worker is in a union. Holding a professional or doctorate degree reduces the likelihood that a worker is a union member by 4.5 percentage points. Compared to the manufacturing industry, the professional and related services and leisure and hospitality reduce the chances by between 5.0 and 5.3 percentage points. Additionally, workers in service, professional and related, office, administrative support, sales, management, business, and financial positions are all 6.0 to 18.1 percentage points less likely to be union members than similar workers in production occupations.
FIGURE 20: PROBABILITY OF BEING A UNION MEMBER IN ILLINOIS, LARGEST FACTORS, 2014-2016
Probability of Union Membership Illinois Mean
Predictor Percentage Point Change
Sector: Local government +22.34%
Sector: State government +19.19%
Sector: Federal government +13.19%
Industry: Construction +11.27%
Race: African-American +9.30%
Industry: Transportation & utilities +9.28%
Industry: Mining +9.11%
Industry: Educational & health services +5.43%
Industry: Public Administration +4.77%
Status: Citizen +4.49%
Education: Master's degree +4.18%
Race: White, non-Latino +4.06%
Education: Professional or doctorate degree -4.51%
Industry: Professional & business services -4.97%
Industry: Leisure & hospitality -5.28%
Occupation: Service -5.95%
Occupation: Professional & related -6.96%
Occupation: Office & administrative support -11.25%
Occupation: Sales & related -13.16%
Occupation: Management, business, & financial -18.11%
Constant 14.38%
Observations 13,168
Source: CPS-ORG, Center for Economic and Policy Research Uniform Data Extracts, 2014-2016. Only statistically significant variables with a coefficient over ±4.0 percent are displayed in the figure. Occupation dummies are relative to “production” occupations and industry dummies are relative to “manufacturing.” For more, see the Appendix.
UNION WAGES Unionized workers typically earn more than their nonunion counterparts (Figure 21). Figure 21 graphically illustrates the difference between the average union wage and the average nonunion wage in Illinois, the Chicago MSA, and the United States by both percentage benefit and actual per-hour dollar benefit. The results do not control for other factors, which may increase a worker’s wages (e.g., education, occupation,

The State of the Unions 2017 15 industry, age, etc.). The raw averages show that, regardless of geography and time, union membership has been positively correlated with increased worker wages. Nationwide, union membership continues to raise worker wages by about $4.00 per hour, or by about 17 percent. The gap between union and nonunion wages appears to be smaller in Illinois, which is generally a high-wage state for both union and nonunion workers. The wage difference in Illinois decreased over the past year, down from a $2.74 hourly benefit in Illinois to a $2.16 hourly benefit as of 2016. Today, the wage difference is also $1.27 per hour in Chicago on average (Figure 22). Unions raise individual incomes by lifting wages per hour. The data presented in Figure 21 may overstate or understate the union wage effect because union members may be more or less likely to have characteristics associated with higher wages such as age, education, job experience, and geographic location. Regression analyses (OLS and quantile regressions) are utilized to control for these and similar factors in order to isolate the independent effect of unionization on wages and report them in Figure 22. The national average further controls for an individual respondent’s state of residence. Data are for employed persons aged 16 and older from 2014 through 2016 and are based on the natural logarithm of hourly wages to “normalize the data” and analyze the results in percentage terms. For more on the union wage premium regressions, see Table B in the Appendix.
FIGURE 21: UNION WAGE DIFFERENCES BY REGION, PERCENTAGE AND DOLLAR VALUES, 2007 TO 2016
FIGURE 22: WAGES OF UNION AND NONUNION WORKERS BY REGION, 2016
Illinois Chicago MSA USA
Variable Nonunion Union Nonunion Union Nonunion Union
Wage $25.14 $27.30 $26.55 $27.82 $23.81 $27.73
Union Difference, % +8.59% +4.78% +16.49%
Union Difference, $ +$2.16 +$1.27 +$3.92
After controlling for education, demographics, and employment factors, the union wage premium generally aligns with the differences reported in Figures 21 and 22 (Figure 23). On average, unions are found to increase a worker’s per-hour wage by 10.6 percent in the United States. In Illinois, the union wage premium is an estimated 8.0 percent on average, holding all else constant (including occupation and industry). Both results are statistically significant, even at the 1-percent level. A unique analytical tool, called a quantile regression, permits evaluation of the union wage premium across the wage distribution. While union membership is statistically associated with an 8.0 percent increase in the average Illinois worker’s wage, the benefit is generally highest for those at the bottom of the state’s hourly income distribution (Figure 23). In fact, over the past three years, union membership
0%
5%
10%
15%
20%
25%
20
07
20
08
20
09
20
10
20
11
20
12
20
13
20
14
20
15
20
16
Union Wage Premiums, %
Illinois Chicago USA
$0.00
$1.00
$2.00
$3.00
$4.00
$5.00
20
07
20
08
20
09
20
10
20
11
20
12
20
13
20
14
20
15
20
16
Union Wage Premiums, $
Illinois Chicago USA

The State of the Unions 2017 16 statistically increases hourly earnings by 7.9 percent for workers in the bottom 10 percent and 9.3 percent for workers in the bottom 25 percent of the wage distribution. The union wage difference was smaller for the median worker, at 7.1 percent. The average union wage premiums for the richest 10 percent and richest 25 percent of workers (both 6.7 percent) were lower than the average. Union membership had no statistical impact on the top 1 percent of wage earners in Illinois. The estimates corroborate national findings from Schmitt (2008) in The Union Wage Advantage for Low-Wage Workers. The data strongly indicate that unionization benefits low-income and middle-class workers most and help to reduce income inequality.
FIGURE 23: REGRESSIONS OF UNION WAGE PREMIUMS FOR THE UNITED STATES AND ILLINOIS, 2014-2016 Union Wage Premium: Ordinary Least Squares (OLS) and Quantile Regressions, 2014-2016
USA Illinois
Mean Mean Bottom 10% Bottom 25% Median Top 25% Top 10% Top 1%
10.58%*** 7.97%*** 7.86%*** 9.26%*** 7.14%*** 6.71%*** 6.72%*** 0.63%*
R2=0.449 R2=0.441 R2=0.167 R2=0.257 R2=0.299 R2=0.313 R2=0.306 R2=0.191
Three asterisks (***) indicate significance at the 1-percent level. Two asterisks (**) indicates significance at the 5-percent level. Source: CPS-ORG, Center for Economic and Policy Research Uniform Data Extracts, 2014-2016. Statistics are adjusted by the outgoing rotation group earnings weight to match the total population 16 years of age or older. For more, see the Appendix.
FIGURE 24: UNION WAGE PREMIUMS BY STATE, OLS REGRESSIONS, 2014-2016Rank State Union Premium
United States 10.58%
1 South Carolina 18.57%
2 Nevada 15.30%
3 Indiana 14.85%
4 Tennessee 13.89%
5 Arkansas 13.89%
6 California 13.32%
7 Idaho 13.21%
8 Louisiana 12.65%
9 Pennsylvania 11.98%
10 New Jersey 11.56%
11 Kansas 11.16%
12 Wisconsin 10.99%
13 Missouri 10.76%
14 Montana 10.65%
15 Rhode Island 10.46%
16 Maryland 10.21%
17 South Dakota 10.14%
18 Ohio 9.93%
19 Hawaii 9.88%
20 Nebraska 9.82%
21 Georgia 9.48%
22 Arizona 9.42%
23 Michigan 9.09%
24 Mississippi 8.95%
25 Delaware 8.74%
Rank State Union Premium
26 New York 8.72%
27 Wyoming 8.59%
28 Oregon 8.54%
29 Maine 8.16%
30 West Virginia 8.09%
31 Minnesota 7.97%
32 Illinois 7.97%
33 Kentucky 7.79%
34 Washington 7.62%
35 Alabama 7.62%
36 Oklahoma 7.44%
37 Massachusetts 7.22%
38 North Dakota 7.05%
39 Alaska 7.03%
40 District of Columbia 6.96%
41 Texas 6.52%
42 North Carolina 5.48%
43 Vermont 5.27%
44 New Hampshire 5.17%
45 Florida 5.00%
46 Connecticut 4.82%
47 Utah 4.72%
48 New Mexico 4.53%
49 Colorado 4.09%
50 Iowa 3.32%
51 Virginia 2.32%
All estimates are significant at least at the 5-percent level. Source: CPS-ORG, Center for Economic and Policy Research Uniform Data Extracts, 2014-2016. Statistics are adjusted by the outgoing rotation group earnings weight to match the total population 16 years of age or older. For more, see the Appendix.

The State of the Unions 2017 17 How does the average Illinois union wage premium of 8.0 percent compare to the union effect in other states? Similar 2014-2016 ordinary least squares regression models are run to assess each of the 49 other states plus the District of Columbia against Illinois. The results, reported in Figure 24, lead to the conclusion that the Illinois union wage premium is the 32nd-highest in the nation. Interestingly, the union wage premium is actually highest for South Carolina (18.6 percent), Nevada (15.3 percent), and Indiana (14.9 percent). A total of 14 states have union wage premiums that are found to be higher than the national average of 10.6 percent. Importantly, a positive union wage premium exists in every state. The Illinois union wage premium (8.0 percent) is slightly lower than the national average (10.6 percent). This could be due to many reasons. As an example, because unionization is higher in Illinois relative to the nation, the “threat effect” could be stronger. That is, nonunion employers in Illinois may have raised wages to union standards to avert the threat of unionization, which benefits nonunion workers and closes the gap (Eren & Ozbeklik, 2014; Western & Rosenfeld, 2011). The weaker threat could also explain why the union premium is particularly in some right-to-work states such as South Carolina or Indiana.
RECENT DATA ON LABOR UNION ESTABLISHMENTS As a result of the gradual, long-term decline in union membership in Illinois, the total number of labor unions and similar labor organizations has declined over the past 10 years. Figure 25 presents County Business Patterns data on the number of establishments and paid employees in these organizations. An establishment is a single physical location where business is conducted or where services or operations are performed. Establishments include all the union halls, employees’ associations, worker centers, and similar offices of local or national labor unions, collective-bargaining units, and similar organizations. The total number of establishments in 2015, the latest year for which data are available, was 881. This is down considerably from the 950 establishments of labor unions and similar labor organizations in Illinois in 2006. Over the past 10 years, there has been a decline of 69 worker establishments (-7.3 percent) in Illinois, despite a rise in overall employment in the state.
FIGURE 25: UNIONS AND SIMILAR ORGANIZATIONS, ESTABLISHMENTS AND EMPLOYMENT, 2006-2015
Illinois NAICS Code: 81393 – Labor Unions
and Similar Labor Organizations
Year Establishments Paid Employees
2006 950 12,043
2007 961 11,615
2008 937 13,059
2009 939 13,245
2010 942 11,304
2011 941 10,549
2012 918 10,546
2013 912 10,833
2014 891 10,316
2015 881 10,278
2006-2015 Change -69 -1,765
Consequently, the number of paid employees working directly for labor unions and similar labor organizations has fallen from 12,043 workers in 2006 to 10,278 workers in 2015 (-14.7 percent). There are 1,765 fewer individuals working for labor unions and similar organizations today than 10 years ago. Note that employment in unions peaked in 2009, at 13,245 individuals employed at union halls and similar

The State of the Unions 2017 18 establishments. As unionization has decreased, revenue from membership dues has relatively declined, resulting in these nonprofit organizations closing down and laying off workers (Figure 25).
NEW IN 2017: COLLECTIVE-BARGAINING STATES VS. “RIGHT-TO-WORK” STATES The movement to implement “right-to-work” (RTW) legislation has accelerated over recent years. From 2007 to 2016, Indiana, Michigan, Wisconsin, and West Virginia passed “right-to-work” laws. Missouri and Kentucky followed in 2017. Today, 28 states have “right-to-work” laws. A “right-to-work” law is a government regulation which prohibits workers and employers from including union security clauses into collective bargaining contracts. Union security clauses ensure that each member from a collective bargaining unit pays a fair share of dues or fees for the services provided by the union. RTW makes the payment of dues or fees optional, allowing workers in any bargaining unit to “free ride” on the efforts and contributions of others. Consequently, workers can benefit from higher wages, better health and retirement benefits, legal and grievance representation, and other perks earned by the union without paying anything for the services provided (Manzo & Bruno, 2015). Conversely, in a fair-share collective bargaining (CB) state, employers and labor unions are at liberty to negotiate a range of union security clauses. They may, but are not mandated to, agree to a union security clause that requires all persons covered by the contract to pay dues or fees to cover the cost of bargaining activities. In these states, covered employees are only required to pay for bargaining costs and are not forced to finance political or other non-bargaining activities (Manzo & Bruno, 2015). One of the main policy changes contributing to the decline of unionization across the United States is the ratification of “right-to-work” legislation (Figure 26). From 2015 to 2016, union membership in RTW states declined by over 293,000 members. In CB states, overall union membership improved by over 56,000 workers. However, Illinois lost nearly 35,000 members, one of 9 CB states to experience a decline. After netting Illinois out to compare the state to all other CB states, all other CB states gained nearly 91,000 union members over the year. At the state-level, union membership declined in 20 of the 26 RTW states (76.9 percent) but in only 9 of the 25 CB states (36.0 percent), which includes the District of Columbia, over the year.
FIGURE 26: CHANGE IN UNION MEMBERSHIP, ILLINOIS VS. CB STATES VS. RTW STATES, 2015-2016
Union Members 2015 2016 Change
Illinois 846,984 812,397 -34,587
Other Collective-Bargaining States 9,720,044 9,810,999 +90,955
All Right-to-Work States 4,219,252 3,926,238 -293,014
United States 14,786,281 14,549,634 -236,647
Union membership rates fell in both CB and RTW states, but declined more sharply in RTW states (Figure 27). The union membership rate fell by a 0.4 percentage point nationally. At 0.7 percentage point, the decline in unionization in Illinois was higher than the national average. RTW states saw a cumulative drop in the union membership rate by a 0.6 percentage point, while unionization only fell by a 0.2 percentage point in all collective-bargaining states, excluding Illinois.
FIGURE 27: CHANGE IN UNIONIZATION RATES, ILLINOIS VS. CB STATES VS. RTW STATES, 2015-2016
Union Membership Rate 2015 2016 Change
Illinois 15.22% 14.54% -0.68%
Other Collective-Bargaining States 15.12% 14.94% -0.18%
All Right-to-Work States 6.60% 6.04% -0.57%
United States 11.05% 10.69% -0.37%

The State of the Unions 2017 19
CONCLUSIONS Since 2007, unionization has declined in Illinois, the Chicago region, and America. There are approximately 30,000 fewer union members in Illinois today than there were in 2007, contributing to the 1.1 million-member drop in union workers across the nation over that time. Declining union membership in Illinois has primarily been the result of decreases in male unionization. Consequently, the total number of labor unions and similar labor organizations has declined over the past 10 years. There are 881 labor unions and similar organizations in Illinois, a decline of nearly 70 worker establishments over the past 10 years. There are also 1,765 fewer individuals working for labor unions and similar organizations today than there were a decade ago. The long-term downward trends continued for Illinois’ labor movement over the past year. From 2015 to 2016, the unionization rate declined from 15.2 percent to 14.5 percent, union members declined from about 847,000 to about 812,000, and workers between the ages of 35 and 44 and the ages of 55 and 64 experienced drops in union membership.
Although there continue to be downward trends, the Illinois’ labor movement still retains a higher density than the national average. Additionally, while Illinois’ public sector saw a slight decline in unionization rates from 2015 to 2016, the union membership rate for public sector workers is 5.5 percentage points higher in 2016 than it was in 2007. From 2015 to 2016, unionization rates marginally increased for Latino and Latina workers, African American workers, workers between the ages of 16 and 25, and private sector workers. About half of all public sector workers continue to be unionized in both Illinois and the Chicago metropolitan area. Meanwhile, slightly more than one-third of all public sector workers are unionized across the nation. In comparison, fewer than one-in-10 (9.7 percent) workers in Illinois’ private sector are now union members, though this exceeds the 6.4 percent unionization rate for private sector workers across America. Union membership is influenced by a number of factors. Employment in the public sector, construction, transportation and utilities, mining, educational and health services, and public administration increase the likelihood of unionization. Additionally, African-American workers are statistically more likely to be union members than their racial and ethnic counterparts. By contrast, workers employed in professional and related, management, business, and financial occupations, workers employed in sales and related occupations, and those with professional or doctorate degrees are less likely to be unionized. Labor unions increase individual incomes by lifting hourly wages – particularly for low-income workers. In Illinois, unions raise worker wages by an average of 8.0 percent. The state’s union wage effect is the 32nd-highest in the nation. The union wage differential is higher for the bottom 25 percent of workers (9.3 percent) than the richest 25 percent of workers (7.2 percent), helping to reduce income inequality. Organized labor plays a vital role in Illinois’ economy and communities. The Illinois labor movement, however, will continue to face both short- and long-term challenges. In the short term, there are political pressures to weaken unions through various legislative and corporate measures. Over the long term, reversing the trend of declining union membership rates remains a critical if uncertain task. Labor’s response to these challenges will define its influence and effectiveness in the decades to come.

The State of the Unions 2017 20
REFERENCES Adler, Patrick, Chris Tilly, and Trevor Thomas. (2015). From ’15 to $15: The State of the Unions in California
and its Key Cities in 2015. Institute for Research on Labor and Employment, University of California- Los Angeles, available at http://www.irle.ucla.edu/publications/documents/SOU2015.pdf.
Bruno, Robert. (2015). “The Changing Landscape and future of Labor Relations: A View from Organized Labor.”
Illinois Public Employee Relations Report, 32, 3, available at https://www.kentlaw.iit.edu/institutes-centers/institute-for-law-and-the-workplace/publications/illinois-public-employee-relations-report.
Caldwell, Patrick. (2017) “Who Moved My Teachers?” Mother Jones, available at
http://www.motherjones.com/politics/2017/03/scott-walker-trump-wisconsin-teacher-union. Census. (2017). Business Patterns. 2006-2015. American FactFinder, available at factfinder.census.gov. Center for Economic and Policy Research (CEPR). (2017). 2007-2016 CPS ORG Uniform Extracts, Version 2.2.1.
Washington, DC. Cooper, David and Lawrence Mishel. (2015). The Erosion of Collective Bargaining Has Widened the Gap Between
Productivity and Pay. Economic Policy Institute, available at http://www.epi.org/publication/collective-bargainings-erosion-expanded-the-productivity-pay-gap/.
Gordon, Lafer. (2013). “The Legislative Attack on American Wages and Labor Standards, 2011-2012.” Economic
Policy Institute Briefing Paper #364, available at http://www.epi.org/publication/attack-on-american-labor-standards/.
Hirsch, Barry T. and David A. Macpherson. (2017). “Union Membership, Coverage, Density, and Employment
Among All Wage and Salary Workers, 1973-2016.” Unionstats.com. Georgia State University and Trinity University. Database from the Current Population Survey, available at www.unionstats.com.
Eren, Ozkan and I. Serkan Ozbeklik. (2014). “Union Threat and Nonunion Wages: Evidence from the Case Study
of Oklahoma.” Louisiana State University Working Paper, Submitted to Economic Inquiry, available at http://faculty.unlv.edu/oeren/eren_ozbeklik_paper3.pdf.
Manzo IV, Frank and Robert Bruno. (2015). The Impact of Local “Right-to-Work” Zones: Predicting Outcomes
for Workers, the Economy, and Tax Revenue in Illinois. Illinois Economic Policy Institute and Project for Middle Class Renewal, University of Illinois at Urbana-Champaign, available at http://illinoisepi.org/countrysidenonprofit/wp-content/uploads/2013/10/The-Impact-of-Local-Right-to-Work-Zones.pdf.
Manzo IV, Frank and Robert Bruno. (2016). The Application and Impact of Labor Union Dues in Illinois: An
Organizational and Individual-Level Analysis. Illinois Economic Policy Institute; Project for Middle Class Renewal, University of Illinois at Urbana-Champaign, available at http://illinoisepi.org/countrysidenonprofit/wp-content/uploads/2013/10/ILEPI-PMCR-Application-and-Impact-of-Union-Dues-in-Illinois-FINAL.pdf.
Manzo IV, Frank, Robert Bruno, and Virginia Parks. (2016). The State of the Unions 2016: A Profile of
Unionization in Chicago, in Illinois, and in America. Illinois Economic Policy Institute; Labor Education Program, University of Illinois at Urbana-Champaign; Occidental College, available at https://illinoisepi.org/countrysidenonprofit/wp-content/uploads/2013/10/State-of-the-Unions-2016-FINAL.pdf.
Milkman, Ruth and Stephanie Luce. (2016). The State of the Unions 2016: A Profile of Organized Labor in New
York City, New York State, and the United States. Joseph S. Murphy Institute for Worker Education and Labor Studies and the Center for Urban Research, City University of New York Graduate Center, available at https://www.gc.cuny.edu/CUNY_GC/media/CUNY-Graduate-Center/PDF/Communications/Union_Density2016_C5.pdf.
The State of the Unions 2017 21 Murphy, Erin. (2017). “Iowa's Public-Sector Unions Brace for Impact of New Collective Bargaining Law.” The
Gazette. Available at http://www.thegazette.com/subject/news/iowas-public-sector-unions-brace-for-impact-of-new-collective-bargaining-law-20170220.
Schmitt, John. (2008). The Union Wage Advantage for Low-Wage Workers. Center for Economic and Policy
Research, available at http://www.cepr.net/documents/publications/quantile_2008_ 05.pdf. Sommeiller, Estelle and Mark Price. (2015). The Increasingly Unequal States of America: Income Inequality by
State, 1917 to 2012. Economic Analysis and Research Network, available at http://www.epi.org/publication/income-inequality-by-state-1917-to-2012/.
Western, Bruce and Jake Rosenfeld. (2011). “Unions, Norms, and the Rise in U.S. Wage Inequality.” American
Sociological Review, 76(4). 513-537, available at http://www.asanet.org/images/journals/docs/pdf/asr/WesternandRosenfeld.pdf.
COVER PHOTO CREDITS 182nd Airlift Wing. (2014). “Firefighters with the 182nd Civil Engineer Squadron coordinate triage during a
mass-casualty exercise in Peoria, Ill., April 12, 2014.” Flickr Creative Commons User. Available at
goo.gl/fkxNMG.
Associated Press. (2016). “Union supporters rally against Republican Illinois Gov. Bruce Rauner's calls to change
collective bargaining policies, in front of the Illinois State Capitol Wednesday, May 18, 2016, in
Springfield, Ill.” The Daily Herald. Available at
http://www.dailyherald.com/article/20160518/news/305189746/.
AFSCME Council 31. (2016). “10,000 Union Members.” Available at http://labortribune.com/10000-union-
members-fill-streets-illinois-capitol-to-oppose-rauner-2/.
Davis, Sammy. (2016). “Union Labels ILGWU Red, White, & Blue.” Vintage Fashion. Available at
http://sammydvintage.com/vintage-style/union-labels-ilgwu/.
One Nation Indivisible. (2017). “Illinois.” Available at http://www.onenationindivisible.org/map-
state/illinois/.

The State of the Unions 2017 22
APPENDIX TABLE A: PROBIT REGRESSION ON PROBABILITY OF UNION MEMBERSHIP, AVERAGE MARGINAL EFFECTS, ILLINOIS WORKERS, 2014-2016
Illinois
Prob(Union Member) Coefficient (St. Err.)
Age 0.0057*** (0.0001)
Age2 -0.0001*** (0.0000)
Female -0.0143*** (0.0003)
Citizen 0.0449*** (0.0006)
White, non-Latino 0.0406*** (0.0007)
African American 0.0930*** (0.0007)
Latino or Latina 0.0213*** (0.0008)
Chicago MSA 0.0053*** (0.0005)
Center City -0.0052*** (0.0006)
Suburb -0.0197*** (0.0005)
Federal government 0.1319*** (0.0009)
State government 0.1919*** (0.0006)
Local government 0.2234*** (0.0005)
Usual hours worked 0.0016*** (0.0000)
Less than high school 0.0068*** (0.0006)
Some college, no degree 0.0024*** (0.0005)
Associate’s 0.0065*** (0.0005)
Bachelor’s -0.0036*** (0.0005)
Master’s 0.0418*** (0.0006)
Professional/Doctorate -0.0451*** (0.0009)
Industry/Occupation Dummies Y Y
Constant 0.1438*** (0.0001)
R2 0.2709
Observations 13,168 Three asterisks (***) indicate significance at the 1% level, two asterisks (**) indicates significance at the 5% level, and one asterisk (*) indicates significance at the 10% level. Source: CPS-ORG, Center for Economic and Policy Research Uniform Data Extracts, 2014-2016. The total number of observations of employed persons was 13,168 in Illinois. Importance weights are applied to the probit model.
A probit regression model allows for analysis of the probability of a “binary” yes-or-no variable occurring. In this case, the model reports the (positive or negative) direction of the effect that a factor has on the probability of being a union member and whether the output is statistically significant. To determine the magnitude of statistically significant factors, average marginal effects (AMEs) are generated and reported using the dydx, margins command in STATA. Importance weights to match the sample size to the actual
population are applied.
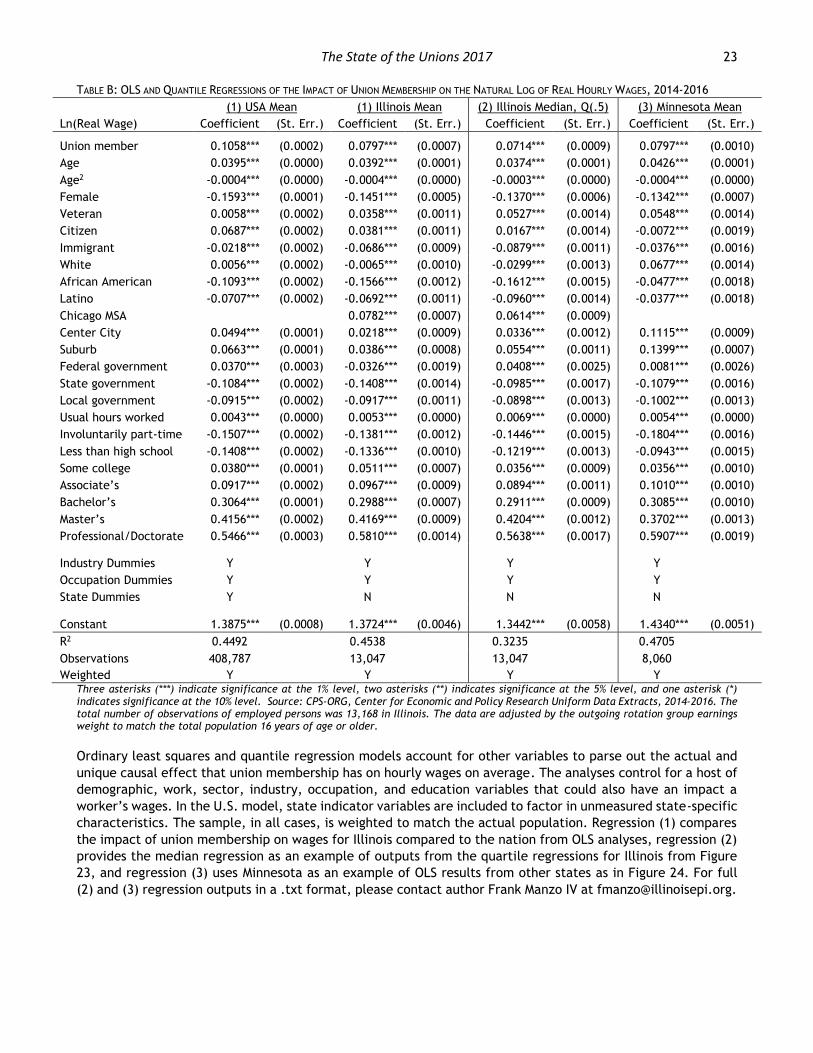
The State of the Unions 2017 23 TABLE B: OLS AND QUANTILE REGRESSIONS OF THE IMPACT OF UNION MEMBERSHIP ON THE NATURAL LOG OF REAL HOURLY WAGES, 2014-2016
(1) USA Mean (1) Illinois Mean (2) Illinois Median, Q(.5) (3) Minnesota Mean
Ln(Real Wage) Coefficient (St. Err.) Coefficient (St. Err.) Coefficient (St. Err.) Coefficient (St. Err.)
Union member 0.1058*** (0.0002) 0.0797*** (0.0007) 0.0714*** (0.0009) 0.0797*** (0.0010)
Age 0.0395*** (0.0000) 0.0392*** (0.0001) 0.0374*** (0.0001) 0.0426*** (0.0001)
Age2 -0.0004*** (0.0000) -0.0004*** (0.0000) -0.0003*** (0.0000) -0.0004*** (0.0000)
Female -0.1593*** (0.0001) -0.1451*** (0.0005) -0.1370*** (0.0006) -0.1342*** (0.0007)
Veteran 0.0058*** (0.0002) 0.0358*** (0.0011) 0.0527*** (0.0014) 0.0548*** (0.0014)
Citizen 0.0687*** (0.0002) 0.0381*** (0.0011) 0.0167*** (0.0014) -0.0072*** (0.0019)
Immigrant -0.0218*** (0.0002) -0.0686*** (0.0009) -0.0879*** (0.0011) -0.0376*** (0.0016)
White 0.0056*** (0.0002) -0.0065*** (0.0010) -0.0299*** (0.0013) 0.0677*** (0.0014)
African American -0.1093*** (0.0002) -0.1566*** (0.0012) -0.1612*** (0.0015) -0.0477*** (0.0018)
Latino -0.0707*** (0.0002) -0.0692*** (0.0011) -0.0960*** (0.0014) -0.0377*** (0.0018)
Chicago MSA 0.0782*** (0.0007) 0.0614*** (0.0009)
Center City 0.0494*** (0.0001) 0.0218*** (0.0009) 0.0336*** (0.0012) 0.1115*** (0.0009)
Suburb 0.0663*** (0.0001) 0.0386*** (0.0008) 0.0554*** (0.0011) 0.1399*** (0.0007)
Federal government 0.0370*** (0.0003) -0.0326*** (0.0019) 0.0408*** (0.0025) 0.0081*** (0.0026)
State government -0.1084*** (0.0002) -0.1408*** (0.0014) -0.0985*** (0.0017) -0.1079*** (0.0016)
Local government -0.0915*** (0.0002) -0.0917*** (0.0011) -0.0898*** (0.0013) -0.1002*** (0.0013)
Usual hours worked 0.0043*** (0.0000) 0.0053*** (0.0000) 0.0069*** (0.0000) 0.0054*** (0.0000)
Involuntarily part-time -0.1507*** (0.0002) -0.1381*** (0.0012) -0.1446*** (0.0015) -0.1804*** (0.0016)
Less than high school -0.1408*** (0.0002) -0.1336*** (0.0010) -0.1219*** (0.0013) -0.0943*** (0.0015)
Some college 0.0380*** (0.0001) 0.0511*** (0.0007) 0.0356*** (0.0009) 0.0356*** (0.0010)
Associate’s 0.0917*** (0.0002) 0.0967*** (0.0009) 0.0894*** (0.0011) 0.1010*** (0.0010)
Bachelor’s 0.3064*** (0.0001) 0.2988*** (0.0007) 0.2911*** (0.0009) 0.3085*** (0.0010)
Master’s 0.4156*** (0.0002) 0.4169*** (0.0009) 0.4204*** (0.0012) 0.3702*** (0.0013)
Professional/Doctorate 0.5466*** (0.0003) 0.5810*** (0.0014) 0.5638*** (0.0017) 0.5907*** (0.0019)
Industry Dummies Y Y Y Y
Occupation Dummies Y Y Y Y
State Dummies Y N N N
Constant 1.3875*** (0.0008) 1.3724*** (0.0046) 1.3442*** (0.0058) 1.4340*** (0.0051)
R2 0.4492 0.4538 0.3235 0.4705
Observations 408,787 13,047 13,047 8,060
Weighted Y Y Y Y Three asterisks (***) indicate significance at the 1% level, two asterisks (**) indicates significance at the 5% level, and one asterisk (*) indicates significance at the 10% level. Source: CPS-ORG, Center for Economic and Policy Research Uniform Data Extracts, 2014-2016. The total number of observations of employed persons was 13,168 in Illinois. The data are adjusted by the outgoing rotation group earnings weight to match the total population 16 years of age or older.
Ordinary least squares and quantile regression models account for other variables to parse out the actual and
unique causal effect that union membership has on hourly wages on average. The analyses control for a host of
demographic, work, sector, industry, occupation, and education variables that could also have an impact a
worker’s wages. In the U.S. model, state indicator variables are included to factor in unmeasured state-specific
characteristics. The sample, in all cases, is weighted to match the actual population. Regression (1) compares
the impact of union membership on wages for Illinois compared to the nation from OLS analyses, regression (2)
provides the median regression as an example of outputs from the quartile regressions for Illinois from Figure
23, and regression (3) uses Minnesota as an example of OLS results from other states as in Figure 24. For full
(2) and (3) regression outputs in a .txt format, please contact author Frank Manzo IV at [email protected].

The State of the Unions 2017 24
Industry Profiles: Union and Nonunion Workers in Illinois, 2014-2016
2014-2016 Construction Manufacturing Transportation and Warehousing
Education, Health, and Social Services
Public Administration
Variable State Labor Market State Labor Market State Labor Market State Labor Market State Labor Market
Employed 85.4% 92.7% 91.5% 91.8% 91.4%
In Labor Force 95.8% 97.1% 96.7% 95.7% 94.0%
Unemployment Rate 10.8% 4.5% 5.4% 4.1% 2.8%
Unionization Rate 37.4% 11.0% 30.5% 23.2% 52.8%
Share of Union Workforce 11.3% 9.3% 12.0% 36.7% 14.2%
Total Observations 1,066 2,149 1,054 4,201 676
Standard Margin of Error ±3.0% ±2.1% ±3.0% ±1.5% ±3.8%
Variable Nonunion Union Nonunion Union Nonunion Union Nonunion Union Nonunion Union
Observations 433 267 1,726 206 615 270 2,805 868 296 323
Employment
Average Workers Per Year 157,183 94,007 622,294 77,153 226,632 99,366 1,007,275 304,696 104,927 117,433
Hourly Wage $23.57 $33.39 $26.44 $21.72 $21.82 $26.25 $24.43 $25.80 $28.29 $30.28
Union Wage Difference, % -- +41.7% -- -17.9% -- +20.4% -- +5.6% -- +7.0%
Usual Hours Worked 39.8 40.6 41.5 40.2 42.6 39.6 35.9 41.0 38.1 40.9
Education
Less than High School 15.7% 5.6% 9.7% 13.8% 8.2% 3.0% 2.7% 1.8% 1.4% 2.1%
High School 39.8% 48.9% 30.0% 43.5% 37.0% 27.6% 15.2% 9.9% 11.6% 12.3%
Some College, No Degree 16.7% 19.3% 17.3% 19.7% 20.9% 36.4% 19.3% 8.7% 18.3% 27.8%
Associates 9.1% 15.0% 7.7% 10.3% 9.9% 14.5% 13.1% 6.5% 14.4% 17.2%
Bachelors 16.9% 7.8% 24.4% 10.3% 16.6% 17.1% 26.7% 27.9% 33.8% 27.6%
Masters 1.4% 2.5% 8.4% 0.5% 7.1% 1.1% 15.2% 40.1% 11.3% 10.3%
Professional or Doctorate 0.5% 1.0% 2.4% 1.9% 0.3% 0.2% 7.8% 5.2% 9.2% 2.8%
Gender
Male 85.4% 99.1% 68.0% 79.4% 75.0% 71.1% 24.5% 24.4% 44.5% 66.9%
Female 14.6% 0.9% 32.0% 20.6% 25.0% 28.9% 75.5% 75.6% 55.5% 33.1%
Race/Ethnicity
White, non-Latino 65.3% 79.7% 62.3% 52.1% 59.6% 64.8% 68.1% 72.8% 73.6% 70.5%
African American 5.2% 5.0% 7.6% 21.8% 19.8% 27.5% 13.8% 15.1% 13.6% 19.9%
Latino or Latina 27.0% 14.8% 22.5% 21.9% 15.3% 6.7% 9.7% 8.2% 8.2% 7.8%
Other Information
Average Age 41.8 43.3 41.5 44.5 42.6 45.6 41.7 44.5 46.5 43.8
Lives in the Chicago MSA 71.9% 59.0% 69.9% 48.5% 77.2% 69.3% 65.7% 65.6% 57.2% 60.9%
Union workers in these five industries accounted for 82.3 percent of all union members in Illinois in 2014, 2015, and 2016, according to the data from the Bureau of Labor Statistics. Data from three years are used to increase statistical significance. Standard margins of error are reported as equivalents if data were obtained from a simple survey, based on total observations and estimated average population using the earnings weight provided. Note that all industry profiles are estimates and serve as general parameters, not exact figures.

The State of the Unions 2017 25