the state of things perception and reputation ben page ... · 7 base: 1,257 british adults 18+,...
TRANSCRIPT

1
The state of things – perception and reputation
Ben Page, Chief Executive, Ipsos MORI

2
PREDICTION IS HARD
2

3
So where
are we?

4Political Monitor | October 2016 | Final | Public
DO YOU THINK THAT THE GENERAL ECONOMIC CONDITION OF THE COUNTRY WILL IMPROVE, STAY THE SAME OR GET WORSE
OVER THE NEXT 12 MONTHS?
Source: Ipsos MORI Political MonitorBase: c.1,000 British adults each month
Marmite shock – confidence drops 28 pts in a month
-80
-60
-40
-20
0
20
40
Feb
1997
Jun
1997
Oct
1997
Feb
1998
Jun
1998
Oct
1998
Feb
1999
Jun
1999
Oct
1999
Feb
2000
Jun
2000
Oct
2000
Feb
2001
Jun
2001
Oct
2001
Feb
2002
Jun
2002
Oct
2002
Feb
2003
Jun
2003
Oct
2003
Feb
2004
Jun
2004
Oct
2004
Feb
2005
Jun
2005
Oct
2005
Feb
2006
Jun
2006
Oct
2006
Feb
2007
Jun
2007
Oct
2007
Feb
2008
Jun
2008
Oct
2008
Feb
2009
Jun
2009
Oct
2009
Feb
2010
Jun
2010
Oct
2010
Feb
2011
Jun
2011
Oct
2011
Feb
2012
Jun
2012
Oct
2012
Feb
2013
Jun
2013
Oct
2013
Feb
2014
Jun
2014
Oct
2014
Feb
2015
Jun
2015
Oct
2015
Feb
2016
Jun
2016
Oct
2016
-29
5Political Monitor | October 2016 | Final | Public
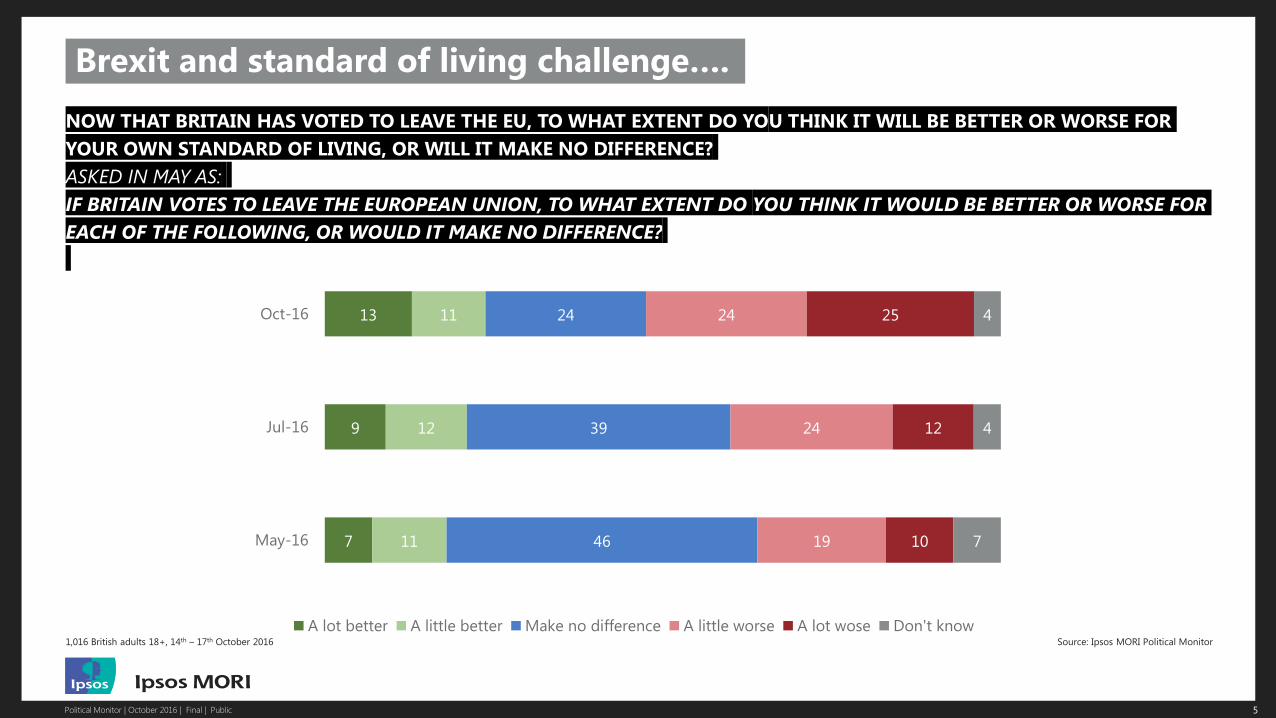
NOW THAT BRITAIN HAS VOTED TO LEAVE THE EU, TO WHAT EXTENT DO YOU THINK IT WILL BE BETTER OR WORSE FOR
YOUR OWN STANDARD OF LIVING, OR WILL IT MAKE NO DIFFERENCE?
ASKED IN MAY AS:
IF BRITAIN VOTES TO LEAVE THE EUROPEAN UNION, TO WHAT EXTENT DO YOU THINK IT WOULD BE BETTER OR WORSE FOR
EACH OF THE FOLLOWING, OR WOULD IT MAKE NO DIFFERENCE?
Source: Ipsos MORI Political Monitor
Brexit and standard of living challenge….
1,016 British adults 18+, 14th – 17th October 2016
7
9
13
11
12
11
46
39
24
19
24
24
10
12
25
7
4
4
May-16
Jul-16
Oct-16
A lot better A little better Make no difference A little worse A lot wose Don't know

6Political Monitor | October 2016 | Final | Public
18
47
30
514
55
26
5
QA: RECENTLY THE VALUE OF THE BRITISH POUND HAS DECREASED COMPARED WITH OTHER CURRENCIES. (QB INCLUDES:
THIS IS LIKELY TO MEAN IMPORTS TO BRITAIN FROM OTHER COUNTRIES WILL BECOME MORE EXPENSIVE, WHILE BRITISH
EXPORTS TO OTHER COUNTRIES WILL BE MORE COMPETITIVE). ON BALANCE, DO YOU THINK THE FALL IN THE POUND IS A
GOOD THING OR A BAD THING FOR BRITAIN, OR DOES IT MAKE NO DIFFERENCE?
Source: Ipsos MORI Political MonitorBase: 1,000 British adults 18+, 10th – 14th September 2016
The depreciation of the Pound
QA QB
GOOD THING BAD THING MAKES NO DIFFERENCE DON’T KNOW

7
Source: Ipsos MORI Political MonitorBase: 1,257 British adults 18+, 11th – 14th June 2016
Immigration trumped
the economy before
And which of these issues, if any,
that you mentioned is the most
important to you in helping you
decide which way to vote?
23 June…..
11
7
5
6
7
8
11
12
28
33
Don’t know
Nothing/none
The ability to travel in the
European Union
Britain’s ability to trade with
countries in the European …
The cost of EU immigration on
Britain’s welfare system
The impact on British jobs
Impact on public
services/housing
Britain’s ability to make
its own laws
The impact on Britain’s
economy
The number of immigrants
coming into Britain
Jun-16
Unprompted

8
45% single market
vs 39% stop immigration

9Political Monitor | October 2016 | Final | Public
0
10
20
30
40
50
60A
pr
03
Oct
03
Ap
r 04
Oct
04
Ap
r 05
Oct
05
Ap
r 06
Oct
06
Ap
r 07
Oct
07
Ap
r 08
Oct
08
Ap
r 09
Oct
09
Ap
r 10
Oct
10
Ap
r 11
Oct
11
Ap
r 12
Oct
12
Ap
r 13
Oct
13
Ap
r 14
Oct
14
Ap
r 15
Oct
15
Ap
r 16
Oct
16
2015 General Election
Miliband
elected
(Sept 10)
Corbyn
elected
(Sept 15)
May
as PM
(July 16)
HOW WOULD YOU VOTE IF THERE WERE A GENERAL ELECTION TOMORROW?
Source: Ipsos MORI Political Monitor
Base: c. 700 British adults; Prior to July 2015 the turnout filter is “All certain to vote”; From July 2015 turnout filter is “all 9/10 certain to vote and always/usually/it depends vote
in General Elections
Conservatives spring to 18 point lead over Labour
2005 General Election 2010 General Election
Cameron
elected
(Dec 05)
Brown
as PM
(June 07)
CONSERVATIVE LABOUR UKIP GREEN LIB DEM

Public services briefing – STRICTLY CONFIDENITAL NOT FOR CIRCULATION 10
Fundamentals haven’t changed - we are living in much more uncertain world

Public services briefing – STRICTLY CONFIDENITAL NOT FOR CIRCULATION 11
Life is more comfortable compared to the 1970s – but we still suffer from change anxiety
1975 2015
96%96%
71%
43%
Washingmachine
ownership
Central heating 77%
agree “the world is
changing too fast”

12
Patriotic nostalgia
everywhere
To what extent do you agree or
disagree…?
I would like … to be the way it used to
be
69%
62%
60%
57%
56%
56%
54%
53%
51%
50%
50%
46%
45%
45%
42%
41%
41%
35%
28%
28%
22%
21%
27%
34%
34%
36%
29%
34%
33%
44%
33%
43%
44%
38%
47%
46%
46%
45%
52%
67%
63%
73%
US
Argentina
India
Italy
France
Australia
Belgium
GB
Turkey
Canada
S Africa
Total
Russia
Brazil
Spain
Japan
Poland
Germany
S Korea
Sweden
China
Base: 16,039 adults across 20 countries (1,000 GB),
online,
The Global Trends Survey
Agree Disagree
US

13
Reasons to worry

14

15
Nativism seems the key driving force for Trump…..
Nativism/

16
Over here….

17Deloitte – Customer service expectations | August 2016 | FINAL |
Survey on behalf of Deloitte LLP for The State of the State 2016-17
57%33%
30%24%
22%20%
18%11%10%
7%6%6%6%5%5%4%
2%2%1%
The NHS and healthcare
Dealing with the UK leaving the EU
Education and schools
The economy and jobs
Immigration
Poverty, inequality and low pay
Housing
Social security, benefits and pensions
Defence, security and terrorism
Environment and climate change
Public transport
Local authority services
Police and preisons
Reducing the deficit
Universities and higher education
Infrastructure
Devolution withint he UK
Other
None of these
Which two or three,
if any, of the
following policy
areas do you think
should be the
priority for the UK
government over
the next 12
months?
Dealing with Brexit is a high priority for the public over the next 12 months, but the
NHS is clearly top of the list ….
Base: 1099 GB adults 15+
Q

18Deloitte – Customer service expectations | August 2016 | FINAL |
Survey on behalf of Deloitte LLP for The State of the State 2016-17
20%
17%
14%
12%
8%
7%
7%
6%
5%
4%
Better public transport
Better health services / hospitals
More money / investment
Better road maintenace / traffic flow / management
Better street cleaning/ rubbish collection / recycling facilities
Better / more education / schools
Better / more police / policing
Nothing / none / no change good as they are
Better / improved services for the young / children
Better / improved housing / homes / more affordable rents
What things would
you say would most
improve public
services in your
local area? (Top ten
mentions)
Spontaneous requests for more of the following locally…..
Base: 1099 GB adults 15+
Q

19Deloitte – Customer service expectations | August 2016 | FINAL |
Survey on behalf of Deloitte LLP for The State of the State 2016-17
6%
8%
8%
21%
15%
25%
47%
39%
49%
25%
37%
10%
1%
2%
8%
A great deal A fair amount Not very much Not at all Don't know
November 2012
July 2016
As you may know, the
government has
announced a number
of spending cuts to
help reduce the
national deficit. To
what extent, if at all,
have you and your
family been affected
by the cuts so far?
Most still not noticing austerity
Base: 1099 GB adults 15+
Q
August 2015

20Deloitte – Customer service expectations | August 2016 | FINAL |
Survey on behalf of Deloitte LLP for The State of the State 2016-17
60%
46%
56%61%
76%
26%
33%
23%20%
14%11%
18%15%
12%7%
3%2%6%7%
3%0%
10%
20%
30%
40%
50%
60%
70%
80%
90%
100%
Government services should be extended, even if
it means some increases to taxes
Things should be left as they are
Taxes should be cut, even if it means some
reduction in government services
November 2000 April 2005 July 2016
People have different
views about whether
its is more important
to reduce taxes or
keep up government
spending. How about
you? Which of these
statements comes
closest to your own
view?
Starting to see shift in tax v spend priorities
Base: 1099 GB adults 15+
Q
April 1997 June 2009

21Deloitte – Customer service expectations | August 2016 | FINAL |
Survey on behalf of Deloitte LLP for The State of the State 2016-17
In the recent referendum Britain
voted to leave the European Union.
To what extent do you think this
will be better or worse for Britain’s
public services than if we had
voted to remain or will it make no
difference?
Overall, public expect Brexit to be worse for public services
Base: 1099 GB adults 15+
9%
18%
26%20%
20%
5%
A lot better A little better Make no difference
A little worse A lot worse Don't knowQ

22
How are you doing?

23Deloitte – Customer service expectations | August 2016 | FINAL |
Survey on behalf of Deloitte LLP for The State of the State 2016-17
Thinking about the
following list of
public services,
overall, how satisfied
or dissatisfied, if at
all, are you with the
quality of each?
Satisfaction with many key public services among users has held up or even improved.
Base: users of each service
*Small base size, indicative only
Q
1998 2000 2002 2016
Local sports or
leisure centres77% 76% 76% 86%
Parks and open
spaces79% 81% 81% 86%
Libraries 87% 88% 85% 85%
Recycling facilities 78% 80% 76% 82%
Universities and
higher education82% 78%
Schools 78%
NHS hospitals 80% 82% 76% 77%
GP surgeries 72%
Police 68%
Local bus services 62% 64% 66% 67%
Social services for
adults/older people60%
Social services for
children/families*59%

24Deloitte – Customer service expectations | August 2016 | FINAL |
Survey on behalf of Deloitte LLP for The State of the State 2016-17
Thinking about public sector
organisations like local councils,
schools and hospitals, and private
sector companies like shops and banks.
Which do you think is better at
providing services – public sector
organisations or private sector
companies – or do you think there is no
difference?
Q
Public sector is improving…
Base: July 2016 - 1099 GB adults 15+ - May 2004 1502 GB adults 16+ by telephone. Trends indicative only
30%
20%
42%
38%
25%
36%
2%
10%
Public sector better No difference
July 2016
May 2004

25Deloitte – Customer service expectations | August 2016 | FINAL |
Survey on behalf of Deloitte LLP for The State of the State 2016-17
4%14%
5%
51%
51%
21%
30%
7%
10%
4%
2%
2%
Greatly exceed expectations
Slighly exceed expectations
About what you expect
Fall slightly short of expectations
Thinking generally about what you
expect of public services like local
councils, schools or hospitals / private
sector companies like shops or banks,
would you say they…
Q
The public sector has got better at exceeding customer expectations
Base: 1099 GB adults 15+, September 1998: 5,064 GB adults
July 2016
September
1998

26Veracity Index 2015 Generational Analysis | January 2016 | Version 1 | PUBLIC
Who do they trust?
89%
86%
80%
79%
69%
68%
68%
67%
65%
59%
53%
51%
49%
47%
46%
43%
42%
37%
37%
35%
25%
25%
22%
21%
Doctors
Teachers
Judges
Scientists
Hairdressers
The Police
Ordinary Man/Woman in the street
Clergy/Priests
TV news readers
Civil Servants
Pollsters
Lawyers
Managers in the NHS
Charity Chief Executives
Trade Union Officials
Local Councillors
Builders
Bankers
Managers in Local Government
Business Leaders
Journalists
Estate Agents
Government Ministers
Politicians generally
“Now I will read you a list of different types of people. For each would you tell me if you generally trust them to tell the truth, or not?”
% trust to tell the truth
Base: 990 British adults aged 15+, fieldwork 5th December 2015 – 4th January 2016

27Deloitte – Customer service expectations | August 2016 | FINAL |
Survey on behalf of Deloitte LLP for The State of the State 2016-17
How often, if at all, do you
think organisations that
deliver public services /
private sector
organisations…
Q
When asked about specific aspects of services, the public sector is behind the private
sector on offering a personalised service and listening to preferences…
Source: HMRC and OBR 2015Base: 1099 GB adults 15+,
23%
19%
17%
16%
25%
28%
27%
16%
Public sector
organisations
Private sector
companies
… understand
your needs
… listen to your
preferences
… offer you a
personalised
service
… involve you in
decisions about
how you use the
service
% Always /often
28
Building things….

29Deloitte – Customer service expectations | August 2016 | FINAL |
Survey on behalf of Deloitte LLP for The State of the State 2016-17
Fieldwork dates: 18° Sept to 29° Sept 2015
Most support local decision-making for issues like housing ..
17%
25%
35%
36%
44%
56%
64%
65%
57%
47%
47%
38%
26%
18%
New housing developments
Transport, such as…
Schools and further…
Crime and policing services
Health and social care…
New infrastructure…
Welfare benefit payments,…
Nationally Locally
Q. For each of the following services, do you think decisions should be taken nationally for England as a whole or
locally by local bodies such as councils or other local service providers?
Base: All adults aged 16-75 in England (3831)

4
33
32
21
74
% Very satsified % Fairly satisfied
% Neither/nor % Fairly dissatisfied
% Very dissatisfied % Don't know
Base: 1,001 GB adults 16-65 (online), 26 Aug-9 Sept
I now want you to think
about Britain’s
infrastructure.
By infrastructure I
mean things we rely on
like road, rail and air
networks, utilities such
as energy and water,
and broadband and
other communications.
Overall, how satisfied
or dissatisfied are you
with Britain’s national
infrastructure?
Q
Public lukewarm on Britain’s infrastructure
Satisfied Dissatisfied
36% 29%

23
44
19
51
8
% Strongly agree % Tend to sagree % Neither/nor
% Tend to disagree % Strongly disagree % Don't know
To what extent do you
agree or disagree…?
Local
communities’
views on plans for
infrastructure
should be heard
properly, even if it
means delays
Q
But they want to be consulted even if slows development
Agree Disagree
67% 6%Base: 1,001 GB adults 16-65 (online), 26 Aug-9 Sept

4
23
31
27
14
% Very good % Fairly good % Fairly poor
% Very poor % Don't know
These next questions
are about different
types of
infrastructure in GB.
Please indicate how
good or poor you
rate the current
quality of each
one in GB…
New housing
supply
Q
Housing supply – 6 in 10 are negative
Good Poor
27% 59%Base: 1,001 GB adults 16-65 (online), 26 Aug-9 Sept

33
British confidence
still high

34
Base: 1,052 British Citizens aged 16-75 in GB. Interviews were
conducted online, from 26th-29th July 2016
What is best
From this list, please tell me
which two or three, if any of
these do you think are the best
characteristics of British people
as a whole?
6%
7%
13%
19%
24%
25%
26%
27%
40%
47%
Don't know
None
Keep to themselves
Law abiding
Hardworking
Friendly
Patriotism
Tolerant
Polite/Good Manners
Good sense of humour
about us?

35
????
Base: 1,052 British Citizens aged 16-75 in GB.
Interviews were conducted online, from 26th-29th July
2016
And what’s worst?
From this list, please tell me
which two or three, if any of
these do you think are the worst
characteristics of British people
as a whole?
5%
7%
7%
14%
14%
14%
17%
18%
19%
22%
27%
37%
42%
Don't know
None
Unfriendly
Rude
Too nationalistic
Bad teeth
Too pessimistic
Bad eating habits
Lazy
Intolerant to other…
Complain too much
Ignorant of other cultures
Drink too much

36
????
Base: 1,052 British Citizens aged 16-75 in GB.
Interviews were conducted online, from 26th-29th July
2016
Still proud to be British
rather than
Do you agree or disagree with
the statement, “I would rather
be a citizen of Britain than of any
country on earth?”
anything else!
31%
29%
23%
8%
5% 4%
Strongly agree
Tend to agree
Neither agree nor
disagree
Tend to agree
Strongly disagree
I am not British
Don’t know

37
