the weatherization assistance program formula
TRANSCRIPT

The Weatherization Assistance Program
Formula
Updated November 12, 2021
Congressional Research Service
https://crsreports.congress.gov
R46418

Congressional Research Service
SUMMARY
The Weatherization Assistance Program Formula The Department of Energy’s (DOE’s) Weatherization Assistance Program (WAP) enables low-income families to reduce their energy consumption by making their dwellings more energy efficient. The WAP was authorized in Title IV of the Energy Conservation and Production Act
(ECPA, P.L. 94-385) and established in 1976. This act authorized the Administrator of the Federal Energy Administration (and later the Secretary of Energy) to provide weatherization
assistance.
The WAP is a formula grant program: funding flows from DOE to state and territorial governments and then to local governments and weatherization agencies. DOE program guidelines specify that a variety of
energy efficiency measures are eligible for support under the program. The measures include insulation, space-heating equipment, energy-efficient windows, water heaters, and efficient air conditioners.
Program funds are allocated to the states and territories according to a formula that has a long and complicated history.
Initially WAP funds were distributed in a manner that was more favorable to colder-weather states. This focus was in part the result of high heating oil prices throughout the 1970s. As WAP was reauthorized, Congress amended the factors that were
considered by DOE to inform the distribution of funds.
The current procedure dates to 1990, when Congress reauthorized WAP. The reauthorization required that the Secretary of DOE amend the formula allocation to use more recent data and to account for factors such as the cost of heating and cooling.
The effect of these changes was that, in general, some funding would be shifted from colder-weather states to warmer-weather states. To prevent a dramatic shift of funds, the “new” formula, which DOE developed in 1995, is used to calculate state allotments only when appropriations for the WAP program exceed approximately $209.7 million. When funds are at or
above the threshold, DOE determines program allocations for states and territories according to a base allocation and a formula allocation. The base allocation is a set amount for each state and territory and reflects historical program allocations.
The formula allocation is composed of three factors: a population factor, a climatic factor (which is derived from heating and cooling degree days), and a residential energy expenditure factor by low-income households (which approximates the financial burden to low-income households of energy use). For total program allocations below $209,724,761, DOE
determines allocations for states and territories according to a base allocation of $209,724,761 less the percentage decrease of the total program allocation from the threshold.
Under the current procedure, the method of funding allocation is dependent upon whether WAP’s annual appropriation by
Congress is at or exceeds the monetary threshold, as noted. In FY2021, the threshold for the formula allocation was exceeded with WAP funding at $310 million.
The WAP was reauthorized in the Energy Act of 2020 (Division Z of the Consolidated Appropriations Act, 2021, P.L. 116-260). The act amended the program, and in addition to the factors in the formula allocation, the Secretary of DOE also may consider the non-energy benefits of weatherization improvements—such as improvements to health and safety—when
determining appropriate standards and procedures.
Issues for Congress center on whether to amend the current allocation procedure to account for changes in the energy consumption of heating or cooling, to make changes to the per dwelling funding limit, to make changes to the approved
weatherization materials, or to include other factors in the formula. In the 117th Congress, several bills would make changes to the WAP. These include increasing the authorized appropriations for the program, increasing per dwelling funding limits,
establishing a timeline for disbursement of allocated funds to states, and directing a percentage of funds to be apportioned to environmental justice communities, among other proposals.
R46418
November 12, 2021
Corrie E. Clark Analyst in Energy Policy
Lynn J. Cunningham
Senior Research Librarian

The Weatherization Assistance Program Formula
Congressional Research Service
Contents
Introduction to the Weatherization Assistance Program ......................................................... 1
Statutory Authority for Allocation ................................................................................ 2
WAP’s Program Allocation ............................................................................................... 2
Development of the Program Allocation Procedures........................................................ 3 1984 Formula Allocation ....................................................................................... 3 1995 Formula Allocation ....................................................................................... 4
FY2021 Allocation .................................................................................................... 4
The Base Allocation ........................................................................................................ 5
The Formula Allocation ................................................................................................... 5
Factor 1: Population ................................................................................................... 6 Factor 2: Climate ....................................................................................................... 6 Factor 3: Residential Energy Expenditure ...................................................................... 7
Potential Issues for Congress ............................................................................................ 8
Tables
Table A-1. Weatherization Assistance Program (WAP): State Allocations: FY2020-
FY2021 .................................................................................................................... 10
Table A-2. Table A-2. Weatherization Assistance Program (WAP): State Allocations:
FY2010-FY2019 ........................................................................................................ 14
Table A-3. Table A-3. Weatherization Assistance Program (WAP): State Allocations:
FY2001-FY2009 ARRA.............................................................................................. 18
Table B-1. Base Allocation Table from 10 C.F.R. §440.10 ................................................... 22
Appendixes
Appendix A. State Total Allocations, FY2001-FY2021 ....................................................... 10
Appendix B. Base Allocation .......................................................................................... 22
Contacts
Author Information ....................................................................................................... 23

The Weatherization Assistance Program Formula
Congressional Research Service 1
Introduction to the Weatherization Assistance
Program The Weatherization Assistance Program (WAP) was established in 1976 under Title IV of the
Energy Conservation and Production Act (ECPA, P.L. 94-385, 42 U.S.C. §6861 et seq.). The WAP enables low-income families to permanently reduce their energy consumption by making
their households more energy efficient.1 It is a formula grant program: funding flows from the
Department of Energy (DOE) to state governments (including territories, beginning in 2007) and
then to local governments and weatherization agencies. DOE program guidelines specify that a
variety of energy efficiency measures are eligible for support under the program. The measures include insulation, space-heating equipment, energy-efficient windows, water heaters, and efficient air conditioners.
The Energy Act of 2020 (Division Z, P.L. 116-260) amended the program and reauthorized annual appropriations from FY2021 through FY2025. The act clarified that renewable energy
technologies and other advanced technologies are considered to be weatherization materials (42
U.S.C. §6862(9)). The act also amended section 413(b) of EPCA (42 U.S.C. §6863(b)) to
authorize DOE to account for the non-energy benefits of weatherization improvements—such as
improvements to health and safety—when determining appropriate standards and procedures for WAP. The act added a section 414(c) of EPCA (42 U.S.C. §6864c) stating that the Secretary may
request that grant recipients review and encourage the expanded use of private contractors. A new
section 414(d) authorized the creation of a new financial assistance program for WAP
enhancement and innovation. Other changes include increasing the amount of a WAP grant that
can be used for administration purposes from 10% to 15% and changing the eligibility requirements for reweatherization of any dwelling to 15 years after the previous weatherization was completed.
Currently, DOE employs a formula to allocate WAP funding to states, the District of Columbia, and territories (hereinafter referred to as states and territories). Each state and territory, in turn,
decides how to allocate its share of the funding to local governments and jurisdictions. 2 Funds
made available to the states are allocated to local governments and nonprofit agencies for
purchasing and installing energy efficiency materials, such as insulation, and for making energy-
related repairs.3 Funds for tribes are included in a state’s formula allocations. With a few exceptions, funds for tribes are distributed at the state level.
This report discusses the formula that is used to allocate WAP funds to state governments. The
formula allocation has changed over time. The report begins with an introduction to WAP, including the program’s statutory authority, current allocation procedure, and origin and
evolution. Next, the report discusses the specific methods and factors for distributing WAP funds
1 The federal WAP statute states that the primary purpose of the program is “ to increase the energy efficiency of
dwellings owned or occupied by low-income persons, reduce their total residential energy expenditures, and improve
their health and safety, especially low-income persons who are particularly vulnerable such as the elderly, the
handicapped, and children.” See 42 U.S.C. §6861.
2 Administrative rules, eligibility standards, the types of aid, and benefit levels are primarily decided at the state level.
Eligibility is automatically given to applicants receiving Temporary Assistance to Needy Families or Supplemental
Security Income. Also, if a state elects, program eligibility can extended to a household that meets Low Income Home
Energy Assistance Program eligibility criteria. 3 Most of the grantees are state-designated community action agencies, which administer multiple types of social
service grants for low-income persons. No more than 10% of grant funds allocated to states may be used for
administration according to 42 U.S.C. §6865.

The Weatherization Assistance Program Formula
Congressional Research Service 2
to the states, which involve a base allocation and a formula allocation. The report concludes with
a discussion of issues for Congress and identifies some related legislation introduced in the 117th Congress.
Statutory Authority for Allocation
Under current law, DOE allocates weatherization assistance funds to states and territories, taking
into account several factors. Section 414 of ECPA (42 U.S.C. 6864(a)) mandates that the funding
allocation be based on “the relative need for weatherization assistance among low-income persons.” Other factors specified in Section 414 include:
“the number of dwelling units to be weatherized”;
“the climatic conditions in the state [or territory] respecting energy conservation,
which may include consideration of annual degree days”;
“the type of weatherization work to be done in various settings”; and
“such other factors as the Secretary [of DOE] may determine necessary, such as
the cost of heating and cooling, in order to carry out the purpose and provisions
of this part.”
DOE is required to annually update the data used in the allocation of funds.4
WAP’s Program Allocation Funds for WAP are directed to several activities. DOE reserves some funds for national training
and technical assistance (T&TA) activities that benefit all states and territories. DOE allocates funding for T&TA activities at both the state and local levels. The total funding for national, state, and local T&TA is limited to 10% of an annual appropriation.5
The remaining funds comprise the total allocation to state programs. The program allocation consists of two parts: the base allocation and the formula allocation. The base allocation for each
state is fixed, but the amount differs for each state. The fixed base was intended to prevent large swings from previous allocations which could disrupt a state’s program operations.
A state or territory’s program allocation for a given year is determined using one of two methods
and is dependent upon WAP’s annual appropriation by Congress.6 If the total program allocation
is at or above $209,724,761 (referred to as the threshold amount),7 DOE determines program
allocations for states and territories according to a base allocation and a formula allocation, which is expressed mathematically as:
Program Allocation = Base Allocation + Formula Allocation
4 See 42 U.S.C. 6864(c).
5 The American Recovery and Reinvestment Act of 2009 (P.L. 111-5) allowed the T&TA share to increase temporarily
to 20%. 6 These methods are described in an interim rule that was published and later finalized in the Federal Register in 1995.
For interim rule, see Department of Energy, “Weatherization Assistance Program for Low-Income Persons,” 60
Federal Register 29469-29481, June 5, 1995. For final rule, see Department o f Energy, “Weatherization Assistance
Program for Low-Income Persons,” 60 Federal Register 64314-64315, December 15, 1995.
7 See 10 C.F.R. §440.10. The threshold amount, $209,724,761, is based upon the appropriation of $226,800,000 for the
WAP in FY1995 under P.L. 103-332. After reserving funds for DOE and state and territory T&TA, total program
allocations were $209,724,761 for FY1995. The threshold amount is not adjusted for inflation.
The Weatherization Assistance Program Formula
Congressional Research Service 3
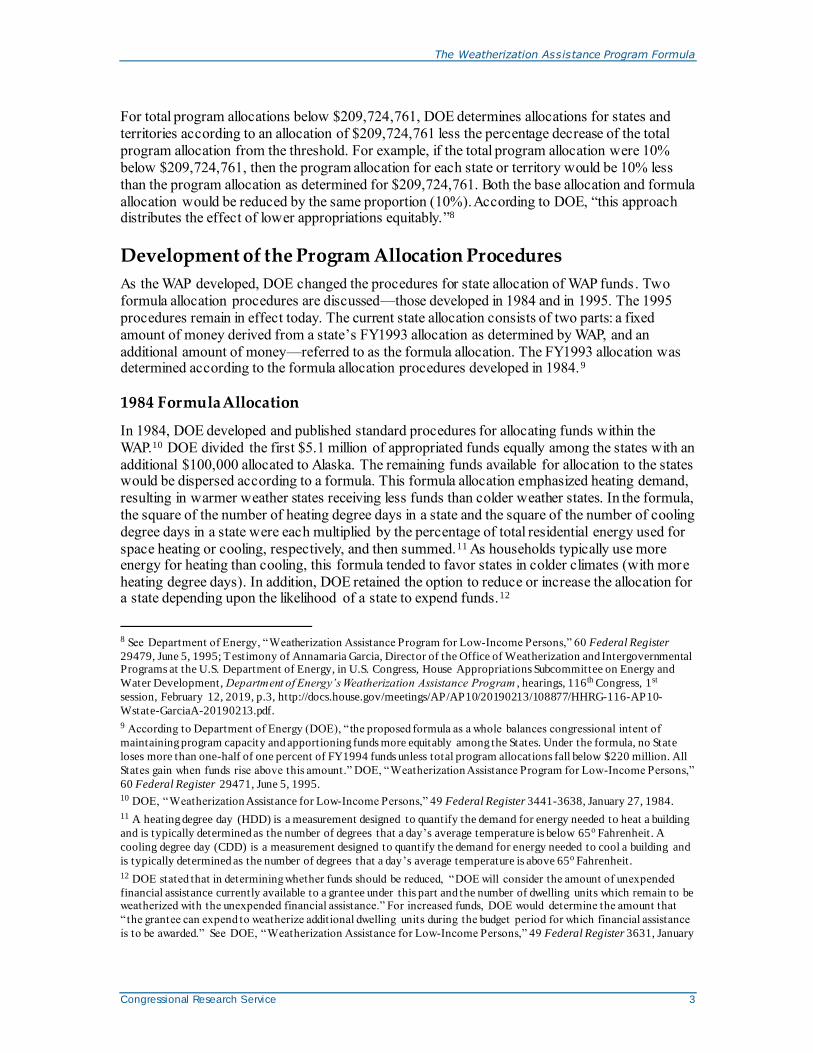
For total program allocations below $209,724,761, DOE determines allocations for states and
territories according to an allocation of $209,724,761 less the percentage decrease of the total
program allocation from the threshold. For example, if the total program allocation were 10%
below $209,724,761, then the program allocation for each state or territory would be 10% less
than the program allocation as determined for $209,724,761. Both the base allocation and formula
allocation would be reduced by the same proportion (10%). According to DOE, “this approach distributes the effect of lower appropriations equitably.”8
Development of the Program Allocation Procedures
As the WAP developed, DOE changed the procedures for state allocation of WAP funds. Two
formula allocation procedures are discussed—those developed in 1984 and in 1995. The 1995
procedures remain in effect today. The current state allocation consists of two parts: a fixed
amount of money derived from a state’s FY1993 allocation as determined by WAP, and an
additional amount of money—referred to as the formula allocation. The FY1993 allocation was determined according to the formula allocation procedures developed in 1984.9
1984 Formula Allocation
In 1984, DOE developed and published standard procedures for allocating funds within the
WAP.10 DOE divided the first $5.1 million of appropriated funds equally among the states with an
additional $100,000 allocated to Alaska. The remaining funds available for allocation to the states would be dispersed according to a formula. This formula allocation emphasized heating demand,
resulting in warmer weather states receiving less funds than colder weather states. In the formula,
the square of the number of heating degree days in a state and the square of the number of cooling
degree days in a state were each multiplied by the percentage of total residential energy used for
space heating or cooling, respectively, and then summed.11 As households typically use more energy for heating than cooling, this formula tended to favor states in colder climates (with more
heating degree days). In addition, DOE retained the option to reduce or increase the allocation for a state depending upon the likelihood of a state to expend funds.12
8 See Department of Energy, “Weatherization Assistance Program for Low-Income Persons,” 60 Federal Register
29479, June 5, 1995; Testimony of Annamaria Garcia, Director of the Office of Weatherization and Intergovernmental Programs at the U.S. Department of Energy, in U.S. Congress, House Appropriations Subcommittee on Energy and
Water Development, Department of Energy’s Weatherization Assistance Program , hearings, 116 th Congress, 1st
session, February 12, 2019, p.3, http://docs.house.gov/meetings/AP/AP10/20190213/108877/HHRG-116-AP10-
Wstate-GarciaA-20190213.pdf.
9 According to Department of Energy (DOE), “ the proposed formula as a whole balances congressional intent of
maintaining program capacity and apportioning funds more equitably among the States. Under the formula, no State
loses more than one-half of one percent of FY1994 funds unless total program allocations fall below $220 million. All
States gain when funds rise above this amount.” DOE, “Weatherization Assistance Program for Low-Income Persons,”
60 Federal Register 29471, June 5, 1995. 10 DOE, “Weatherization Assistance for Low-Income Persons,” 49 Federal Register 3441-3638, January 27, 1984.
11 A heating degree day (HDD) is a measurement designed to quantify the demand for energy needed to heat a building
and is typically determined as the number of degrees that a day’s average temperature is below 65o Fahrenheit. A
cooling degree day (CDD) is a measurement designed to quantify the demand for energy needed to cool a building and
is typically determined as the number of degrees that a day’s average temperature is above 65o Fahrenheit.
12 DOE stated that in determining whether funds should be reduced, “DOE will consider the amount of unexpended
financial assistance currently available to a grantee under this part and the number of dwelling units which remain to be weatherized with the unexpended financial assistance.” For increased funds, DOE would determine the amount that
“ the grantee can expend to weatherize additional dwelling units during the budget period for which financial assistance
is to be awarded.” See DOE, “Weatherization Assistance for Low-Income Persons,” 49 Federal Register 3631, January

The Weatherization Assistance Program Formula
Congressional Research Service 4
1995 Formula Allocation
The State Energy Efficiency Program Improvement Act of 1990 (P.L. 101-440) directed DOE to
review the formula allocation. Some were concerned that the formula favored northern states over
southern and western states. According to the Senate committee report for S. 247 (S.Rept. 101-235), enacted as P.L. 101-440:13
The Committee intends that there be a more equitable distribution of Federal financial
assistance among the States than presently exists. The current formula’s squaring of heating and cooling degree days does not appear to provide for an equitable national distribution of available federal funds among low-income households. By requiring a repromulgation
of the formula, the Committee intends to achieve a more equitable distribution of such WAP funds based on the nationwide low-income population.
In this regard, the Secretary shall determine whether, in fact, the current formula’s squaring of heating and cooling degree days unfairly favors certain States, and, if so, shall take
immediate steps to change the allocation formula to reflect a more equitable national distribution of funds among low-income households. In this regard, the Committee intends that the Secretary, in consultation with the State Advisory Board established under the Act,
develop a new formula and criteria for determining the most equitable methods of allocating weatherization funds based on low income population, number of heating and
cooling days, the relative costs of heating and cooling, and the annual costs incurred by low-income households for heating and cooling.14
DOE undertook a rulemaking, and published the final rule in 1995.15 This formula allocation remains in effect.
FY2021 Allocation
DOE determines the annual funding allocation or “total program allocation” for weatherization
assistance for each state and territory from “the annual appropriation [by Congress] less funds
reserved for training and technical assistance.”16 For fiscal year (FY) 2021, weatherization
received $315.0 million in total appropriations, of which $310.0 million went to WAP and $5.0
million for T&TA activities at DOE headquarters.17 Of the total appropriations, DOE was directed to make $1 million available for grant recipients that have previously worked through the
weatherization innovation pilot program (WIPP) “to implement and demonstrate programs to
treat harmful substances, including vermiculite, at the state and regional level.”18 Within available
funds, DOE reserved $18.6 million to be made available via the WIPP for innovation and $6.2
27, 1984.
13 U.S. Congress, Senate Committee on Energy and Natural Resources, Subcommittee on Energy Regulation and
Conservation, State Energy Conservation Programs Improvement Act of 1989, hearing on S. 247, 101st Cong., 1st sess.,
May 2, 1989, pp. 156-158. 14 U.S. Congress, Senate Committee on Energy and Natural Resources, State Energy Efficiency Improvement Act of
1989, report to accompany S. 247, 101st Cong., 1st sess., January 10, 1988, S.Rept. 101-235, p. 19.
15 For the final rule, see Department of Energy, “Weatherization Assistance Program for Low-Income Persons,” 60
Federal Register 64314-64315, December 15, 1995. For the interim rule, which describes the formula allocation, see
Department of Energy, “Weatherization Assistance Program for Low-Income Persons,” 60 Federal Register 29469-
29481, June 5, 1995. 16 See definition for “ total program allocation” under 10 C.F.R. §440.3.
17 See Joint Explanatory Statement, Division D, Consolidated Appropriations Act, 2021 ( P.L. 116-260),
https://docs.house.gov/billsthisweek/20201221/BILLS-116RCP68-JES-DIVISION-D.pdf.
18 Ibid., p. 78.

The Weatherization Assistance Program Formula
Congressional Research Service 5
million to make funding available for Sustainable Energy Resources for Consumers (SERC)
Grants and allocated an additional $0.8 million for cross-cutting activities.19 Altogether, $283.4
million was available to states and territories for FY2021, with $233.8 million available for the
total program allocation and nearly $49.6 million for T&TA activities.20 For FY2021, the total program allocation was above the threshold.
Appendix A provides annual allocation information for states, territories, and tribes for FY2001
through FY2021; the allocations vary from year to year and reflect changes in funding levels for the WAP and DOE allocations for program funds and T&TA funds.
The Base Allocation The base allocation is a fixed amount of annual funding that each state and territory receives
from appropriated sums for weatherization assistance from DOE.21 The fixed amount differs for
each state and territory and was based upon the allocations for FY1993 as determined by DOE
according to a previous formula.22 Base allocations, which total $171,858,000, are listed in Table 1 of 10 C.F.R. §440.10(b)(1). This table is included in Appendix B for reference.
The Formula Allocation State and territory formula allocations are determined from the difference between the total
program allocation and the total base allocation of $171,858,000. This difference can be
considered to be the total available funds for formula allocation. For example, in FY2020, the
total available funds for formula allocation was $77,374,500 (the difference between the FY2020 total program allocation—$249,232,500—and the base allocation—$171,858,000). The formula
allocation for each state or territory is determined by multiplying the total available funds for
formula allocation by a state or territory’s formula share. The state formula allocation is expressed mathematically as:
State Formula Allocation = Total Funds for Formula Allocation × State Formula Share
The formula share is the product of three factors—population, climate, and residential energy expenditures—normalized by the national total of the product of each state’s three factors.
19 Section 411 of the Energy Independence and Security Act of 2007 (EISA 2007, P.L. 110-140) stipulates that WAP
funds may be used to award Sustainable Energy Resources for Consumers (SERC) grants only when WAP funding for
a given fiscal year is at or above $275 million. EISA 2007 also directs DOE to limit SERC grant funding to 2% of
WAP funds; therefore for FY2021, SERC funds are limited to no more than $6.2 million (or 2% of $310 mil lion). In
addition, DOE also allocated $825,000 in FY2021 WAP funds for cross-cutting activities. DOE, “Program Year 2021
Grantee Allocations,” Weatherization Program Notice, January 21, 2021, https://www.energy.gov/eere/wap/downloads/
weatherization-program-notice-21-2-program-year-2021-grantee-allocations.
20 DOE reserved nearly $52.9 million for T&TA activities for states and territories, which is less than the 20% that
DOE may reserve for grantees per 42 U.S.C. §6866. See DOE, “Program Year 2020 Grantee Allocations,” Weatherization Program Notice, February 10, 2020, https://www.energy.gov/eere/wipo/downloads/wpn-20-2-program-
year-2020-grantee-allocations.
21 See 10 C.F.R. §440.10(b)(1).
22 In 1995, DOE issued an interim rule (which was later finalized) that established an updated allocation formula “to
provide warmer-weather States a greater share of the funding, while protecting the Program capacity developed over
the years by colder-weather States.” See Department of Energy, “Weatherization Assistance Program for Low-Income
Persons,” 60 Federal Register 29470, June 5, 1995.

The Weatherization Assistance Program Formula
Congressional Research Service 6
Factor 1: Population
The population factor (Factor 1) is the percentage of the U.S. low-income households in each state or territory. The formula gives equal weight to owners and renters. The American Recovery
and Reinvestment Act of 2009 (ARRA, P.L. 111-5 §407a) revised the program guidelines to raise the low-income eligibility ceiling from 150% to 200% of the poverty level.23
The U.S. Energy Information Administration’s (EIA’s) 2009 Residential Energy Consumption
Survey (RECS) estimated that there were 113.6 million households in the United States.24 Of the
113.6 million households, approximately 39.5 million households (or nearly 35%) were federally
eligible for weatherization assistance. The distribution of low-income households in the United
States in 2009 was “in roughly the same proportions as the non-low-income population, with approximately 16% in the Northeast, 23% in the Midwest, 41% in the South, and 20% in the
West.”25 EIA’s 2015 RECS—with the most recent survey data—estimated that the total number
of households has increased in the United States to 118.2 million.26 Although CRS did not
identify a source for the number of households that were eligible for weatherization assistance in
2015, EIA’s 2015 RECS did estimate that 37.0 million of the 118.2 million households in the United States experienced energy insecurity.27
Factor 2: Climate
The climate factor (Factor 2) accounts for the variation in climatic conditions that can affect
household energy consumption (i.e., energy demand for heating and cooling). The factor accounts
for the energy needed for heating and cooling in a proportional manner. The factor relies upon 30-
year averages of heating degree days and cooling degree days as reported by the National
Oceanic and Atmospheric Administration (NOAA). According to NOAA, the 30-year averages are updated once every 10 years.28 In May 2021, NOAA published 30-year climate normals for
the period from 1991 through 2020.29 A heating degree day (HDD) is a measurement designed to
quantify the demand for energy needed to heat a building and is typically determined as the
number of degrees that a day’s average temperature is below 65o Fahrenheit. A cooling degree
23 At the time of the 1995 rulemaking for the formula allocation, the low-income eligibility ceiling was 125% of the
poverty level. T he number of low-income households used in the rulemaking was obtained from a special tabulation of
Census data completed by the Bureau of the Census for the Department of Energy .
24 Of the 113.6 million households, EIA reported that 16.9 million households were below the poverty line in 2009.
EIA, “Table HC9.2 Household Demographics of U.S. Homes, by Owner/Renter Status, 2009 ,” 2009 RECS Survey
Data, https://www.eia.gov/consumption/residential/data/2009/#house. 25 Eisenberg, Joel, Weatherization Assistance Program Technical Memorandum Background Data and Statistics On
Low-Income Energy Use and Burdens, ORNL/TM-2014/133, Oak Ridge, Tennessee, April 2014, p. 3.
26 EIA updated the RECS in 2017 (with data from 2015); see https://www.eia.gov/consumption/residential/data/2015/
hc/php/hc9.5.php.
27 Household energy insecurity refers to those households that experienced at least one of the following issues collected
in the survey: (1) reducing or forgoing food or medicine to pay energy costs, (2) leaving the home at an unhealthy
temperature, (3) receiving a disconnect or delivery stop notice, (4) unable to use heating equipment, or (5) unable to use cooling equipment. EIA, “Table HC11.1 Household Energy Insecurity, 2015,” 2015 RECS Survey Data,
https://www.eia.gov/consumption/residential/data/2015/hc/php/hc11.1.php.
28 The 1991–2020 U.S. Climate Normals dataset is the latest release of Climate Normals by the National Centers for
Environmental Information (NCEI); see https://www.ncei.noaa.gov/access/us-climate-normals/.
29 NOAA National Centers for Environmental Information, “NOAA Delivers New U.S. Climate Normals: Decadal
update from NCEI gives forecasters and public latest averages from 1991-2020,” press release, May 5, 2021,
https://www.ncei.noaa.gov/news/noaa-delivers-new-us-climate-normals.

The Weatherization Assistance Program Formula
Congressional Research Service 7
day (CDD) is a measurement designed to quantify the demand for energy needed to cool a
building and is typically determined as the number of degrees that a day’s average temperature is
above 65o Fahrenheit. Factor 2 is the sum of the HDD ratio (a state HDD divided by the national
median HDD) and the CDD ratio (a state CDD divided by the national median CDD multiplied
by 0.1) for each state or territory, treating the energy needed for heating and cooling in a proportional manner. Mathematically, Factor 2 is expressed as:
Factor 2=State HDD
National Median HDD+ (
State CDD
National Median CDD× 0.1)
Including 0.1 in the CDD ratio—according to the 1995 interim rule—accounted for the difference
in national energy consumption data between heating and cooling. According to 1990 data from EIA, national heating consumption equaled 4.79 quadrillion Btu while air conditioning
consumption equaled 0.49 quadrillion Btu.30 At the time, heating consumed approximately 10
times more energy than air conditioning; however, according to the 2015 RECS, EIA estimates
national heating energy consumption has declined to 3.95 quadrillion Btu while national air
conditioning energy consumption has increased to 0.73 quadrillion Btu.31 Using the data within the 2015 RECS, heating consumes approximately 5.4 times more energy than air conditioning.
Factor 3: Residential Energy Expenditure
The residential energy expenditure factor (Factor 3) is an estimate of the residential energy
expenditure (REE) for low-income households for a state or territory. Energy expenditures for
low-income households are not available at the state level. Further, EIA provides data for state
residential energy consumption including expenditure data, but EIA does not distinguish between
low-income households and other households. Therefore the factor is determined based on publicly available data from the U.S. Census Bureau. At the Census division level, residential
energy expenditure data is available for the overall population and for low-income households
(referred to as “Division REE”).32 According to the 1995 interim rule, “the underlying assumption
in the calculation of State residential energy expenditures per low-income household is that the
relationship between a State’s residential energy expenditures per household and its respective divisional residential energy expenditures per household is the same for its low-income
population as it is for its general population.”33 For example, if an average household in a state
spends 50% more on residential energy than the average household in its Census division, then it
is assumed that low-income households in the same state would also spend 50% more on
residential energy than the average low-income household in its Census division. To determine Factor 3, the state or territory’s low-income household energy expenditures are normalized
according to a national median low-income household energy expenditure. Mathematically, Factor 3 is expressed as:
30 Data from Table 28 of EIA’s Household Energy Consumption and Expenditures 1990. 31 Data from Table CE3.1, “Annual Household Site End-Use Consumption in the U.S.—Totals and Averages, 2015,”
RECS 2015. https://www.eia.gov/consumption/residential/data/2015/index.php?view=
consumption#by%20end%20uses.
32 The Census Bureau established nine divisions, which are geographic groupings of states for the presentation of
census data. The current divisions are New England, Middle Atlantic, East North Central, West North Central, South
Atlantic, East South Central, West South Central, Mountain, and Pacific. See https://factfinder.census.gov/help/en/
division.htm. 33 See Department of Energy, “Weatherization Assistance Program for Low-Income Persons,” 60 Federal Register
29477, June 5, 1995.

The Weatherization Assistance Program Formula
Congressional Research Service 8
Factor 3 =
State REE State Households⁄Division REE Division Households⁄
× Division Low-Income REE
National Median REE
Potential Issues for Congress Under the current procedure, the method of funding allocation is dependent upon whether WAP’s
annual appropriation is at or exceeds a monetary threshold, as discussed. An issue for Congress is
whether to maintain this approach and continue to direct the allocation procedure through annual appropriations. Alternatively, Congress could amend the authorizing language to address concerns
regarding the current allocation procedure. They center on whether adjustments are needed to
account for changes in heating and cooling or to include other factors in the formula. Another issue is sufficiency of appropriations for the program.
Congress could direct DOE to examine the current allocation formula and determine whether
revisions to the current approach should be undertaken. Congress previously directed DOE to
revise the weatherization allocation formula “in order to allow for a more equitable
apportionment of funds while not harming the existing capacity of any State to weatherize homes.”34 The DOE examination resulted in the 1995 rulemaking and current allocation formula.
Congress may consider whether adjustments to the formula are merited to account for changes in heating and cooling. As discussed in “Factor 2: Climate,” the energy consumption ratio of heating
to air conditioning has declined from approximately 10 to 5.4. Factor 2 also relies upon 30-year
averages of HDDs and CDDs as reported and updated by NOAA on a 10-year basis. As the U.S.
average annual temperature has increased, heating degree days have decreased and cooling
degree days have increased overall.35 The exception to this are states within the Southeast
(excluding Florida), which have seen more HDDs and fewer CDDs.36 Long-term averages may not reflect present or future conditions or sufficiently capture the potential energy expenditure
burden associated with heating and cooling during extreme temperatures. According to the Fourth
National Climate Assessment (NCA4), extreme temperatures are projected to increase even more
than average temperatures in the contiguous United States.37 The EIA projects that delivered
energy for air conditioning of buildings will increase in the building sector through 2050 while energy for space heating will decline during the same period.38 In addition, the HDD or CDD
34 In H.Rept. 103-740, the Conference Report on the Department of Interior and Related Agencies Appropriations Act,
1995, P.L. 103-332, the conference committee stated that sufficient funds would be made available to permit DOE to
revise the weatherization allocation formula “in order to allow for a more equitable apportionment of funds while not
harming the existing capacity of any State to weatherize homes.”
35 U.S. Environmental Protection Agency (EPA), Climate Change Indicators in the United States, Fourth Edition,
2016, p. 64, https://www.epa.gov/climate-indicators/downloads-indicators-report .
36 EPA, “Climate Change Indicators: Heating and Cooling Degree Days,” https://www.epa.gov/climate-indicators/
climate-change-indicators-heating-and-cooling-degree-days. 37 “Extreme temperatures in the contiguous United States are projected to increase even more than average
temperatures. The temperatures of extremely cold days and extremely warm days are both expected to increase. Cold
waves are projected to become less intense while heat waves will become more intense. The number of days below
freezing is projected to decline while the number above 90°F will rise.” See p. 185 of Vose, R.S., D.R. Easterling, K.E.
Kunkel, A.N. LeGrande, and M.F. Wehner, “2017: Temperature Changes in the United States,” in Climate Science
Special Report: Fourth National Climate Assessment, Volume I [Wuebbles, D.J., D.W. Fahey, K.A. Hibbard, D.J.
Dokken, B.C. Stewart, and T .K. Maycock (eds.)]. U.S. Global Change Research Program, Washington, DC, USA, pp.
185-206. 38 EIA’s model uses population-weighted degree days and reflects projected population shifts from colder to warmer
parts of the United States; EIA, “ EIA Projects Air-Conditioning Energy Use to Grow Faster Than Any Other Use in

The Weatherization Assistance Program Formula
Congressional Research Service 9
determined for a state may not capture the actual HDD and CDD experienced in urban areas .
Studies have shown evidence of heat islands in urban areas and that persons of color and low-income households within some urban areas experience additional elevated heat exposure.39
In addition to altering the existing factors within the WAP’s formula allocation, Congress may
include other factors. In the 117th Congress, several bills would make changes to the WAP. Some
bills would increase authorization of appropriations for the program.40 Some proposals would
increase per dwelling funding limits.41 One proposal would establish a timeline for DOE to
disperse allocated funds to states.42 Another bill would direct a percentage of fees received into the Treasury to be appropriated to the weatherization assistance program and apportioned to environmental justice communities.43
Changing the amount of appropriations or the formula allocation may have different outcomes. Increasing appropriations to the WAP under the existing program allocation would provide
additional funding to all states and territories. Changing the formula allocation to reflect changes
in energy consumption due to heating and cooling and changes in HDDs and CDDs—holding all
other factors constant—may increase formula allocations to states and territories in warmer
climates (or those areas where a greater percentage of a household’s energy consumption is due to air conditioning). Expanding the factors that DOE should consider—such as the health and safety
of occupants—may introduce other changes to formula allocations and the subsequent program allocations to states and territories.
Buildings,” https://www.eia.gov/todayinenergy/detail.php?id=43155.
39 The term “heat island” describes urban areas that have hotter surface and air temperatures than nearby rural areas.
The urban heat island can affect communities by increasing energy demand and energy costs for cooling and air
conditioning, air pollution and greenhouse gas emissions, heat -related illness and mortality, and water pollution. See
U.S. Environmental Protection Agency, 2008, Reducing Urban Heat Islands: Compendium of Strategies. Draft.
https://www.epa.gov/heat-islands/heat-island-compendium; T . Chakraborty, A. Hsu, D. Manya, G. Sheriff, 2019, “Disproportionately Higher Exposure to Urban Heat in Lower-Income Neighborhoods: A Multi-City Perspective,”
Environmental Research Letters, vol. 14 (10); A. Hsu , G. Sheriff, and T . Chakraborty, et al., “Disproportionate
Exposure to Urban Heat Island Intensity Across Major US Cities,” Nature Communications, vol. 12 (2021), p. 2721.
40 These include S. 2377, Energy Infrastructure Act; H.R. 4309, Clean Energy Innovation and Deployment Act of 2021;
and H.R. 3684, Infrastructure Investment and Jobs Act.
41 Such proposals include H.R. 4309, Clean Energy Innovation and Deployment Act of 2021, and H.R. 5376, Build
Back Better Act. 42 H.R. 1512, Climate Leadership and Environmental Action for our Nation’s Future Act.
43 S. 2085, Save Our Future Act. According to the bill, an environmental justice community is “(A) a community of
color; (B) a low-income community; and (C) a Tribal or indigenous community. This bill would apportion 24% of
certain fees received into the Treasury under subchapter E of chapter 38 of the Internal Revenue Code of 1986 and section 102 of the bill for weatherization assistance.”

CRS-10
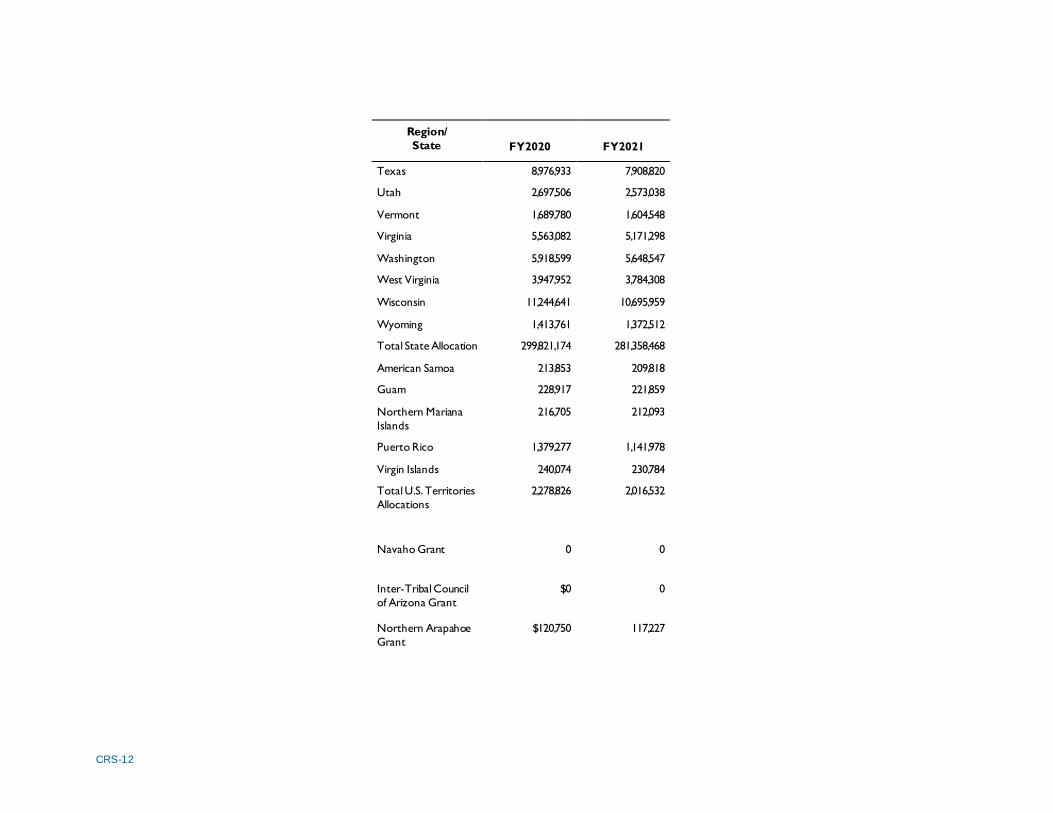
Appendix A. State Total Allocations, FY2001-FY2021
Table A-1. Weatherization Assistance Program (WAP): State Allocations: FY2020-FY2021
In current dollars
Region/
State FY2020 FY2021
Alabama $3,443,053 $3,155,946
Alaska 2,283,222 2,177,695
Arizona 2,425,326 2,132,014
Arkansas 2,729,832 2,532,999
California 9,107,043 8,349,546
Colorado 6,940,358 6,657,253
Connecticut 3,694,901 3,417,529
Delaware 844,216 783,257
District of Columbia 779,056 749,828
Florida 3,875,985 3,292,566
Georgia 4,842,022 4,324,752
Hawaii 302,402 280,638
Idaho 2,539,427 2,428,866
Illinois 17,420,195 16,511,511
Indiana 8,886,940 8,353,685
Iowa 6,147,974 5,893,595
Kansas 3,291,592 3,104,047
Kentucky 5,884,213 5,582,705
Louisiana 2,082,825 1,894,485

CRS-11
Region/
State FY2020 FY2021
Maine 3,929,166 3,750,112
Maryland 3,767,334 3,493,675
Massachusetts 8,509,094 8,040,682
Michigan 20,160,855 19,093,962
Minnesota 12,143,741 11,722,051
Mississippi 2,202,874 2,034,117
Missouri 7,842,278 7,388,481
Montana 3,078,176 2,980,791
Nebraska 3,159,918 3,019,814
Nevada 1,509,219 1,357,572
New Hampshire 2,007,085 1,901,236
New Jersey 7,178,533 6,656,307
New Mexico 2,508,160 2,380,135
New York 26,945,581 25,229,032
North Carolina 6,186,961 5,642,274
North Dakota 2,971,658 2,891,278
Ohio 17,866,747 16,856,226
Oklahoma 3,525,126 3,271,910
Oregon 3,707,845 3,531,636
Pennsylvania 19,216,844 18,125,877
Rhode Island 1,539,247 1,451,556
South Carolina 2,700,461 2,440,739
South Dakota 2,316,227 2,236,681
Tennessee 5,875,208 5,480,377
CRS-12
Region/
State FY2020 FY2021
Texas 8,976,933 7,908,820
Utah 2,697,506 2,573,038
Vermont 1,689,780 1,604,548
Virginia 5,563,082 5,171,298
Washington 5,918,599 5,648,547
West Virginia 3,947,952 3,784,308
Wisconsin 11,244,641 10,695,959
Wyoming 1,413,761 1,372,512
Total State Allocation 299,821,174 281,358,468
American Samoa 213,853 209,818
Guam 228,917 221,859
Northern Mariana
Islands
216,705 212,093
Puerto Rico 1,379,277 1,141,978
Virgin Islands 240,074 230,784
Total U.S. Territories
Allocations
2,278,826 2,016,532
Navaho Grant 0 0
Inter-Tribal Council
of Arizona Grant
$0
0
Northern Arapahoe
Grant
$120,750 117,227
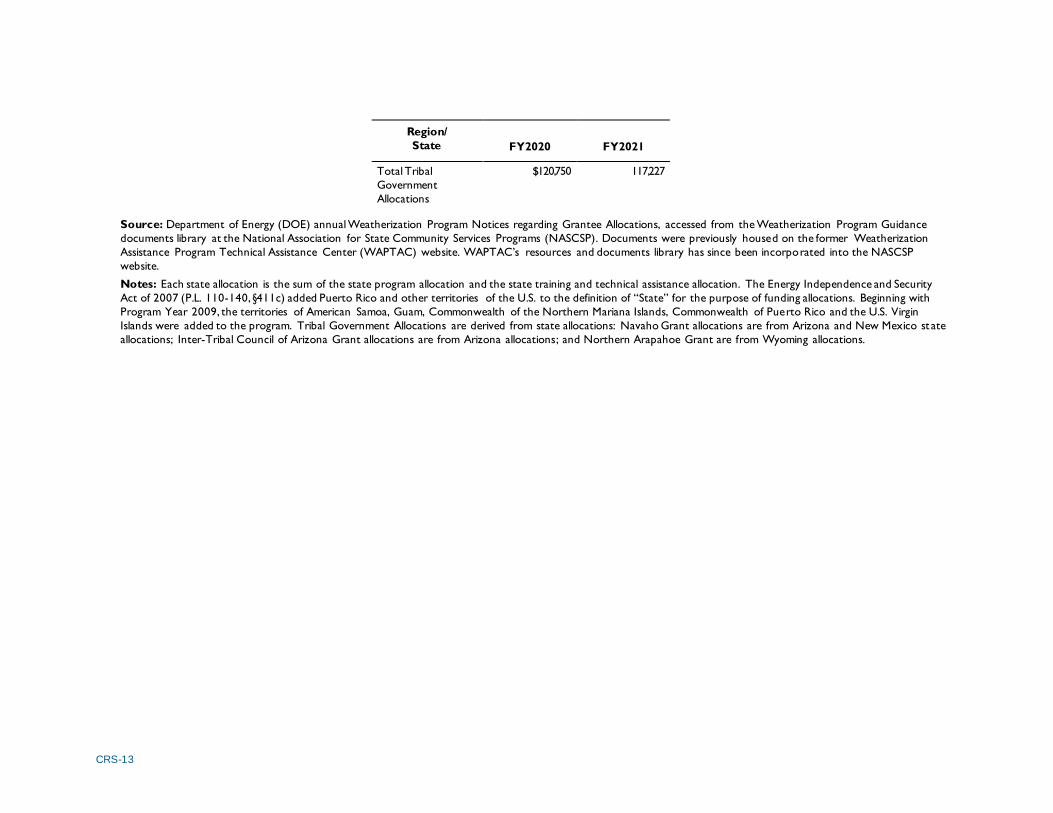
CRS-13
Region/
State FY2020 FY2021
Total Tribal
Government
Allocations
$120,750 117,227
Source: Department of Energy (DOE) annual Weatherization Program Notices regarding Grantee Allocations, accessed from the Weatherization Program Guidance
documents library at the National Association for State Community Services Programs (NASCSP). Documents were previously housed on the former Weatherization
Assistance Program Technical Assistance Center (WAPTAC) website. WAPTAC’s resources and documents library has since been incorporated into the NASCSP
website.
Notes: Each state allocation is the sum of the state program allocation and the state training and technical assistance allocation. The Energy Independence and Security
Act of 2007 (P.L. 110-140, §411c) added Puerto Rico and other territories of the U.S. to the definition of “State” for the purpose of funding allocations. Beginning with
Program Year 2009, the territories of American Samoa, Guam, Commonwealth of the Northern Mariana Islands, Commonwealth of Puerto Rico and the U.S. Virgin
Islands were added to the program. Tribal Government Allocations are derived from state allocations: Navaho Grant allocations are from Arizona and New Mexico st ate
allocations; Inter-Tribal Council of Arizona Grant allocations are from Arizona allocations; and Northern Arapahoe Grant are from Wyoming allocations.

CRS-14
Table A-2. Table A-2. Weatherization Assistance Program (WAP): State Allocations: FY2010-FY2019
In current dollars
Region/
State FY2010 FY2011 FY2012 FY2013 FY2014 FY2015 FY2016 FY2017 FY2018 FY2019
Alabama $1,882,352 $1,822,292 $0 $1,875,979 $337,245 $2,047,091 $2,277,174 $2,414,515 $2,669,966 $2,849,629
Alaska 1,329,537 1,287,597 0 1,322,690 237,780 1,463,587 1,630,495 1,727,958 1,909,237 2,053,765
Arizona 952,279 855,295 0 487,020 157,651 997,882 1,109,782 1,408,970 1,555,787 1,831,626
Arkansas 1,622,103 1,570,573 0 1,615,506 290,420 1,668,947 1,868,107 1,980,223 2,188,755 2,318,929
California 4,917,928 4,758,371 1,649,091 1,523,628 883,418 5,244,959 5,857,131 6,215,232 6,881,295 7,540,160
Colorado 4,307,729 4,168,171 0 4,303,435 773,629 4,590,704 5,134,641 5,448,189 6,031,384 6,314,441
Connecticut 1,972,276 1,909,269 1,319,737 500,092 353,424 2,201,899 2,450,480 2,598,507 2,873,837 3,117,380
Delaware 460,428 446,976 0 452,837 81,406 517,552 572,294 604,501 664,407 717,370
District of
Columbia 519,060 503,686 458,248 511,519 91,956 538,874 597,118 630,856 693,610 714,233
Florida 1,484,081 1,437,075 0 709,416 265,586 1,698,578 1,886,281 1,999,517 2,210,133 2,705,406
Georgia 2,282,504 2,209,329 1,018,734 2,276,474 409,242 2,533,810 2,829,878 3,001,301 3,320,146 3,788,068
Hawaii 169,266 165,356 54,373 76,406 29,019 195,448 206,123 215,750 233,658 257,473
Idaho 1,558,041 1,508,611 1,388,688 1,551,391 278,893 1,673,179 1,862,705 1,974,487 2,182,400 2,297,304
Illinois 10,844,851 10,491,023 4,852,662 10,846,159 1,949,814 11,175,446 12,503,393 13,271,340 14,699,712 15,465,764
Indiana 5,137,920 4,971,150 0 4,440,679 923,000 5,551,898 6,193,959 6,572,830 7,277,526 7,755,598
Iowa 3,918,674 3,791,869 0 3,797,481 703,628 4,105,176 4,591,815 4,871,889 5,392,824 5,586,637
Kansas 1,988,468 1,924,929 1,774,148 1,863,608 356,337 2,112,717 2,360,701 2,503,192 2,768,223 2,892,165
Kentucky 3,547,808 3,433,159 3,170,588 3,177,017 636,901 3,814,133 4,260,696 4,520,352 5,003,308 5,234,906
Louisiana 1,340,633 1,298,329 596,996 529,968 239,776 1,214,531 1,345,356 1,425,235 1,573,809 1,695,764
Maine 2,415,842 2,338,296 2,156,877 766,699 433,233 2,594,260 2,890,611 3,065,779 3,391,590 3,538,802
Maryland 2,083,502 2,016,848 0 403,370 373,437 2,259,316 2,524,106 2,676,673 2,960,448 3,196,150

CRS-15
Region/
State FY2010 FY2011 FY2012 FY2013 FY2014 FY2015 FY2016 FY2017 FY2018 FY2019
Massachusetts 5,137,610 4,970,851 4,594,307 5,064,575 922,944 5,426,786 6,058,804 6,429,341 7,118,536 7,507,308
Michigan 11,910,904 11,522,133 3,997,503 11,913,125 2,141,623 12,862,926 14,397,981 15,282,760 16,928,436 17,869,403
Minnesota 7,739,554 7,487,510 0 4,015,528 1,391,096 8,193,811 9,157,907 9,719,552 10,764,207 11,190,371
Mississippi 1,290,592 1,249,929 574,589 249,986 230,773 1,348,340 1,499,412 1,588,790 1,755,035 1,852,245
Missouri 4,703,704 4,551,167 0 3,440,907 844,874 4,977,015 5,564,897 5,904,977 6,537,523 6,876,381
Montana 1,987,207 1,923,710 886,510 676,220 356,110 2,101,326 2,346,361 2,487,968 2,751,354 2,855,298
Nebraska 1,964,240 1,901,497 657,170 380,299 351,978 2,098,732 2,342,735 2,484,118 2,747,089 2,853,612
Nevada 662,859 642,771 587,023 655,441 117,829 797,304 871,308 921,955 1,016,157 1,199,608
New
Hampshire
1,193,071 1,155,605 530,923 1,186,106 213,227 1,292,380 1,438,061 1,523,657 1,682,864 1,780,183
New Jersey 3,999,259 3,869,812 0 773,962 718,127 4,308,921 4,807,576 5,100,955 5,646,638 6,088,137
New Mexico 1,369,544 1,326,143 610,245 889,637 243,456 1,475,444 1,646,802 1,923,264 2,125,643 2,232,675
New York 15,786,616 15,270,806 14,130,828 15,792,155 2,838,955 16,761,187 18,794,102 19,949,970 22,099,866 23,321,618
North
Carolina
3,249,190 3,144,329 0 2,065,144 583,172 3,505,540 3,916,921 4,155,377 4,598,903 5,064,596
North Dakota 1,969,451 1,906,536 0 1,963,153 352,916 2,087,315 2,328,127 2,468,609 2,729,905 2,782,844
Ohio 10,762,015 10,410,903 0 10,763,252 1,934,910 11,336,518 12,670,127 13,448,355 14,895,852 15,710,535
Oklahoma 2,029,472 1,964,590 679,076 2,023,225 363,715 2,166,950 2,426,960 2,573,537 2,846,169 2,996,202
Oregon 2,222,843 2,151,623 1,488,030 2,216,762 398,507 2,422,447 2,696,844 2,860,063 3,163,650 3,325,518
Pennsylvania 11,519,998 11,144,041 3,866,228 2,228,808 2,071,290 12,320,702 13,754,306 14,599,392 16,171,240 16,889,762
Rhode Island 916,134 887,744 813,840 232,526 163,399 986,095 1,094,465 1,158,873 1,278,670 1,352,790
South Carolina 1,388,815 1,344,931 927,855 1,382,018 248,446 1,495,042 1,666,574 1,766,261 1,951,678 2,168,457
South Dakota 1,513,071 1,465,115 505,656 1,506,381 270,802 1,591,553 1,776,878 1,883,366 2,081,435 2,136,561
Tennessee 3,278,362 3,172,544 0 634,509 588,421 3,619,816 4,036,524 4,282,355 4,739,600 5,045,797
Texas 4,294,261 4,155,146 0 4,289,956 771,205 4,657,454 5,165,132 5,480,562 6,067,254 6,811,752

CRS-16
Region/
State FY2010 FY2011 FY2012 FY2013 FY2014 FY2015 FY2016 FY2017 FY2018 FY2019
Utah 1,638,680 1,586,608 730,451 415,578 293,403 1,763,864 1,970,108 2,088,513 2,308,745 2,426,710
Vermont 1,012,458 980,912 0 1,005,339 180,730 1,101,981 1,228,156 1,300,807 1,435,939 1,506,339
Virginia 3,148,212 3,046,661 0 3,142,923 565,003 3,363,309 3,761,099 3,989,946 4,415,600 4,743,147
Washington 3,570,881 3,455,476 3,191,250 2,109,133 641,052 3,885,453 4,325,258 4,588,895 5,079,256 5,329,638
West Virginia 2,525,991 2,444,834 1,127,759 2,520,169 453,051 2,668,468 2,977,505 3,158,033 3,493,809 3,587,126
Wisconsin 6,726,647 6,507,803 6,017,339 6,564,418 1,208,850 7,283,668 8,147,306 8,646,632 9,575,373 10,056,393
Wyoming 852,525 826,080 378,719 744,539 152,077 894,620 996,423 1,055,049 1,164,090 1,205,819
Total State
Allocation 175,099,448 169,376,014 64,735,443 133,877,148 31,417,736 186,994,954 208,817,505 221,949,228 245,652,571 260,638,395
American
Samoa
154,860 151,424 132,094 147,007 26,427 162,559 175,791 183,546 197,970 204,166
Guam 158,948 155,377 0 31,075 27,163 167,227 180,948 189,022 204,041 213,233
Northern
Mariana Islands
155,635 152,172 0 39,858 26,566 163,441 176,764 184,581 199,120 205,882
Puerto Rico 647,129 627,557 0 405,670 114,998 725,059 797,260 843,340 929,049 905,767
Virgin Islands 161,976 158,306 0 31,661 27,708 170,688 184,770 193,080 208,538 219,950
Total U.S.
Territories
Allocations
1,278,548 1,244,836 132,094 655,271 222,862 1,388,974 1,515,533 1,593,569 1,738,718 1,748,998
Navaho Grant 242,391 234,760 0 46,952 44,991 268,138 300,659 0 0 0
Inter-Tribal
Council of
Arizona Grant
0 67,245 61,729 48,013 12,395 78,448 87,250 0 0 0
Northern
Arapahoe
Grant
79,614 77,145 70,734 68,947 14,202 83,546 93,053 98,528 108,711 112,607

CRS-17
Region/
State FY2010 FY2011 FY2012 FY2013 FY2014 FY2015 FY2016 FY2017 FY2018 FY2019
Total Tribal
Government
Allocations
322,005 379,150 132,463 163,912 71,588 430,132 480,962 98,528 108,711 112,607
Source: Department of Energy (DOE) annual Weatherization Program Notices regarding Grantee Allocations, accessed from the Weatherization Program Guidance
documents library at the National Association for State Community Services Programs (NASCSP). Documents were previously housed on the former Weatherization
Assistance Program Technical Assistance Center (WAPTAC) website. WAPTAC’s resources and documents library has since been incorporated into the NASCSP
website.
Notes: Each state allocation is the sum of the state program allocation and the state training and technical assistance allocation. The Energy Independence and Security
Act of 2007 (P.L. 110-140, §411c) added Puerto Rico and other territories of the U.S. to the definition of “State” for the purpose of funding allocations. Beginning with
Program Year 2009, the territories of American Samoa, Guam, Commonwealth of the Northern Mariana Islands, Commonwealth of Puerto Rico and the U.S. Virgin
Islands were added to the program. Tribal Government Allocations are derived from state allocations: Navaho Grant allocations are from Arizona and New Mexico state
allocations; Inter-Tribal Council of Arizona Grant allocations are from Arizona allocations; and Northern Arapahoe Grant are from Wyoming allocations.

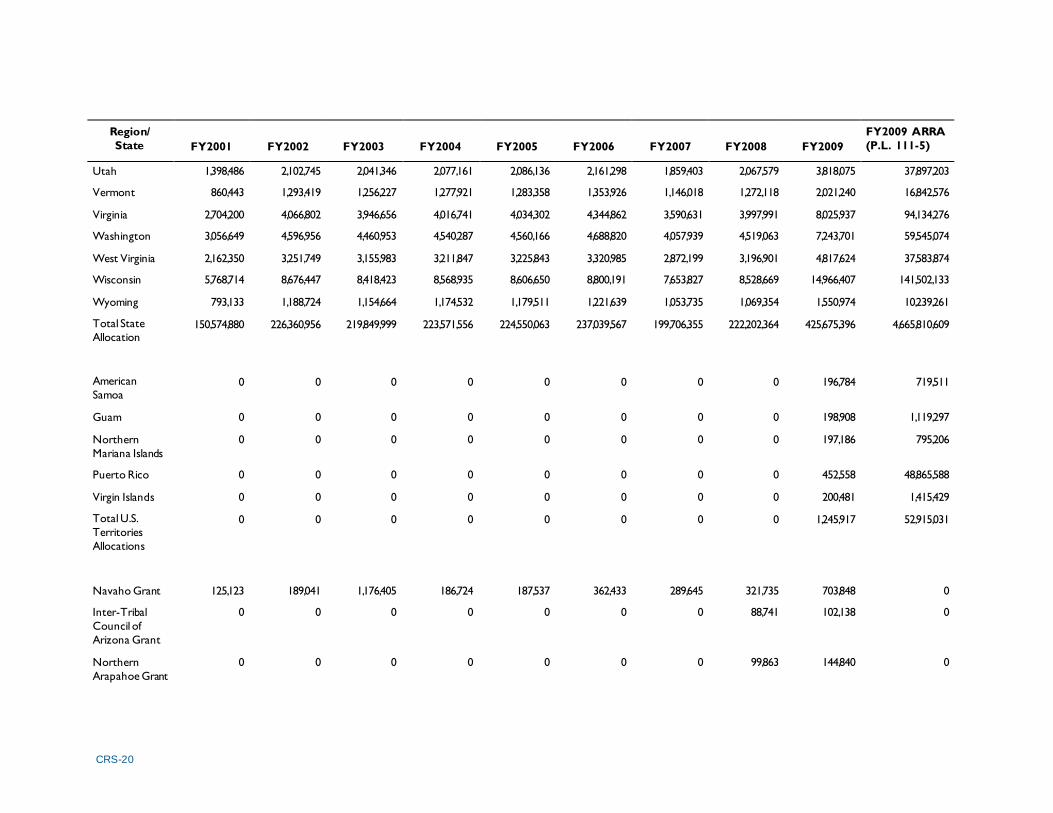
CRS-18
Table A-3. Table A-3. Weatherization Assistance Program (WAP): State Allocations: FY2001-FY2009 ARRA
In current dollars
Region/
State FY2001 FY2002 FY2003 FY2004 FY2005 FY2006 FY2007 FY2008 FY2009
FY2009 ARRA
(P.L. 111-5)
Alabama $1,620,906 $2,437,309 $2,365,903 $2,407,556 $2,417,993 $2,724,123 $2,154,306 $2,396,413 $5,458,962 $71,800,599
Alaska 1,148,143 1,700,925 1,651,545 1,680,350 1,687,568 1,734,314 1,505,217 1,672,643 2,553,917 18,142,580
Arizona 914,996 1,375,478 1,335,832 1,358,959 1,364,754 1,443,174 1,096,515 1,128,755 3,670,756 57,023,278
Arkansas 1,394,048 2,096,068 2,034,869 2,070,568 2,079,513 2,202,800 1,853,518 2,061,017 4,031,570 48,114,415
California 4,238,044 6,374,011 6,184,856 6,295,195 6,322,844 7,085,364 5,624,334 6,265,676 14,161,143 185,811,061
Colorado 3,689,256 5,548,524 5,384,059 5,479,996 5,504,036 5,678,125 4,896,704 5,454,329 9,122,025 79,531,213
Connecticut 1,687,796 2,537,924 2,463,509 2,506,917 2,517,795 2,759,107 2,242,994 2,495,304 5,315,348 64,310,502
Delaware 387,168 581,518 565,620 574,894 577,217 612,727 518,509 572,412 1,183,372 13,733,668
District of
Columbia 437,201 656,778 638,629 649,216 651,868 712,764 584,848 646,384 998,697 8,089,022
Florida 1,317,877 1,981,492 1,923,719 1,957,419 1,965,864 2,592,639 1,752,523 1,948,403 9,885,233 175,984,474
Georgia 1,971,410 2,964,538 2,877,362 2,928,214 2,940,956 3,339,105 2,619,035 2,914,609 8,294,558 124,756,312
Hawaii 137,693 206,257 201,583 204,314 204,993 234,987 187,733 203,581 393,559 4,041,461
Idaho 1,328,717 1,997,798 1,939,538 1,973,522 1,982,038 2,076,784 1,766,897 1,964,431 3,366,002 30,341,929
Illinois 9,323,696 14,023,856 13,605,888 13,849,700 13,910,793 14,349,500 12,367,330 13,784,473 24,070,095 242,526,619
Indiana 4,410,532 6,633,467 6,436,551 6,551,417 6,580,199 6,762,132 5,853,032 6,520,687 12,342,276 131,847,383
Iowa 3,359,006 5,051,761 4,902,155 4,989,424 5,011,292 5,153,879 4,458,829 4,966,077 8,578,634 80,834,411
Kansas 1,703,713 2,561,867 2,486,735 2,530,561 2,541,543 2,706,214 2,264,099 2,518,837 5,001,886 56,441,771
Kentucky 3,042,989 4,576,408 4,441,020 4,519,996 4,539,785 4,761,929 4,039,827 4,498,867 7,640,899 70,913,750
Louisiana 1,165,702 1,752,591 1,701,665 1,731,371 1,738,815 1,997,309 1,550,758 1,723,424 3,623,154 50,657,478
Maine 2,065,666 3,106,317 3,014,901 3,068,227 3,081,589 3,240,063 2,744,008 3,053,961 4,924,673 41,935,015
Maryland 1,785,842 2,685,405 2,606,578 2,652,560 2,664,081 2,897,804 2,372,992 2,640,259 5,280,336 61,441,745

CRS-19
Region/
State FY2001 FY2002 FY2003 FY2004 FY2005 FY2006 FY2007 FY2008 FY2009
FY2009 ARRA
(P.L. 111-5)
Massachusetts 4,408,639 6,630,621 6,433,790 6,548,606 6,577,376 6,938,192 5,850,524 6,517,890 11,794,866 122,077,457
Michigan 10,226,257 15,381,490 14,922,914 15,190,413 15,257,442 15,446,624 13,564,024 15,118,849 25,949,859 243,398,975
Minnesota 6,646,224 9,979,183 9,682,194 9,855,435 9,898,845 10,154,727 8,802,132 9,809,089 15,972,943 131,937,411
Mississippi 1,109,916 1,668,677 1,620,261 1,648,503 1,655,581 1,850,660 1,476,791 1,640,948 3,744,293 49,421,193
Missouri 4,041,710 6,078,686 5,898,363 6,003,549 6,029,907 6,368,172 5,364,017 5,975,410 11,566,101 128,148,027
Montana 1,710,249 2,550,624 2,475,828 2,519,458 2,530,390 2,623,349 2,254,188 2,507,786 3,760,263 26,543,777
Nebraska 1,679,110 2,524,859 2,450,834 2,494,014 2,504,834 2,586,397 2,231,477 2,482,462 4,372,276 41,644,458
Nevada 562,559 845,342 821,553 835,429 838,908 946,130 751,059 831,718 2,547,725 37,281,937
New
Hampshire
1,015,772 1,527,066 1,482,885 1,508,657 1,515,114 1,593,171 1,351,967 1,501,762 2,533,628 23,218,594
New Jersey 3,435,381 5,166,645 5,013,603 5,102,877 5,125,246 5,266,959 4,560,095 5,078,993 10,124,722 118,821,296
New Mexico 1,160,650 1,744,160 1,876,873 1,723,006 1,730,427 1,857,690 1,542,148 1,714,483 2,927,997 26,855,604
New York 13,579,110 20,424,856 19,815,430 20,170,923 20,259,998 21,818,047 18,009,524 20,075,816 36,654,490 394,686,513
North Carolina 2,799,730 4,210,497 4,086,054 4,158,644 4,176,834 4,576,429 3,717,293 4,139,225 9,766,765 131,954,536
North Dakota 1,695,918 2,527,852 2,453,738 2,496,970 2,507,804 2,589,151 2,234,117 2,485,405 3,679,322 25,266,330
Ohio 9,250,620 13,913,935 13,499,255 13,741,148 13,801,761 14,242,973 12,270,440 13,676,435 25,174,465 266,781,409
Oklahoma 1,744,765 2,623,617 2,546,639 2,591,542 2,602,794 2,831,669 2,318,528 2,579,529 5,150,319 60,903,196
Oregon 1,899,540 2,856,430 2,772,488 2,821,454 2,833,724 2,921,655 2,523,743 2,808,354 4,563,299 38,512,236
Pennsylvania 9,901,139 14,892,448 14,448,499 14,707,466 14,772,357 15,101,584 13,132,955 14,638,184 25,400,552 252,793,062
Rhode Island 778,507 1,170,171 1,136,666 1,156,210 1,161,108 1,253,702 1,037,381 1,150,982 2,022,878 20,073,615
South Carolina 1,195,436 1,797,316 1,745,053 1,775,540 1,783,179 1,982,643 1,590,182 1,767,384 4,242,330 58,892,771
South Dakota 1,290,524 1,940,347 1,883,806 1,916,788 1,925,053 1,991,514 1,716,257 1,907,964 3,020,139 24,487,296
Tennessee 2,815,179 4,233,736 4,108,598 4,181,594 4,199,886 4,534,180 3,737,777 4,162,066 8,571,222 99,112,101
Texas 3,753,569 5,645,264 5,477,906 5,575,530 5,599,993 6,607,385 4,981,976 5,549,413 19,793,889 326,975,732
CRS-20
Region/
State FY2001 FY2002 FY2003 FY2004 FY2005 FY2006 FY2007 FY2008 FY2009
FY2009 ARRA
(P.L. 111-5)
Utah 1,398,486 2,102,745 2,041,346 2,077,161 2,086,136 2,161,298 1,859,403 2,067,579 3,818,075 37,897,203
Vermont 860,443 1,293,419 1,256,227 1,277,921 1,283,358 1,353,926 1,146,018 1,272,118 2,021,240 16,842,576
Virginia 2,704,200 4,066,802 3,946,656 4,016,741 4,034,302 4,344,862 3,590,631 3,997,991 8,025,937 94,134,276
Washington 3,056,649 4,596,956 4,460,953 4,540,287 4,560,166 4,688,820 4,057,939 4,519,063 7,243,701 59,545,074
West Virginia 2,162,350 3,251,749 3,155,983 3,211,847 3,225,843 3,320,985 2,872,199 3,196,901 4,817,624 37,583,874
Wisconsin 5,768,714 8,676,447 8,418,423 8,568,935 8,606,650 8,800,191 7,653,827 8,528,669 14,966,407 141,502,133
Wyoming 793,133 1,188,724 1,154,664 1,174,532 1,179,511 1,221,639 1,053,735 1,069,354 1,550,974 10,239,261
Total State
Allocation 150,574,880 226,360,956 219,849,999 223,571,556 224,550,063 237,039,567 199,706,355 222,202,364 425,675,396 4,665,810,609
American
Samoa 0 0 0 0 0 0 0 0 196,784 719,511
Guam 0 0 0 0 0 0 0 0 198,908 1,119,297
Northern
Mariana Islands
0 0 0 0 0 0 0 0 197,186 795,206
Puerto Rico 0 0 0 0 0 0 0 0 452,558 48,865,588
Virgin Islands 0 0 0 0 0 0 0 0 200,481 1,415,429
Total U.S.
Territories
Allocations
0 0 0 0 0 0 0 0 1,245,917 52,915,031
Navaho Grant 125,123 189,041 1,176,405 186,724 187,537 362,433 289,645 321,735 703,848 0
Inter-Tribal
Council of
Arizona Grant
0 0 0 0 0 0 0 88,741 102,138 0
Northern
Arapahoe Grant
0 0 0 0 0 0 0 99,863 144,840 0

CRS-21
Region/
State FY2001 FY2002 FY2003 FY2004 FY2005 FY2006 FY2007 FY2008 FY2009
FY2009 ARRA
(P.L. 111-5)
Total Tribal
Government
Allocations
125,123 189,041 1,176,405 186,724 187,537 362,433 289,645 510,339 950,826 0
Source: Department of Energy (DOE) annual Weatherization Program Notices regarding Grantee Allocations, accessed from the Weatherizat ion Program Guidance
documents library at the National Association for State Community Services Programs (NASCSP). Documents were previously housed on the former Weatherization
Assistance Program Technical Assistance Center (WAPTAC) website. WAPTAC’s resources and documents library has since been incorporated into the NASCSP
website.
Notes: Each state allocation is the sum of the state program allocation and the state training and technical assistance allocation. The Energy Independence and Security
Act of 2007 (P.L. 110-140, §411c) added Puerto Rico and other territories of the U.S. to the definition of “State” for the purpose of funding allocations. Beginning with
Fiscal Year 2009, the territories of American Samoa, Guam, Commonwealth of the Northern Mariana Islands, Commonwealth of Puerto Rico and the U.S. Virgin Islands
were added to the program. Tribal Government Allocations are derived from state allocations: Navaho Grant allocations are from Arizona and New Mexico state
allocations; Inter-Tribal Council of Arizona Grant allocations are from Arizona allocations; and Northern Arapahoe Grant allocations are from Wyoming allocations.
Also, P.L. 111-5 was enacted as the American Recovery and Reinvestment Act of 2009. It is referred to in the last column by the shorthand “ARRA.”

The Weatherization Assistance Program Formula
Congressional Research Service 22
Appendix B. Base Allocation
Table B-1. Base Allocation Table from 10 C.F.R. §440.10
State Base Allocation in Dollars
Alabama $1,636,000
Alaska 1,425,000
Arizona 760,000
Arkansas 1,417,000
California 4,404,000
Colorado 4,574,000
Connecticut 1,887,000
Delaware 409,000
District of Columbia 487,000
Florida 761,000
Georgia 1,844,000
Hawaii 120,000
Idaho 1,618,000
Illinois 10,717,000
Indiana 5,156,000
Iowa 4,032,000
Kansas 1,925,000
Kentucky 3,615,000
Louisiana 912,000
Maine 2,493,000
Maryland 1,963,000
Massachusetts 5,111,000
Michigan 12,346,000
Minnesota 8,342,000
Mississippi 1,094,000
Missouri 4,615,000
Montana 2,123,000
Nebraska 2,013,000
Nevada 586,000
New Hampshire 1,193,000
New Jersey 3,775,000
New Mexico 1,519,000
New York 15,302,000
North Carolina 2,853,000

The Weatherization Assistance Program Formula
Congressional Research Service 23
State Base Allocation in Dollars
North Dakota 2,105,000
Ohio 10,665,000
Oklahoma 1,846,000
Oregon 2,320,000
Pennsylvania 11,457,000
Rhode Island 878,000
South Carolina 1,130,000
South Dakota 1,561,000
Tennessee 3,218,000
Texas 2,999,000
Utah 1,692,000
Vermont 1,014,000
Virginia 2,970,000
Washington 3,775,000
West Virginia 2,573,000
Wisconsin 7,061,000
Wyoming 967,000
American Samoa 120,000
Guam 120,000
Puerto Rico 120,000
Northern Mariana Islands 120,000
Virgin Islands 120,000
Total 171,858,000
Source: 10 C.F.R. §440.10.
Note: States and territories are organized in the table according to 10 C.F.R. §440.10.
Author Information
Corrie E. Clark Analyst in Energy Policy
Lynn J. Cunningham Senior Research Librarian

The Weatherization Assistance Program Formula
Congressional Research Service R46418 · VERSION 4 · UPDATED 24
Disclaimer
This document was prepared by the Congressional Research Service (CRS). CRS serves as nonpartisan shared staff to congressional committees and Members of Congress. It operates solely at the behest of and
under the direction of Congress. Information in a CRS Report should not be relied upon for purposes other than public understanding of information that has been provided by CRS to Members of Congress in
connection with CRS’s institutional role. CRS Reports, as a work of the United States Government, are not subject to copyright protection in the United States. Any CRS Report may be reproduced and distributed in its entirety without permission from CRS. However, as a CRS Report may include copyrighted images or
material from a third party, you may need to obtain the permission of the copyright holder if you wish to copy or otherwise use copyrighted material.