weatherization assistance program technical memorandum
TRANSCRIPT

ORNL/TM-2014/133
Weatherization Assistance Program Technical Memorandum Background Data and Statistics On Low-Income Energy Use and Burdens
Joel F. Eisenberg
April 2014
Approved for public release: distribution is unlimited.

DOCUMENT AVAILABILITY Reports produced after January 1, 1996, are generally available free via US Department of Energy (DOE) SciTech Connect. Website http://www.osti.gov/scitech/ Reports produced before January 1, 1996, may be purchased by members of the public from the following source: National Technical Information Service 5285 Port Royal Road Springfield, VA 22161 Telephone 703-605-6000 (1-800-553-6847) TDD 703-487-4639 Fax 703-605-6900 E-mail [email protected] Website http://www.ntis.gov/help/ordermethods.aspx Reports are available to DOE employees, DOE contractors, Energy Technology Data Exchange representatives, and International Nuclear Information System representatives from the following source: Office of Scientific and Technical Information PO Box 62 Oak Ridge, TN 37831 Telephone 865-576-8401 Fax 865-576-5728 E-mail [email protected] Website http://www.osti.gov/contact.html
This report was prepared as an account of work sponsored by an agency of the United States Government. Neither the United States Government nor any agency thereof, nor any of their employees, makes any warranty, express or implied, or assumes any legal liability or responsibility for the accuracy, completeness, or usefulness of any information, apparatus, product, or process disclosed, or represents that its use would not infringe privately owned rights. Reference herein to any specific commercial product, process, or service by trade name, trademark, manufacturer, or otherwise, does not necessarily constitute or imply its endorsement, recommendation, or favoring by the United States Government or any agency thereof. The views and opinions of authors expressed herein do not necessarily state or reflect those of the United States Government or any agency thereof.

ORNL/TM-2014/133
Energy and Transportaton Science Division
WEATHERIZATION ASSISTANCE PROGRAM TECHNICAL MEMORANDUM
BACKGROUND DATA AND STATISTICS ON LOW-INCOME ENERGY USE AND BURDENS
Joel F. Eisenberg
Date Published: April 2014
Prepared by OAK RIDGE NATIONAL LABORATORY
Oak Ridge, Tennessee 37831-6283 managed by
UT-BATTELLE, LLC for the
US DEPARTMENT OF ENERGY under contract DE-AC05-00OR22725


iii
Contents SUMMARY SHEET ................................................................................................................................ - 1 -
INTRODUCTION .................................................................................................................................... - 2 -
ENERGY-RELATED CHARACTERISTICS ......................................................................................... - 2 -
Defining The Low-Income Population ....................................................................................................... - 2 -
Fuel Types and Efficiency Characteristics ................................................................................................. - 4 -
ENERGY PRICES AND INFLATION ............................................................................................................... - 8 -
ENERGY EXPENDITURES AND BURDEN ................................................................................................... - 10 -
Distribution of Low-Income Energy Expenditures .................................................................................. - 12 -
Weather Conditions For The Winter Of 2013-14 .................................................................................... - 13 -
APPENDIX A ............................................................................................................................................ - 15 -
APPENDIX B ............................................................................................................................................. - 18 -


- 1 -
SUMMARY SHEET
• Weatherization-eligible households- 39.5 million
• Average site annual energy consumption for Weatherization-eligible households- 78.2 million British thermal units (MBtu).
• Weatherization-eligible households space conditioning energy consumption per square foot- 30.56 thousand Btu (mBtu).
• Average eligible household energy expenditure for FY 2014 -$1,851 o For gas-heated households- $1,859 o For propane-heated households- $2,758 o For fuel-oil-heated households- $3,008 o For electric-heated households- $1,593
• Total energy expenditures by eligible households for FY 2014 -$72.3
Billion
• Average space conditioning expenditure per eligible household for FY 2014 - $721
• Energy burden for eligible households in FY 2014- 16.3 percent
• Energy burden for non-eligible households in FY 2014- 3.5 percent
• The price of natural gas increased slightly in FY 2014 to $11.56 per
thousand cubic feet (mcf) but is still below the 2009 level of $11.97 per mcf.
• The price of home heating oil has maintained its sharp increase from 2008
levels and is estimated to be $3.75 per gallon. Electricity prices are estimated to have increased a fraction of a penny to $.124 per kilowatt hour (kWh).

- 2 -
WEATHERIZATION ASSISTANCE PROGRAM
BACKGROUND DATA AND STATISTICS
INTRODUCTION
This technical memorandum is intended to provide readers with information that may be useful
in understanding the purposes and context of the Department of Energy’s Weatherization
Assistance Program (Weatherization). Weatherization has been in operation for over thirty years
and is the largest single national residential energy efficiency program. Its primary purpose,
established by law, is
“…to increase the energy efficiency of dwellings owned or occupied by low-income persons,
reduce their total residential energy expenditures, and improve their health and safety,
especially low-income persons who are particularly vulnerable such as the elderly, the
handicapped, and children.”1
The data and statistics in this memorandum provide reasonable and transparent estimates of key
low-income energy usage and housing characteristics. The companion appendices at the back of
the memorandum explain the methods and sources used in developing the statistics.
ENERGY-RELATED CHARACTERISTICS OF LOW-INCOME HOUSEHOLDS
Defining The Low-Income Population
There are several ways to define the number of households that can be described as low-income.
Most of these are based on household income standards defined by various federal programs. For
example, eligibility for many programs at the Department of Housing and Urban Development
(HUD) is defined as household income at or below 80 percent of the local area median. The
1 Title 42 of the U.S. Code, Chapter 81, Subchapter III, Part A, 6861.

- 3 -
Department of Health and Human Services Low Income Home Energy Assistance Program
(LIHEAP) has historically defined federal eligibility to be household income at or below 150
percent of the Federal Poverty Income Guidelines or 60 percent of state median income,
whichever is higher. The Department of Energy Weatherization Assistance Program now
defines eligibility as household income at or below 200 percent of the Federal Poverty Income
Guidelines.
For purposes of this analysis, the Weatherization guidelines are employed in conjunction with
the DOE Energy Information Administration Residential Energy Consumption Survey (RECS),2
which provides the most reliable energy data regarding household energy use.. According to the
latest RECS, in 2009 there were approximately 39.5 million households in the United States that
were federally eligible for Weatherization out of 113.6 million households nationwide. Within
this low-income population 16.9 million households were categorized as having income at or
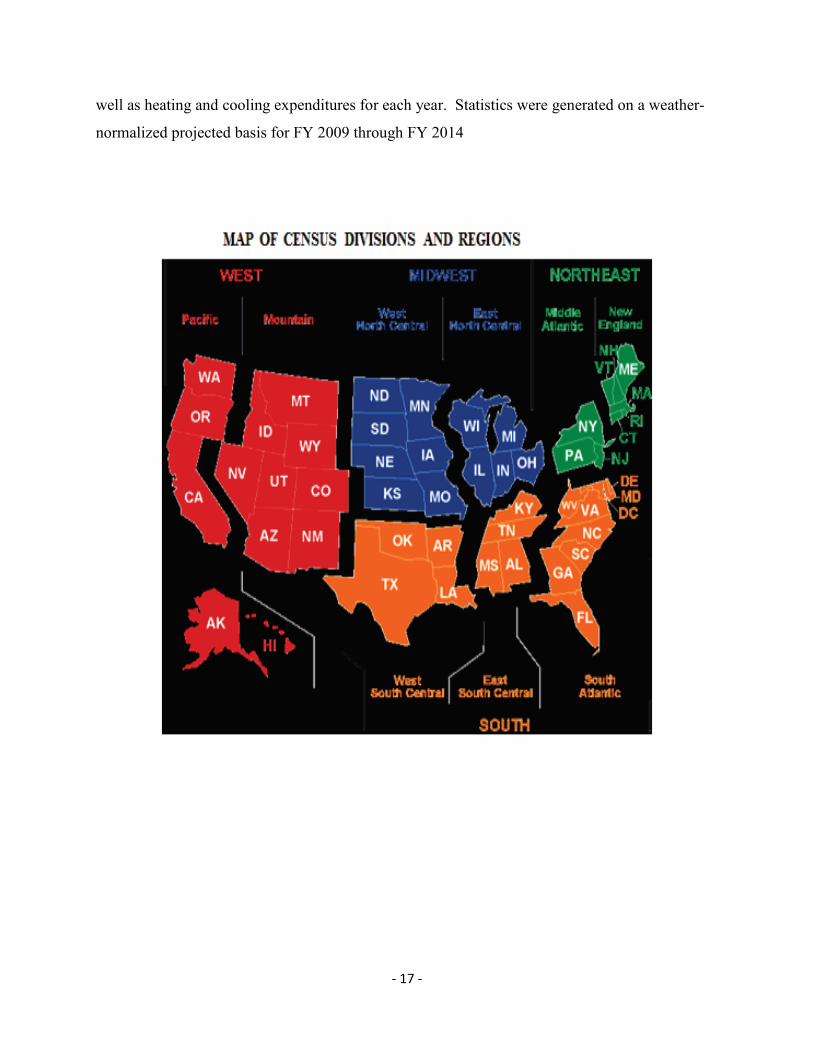
below the poverty level. The low-income household population is generally distributed around
the United States in roughly the same proportions as the non-low-income population, with
approximately 16 percent in the Northeast, 23 percent in the Midwest, 41 percent in the South,
and 20 percent in the West. A somewhat higher percentage of non-low-income households,
about 4 percent more, live in the Northeast and about 6 percent fewer live in the South.
This large eligible population is comprised of a broad range of households in terms of income
levels, housing characteristics, and program participation. Nearly 60 percent of the households
contained at least one paid worker and approximately 28 percent reported receiving Food
Stamps. Thirty three percent received retirement income. Sixty four percent of the eligible
households lived in single-family or mobile homes and just under half owned their own homes.
2 Energy expenditure statistics in this memorandum are based on the public use files of the 2009 RECS, weather-normalized, and adjusted for annual prices as projected by EIA Short Term Energy Outlook.

- 4 -
Fuel Types and Efficiency Characteristics
Low-income consumers have a similar profile to other consumers in terms of the primary heating
fuel they use, with a slightly higher proportion than the general population using propane for this
purpose. The largest single heating fuel type is natural gas, with approximately 43 percent of
low-income households employing this fuel. Electricity is used for heating by 39 percent of
these households. Home heating oil is the heating fuel of 5 percent of low-income families and
propane is also employed for heating by 5 percent. The remaining households heated with other
fuels such as wood or used no heating energy at all. This distribution is shown in Graph 1.

- 5 -
The distribution of heating fuel usage varies substantially by region. Most of the home heating
oil is used by low-income households in the Northeast whereas electricity is the dominant
heating source in the South and natural gas predominates in the Midwest. This has important
implications for the average level of residential expenditures and energy burdens in the various
parts of the country because home heating oil and propane prices per MBtu are higher and have
risen more sharply than those of other fuels. Furthermore, residential electricity prices in the
Northeast tend to be well above the electricity national average. The overwhelming
predominance of natural gas as the primary heating fuel in the Midwest makes low-income
households in that part of the United States extremely sensitive to events in the natural gas
markets.
Average energy consumption for low-income households in 2009 was 78 million British thermal
units (MBtu) compared to 96 MBtu for the non-low-income households. On the other hand,
energy intensity (i.e., Btu consumption for heating and cooling per square foot of conditioned
space) showed the reverse pattern. For eligible households, consumption per square foot
averaged 31 thousand British thermal units (mBtu) whereas for non-low-income households the
average was 24 mBtu per square foot. This reflects the relative inefficiency of the low-income
housing stock compared to that of other households. For example, 28 percent of low-income
households reported inadequate insulation in their homes whereas 17 percent of non-low-income
households reported this condition.
A review of the average energy consumption for low-income households by housing type reveals
that households living in large apartment buildings have lower average annual consumption than
those in most other building types, 46 MBtu compared to 95 MBtu for those in single family
detached homes. It important to note that average consumption per square foot is higher in the
small multifamily housing stock- buildings with 2-5 units, than it is in other building types. The
average space conditioning consumption was 46 mBtu per square foot for these homes compared
to 29 mBtu for single family homes and 37 mBtu per square foot for apartments in large
buildings. This highlights a potential efficiency opportunity in the small multifamily housing
stock.

- 6 -
TABLE 1
AGE OF HEATING SYSTEMS AND REFRIGERATORS BY PROGRAM ELIGIBILITY
RECS 2009
Age of
Equipment
Refrigerators
Low-Income Non-Low-Income
Heating Systems
Low-Income Non-Low-Income
Under 2 Years 11.9% 12.4% 10.0% 9.4%
2-4 Years 22.6% 23.0% 13.1% 15.4%
5-9 Years 34.4% 35.6% 20.9% 25.4%
10-19 Years 25.3% 24.7% 27.1% 29.1%
20 Years or more 5.6% 4.1% 28.1% 20.7%
The RECS data indicate substantial energy efficiency opportunities in the low-income housing
stock in terms of both heating systems and refrigerators if one uses the age of the equipment as a
rough proxy for inefficiency. Over 30 percent of the refrigerators in the low-income households
were 10 years old or more. Fifty five percent of heating systems in low-income homes were 10
years old or more. Non-low-income households also presented significant efficiency
opportunities based on this criterion.
The number of households reporting that they replaced their primary refrigerator in the four
years prior to and including the survey was approximately 24 percent for low-income households
and 25 percent for non-low-income households. Both household types received minimal
assistance in the form of public aid, manufacturer rebates, energy provider incentives or
weatherization programs for refrigerator replacement.
The percentage of owner-occupied households that reported replacing their primary heating
system in the previous four years was about 18 percent for both low-income households and non-

- 7 -
low-income households. Of the latter, just less than 5 percent of all households received some
form of rebate, tax credit or other subsidy. For low-income households, just under 4 percent
received some form of aid, with about 40 percent of this coming from a weatherization program.
Another significant efficiency opportunity reported in the RECS data pertains to the level of
insulation in American homes. The share of owner occupied non-low-income homes reporting
little or no insulation was 14 percent. For owner occupied low-income homes the comparable
share of homes with little or no insulation was 24 percent.
Though the percentage of low-income homes with poor or no insulation was substantially higher
than that of non-low-income homes, the percentage of homes that reported adding insulation in
the 10 years prior to the survey was only 18 percent for owner occupied low-income homes
compared to 20 percent for owner occupied non-low-income homes. In both cases the majority
of households received no financial assistance to add insulation. Of the low-income homes, just
over two percent reported some financial aid for this purpose with slightly more than half of this
coming from a weatherization program. By contrast, for non-low-income homes just less than
two percent reported some form of assistance paying for insulation with well over half of this
coming from tax credits. The statistics here are reported for the period immediately prior to and
including 2009. It can be expected that there will be a substantial increase in the percentage of
low-income homes receiving assistance reported in the next RECS survey which will cover the
period of the American Reinvestment and Recovery Act (ARRA) when over $5 Billion was
committed to the Department of Energy’s Weatherization Assistance Program.

- 8 -
ENERGY PRICES AND INFLATION
The energy inflation picture over the long term reflects energy prices rising faster than the rate
of general inflation and also faster than low-income household incomes. The data for low-
income households indicate an actual decline in incomes during recent years as a result of the
Great Recession. According to the Bureau of Labor Statistics, average income for the lowest
quintile of the U.S. population increased by 58% since 1992 while inflation rose by 67 percent.
Over this period, electricity prices have risen 51 percent, natural gas rose 96 percent and heating
oil climbed 312 percent. Please see Graph 2 for details.
During the past ten years, there has been severe price inflation for home heating oil and a slow
but steady rise in electricity prices. Natural gas prices have been slowly increasing after dropping
as supplies increased sharply in 2008.

- 9 -

- 10 -
ENERGY EXPENDITURES AND BURDEN
The average annual weather-normalized expenditure for low-income households estimated for
FY 2014, (October 2013-September 2014) is $1,851 of which $721 is estimated to be for
primary heating and cooling expenses. This compares to estimated residential energy
expenditures of $2,284 for non-low-income households, of which $906 is estimated for primary
heating and cooling.
Low-income households have lower average residential energy usage and lower residential
energy bills than do non-low-income households but this difference is not in proportion to
household income. The income of low-income households as provided in the 2009 RECS and
adjusted for inflation was estimated at $18,773 compared to $71,755 for non-low-income
households. In FY 2014 the estimated mean energy burden of low-income households, defined
for each household as residential energy expense divided by household income, was therefore
estimated to be 16.3 percent for low-income households compared to 3.5 percent for non-low-
income households as shown in graph 3.

- 11 -
As one examines the energy bills of eligible low-income households several features stand out.
Households that employ fuel oil as their primary heat source have the highest energy bills,
followed by those that heat with propane. The average energy bill for the former was estimated
at $3,008 for FY 2014 while that of the latter was $2,758. This compares with $1,859 for
households heating with natural gas and $1,593 for households heating with electricity. Please
see Graph 4 for details of heating and total residential energy expenditures by primary heating
fuel.
- 12 -
Given the concentration of low-income households heating with fuel oil in the Northeast it is no
wonder that the estimated average energy expenditure for low-income households for FY 2010 is
higher there than elsewhere at $2,335. This compares to $1,940 for such households in the
Midwest, where less expensive natural gas predominates and to $1,802 for those in the South,
where heating loads are lower. Those low-income households living in the West have a
projected average expenditure of $1,374. The very large size of these Census regions masks the
considerable diversity of weather conditions and energy expenditures on a smaller Census
division or state scale.
Distribution of Low-Income Energy Expenditures
The previous discussion has highlighted averages of energy expenditure by fuel type, both
nationally and by region. It is important to keep in mind that nationally, and in each region and
state low-income energy expenditures vary considerably even among households using the same
heating fuel and living in the same type of building . Causes for these variations are several
including variations in building energy efficiency, number of household members, and
household behavior. This results in a broad distribution in energy usage and energy burdens as
depicted in Graph 5 which shows a typical bell curve distribution of low-income energy
expenditures with a long tail. This means that there are often a considerable proportion of low-
income households with energy bills and burdens that are below the average and others that have
bills and burdens that considerably exceed the averages. The latter may be particularly good
targets for Weatherization if they can be identified through energy consumption data.

- 13 -
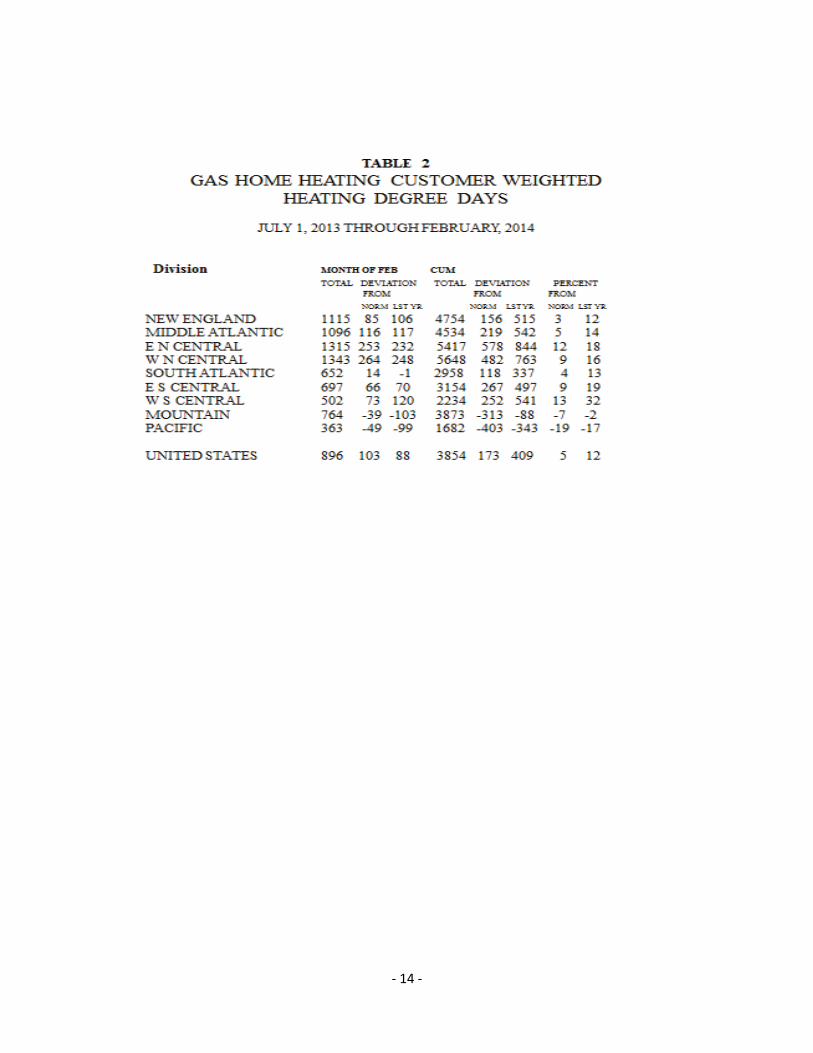
Weather Conditions For The Winter Of 2013-14
The Energy Expenditure data presented to this point have been weather-normalized, that is to
say, adjusted to standard 30-year weather historical conditions. This facilitates standardized
comparison of expenditures from year to year. Quite clearly, in this unusual winter the cost of
heating will be higher than normal due to the colder weather that has impacted both the demand
for heating energy and its price. Table 2 shows the heating degree days nationally and by Census
Division provided by the National Oceanic and Atmospheric Administration for this year’s
heating season through February of 2014. On a national basis, it indicates heating demand that is
12 percent higher than last year and 5 percent higher than normal. On a Divisional basis, there
are certain parts of the country that have been particularly hard hit. These include the East North
Central Division that has suffered heating degree days 12 percent above normal, the West South
Central Division where heating degree days have averaged 13 percent colder than normal and the
West North Central and East South Central Divisions where heating degree days have exceeded
the 30-year norm by 9 percent.
- 14 -

- 15 -
APPENDIX A
Method for Estimating Low-Income Energy Expenditures
The method used to estimate energy expenditures by low-income households is based on the
integration of two products from the Department of Energy’s Energy Information
Administration: the Residential Energy Consumption Survey (RECS) for 2009 and the Short
Term Energy Outlook (STEO) for October or November in various years. The former is the
most recent EIA survey of U.S. households in an occasional series dating back to 1978 that
provides detailed data on housing and energy characteristics, demographics, and energy
consumption and expenditures verified through billing data. There are records on 12,083
individual households in the RECS data base. The STEO provides EIA’s monthly estimate of
energy prices for the 18-month period immediately ahead in addition to actual prices for the
previous year.
The RECS public use files identify the location of each household by Census Region, of which
there are four, and by Census Division, of which there are nine. Heating and cooling degree days
are provided for each household for 2009 based on the population-weighted data for each Census
Division and income is provided in 24 categories. The survey provides actual fuel bills for each
household and uses statistical techniques to allocate the usage and expenditures among major
usage categories such as heating, cooling, hot water heating, refrigeration, etc. Long range
climate normals for heating and cooling degree days for each of the Census divisions were
calculated using statistics provided by the National Climatic Data Center of the National Oceanic
and Atmospheric Administration, National Environmental Satellite, Data and Information
Service. These data were employed to calculate an adjustment factor for each division so that
RECS data on heating and cooling expenditures for 2009 could be adjusted to reflect normal
conditions.
Annual price adjustment factors were similarly calculated using quarterly price projections by
division for natural gas and electricity and by region for propane and heating oil as provided by
the STEO for each Fall. The quarterly prices were weighted by consumption for each quarter to
calculate an annual price adjustment factor for the historical record for 2009 and for the price
projections for each year thereafter through FY 2014. The baseline 2009 energy prices used to

- 16 -
calculate multipliers were derived from the historical STEO database. This methodology
provides a conservative and internally consistent approach to the estimation problem.
The estimate of an individual household’s expenditure for a given year n was then calculated
using the following formula in SPSS:
(((Dolngsph * hddfact) + Dolngwth + Dolngoth) * pmngY) + (((Dolpsph * hddfact) + Dollpwth
+ Dollpoth)*pmlp Y) + (((Dolkrsph*hddfact)+Dolkrwth+Doldroth)*pmfoY) +
(((Dolfosph*hddfact)+ Dolfowth + Dolfooth)*pmfoY) + (((Dolelsph * hddfact) + (Dolelcol *
cddfact)+doleloth+ dolelrfg + dolelwth)* pmelY) where:
‘Dol’ signifies the expenditure for 2009,
‘ng’ represents natural gas
‘p’ represents propane
‘kr’ represents kerosene
‘fo’ represents fuel oil
‘el’ represents electricity
‘hddfact’ is the heating degree day adjustment factor for normalization
‘cddfact’ is the cooling degree day adjustment factor for normalization
‘sph’ is space heating
‘wth’ is water heating
‘oth’ is other appliances and uses
‘col’ is cooling,
‘rfg’ is refrigerator
‘pm’ is price multiplier
‘Y’ is the fiscal year
Regional estimates were then made using the sort functions of SPSS to select households by
region and qualification of eligibility for LIHEAP and the ‘Explore’ statistical function to derive
means, medians, and standard deviations by primary heating fuel type for total expenditures as
- 17 -
well as heating and cooling expenditures for each year. Statistics were generated on a weather-
normalized projected basis for FY 2009 through FY 2014

- 18 -
APPENDIX B
List of References
Eisenberg, J, March 2010, “Weatherization Assistance Program Technical Memorandum Background Data and Statistics,” Oak Ridge National Laboratory, Oak Ridge, TN.
Energy Information Administration, 2009 Annual Energy Outlook For 2010, Early Release, Washington D.C.
Energy Information Administration, Residential Energy Consumption Survey for 2009, Public Use Microsample, Washington D.C.
Energy Information Administration, Short Term Energy Outlook, November, 2013, Washington D.C.
Energy Information Administration, Short Term Energy Outlook, October, 2012, Washington D.C.
Energy Information Administration, Short Term Energy Outlook, November, 2011, Washington D.C.
Energy Information Administration, Short Term Energy Outlook, October, 2010, Washington D.C.
Energy Information Administration, Short Term Energy Outlook, October, 2009, Washington D.C.
U.S. Census Bureau, 2012, Income, Poverty, and Health Insurance Coverage In The United States, Washington D.C.
U.S. Department of Commerce, National Oceanic and Atmospheric Administration, 2007, Historical Climatology Series 5-1, Monthly, State, Regional, and National Heating Degree Days, Asheville, NC.
U.S. Department of Health and Human Services, “2014 Poverty Guidelines,” available at http://aspe.hhs.gov/poverty/14poverty.cfm (accessed April 24, 2014).
U.S. National Weather Service, Climate Prediction Center, 2007, Experimental Monthly Total Degree Day Forecast, Camp Springs, MD.