thermoelectric generator performance for passenger...
TRANSCRIPT
Thermoelectric Generator
Performance for PassengerPerformance for Passenger Vehicles
Doug Crane and John LaGrandeur
March 20 20122March 20,, 201

Advanced Thermoelectric Solutions
Program Overview Amerigon recently completed a 7 year
TEG program with partners BMW and Ford. The $10M program phases are described below:
• Phase 1: System modeling and architecture evaluation
• Phase 2: Subsystem design, build and bench test
• Phase 3: System integration. Planar configuration TEG with primary HEX and secondary loop, power converter
• Phase 4: Cylindrical TEG built and tested on test bench at Amerigon
• Phase 5: Improved cylindrical TEG built, installed, and tested on BMW X6 and Lincoln MKT vehicles
Advanced Thermoelectric Solutions
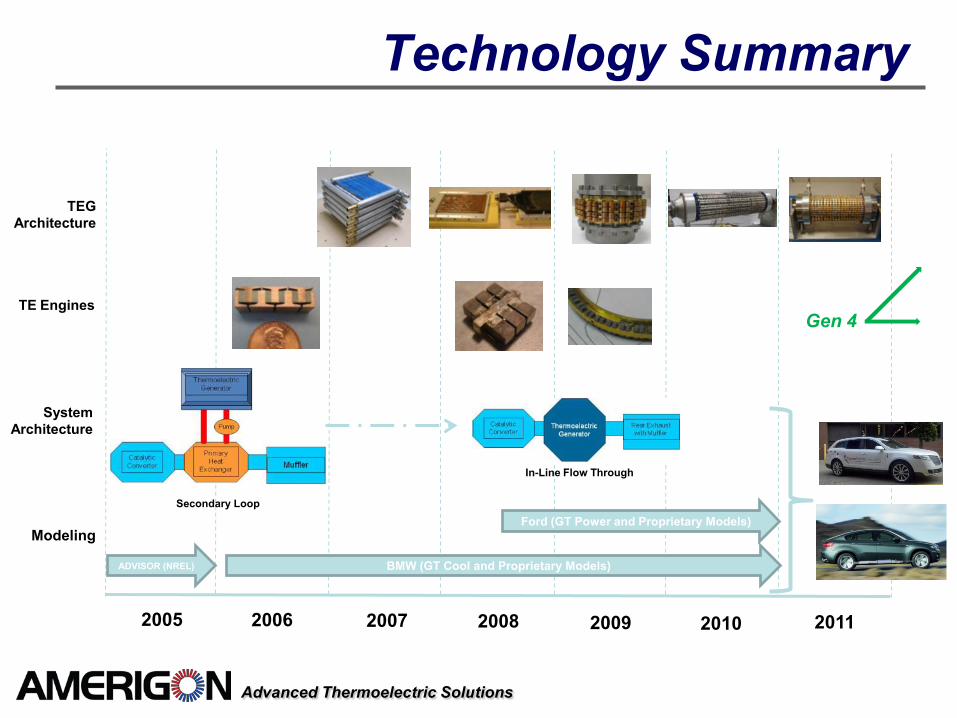
Technology Summary
2005 2008 2009 2010 2011 2006 2007
Modeling
ADVISOR (NREL) BMW (GT Cool and Proprietary Models)
Ford (GT Power and Proprietary Models)
System Architecture
Secondary Loop
In-Line Flow Through
Gen 4
TEG Architecture
TE Engines
Advanced Thermoelectric Solutions
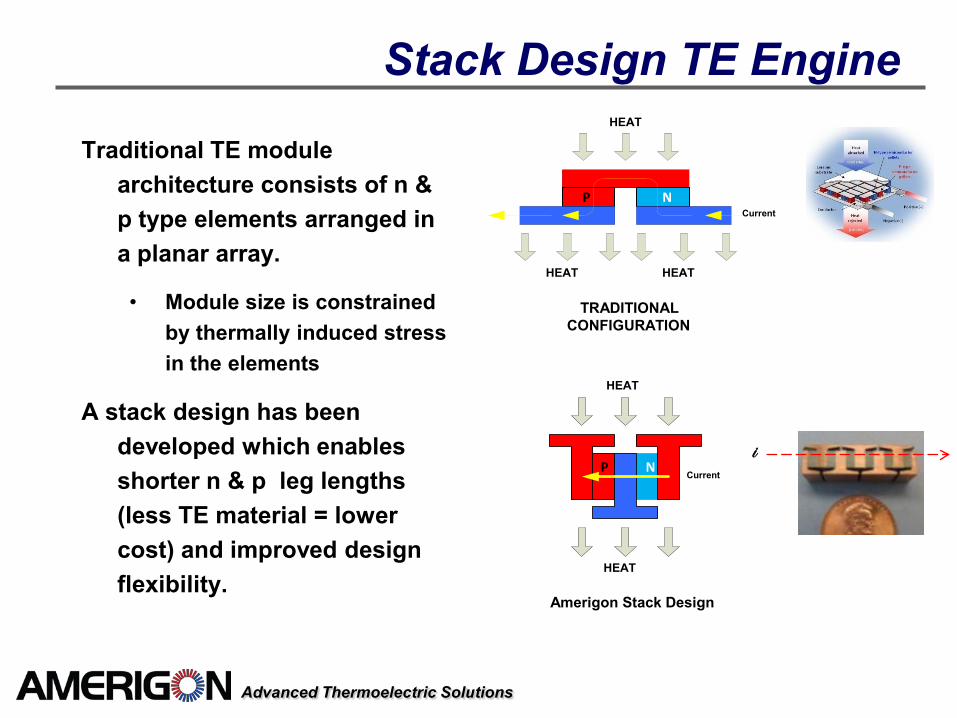
Stack Design TE Engine
Traditional TE module architecture consists of n & p type elements arranged in a planar array.
• Module size is constrained by thermally induced stress in the elements
A stack design has been developed which enables shorter n & p leg lengths (less TE material = lower cost) and improved design flexibility.
N Current
HEAT
HEAT
Amerigon Stack Design
P
HEAT
HEAT HEAT
Current
TRADITIONAL CONFIGURATION
P N
i
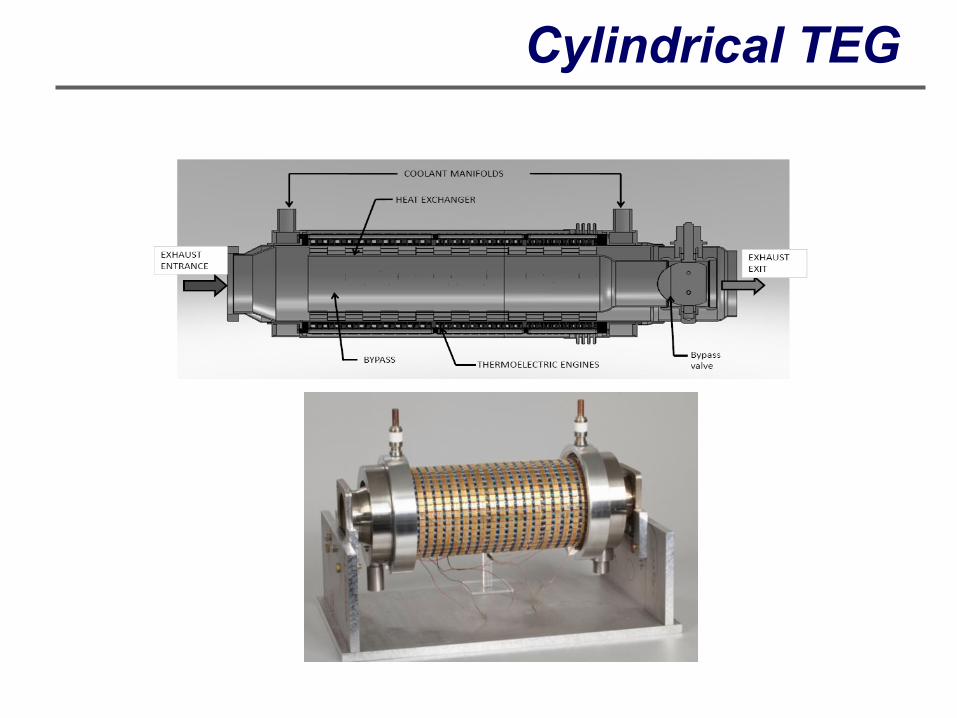
Cylindrical TEG
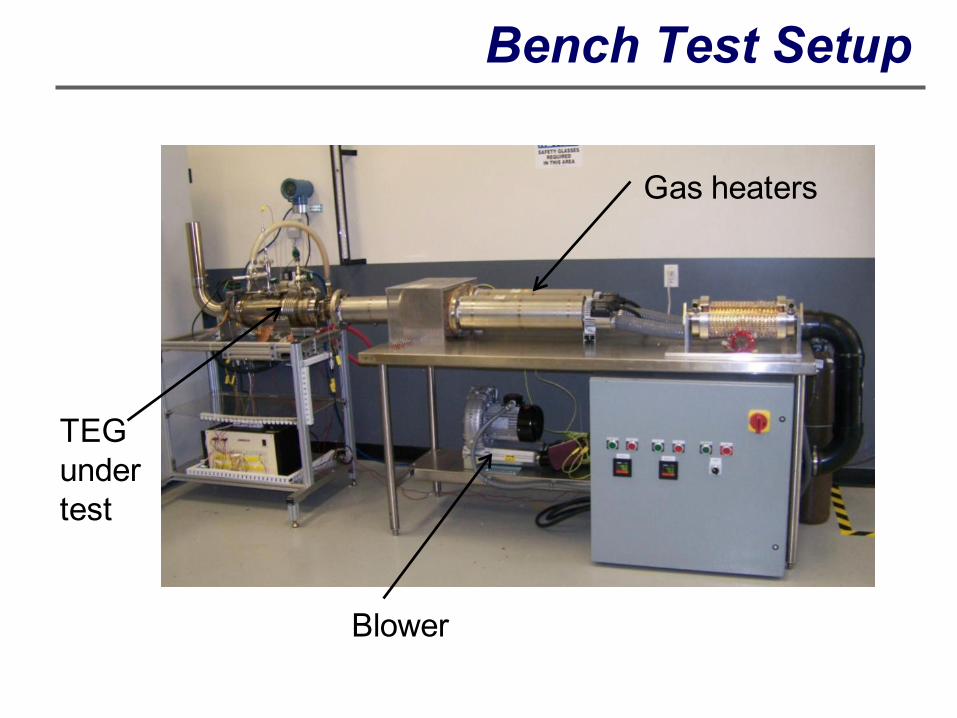
Bench Test Setup
Blower
Gas heaters
TEG under test
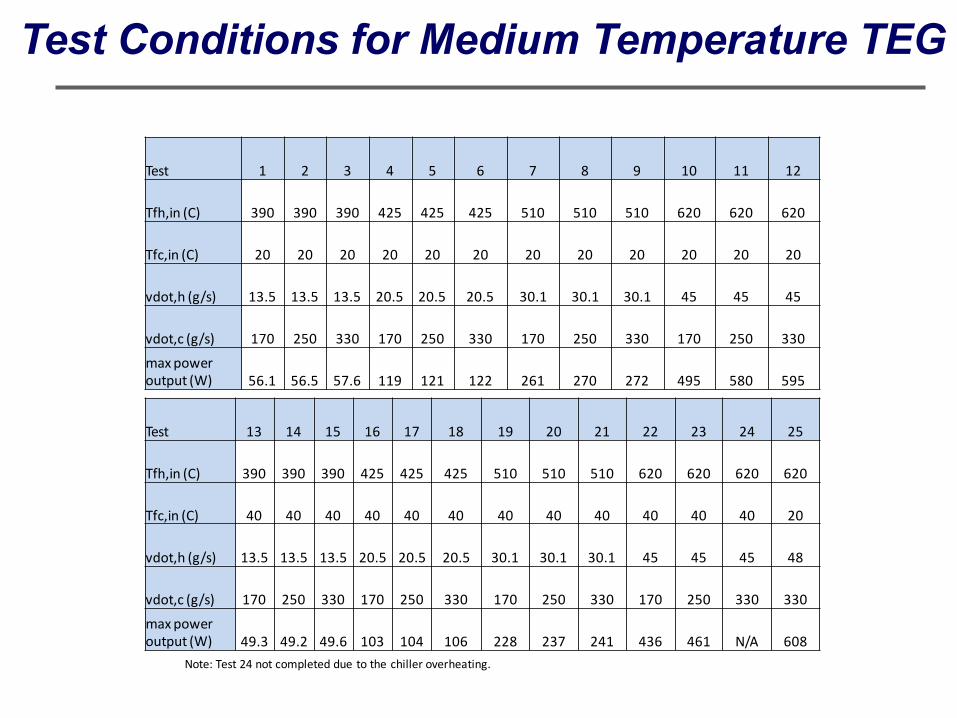
Test Conditions for Medium Temperature TEG
Test 1 2 3 4 5 6 7 8 9 10 11 12
Tfh,in (C) 390 390 390 425 425 425 510 510 510 620 620 620
Tfc,in (C) 20 20 20 20 20 20 20 20 20 20 20 20
vdot,h (g/s) 13.5 13.5 13.5 20.5 20.5 20.5 30.1 30.1 30.1 45 45 45
vdot,c (g/s) 170 250 330 170 250 330 170 250 330 170 250 330
max power output (W) 56.1 56.5 57.6 119 121 122 261 270 272 495 580 595
Test 13 14 15 16 17 18 19 20 21 22 23 24 25
Tfh,in (C) 390 390 390 425 425 425 510 510 510 620 620 620 620
Tfc,in (C) 40 40 40 40 40 40 40 40 40 40 40 40 20
vdot,h (g/s) 13.5 13.5 13.5 20.5 20.5 20.5 30.1 30.1 30.1 45 45 45 48
vdot,c (g/s) 170 250 330 170 250 330 170 250 330 170 250 330 330
max power output (W) 49.3 49.2 49.6 103 104 106 228 237 241 436 461 N/A 608
Note: Test 24 not completed due to the chiller overheating.
Advanced Thermoelectric Solutions
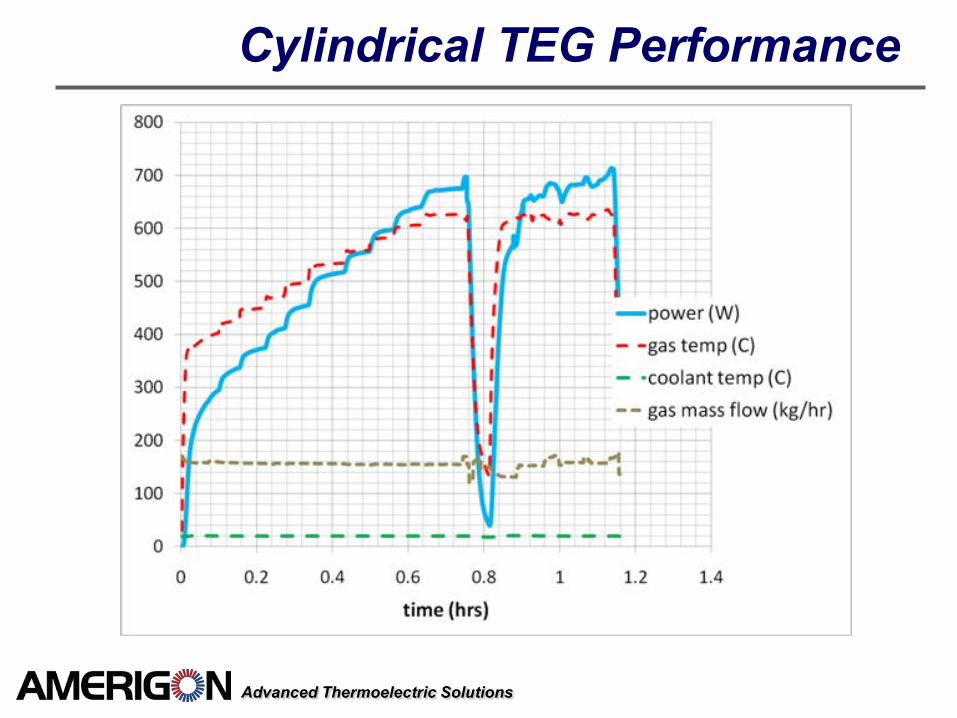
Cylindrical TEG Performance
Advanced Thermoelectric Solutions
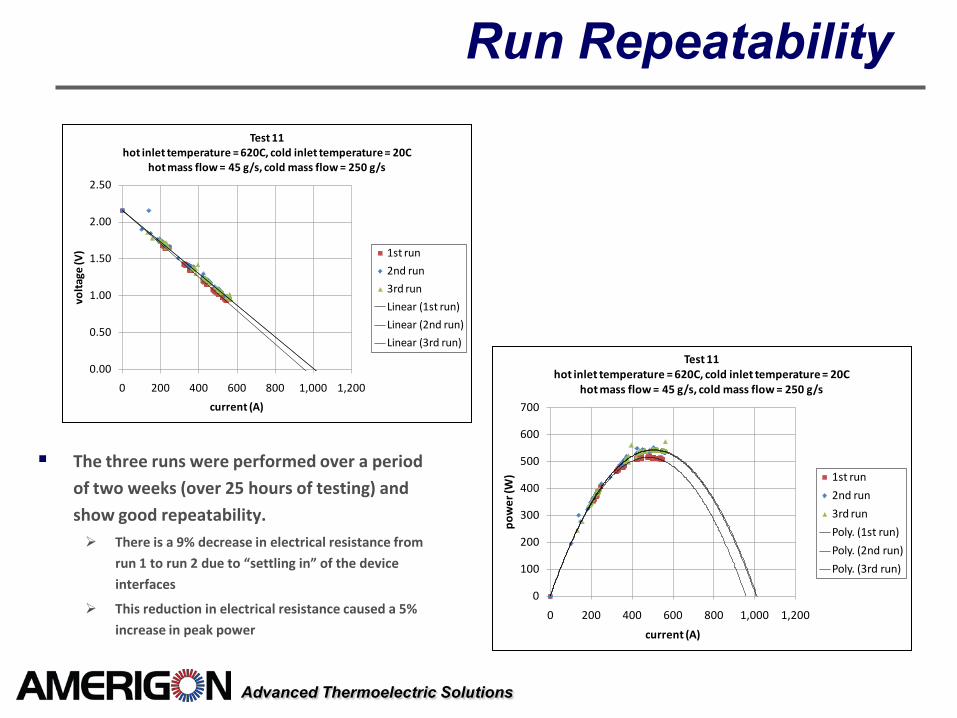
Run Repeatability
The three runs were performed over a period
of two weeks (over 25 hours of testing) and
show good repeatability. There is a 9% decrease in electrical resistance from
run 1 to run 2 due to “settling in” of the device
interfaces
This reduction in electrical resistance caused a 5%
increase in peak power
0.00
0.50
1.00
1.50
2.00
2.50
0 200 400 600 800 1,000 1,200
volt
age
(V)
current (A)
Test 11hot inlet temperature = 620C, cold inlet temperature = 20C
hot mass flow = 45 g/s, cold mass flow = 250 g/s
1st run
2nd run
3rd run
Linear (1st run)
Linear (2nd run)
Linear (3rd run)
0
100
200
300
400
500
600
700
0 200 400 600 800 1,000 1,200
pow
er (W
)
current (A)
Test 11hot inlet temperature = 620C, cold inlet temperature = 20C
hot mass flow = 45 g/s, cold mass flow = 250 g/s
1st run
2nd run
3rd run
Poly. (1st run)
Poly. (2nd run)
Poly. (3rd run)
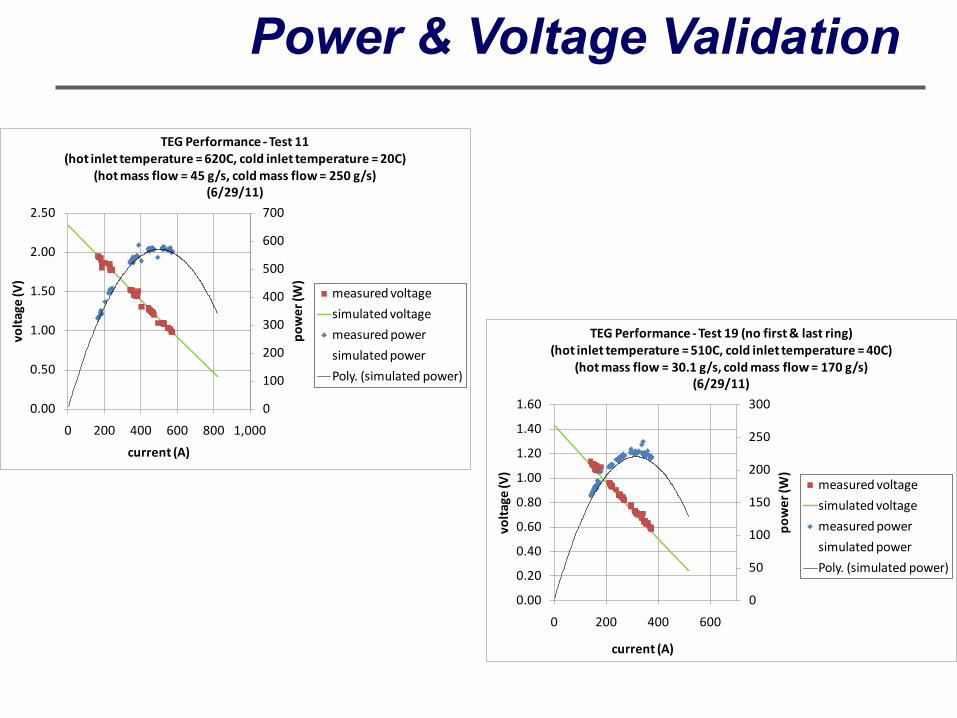
Power & Voltage Validation
0
100
200
300
400
500
600
700
0.00
0.50
1.00
1.50
2.00
2.50
0 200 400 600 800 1,000
pow
er (W
)
volt
age
(V)
current (A)
TEG Performance - Test 11(hot inlet temperature = 620C, cold inlet temperature = 20C)
(hot mass flow = 45 g/s, cold mass flow = 250 g/s)(6/29/11)
measured voltage
simulated voltage
measured power
simulated power
Poly. (simulated power)
0
50
100
150
200
250
300
0.00
0.20
0.40
0.60
0.80
1.00
1.20
1.40
1.60
0 200 400 600
pow
er (W
)
volt
age
(V)
current (A)
TEG Performance - Test 19 (no first & last ring)(hot inlet temperature = 510C, cold inlet temperature = 40C)
(hot mass flow = 30.1 g/s, cold mass flow = 170 g/s)(6/29/11)
measured voltage
simulated voltage
measured power
simulated power
Poly. (simulated power)
11
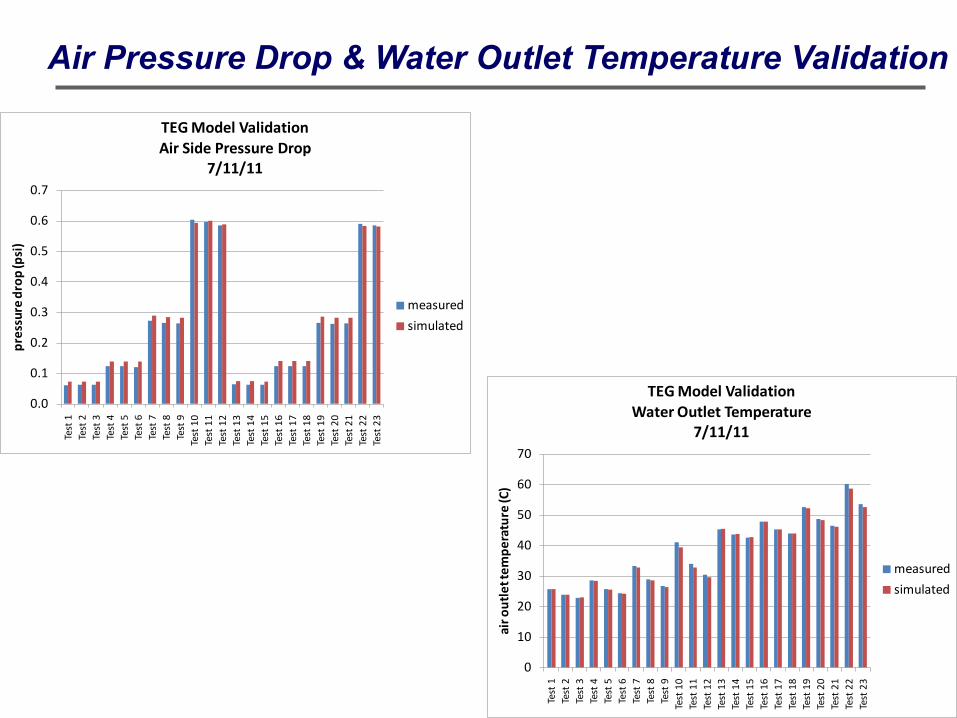
Air Pressure Drop & Water Outlet Temperature Validation
0.0
0.1
0.2
0.3
0.4
0.5
0.6
0.7
Test
1Te
st 2
Test
3Te
st 4
Test
5Te
st 6
Test
7Te
st 8
Test
9Te
st 1
0Te
st 1
1Te
st 1
2Te
st 1
3Te
st 1
4Te
st 1
5Te
st 1
6Te
st 1
7Te
st 1
8Te
st 1
9Te
st 2
0Te
st 2
1Te
st 2
2Te
st 2
3
pres
sure
dro
p (p
si)
TEG Model ValidationAir Side Pressure Drop
7/11/11
measured
simulated
0
10
20
30
40
50
60
70
Test
1Te
st 2
Test
3Te
st 4
Test
5Te
st 6
Test
7Te
st 8
Test
9Te
st 1
0Te
st 1
1Te
st 1
2Te
st 1
3Te
st 1
4Te
st 1
5Te
st 1
6Te
st 1
7Te
st 1
8Te
st 1
9Te
st 2
0Te
st 2
1Te
st 2
2Te
st 2
3
air o
utle
t tem
pera
ture
(C)
TEG Model ValidationWater Outlet Temperature
7/11/11
measured
simulated
12
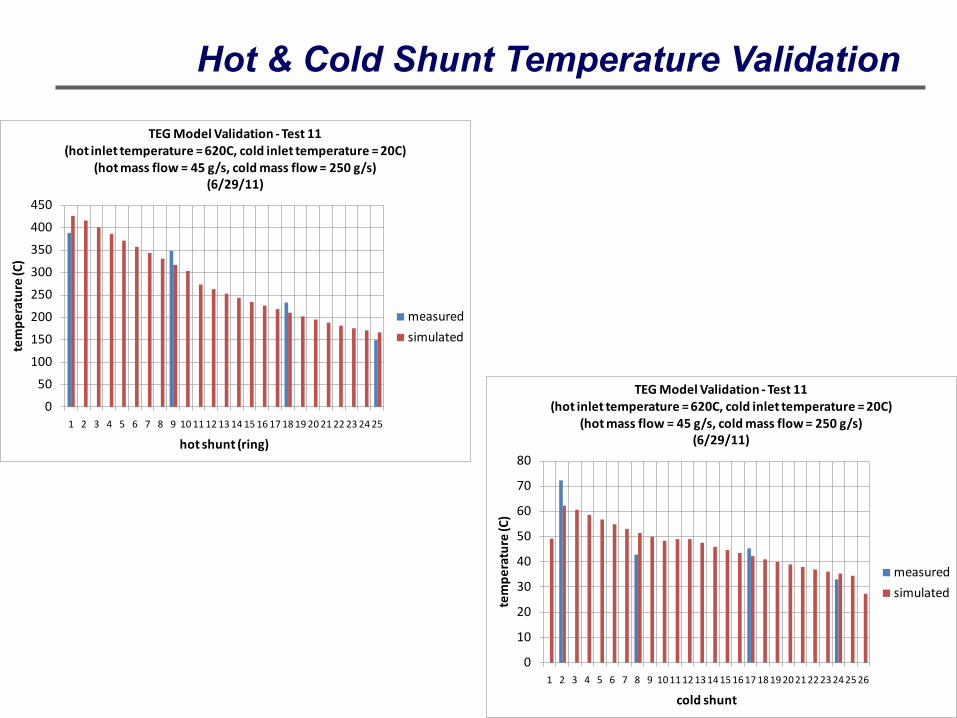
Hot & Cold Shunt Temperature Validation
0
50
100
150
200
250
300
350
400
450
1 2 3 4 5 6 7 8 9 10 11 12 13 14 15 16 17 18 19 20 21 22 23 24 25
tem
pera
ture
(C)
hot shunt (ring)
TEG Model Validation - Test 11(hot inlet temperature = 620C, cold inlet temperature = 20C)
(hot mass flow = 45 g/s, cold mass flow = 250 g/s)(6/29/11)
measured
simulated
0
10
20
30
40
50
60
70
80
1 2 3 4 5 6 7 8 9 10 11 12 13 14 15 16 17 18 19 20 21 22 23 24 25 26
tem
pera
ture
(C)
cold shunt
TEG Model Validation - Test 11(hot inlet temperature = 620C, cold inlet temperature = 20C)
(hot mass flow = 45 g/s, cold mass flow = 250 g/s)(6/29/11)
measured
simulated
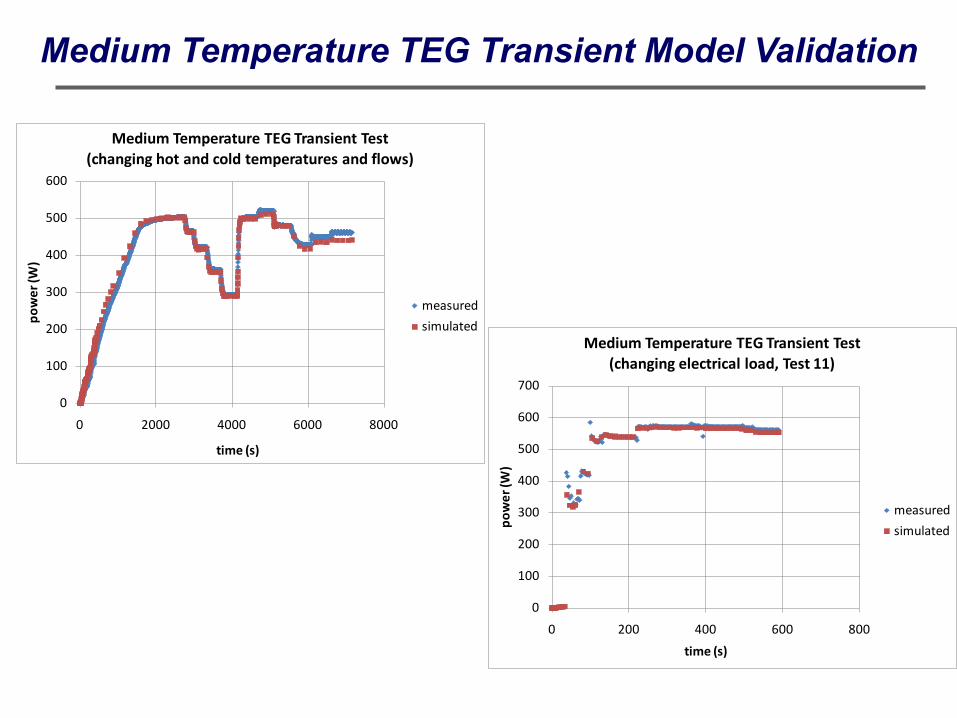
Medium Temperature TEG Transient Model Validation
0
100
200
300
400
500
600
700
0 200 400 600 800
pow
er (W
)
time (s)
Medium Temperature TEG Transient Test(changing electrical load, Test 11)
measured
simulated
0
100
200
300
400
500
600
0 2000 4000 6000 8000
pow
er (W
)
time (s)
Medium Temperature TEG Transient Test(changing hot and cold temperatures and flows)
measured
simulated
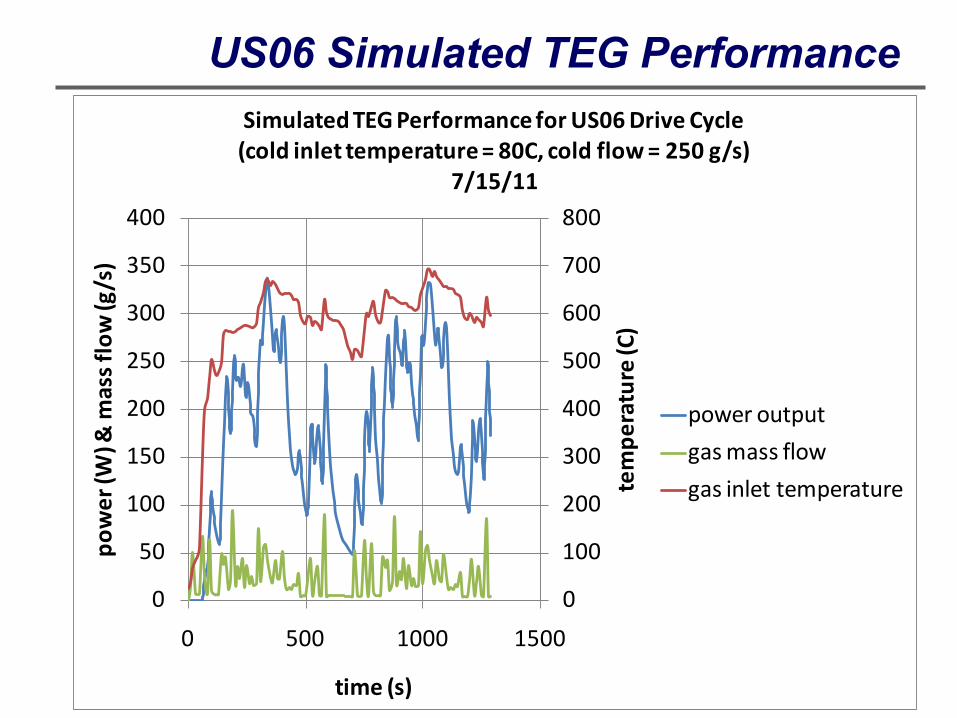
US06 Simulated TEG Performance
0
100
200
300
400
500
600
700
800
0
50
100
150
200
250
300
350
400
0 500 1000 1500te
mpe
ratu
re (C
)
pow
er (W
) & m
ass
flow
(g/s
)
time (s)
Simulated TEG Performance for US06 Drive Cycle(cold inlet temperature = 80C, cold flow = 250 g/s)
7/15/11
power output
gas mass flow
gas inlet temperature

Steady State Power Vs Coolant Flow/Temp
0
100
200
300
400
500
600
1300RPM,
50 Nm
1750RPM,
60 Nm
2000RPM,
65 Nm
2250RPM,
75 Nm
2500RPM,
80 Nm
2750RPM,
80 Nm
3000RPM,105Nm
pow
er (W
)
engine conditions
Measured Steady State TEG Performance on Dynomometer01/31/12
coolant flow = 10 lpm, coolant temp = 30°C
coolant flow = 20 lpm, coolant temp = 30°C
coolant flow = 10 lpm, coolant temp = 55°C
coolant flow = 20 lpm, coolant temp = 55°C
coolant flow = 10 lpm, coolant temp = 80°C
coolant flow = 20 lpm, coolant temp = 80°C

Repeatability: Steady State Power
0
50
100
150
200
250
300
350
400
450
500
1300RPM,
50 Nm
1750RPM,
60 Nm
2000RPM,
65 Nm
2250RPM,
75 Nm
2500RPM,
80 Nm
2750RPM,
80 Nm
3000RPM,105Nm
pow
er (W
)
engine conditions
Measured Steady State TEG Performance on Dynomometer01/31/12
coolant flow = 20 lpm, coolant temp = 55°C
coolant flow = 20 lpm, coolant temp = 55°C(repeat)
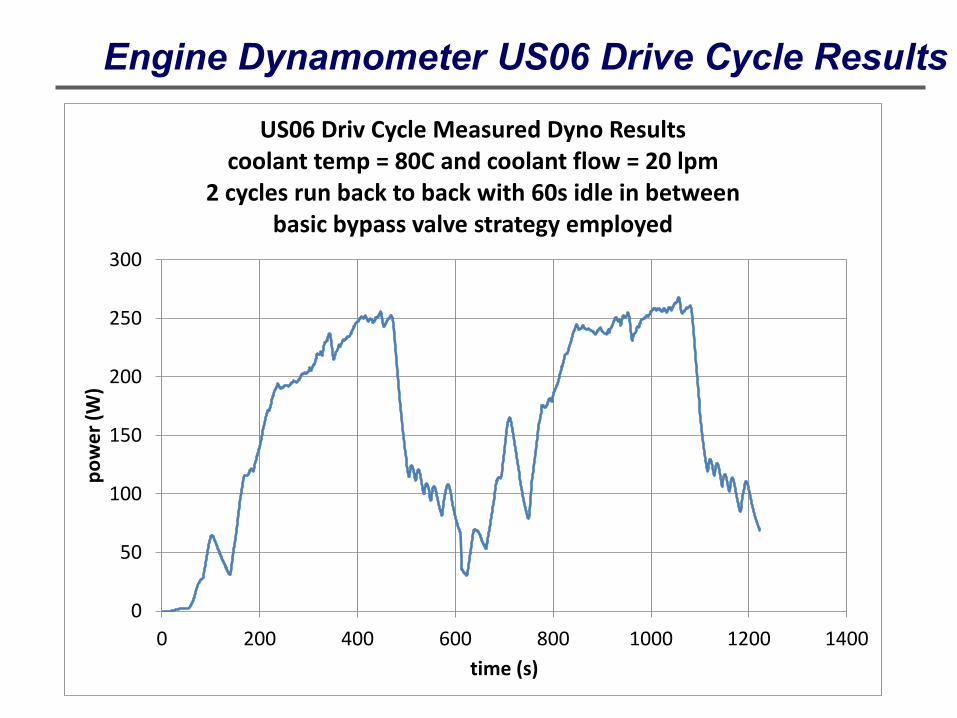
Engine Dynamometer US06 Drive Cycle Results
0
50
100
150
200
250
300
0 200 400 600 800 1000 1200 1400
pow
er (W
)
time (s)
US06 Driv Cycle Measured Dyno Resultscoolant temp = 80C and coolant flow = 20 lpm
2 cycles run back to back with 60s idle in betweenbasic bypass valve strategy employed

Engine Dynamometer US06 Drive Cycle Results
0
100
200
300
400
500
600
0 200 400 600 800 1000 1200 1400
pow
er (W
)
time (s)
US06 Drive Cycle Measured Dyno Resultscoolant flow = 20 lpm
2 cycles run back to back with 60s idle in between01/31/12
coolant temp = 80°C
coolant temp = 55°C
Note: Bypass valve closed for cycle
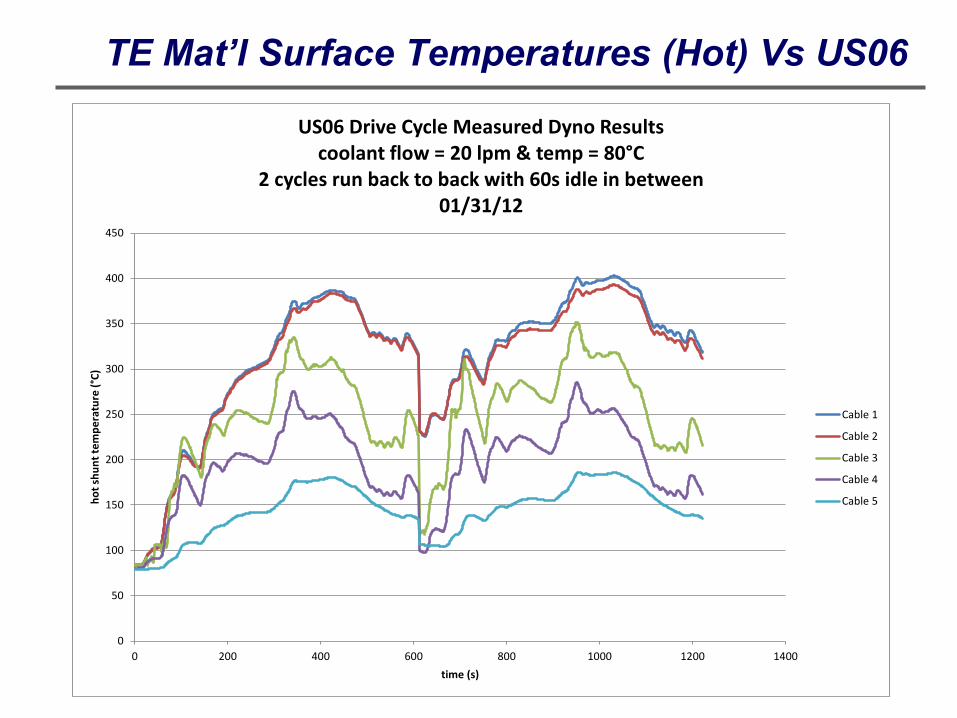
TE Mat’l Surface Temperatures (Hot) Vs US06
0
50
100
150
200
250
300
350
400
450
0 200 400 600 800 1000 1200 1400
hot s
hunt
tem
pera
ture
(°C)
time (s)
US06 Drive Cycle Measured Dyno Resultscoolant flow = 20 lpm & temp = 80°C
2 cycles run back to back with 60s idle in between01/31/12
Cable 1
Cable 2
Cable 3
Cable 4
Cable 5
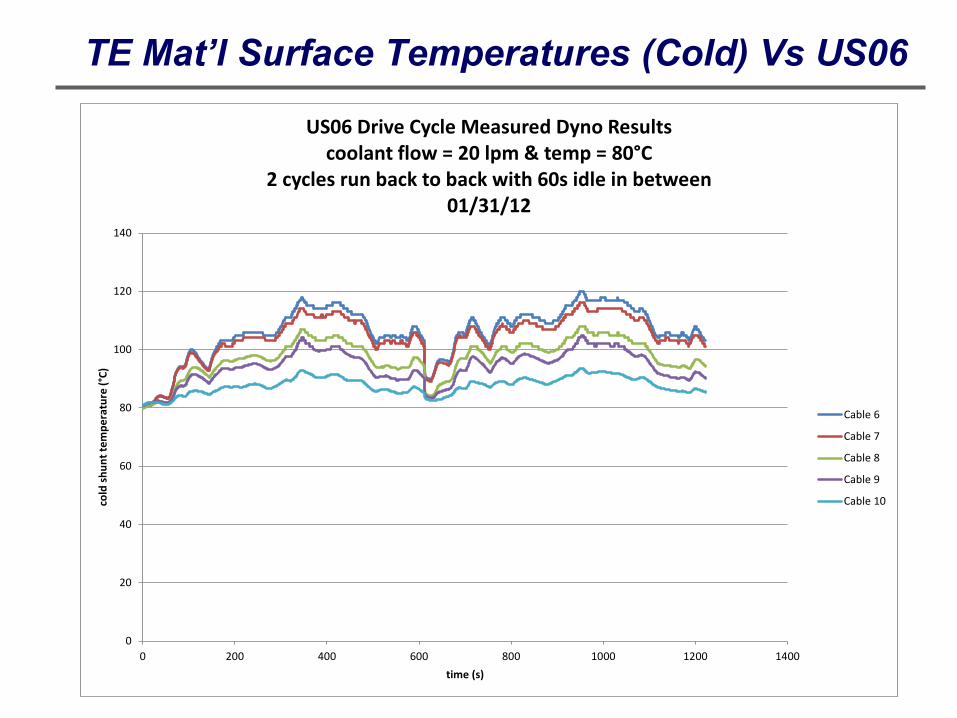
TE Mat’l Surface Temperatures (Cold) Vs US06
0
20
40
60
80
100
120
140
0 200 400 600 800 1000 1200 1400
cold
shu
nt te
mpe
ratu
re (°
C)
time (s)
US06 Drive Cycle Measured Dyno Resultscoolant flow = 20 lpm & temp = 80°C
2 cycles run back to back with 60s idle in between01/31/12
Cable 6
Cable 7
Cable 8
Cable 9
Cable 10

Ford Lincoln MKT AWD
Advanced Thermoelectric Solutions
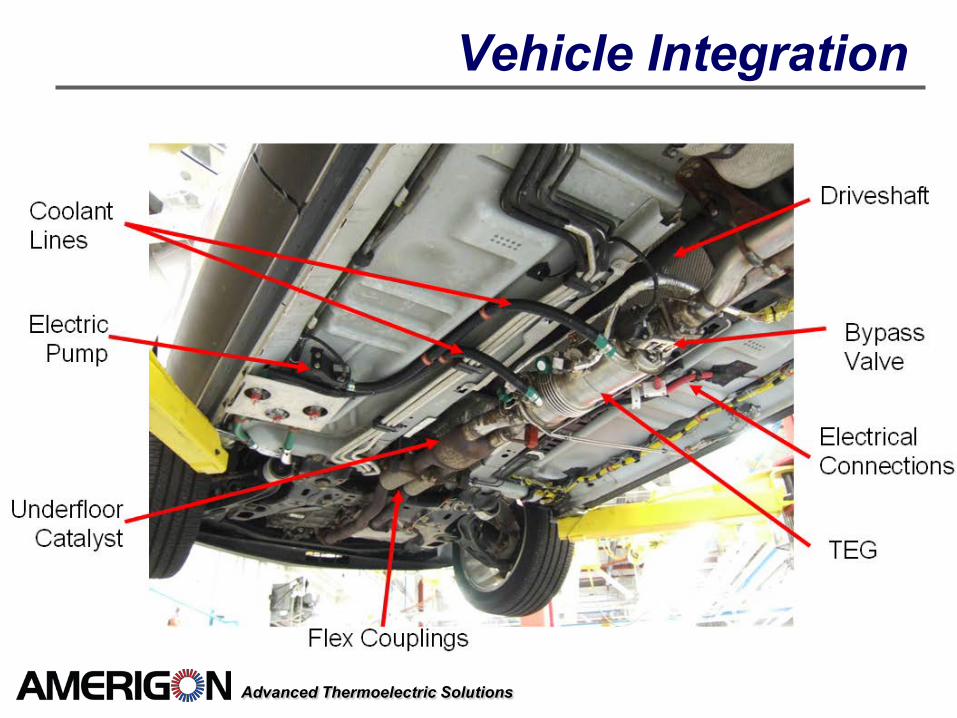
Vehicle Integration
Advanced Thermoelectric Solutions
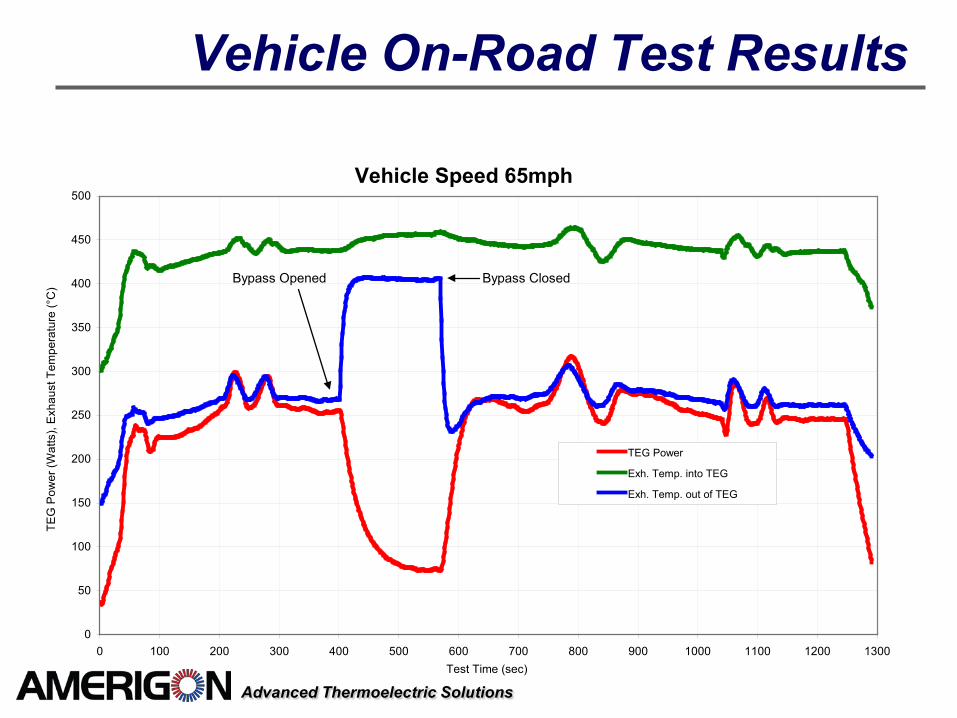
Vehicle On-Road Test Results
Vehicle Speed 65mph
0
50
100
150
200
250
300
350
400
450
500
0 100 200 300 400 500 600 700 800 900 1000 1100 1200 1300Test Time (sec)
TEG
Pow
er (W
atts
), E
xhau
st T
empe
ratu
re (°
C)
TEG Power
Exh. Temp. into TEG
Exh. Temp. out of TEG
Bypass Opened Bypass Closed
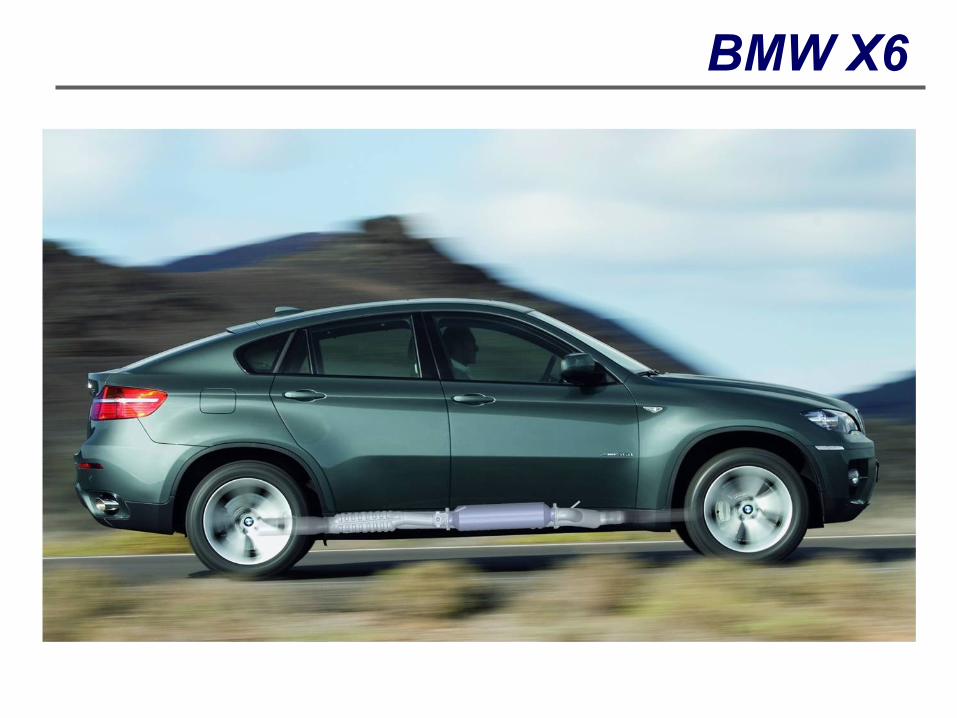
BMW X6
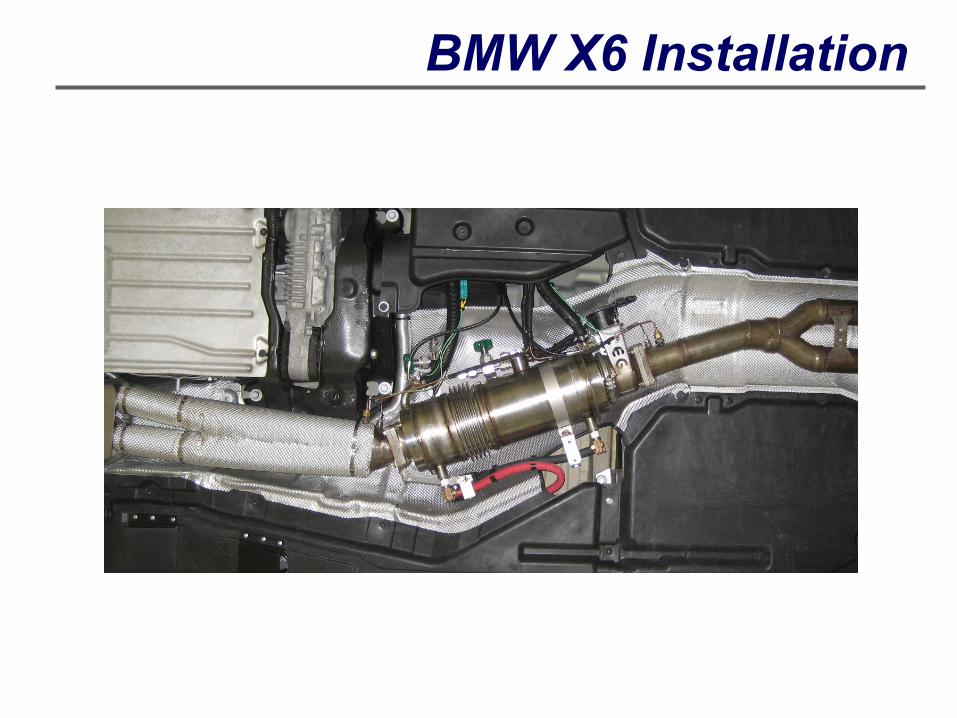
BMW X6 Installation
Advanced Thermoelectric Solutions
Summary
TEGs have been built and bench tested with over 700W of power output achieved with air inlet temperatures up to 620C.
TEGs were installed in a BMW X6 and Lincoln MKT with at least 450W of power output achieved in road tests for both vehicles.
Repeatable performance has been achieved in bench and engine dynamometer testing. Repeatable performance still being achieved in over 6 months of vehicle testing.
Steady state model has been validated to within 10% error for a wide range of operating conditions and load resistances for power, voltage, temperatures, and pressure drops for TEGs with varying TE material
Transient model has been validated to within 10% error for a wide range of operating conditions and load resistances for TEGs with varying TE material
Validated transient model has been used to simulate automotive drive cycles such as the US06
Advanced Thermoelectric Solutions
Outlook and Further Work
Further work is required to address technical and economic risks for
TEG commercialization:
• Material and system costs
• Design robustness and performance
• FE Benefits Vs regulatory and customer drive-cycles
The partnership between BMW, Ford, and Amerigon will continue in a
follow-on DOE TEG program with the following key objectives:
• 5% FE gain for a passenger vehicle measured over the US06 drive cycle
• Economic feasibility defined for 100K/annum manufacturing volume
Advanced Thermoelectric Solutions
Acknowledgements US Department of Energy: John Fairbanks
DOE NETL: Carl Maronde
BMW: Boris Mazar, Andreas Eder and Carsten Spengler
Ford Motor Company: Clay Maranville, Dan Demitroff, and Quazi Hussain
Faurecia Exhaust Systems: Rita Fehle, Robin Willats, Boris Kienle, and Ed Kinnaird
Amerigon/BSST/ZT Plus: Steve Davis, Dmitri Kossakovski, Eric Poliquin, Vladimir Jovovic, Joe Dean & Lon Bell & the rest of the Amerigon Team