thiessen e. image analysis in fish production
TRANSCRIPT

Image Analysis in FishProduction
Project:
Fish in vivo online Monitoring (FIVOM)for Flatfish-Aquacultur
in Cooperaton with bbe Moldaenke, KielFounded by ISH und EU
Eberhard Hartung and EIKO THIESSEN
Institute of Agricultural Engineering
AquaLife 2008
1st – 3rd July
Kiel

Introduction
Tillet et al, 2000
(Aquaculture, Fishery) AgricultureLivestock farming 1000 B.C. – Aquaculture today
n

Introduction
Definition•Aquatic organism (fish, shellfish, shrimp, algea)•Population is owned by the company
Versions•Fish farming in pond or raceway (carp, trout) in Freshwater•Nearshore net-contained (Salmon), ponds in mangrove (Shrimp) insaltwater•Onshore recirculating systems with filters (sturgeon, turbot)
Food for the carnivorous species made out of fish meal
Aquaculture

Turbotproduction
Ecomares, Büsum, Germany
In 1-2 years
1-2 kg
40 kg/m²
10 % newwater per day

High manual effort in recirculations systems
Problem
Fishsorting every fewweeks due to differentgrowing of fish
Size-distribution isunknown before sorting, i.e.date can be too early(homogenous distribution:needless stress and task)or too late(very heterogenous distribution:growth decrease of the smaller fish)
Monitoring the sizedistribution with acamera system

Image analysis in Aquaculture
• Size-measuring for management-decision (sorting–and slaughter date, feedsize and –amount, growth,heterogeneity)
• Automatic sorting (lock, picking belt)
• Behavior analysis (disease, feeding control)
Applications

Automatic, continuous estimation of the fish size
Development of a camerasystem for estimation the size (e.g.length, area, …) and derived parameter (weight) of flatfish ina well-defined distance
• Hardware:a) camerasystem optimised for recirculation systems
• Software:b) Database of the geometric parameters and weightc) Algorithm for fishdetection and measuring
Aims

TrialsCommercial plant: Ecomares, Büsum
Laboratory: ILV, Kiel
Material

Material & Methods
a) Camerasystems: Lab
Camera-Setups• Camera above water• Camera in glasbottombox• Underwatercamera
2. 3.
camera
1.
Validation in respect to accuracy, repeatability and suitability underchanging environmental conditions
camera mitfisheye-bjectiv
Light-proof boxwith transparentplate on bottom

Methods
b) Database: Commercial productionEntire basin (8 m x 8 m)Time lapse: some weeks, differentproduction phase
Expected results:Fish-distribution in the bassin, „haunts“
Typical shape and weight-relation
Single fishWeighing, measuring length andtaking a picture
Box with transparent bottom

Methods
c) Algorithm sequenceImage Analysis should estimate the size (length, area) auf singleunmoved turbot.
Therefor:
•Image acquisition optimised with lighting and placing
•Discarding of pictures with fish movement (Motiondetection withdifference-images)•Object-Extraction with imagefilters (edgedetection, thresholds)•Calibration in Real World Coordinates (i.e. cm-unit)
•Selection of fish shapes by means of typical geometric parameters
•Measuring (length, weight, …)
•Post-Processing (statistical analysis, ignore repeated measurements ofone fish)

Results
a) Validating the SetupsWell known referencefish was measured under different conditions
0.410.57
Without waves:0.75with waves:1.4
Accuracy mean quadr.deviation to reference[cm]
0.250.12
Without waves:0.32with waves:1.2
Repeatibility Stdev ofdifferent positions [cm]
Small area, onlyincreases with slope
Difficult to handle (20 kg),partly shadow, airbubbles on the bottom
Reflexion on the surface,image is disturbed due towaves
contra
No reflexionNo reflexionEasy installation, big areapro
1.151.351.45area [m²]
underwatercamera,slopedglasbottomboxcamera above bassin

Results
a) Light and camera
0
20
40
60
80
100
120
140
160
0 50 100 150 200 250 300 350 400 450 500
illuminance [lux]
mea
n gr
eyva
lue
[bits
]
typ. candlepower in production
difference
background
fish
Automatic brightness-controll leads to constant contrast inthe typical light conditions

Results
b) Distribution
Time lapse at Ecomares (every 5 min, 4 weeks)
Mean raw images mean analysed images(fish = white, background = black)

Spatial probability distribution 0 50 90 %
Results
b) distribution
Time lapse at Ecomares (every 5 min, 4 weeks)
Mean raw images
Results
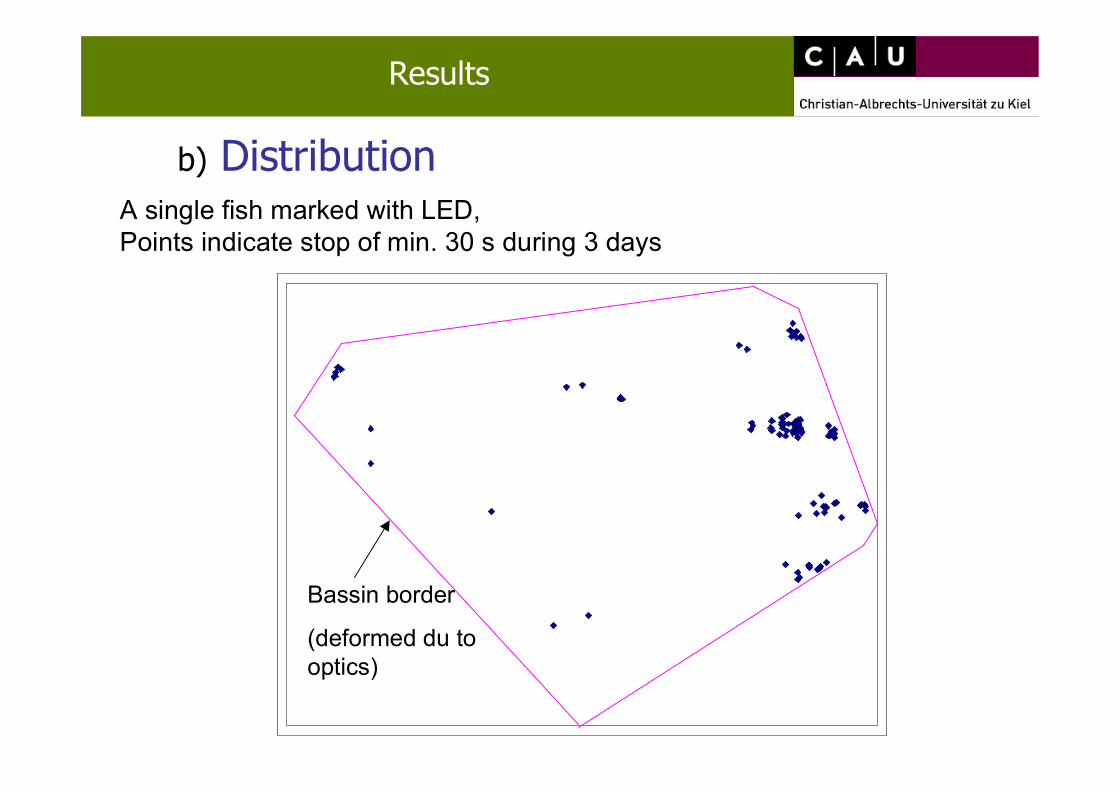
A single fish marked with LED,Points indicate stop of min. 30 s during 3 days
b) Distribution
Bassin border
(deformed du tooptics)

Results
b) Shape-weight-relationSingle fish weighed, length measured and image aquired
lengthy = 0.01x3.3
R2 = 0.98
areay = 0.036x1.6
R2 = 0.99
0
200
400
600
800
1000
1200
1400
1600
1800
2000
100 200 300 400 500 600 700 800 900
area [cm²]
wei
ght [
g]
0 5 10 15 20 25 30 35 40 45 50
length [cm]
n = 55

Results
b) Shape-parameter
L: length U: contour A: areaU²/F, F/L and U/L constant in thepopulation?
0
2
4
6
8
10
12
14
16
U²/L (Rundheit) F/L U/L
n=55
COV :16 % 22 % 7 %
Single fish weighed, length measured and image aquiredImages analysed concerning shape parameters

Results
c) MotiondetectionFishmovement was analysed with the stdev. in the difference from two
frames during feeding
0
1
2
3
4
5
6
7
8
9
10
0 10 20 30 40 50 60 70 80 90 100 110 120 130 140 150 160 170 180
time [s]
activ
ity (s
tdev
. diff
.)
still every 10 s feed
greyvalue, 1 s mean

Results
c) CalibrationPlate with points in defined distance is presentated to camera andcalibrationparameters (objectiv focus and distortion, position of thecamera in the real world coordinatesystem x, y, z, ß, ?) are calculatedfor transformation to cm-units
Raw image corrected image(projection in x-y-plane)

Realisation
c) Screen-ShotSoftware for calibration, objectdetection und –measuring anddocumentation programed in HDevelop
original difference +contours
corrected
Variables Source text
control

Summary and discussion
Automatic Image Analysis can reduce manuel effort in fishproduction andserves important information directly related to fish for the producingmanagement.
Underwatercamera minimises problems with watersurface and providesfishlength with an accuracy of better than 1 cm.
Turbots prefer the border of the bassin and changes position hourly over thewhole bassin.
Fishdetection works well with edgefilter but problems if fish overlap withsmall contrast.
Statistic for calculating the mean and variation of fishsize is influenced byrepeated measuremnet of the same fish

Thank you for your Attention!Dieses Projekt ist Teil von „e-region Schleswig-Holstein plus“,
ein Programm des Ministeriums für Wissenschaft, Wirtschaft und Verkehr und derInnovationsstiftung Schleswig-Holstein – gefördert von der ISH und der EU aus dem
Europäischen Fonds für Regionale Entwicklung (EFRE)
Institute of Agricultural Engineering

Fish „size“:
geometricparameters
Definition
Length L (longest distance along to fish axis )Width W (longest distance perpendicular to Length)Diameter D (longest distance in the area )Area AContour U (Outline of the fish)
U
L
A
W
D

Kamerasdigitale CMOS, Mono, 756x480 Pixeldigitale CCD, Farbe 640x480 und Mono 1280x960 PixelSony Analog CCD + FramegrabberObjektive12 + 16 mm C Mount F1.4 (Pentax)2.5 mm CS Mount F1.21.4 – 3.1 Vario CS Mount F1.4 (Fujinon)5 mm C Mount (Compar)FilterPol-, IR-Sperr- und DurchlassfilterPC und SoftwareIntel Pentium 4 @ 1.6 GHz und 768 MB Ram, Intel Pentium Dual-Coreund 2 x Intel Dual-Core Xeon @ 1.6 GHz und 2 GB RAMWindows XP und Halcon 7.1 (unterstützt Parallelprozessoren)
Bildanalyse (Datenaufnahme und –verarbeitung)
Material

Ergebnisse
b) Genauigkeit KameraKamera (55 Bilder) gegen Zollstock
y = 0.99x + 0.59R2 = 0.996
n = 55
15
20
25
30
35
40
45
15 20 25 30 35 40 45
Länge Zollstock [cm]
Läng
e K
amer
a [c
m]

Institut für Landwirtschaftliche Verfahrenstechnik

Institut für Landwirtschaftliche Verfahrenstechnik
RieselfilterI
Becken IIT, pH, Redox, O2, PegelSMS Alarm
Abfluss
PumpeOR6500
EHEIM2260
Druckluft
Eiw
eiss
absc
häum
er T
5000
PumpeOR2500
Strömungs-wächterATK
Aqu
aCris
tal
U
V-C
RieselfilterIIBecken I
1000 lKühlerT4000
Ozonisator

Institut für Landwirtschaftliche Verfahrenstechnik

Institut für Landwirtschaftliche Verfahrenstechnik