thorley (2010 vs 2005) - mag-umbraco-media-live.s3...
TRANSCRIPT

Date: 9 December 2010 Our ref: 10307/001/rp
A REPORT OF MONITORING OF AIRCRAFT NOISE FROM STANSTED AIRPORT
AT THORLEY, HERTFORDSHIRE BETWEEN JULY AND OCTOBER 2010 AND COMPARISON WITH A SIMILAR
STUDY IN 2005
carried out by R J Peters Employer: Stansted Airport Ltd
Report author: .....................................................
Dr. R. Peters
Principal Consultant
Approved by : …………………………………….
A. V. H. Holdich
Director
© Applied Acoustic Design 2010

Stansted Airport Ltd Aircraft Noise levels at Thorley, Herts, July to October 2010 ___________________________________________________________________________
_________________________________________________________________________________ Ref: 10307/001/rp Date: 09/12/10 Page 2 of 15
CONTENTS Executive Summary 3 1.0 Introduction 6 2.0 The data from the Noise Monitoring Terminal 6 3.0 Analysis of Noise Monitoring Survey Results 6 3.1 The numbers of aircraft noise events 6 3.2 Maximum noise levels of aircraft noise events 7 3.3 Durations and average noise levels of aircraft noise events 8 3.4 The Total noise climate at the site 8 3.5 The contribution of aircraft noise to the noise climate at the site 9 3.6 Putting the noise climate at the site into a wider UK context 10 3.7 Aircraft types contributing to aircraft noise events 12 4.0 Summary and Conclusions 13 Figures 1 - 9 Appendix 1: Map showing location of site Appendix 2: Data from the Noise monitoring Terminal Appendix 3: Explanation of acoustic terms Appendix 4: List of aircraft source identification codes

Stansted Airport Ltd Aircraft Noise levels at Thorley, Herts, July to October 2010 ___________________________________________________________________________
_________________________________________________________________________________ Ref: 10307/001/rp Date: 09/12/10 Page 3 of 15
Executive Summary
A mobile Noise Monitoring Terminal (NMT) was deployed by Stansted Airport between
6th July and 30th October 2010 at Thorley in Hertfordshire, on the southern outskirts of Bishop's Stortford, approximately 8 km South West of Stansted Airport. On days when aircraft are taking off from Stansted to the west, the site lies nearby the flight paths of departing aircraft.
The aim of this report is to present the results of this three month noise monitoring
exercise, to interpret the results in a way that places the contribution of the noise from aircraft using Stansted in the context of the overall noise climate from all other sources, and to compare results with an earlier noise monitoring exercise at the same site in 2005.
The NMT records noise data relating to all noise events which exceed a selected threshold noise level for a selected minimum period of time. These selected conditions were 60 dBA for 10 seconds.
These noise events are then compared by the airport's ANOMS (Airport Noise and
Operations Monitoring System) noise and track keeping computer system with radar tracks of aircraft arriving at or departing from Stansted Airport. Only those noise events which are matched with Stansted aircraft tracks are called aircraft noise events, and those that are not matched are designated as residual noise events. The remainder of the noise at the site, i.e. that noise which is not captured as noise events, (because it fails to meet the capture conditions of being above 60 dBA for 10 seconds) is also classified as residual noise.
Therefore wherever reference is made to aircraft noise events within this document it
should be understood that these relate only to aircraft using Stansted airport. Any noise arising from aircraft travelling to or from any other airport will be included as residual noise.
In addition to gathering data about noise events the NMT also collects and stores, on an
hourly basis, information about the total level of noise at the site from all sources.
A total of 14,687 aircraft noise events occurred during the approximate three month (98 day) survey period. Most of these aircraft noise events were due to departing aircraft, using the 22BZD (55 % of all events) and 22 DVR (19 %) departure routes, with arrivals accounting for 25% of the events. The number of aircraft noise events per day ranged from 54 to 196, with an average of 150 events per day. This distribution almost certainly reflects the day to day variation between easterly and westerly departure directions, determined by wind direction. The numbers of aircraft noise events per day did not show any obvious correlation with day of the week or weekends. The highest number of events per hour occurred in the morning between 06.00 and 09.00 hours, with lower peaks during the mid-day period between noon and 13.00 hours, and in the late afternoon between 17.00 and 19.00 hours, local time. During the busiest hours there were between 10 and 13 events per hour. The maximum noise level (LASmax) of aircraft noise events ranged from 60 dBA to 91 dBA, but for more than 90% of the events was below 72 dBA, with an overall average of 68 dBA. There were 199 events greater than 75 dBA and 23 events with a maximum noise level greater than 80 dBA.

Stansted Airport Ltd Aircraft Noise levels at Thorley, Herts, July to October 2010 ___________________________________________________________________________
_________________________________________________________________________________ Ref: 10307/001/rp Date: 09/12/10 Page 4 of 15
The average noise level (LAeq value) during aircraft noise events, which had an average duration of about 29 seconds, was 64 dBA. The total noise climate at the site may be characterised by average hourly values of various noise percentile levels, and by the average (or equivalent) noise level (LAeq). These values were fairly constant during the daytime, between 07.00 and 19.00 hours (with average values of LAS10 of 60 dBA, LAS90 of 47 dBA and LAeq of 57 dBA), but falling to lower levels in the late evening, night-time and early morning periods. The average value over the night-time period from 23.00 to 07.00 hours (LAeq values) was 52 dBA, and for the evening period from 19.00 to 23.000 hours was 56 dBA. The daily average (LAeq) level of the total noise at the site is a combination of that due to aircraft noise events and that due to residual noise. On average over the 3 month period the level of the residual noise (55 dBA) was about 2 dB below that of the total noise level (57 dBA) with aircraft noise level on average a further 2 dBA below, at 53 dBA.. Therefore the noise from aircraft noise events, when cumulatively averaged over an extended period of time (of hours, days or weeks) makes a significant but not a dominant contribution to the average level of total noise at the site, with noise from all other sources, i.e. the residual noise, making a greater contribution. However each individual aircraft noise event, whenever it occurs, is likely to be clearly audible and distinguishable from the residual noise because, in addition to being different in character, it results in a noticeable increase in the level of the ambient noise by 10 dBA
It is possible to convert the hourly LAeq values into the 24 hour Lden noise index (day evening night level) used by Defra for noise mapping purposes, giving, on the basis of the data collected at this site over the three months period, an Lden value for the total noise of 60 dBA and of 56 dBA for the aircraft noise.
In order to place the noise climate at the site in a wider UK context the noise levels from the NMT have been compared with the results of the National Noise Index survey of noise levels in the UK in 2000, with World Health Organisation Guidelines, and with Stansted Airport aircraft noise contours. Although 84 different aircraft types were involved in the total of 14,687 aircraft noise events, two aircraft types accounted for more than 80% of the events: Boeing 737- 800: 9,021 events (61.4%), and Airbus A319: 3238 events (22.0 %), and only five aircraft types accounted for more than 90% of the events. The average maximum noise level (LASmax) during aircraft noise events did not vary significantly with aircraft type for the relatively few aircraft types which make up most of the aircraft noise events. Although there are some aircraft types which produce significantly higher values of LASmax there are only very small numbers of these types of events.
A comparison of the results with those from the 2005 survey indicates that there has not been any significant change in the noise climate at the site.
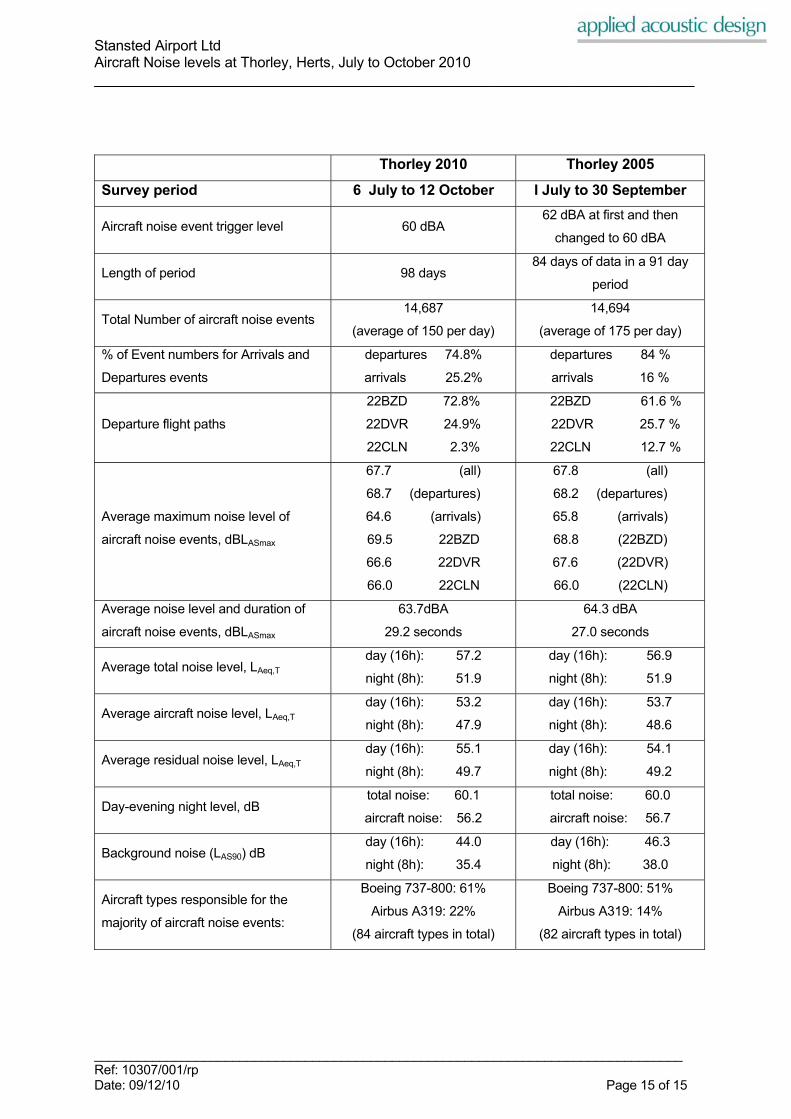
A summary of the main noise related parameters (three monthly averages) for the
period from 6th July to 12th October 2010, at Thorley are shown in the Table below, together with a comparison of similar data for the 2005 survey.

Stansted Airport Ltd Aircraft Noise levels at Thorley, Herts, July to October 2010 ___________________________________________________________________________
_________________________________________________________________________________ Ref: 10307/001/rp Date: 09/12/10 Page 5 of 15
The information presented in this report will serve as a baseline for comparison with
any future noise level surveys that may be undertaken at this location.
Thorley 2010 Thorley 2005
Survey period 6 July to 12 October I July to 30 September
Aircraft noise event trigger level 60 dBA 62 dBA at first and then
changed to 60 dBA
Length of period 98 days 84 days of data in a 91 day
period
Total Number of aircraft noise events 14,687
(average of 150 per day)
14,694
(average of 175 per day)
% of Event numbers for Arrivals and
Departures events
departures 74.8%
arrivals 25.2%
departures 84 %
arrivals 16 %
Departure flight paths
22BZD 72.8%
22DVR 24.9%
22CLN 2.3%
22BZD 61.6 %
22DVR 25.7 %
22CLN 12.7 %
Average maximum noise level of
aircraft noise events, dBLASmax
67.7 (all)
68.7 (departures)
64.6 (arrivals)
69.5 22BZD
66.6 22DVR
66.0 22CLN
67.8 (all)
68.2 (departures)
65.8 (arrivals)
68.8 (22BZD)
67.6 (22DVR)
66.0 (22CLN)
Average noise level and duration of
aircraft noise events, dBLASmax
63.7dBA
29.2 seconds
64.3 dBA
27.0 seconds
Average total noise level, LAeq,T day (16h): 57.2
night (8h): 51.9
day (16h): 56.9
night (8h): 51.9
Average aircraft noise level, LAeq,T day (16h): 53.2
night (8h): 47.9
day (16h): 53.7
night (8h): 48.6
Average residual noise level, LAeq,T day (16h): 55.1
night (8h): 49.7
day (16h): 54.1
night (8h): 49.2
Day-evening night level, dB total noise: 60.1
aircraft noise: 56.2
total noise: 60.0
aircraft noise: 56.7
Background noise (LAS90) dB day (16h): 44.0
night (8h): 35.4
day (16h): 46.3
night (8h): 38.0
Aircraft types responsible for the
majority of aircraft noise events:
Boeing 737-800: 61%
Airbus A319: 22%
(84 aircraft types in total)
Boeing 737-800: 51%
Airbus A319: 14%
(82 aircraft types in total)

Stansted Airport Ltd Aircraft Noise levels at Thorley, Herts, July to October 2010 ___________________________________________________________________________
_________________________________________________________________________________ Ref: 10307/001/rp Date: 09/12/10 Page 6 of 15
1.0 Introduction 1.1 A mobile Noise Monitoring Terminal (NMT) has been deployed by Stansted Airport for
an approximate three month period from 06 July to 12 October 2010. 1.2 The NMT was sited at Thorley in Hertfordshire, on the southern outskirts of Bishop's
Stortford, approximately 8 km South West of Stansted Airport. It was located in the rear garden of one of a row of residential properties which extend to the railway line between Cambridge and London Liverpool Street stations. The NMT was approximately 80 metres from the railway line and approximately 65 metres from the B1383 road at the front of the properties. In addition to noise from aircraft the other main source of noise at the site was from trains (including train horns) and there was also some noise from road traffic and from domestic activities. A map showing the location (indicated by an arrow) is presented in Appendix 1. On days when aircraft are taking off from Stansted to the west, the site lies nearby aircraft departure routes.
1.3 An NMT had previously been deployed at the same site and with the microphone at the
same location in 2005 between 1 July and 30 September. 1.4 The aims of this report are:
• to present the results of the three month 2010 noise monitoring survey, and • to interpret the results in a way that places the contribution of the noise from
passing aircraft using Stansted airport in the context of the overall noise climate from all other sources, and
• to compare the results of the 2005 and 2010 surveys; • To provide a baseline for comparison with any future noise surveys in this
format that may be undertaken at this location. 1.5 A glossary of technical terms used in this report is given in Appendix 3. 2.0 Data from the Noise Monitoring Terminal 2.1 The Noise monitoring Terminal (NMT) gathers data about the number and level of
aircraft noise events, and also data about the total level of noise at the site, on an hourly basis. The hourly values of total noise are a combination of the noise from the aircraft noise events and from all other noise sources, called residual noise.
2.2 Further details about the way the NMT gathers and processes noise data is given in
Appendix 2. 3.0 Analysis of Noise Monitoring Survey Results 3.1 The numbers of aircraft noise events 3.1.1 A total of 14,687 aircraft noise events were recorded at the site during the three month
period; 3,732 in July (6th to 31st), 4,665 in August, 4,546 in September and 1,744 in October (1st to 12th).
3.1.2 The majority of these aircraft noise events were due to departing aircraft (75%); with
25% due to arrivals. The majority of the departures (73%) were from departure route 22 BZD with 25% from departure route 22 DVR and 2% from route 22CLN.

Stansted Airport Ltd Aircraft Noise levels at Thorley, Herts, July to October 2010 ___________________________________________________________________________
_________________________________________________________________________________ Ref: 10307/001/rp Date: 09/12/10 Page 7 of 15
3.1.3 Figure 1 shows the total number of aircraft noise events occurring each day during the 3 months period from 6th July to 12th October 2010. There was no obvious correlation between the number of aircraft noise events and the day of the week or weekend. The number of aircraft noise events per day ranged from 54 to 196, with an average of 150 events per day over the approximate three month (98 day) period. This distribution almost certainly reflects the day to day variation between easterly and westerly departure directions, determined by wind direction.
3.1.4 Figure 2 indicates the average distribution of numbers of aircraft noise events
throughout the 24 hour day. The highest number of events per hour occurred in the morning between 06.00 and 09.00 hours, with lower peaks during the mid-day period between noon and 13.00 hours, and in the late afternoon between 17.00 and 19.00 hours, local time. During the busiest hours there were between 10 and 13 events per hour.
3.2 Maximum noise levels of aircraft noise events 3.2.1 The NMT recorded the maximum noise level (measured using the 'A' frequency
weighting and the Slow (S) time weighting) produced by each aircraft noise event, (LASmax). These values ranged from 60 dBA to 91 dBA, but more than 90% of the events have maximum noise levels in the range between 62 and 72 dBA, with an overall average of 67.7 dBA.
3.2.2 There was a significant difference between the maximum noise levels of aircraft noise
events arising from departures (average 68.7 dBA) and arrivals (average 64.6 dBA), and, among departing aircraft, for those using the different departure routes: 22BZD (average 69.5 dBA), 22DVR (average 66.6 dBA) and 22CLN(average 66.0 dBA).
3.2.3 Figure 3 indicates the average LASmax value of aircraft noise events recorded each day
during the three month monitoring period. Figure 4 shows the variation of average hourly value of LASmax value for the three month period. Figure 5 shows a statistical distribution of LASmax values for the three month period.
3.2.4 It can be seen from Figure 3 that the average maximum level per day ranged between
63 dBA and 69 dBA. 3.2.5 The variation of average maximum value of aircraft noise events by hour of day (Figure
4) shows similar range i.e. between 64 dBA and 70 dBA. The two highest hourly averages, of 70 dBA, which occurred between 01.00 and 02.00 hours and between 05.00 and 06.00 hours in the morning correspond, according to Figure 2, to a relatively small number of events: on average less than 2 events per day between 01.00 and 02.00 hours and to less than one event per day between 05.00 and 06.00 hours each day.
3.2.6 Figure 5 shows that the maximum noise levels of most aircraft noise events (more than
90% of events) lie between 62 and 72 dBA, and that 99% of values are below 76 dBA. There are 199 events (out of a total of 14687) with a maximum noise level greater than 75 dBA, and 23 events with a maximum noise level greater than 80 dBA.
3.2.7 A comparison of the data for the 2005 and 2010 surveys indicates that the numbers of
aircraft noise events, their distribution day by day and hour by hour, and their range of maximum noise levels were broadly similar in 2010 and 2005. More detailed numerical comparisons are given in the Summary Comparison Table at the end of section 4 of this Report.

Stansted Airport Ltd Aircraft Noise levels at Thorley, Herts, July to October 2010 ___________________________________________________________________________
_________________________________________________________________________________ Ref: 10307/001/rp Date: 09/12/10 Page 8 of 15
3.3 Durations and average noise levels of aircraft noise events 3.3.1 The duration of 90% of aircraft noise events was between 10 seconds and 40 seconds,
with an average value for all events of 29 seconds. 3.3.2 In addition to LASmax values the NMT also recorded the Single Event Noise Level (SEL)
for each aircraft noise event. This parameter relates to the amount of sound energy in each event, and may be used to calculate the average noise level, or LAeq value, over the event duration. These LAeq values ranged from 59 to 80 dBA but with an average value of 64 dBA.
3.3.3 Thus a typical aircraft noise event might represent an average noise level of about 64
dBA for about 29 seconds, but varying within the 29 seconds, between the trigger level of 60 dBA and the average maximum value of 68 dBA.
3.3.4 A comparison of the data from the 2005 and 2010 surveys indicates that the durations
and average noise levels during aircraft noise events were broadly similar in 2010 and 2005. More detailed numerical comparisons are given in the Summary Comparison Table at the end of section 4 of this Report.
3.4 The total noise climate at the site 3.4.1 The NMT also recorded the total noise level (i.e. from all sources, including aircraft and
residual noise events) each hour, measured in terms of the hourly values of LAeq (representing the average noise level over the hour) and the following statistical percentile levels: LAS1, LAS10, LAS50, LAS90 and LAS99, where, for example LAS10 is the noise level (measured using the 'A' frequency weighting (i.e. in dBA) and the Slow (S) time weighting) exceeded for 10% of the 1 hour measurement time interval. Figure 6 shows these values averaged over the three month noise survey period for each hour of the day.
3.4.2 It can be seen from Figure 6 that the value of each index is fairly constant from about
06.00 hours to 19.00 hours but then falls off outside these times (i.e. in the late evening, night-time and early morning periods).
3.4.3 The average values of the various noise indices over various parts of the 24 hour day
(day, evening, night etc.) are shown below. For all these periods the indices were calculated from the relevant hourly levels, using arithmetic averages in the case of the statistical levels and logarithmic averages for the LAeq indices. For comparison, values from the 2005 survey are shown in brackets (except for the L1 values which were not available in the 2005 data).
Noise level, dBA
Noise climate index
Day (07.00-19.00)
Evening (19.00-23.00)
Night (23.00-07.00)
Day and Evening
(07.00-23.00)
24 hours
L1 67.8 67.5 60.9 67.7 65.4 L10 59.9 (60.4) 58.7 (58.9) 49.9 (50.2) 59.6 (60.0) 56.3 (56.8) L50 50.7 (50.7) 48.4 (49.0) 42.4 (42.6) 50.1 (50.3) 47.5 (47.7) L90 47.1 (46.8) 44.6 (44.9) 37.9 (38.0) 46.4 (46.3) 43.6 (43.6) L99 44.7 (44.1) 42.2 (42.4) 35.4 (35.7) 44.0 (43.7) 41.2 (41.0)
Leq 57.5 (57.1) 56.3 (56.2) 51.9 (51.9) 57.2 (56.9) 56.1 (55.8)

Stansted Airport Ltd Aircraft Noise levels at Thorley, Herts, July to October 2010 ___________________________________________________________________________
_________________________________________________________________________________ Ref: 10307/001/rp Date: 09/12/10 Page 9 of 15
It can be seen from the above table that the values of the various noise climate indices were very similar for both the 2005 and 2010 surveys.
3.4.4 Since Figure 6 shows that, on average, the noise levels at the site do not vary much
from hour to hour in the daytime they are unlikely to vary much within each hour, and so the data shown in Figure 6, and particularly the LAeq values, could be used as a good indication of 30 minute LAeq values, required in Building Bulletin 93 for the assessment of noise climates near to schools in the vicinity.
3.4.5 For a period of one hour the value of the LAS10 noise index is the noise level exceeded
for 6 minutes in that hour, and value of the LAS90 noise index is the noise level exceeded for 54 minutes in the hour, so that noise levels at or below the LAS90 value occur for 6 minutes in the hour. Thus Figure 6 shows that for a typical hour in the daytime (07.00 to 19.00 hours) the total noise level over the entire hour at this site would exceed 60 dBA (LA10 value) for 6 minutes, and would be below 47 dBA (LA90 value) for 6 minutes, and would therefore be between 47 and 60 dBA for 48 minutes of the hour.
3.4.6 The UK Government Department, Defra, has used the 24 hour Lden noise index (day
evening night level) for noise mapping purposes. This index is based on average levels of aircraft noise (LAeq values) throughout the day but with a weighting penalty of 5 dB applied to noise in the evening (19.00 hours to 23.00 hours) and a 10 dB penalty at night-time (23.00 hours to 07.00 hours). It is possible to convert the hourly LAeq values displayed in Figure 6 and in the above Table into an Lden value for the total noise at the site, of 60.1 dBA (and 60.0 dBA in 2005).
3.5 The contribution of aircraft noise events to the total noise climate at the site 3.5.1 By using the Single Event Noise Level (SEL) for each aircraft noise event it is possible
to calculate the average, or equivalent aircraft noise level (LAeq) due to aircraft noise events over a period of time (hour, day or month). Although this average noise level bears little relationship to the aircraft noise as heard, which occurs in short bursts of noise at higher levels rather than as a lower continuous average level, it is, nevertheless, a useful parameter for comparative purposes.
3.5.2 Since the NMT also records hourly LAeq values of the total noise from the site it is
possible, by subtracting the aircraft noise level from the total noise level (using the decibel (or logarithmic) subtraction process which is appropriate in this case) to calculate the remaining component of the total noise, i.e. the residual noise level.
3.5.3 The residual noise is a combination of the noise from residual noise events (i.e. those
captured noise events which did not match with aircraft movements) and from other residual noise, not captured as noise events, i.e. all other noise recorded by the monitor that did not exceed the trigger level for the required minimum time period.
3.5.4 Figure 7 shows the values of the levels of total noise, aircraft noise and residual noise
averaged over the three month noise survey period for each hour of the day, together with the background noise level (LAS90). The Table below shows the levels of total, aircraft and residual noise averaged over the various parts of the 24 hour day (day, evening, night etc.), with values from the 2005 survey shown in brackets.

Stansted Airport Ltd Aircraft Noise levels at Thorley, Herts, July to October 2010 ___________________________________________________________________________
_________________________________________________________________________________ Ref: 10307/001/rp Date: 09/12/10 Page 10 of 15
Average Noise level (LAeq value), dBA
Day (07.00-19.00)
Evening (19.00-23.00)
Night (23.00-07.00)
Day and Evening
(07.00-23.00)
24 hours
Total noise 57.5 (57.1) 56.3 (56.2) 51.9 (51.9) 57.2 (56.9) 56.1 (55.8) Aircraft noise 53.3 (54.0) 52.9 (53.1) 47.9 (48.6) 53.2 (53.7) 52.0 (52.6)
Residual noise
55.4 (54.3) 53.7 (53.4) 49.7 (49.2) 55.1 (54.1) 53.9 (53.0)
It can be seen from the Table that the values of the various noise indices were broadly similar for both the 2005 and 2010 surveys.
3.5.5 It can also be seen that on average over the 3 month period the level of the residual
noise was about 2 dB below that of the total noise level with aircraft noise level on average a further 2 dBA below.
3.5.6 This shows that when the noise from aircraft noise events is cumulatively averaged
over an extended period of time (of hours, days or weeks) it makes a significant but not a dominant contribution to the average level of total noise at the site, with noise from all other sources, i.e. the residual noise, making a greater contribution. However each individual aircraft noise event, whenever it occurs, is likely to be clearly audible and distinguishable from the residual noise because, in addition to being different in character, it results in a noticeable increase in the level of the ambient noise by 10 dBA or more for a period of about 29 seconds.
3.6 Putting the noise climate at the site into a wider UK context National Noise Incidence Study 3.6.1 The National Noise Incidence Study of noise levels in England and Wales in 2000
carried out by the Building Research Establishment for Defra gave a breakdown of the proportion of residents exposed to noise, as follows:
Proportion of the population of England and Wales living in dwellings exposed to daytime noise levels (LAeq, 16 hour) in 5 dB bands, in the 2000 National Noise Incidence Study
5 dB noise exposure level bands* Proportion in band Less than 50 dBA 30%
50 dBA < L < 55 dBA 37% 55 dBA < L < 60 dBA 18% Greater than 60 dBA 15%
*The noise level exposure bands in the above Table are for 'free field ' noise levels, i.e. noise
levels unaffected by sound reflections from nearby surfaces. All the noise levels from the NMT at Thorley are also free field values.
3.6.2 From the Table in paragraph 3.5.4 the 16 hour LAeq value for total noise at this site is
57 dBA, which puts the site in the 'Less than 60 but greater than 55 dBA' noise exposure band, occupied by 18 % of dwellings in England and Wales. It can also be seen that without the contribution from aircraft noise the 16 hour LAeq value for residual noise at this site was 55.1 dBA, in which case the site would (just) remain in the same noise exposure band.
3.6.3 The National Noise Incidence Study of noise levels was extended in 2002 to cover the
entire UK and also to include the Lden index as shown below:

Stansted Airport Ltd Aircraft Noise levels at Thorley, Herts, July to October 2010 ___________________________________________________________________________
_________________________________________________________________________________ Ref: 10307/001/rp Date: 09/12/10 Page 11 of 15
Proportion of UK population living in dwellings exposed to noise levels in 5 dB bands, according to the Lden noise index, in the National Noise Incidence Study 2002 5 dB noise exposure level bands** Proportion in band Less than 55 dBA 33% 55 dBA < L < 60 dBA 38% 60 dBA < L < 65 dBA 16% Greater than 65 dBA 13%
**The noise level exposure bands in the above Table are for noise levels measured at 1m from
a building facade, and so will include a contribution (assumed to be 3 dBA) from sound reflected from the facade of the building. All the noise levels from the NMT are free field values and therefore 3 dB must be added for them to be comparable with the exposure bands in the above Table.
3.6.4 Since the Lden value for the total noise at this site is 60 dBA (paragraph 3.4.6) the
addition of 3dB (i.e. a facade level of 63 dBA) puts the site in 'Less than 65 but greater than 60 dBA' noise exposure band, occupied by 16 % of dwellings in the UK.
World Health Organisation and PPG 24 Guidance on Community Noise 3.6.5 In 2000 the World Health Organisation issued 'Guidelines for Community Noise', which
are reflected in the UK Planning Policy Guidance Note 24 (Annex 2, paragraph 4): that ''general daytime outdoor noise levels of less than 55 dBA are desirable to prevent significant community annoyance'' and that ''at night, sound pressure levels at the outside façades of living spaces should not exceed 45 dB (LAeq) so that people may sleep with bedroom windows open.''
3.6.6 The National Noise Incidence Study 2000 has estimated that 55% of the population of
England and Wales live in dwellings exposed to day-time noise levels above the WHO level of 55 dB LAeq,16h, and that 68% are exposed to night-time levels above the WHO level of 45 LAeq, 8h.
3.6.7 The total noise exposure levels at this site based on the data collected during this 3
month noise survey period, (shown in the Table in paragraph 3.5.4) are an LAeq,16h of 57.2 dBA in the daytime and 51.9 dBA LAeq, 8h.at night-time. The noise levels at the site are therefore above both the WHO Guideline of 55 dBA in the daytime, and the night-time Guideline value of 45 dBA. Without the contribution from aircraft noise events the noise at the site would be the residual noise level, of 55.1 dBA in the daytime and 49.7 dBA at night-time (from Table in paragraph 3.5.4). In this case the level of residual noise at the site would be (just) above the WHO daytime guideline level for the daytime and also well above the night-time guideline level.
Aircraft noise contours 3.6.8 The UK government produces annual contours of predicted aircraft noise levels around various UK airports, including Stansted. The contours show the predicted values of the daytime 16 hour (07.00 to 23.00 hours) LAeq values produced by aircraft in flight, in 3 dB bands, from 73 dBA (closest to the airport) to an outer contour value of 57 dBA.
3.6.9 Based on research the Government has used 57dBA Leq as the level of daytime noise marking the approximate onset of significant community annoyance. The relationship between noise and annoyance is of course not an exact one, and varies according to individuals and locations.

Stansted Airport Ltd Aircraft Noise levels at Thorley, Herts, July to October 2010 ___________________________________________________________________________
_________________________________________________________________________________ Ref: 10307/001/rp Date: 09/12/10 Page 12 of 15
3.6.10 Although it is interesting to compare the Aircraft noise levels derived from the NMT data at this site with the published contours for Stansted, in making any such comparisons it must be borne in mind that the contours are based on the average summer day, where 'summer' is the 92-day period from 16 June to 15 September, and 'day' is the 16-hour period 0700-2300 (local time), whereas the aircraft noise levels in this report are for the three month period, from July to October 2010.
3.6.11 The published contours for Stansted Airport for 2007 and 2008 (ERCD Report 0903) show that the site at Thorley lies just outside the outermost 57 dBA contour, by less than 1kilometre. Monitoring data from this study shows that the measured 16 hour daytime aircraft noise LAeq value for the three month period (paragraph 3.5.4) was 53 dBA.
3.6.12 Contours of aircraft noise Lden were also produced for the year 2006 (ERCD Report
0708) to meet the requirements of the first round noise mapping exercise under EU Directive 2002/49/EC. These contours were produced in 5 dB steps with the lowest (outermost contour) being for Lden of 55 dBA and were based on data for an average day over the whole year (2006). Although it is interesting to compare the Lden value for aircraft noise, calculated from the values presented in this report with the published contours, it should be noted that the contours and the measured values are based on two different periods of time, for which the modal split may be different, and which will involve different numbers and types of aircraft noise events. The contour map shows that the site at Thorley lies approximately half way between the 55 dBA and the 60 dBA Lden contours. The value of Lden calculated from the values of aircraft noise level given in paragraph 3.5.4 for the three month period October to December 2009 is 56 dBA.
3.6.13 Contours of noise exposure for the night-time period, Lnight (LAEq,8h), were also produced
for 2006 at Stansted on the same basis as for the Lden contours. This contour map shows that the site at Thorley lies just outside the lowest 50 dBA LAEq,8h contour. Monitoring data from this study shows that the measured 8 hour night-time aircraft noise LAeq value for the three month period (paragraph 3.5.4) was 48 dBA.
3.6.13 It is intended that the next round of noise mapping and Lden contours will be carried out
for the year 2011. 3.7 The contribution of different aircraft types to aircraft noise at the site 3.7.1 Eighty four different aircraft types contributed to the total number of 14,687 aircraft
noise events which occurred during the three month period, but most of the events arose from a relatively small number of aircraft types, with only two types being responsible for more than 80% of all aircraft noise events at the site:
• Boeing 737 - 800: 61% • Airbus A319: 22%
3.7.2 Figure 8 shows the numbers of events from the 26 most common types of aircraft for
which there were more than 10 events in the three month period. Also shown are the numbers of a further 20 less frequent but noisier types for which the average value of LASmax was greater than 70 dBA. Each aircraft type shown in Figure 8 is described by a 3 character source code. A list of these codes is given in Appendix 4.
3.7.3 Figure 9 shows the average maximum aircraft noise level LASmax value for each aircraft
types shown in Figure 8. It can be seen that the average maximum noise level (LASmax) of aircraft noise events did not vary significantly with aircraft type for the relatively few

Stansted Airport Ltd Aircraft Noise levels at Thorley, Herts, July to October 2010 ___________________________________________________________________________
_________________________________________________________________________________ Ref: 10307/001/rp Date: 09/12/10 Page 13 of 15
aircraft types which make up most of the aircraft noise events. Although there are some aircraft types which produce significantly higher values of LASmax there are only very small numbers of these types of events.
4.0 Summary and Conclusions 4.1 A total of 14,687 aircraft noise events occurred during the approximate three month (98
day) survey period. Most of these aircraft noise events were due to departing aircraft, using the 22 BZD (55 % of all events) and 22 DVR (19 %) departure routes, with arrivals accounting for 25% of the events. The number of aircraft noise events per day ranged from 54 to 196, with an average of 150 events per day. This distribution almost certainly reflects the day to day variation between easterly and westerly departure directions, determined by wind direction.
4.2 The numbers of aircraft noise events per day did not show any obvious correlation with
day of the week or weekends. The highest number of events per hour occurred in the morning between 06.00 and 09.00 hours, with lower peaks during the mid-day period between noon and 13.00 hours, and in the late afternoon between 17.00 and 19.00 hours, local time. During the busiest hours there were between 10 and 13 events per hour.
4.3 The maximum noise level (LASmax) of aircraft noise events ranged from 60 dBA to 91
dBA, but for more than 90% of the events was below 72 dBA, with an overall average of 68 dBA. There were 199 events greater than 75 dBA and 23 events with a maximum noise level greater than 80 dBA.
4.4 The average noise level (LAeq value) during aircraft noise events, which had an average
duration of about 29 seconds, was 64 dBA.
4.5 The total noise climate at the site may be characterised by average hourly values of various noise percentile levels, and by the average (or equivalent) noise level (LAeq). These values were fairly constant during the daytime, between 07.00 and 19.00 hours (with average values of LAS10 of 60 dBA, LAS90 of 47 dBA and LAeq of 57 dBA), but falling to lower levels in the late evening, night-time and early morning periods. The average value over the night-time period from 23.00 to 07.00 hours (LAeq values) was 52 dBA, and for the evening period from 19.00 to 23.000 hours was 56 dBA.
4.6 The daily average (LAeq) level of the total noise at the site is a combination of that due to
aircraft noise events and that due to residual noise. On average over the 3 month period the level of the residual noise (55 dBA) was about 2 dB below that of the total noise level (57 dBA) with aircraft noise level on average a further 2 dBA below, at 53 dBA..
4.7 Therefore the noise from aircraft noise events, when cumulatively averaged over an
extended period of time (of hours, days or weeks) makes a significant but not a dominant contribution to the average level of total noise at the site, with noise from all other sources, i.e. the residual noise, making a greater contribution. However each individual aircraft noise event, whenever it occurs, is likely to be clearly audible and distinguishable from the residual noise because, in addition to being different in character, it results in a noticeable increase in the level of the ambient noise by 10 dBA
4.8 It is possible to convert the hourly LAeq values into the 24 hour Lden noise index (day
evening night level) used by Defra for noise mapping purposes, giving, on the basis of

Stansted Airport Ltd Aircraft Noise levels at Thorley, Herts, July to October 2010 ___________________________________________________________________________
_________________________________________________________________________________ Ref: 10307/001/rp Date: 09/12/10 Page 14 of 15
the data collected at this site over the three months period, an Lden value for the total noise of 60 dBA and of 56 dBA for the aircraft noise.
4.9 In order to place the noise climate at the site in a wider UK context the noise levels
from the NMT have been compared with the results of the National Noise Index survey of noise levels in the UK in 2000, with World Health Organisation Guidelines, and with Stansted Airport aircraft noise contours.
4.10 Although 84 different aircraft types were involved in the total of 14,687 aircraft noise
events, two aircraft types accounted for more than 80% of the events: Boeing 737- 800: 9021 events (61.4%), and Airbus A319: 3238 events (22.0 %), and only five aircraft types accounted for more than 90% of the events.
4.11 The average maximum noise level (LASmax) during aircraft noise events did not vary
significantly with aircraft type for the relatively few aircraft types which make up most of the aircraft noise events. Although there are some aircraft types which produce significantly higher values of LASmax there are only very small numbers of these types of events.
4.12 A comparison of the results with those from the 2005 survey indicates that there has
not been any significant change in the noise climate at the site.
4.13 A summary of the main noise related parameters (three monthly averages) for the period from 6th July to 12th October 2010, at Thorley are shown in the Table below, together with a comparison of similar data for the 2005 survey.
4.14 The information presented in this report is summarised in the table overleaf and will
serve as a baseline for comparison with any future noise level surveys that may be undertaken at this location.
Stansted Airport Ltd Aircraft Noise levels at Thorley, Herts, July to October 2010 ___________________________________________________________________________
_________________________________________________________________________________ Ref: 10307/001/rp Date: 09/12/10 Page 15 of 15
Thorley 2010 Thorley 2005
Survey period 6 July to 12 October I July to 30 September
Aircraft noise event trigger level 60 dBA 62 dBA at first and then
changed to 60 dBA
Length of period 98 days 84 days of data in a 91 day
period
Total Number of aircraft noise events 14,687
(average of 150 per day)
14,694
(average of 175 per day)
% of Event numbers for Arrivals and
Departures events
departures 74.8%
arrivals 25.2%
departures 84 %
arrivals 16 %
Departure flight paths
22BZD 72.8%
22DVR 24.9%
22CLN 2.3%
22BZD 61.6 %
22DVR 25.7 %
22CLN 12.7 %
Average maximum noise level of
aircraft noise events, dBLASmax
67.7 (all)
68.7 (departures)
64.6 (arrivals)
69.5 22BZD
66.6 22DVR
66.0 22CLN
67.8 (all)
68.2 (departures)
65.8 (arrivals)
68.8 (22BZD)
67.6 (22DVR)
66.0 (22CLN)
Average noise level and duration of
aircraft noise events, dBLASmax
63.7dBA
29.2 seconds
64.3 dBA
27.0 seconds
Average total noise level, LAeq,T day (16h): 57.2
night (8h): 51.9
day (16h): 56.9
night (8h): 51.9
Average aircraft noise level, LAeq,T day (16h): 53.2
night (8h): 47.9
day (16h): 53.7
night (8h): 48.6
Average residual noise level, LAeq,T day (16h): 55.1
night (8h): 49.7
day (16h): 54.1
night (8h): 49.2
Day-evening night level, dB total noise: 60.1
aircraft noise: 56.2
total noise: 60.0
aircraft noise: 56.7
Background noise (LAS90) dB day (16h): 44.0
night (8h): 35.4
day (16h): 46.3
night (8h): 38.0
Aircraft types responsible for the
majority of aircraft noise events:
Boeing 737-800: 61%
Airbus A319: 22%
(84 aircraft types in total)
Boeing 737-800: 51%
Airbus A319: 14%
(82 aircraft types in total)

Figure 1: Number of aircraft noise events at Thorley, Herts, each day from 06 July to 12 October 2010
0
50
100
150
200
250
Tue‐06‐Jul
Tue‐13‐Jul
Tue‐20‐Jul
Tue‐27‐Jul
Tue‐03‐Aug
Tue‐10‐Aug
Tue‐17‐Aug
Tue‐24‐Aug
Tue‐31‐Aug
Tue‐07‐Sep
Tue‐14‐Sep
Tue‐21‐Sep
Tue‐28‐Sep
Tue‐05‐Oct
Tue‐12‐Oct
day / month
Num
ber
of E
vent
s ea
ch d
ay

Figure 2: Average number of aircraft noise events per hour of the day at Thorley, Herts, from 06 July to 12 October 2010
0
2
4
6
8
10
12
14
0 1 2 3 4 5 6 7 8 9 10 11 12 13 14 15 16 17 18 19 20 21 22 23
Hour of Day
Ave
rage
num
ber
of e
vent
s d
urin
g e
ach
hour

Figure 3: Average value of maximum noise levels of aircraft noise events at Thorley, Herts, each day from 06 July to 12 October 2010
60.0
61.0
62.0
63.0
64.0
65.0
66.0
67.0
68.0
69.0
70.0
Tue‐06‐Jul
Tue‐13‐Jul
Tue‐20‐Jul
Tue‐27‐Jul
Tue‐03‐Aug
Tue‐10‐Aug
Tue‐17‐Aug
Tue‐24‐Aug
Tue‐31‐Aug
Tue‐07‐Sep
Tue‐14‐Sep
Tue‐21‐Sep
Tue‐28‐Sep
Tue‐05‐Oct
Tue‐12‐Oct
day / month
Noi
se le
vel /
dBA
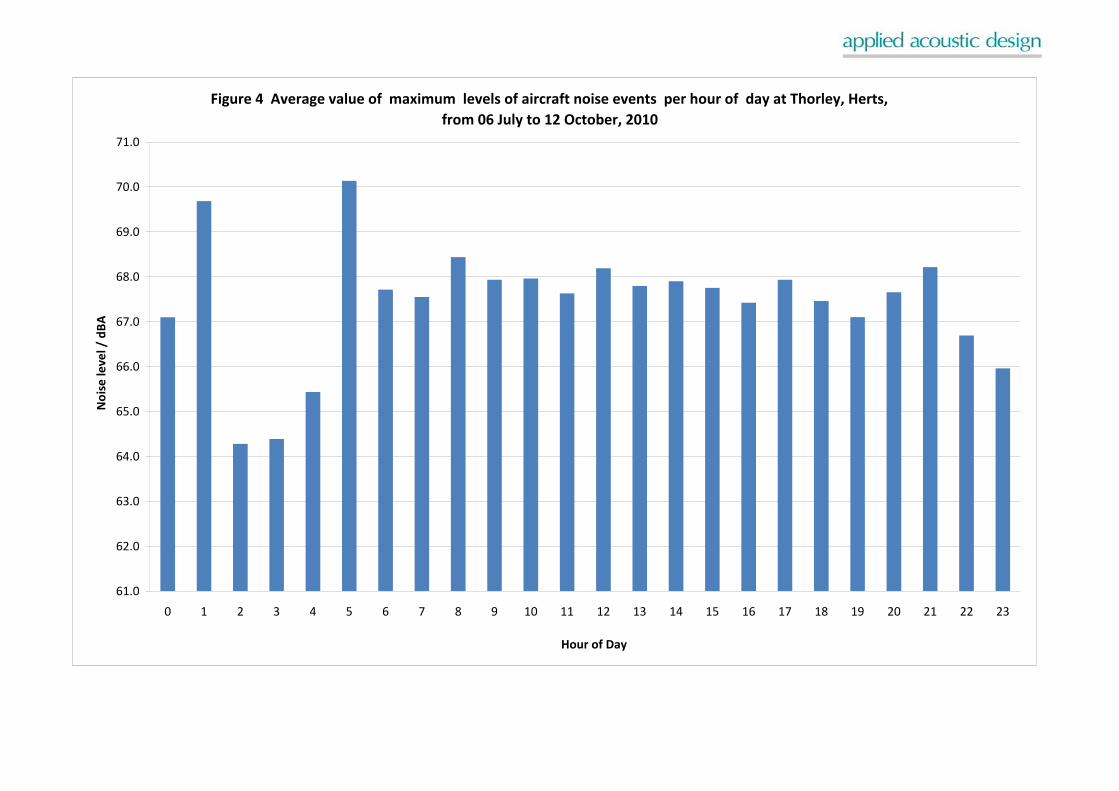
Figure 4 Average value of maximum levels of aircraft noise events per hour of day at Thorley, Herts, from 06 July to 12 October, 2010
61.0
62.0
63.0
64.0
65.0
66.0
67.0
68.0
69.0
70.0
71.0
0 1 2 3 4 5 6 7 8 9 10 11 12 13 14 15 16 17 18 19 20 21 22 23
Hour of Day
Noi
se le
vel /
dBA

Figure 5: Statistical frequency distribution and % cumulative frequency distribution of maximum noise levels of aircraft noise events at Thorley, Herts , 06 July to 12 October 2010
0
500
1000
1500
2000
2500
60 61 62 63 64 65 66 67 68 69 70 71 72 73 74 75 76 77 78 79 80 81 82 83 84 85 86 87 88 89 90 More
Noise level / dBA
Num
ber
of E
vent
s
0.00%
20.00%
40.00%
60.00%
80.00%
100.00%
120.00%
Frequency Cumulative %
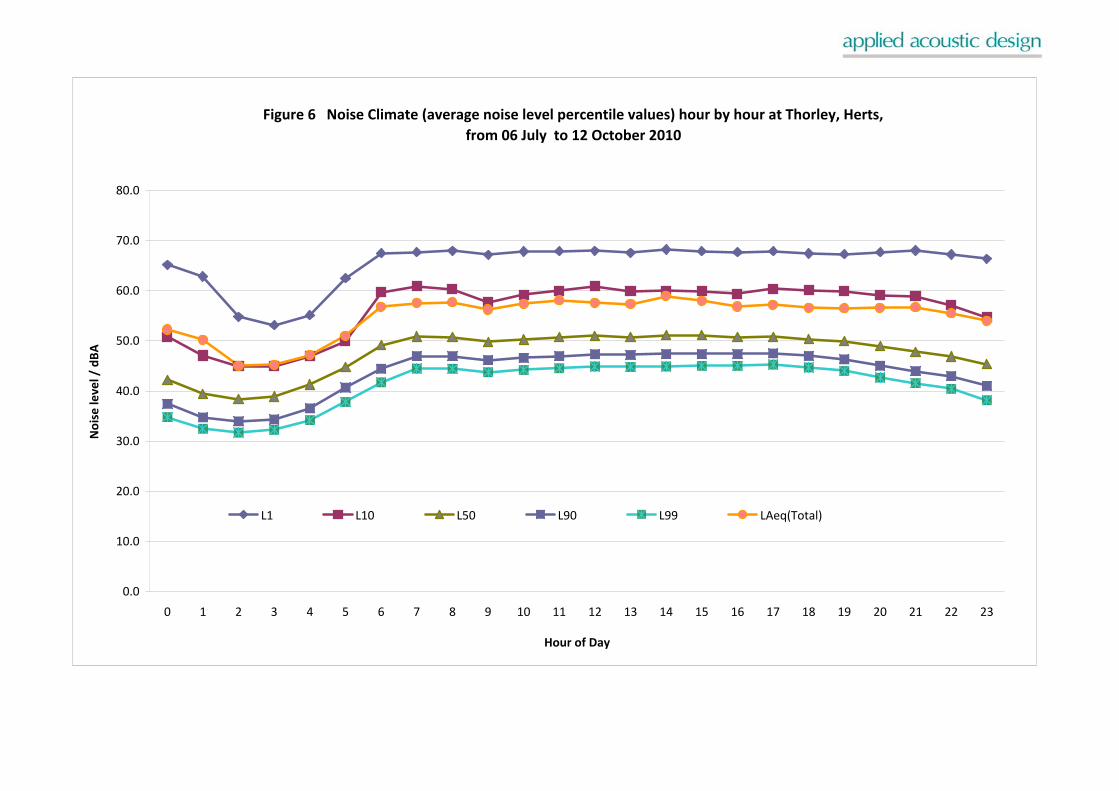
Figure 6 Noise Climate (average noise level percentile values) hour by hour at Thorley, Herts, from 06 July to 12 October 2010
0.0
10.0
20.0
30.0
40.0
50.0
60.0
70.0
80.0
0 1 2 3 4 5 6 7 8 9 10 11 12 13 14 15 16 17 18 19 20 21 22 23
Hour of Day
Noi
se le
vel /
dBA
L1 L10 L50 L90 L99 LAeq(Total)
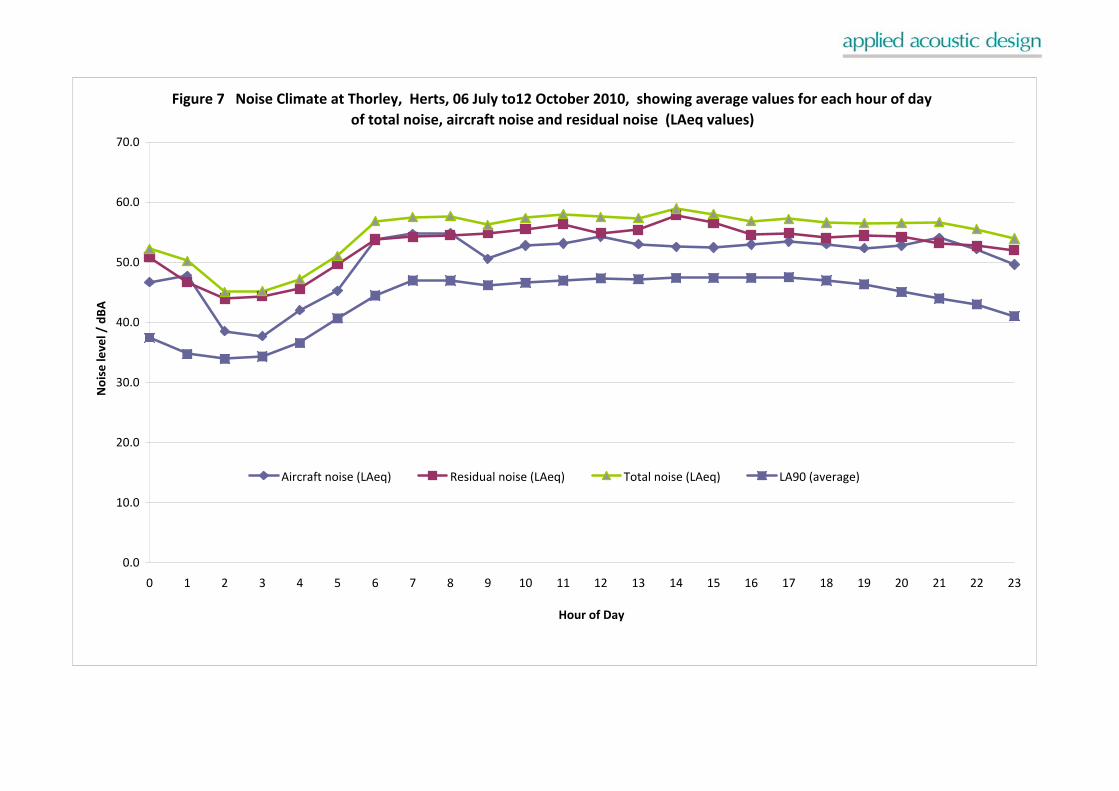
Figure 7 Noise Climate at Thorley, Herts, 06 July to12 October 2010, showing average values for each hour of day of total noise, aircraft noise and residual noise (LAeq values)
0.0
10.0
20.0
30.0
40.0
50.0
60.0
70.0
0 1 2 3 4 5 6 7 8 9 10 11 12 13 14 15 16 17 18 19 20 21 22 23
Hour of Day
Noi
se le
vel /
dBA
Aircraft noise (LAeq) Residual noise (LAeq) Total noise (LAeq) LA90 (average)

Figure 8: Numbers of aircraft noise events arising from different aircraft types at Thorley, Herts, from 06 July to 12 October 2010
1
10
100
1000
1000073H
319
320
73Y
752
M1F 142
74Y
76Y
ABY AT7 343
76X
321
763
73W
GRJ
744
73G
762
DF3
AR8 CCX
CNJ
ER3
CCJ
M83 722
332
M11 721
LRJ
318
732
74E
74L
AB4 C17
D1C D1Y
GS2 143
74X
A4F
D8Y
D93
Aircraft type Code
Num
ber
of E
vent
s

Figure 9: Average values of maximum noise levels of aircraft noise events arising from different aircraft types, at Thorley, Herts, from 06 July to 12 October 2010
60.0
62.0
64.0
66.0
68.0
70.0
72.0
74.0
76.0
78.0
80.073H
319
320
73Y
752
M1F 142
74Y
76Y
ABY AT7 343
76X
321
763
73W
GRJ
744
73G
762
DF3
AR8 CCX
CNJ
ER3
CCJ
M83 722
332
M11 721
LRJ
318
732
74E
74L
AB4 C17
D1C D1Y
GS2 143
74X
A4F
D8Y
D93
Aircraft Type Code
Num
ber
of E
vent
s

APPENDIX 1 MAP OF SITE
Map showing location of noise monitor at Thorley

Stansted Airport Ltd Aircraft Noise levels at Thorley, Herts, July to October 2010 ___________________________________________________________________________
Map showing (approximate) location of noise monitor at Thorley, Bishops Stortford, Hertfordshire

APPENDIX 2 DATA FROM THE NOISE MONITORING TERMINAL

Stansted Airport Ltd Aircraft Noise levels at Thorley, Herts, July to October 2010 ___________________________________________________________________________
Data from the Noise Monitoring Terminal The NMT always records all noise from all sources. It has, however, the facility to capture and show separately all noise events that meet particular pre-set conditions. This facility is used to capture noise events likely to arise from aircraft flying near to the monitor. The pre-set condition used for this study is that the noise must exceed a level of 60 dBA for a minimum duration of 10 seconds. This is arrived at following preliminary noise measurements at the site, and is broadly similar to conditions set for other such studies. It is of course likely that noise arising from activities other than aircraft using Stansted Airport will occasionally cause noise events to be captured. To determine which of all those events are due to aircraft using Stansted Airport their ANOMS (Aircraft Noise Management System) 'noise to track' matching software compares all captured noise events with all Stansted Airport's air traffic radar tracks. Noise events that are matched to aircraft are combined to provide a measure of 'aircraft noise' and noise events that are not matched to aircraft are included with 'all other noise' (i.e. that noise which is not captured as noise events, because it fails to meet the capture conditions of being above 60 dBA for 10 seconds), and is called residual noise. Therefore wherever reference is made to aircraft noise events within this document it should be understood that these relate only to aircraft using Stansted airport. Any noise arising from aircraft travelling to or from any other airport will be included as residual noise. The selection of the threshold conditions (noise level and time period) which trigger the capture of a noise event is a compromise judgement designed to include as much of the noise from passing aircraft as possible whilst at the same time excluding, as far as possible, noise from other sources. For this survey a threshold trigger level 60 dBA for a duration of at least 10 seconds was used. The following information is recorded for each noise event: date, time, duration, LASmax and SEL values, and, in addition, for aircraft noise events, event type (arrival/ departure), departure route, runway used, and aircraft type. In addition to gathering data about noise events the NMT also collects and stores information on an hourly basis about the total level of noise at the site from all sources (including that from aircraft movements), including individual noise events. Because the noise level is usually not constant, but varies continuously throughout each hour it is necessary to describe the total noise level statistically in terms of a measure of the average noise level throughout the hour (and called the hourly continuous equivalent noise level, LAeq) and also in terms of a series of hourly percentile levels. The most important of these is the LAS90, which is the noise level exceeded for 90% of each hour. This level of noise is conventionally taken to be a measure of the background noise level for each hour, and is the more or less constant level of noise which underlies the variations caused by various transient sources including aircraft.

APPENDIX 3 GLOSSARY OF TERMS

Stansted Airport Ltd Aircraft Noise levels at Thorley, Herts, July to October 2010 ___________________________________________________________________________
GLOSSARY OF TERMS
This glossary is presented in two parts. The first part contains definitions relating specifically to the context of this report, followed, in the second part, by a more general glossary of acoustic terms. Definitions relating specifically to the context of this Report: Aircraft Noise events Noise events which have been matched by the GEMS noise and track
keeping system to radar tracks in the vicinity of the NMT from aircraft arriving at or departing from Stansted airport.
Aircraft noise level The average noise level derived from aircraft noise events, aggregated
into hourly, daily or monthly average (LAeq) values. ANOMS Airport Noise and Operations Monitoring System.
The software data analysis system currently in use at the airport (incorporating the NTK system).
Applied Acoustic Design (AAD) Acoustic consultants retained by FEU Average LASmax level The arithmetic average of the LASmax values of all the events (of a
particular type i.e. either aircraft noise or community noise) which occur over a particular period of time (eg hour, day or month).
Building Research Establishment
A former government organisation, now privately owned, which conducts research on noise. Carried out the National Noise Incidence Study for Defra in 2000.
Defra UK government Department for Environment Food and Rural Affairs,
which has responsibility for aspects of policy relating to environmental noise
Flight Evaluation Unit (FEU)
The unit within BAA which monitors all aircraft movements to ensure compliance with Department for Transport noise regulations relating to track keeping, noise abatement and night flights, and which also provides a means of investigating and responding to complaints and enquiries from the public.
National Noise Incidence Study 2000
A study carried out by the Building Research Establishment for Defra based on a survey of noise levels outside 1020 dwellings in England and Wales in 2000, giving proportions of the population exposed to various levels of environmental noise.

Stansted Airport Ltd Aircraft Noise levels at Thorley, Herts, July to October 2010 ___________________________________________________________________________
Noise event A burst of noise at a high level which satisfies the noise event capture
conditions for a particular NMT, i.e. which exceeds the pre-set trigger noise level (in this report 62 dBA) for a pre-set time interval (in this report 10 seconds).
Noise events are detected, captured and stored by the NMT, and following subsequent processing by the NTK system are classified in this report as either aircraft noise events or community noise events
Noise Monitoring Terminal (NMT)
The noise measurement and analysis system installed at each site consisting of a precision grade sound level meter (Larson Davis type 870) inside a weather proof and tamper proof metal cabinet connected to an outdoor microphone located at a height of approximately 3.5 m above ground level.
NTK system Noise and Track Keeping system.
A software system able to match noise events recorded by the NMTs with aircraft tracks.
PPG24 Planning Policy Guidance Note 24:Planning and Noise, a document
issued by the UK government Department for the Environment in 1994 which gives guidance to local authorities and others on noise and planning.
Residual noise All noise arriving at the NMT microphone apart from aircraft noise
events, i.e. comprising residual noise events and all other noise which does not satisfy the trigger conditions for capture as a noise event.
Residual Noise events
Those noise events which have not been matched by the NTK system to aircraft tracks using Stansted Airport in the vicinity of the NMT.
Statistical frequency Analysis (of LASmax noise levels)
An analysis of a group of LASmax values giving the numbers of events (or percentages of total numbers) at different dBA levels
Total noise All noise arriving at the NMT microphone, i.e. not only including all
noise events (both aircraft and residual) but also all other noise which does not satisfy the trigger conditions for capture as a noise event.
Total noise level The average or continuous equivalent level (LAeq) of the total noise at
the site, recorded each hour by the NMT, which may also be aggregated into daily or monthly values.
Total noise climate The level of the total noise at the NMT microphone varies with time.
over a particular period of time e.g. one hour, this variation may be
Stansted Airport Ltd Aircraft Noise levels at Thorley, Herts, July to October 2010 ___________________________________________________________________________
described in terms of a number of different noise indices including the average or equivalent noise level, maximum and minimum noise level values and various percentile levels. Such a description constitutes the noise climate at the site over that period of time.
The NMT records the following total noise indices every hour: LAeq, LASmax, LAS10, LAS50, LAS90 and LAS99.
World Health Organisation
Issued 'Guidelines for Community Noise' in 2000 A general Glossary of acoustic Terms: A-weighting A method of producing a single figure measure of a broad band noise
(as opposed to the 8 or 9 figures which make up an octave band spectrum) which takes into account, in an approximate way at least, the frequency response of the human hearing system. The idea is that sound levels measured in this way should give an indication of the loudness of the sound.
A-weighted sound pressure level (dBA).
The value of the sound pressure level, in decibels, measured using an A-weighting electronic circuit built into the sound level meter. The vast majority of noise measurements are carried out in this way.
Day, evening, night level, Lden
An index of environmental noise based on average noise levels (LAeq) throughout the 24 hour period, but with a weighting factor of 5 dBA added to evening noise levels (19.00 to 23.00 hours), and a weighting of 10 dB added to night-time noise levels (23.00 to 07.00 hours). It is the noise index used in the UK Noise mapping exercise commissioned by Defra in response to the European Union Directive on Environmental Noise in 2002.
Decibel scale The decibel scale is the scale on which sound pressure levels are
commonly measured. It is a logarithmic scale and is used for convenience to compress the audible range of sound pressures into a manageable range, from 0 dB to 140 dB. The zero of the scale, 0 dB, corresponds to the notional threshold of hearing, 0.00002 Pa, and the upper limit, 140 dB, corresponds to 20 Pa, which would cause immediate damage to the ear.
Equivalent continuous sound level (LAeq,T), also called the Average noise level.
The LAeq,T represents a measure of the ‘average’ sound level over the measurement period. It corresponds to the steady continuous level of sound which, over the same period of time, T, would contain the same amount of (A-weighted) sound energy as the time varying noise.

Stansted Airport Ltd Aircraft Noise levels at Thorley, Herts, July to October 2010 ___________________________________________________________________________
This is the most common method of measuring time varying noise, and within certain limits gives the best correlation with human response to noise, for example with annoyance.
Frequency The frequency of a musical note is what gives it its pitch. It is the
number of cycles of the fluctuating sound pressure which occur each second, and is measured in cycles per second, Hertz (Hz). The human ear can detect frequencies in the range 20 to 20000 Hz.
Most noises are a mixture of all frequencies, called broad-band noise. LAS90,T This is the most commonly used of many possible statistical measures
of a time varying noise. It is the 90th percentile of the statistical noise level distribution, or, more simply, the noise level that is exceeded for 90% of the measurement time (T). Thus over one hour for example it represents the noise level which is exceeded for all but (the quietest) six minutes of that hour.
It is commonly used as a measure of the background noise in any given situation, against which the level of any new, potentially intrusive source of noise is often compared. Background noise itself often varies with time and so the LA90,T is almost universally used as the best measure of the ‘more or less always present’ noise level which underlies short term variations from other sources of noise.
Maximum sound pressure level (LASmax,T)
This is the highest value of the time weighted sound pressure level, (measured using the A frequency weighting and the Slow time weighting) which occurred during the measurement period, T. It is commonly used to measure the effect of very short duration bursts of noise, such as for example sudden bangs, shouts, car horns, emergency sirens etc. which audibly stand out from the general level of, say, traffic noise, but because of their very short duration, maybe only a very small fraction of a second, may not have any effect on the LAeq,T value.
In the context of this report the LASmax value for each aircraft noise event is monitored
Noise Unwanted sound Octave band spectra In order investigate the frequency content of broad band sounds, called
its frequency spectrum, measurements of sound pressure are carried out over a range of frequency bands. The most common method is to split the audio frequency range into 8 or 9 octave bands. An octave is a frequency range from one particular frequency to double that frequency.
Octave band measurements are not referred to in this report.

Stansted Airport Ltd Aircraft Noise levels at Thorley, Herts, July to October 2010 ___________________________________________________________________________
Percentile noise level, (LASN, where N is a number between 0 and100)
The noise level which is exceeded for N% of the measurement period. For example, a value of LA10,1hour of 57 dBA means that in that hour the noise level was at or above 57 dBA for 6 minutes (i.e.10% of an hour), or alternatively, was at or below 57 dBA for 54 minutes.
Sound exposure level (SEL)
This is a measure of the A-weighted sound energy used to describe single noise events such as the passing of a train or aircraft; it is the A-weighted sound pressure level which, if occurring over a period of one second, would contain the same amount of A-weighted sound energy as the event.
SEL values for events may be used to calculate the average noise level over a period of time (hour, day or month)
Sound pressure sound is a disturbance or fluctuation in air pressure, and sound pressure, measured in Pascals (Pa), is used as a measure of the magnitude of the sound. The human ear can detect sound pressures in the range from 0.00002 Pa to 20 Pa. This is an enormously wide range and so for convenience sound pressures are commonly measured on a decibel (dB) scale.
Time varying noise When the level of noise varies with time, as is often the case, for example with noise from road traffic, various measures or noise indices as they are called are used to give a single figure description of the noise over a given period of time. The three most commonly used noise indices are the LAeq, T the LA90,T and the LAmax,T values.
In all three cases the ‘L’ stands for the level of the sound in decibels, the ‘A’ for the fact that it is the A- weighted value, and the ‘T’ for the time period over which the noise is measured, for example 5min, 1 hour, 24 hour etc.
Time weighting (Fast (F) and Slow (S))
An exponential function of time, of a specified time constant, that weights the square of the instantaneous sound pressure. (Defined in BS EN 61672 – 1:2003).
There are two time constants defined in BS EN 61672 – 1:2003, designated Fast (F) and Slow (S), and noise indices such as the maximum, or percentile noise levels which are based on instantaneous time-weighted sound pressure should indicate which time weighting has been used in the measurement.
In this report, in line with standard practice for aircraft noise measurement, it is the Slow (S) time weighting that has been used, hence reference is made to LASmax and to LAS90.

APPENDIX 4 LIST OF AIRCRAFT IDENTIFICATION SOURCE CODES
Stansted Airport Ltd Aircraft Noise levels at Thorley, Herts, July to October 2010 ___________________________________________________________________________
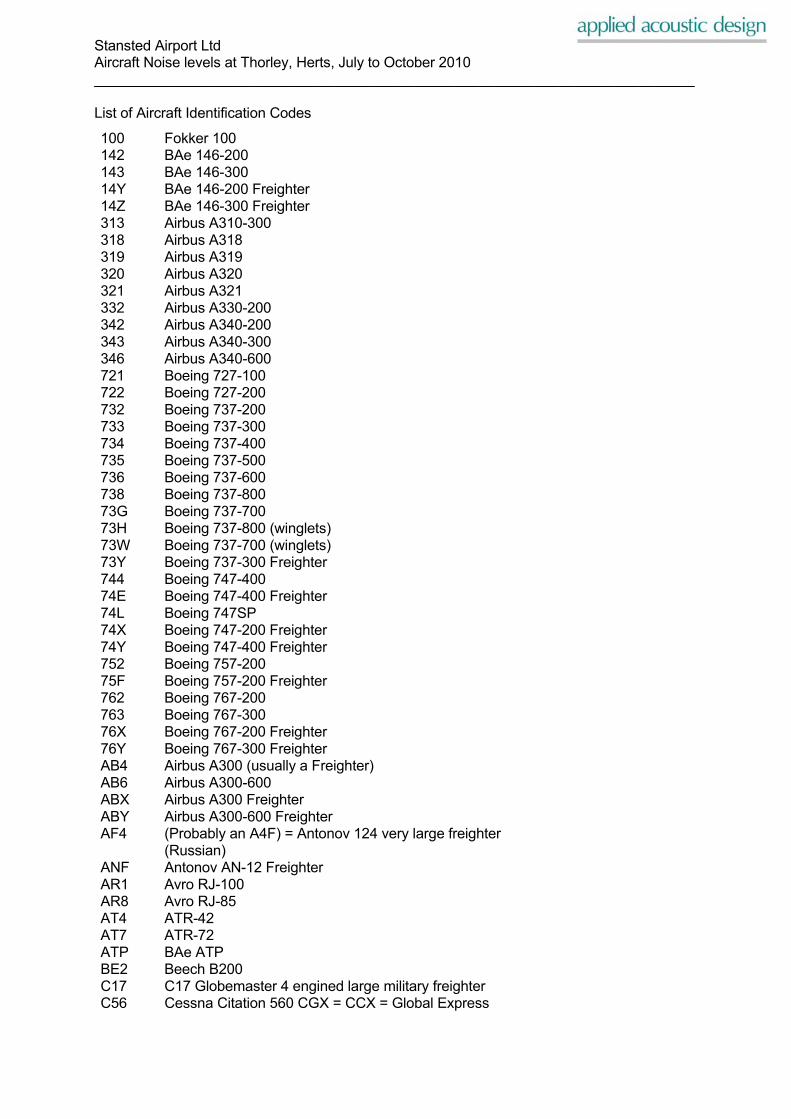
List of Aircraft Identification Codes
100 Fokker 100 142 BAe 146-200 143 BAe 146-300 14Y BAe 146-200 Freighter 14Z BAe 146-300 Freighter 313 Airbus A310-300 318 Airbus A318 319 Airbus A319 320 Airbus A320 321 Airbus A321 332 Airbus A330-200 342 Airbus A340-200 343 Airbus A340-300 346 Airbus A340-600 721 Boeing 727-100 722 Boeing 727-200 732 Boeing 737-200 733 Boeing 737-300 734 Boeing 737-400 735 Boeing 737-500 736 Boeing 737-600 738 Boeing 737-800 73G Boeing 737-700 73H Boeing 737-800 (winglets) 73W Boeing 737-700 (winglets) 73Y Boeing 737-300 Freighter 744 Boeing 747-400 74E Boeing 747-400 Freighter 74L Boeing 747SP 74X Boeing 747-200 Freighter 74Y Boeing 747-400 Freighter 752 Boeing 757-200 75F Boeing 757-200 Freighter 762 Boeing 767-200 763 Boeing 767-300 76X Boeing 767-200 Freighter 76Y Boeing 767-300 Freighter AB4 Airbus A300 (usually a Freighter) AB6 Airbus A300-600 ABX Airbus A300 Freighter ABY Airbus A300-600 Freighter AF4 (Probably an A4F) = Antonov 124 very large freighter (Russian) ANF Antonov AN-12 Freighter AR1 Avro RJ-100 AR8 Avro RJ-85 AT4 ATR-42 AT7 ATR-72 ATP BAe ATP BE2 Beech B200 C17 C17 Globemaster 4 engined large military freighter C56 Cessna Citation 560 CGX = CCX = Global Express

Stansted Airport Ltd Aircraft Noise levels at Thorley, Herts, July to October 2010 ___________________________________________________________________________
CCJ Bombardier Challenger CCX Bombardier Global Express CGX An old code no longer in use – should be CCX which is a Bombardier Global Express CJ5 Cessna Citation Jet CL6 = Global Express Challenger 600 DF7 = Dassault Falcon 7x CNJ Cessna Citation CR2 Bombardier CRJ-200 CR7 Canadair regional jet 700 CR9 Bombardier CRJ-900 D1C DC10 (McDonnell Douglas) D1Y DC10 Freighter (McDonnell Douglas) D8Y DC8 (McDonnell Douglas Freighter 4 engined) D38 Dornier 328 D93 DC9 (McDonnell Douglas DC9 -30) DF2 Dassault Falcon (this covers various types) 76X= Boeing 767-200 Freighter 73C= Boeing 737-300 (winglets) G54= GS4 = Gulfstream IV = Gulfstream 4 DF3 Dassault Falcon 50/900 DH4 Dehavilland Dash 8-Q400 E90 Embraer 190 EM2 Embraer Brasillia ER3 Embraer RJ-135 F50 Fokker 50 FRJ Dornier 328 Jet G52 GS2 = Gulfstream 2 G55 GS5 = Gulfstream 5 GRJ Gulfstream II/III/IV/V H25 Hawker HS-125 J31 BAe Jetstream 31 JET Generic code used for small jet aircraft without a specific IATA code LRJ Bombardier Learjet 23/24/25/31/35/40/45/55/60 M1F Boeing (McDonnell Douglas) MD11 Freighter M11 McDonald Douglas MD11 (usually a freighter – Fedex) M82 Boeing (McDonnell Douglas) MD82 M83 Boeing (McDonnell Douglas) MD83 M87 Boeing (McDonnell Douglas) MD87 M90 Boeing (McDonnell Douglas) MD90 PA2 Piper PAT Piper, Twin Propeller S20 Saab 2000 TU5 Tupolev TU-154 YK2 Yak 42