tidal breathing analysis as indicator of expiratory airway ... · (cutrera , cornelis 96). ......
TRANSCRIPT
Tidal breathing analysis as indicator of expiratory airway obstruction in
infants
ר אביגדור חברוני"ד

Methods used for evaluation of various lung
functions in Infants (Partial list)
Adult type infant pulmonary function tests Lung volumes, Flows, Resistance, Compliance
Airway occlusion techniques Resistance, Compliance
Multiple-breath helium dilution Lung volumes (FRC)
Multiple-breath inert gas washout Inhomogeneity of ventilation (LCI), FRC
Forced oscillation technique and impulse oscillometry Impedance, Resistance
Tidal Breathing analysis advantages
Easy and quick
Cheap
Portable
May not necessitate sedation
Can be used during normal sleep
Can be used in severe patients

Tidal Breathing analysis
Number of studies
Indicates airway obstruction (Morris 97, Seddon 96, Cornelis 96 )
Can demonstrate improvement after bronchodilators (Cornelis 96).
Can assess reaction to histamine provocation test (Cutrera ,
Cornelis 96).
Can be useful first tool in suggesting the site of the pathology in noisy breathing infants (Fillipone 2000)
Predictor of wheeze later in life (Håland 2005, Yuksel 96)
Conflicting results in assessing cystic fibrosis Pts (Ranganathan
2003, Williams 2000 )
Up to date, it is not routinely used in clinical practice

Tidal Breathing analysis
Limitation of some of the previous studies
Small series
Comparison of VT to resistance and other less direct. measurements (other than forced expiration).
Studies have been conducted in adults and children. (vs infants in the current study)
Awake state (less accurate)
Infants- dynamic FRC

The current study
Aim:
To evaluate the ability of tidal breathing loops to predict
expiratory airway obstruction in infants less than 2 years of
age.
Methods:
Retrospective analysis.
Comparison between parameters derived from tidal
breathing flow-volume & flow-time loops and V’maxFRC
(maximal flow at the functional residual capacity point).
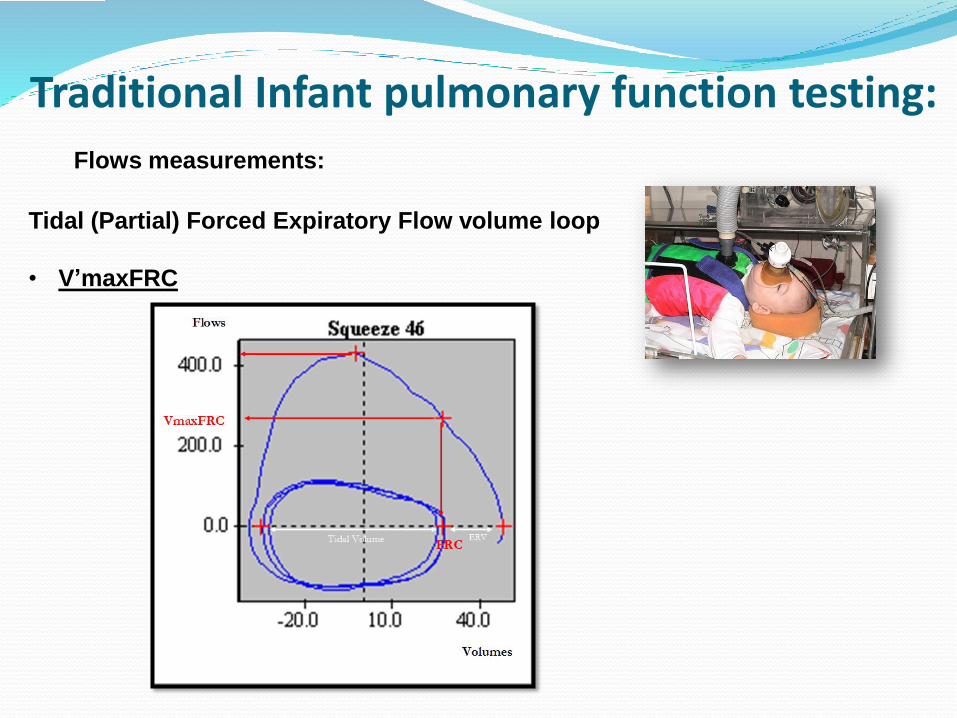
Traditional Infant pulmonary function testing:
Flows measurements:
Tidal (Partial) Forced Expiratory Flow volume loop
• V’maxFRC

Non obstructed
curves
Flow- volume curves Flow -Time curves PEFVL
Moderate obstruction
Severe obstruction
Tidal Breathing – Loops patterns
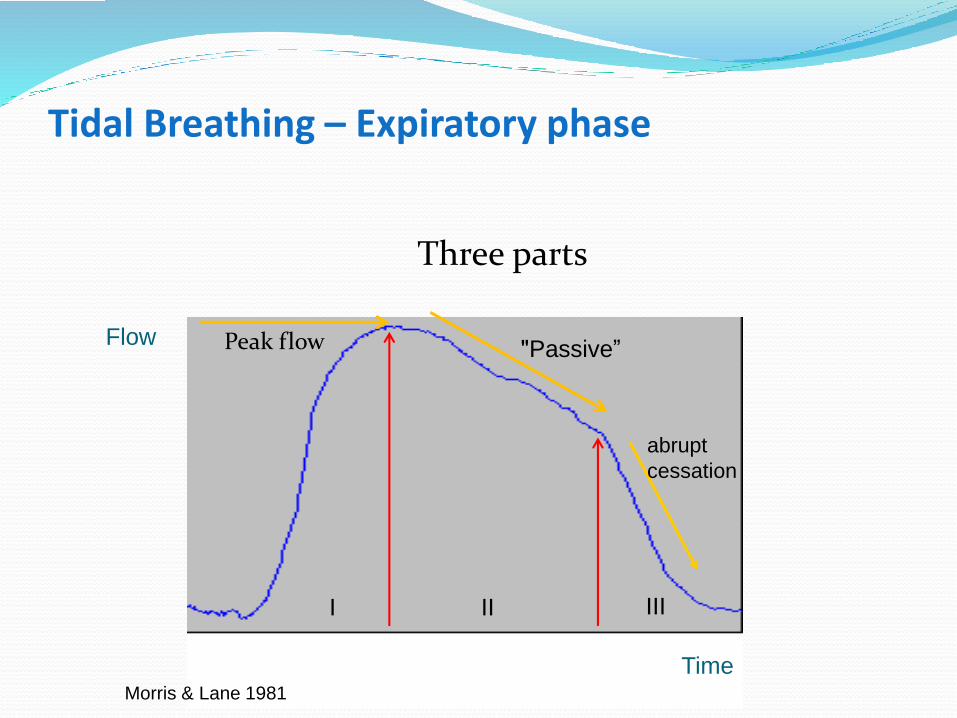
Tidal Breathing – Expiratory phase
Three parts
Flow
TimeMorris & Lane 1981
II
Passive” "
III
abrupt
cessation
I
Peak flow
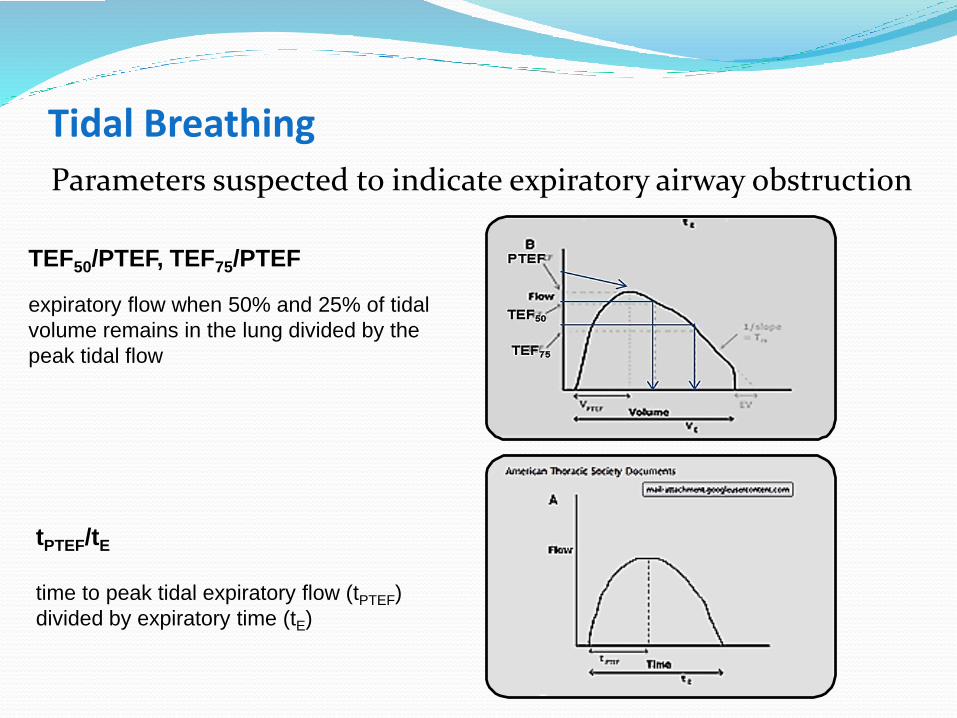
Tidal Breathing
Parameters suspected to indicate expiratory airway obstruction
tPTEF/tE
time to peak tidal expiratory flow (tPTEF)
divided by expiratory time (tE)
TEF50/PTEF, TEF75/PTEF
expiratory flow when 50% and 25% of tidal
volume remains in the lung divided by the
peak tidal flow

Tidal Breathing
tPTEF/tE is lower
TEF50/PTEF, TEF75/PTEF should be lower
• Obstruction -> Slower flows
• tE is longer
• Control of breathing
• reduced laryngeal braking
• earlier inspiratory muscles
relaxation

Definition: Severely obstructed infants
What is “ severely obstructed”?
• V’maxFRC<40% pred
• Tidal breathing limitation
No better discrimination
• According to V’maxFRC
• No clear definition

Study population
Infants aged 3 to 24 months who underwent iPFTbetween 2009-2012 because of recurrent or chronic wheezing or cough
Excluded
Infants born before 34w of gestation
Infants with any known severe chronic disease
Infants diagnosed with central airway disease
Pulmonary function were not done during acute state of illness

Study populationn=178
Mean SD
Age (months) 10.27 4.26
Sex (male) 66%
Weight (kg) 8.67 1.71
Height (cm) 71.02 5.88
Week of birth 39 2

Normal vs severely obstructed infants
𝐕maxFRC>80% pred 𝐕maxFRC<40% pred
N 54 57
Mean SD Mean SD P value
Clinical data
Age (months) 10.1 3.6 10.3 4.5 0.82
Sex (male) 65% 70%
Weight (kg) 8.3 1.4 9.1 1.9 0.01
Height (cm) 70.4 4.9 72.1 6.3 0.10
Week of birth 39.1 1.9 38.7 2.2 0.28
Tidal breathing
RR (min-1) 34.97 9.51 34.04 9.40 0.60
tI/tE 0.77 0.17 0.68 0.20 0.01
tPTEF (sec) 0.25 0.08 0.20 0.09 0.04
tE/tPTEF 0.27 0.07 0.18 0.05 0.0001
TEF50/PTEF 0.89 0.05 0.79 0.08 0.0001
TEF25/PTEF 0.67 0.09 0.52 0.11 0.0001
PTEF (ml/sec) 119.05 29.26 133.64 29.37 0.01
PTIF (ml/sec) 146.02 43.13 170.35 32.74 0.02

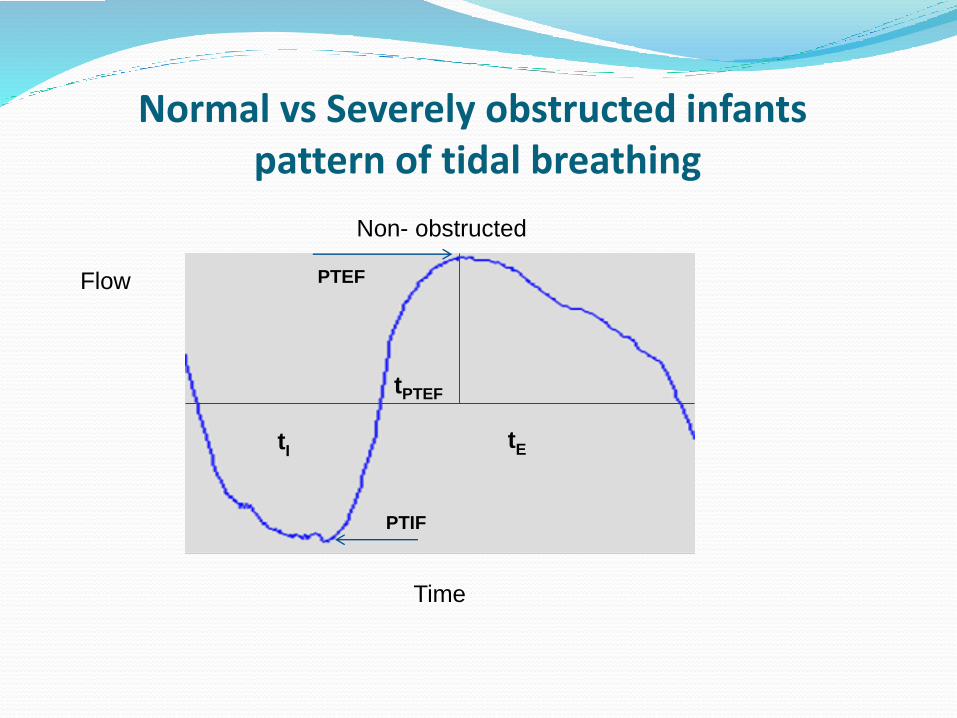
Normal vs Severely obstructed infantspattern of tidal breathing
PTEF
tPTEF
tE
PTIF
tI
Flow
Time

R=0.64
P<0.001
R=0.63
P<0.001
R=0.60
P<0.001
Tidal Breathing Parameters vs V’maxFRC Correlations

Can we identify confidently the severely obstructed infants?
• The severely obstructed infants will, probably, be
identified more clearly by tidal breathing loops than
others

𝐕maxFRC>40% pred 𝐕maxFRC <40% pred
N 121 57
Mean SD Mean SD P value
Clinical data
Age (months) 10.3 4.2 10.3 4.5 0.99
Sex (male) 64% 70%
Weight (kg) 8.5 1.6 9.1 1.9 0.01
Height (cm) 70.5 5.6 72.1 6.3 0.08
Week of birth 38.9 1.9 38.7 2.2 0.47
Tidal breathing
RR (min-1) 34.4 10.4 34.0 9.4 0.82
tI/tE 0.74 0.18 0.68 0.20 0.04
tPTEF (sec) 0.26 0.11 0.20 0.09 0.0122
tE/tPTEF 0.25 0.07 0.18 0.05 0.0001
TEF50/PTEF 0.88 0.06 0.79 0.08 0.0001
TEF25/PTEF 0.65 0.11 0.52 0.11 0.0001
PTEF (ml/sec) 119.40 30.19 133.64 29.37 0.0035
PTIF (ml/sec) 149.78 39.08 170.35 32.74 0.0126

TEF50/PTEF
AUC=0.801

TEF50/PTEF
tE/tPTEF
For TEF50/PTEF - AUC=0.801
For tE/tPTEF - AUC=0.787

tE/tPTEFTEF50/PTEF
0.266(0.067)0.891(0.050)Normal Value (SD)*
0.2240.870Cut-off value
-0.621-0.433Cut-off value
Z-score
81.5%81.5%Sensitivity
59.2%60.8%Specificity
87.7%88%Negative Predictive
Value
47.348.5%Positive predictive
Value
* VmaxFRC between 90-110 %predicted n-30

Summary
• Tidal breathing analysis is appealing way to measure airway obstruction in infants.
• There is a correlation between V’maxFRC and some parameters derived from tidal breathing loops.
• The correlation is probably not strong enough to permit tidal breathing analysis replace forced expiration methods.
• However, TEF50/PTEF and tE/tPTEF derived from tidal breathing flow-volume and flow-time loops can confidently discriminate between the severely obstructed infants and the others, and therefore can be used for this purpose.

רבה-תודה

493 results of VmaxFRC%predicted
Normal vs Severely obstructed infantspattern of tidal breathing
Flow
Time
tPTEF
tEtI
PTEF
PTIF
Non- obstructed


V'maxFRC>40% pred V'maxFRC<40% pred
N 118 56
Mean SD Mean SD P value
Clinical
Age (mo) 11.3 5.8 10.5 4.9 0.37
Sex (male) 63% 71% 0.286
Weight (kg) 8.6 1.7 9.0 1.9 0.13
Height (cm) 71.3 6.7 72.1 6.1 0.48
Week of birth 38.9 1.9 39.0 2.1 0.85
LFT
RR 33.6 10.4 34.5 9.8 0.59
tI/tE 0.73 0.18 0.68 0.19 0.11
tE/tPTEF 0.248 0.071 0.185 0.061 0.0001
Tef50/PTEF 0.87 0.06 0.80 0.09 0.0001
Tef25/PTEF 0.64 0.11 0.53 0.12 0.0001
tPTEF 0.26 0.11 0.20 0.09 0.0059
PTEF 120.63 32.09 132.78 29.94 0.0173
PTIF 149.78 39.08 170.35 32.74 0.0126