tj content a4portrait v3 - atkinsglobal.com/media/files/a/atkins-corporate/group... · justin p....
TRANSCRIPT

5
Asset M
anagement
Abstract
A combination of finite element method (FEM) analysis, traditional pavement design methods, and forensic analysis can reveal information about a pavement’s history and its future performance that cannot be determined with traditional evaluation methods alone. Engineers and researchers recently applied this three-tiered approach to the rehabilitation of Runway 9/27 at Houston Airport System’s George Bush Intercontinental Airport. The results of the investigation demonstrate the utility of a new generation of tools for site-specific pavement evaluation and rehabilitation design and suggest a change in the way engineers approach these projects in the future.
For Runway 9/27, the investigative team had to discover the root causes for crazing, tearing, and shoving of the asphalt at the landing areas and high-speed exits. Using X-ray computed tomography, the relationship between air void and crack distributions was evaluated from core samples and the distresses observed in different runway areas. The results revealed high air-void content consistently at a depth of approximately 3 inches, indicating a point of separation or slippage boundary.
Based on the forensic evaluation and FEM analysis, investigators concluded that the distress in the pavement was likely due to high shear stresses resulting from the braking and cornering action of aircraft and to the geometry of the asphalt layers. The synergistic effects of a stiff, polyethylene binder, oxidative aging in the top inch of the pavement, and the high, near-surface shear stresses all resulted in shoving and crazing.
Ongoing advances in computer technology open the door for the development of increasingly sophisticated programs to analyze pavement conditions, allowing for more cost-effective, yet more thorough, investigations.
Deficiencies in the traditional pavement analysis approach can be mitigated not only by supplementing the investigation with forensic analyses to determine causes for apparent distress, but also by using three-dimensional FEMs to analyze relationships between weak interlayers (identified on the basis of visual examination), shear stresses, and permanent deformation.
Typically, airports demolish airfield pavements at the end of their 20 year design lives and build new ones. In contrast, by deploying forensic engineering practices, airports can save costs, expedite construction, and mitigate the environmental impact associated with pavement replacement.
Rehabilitation of Runway 9/27 at George Bush Intercontinental Airport, Houston, Texas
99
Justin P. JonesVice President / Business Sector Manager
National Aviation Group
Atkins North America
William G. StamperSenior Engineer
National Aviation Group
Atkins North America
Adil GodiwallaAssistant Director of Aviation
Design & Construction Division
Houston Airport Systems
Jim HallSenior Principal Engineer
Applied Research Associates, Inc.
Vicksburg, Mississippi
Dallas LittleSnead Endowed Chair in TransportationEngineering
Civil Eng. Dept., Texas A&M University
CMS Engineering Group, LLC, Texas
6
BackgroundThe Houston Airport System is the fourth-largest airport system in the United States and the sixth-largest in the world. To bring air service to the metro area’s population of more than 5.5 million, the Houston Airport System has three facilities: George Bush Intercontinental Airport, William P. Hobby Airport, and Ellington Airport. The three-airport system served more than 49.5 million passengers in 2010, including more than 8.5 million international travelers.
Together these facilities form one of North America’s largest public airport systems and position Houston as the international passenger and cargo gateway to the south central United States and a primary gateway to Latin America.1
After a complete rehabilitation, Runway 9/27 at George Bush Intercontinental Airport was re-opened in 2009 and is now equipped with state-of-the-art approach capabilities. The runway began accepting ARC’s Category III approaches in February 2009. According to FAA Advisory Circular (AC) 150/5300-13, Airport Design, the Airport Reference Code (ARC) is a coding system used to relate airport design criteria to the operational and physical characteristics of the airplanes intended to operate at an airport. The upgraded runway allows pilots the greatest precision in landing aircraft in low and reduced visibility flight conditions.
The rehabilitated runway now places Houston’s hub airport in a league among a few airports in the nation that currently operate three parallel Category III runways. The Houston Airport System combined the fast-tracked rehabilitation project with the addition of the navigational aid that was completed at the same time.2
George Bush Intercontinental Airport is located approximately 20 miles north of downtown Houston, Texas. Named after George H.W. Bush, the 41st president of the United States, the airport is one of the fasting growing in the nation and the 17th busiest in the world, serving nearly 43 million passengers annually.3
One of the airport’s five existing runways, the 10,000 foot long Runway 9/27 was originally constructed in 1987 with 300 foot Portland concrete cement (PCC) pavement at each end and asphalt pavement in the center with a lime cement fly ash (LCF) base. The 9,400 foot asphalt portion of the runway received an asphalt overlay in 1998, and portions of
the taxiways have been reconstructed and repaired since the original construction.
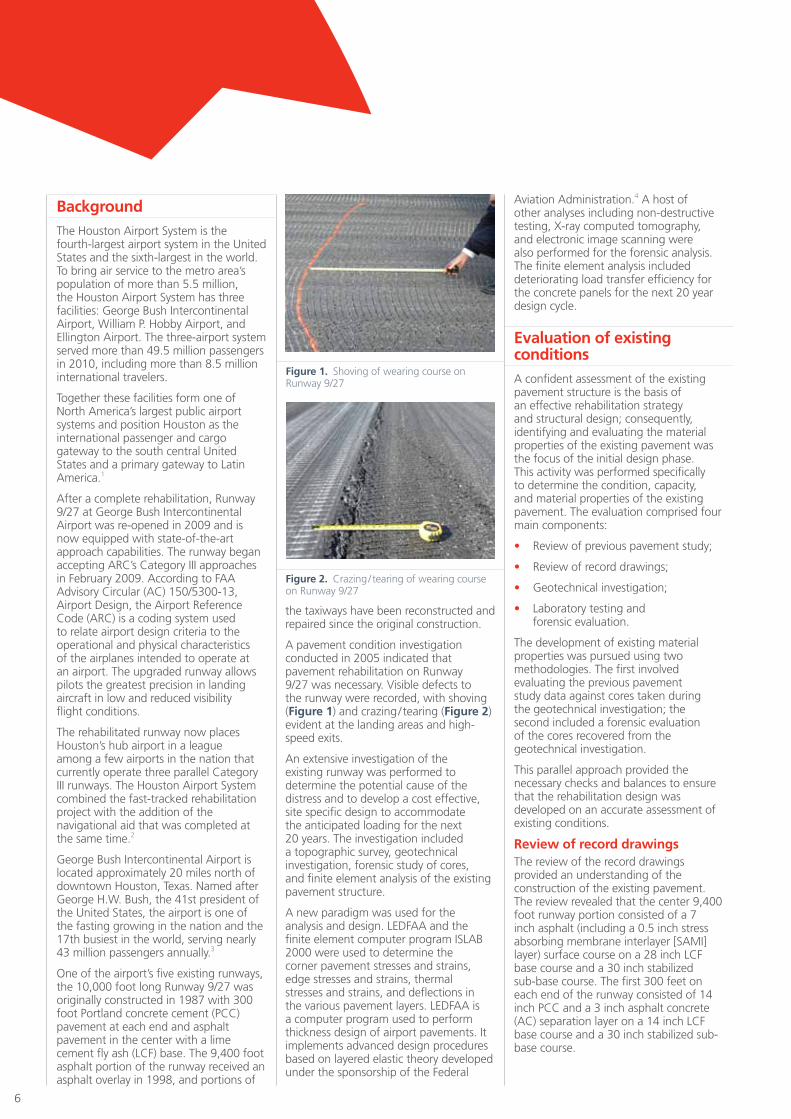
A pavement condition investigation conducted in 2005 indicated that pavement rehabilitation on Runway 9/27 was necessary. Visible defects to the runway were recorded, with shoving (Figure 1) and crazing / tearing (Figure 2) evident at the landing areas and high-speed exits.
An extensive investigation of the existing runway was performed to determine the potential cause of the distress and to develop a cost effective, site specific design to accommodate the anticipated loading for the next 20 years. The investigation included a topographic survey, geotechnical investigation, forensic study of cores, and finite element analysis of the existing pavement structure.
A new paradigm was used for the analysis and design. LEDFAA and the finite element computer program ISLAB 2000 were used to determine the corner pavement stresses and strains, edge stresses and strains, thermal stresses and strains, and deflections in the various pavement layers. LEDFAA is a computer program used to perform thickness design of airport pavements. It implements advanced design procedures based on layered elastic theory developed under the sponsorship of the Federal
Aviation Administration.4 A host of other analyses including non-destructive testing, X-ray computed tomography, and electronic image scanning were also performed for the forensic analysis. The finite element analysis included deteriorating load transfer efficiency for the concrete panels for the next 20 year design cycle.
Evaluation of existing conditionsA confident assessment of the existing pavement structure is the basis of an effective rehabilitation strategy and structural design; consequently, identifying and evaluating the material properties of the existing pavement was the focus of the initial design phase. This activity was performed specifically to determine the condition, capacity, and material properties of the existing pavement. The evaluation comprised four main components:
• Review of previous pavement study;
• Review of record drawings;
• Geotechnical investigation;
• Laboratory testing and forensic evaluation.
The development of existing material properties was pursued using two methodologies. The first involved evaluating the previous pavement study data against cores taken during the geotechnical investigation; the second included a forensic evaluation of the cores recovered from the geotechnical investigation.
This parallel approach provided the necessary checks and balances to ensure that the rehabilitation design was developed on an accurate assessment of existing conditions.
Review of record drawingsThe review of the record drawings provided an understanding of the construction of the existing pavement. The review revealed that the center 9,400 foot runway portion consisted of a 7 inch asphalt (including a 0.5 inch stress absorbing membrane interlayer [SAMI] layer) surface course on a 28 inch LCF base course and a 30 inch stabilized sub-base course. The first 300 feet on each end of the runway consisted of 14 inch PCC and a 3 inch asphalt concrete (AC) separation layer on a 14 inch LCF base course and a 30 inch stabilized sub-base course.
Figure 1. Shoving of wearing course on Runway 9/27
Figure 2. Crazing / tearing of wearing course on Runway 9/27
7
Asset M
anagement
These data were verified through a total of 17 cores to a depth of 10 feet and 24 cores through the existing asphalt pavement taken during the geotechnical investigation.
Geotechnical investigationAnalytical procedures were used to compute or back calculate the elastic properties of the individual pavement layers and sub-grade. The data used for the analysis were calculated during the previous pavement study and from cores obtained during the geotechnical investigation.
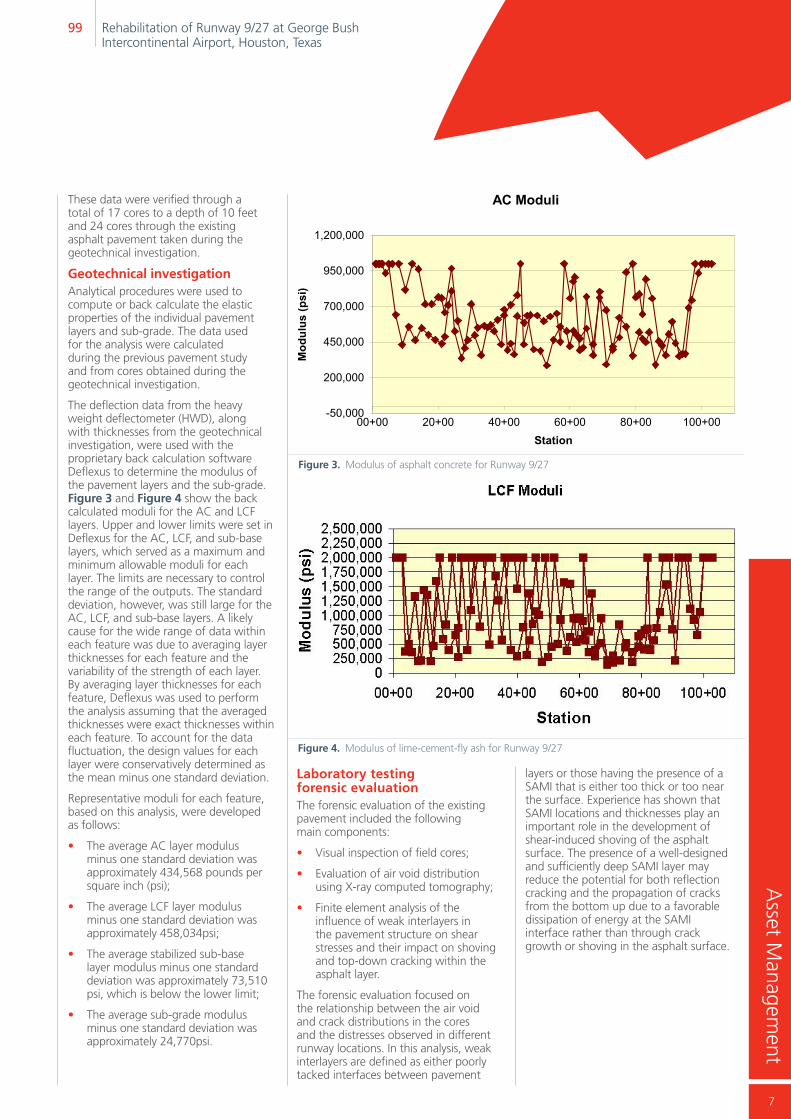
The deflection data from the heavy weight deflectometer (HWD), along with thicknesses from the geotechnical investigation, were used with the proprietary back calculation software Deflexus to determine the modulus of the pavement layers and the sub-grade. Figure 3 and Figure 4 show the back calculated moduli for the AC and LCF layers. Upper and lower limits were set in Deflexus for the AC, LCF, and sub-base layers, which served as a maximum and minimum allowable moduli for each layer. The limits are necessary to control the range of the outputs. The standard deviation, however, was still large for the AC, LCF, and sub-base layers. A likely cause for the wide range of data within each feature was due to averaging layer thicknesses for each feature and the variability of the strength of each layer. By averaging layer thicknesses for each feature, Deflexus was used to perform the analysis assuming that the averaged thicknesses were exact thicknesses within each feature. To account for the data fluctuation, the design values for each layer were conservatively determined as the mean minus one standard deviation.
Representative moduli for each feature, based on this analysis, were developed as follows:
• The average AC layer modulus minus one standard deviation was approximately 434,568 pounds per square inch (psi);
• The average LCF layer modulus minus one standard deviation was approximately 458,034psi;
• The average stabilized sub-base layer modulus minus one standard deviation was approximately 73,510 psi, which is below the lower limit;
• The average sub-grade modulus minus one standard deviation was approximately 24,770psi.
Laboratory testing forensic evaluation The forensic evaluation of the existing pavement included the following main components:
• Visual inspection of field cores;
• Evaluation of air void distribution using X-ray computed tomography;
• Finite element analysis of the influence of weak interlayers in the pavement structure on shear stresses and their impact on shoving and top-down cracking within the asphalt layer.
The forensic evaluation focused on the relationship between the air void and crack distributions in the cores and the distresses observed in different runway locations. In this analysis, weak interlayers are defined as either poorly tacked interfaces between pavement
layers or those having the presence of a SAMI that is either too thick or too near the surface. Experience has shown that SAMI locations and thicknesses play an important role in the development of shear-induced shoving of the asphalt surface. The presence of a well-designed and sufficiently deep SAMI layer may reduce the potential for both reflection cracking and the propagation of cracks from the bottom up due to a favorable dissipation of energy at the SAMI interface rather than through crack growth or shoving in the asphalt surface.
AC Moduli
-50,000
200,000
450,000
700,000
950,000
1,200,000
00+00 20+00 40+00 60+00 80+00 100+00Station
Mod
ulus
(psi
)
Figure 3. Modulus of asphalt concrete for Runway 9/27
Figure 4. Modulus of lime-cement-fly ash for Runway 9/27
99 Rehabilitation of Runway 9/27 at George Bush Intercontinental Airport, Houston, Texas

8
Observations Regarding Core and Runway ConditionFigure 5 shows representative core samples (Cores F10A and F10B). Table 1 summarizes the measurements and visual inspection of core samples taken as part of the geotechnical investigation.
X-ray computed tomography analysis of air void distributionX-ray computed tomography is a nondestructive technique used to visualize the internal characteristics of opaque objects. An X-ray source sends out a beam of known intensity through the analyzed sample. The beam then reaches a detector where the attenuated beam intensity is measured. The sample rotates 360 degrees with respect to its center so that a full two-dimensional image can be created. The sample also moves at a given fixed gap in the vertical direction so that images at different
Figure 5. Representative core samples (F10A and F10B) showing air void and crack distributions in runway core samples
Label Location
Total Thickness (Inches)
SAMI Location (Inches) and condition
Core condition
Location condition Notes
F15 Taxiway SA 6.0 5.0 Separated at SAMI Depression in the Taxiway
F14 Taxiway SA 4.0 3.0 (distorted layer and non-uniform)
Separated in a lower SAMI layer
Depression in the Taxiway
Aggregate of darker color
F10CNear the intersection of Runway and Taxiway SH
8.5 7.0 (uniform and thin layer)
No evidence of separation
Good condition
F10A Near the intersection of Runway and Taxiway SH
7.0 6.0 (uniform and thin layer)
Separated at 2.0 inches
Raveling (loss of asphalt concrete from the surface)
Longitudinal crack (0.75 inch opening and 1.5 inch deep)
Closure of grooves
F10B Near the intersection of Runway and Taxiway SH
7.0 5.0 (thin layer)
No top layer Shoving north of F10A with mix moving to the west
Thin mixes below the SAMI
F8 Intersection of Runway and Taxiway SG
8.0 5.0 (thin layer)
Separated at 3.0 inches
Good condition
F7 Between F8 and C 8.0 5.0 (thin layer)
Separated at the base
Good condition
D2 East side of Runway just east of Taxiway SH
8.0 6.0 Separated at SAMI disintegrated
Good condition
B3 West side of Runway just west of Taxiway SG
5.5 5.0 Separated at 3.0 inches
Good condition
C1 Near the middle of Runway between Taxiway SH and SG
8.5 6.0 (thin layer)
Separated at 3.5 inches Good condition
Table 1. Summary of core measurements and visual inspection

9
Asset M
anagement
height locations can be obtained and thus describe the entire sample volume. X-ray computed tomography was used to evaluate the internal air void distribution in cores C1, F10A, F10B, F10C, and F14.
Results from Core F14 provide an indication of the data developed from this analysis. Core F14 exhibited low air voids except in the location of the SAMI layer (Figure 6). The low void content is an indication of mix instability or shoving, which was observed in this location during the site visit. This location has three characteristics that differentiate it from all other sections. First, the SAMI
layer in this core is thicker than in the others. Second, the SAMI layer is at a depth of about 3 inches from the surface, which is the smallest depth to SAMI among all cores. Third, the aggregate source, which is a darker aggregate, appears to be different from the aggregates used in the rest of Runway 9/27. Figure 7 shows images captured at different depths within the core. Figure 8 shows the three-dimensional distribution of air voids in Core F14. These images show that the percentage of air voids in the SAMI layer is much higher than in the rest of the core.
Finite element analysis of the influence of weak interlayersAn elasto-visco-plastic finite element model was used to analyze the permanent deformation of an airfield pavement section. The objective of this simulation was not to model the Runway 9/27 structure and material properties (because that requires extensive material testing) but rather to demonstrate the influence of the location of a SAMI layer on shear stresses and permanent deformation.
0
10
20
30
40
50
60
70
80
90
100
0% 2% 4% 6% 8% 10% 12% 14%
Percent air voids
Dep
th (m
m)
Figure 6. Air void distribution in Core F14
Depth = 2mm Depth = 66mm Depth = 90mm
Figure 7. Images taken at different depths within core F14
Figure 8. Three-dimensional air void distribution in core F14
99 Rehabilitation of Runway 9/27 at George Bush Intercontinental Airport, Houston, Texas

10
The analysis was conducted using an axisymmetric finite element model. The asphalt mix material properties were selected to represent the properties of a typical asphalt mix that was evaluated at Texas A&M University at a high temperature of 58oC. The applied load was that of a B-737-300 aircraft (see Table 2). Figure 9 shows the axisymmetric finite element model with the applied forces. The asphalt layer thickness is 6 inches, and the width is 120 inches. The SAMI was modeled as a 1 inch layer with an elastic modulus equal to 40 percent of that of the surrounding hot mix asphalt layers. However, the visco-plastic model parameters were maintained at the same level for both the SAMI and asphalt mixture. Figure 10 shows the maximum permanent deformation in the three sections.
Gross Weight lbs (tons) 140,000 (63.503)
Tire Pressure psi (kPa) 201 (1386)
Percent Gross Weight on Gear 47.5%
Dual Spacing in (mm) 30.5 (774.7)
Tire Contact Width in (mm) 11.47 (291.4)
Tire Contact Length in (mm) 18.36 (466.3)
Table 2. B-737-300 loads used in the finite element model
It should be noted that a pavement section with the SAMI layer 2 inches below the surface experiences more permanent deformation than the section without the SAMI layer (about an 11 percent increase in permanent deformation). The section with the SAMI layer located 4 inches below the surface experienced only a 4 percent increase in permanent deformation compared with the section without SAMI. It is also important to note that as the SAMI layer is moved closer to the surface, the shear stresses within the hot mix asphalt surface are increased (Figure 9). This condition could lead to near surface distortion and could possibly contribute to groove closure or distortion of the groove pattern. The system with a SAMI layer at 4 inches below the surface induces a favorable combination of low permanent deformation and low surface shear stresses. The system with no SAMI layer gives the least permanent
deformation but the highest surface shear stresses.
ReconciliationIn addition to analyzing the influence of weak layers, the parallel forensic evaluation tested intact LCF cores in the laboratory; these cores yielded elastic moduli of around 4,000,000psi, significantly higher than that resulting from the back calculation analysis. While this high result may be true of an intact specimen, it is estimated that cracking in the LCF layer and poor bonding among the multiple LCF layers yielded
a composite layer with a much smaller modulus, matching that resulting from the back calculation.
A three-phase approach was undertaken to reconcile the differences between laboratory measured compressive strengths, resilient moduli, and field back calculated values. The hypothesis of the analysis was that both the laboratory-measured compressive strength and modulus values and the back calculated values from HWD testing were probably correct and could be reconciled. The
Verticalstresses (Z-
direction)Friction stresses
(Y-direction)
6"
Figure 9. Applied loads in the finite element model
9.60E-02
9.80E-02
1.00E-01
1.02E-01
1.04E-01
1.06E-01
1.08E-01
1.10E-01
0 0.5 1 1.5 2 2.5 3 3.5 4 4.5
Ver
tical
Per
man
ent D
efor
mat
ion,
inch
es
0
50
100
150
200
250
300
Max
imum
Von
Mis
ses
She
ar S
tress
, psi
Permanent Deformation
Von Misses Shear Stress
Similar to Core F14
Similar to Core F10
Depth of SAMI below Surface
Figure 10. Permanent deformation and shear stresses in asphalt layer due to different SAMI layer depth
Symmetric line

11
Asset M
anagement
basis for this reconciliation is that while an intact section of the LCF (such as that evaluated in the laboratory) may have a high compressive strength and modulus, the “slab” effect may be considerably lower due to the cumulative effect of shrinkage cracks and smaller, load-associated cracks. These cracks are not likely to be tested in all intact laboratory samples. Further, the intact sections tested in the laboratory may not reflect field performance due to a lack of bonding between compaction planes. This is a distinct possibility because the LCF layer was constructed in approximately seven individual sub-layers. Theory dictates that the combined stiffness of several partially bonded or unbonded stiff sub-layers is substantially less than the stiffness of a monolithic layer of the same thickness and stiffness.
The conclusion from that work is that the residual hot mix asphalt surface can be reasonably modeled in the ISLAB analysis (ISLAB is a finite element analysis software) as a Totski interface with an interlayer constant of 0.75 x 10⁶psi/in, the LCF layer can be modeled as a 28 inch thick layer with an effective modulus of 500,000psi, and the composite sub-base-sub-grade interlayer can be modeled with a composite k-value of between 200 and 300pci, a result comparative to that established through back calculation of HWD data.
Conclusions of forensic evaluationIn addition to finalizing the material properties, the forensic evaluation also revealed that the distress was likely due to high shear stresses resulting from the braking and cornering action of aircraft and the nature of the asphalt layer placed. The asphalt binder used was very stiff. The synergistic effects of a very stiff, polyethylene binder, oxidative aging in the top inch of the pavement, and the high, near-surface shear stresses resulted in shoving and crazing (closely spaced top-down cracking). Initial assumptions that the SAMI layer was a major contributor to the distress were therefore proved unfounded.
The analysis also identified the benefits of maintaining a section of the existing AC in the final overlay design. This layer, approximately 2 or 3 inches after milling, provides at least two favorable functions: (1) it acts as a cushioning effect for the PCC overlay that will reduce corner stresses imposed by loading and temperature-induced curling; and (2) it acts as a bond-breaker between the PCC overlay and the LCF structural layer that allows the PCC overlay and the LCF to function as two separate layers, thereby
reducing the bending stresses within the LCF. The analysis also enabled the development of a model for use during the design of the overlay solution.
Forensic analysis and rehabilitation designAn LEDFAA analysis was performed to prepare paving alternatives using the material properties for specific pavement areas, with results for a PCC overlay ranging from 8.5 to 14.5 inches.
After the LEDFAA analysis was performed, the finite element based ISLAB computer model was used to further evaluate the PCC overlay thicknesses predicted by LEDFAA. A four-step analysis was performed using ISLAB:
1. Determine the critical location and critical stresses imparted by the critical aircraft listed.
2. Assess the fatigue life consumption of the rehabilitated (overlayed) pavement due to the design traffic.
3. Evaluate the impact of overlay thickness on damage of the LCF layer.
4. Compare and evaluate the impact of the actual thickness of the LCF with an effective LCF modulus (from HWD back calculation) versus effective thickness of the LCF layer based on the laboratory measured moduli.
For these studies, the following model was used, based on the findings of the forensic evaluation discussed above:
• Model the residual hot mix asphalt layer as a Totski interlayer with a “spring constant” of approximately 3.0 x 10⁶psi/in, which is consistent with a resilient or dynamic modulus of approximately 750,000psi;
• Model the LCF as a 28 inch thick layer with an effective modulus of 500,000 psi. This is the more critical case as compared to modeling the LCF with a higher modulus (4 x 10⁶psi) with a reduced or effective thickness of 12 to 14 inches;
• Model the composite sub-base and subgade with a k-value of 200pci.
This analysis demonstrated an unusual trend because the bending stresses actually decreased when the PCC overlay thickness is less than about 10 inches. However, an overlay thickness below 12 inches induced high bending stresses at the bottom of the LCF layer, which may be a potential for excessive damage in that layer. Curling stresses were conservatively considered in the analysis, and although the analysis demonstrates
the high bending stresses that can occur in the LCF, the acceptable performance of this layer over more than 20 years of service tempers that assessment. Further, traditional transfer functions, such as the one used in the fatigue consumption analysis, are highly sensitive to the stress ratio. Increasing the PCC rupture modulus from 650psi to 750psi increases the performance life to 20 years or more.
The results of this analysis demonstrate that a PCC thickness between approximately 10 and 15 inches has little impact on critical PCC stresses. However, the thickness of the PCC significantly impacts critical stresses in the LCF, particularly when a Totski interface is not considered.
Subsequently, the design thickness was developed with two goals in mind: (1) to limit the stress in the PCC, and (2) to minimize the stress in the LCF layer. Based on the results of this analysis (shown in Figure 11 and Figure 12), it is apparent that the optimum thickness is approximately 14 inches, which would provide adequate support to protect the PCC as well as the bottom LCF layer. A thickness of 10 inches would likely provide the needed support for the PCC layer, but degradation would likely occur in the LCF layer over time.
Benefits of forensic evaluationDuring the preliminary engineering phase, the runway underwent an extensive and rigorous investigation, which exceeded the normal limits of project development and included a forensic evaluation of the existing pavement.
SummaryAs part of the project’s preliminary engineering phase, Atkins, assisted by Applied Research Associates (ARA) and CMS Engineering Group (CMS), undertook an extensive and rigorous investigation of the existing runway to determine the potential cause of the evident distress and to develop rehabilitation alternatives that would be evaluated in more detail as part of the Preliminary Engineering Report submission.
Given the unusual nature of the existing pavement, the design team determined that a more rigorous design approach was needed; therefore, an extensive forensic investigation was undertaken to determine the existing conditions, identify the cause of failure, and provide analytical
99 Rehabilitation of Runway 9/27 at George Bush Intercontinental Airport, Houston, Texas

12
CASE 1
0
100
200
300
400
500
600
0 5 10 15 20 25PCC Thickness (inch)
Criti
cal S
tress
Bot
tom
of P
CC (p
si)
0
20
40
60
80
100
120
140
160
Criti
cal S
tress
Bot
tom
of L
CF (p
si)
Bottom of PCC
Bottom of LCF
Figure 11. Case 1: Hot mix asphalt as Totski interface (with temperature gradient)
Criti
cal S
tress
Bot
tom
of P
CC (p
si)
Criti
cal S
tress
Bot
tom
of L
CF (p
si)
Bottom of PCC
Bottom of LCFCASE 3
0
50
100
150
200
250
300
350
400
0 5 10 15 20 25PCC Thickness (inch)
0
200
400
600
800
1000
1200
Figure 12. Case 3: Hot mix asphalt and lime-cement-fly ash as composite layer (with no temperature gradient)
data to allow the team to develop a cost-efficient solution.
This investigation went beyond the normal limits of project development and included a forensic evaluation of the existing pavement. This rigorous approach enabled the team to develop an efficient site-specific solution, balancing initial cost, longevity, and construction schedule to best meet the challenges. The cost of this additional investigation was less than 0.3 percent of the final construction cost, yet the savings achieved as a result were far greater by factors of ten.
The project (Figure 13) demonstrated the correct application of engineering principles and innovative approaches and illustrated how up-to-date equipment can benefit a project. The result is a highly successful project – recipient of the Federal Aviation Administration’s Program of the Year Award – that will comfortably ensure air operations into the airport’s 60th anniversary in 2029.
References1. http://www.fly2houston.com/about-has-history. Accessed August 3, 2011.2. http://airportnews.aero/airline/19461/59/George-Bush-Airport-receives-state-of-the-art-upgrades. Accessed July 28, 2011.3. http://www.houston-iah.airports-guides.com/. Accessed July 28, 2011.4. http://www.airporttech.tc.faa.gov/Pavement/26ledfaa.asp. Accessed July 28, 2011.
Figure 13. Runway 9/27 at George Bush Intercontinental Airport, Houston, Texas