tozer et al., 2014, athabasca oil sands
TRANSCRIPT
AUTHORS
Richard S. J. Tozer � BP Canada, 240 4thAvenue SW, Calgary, Alberta, Canada; presentaddress: BP Exploration, 580 Westlake ParkBoulevard, Houston, Texas;[email protected]
Richard Tozer is a geologist with 11 years ofindustry experience. He holds a B.Sc. degreein geology from Imperial College, London,
E&P NOTE
Athabasca oil sands: Megatraprestoration and charge timingRichard S. J. Tozer, Albert P. Choi,Jeffrey T. Pietras, and Donald J. Tanasichuk
United Kingdom, and a Ph.D. in structural ge-ology from the University of Leeds, UnitedKingdom. He has worked for BP since 2003 andis currently evaluating exploration opportunitieson the Brazil equatorial margin. His researchinterests include thrust tectonics, passive marginevolution, and arctic geology.
Albert P. Choi � BP Canada, 240 4thAvenue SW, Calgary, Alberta, Canada;[email protected]
Albert Choi received a B.Sc. degree in engi-neering physics from the University of BritishColumbia and an M.Sc. degree in geophysicsfrom the University of Alberta. He has heldvarious technical and supervisory positions withBP and is currently team leader for regionalstudies in BP Canada.
Jeffrey T. Pietras � BP Canada, 240 4thAvenue SW, Calgary, Alberta, Canada; presentaddress: Department of Geological Sciencesand Environmental Studies, State Universityof New York at Binghamton, P.O. Box 6000,Binghamton, New York;[email protected]
Jeff Pietras is a sedimentologist and strati-grapher who specializes in basin analysis, la-custrine stratigraphy, and hydrocarbon explo-ration. He received his B.S. degree in geologyfrom Binghamton University, and his M.S.degree and his Ph.D. in geology from the Uni-versity of Wisconsin–Madison. He has workedregional-scale projects on sedimentary basinsaround the world for BP.
Donald J. Tanasichuk � BP Canada, 240
ABSTRACT
The petroleum trap for the Athabasca oil sands has remainedelusive because it was destroyed by flexural loading of theWestern Canada Sedimentary Basin during the Late Creta-ceous and Paleocene. The original trap extent is preservedbecause the oil was biodegraded to immobile bitumen as thetrap was being charged during the Late Cretaceous. Using welland outcrop data, it is possible to reconstruct the Cretaceousoverburden horizons beyond the limit of present-day erosion.Sequential restoration of the reconstructed horizons revealsa megatrap at the top of the Wabiskaw-McMurray reservoirin the Athabasca area at 84 Ma (late Santonian). The mega-trap is a four-way anticline with dimensions 285 × 125 km(177 × 78mi) andmaximum amplitude of 60m (197 ft). Thesoutheastern margin of the anticline shows good conformanceto the bitumen edge for 140 km (87 mi). To the northeast ofthe anticline, bitumen is present in a shallower trap domainin what is interpreted to be an onlap trap onto the CanadianShield; leakage along the onlap edge is indicated by tarrybitumen outliers preserved in basement rocks farther to thenortheast. Peripheral trap domains that lie below the paleo-spillpoint, in northern, southern, and southwestern Athabasca,and Wabasca, are interpreted to represent a late charge of oilthat was trapped by bitumen already emplaced in the anti-cline and the northeastern onlap trap. This is consistent withkimberlite intrusions containing live bitumen, which indicatethat the northern trap domain was charged not before 78 Ma.The trap restoration has been tested using bitumen-water con-tact well picks. The restored picks fall into groups that are
4th Avenue SW, Calgary, Alberta, Canada;[email protected]
Don Tanasichuk is a geophysicist working inthe regional oil sands team of BP Canada.He has more than 30 years of industry expe-rience working from prospect evaluation to
Copyright ©2014. The American Association of Petroleum Geologists. All rights reserved.
Manuscript received March 1, 2013; provisional acceptance June 10, 2013; revised manuscript receivedJuly 2, 2013; final acceptance August 7, 2013.DOI:10.1306/08071313039
AAPG Bulletin, v. 98, no. 3 (March 2014), pp. 429–447 429

basin-scale projects over much of the WesternCanada Sedimentary Basin and Canadian fron-tiers, along with assignments in the MiddleEast, Caribbean, and parts of the South Atlantic.He received his B.Sc. degree in geophysicsfrom the University of Alberta in 1979.
ACKNOWLEDGEMENTS
We thank BP for permission to publish thiswork. We acknowledge fruitful discussions withmany of our peers and colleagues and thankM. Caddel, D. Fell, P. Gromek, P. Kouremenos,A. Mok, K. Pietras, and E. Sacks for providingwell picks for this study. We are grateful toN. Deyell, J. Evans, B. Ireland, H. Leach, S. Lewis,C. Natenstedt, N. Jones, and M. Judson forreviewing and approving a draft of the text andfigures. We acknowledge Alberta Energy andUtilities Board, Alberta Geological Survey, TheGeological Survey of Canada, and SaskatchewanGeological Survey for making data availableand thank K. Fallas, A. Okulitch, and S. Sinclairfor their assistance. Thorough reviews byN. Harris, S. Larter, D. Leckie, B. Katz, andF. Whitehurst helped to improve the text andfigures.The AAPG Editor thanks Senior Associate EditorBarry J. Katz and the following reviewers fortheir work on this paper: Nicholas B. Harris,Steve Larter, and Dale A. Leckie.
430 E&P Note
consistent both with the trap domains determined from thetop reservoir restoration and the conceptual charge model inwhich the four-way anticline was filled first, followed by thenortheastern onlap trap, and then the peripheral trap domains.
INTRODUCTION
The heavy-oil or bitumen reservoirs of northeast Alberta con-tain 1.8 trillion bbl of resources. Of this, almost 1 trillion bbl arecontained in the Lower Cretaceous Wabiskaw and McMurrayreservoirs of the Athabasca oil sands (Crowfoot et al., 2012).The Athabasca oil sands lie close to the eastern edge of theWestern Canada Sedimentary Basin (Figure 1) at outcrop or ashallow depth of burial, and therefore, their location has beenknown from direct observation even prior to the first de-scriptions by the Geological Survey of Canada (1875, 1883).However, the geometry and timing of development of the pe-troleum trap have remained elusive because the original trapwas destroyed by continued flexural loading of the basin andsubsequent uplift and erosion (Ranger, 1994). The objective ofthis study is to model the original trap to understand the trapgeometry and charge timing.
BACKGROUND
Basin Subsidence History, Megasequences, andPlay Elements
TheWesternCanada Sedimentary Basin comprises theAlbertaForeland Basin in the west and the Williston IntracratonicBasin in the southeast (Beaumont, 1981;Wright et al., 1994)(Figure 1). The Western Canada Sedimentary Basin devel-oped following a period of rifting in the Precambrian, whichwas followed by thermal subsidence along the passive mar-gin of western North America during the Paleozoic (Bondand Kominz, 1984; Klein and Hsui, 1987). The sedimentaryfill of the basin can be divided into several megasequences,each with a common subsidence mechanism and similar litho-logical characteristics. In the area of this study, the passive-margin megasequence (Figure 2) that was deposited duringPaleozoic thermal subsidence is incomplete because of thepresence of the Peace River arch (O'Connell, 1994), an im-portant, long-lived, dynamic structure in the basin. Therefore,stratigraphy of Cambrian to Silurian age is not represented,and thermal subsidence is recorded by stratigraphy of Middle

Figure 1. Regional map showing the location of the Athabasca oil sands and key tectonic elements. Position of the Peace River arch andSweetgrass arch is from Wright et al. (1994); oil sands outlines are from Crowfoot et al. (2012).
Devonian (which rests unconformably on Precam-brian basement) to Mississippian age (Kent, 1994).The sediments deposited during this time are amixed succession of carbonates, evaporates, andshales, including at least one significant source rock,the Upper Devonian Exshaw Formation (Creaneyet al., 1994). A period of relatively subdued sub-sidence (transitionalmegasequence; Figure 2) fromthe Late Mississippian to Late Jurassic was char-acterized by deposition of a siliciclastic-dominatedsuccession, which also includes at least one majorsource rock, the Lower Jurassic Gordondale (for-merly Nordegg) Member of the Fernie Group(Creaney et al., 1994).
A shift in sediment provenance from east towest during theLate Jurassic (Kimmeridgian)marksthe change to flexural subsidence as a result of de-velopment of the Rocky Mountain fold and thrust
belt (Beaumont, 1981; Price, 1981, 1994; Miall,2009) (Figure 1). The stratigraphy of the associatedforeland basin megasequence (Figure 2) is silici-clastic dominated and includes the siliciclastic res-ervoirs of the Mannville Group (latest Barremianto early Albian; Stott et al., 1993) (Figure 3). TheMannvilleGroupwas deposited in threemain axialtrends along the foreland basin, separated by ridgesof Paleozoic carbonates that were resistant to ero-sion (Stott et al., 1993; Hayes et al., 1994). Alongthe eastern axial trend, in the Athabasca area, ac-commodation space for the Mannville Group wasproduced both by dissolution of the DevonianPrairie Evaporite and erosion of the Devonian stra-tigraphy (Vigrass, 1968; Stott et al., 1993). Depo-sition of the Mannville Group began with fluvial-estuarine sands of the McMurray Formation andmarine sands of theWabiskawMember (Clearwater
Tozer et al. 431

Figure 2. Regional cross section showing the present-day geometry of the basin, the megasequences, and key play elements. The lineshowing estimated maximum burial at the top of the section is derived from vitrinite reflectance data compiled by Stasiuk et al. (2002).Refer to Figure 1 for location.
Formation); these were subsequently sealed by theshale member of the Clearwater Formation duringa major marine transgression in the early Albian(Stott et al., 1993) (Figure 3). In the Athabascaarea, the overburden stratigraphy is represented bymarine sediments of the Colorado Group (Stottet al., 1993) (Figure 3). Flexural subsidence con-tinued until the early Eocene, when a change fromactive compression to uplift and erosion is thoughtto have resulted from an episode of crustal exten-sion in the central part of the fold and thrust belt(Price, 1994).
Petroleum Systems and Trap Timing:Previous Studies
The source rock for the oil sands of northeast Al-berta remains controversial, with different emphasisplaced on the contribution from the Upper Devo-nian Exshaw Formation and the Lower JurassicGordondale (formerly Nordegg) Member (Figure 2).Based on geological and geochemical data, Riediger(1994) argued that theGordondale could not havebeen a major source for the oil sands, which areinstead dominated by contribution from the Exshaw(Adams et al., 2013), except locally in the PeaceRiver oil sands where charge from the Gordondale
432 E&P Note
can be recognized. In contrast, four-dimensionalbasin modeling and inorganic petroleum finger-printing suggest that the dominant source rock istheGordondale (Higley et al., 2009; Berbesi et al.,2012; Finlay et al., 2012). Other authors suggestthat a combination of these and additional sourcerocks is responsible (Creaney and Allan, 1990).
Regardless of this controversy, in northeast Al-berta, these source rocks were either eroded (Ex-shaw) or never deposited (Gordondale) during flex-ural loading of the Western Canada SedimentaryBasin. Petroleum systemsmodeling shows that sourcematurity was achieved during the Late Cretaceous,with peak generation in the source kitchen, whereflexural loading resulted in maximum burial in thebasin, during the latest Cretaceous and Paleocene(e.g., Creaney and Allan, 1990; Higley et al., 2009;Berbesi et al., 2012; see Adams et al., 2013, for areview); much of the petroleum then migratedhundreds of kilometers across the basin from westto east (Higley et al., 2009; Adams et al., 2013)(Figure 2). The Cretaceous Mannville Group sili-ciclastic reservoirs and Devonian Grosmont For-mation carbonate reservoir in northeast Albertaacted as the ultimate gathering point for the un-derlying source-carrier systems (Piggott and Lines,1991).
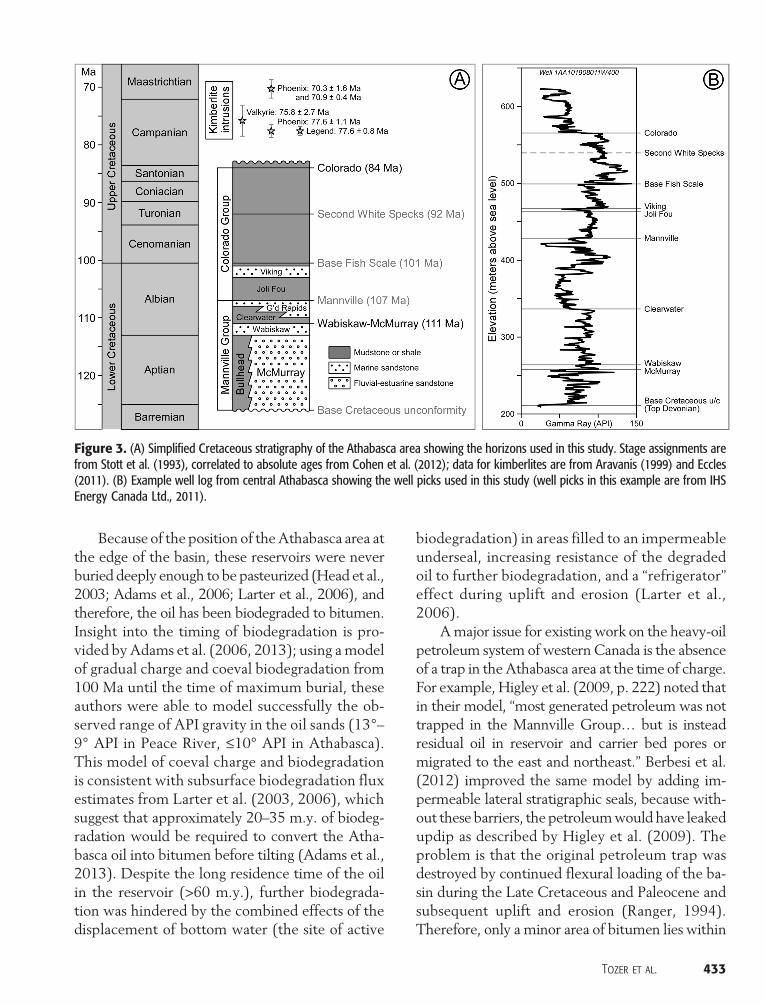
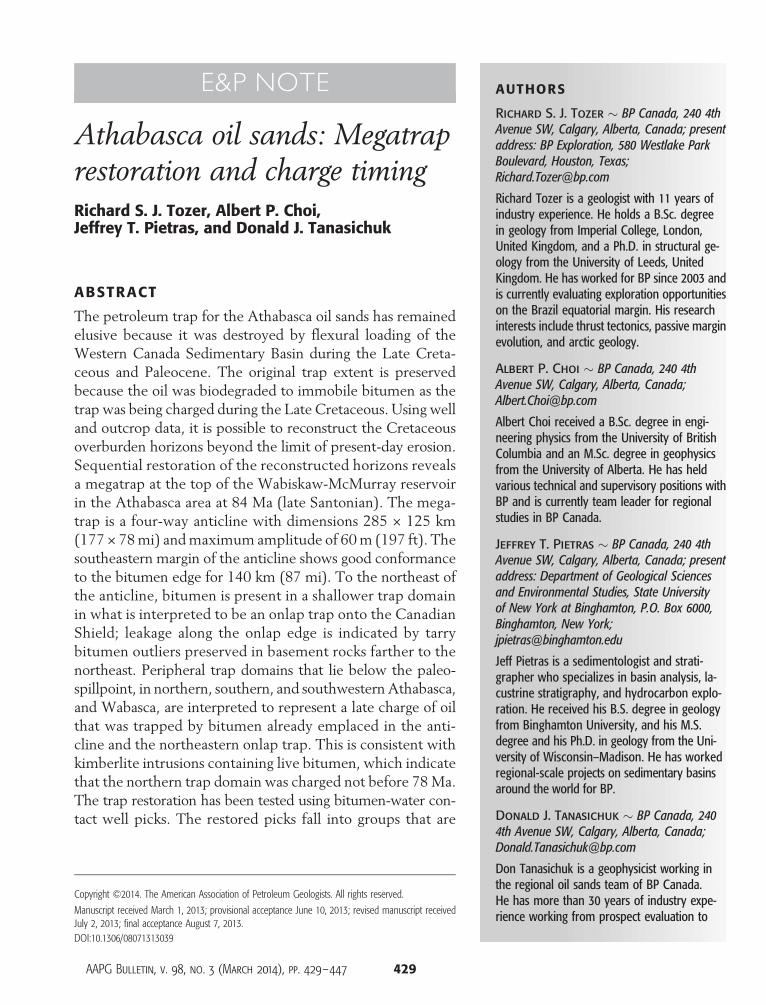
Figure 3. (A) Simplified Cretaceous stratigraphy of the Athabasca area showing the horizons used in this study. Stage assignments arefrom Stott et al. (1993), correlated to absolute ages from Cohen et al. (2012); data for kimberlites are from Aravanis (1999) and Eccles(2011). (B) Example well log from central Athabasca showing the well picks used in this study (well picks in this example are from IHSEnergy Canada Ltd., 2011).
Because of the position of theAthabasca area atthe edge of the basin, these reservoirs were neverburied deeply enough to be pasteurized (Head et al.,2003; Adams et al., 2006; Larter et al., 2006), andtherefore, the oil has been biodegraded to bitumen.Insight into the timing of biodegradation is pro-vided byAdams et al. (2006, 2013); using amodelof gradual charge and coeval biodegradation from100 Ma until the time of maximum burial, theseauthors were able to model successfully the ob-served range of API gravity in the oil sands (13°–9° API in Peace River, ≤10° API in Athabasca).This model of coeval charge and biodegradationis consistent with subsurface biodegradation fluxestimates from Larter et al. (2003, 2006), whichsuggest that approximately 20–35 m.y. of biodeg-radation would be required to convert the Atha-basca oil into bitumen before tilting (Adams et al.,2013). Despite the long residence time of the oilin the reservoir (>60 m.y.), further biodegrada-tion was hindered by the combined effects of thedisplacement of bottom water (the site of active
biodegradation) in areas filled to an impermeableunderseal, increasing resistance of the degradedoil to further biodegradation, and a “refrigerator”effect during uplift and erosion (Larter et al.,2006).
Amajor issue for existing work on the heavy-oilpetroleum system of western Canada is the absenceof a trap in the Athabasca area at the time of charge.For example, Higley et al. (2009, p. 222) noted thatin their model, “most generated petroleum was nottrapped in the Mannville Group… but is insteadresidual oil in reservoir and carrier bed pores ormigrated to the east and northeast.” Berbesi et al.(2012) improved the same model by adding im-permeable lateral stratigraphic seals, because with-out these barriers, the petroleumwould have leakedupdip as described by Higley et al. (2009). Theproblem is that the original petroleum trap wasdestroyed by continued flexural loading of the ba-sin during the Late Cretaceous and Paleocene andsubsequent uplift and erosion (Ranger, 1994).Therefore, only a minor area of bitumen lies within
Tozer et al. 433

structural closure today (Vigrass, 1968). Previousmodeling of the trap geometry is limited to thestudy by Ranger (1994); in that study, the as-sumption was that the bitumen-water contact(BWC)was originally horizontal, and has been tiltedby flexural loading of the basin after the oil wasbiodegraded to immobile bitumen. Therefore, bycorrecting the structure of the top of the reservoirso that the BWC is flattened, the geometry of thetrap at the time of oil accumulation can be re-constructed. Although the analysis is limited to thearea where the BWC can be picked and, therefore,closure of the trap is not demonstrated, the traprestoration of Ranger (1994) shows a gently south-plunging arch with a width of 150 km (93 mi) andmaximum relief of 60 m (197 ft).
ATHABASCA TRAP MODELING
Hypothesis and Method
The hypothesis for this study is that the trap couldbe reconstructed using a megaregional, basin-scaleview. Basin-scale horizon structure grids (hereaftercalled ‘horizon[s]’) were first constructed to honorthe present-day geometry of the Cretaceous stra-tigraphy, including areas where erosion has oc-curred (this process is fully described in the sectiontitled Data and Grid Modeling Methodology). Thehorizon corresponding to the boundary at the top ofthe Wabiskaw-McMurray reservoir and the base ofthe overlying of the Clearwater Formation (shalemember) seal was then sequentially restored byflattening each overburden horizon to a sea leveldatum; this yields an approximate paleostructuregrid (the method is similar to the isopach methoddescribed by Vigrass, 1968, p. 1991). Each top res-ervoir restoration was checked for structural clo-sure and/or conformance of bitumen to structureusing the published bitumen outline (Crowfootet al., 2012, their figure AE.4). Finally, the best traprestoration was tested by restoring well picks of theBWC using the same overburden horizon. The re-stored BWC picks were assessed to see if they fellinto areal groups of similar elevation that are con-sistent with the trap restoration.
434 E&P Note
Two key advantages of this method are pres-ent over the existing analysis by Ranger (1994).First, the trap restoration is not limited to the areacovered by the BWC, and second, the horizon thatrestores the trap geometry and BWC provides theprecise trap timing.
We have deliberately chosen not to use decom-paction in our modeling to present the simplestreconstruction possible. Defining the method andparameters for decompaction and reconstructingthe maximum burial datum are beyond the scopeof this article. However, reconnaissance modelingusing a standard method and parameters for de-compaction (Allen and Allen, 2005), combinedwith a maximum burial datum extrapolated fromMannville vitrinite reflectance data (Stasiuk et al.,2002), indicates that our conclusions would re-main the same.
Data and Grid Modeling Methodology
The horizons used in the trap model and theirconstituent well and outcrop data are summa-rized in Figure 3 and Table 1. Restorations of theWabiskaw-McMurray horizon using the Mann-ville, base Fish Scale Sandstone, and SecondWhiteSpecks Sandstone overburden horizons did notprovide significant insight into the trap geometryor timing, and therefore, the details of modelingfor these three horizons are omitted. The wellpicks for theWabiskaw-McMurray horizon are fromPaterson et al. (1978), Mossop and Shetsen (1994),Ranger (1994), Christopher (2003), IHS EnergyCanada Ltd. (2011) and proprietary sources; thosefor the Colorado horizon, which represents the topof the ColoradoGroup (Figure 3; Table 1), are fromIHS Energy Canada Ltd. (2011) and a proprietarysource only. The well-pick editing and horizonstructure grid modeling for this study were done inEarthVision® (EarthVision is a registered trade-mark of Dynamic Graphics, Inc.).
The outcrop data points used in this studycome from the most recent compilation of the ge-ology in the area by Okulitch and Fallas (2007).For the Wabiskaw-McMurray horizon, only threeoutcrop data points were included. These corre-spond to the eastern tip of the outcrop at the top of

Table 1. Data Used to Build the Cretaceous Horizon Structure Grids for This Study*
Well Top Pick and Horizon Name Stage Horizon Age (Ma) No. Well Picks after Editing No. Outcrop Picks
Colorado late Santonian 84 9143 14Second White Specks middle Turonian 92 11,314 14Base Fish Scale Albian–Cenomanian 101 13,690 n/aMannville middle Albian 107 18,645 n/aWabiskaw-McMurray early Albian 111 26,037 3McMurray BWC n/a n/a 1689 1 (Christina River)
*Stage assignments from Stott et al. (1993), absolute ages from Cohen et al. (2012). BWC = bitumen-water contact.
the shale member of the Bullhead Group in north-ern Alberta and two points where the Wabiskaw-McMurray unit onlaps the Devonian in westernSaskatchewan and northern Alberta (Figure 4).In the case of the Colorado horizon, the outcropdata come from northern Alberta only; the out-
Figure 4. Wabiskaw-McMurray present-day structure: regional (left(2012). Refer to Figure 1 for location.
crops that were included correspond to the al-most time-equivalent boundary at the top SmokyGroup–base Wapiti Formation (Stott et al., 1993)(Figure 4). The elevation values for all outlierswere taken from a regional digital elevation modelcovering the Western Canada Sedimentary Basin;
), subregional (right). Oil sands outline is from Crowfoot et al.
Tozer et al. 435

in areas where a significant thickness of Quater-nary till is present, this was also considered (mod-ified after Christopher, 2003; Atkinson and Lyster,2010). Having determined the coordinates andelevation of the outliers, these points were thengridded together with the well picks.
To define correctly the present-day horizon ge-ometry without the effects of recent erosion, twosteps were required during initial data editing. First,where the formation tops have been eroded and,therefore, no longer represent the original strati-graphic thickness, they were deleted. In the case ofthe Wabiskaw-McMurray, this was done by mak-ing a polygon from the outcrop edge correspondingto the top of the McMurray Formation (Okulitchand Fallas, 2007);Wabiskaw-McMurray well pickswithin this polygon were then deleted. In the caseof the Colorado, well picks that lie beyond thepresent-day subcrop edge are observed to be anom-alously deep and were deleted by hand; note thatin the Athabasca area, the full thickness of theColoradoGroup is preserved in local bedrock highsbeneath Quaternary till. Second, a series of pointswas added to each horizon to represent the esti-mated onlap edge of the basin onto the CanadianShield. The position of this onlap edge can be es-timated because a group of peaks exists in north-ern Saskatchewan at 600 m (1968 ft) elevationthat are composed of basement rocks of the Cana-dian Shield without sedimentary cover (Figure 1).Therefore, the base Cretaceous unconformity ho-rizon projects above these peaks, and the 600-m(1968-ft) structure contour on this horizon mustlie in a narrow zone between these peaks and out-crops to the southwest where the base Cretaceousunconformity is exposed at elevations of 500 m(1640 ft) and less (Okulitch and Fallas, 2007)(Figure 1). This 600-m (1968-ft) structure con-tour was added as a series of points to the wellpicks for the overlying horizons; the onlap edgeestimated using this method is shown in crosssection in Figure 2.
Having removed the eroded well picks and ad-ded the estimated onlap edge, a raw horizon struc-ture grid was generated. The grid elevation valueat each well pick was then determined by back-interpolation to the horizon, and picks beyond a
436 E&P Note
±20-m (±66-ft) buffer were deleted. Because ofthe number of data involved, this step is a quickand objective way of removing a large number ofoutlying picks; these are thought to be causedby basic errors in pick elevation, log-depth calibra-tion, or the well survey. The data were then re-gridded, and any remaining outlying picks were re-moved by hand editing during three-dimensionalvisualization. An additional quality control step wasalso conducted by creating isochore grids for theinterval above and below the horizon of interest andthen hand editing the picks to remove any isochoreanomalies. The resultant edited picks were thenused to create the final horizon structure grid.
The BWC well picks are from proprietarysources only, supplemented by a single outcroppoint from the Christina River. The picks were re-stored directly using the Colorado horizon to testthe trap restoration.
ATHABASCA TRAP: RESULTSAND INTERPRETATION
Wabiskaw-McMurray Present-Day Structure
The present-day structure of theWabiskaw-McMurray(Figure 4) shows limited areal and vertical closure(330–300 m [1082–984 ft] elevation, dimensions170 × 95 km [106 × 59 mi]), mainly confined tothe northern Athabasca area; a similar feature wasrecognized by Vigrass (1968). Although poor agree-ment of this closure exists with the published bitu-men outline (Crowfoot et al., 2012), moderate con-formance of the southeast bitumen edge is foundat 200m (656 ft) elevation for a distance of 85 km(53 mi). The west and east margins of this closureare coincident with the Grosmont escarpmentand the edge of the Prairie Evaporite, respectively.A major east–west-trending structural high canbe traced through the Athabasca area to the limitof well data and up to the outcrop edge (whereCretaceous sediments rest directly on basementrocks of the Canadian Shield; Okulitch and Fallas,2007) in western Saskatchewan; this structuralhigh represents the present-day expression ofthe Athabasca arch (Okulitch and Fallas, 2007).

Figure 5.Wabiskaw-McMurray paleostructure, restored using the 84-Ma (late Santonian) Colorado horizon: regional (left), subregional(right). Note the presence of a major four-way anticline in the Athabasca area with structural closure at 300 m (984 ft) depth. P, V, L =Phoenix, Valkyrie, and Legend kimberlite intrusions, respectively. Oil sands outline is from Crowfoot et al. (2012). Refer to Figure 1 forlocation.
Although the original trap is no longer present inthe Athabasca area, the bitumen is, of course, im-mobile and therefore remains in place.
Wabiskaw-McMurray Paleostructure at 107,101, and 92 Ma
The paleostructure of the Wabiskaw-McMurrayshows poor conformance with the published bitu-men outline when restored with the Mannville(middle Albian, 107 Ma) and base Fish Scale(Albian–Cenomanian, 101 Ma) horizons (stage as-signments from Stott et al., 1993; absolute agesfrom Cohen et al., 2012). The paleostructure showsonly moderate conformance with the bitumen out-line when restored with the Second White Specks
(middle Turonian, 92 Ma) horizon. In all three re-storations, the Wabiskaw-McMurray paleostructureshows only isolated areas within structural clo-sure. These paleostructure maps are therefore notpresented.
Wabiskaw-McMurray Paleostructure at 84 Ma
The paleostructure grid of the Wabiskaw-McMurrayhorizon restored at 84 Ma using the Colorado ho-rizon (late Santonian; stage assignment from Stottet al., 1993; absolute age from Cohen et al., 2012)shows the presence of amajor four-way anticline inthe central Athabasca area (Figure 5). The deepestclosing contour is at a depth of 300 m (984 ft),although this contour must be closed by hand
Tozer et al. 437

Figure 6. The Athabasca oil sands can be divided into six trapdomains using the 300- and 270-m (984- and 886-ft) paleo-structure (84 Ma) depth contours and the published bitumenoutline (Crowfoot et al., 2012).
through the saddle area to the east of the anticlinecrest. The anticline has good conformance at 300m(984 ft) depth along the southeast of the pub-lished bitumen outline (Crowfoot et al., 2012)for a distance of 140 km (87 mi). The dimensionsof the anticline are 285 km (177 mi) (northwestto southeast) by 50 km (31 mi) width in the southand 125 km (78 mi) width in the north; the max-imum amplitude of the anticline is 60 m (197 ft),from 240 to 300 m (787 to 984 ft) restored depth(approximately 300 to 360 m [984 to 1181 ft]restored depth with decompaction and erosionconsidered).
This four-way anticline is interpreted to rep-resent the primary structural trap in the Athabascaarea, and it explains why the bitumen is foundconcentrated in one area on the basin margin. Thegeometry of the anticline is interpreted to havebeen generated by two major trap-forming ele-ments; the arch on the west side of the PrairieEvaporite edge (the north–south-trending trap ele-ment) and the Athabasca arch (the east–west-trending trap element). Dissolution of the PrairieEvaporite and the consequent dip reversal of theoverlying Cretaceous stratigraphy have long beenrecognized as an important trap element (Vigrass,1968). However, we also emphasize the role ofthe east–west-trending Athabasca arch (Okulitchand Fallas, 2007), which is contiguous with thePeace River arch, an important, long-lived, dy-namic structure in the basin (see O'Connell, 1994,and references therein). The maps indicate thatthe Athabasca arch was active as a subtle positivefeature during the Late Cretaceous (Figure 5) andremains so today (Figure 4). In addition to its func-tion in creating the trap, it would also have actedto focus the petroleum charge toward the Atha-basca area.
The extremely shallow depth of burial in theAthabasca area that is shown by the paleostructuremap at 84 Ma (Figure 5) is notable. Petroleum sys-tems modeling indicates that the reservoir tem-perature in the Athabasca area never exceeded45°C (Adams et al., 2006; Larter et al., 2006),which is significantly below the 80°C lower limitfor pasteurization (e.g., Head et al., 2003; Adamset al., 2006, and references therein). Therefore,
438 E&P Note
we interpret that charge and biodegradation ofpetroleum in Athabasca were coeval; this is sup-ported by petroleum systems modeling (Adamset al., 2006, 2013). However, in addition to thisimportant process of coeval charge and biodeg-radation, the trap restoration suggests that thedistribution of bitumen was strongly controlled bystructural and stratigraphic trap elements. Theseare described in the following section.
Athabasca Trap Domains
Using the structural restoration, it is possible todivide the Athabasca oil sands into six differenttrap domains; these are summarized in Figure 6

Table 2. Trap Domain Areas
Trap Domain Trap Type Area (km2) % of Total Area
Central Athabasca Structural trap (four-way anticline) 23,444 43.6Northeastern Athabasca Stratigraphic (onlap) trap 3617 6.7Northern Athabasca Bitumen trap 12,910 24.0Southern Athabasca Bitumen trap 1393 2.6Southwestern Athabasca Bitumen trap 4762 8.8Wabasca Bitumen trap 7684 14.3Total 53,810
and Table 2. The giant paleostructure anticlinewith closure at 300 m (984 ft) restored depth isinterpreted as the primary trap in the Athabascaarea. As discussed, this structure is interpreted tohave developed because of interaction of the north–south-trending arch on the west side of the PrairieEvaporite edge and the east–west-trending Atha-basca arch. Note that the anticline accounts for44% of the Athabasca oil sands by area. We in-terpret that the anticline was being charged by oileven as it developed at 84Ma, and that this oil wasrapidly biodegraded to immobile bitumen. Thisinterpretation is consistent with petroleum sys-temsmodeling showing, first, the onset of peak oilgeneration in the Late Cretaceous (Creaney andAllan, 1990; Higley et al., 2009; Berbesi et al.,2012; see Adams et al., 2013, for a review), andsecond, coeval charge and biodegradation (Adamset al., 2006, 2013). The initial bitumen that col-lected in the central four-way anticline would haveblocked the porosity and permeability, and thiswould explain why a regional paleogas cap is ab-sent in this area.
The shallowest trap edge (both present andrestored) is found in the northeastern trap domain,where the paleostructure reaches depths of 200 m(656 ft) and less. The lower limit of the northeast-ern trap domain is placed at the 270-m (886-ft)paleostructure depth contour on the basis of a shal-low population of BWC picks that lie to the eastof this line. We interpret this trap domain to be astratigraphic trap where the reservoir interval on-laps the Canadian Shield (see Ranger, 1994, for asimilar interpretation). This is supported by thepresence of tarry bitumen outliers that are found in
basement rocks farther to the northeast (Wilsonet al., 2007), along trend with the Athabasca arch.The bitumen outliers are interpreted to representleakage along the stratigraphic pinch-out at theedge of the trap (Ranger, 1994; Adams et al., 2013).Additional outliers of tarry bitumen to the northof this trap domain (Wilson et al., 2007) are inter-preted to indicate the original reservoir footprintprior to Cenozoic erosion. The observation thatthe shallowest trap domain is located in northeastAthabasca agrees with the description of Ranger(1994) that the thickest zones of lean bitumenand water are found at the top of the reservoir in-terval in this area. These are thought to represent apaleogas cap that accumulated in this area, leakedoff during uplift and erosion, and was subsequentlyfilled by meteoric water. Fustic et al. (2012) arguethat the gas was more likely to have been of bio-genic origin.
The bitumen in the northern trap domain liesbelow the 270-m (886-ft) paleostructure depthcontour. This trap domain includes the saddle areabetween the central four-way anticline and north-eastern onlap trap and is interpreted to represent alate charge of oil that was trapped below thesetrap domains by bitumen already emplaced. Onthe north flank of the saddle, a strong stratigraphiccomponent almost certainly exists to the west (on-lap onto the Grosmont ridge) and north (facieschange to the shalemember of the BullheadGroup)edges of this trap domain.
The final three trap domains are located insouthern and southwestern Athabasca and Wa-basca. These trap domains lie below the 300-m(984-ft) paleostructure spillpoint and are also
Tozer et al. 439
interpreted to represent a late charge of oil thatwas trapped by bitumen already emplaced in thecentral four-way anticline. The ragged southwestmargins of all three trap domains are thought tohave a strong stratigraphic (facies change) com-ponent, whichwould also have been enhanced bythe regional dip of the reservoir into the basin.The north edge of the Wabasca trap domain isinterpreted as onlap onto the Devonian subcrop(Figure 6).
Figure 7. McMurray bitumen-water contact (BWC) picks re-stored using the 84-Ma Colorado horizon. Note the increase indepth of the restored BWC between the central four-way anti-cline and the peripheral trap domains (northern and south-western), and the shallower depth of the restored BWC in thenortheastern onlap trap.
Bitumen-Water Contact Restoration
A key component of the new trap hypothesis isthat the paleotrap model can be tested using theBWC. Assuming this was originally a subhorizon-tal oil–water contact, the overburden horizon thatrestores the trap should also return the BWC to itsoriginal orientation.
When the BWC data are viewed in three di-mensions, significant local variation in the BWC isapparent. Ranger (1994) suggested three reasonsfor this. First, structural events (e.g., faulting, karstcollapse, salt collapse) that occurred after biodeg-radation would have lowered the BWC elevationin affected areas. Second, many wells have a sig-nificant transition zone between the bitumen andunderlying aquifer, instead of an abrupt BWC; theelevation where the BWC is picked in the transitionzone is therefore subjective. Third, basic errors inpick elevation, log-depth calibration, orwell surveymay also be a source of the observed variation.
An additional two factors may also be signifi-cant. First, in view of the scale of the oil sands, asignificant variation in the oil–water contact causedby original structural, stratigraphic, or other factorsmight be expected (for examples of these factors,see Jolley et al., 2010). In the Athabasca area, ex-amples of lateral reservoir compartmentalizationcaused by local stratigraphic complexity are doc-umented by Fustic et al. (2012), and primary var-iation of the BWC is shown by an outcrop of theMcMurray Formation exposed at the ChristinaRiver (east of Fort McMurray), where the BWC isan irregular surface that varies in elevation by 2 m(6.6 ft) over approximately 8 m (26 ft) of distance(Ranger, 1994). Second, local variations in the
440 E&P Note
resistivity of the pore water are known to be pres-ent along the edge of the Prairie Evaporite; con-sequently, where the BWC has been picked fromresistivity alone, without the use of core, it maybe incorrect.
Our hypothesis is that the different trap do-mains originally had different BWCs. This wastested by first determining the elevation of theColorado horizon structure grid at each BWC pickby back-interpolation. The difference between theColorado elevation and the BWC elevation repre-sents the restored depth of the BWC point at 84Ma.The points were then divided into different popu-lations corresponding to the central, northeastern,

Figure 8. Paleostructure cross section showing distance versus depth of the McMurray bitumen-water contact (BWC) after restorationusing the 84-Ma Colorado horizon; note the different restored BWC elevations in the different trap domains. The points have beenprojected to a common plane oriented southwest–northeast.
northern, and southwestern trap domains. In eachof these areas, the mean present-day elevation andrestored depth of the BWC was then determined.The results of this are shown in Figures 7 and 8 andTable 3.
The restored picks fall into groups that areconsistent with the trap domains determined fromthe top Wabiskaw-McMurray reservoir restoration.
Table 3. Results of McMurray Bitumen-Water Contact Modeling*
Trap DomainNumber ofBWC Picks
Mean BWCElevation Present
Day (m)
Central 1095 204.1Northeastern 35 296.9Northern: saddle north flank 367 230.9Northern: saddle south flank 127 237.0Southwestern 66 174.3Total 1690
*BWC = bitumen-water contact.
The northeastern (onlap) trap domain has theshallowest restored BWC at 319m (1046 ft) depth,followed by the central (four-way anticline) trapdomain at 351m (1151 ft), the southwestern trapdomain at 366 m (1200 ft), and the northern trapdomain at 361 and 394 m (1184 and 1292 ft),respectively, on the south and north flanks of thesaddle between the central and northeastern trap
StandardDeviation Present
Day (m)
Mean BWC Depthafter Restorationat 84 Ma (m)
StandardDeviation afterRestoration (m)
28.1 350.7 16.813.8 318.5 13.820.2 393.4 18.720.0 360.6 18.913.1 365.5 11.6
Tozer et al. 441

Figure 9. Dip cross section through the southwestern, central, and northeastern trap domains. (a) Present day, (b) restored using the84-Ma Colorado horizon, (c) restored section with bitumen fill showing the bitumen-water contact (BWC) depths in the different trapdomains. See Figures 4 and 5 for location.
442 E&P Note

Table 4. Data for Key Kimberlite Intrusions in Northwest Athabasca (Northern Trap Domain)*
Kimberlite Drill Hole Coordinates (m; NAD27 UTM12N) Radiometric Age (Ma)
Phoenix 98DH-PH01 351500 E; 6330580 N 77.6 ± 1.1 (U-Pb perovskite)70.9 ± 0.4 (Rb-Sr phlogopite)70.3 ± 1.6 (U-Pb perovskite)
Valkyrie 98DH-VA02 362350 E; 6355490 N 75.8 ± 2.7 (U-Pb perovskite)Legend 98DH-LE01 386200 E; 6340600 N 77.6 ± 0.8 (Rb-Sr phlogopite)
*Compiled from Aravanis (1999) and Eccles (2011).
domains (Figure 8). The difference in these eleva-tions is consistent with the interpretation thatthe central four-way anticline was filled first,followed by the shallower northeastern onlap trap,and then the deeper peripheral trap domains,which would have been sealed by immobile bi-tumen farther updip. The trap geometry and re-stored BWCs are illustrated by the cross sectionsin Figure 9.
Note that the standard deviation of the BWCpicks in the central four-way anticline improvessignificantly from 28m (92 ft) today to 17m (56 ft)when restored (Table 3); this trap domain hasthe broadest spatial extent, and therefore, this im-provement supports the structural restoration ofthe paleotrap. The standard deviation of the re-stored BWC picks in the other trap domains alsoshowsmoderate improvement, with the exceptionof the northeastern onlap trap, which remains thesame because of its limited spatial extent.
We speculate that the discrepancy betweenthe restored BWCs for the central and north-eastern trap domains (at 351 and 319 m [1151and 1046 ft], respectively) and the paleostructurecontours used to define the lower limit of thesetrap domains (at 300 and 270 m [984 and 886 ft],respectively) is meaningful. In both areas, the dif-ference is 50 m (164 ft) and would equate ap-proximately to the boundary between the middleand upper McMurray; above this boundary, changeto more laterally extensive marine shales of theupper McMurray is evident (Ranger, 1994). Weinterpret this boundary to represent an importantbaffle that controlled vertical petroleummigrationin the Athabasca oil sands; therefore, the spillpointof this boundary can still be recognized in the re-stored BWC.
Kimberlites and Charge Timing
Aperiod of diamond exploration from1990 to 2010revealed the presence of numerous kimberlite pipesof Late Cretaceous and Paleocene age in north-ern Alberta (Eccles, 2011). Fifty-one kimberlitepipes have been discovered to date in three distinctclusters: Mountain Lake (2), Buffalo Head Hills(41), and Birch Mountains (8); the Birch Moun-tains kimberlite cluster lies on the northwesternmargin of the Athabasca oil sands (Eccles, 2011).
Radiometric age dates have been determinedfor the kimberlites (Aravanis, 1999; Eccles, 2011),and therefore, their spatial and temporal relation-ship to the bitumen (coked vs. unaltered; S. R.Larter, 2012, personal communication) providesan independent test for our model of trap andcharge timing. The kimberlites are a blind test be-cause the trap restorationwas completed beforewewere aware of this information. The original geo-logical descriptions for the 19 kimberlite explorationdrill holes (Aravanis, 1999) were reviewed to checktheir relationship to the bitumen. Bitumen is de-scribed for only three of the exploration drill holes,the Phoenix, Valkyrie, and Legend kimberlites; inall three cases, the descriptions suggest that thebitumen in the kimberlites is live and has not suf-fered thermal alteration. For example, core fromthe Valkyrie kimberlite is described as “black me-dium grained fragmental, competent bitumen-rich kimberlite… the nature of this unit [is] thatit is “soaked” in bitumen (bitumen is oozing fromthe core causing both black and faint yellow stain-ing)” (Aravanis, 1999, p. 276). Similar descriptionsfor the other two drill holes strongly suggest thatpetroleum charge occurred after intrusion of thekimberlites.
Tozer et al. 443

Figure 10. Conceptual charge model for the Athabasca oil sands. (A) Initial charge of the central four-way anticline around 84 Ma. (B)Charge of the northeastern onlap trap domain down to 270 m (886 ft) depth. (C) Charge of the peripheral trap domains below the 300-m(984-ft) spillpoint; charge of the northern trap domain not before 78-Ma kimberlites (data for kimberlites from Aravanis, 1999; Okulitchand Fallas, 2007; Eccles, 2011). (D) Uplift and erosion from Eocene to present; the original trap footprint and onlap edge are indicated byoutliers of tarry bitumen in basement rocks of the Canadian Shield (Wilson et al., 2007).
The radiometric age dates for the kimberlites(Figure 3; Table 4) indicate that all three intrusionsare middle Campanian to early Maastrichtian inage (the spread of dates is 78 to 70 Ma). Relativeto the top reservoir paleostructure at 84 Ma, thePhoenix and Legend kimberlites lie almost exactlyon the 300-m (984-ft) closing contour, whereastheValkyrie kimberlite lies farther downdip in thenorthern trap domain at 334 m (1095 ft) paleo-depth (Figure 5). Therefore, the data for the kim-berlites are consistent with the interpretation thatthe central four-way anticlinewas filled first, around84 Ma, whereas the northern trap domain experi-enced later oil charge, not before 78 Ma. If furtherkimberlites are discovered in the other paleotrapdomains, these would allow the sequence of chargetiming to be understood further.
The trap restoration and data for the kimber-lites are inconsistent with the 111.6 ± 5.3 Marhenium-osmium (Re-Os) isochron age of bitu-men from the Alberta oil sands (Selby and Creaser,2005). Not only does this predate deposition ofthe Clearwater seal, but we also note that a criticalassumption of the Re-Os technique is that the
444 E&P Note
petroleum is derived from a single source rock,whereas there is agreement that multiple sourcerocks exist for the oil sands (e.g., Finlay et al., 2012,and references therein). Additional issues with theRe-Os technique aredescribedbyLarter et al. (2012).These problemsmay explain why the 112-Ma dateis inconsistent with our geological model of traptiming (84Ma), the charge timing indicated by thekimberlites (<78Ma; Aravanis 1999; Eccles 2011),and existing petroleum systems models that in-dicate that source maturity was achieved duringthe Late Cretaceous, with peak generation duringthe latest Cretaceous and Paleocene (Creaney andAllan, 1990;Higley et al., 2009; Berbesi et al., 2012;see Adams et al., 2013, for a review).
In summary, the conceptual charge model forthe Athabasca oil sands is illustrated in Figure 10and is described as follows:
a. Initial fill of the central Athabasca four-way anti-cline during the late Santonian (Colorado horizon,84 Ma). Our interpretation that the early oil-richcharge in this area was subjected to coeval bio-degradation is consistent with petroleum systems
modeling (Adams et al., 2006, 2013). The re-sultant bitumen would have blocked the po-rosity and permeability in this trap domain, andthis would explain why a regional paleogas capis absent in this area.
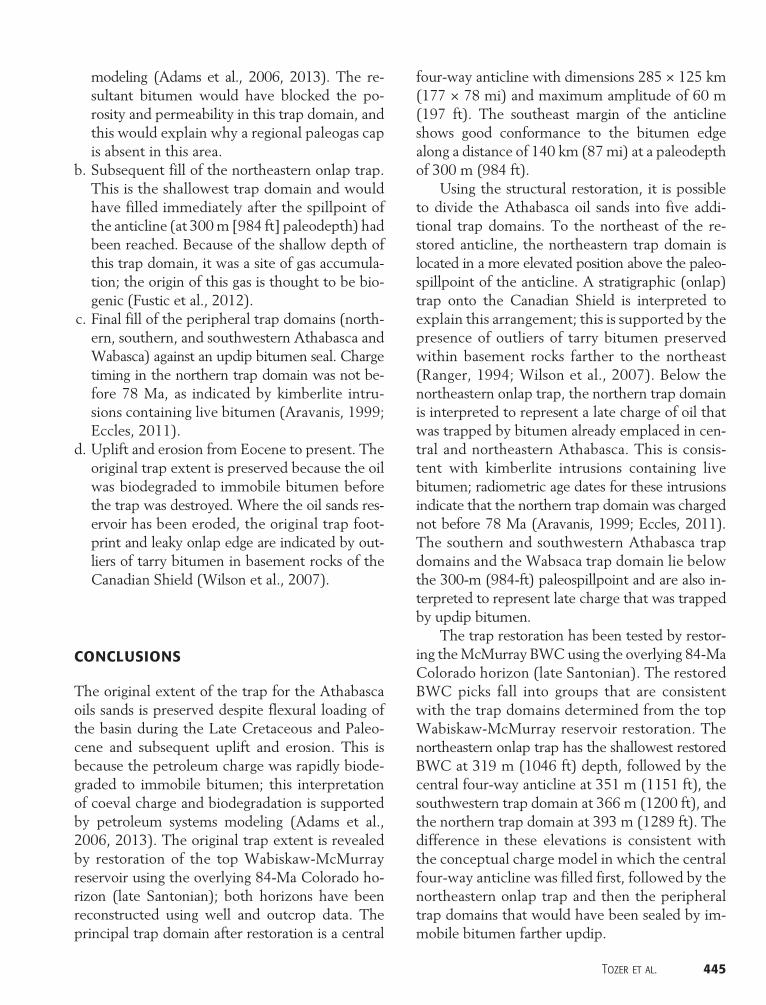
b. Subsequent fill of the northeastern onlap trap.This is the shallowest trap domain and wouldhave filled immediately after the spillpoint ofthe anticline (at 300m [984 ft] paleodepth) hadbeen reached. Because of the shallow depth ofthis trap domain, it was a site of gas accumula-tion; the origin of this gas is thought to be bio-genic (Fustic et al., 2012).
c. Final fill of the peripheral trap domains (north-ern, southern, and southwestern Athabasca andWabasca) against an updip bitumen seal. Chargetiming in the northern trap domain was not be-fore 78 Ma, as indicated by kimberlite intru-sions containing live bitumen (Aravanis, 1999;Eccles, 2011).
d. Uplift and erosion from Eocene to present. Theoriginal trap extent is preserved because the oilwas biodegraded to immobile bitumen beforethe trap was destroyed. Where the oil sands res-ervoir has been eroded, the original trap foot-print and leaky onlap edge are indicated by out-liers of tarry bitumen in basement rocks of theCanadian Shield (Wilson et al., 2007).
CONCLUSIONS
The original extent of the trap for the Athabascaoils sands is preserved despite flexural loading ofthe basin during the Late Cretaceous and Paleo-cene and subsequent uplift and erosion. This isbecause the petroleum charge was rapidly biode-graded to immobile bitumen; this interpretationof coeval charge and biodegradation is supportedby petroleum systems modeling (Adams et al.,2006, 2013). The original trap extent is revealedby restoration of the top Wabiskaw-McMurrayreservoir using the overlying 84-Ma Colorado ho-rizon (late Santonian); both horizons have beenreconstructed using well and outcrop data. Theprincipal trap domain after restoration is a central
four-way anticline with dimensions 285 × 125 km(177 × 78 mi) and maximum amplitude of 60 m(197 ft). The southeast margin of the anticlineshows good conformance to the bitumen edgealong a distance of 140 km (87mi) at a paleodepthof 300 m (984 ft).
Using the structural restoration, it is possibleto divide the Athabasca oil sands into five addi-tional trap domains. To the northeast of the re-stored anticline, the northeastern trap domain islocated in a more elevated position above the paleo-spillpoint of the anticline. A stratigraphic (onlap)trap onto the Canadian Shield is interpreted toexplain this arrangement; this is supported by thepresence of outliers of tarry bitumen preservedwithin basement rocks farther to the northeast(Ranger, 1994; Wilson et al., 2007). Below thenortheastern onlap trap, the northern trap domainis interpreted to represent a late charge of oil thatwas trapped by bitumen already emplaced in cen-tral and northeastern Athabasca. This is consis-tent with kimberlite intrusions containing livebitumen; radiometric age dates for these intrusionsindicate that the northern trap domain was chargednot before 78 Ma (Aravanis, 1999; Eccles, 2011).The southern and southwestern Athabasca trapdomains and the Wabsaca trap domain lie belowthe 300-m (984-ft) paleospillpoint and are also in-terpreted to represent late charge that was trappedby updip bitumen.
The trap restoration has been tested by restor-ing theMcMurray BWCusing the overlying 84-MaColorado horizon (late Santonian). The restoredBWC picks fall into groups that are consistentwith the trap domains determined from the topWabiskaw-McMurray reservoir restoration. Thenortheastern onlap trap has the shallowest restoredBWC at 319 m (1046 ft) depth, followed by thecentral four-way anticline at 351 m (1151 ft), thesouthwestern trap domain at 366 m (1200 ft), andthe northern trap domain at 393 m (1289 ft). Thedifference in these elevations is consistent withthe conceptual charge model in which the centralfour-way anticline was filled first, followed by thenortheastern onlap trap and then the peripheraltrap domains that would have been sealed by im-mobile bitumen farther updip.
Tozer et al. 445

REFERENCES CITED
Adams, J., C. Riediger, M. Fowler, and S. Larter, 2006, Ther-mal controls on biodegradation around the Peace Rivertar sands: Paleo-pasteurization to the west: Journal ofGeochemical Exploration, v. 89, p. 1–4, doi:10.1016/j.gexplo.2005.11.004.
Adams, J., S. Larter, B. Bennett, H. Huang, J. Westrich, andC. van Kruisdijk, 2013, The dynamic interplay of oilmixing, charge timing, and biodegradation in formingthe Alberta oil sands: Insights from geologic modelingand biogeochemistry, in F. J. Hein, D. Leckie, S. Larter,and J. Suter, eds., Heavy-oil and oil-sand petroleum sys-tems in Alberta and beyond: AAPG Studies in Geology64, p. 23–102.
Allen, P. A., and J. R. Allen, 2005, Basin analysis, principlesand applications, 2d ed.: Oxford, Blackwell Publishing,549 p.
Aravanis, T., 1999, Legend property assessment report: AlbertaEnergy, Mineral Assessment Report MIN 20000003,1208 p.
Atkinson, N., and S. Lyster, 2010, Thickness and distributionof Quaternary and Neogene sediment in Alberta, Canada(GIS data, ASCII grid format): Alberta Geological Sur-vey, DIG 2010–0036.
Beaumont, C., 1981, Foreland basins: Geophysical Journal ofthe Royal Astronomical Society, v. 65, p. 291–329, doi:10.1111/j.1365-246X.1981.tb02715.x.
Berbesi, L. A., R. di Primio, Z. Anka, B. Horsfield, and D. K.Higley, 2012, Source rock contributions to the LowerCretaceous heavy-oil accumulations in Alberta: A basinmodeling study: AAPG Bulletin, v. 96, p. 1211–1234,doi:10.1306/11141111064.
Bond, G. C., and M. A. Kominz, 1984, Construction of tec-tonic subsidence curves for the early Paleozoic miogeo-cline, southern Canadian Rocky Mountains: Implica-tions for subsidence mechanisms, age of breakup, andcrustal thinning: Geological Society of America Bulletin,v. 95, p. 155–173, doi:10.1130/0016-7606(1984)95<155:COTSCF>2.0.CO;2.
Christopher, J. E., 2003, Jura-Cretaceous Success Formationand lower Mannville Group of Saskatchewan: Saskatch-ewan Geological Survey Report 223, 128 p.
Cohen, K. M., S. Finney, and P. L. Gibbard, 2012, Interna-tional chronostratigraphic chart: International Commis-sion on Stratigraphy, accessed July 1, 2013, http://www.stratigraphy.org/.
Creaney, S., and J. Allan, 1990, Hydrocarbon generation andmigration in the Western Canada sedimentary basin,in J. Brooks, ed., Classic petroleum provinces: GeologicalSociety (London) Special Publication 50, p. 189–202.
Creaney, S., J. Allan, K. S. Cole, M. G. Fowler, P. W. Brooks,K. G. Osadetz, R. W. Macqueen, L. R. Snowdon, andC. L. Riediger, 1994, Petroleum generation andmigrationin the Western Canada sedimentary basin (chapter 31),inG.Mossop and I. Shetsen, eds., Geological atlas of theWesternCanada sedimentary basin: Canadian Society ofPetroleum Geologists and Alberta Research Council,p. 455–468.
446 E&P Note
Crowfoot, C., R. Marsh, K. Parks, and F. Hein, eds., 2012,Alberta’s energy reserves 2011 and supply/demand out-look 2012–2021: Energy Resources Conservation BoardReport ST98-2012, 290 p.
Eccles, D. R., 2011, Northern Alberta Kimberlite province:The first 20 years : Energy Resources Conservation Boardand Alberta Geological Survey Bulletin, v. 65, 119 p.
Finlay, A. J., D. Selby, and M. J. Osborne, 2012, Petroleumsource rock identification of United Kingdom Atlanticmargin oil fields and the western Canadian oil sands usingplatinum, palladium, osmium and rhenium: Implicationsfor global petroleum systems: Earth and Planetary ScienceLetters, v. 313–314, p. 95–104, doi:10.1016/j.epsl.2011.11.003.
Fustic, M., B. Bennett, H. Huang, and S. Larter, 2012, Dif-ferential entrapment of charged oil—New insights onMcMurray Formation oil trapping mechanisms: Marineand Petroleum Geology, v. 36, p. 50–69, doi:10.1016/j.marpetgeo.2012.05.004.
Geological Survey of Canada, 1875, Map showing the routetravelled by Prof. John Macoun M.A. from the forks ofthe Peace and Smoky Rivers to Carlton House Saskatch-ewan River: Geological Survey of Canada, MulticoloredGeological Map 112, 1 sheet, scale 1:2,534,400, ac-cessed July 1, 2013, http://geoscan.nrcan.gc.ca/geoscan-index.html, doi:10.4095/214378.
Geological Survey of Canada, 1883, Map of part of the Atha-basca River to illustrate Dr Bell’s exploration: GeologicalSurvey of Canada, Multicoloured Geological Map 173,1 sheet, scale 1:506,880, accessed July 1, 2013, http://geoscan.nrcan.gc.ca/geoscan-index.html, doi:10.4095/107249.
Hayes, B. J. R., J. E. Christopher, L. Rosenthal, G. Los, B.McKercher, D. Minken, Y. M. Tremblay, and J. Fennell,1994, Cretaceous Mannville Group of theWestern Can-ada sedimentary basin (chapter 19), in G. Mossop andI. Shetsen, eds., Geological atlas of the Western Canadasedimentary basin: Canadian Society of Petroleum Geol-ogists and Alberta Research Council, p. 317–334.
Head, I. M., D. M. Jones, and S. R. Larter, 2003, Biologicalactivity in the deep subsurface and the origin of heavy oil:Nature, v. 426, p. 344–352, doi:10.1038/nature02134.
Higley, D. K., M. D. Lewan, L. N. R. Roberts, and M. Henry,2009, Timing and petroleum sources for the Lower Cre-taceous Mannville Group oil sands of northern Albertabased on 4-D modeling: AAPG Bulletin, v. 93, p. 203–230, doi:10.1306/09150808060.
IHS Energy Canada Ltd., 2011,Well data (Canada) database:Calgary, Alberta, Canada.
Jolley, S. J., Q. J. Fisher, and R. B. Ainsworth, 2010, Reser-voir compartmentalization: An introduction, in S. J.Jolley, Q. J. Fisher, R. B. Ainsworth, P. J. Vrolijk, andS. Delisle, eds., Reservoir compartmentalization: Geo-logical Society (London) Special Publication 347, p. 1–8.
Kent, D. M., 1994, Paleogeographic evolution of the cratonicplatform—Cambrian to Triassic (chapter 7), inG. Mossopand I. Shetsen, eds., Geological atlas of theWestern Can-ada sedimentary basin: Canadian Society of PetroleumGeologists and Alberta Research Council, p. 69–86.
Klein, G. deV., and A. T. Hsui, 1987, Origin of cratonic basins:Geology, v. 15, p. 1094–1098, doi:10.1130/0091-7613(1987)15<1094:OOCB>2.0.CO;2.
Larter, S., A. Wilhelms, I. Head, M. Koopmans, A. Aplin, R.Di Primio,C. Zwach,M. Erdmann, andN.Telnaes, 2003,The controls on the composition of biodegraded oils inthe deep subsurface—Part 1. Biodegradation rates in pe-troleum reservoirs: Organic Geochemistry, v. 34, p. 601–613, doi:10.1016/S0146-6380(02)00240-1.
Larter, S., H. Huang, J. Adams, B. Bennett, O. Jokanola, T.Oldenburg, M. Jones, I. Head, C. Riediger, andM. Fowler,2006, The controls on the composition of biodegradedoils in the deep subsurface: Part II—Geological controlson subsurface biodegradation fluxes and constraints onreservoir-fluid property prediction: AAPG Bulletin,v. 90, p. 921–938, doi:10.1306/01270605130.
Larter, S., et al., 2012, New routes to solutions of the WCSBoil charge conundrum: Gamma-ray photons and Fouriertransformmass spectrometry (abs.); Canadian Society ofPetroleum Geologists Geoconvention, 6 p.
Miall, A. D., 2009, Initiation of the Western Interior fore-land basin: Geology, v. 37, p. 383–384, doi:10.1130/focus042009.1.
Mossop, G., and I. Shetsen, 1994, Atlas well control data,geological atlas of the Western Canada sedimentary ba-sin: Canadian Society of Petroleum Geologists and Al-berta Research Council, data available from AlbertaGeological Survey, accessed July 1, 2013, http://www.ags.gov.ab.ca/publications/wcsb_atlas/atlas.html.
O’Connell, S. C., 1994, Geological history of the Peace Riverarch (chapter 28), in G. Mossop and I. Shetsen, eds.,Geological atlas of the Western Canada sedimentary ba-sin: Canadian Society of Petroleum Geologists and Al-berta Research Council, p. 431–437.
Okulitch, A. V., and K. M. Fallas, 2007, GIS dataset of Phan-erozoic geological features, Slave River, Peace River, andLake Athabasca map areas, Northwest Territories, Alberta,and Saskatchewan: Geological Survey of CanadaOpen FileReport 5338, accessed July 1, 2013, http://geoscan.nrcan.gc.ca/geoscan-index.html, doi:10.4095/223451.
Paterson, D. F., A. C. Kendall, and J. E. Christopher, 1978,The sedimentary geology of the La Loche area, Saskatch-ewan, NTS Sheet 74 C: SaskatchewanMineral ResourcesGeological Survey Report 201, 38 p.
Piggott, N., and M. D. Lines, 1991, A case study of migrationfrom the west Canada basin, in W. A. England and A. J.Fleet, eds., Petroleum migration: Geological Society(London) Special Publication 59, p. 207–225.
Price, R. A., 1981, TheCordilleran foreland thrust and fold belt
in the southern Canadian Rocky Mountains: GeologicalSociety (London) Special Publication 9, p. 427–448.
Price, R. A., 1994, Cordilleran tectonics and the evolution ofthe Western Canada sedimentary basin (chapter 2), inG.Mossop and I. Shetsen, eds., Geological atlas of theWest-ern Canada sedimentary basin: Canadian Society of Petro-leum Geologists and Alberta Research Council, p. 13–24.
Ranger, M. J., 1994, A basin study of the southern Athabascaoil sands deposit, Ph.D. thesis, University of Alberta, Ed-monton, Alberta, inM. J. Ranger andM. K. Gingras, Ge-ology of the Athabasca oil sands, field guide and over-view: Edition 5a (September 2010), 125 p.
Riediger, C. L., 1994, Migration of “Nordegg” oil in theWest-ern Canada basin. How much and how far?: Bulletin ofCanadian Petroleum Geology, v. 42, p. 63–73.
Selby, D., and R. A. Creaser, 2005, Direct radiometric datingof hydrocarbon deposits using rhenium-osmium iso-topes: Science, v. 308, p. 1293–1295, doi:10.1126/science.1111081.
Stasiuk, L. D., M. G. Fowler, and G. Addison, 2002, Thermalmaturity evaluation of Lower Cretaceous MannvilleGroup and equivalent coals in the Western Canada sedi-mentary basin; a compilation of vitrinite reflectance data:Geological Survey of Canada Open File Report 4342.
Stott, D. F., W. G. E. Caldwell, D. J. Cant, J. E. Christopher,J. Dixon, E. H. Koster, D. H. McNeil, and F. Simpson,1993, Cretaceous, subchapter 4I, inD. F. Stott and J. D.Aitken, eds., Sedimentary cover of the craton in Canada:Geological Survey of Canada, Geology of Canada, no. 5,p. 358–438 (also Geological Society of America, TheGeology of North America, v. D-1), accessed July 1,2013, http://geoscan.nrcan.gc.ca/geoscan-index.html,doi:10.4095/213611.
Vigrass, L. W., 1968, Geology of Canadian heavy oil sands:AAPG Bulletin, v. 52, p. 1984–1999.
Wilson, N. S. F, L. D. Stasiuk, and M. G. Fowler, 2007, Originof organic matter in the Proterozoic Athabasca Basin ofSaskatchewan and Alberta, and significance to uncon-formity uranium deposits, in C. W. Jefferson and G.Delaney, eds., EXTECH IV: Geology and uranium ex-ploration technology of the Proterozoic Athabasca Ba-sin, Saskatchewan and Alberta: Geological Survey ofCanada Bulletin, v. 588, p. 325–339.
Wright, G. N., M. E. McMechan, and D. E. G. Potter, 1994,Structure and architecture of the Western Canada sedi-mentary basin (chapter 3), in G. Mossop and I. Shetsen,eds., Geological atlas of the Western Canada sedimentarybasin: Canadian Society of Petroleum Geologists and Al-berta Research Council, p. 25–40.
Tozer et al. 447