tr-244 toxicology and carcinogenesis studies of a
TRANSCRIPT

NATIONAL TOXICOLOGY PROGRAM Technical Report Series No. 244
CARClNOG EN ES IS STUDIES
OF POLYBROMINATED BIPHENYL MIXTURE
(FIREMASTER FF-1) (CAS NO. 67774-32-7)
IN F344/N RATS AND B6C3F1 MICE (GAVAGE STUDIES)
U.S. DEPARTMENT OF HEALTH AND HUMAN SERVICES Public Health Service
National Institutes of Health

NOTE TO THE READER
This is one in a series of experiments designed to determine whether selected chemicals produce cancer in animals. Chemicals selected for testing in the NTP carcinogenesis program are chosen primarily on the bases of human exposure, level of production, and chemical structure. Selection per se is not an indicator of a chemical’s carcinogenic potential. Negative results, in which the test animals do not have a greater incidence of cancer than control animals, do not necessarily mean that a test chemical is not a carcinogen, inasmuch as the experiments are conducted under a limited set of conditions. Positive results demonstrate that a test chemical is carcinogenic for animals under the conditions of the test and indicate that exposure to the chemical has the potential for hazard to humans. The determination of the risk to humans from chemicals found to be carcinogenic in animals requires a wider analysis which extends beyond the purview of this study.
This study was designed and conducted at the National Institute of Environmental Health Sciences, National Toxicology Program.
Comments and questions about the National Toxicology Program Technical Reports on Carcino- genesis Studies should be directed to the National Toxicology Program, located at Research Triangle Park, NC 27709 (919-541-3991) or a t Room 835B, Westwood Towers, 5401 Westbard Ave., Bethesda, MD 20205 (30 1496-1 152).
Although every effort is made to prepare the Technical Reports as accurately as possible, mistakes may occur. Readers are requested to communicate any mistakes to the Deputy Director, NTP (P.O. Box 12233, Research Triangle Park, NC 27709), so that corrective action may be taken. Further, anyone who is aware of related ongoing or published studies not mentioned in this report is encouraged to make this information known to the NTP.
These NTP Technical Reports are available for sale from the National Technical Information Service, U.S. Department of Commerce, 5285 Port Royal Road, Springfield, VA 22161 (703-487- 4650).
Single copies of this carcinogenesis studies technical report are available without charge (and while supplies last) from the NTP Public Information Office, National Toxicology Program, P.O. Box 12233, Research Triangle Park, N C 27709.
Polybrominated Biphenyl Mixture 2

NTP TECHNICAL REPORT ON THE
TOXICOLOGY AND CARCINOGENESIS STUDIES
OF A POLYBROMINATED BIPHENYL MIXTURE
(FIREMASTER FF-1) (CAS NO, 67774-32-7)
IN F344/N RATS AND B6C3F1 MICE (GAVAGE STUDIES)
NATIONAL TOXICOLOGY PROGRAM Box 12233
Research Triangle Park North Carolina 27709
June 1983
NTP-81-32 NIH Publication No. 83-1800
NTP TR 244
U.S.DEPARTMENT OF HEALTH AND HUMAN SERVICES Public Health Service
National Institutes of Health

NOTE TO THE READER
This is one in a series of experiments designed to determine whether selected chemicals produce cancer in animals. Chemicals selected for testing in the NTP carcinogenesis program are chosen primarily on the bases of human exposure, level of production, and chemical structure, Selection per se is not an indicator of a chemical’s carcinogenic potential. Negative results, in which the test animals do not have a greater incidence of cancer than control animals, do not necessarily mean that a test chemical is not a carcinogen, inasmuch as the experiments are conducted under a limited set of conditions. Positive results demonstrate that a test chemical is carcinogenic for animals under the conditions of the test and indicate that exposure to the chemical has the potential for hazard to humans. The determination of the risk to humans from chemicals found to be carcinogenic inanimals requires a wider analysis which extends beyond the purview of this study.
This study was designed and conducted at the National Institute of Environmental Health Sciences, National Toxicology Program.
Comments and questions about the National Toxicology Program Technical Reports on Carcino- genesis Studies should be directed to the National Toxicology Program, located at Research Triangle Park, NC 27709 (919-541-3991) or a t Room 835B, Westwood Towers, 5401 Westbard Ave., Bethesda, MD 20205 (301-496-1 152).
Although every effort is made to prepare the Technical Reports as accurately as possible, mistakes may occur. Readers are requested to communicate any mistakes to the Deputy Director, NTP (P.O. Box 12233, Research Triangle Park, NC 27709), so that corrective action may be taken. Further, anyone who is aware of related ongoing or published studies not mentioned in this report is encouraged to make this information known to the NTP.
These NTP Technical Reports are available for sale from the National Technical Information Service, U.S. Department of Commerce, 5285 Port Royal Road, Springfield, VA 22161 (703-487- 4650).
Single copies of this carcinogenesis studies technical report are available without charge (and while supplies last) from the NTP Public Information Office, National Toxicology Program, P.O. Box 12233, Research Triangle Park, NC 27709.
Polybrominated Biphenyl Mixture 2

TABLE OF CONTENTSPage
Abstract 7Contributors 8Reviewers 9Summary of Peer Review Comments 10
I. Introduction 11II. Materials and Methods 17
Test Chemical 18Animals and Husbandry 18Experimental Design (Six-Month Administration) 18Dose Selection 18Necropsy Examination 18Clinical Pathologic Examination 19Electron Microscopic Examination , . . . . 19Excess Porphyrin Determination 19Carcinogenic Potential of Polybrominated Biphenyl After 6-MonthExposure 20
Experimental Design 20Statistical Analysis 22
III. Results 23Results of Six-Month Observation 24
Clinical Observation 24Food Consumption 26Organ Weights 30Hematologic Findings 32Clinical Chemistry 34Necropsy Findings 37Histopathologic Findings 37
Results of Lifetime Observation , 40Survival Time in Rats 40Survival Time in Mice..". 42Body Weights in Rats and Mice 43Necropsy Findings in Rats and Mice 45Histopathologic Findings in Rats 45Necropsy Findings in Mice 48Histopathologic Findings in Mice 48
IV. Discussion and Conclusions 51V. References 55
TABLESTable 1 Polybrominated Biphenyl Isomers Found by Gas Chromatography/
Mass Spectrometry Analysis of Firemaster BP-6 12Table 2 Sources and Description of Materials Used for Animal
Maintenance in the PBB Studies 20Table 3 Utilization of Rats Exposed to PBB for 6 Months 21Table 4 Utilization of Mice Exposed to PBB for 6 Months 21Table 5 Food Consumption by Male Rats Receiving PBB 26Table 6 Food Consumption by Female Rats Receiving PBB 27Table 7 Food Consumptionby Male Mice Receiving PBB 28Table 8 Food Consumption by Female Mice Receiving PBB 29Table 9 Absolute and Relative Weights (% of Body Weight) of Liver, Spleen,
and Thymus of Male Rats After a 6-Month Exposure to PBB 30Table 10 Absolute and Relative Weights (% of Body Weight) of Liver, Spleen,
and Thymus of Female Rats After a 6-Month Exposure to PBB 31Table 11 Absolute Weight (g) and Relative (%) Liver to Body Weight of Male
and Female Mice After a 6-Month Exposure to PBB 31
3 Polybrominated Biphenyl Mixture

Table 12
Table 13
Table 14
Table 15
Table 16 Table 17
Table 18
Table 19
Table 20
Table 21
Table 22
Table 23
Table 24
Table 25
Table 26
Table 27
Table 28
Table 29
Table 30
Table 31
Table 32
Table 33
Figure 1
Erythrocyte Values and Platelet Counts of Rats After a 6-Month Exposure to PBB. . ., . . . . . . . . . ... . . . . . .. . .... . . . .. . . . . . . . .. . . . . . . . . . . . 32 Blood Leukocyte and Differential Counts of Rats After a 6-Month Exposure to PBB ..................................................... 32 Erythrocyte Values and Platelet Counts of Mice After a 6-Month Exposure to PBB. . ., . . . ... . . . . . . ... . . .., ., , ., ... . .. . . . . . .. . . . . . .. ... . 33 Blood Leukocyte and Differential Counts of Mice After a 6-Month Exposure to PBB ... . . .. . . .., , . , . . . . , ., , . . . . .. . . .... . . . .. . .. . 33 Serum Protein Values of Rats After a 6-Month Exposure to PBB . . . . . . . . .. 34 Serum Clinical Chemistry Values of Rats After a 6-Month Exposure to PBB. . , . . . ., . . . . .. . . .. .. . , , . . . . , ., , .. . . . . . ., .. . , .. .. . ... . 35 Serum Clinical Chemistry Values of Mice After a 6-Month Exposure to PBB. . , ... . , . . . . .. . ... . . . . , .. . .. , .. . . ... . . .. . . . . . . . .. . .. . 35 Serum Thyroid Hormone Values in Rats After a 6-Month Exposure to P B B , . ., . , , . . .., , .... . . , , , . .., .. . , . . , ., . . . . , , . , ., . , .. , .. . 36 Hepatic Porphyrin Levels @gig) in Rats and Mice After a 6-Month Exposure to PBB. . . . . , , .., ., , . . . ., ., . . . , , . , . , .. . . .., . . . , . . . , .. . .. . ., . 36 Hepatic Lesions in Rats and Mice After a 6-Month Exposure t o P B B . . . . .. . . . . .. . . . . . . . . . . . .. ............................... . ..... 37 Microscopic Observation of Excess Lipid Accumulation (Oil Red 0 Stain) in the Liver of Rats After a 6-Month Exposure to PBB , . . . . , .. . .,.. . .... . 39
Incidence (%) of Moderate or Marked Chronic Progressive Nephropathy
Incidence (%) of Microscopic Lesions in the Liver of Male and Female
Effect of Polybrominated Biphenyl Administration on Survival in Rats and Mice ....................................................... 41 Body Weights (g) of Male Rats During Lifetime Observation Phase of PBB Study . . . . . . . . , ,. . . . . . . .,.. . ,.. . , . . . . , , . . , , . .., ... . . . . , . . .. . . . . . 43 Body Weights (g) of Female Rats During Lifetime Observation Phase of PBB Study . .. . . ......................., . ............. . . . . . .......... 43 Body Weights (8) of Male Mice During Lifetime Observation Phase of PBB Study , , ..,. . . . . . . . .. . ., . . . .. . . , , . . . . .. . , . . . , . . ., . . .. . . . .. . . . . . . 44 Body Weights (g) of Female Mice During Lifetime Observation Phase of PBB Study. . . .. , . . . . . .. . ,, .. . . . . . . . ., ., . .. . . .., , , . , , . . . . . . . . . . . .. . 44 Incidence (%) of Microscopic Lesions in the Liver of Male Rats Exposed to PBB for 6 Months and Examined During Lifetime Observation Phase . . . . 45 Incidence (%) of Microscopic Lesions in the Liver of Female Rats Exposed to PBB for 6 Months and Examined During Lifetime Observation Phase . . . . 46
(CPN) and Myelomonocytic Leukemia (ML) in Rats Exposed to PBB for 6 Months and Examined During Lifetime Observation Phase . . . , . . . . . . .. .. 46 Incidence (96)of Focal Hyperplastic Gastropathy and Gastric Ulcers in Rats Exposed to PBB for 6 Months and Examined During Lifetime Observation Phase . . . . . . . . . . . . . . . . . . . . . . . . . . . . . . . . . . . . . . . . . . . . . . . . . . . . 47
Mice Exposed to PBB for 6 Months and Examined During Lifetime Observation Phase ................................................... 48 Incidence of Malignant Lymphoma in Mice Exposed to PBB for 6 Months and Examined During Lifetime Observation Phase .. . . . . . . . . . 49
FIGURES
Histogram Showing Difference in Body Weight Gain in Rats Exposed to Polybrominated Biphenyl Mixture, A Total of 125 Doses During a 6-Month Period , , . , , , . . . , .. ., , . . . , , ., . , , , , , . , , , , , , . , . . , , . . . . 24
Polybrominated Biphenyl Mixture 4

Figure 2
Figure 3
Figure 4
Figure 5
Figure 6
Appendix A
Table Al
Table A2
Table A3
Table A4
Table A5
Table A6
Table A7
Table A8
Table A9
Table AI0
Table Al 1
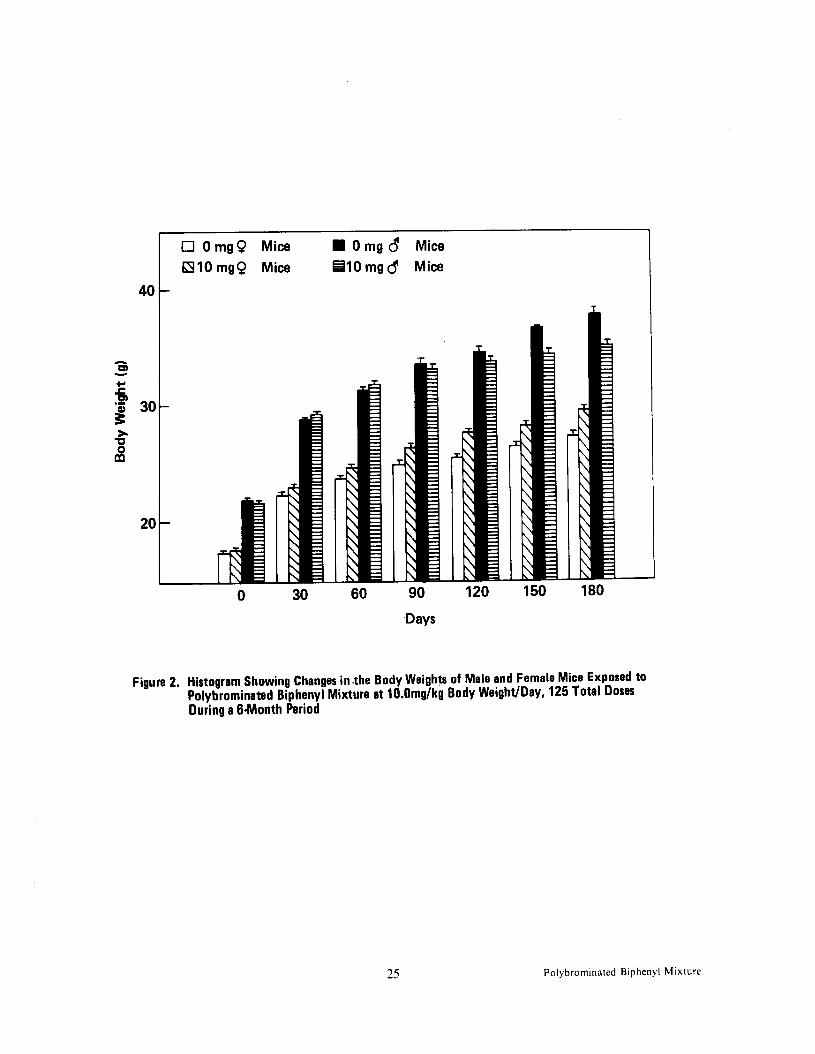
Histogram Showing Changes in Body Weights of Male and Female Mice Exposed to Polybrominated Biphenyl Mixture at 10.0 mg/ kg Body Weight Day, 125 Total Doses During a 6-Month Period . . . . . . . . . . . . . 25 Survival Curves for Male Rats Administered Polybrominated Biphenyl Mixture in Corn Oil by Gavage. . .............................. 40 Survival Curves for Female Rats Administered Polybrominated Biphenyl Mixture in Corn Oil by Gavage. . .............................. 41 Survival Curves for Male Mice Administered Polybrominated Biphenyl Mixture in Corn Oil by Gavage.. .............................. 42 Survival Curves for Female Mice Administered Polybrominated Biphenyl Mixture in Corn Oil by Gavage ................................42
APPENDIXES
Individual Animal Pathology in Rats Administered Polybrominated Biphenyl Mixture in Corn Oil by Gavage (Lifetime Observation) . . . . . . . . . . . 61 Individual Animal Pathology in Male Rats Administered 10.0 mg Polybrominated Biphenyl Mixture/ kg Body Weight in Corn Oil by Gavage (Lifetime Observation) ......................................... 62 Individual Animal Pathology in Male Rats Administered 3.0 mg Polybrominated Biphenyl Mixture/ kg Body Weight in Corn Oil byGavage (Lifetime Observation) ......................................... 64 Individual Animal Pathology in Male Rats Administered 1.0 mg Polybrominated Biphenyl Mixture/ kg Body Weight in Corn Oil by Gavage (Lifetime Observation) ......................................... 66 lndividual Animal Pathology in Male Rats Administered 0.3 mg Polybrominated Biphenyl Mixture/ kg Body Weight in Corn Oil by Gavage (Lifetime Observation) ......................................... 68 Individual Animal Pathology in Male Rats Administered 0.1 mg Polybrominated Biphenyl Mixture/ kg Body Weight in Corn Oil by Gavage (Lifetime Observation) ......................................... 70 Individual Animal Pathology in Control Male Rats Administered 0 mg Polybrominated Biphenyl Mixture/ kg Body Weight in Corn Oil by Gavage (Lifetime Observation) ......................................... 72 Individual Animal Pathology in Female Rats Administered 10.0 mgPolybrominated Biphenyl Mixture/ kg Body Weight in Corn Oil by Gavage (Lifetime Observation) ...................................... 74 Individual Animal Pathology in Female Rats Administered 3.0 mg Polybrominated Biphenyl Mixture/ kg Body Weight in Corn Oil by Gavage (Lifetime Observation) ...................................... 75 Individual Animal Pathology in Female Rats Administered 1.O mg Polybrominated Biphenyl Mixture/ kg Body Weight in Corn Oil by Gavage (Lifetime Observation) ...................................... 76 lndividual Animal Pathology in Female Rats Administered 0.3 mg Polybrominated Biphenyl Mixture/ kg Body Weight in Corn Oil by Gavage (Lifetime Observation) ...................................... 77 lndividual Animal Pathology in Female Rats Administered 0.1 mgPolybrominated Biphenyl Mixture/ kg Body Weight in Corn Oil by Gavage (Lifetime Observation) ......................................78
Table A12 Individual Animal Pathology in Control Female Rats Administered 0 mg Polybrominated Biphenyl Mixture/ kg Body Weight in Corn Oil by Gavage (Lifetime Observation) ...................................... 79
5 Polybrominated Biphenyl Mixture

Appendix B Individual Animal Pathology in Mice Administered Polybrominated Biphenyl Mixture in Corn Oil by Gavage (Lifetime Observation) . . . . . . . . . . . 8 1
Table B1
Table B2
Table B3
Table B4
Table B5
Table B6
Table B7
Table B8
Table B9
Table B10
Table B1 1
Table B12
Appendix C
Table Cl
Table C2
Table C3
Table C4
Individual Animal Pathology in Male Mice Administered 10.0 mg Polybrominated Biphenyl Mixture/ kg Body Weight in Corn Oil by Gavage (Lifetime Observation) ......................................... 82 Individual Animal Pathology in Male Mice Administered 3.0 mg Polybrominated Biphenyl Mixture/ kg Body Weight in Corn Oil by Gavage (Lifetime Observation) ......................................... 83 Individual Animal Pathology in Male Mice Administered 1.0 mg Polybrominated Biphenyl Mixture/ kg Body Weight in Corn Oil by Gavage (Lifetime Observation) ......................................... 84 Individual Animal Pathology in Male Mice Administered 0.3 mg Polybrominated Biphenyl Mixture/ kg Body Weight in Corn Oil by Gavage (Lifetime Observation) ......................................... 86 Individual Animal Pathology in Male Mice Administered 0. I mg Polybrominated Biphenyl Mixture/ kg Body Weight in Corn Oil by Gavage (Lifetime Observation) ...................................... 87 Individual Animal Pathology in Control Male Mice Administered 0 mg Polybrominated Biphenyl Mixture/ kg Body Weight in Corn Oil by Gavage (Lifetime Observation) ...................................... 89 Individual Animal Pathology in Female Mice Administered 10.0 mg Polybrominated Biphenyl Mixture/ kg Body Weight in Corn Oil by Gavage (Lifetime Observation) ......................................... 90 Individual Animal Pathology in Female Mice Administered 3.0 mg Polybrominated Biphenyl Mixture/ kg Body Weight in Corn Oil by Gavage (Lifetime Observation) ......................................... 9 1 Individual Animal Pathology in Female Mice Administered 1 .O mg Polybrominated Biphenyl Mixture/ kg Body Weight in Corn Oil by Gavage (Lifetime Observation) ......................................... 92 Individual Animal Pathology in Female Mice Administered 0.3 mg Polybrominated Biphenyl Mixture/ kg Body Weight in Corn Oil by Gavage (Lifetime Observation) ......................................... 93 Individual Animal Pathology in Female Mice Administered 0.1 mg Polybrominated Biphenyl Mixture/ kg Body Weight in Corn Oil by Gavage (Lifetime Observation) ......................................... 94 Individual Animal Pathology in Control Female Mice Administered 0 mg Polybrominated Biphenyl Mixture/ kg Body Weight in Corn Oil by Gavage (Lifetime Observation) ...................................... 95 Summary of the Incidence of Lesions in Rats and Mice Administered Polybrominated Biphenyl Mixture in Corn Oil by Gavage (Lifetime Observation). ........................................................ 97 Summary of the lncidence of Lesions in Male Rats Administered Polybrominated Biphenyl Mixture in Corn Oil by Gavage (Lifetime Observation) ................................................ 98 Summary of the Incidence of Lesions in Female Rats Administered Polybrominated Biphenyl Mixture in Corn Oil by Gavage (Lifetime Observation) ............................................... . lo0 Summary of the Incidence of Lesions in Male Mice Administered Polybrominated Biphenyl Mixture in Corn Oil by Gavage (Lifetime Observation) ............................................... . I03 Summary of the Incidence of Lesions in Female Mice Administered Polybrominated Biphenyl Mixture in Corn Oil by Gavage (Lifetime Observation) ............................................... .I05
Polybrominated Biphenyl Mixture 6

n + m = 5 - 7
POLYBROMINATED BIPHENYL MIXTURE CAS NO. 67774-32-7
ABSTRACT Firemaster FF-I, a flame retardant composed of polybrominated biphenyls (PBB), was responsible
for widespread environmental contamination and animal losses in Michigan starting in 1973. This study was undertaken to characterize the long-term toxic and carcinogenic potential of this PBB mixture in rats and mice of each sex. Fischer 344/N rats and B6C3F1 mice were given 125 oraldoses of PBB over a 6-month period -0, 0.1, 0.3, 1.0, 3.0, or 10.0 mg/kg body weight/day ( 5 days/week).
A dose-related decrease in body weight gain was observed in both male and female rats and male mice, although there was no significant difference in food consumption. At the end of the 6-month exposure, there was a dose-dependent decrease in thymus weights in rats. The liver appeared to be the primary target organ. Dose-related hepatotoxic effects were characterized by a marked increase in liver weight, with accentuation of hepatic lobular markings. Microscopically, there was moderate to marked hepatocellular swelling, disorganization and single cell necrosis of hepatocytes, fatty infiltra- tion, and bile duct proliferation. At the 6-month observation, atypical hepatocellular foci were observed at a low incidence in dosed rats and mice. Hepatic porphyrin levels were markedly increased in both rats and mice, excessively in females. Levels of porphyrin tended to decrease gradually, primarily in mice, following cessation of exposure. The significant decreases in serum thyroxine (T4)and triiodothyronine (T3)in rats suggest that PBB may interfere with thyroid hormone secretion.
Total serum protein was decreased in dose-related fashion in female rats primarily due to dose- related decreases in albumin. There was a significant increase in the serum levels of gamma glutamyl transpeptidase (GGTP) in female rats given 10.0 mg/ kg of PBB. There was a dose-related decrease in serum glucose in female rats, a dose-related decrease in the serum triglyceride level in dosed male rats, except at the lowest dose (0.1 mg/ kg), and a dose-related increase in the serum levels of cholesterol in both male and female rats.
Serum levels of GGTP were increased only in female mice given 10.0 mg/ kg of PBB. There was a 5-to 6-fold increase in the activity of serum glutamic pyruvic transaminase (SGPT) in male and female mice in 10.0 mg/ kg groups. Serum enzyme activity of alkaline phosphatase (AP) was also increased in mice given the highest dose of PBB. There was a significant dose-related increase in the serum levels of cholesterol in female mice, and the highest dose group was significantly greater than thecontrol female mice. Serum glucose was significantly decreased in female mice administered 10.0 mg/ kg of PBB.
To determine the carcinogenic potential of PBB, rats and mice dosed for 6 months were observed without exposure to PBB for an additional 23 or 24 months, respectively (lifetime observation). The dosing (0.3 mg/ kg or higher dose levels) shortened the survival time in male rats, whereas no such effect was observed in dosed females. There was also evidence of shortened survival time in the 10.0 mg/ kg PBB-dosed mice. A significantly higher incidence of atypical hepatocellular foci, neoplastic nodules, hepatocellular carcinomas, and cholangiocarcinomas was observed in dosed rats. The incidence of hepatocellular carcinoma was increased in both male and female mice (highest dose level) compared with control male and female mice. The incidence of hepatic neoplasms appeared to be dose dependent in rats and mice. Liver tumors were observed primarily in those groups of animals to which PBB was given in doses sufficient to induce readily observable hepatic toxicity.
Under the conditions of these studies, polybrominated biphenyl mixture (Firemaster FF-1) was carcinogenic for Fischer 344/N rats and B6C3F1 mice of each sex, inducing neoplastic nodules, hepatocellular carcinomas, and cholangiocarcinomas in rats and hepatocellular carcinomas in mice. Other toxicities included porphyrogenic effects and hepatotoxicity.
7 Polybrominated Biphenyl Mixture

CONTRIBUTORS
National Toxicology Program P.O. Box 12233
Research Triangle Park North Carolina 27709
This toxicology and carcinogenesis bioassay was conducted at the National Institute of Environ- mental Health Sciences/National Toxi6ology Program. The chronic study using Fischer 344/ N rats was begun in October 1977, exposure terminated in April 1978 (6 months), and completed in February 1980 (29 months); the study using B6C3F1 mice began in February 1978, exposure stopped in August 1978 (6 months), and completed in August 1980 (30 months).
The polybrominated biphenyl mixture (Firemaster FF-1) used in this toxicology and carcinogenesis bioassay was supplied by Michigan Chemical Corporation, St. Louis, Michigan, and analyzed by the Midwest Research Institute, 425 Volker Blvd., Kansas City, Missouri 64110.
Evaluation of experiments, interpretation of results, and report of findings: Bhola N. Gupta (Chemical Manager),
B.V.Sc., Ph.D. Ms. Martha W. Harris Joseph K. Haseman, Ph.D. John A. Moore, D.V.M.
Pathology evaluation: Bhola N. Gupta, B.V.Sc., Ph.D.
Pathology Review: Gary A. Boorman, D.V.M., Ph.D. Morando Soffritti, M.D. Ernest E. McConnell, D.V.M.
Porphyrin and serum thyroxin analyses: Joyce A. Goldstein, Ph.D.
Technical Assistance: Ms. Janet D. Allen Ms. Doris L. Myers Mr. James Clark Mr. Fred A. Talley Ms. Betty J . Harris Mr. Ralph E. Wilson Mr. Eric Haskins {Mr. Elton W. Yancey
Format and typing: Ms. Beth H. deBrito Ms. Geraldine K. Wandrisco Ms. Bonnie J. Jefferson
Report review: NTP/ NIH Implementation Committee J . F. Douglas, Ph.D. J . E. Huff, Ph.D. C. Grieshaber, Ph.D. E. E. McConnell, D.V.M. L. Hart, Ph.D. J . A. Moore, D.V.M. J. K . Haseman, Ph.D. R. Tennant, Ph.D.
Polybrominated Biphenyl Mixture 8

REVIEWERS
National Toxicology Program Board of Scientific Counselors’ Technical Reports Review Subcommittee
Margaret Hitchcock, Ph.D. (Chairperson and Principal peviewer) John B. Pierce Foundation Laboratory New Haven, Connecticut
Curtis Harper, Ph. D. Alice S . Whittemore, Ph.D.* Associate Professor of Pharmacology Stanford University School of Medicine University of North Carolina Palo Alto, California Chapel Hill, North Carolina
Ad Hoc Subcommittee Panel of Experts
Norman Breslow, Ph.D. Bernard A. Schwetz, D.V.M., Ph.D.* University of Washington Toxicology Research Laboratory Seattle, Washington Dow Chemical U.S.A.
Midland, Michigan Joseph Highland, Ph.D.* Roy Shore, Ph.D. (Principal Reviewer)
Environmental Defense Fund New York University Medical Center Washington, D.C. New York, New York
Frank Mirer, Ph.D. James Swenberg, D.V.M., Ph.D. International Union, Chief of Pathology United Auto Workers Chemical Industry Institute of
Detroit, Michigan Toxicology Research Triangle Park, North Carolina
Sheldon D. Murphy, Ph.D.* Gary M. Williams, M.D. Professor of Toxicology Chief of Experimental Pathology University of Texas Medical School American Health Foundation Houston, Texas Valhalla, New York
Svend Nielsen, D.V.M., Ph.D.* Professor of Pathology The University of Connecticut Storrs, Connecticut
*Unable to attend 23 June 1981 meeting.
9 Polybrominated Biphenyl Mixture

SUMMARY OF PEER REVIEW COMMENTS ON THE CARCINOGENESIS STUDIES OF
POLYBROMINATED BIPHENYL MIXTURE (FIREMASTER FF-1)
On 23 June 1981, this toxicology and carcinogenesis studies technical report on polybrominated biphenyl mixture (Firemaster FF-1) underwent peer review and was approved by the National Toxicology Program Board of Scientific Counselors’ Technical Reports Review Subcommittee and associated Panel of Experts at an open meeting held in Building 101, National Institute of Environ- mental Health Sciences, Research Triangle Park, North Carolina.
Dr. Hitchcock, a principal reviewer, agreed that this polybrominated biphenyl mixture (PBB) was carcinogenic for Fischer 344/N rats and B6C3F1 mice of both sexes, inducing neoplastic nodules, hepatocellular carcinomas, and cholangiocarcinomas in rats and hepatocellular carcinomas in mice. Other toxicities observed included porphyrogenic effects and hepatotoxicity. The test compound also affected the body weight gain in male and female rats and male mice, although there was no significant difference in food consumption. Dr. Hitchcock noted that this study was the first to be completed under NTP with an experimental protocol which expands the traditional two-dose two-species design. For both rats and mice, there were 6 dose groups ranging from 0 (controls) to 0.1 to 10.0 mg/ kg, 5 days/ week for 6 months. To determine the carcinogenic potential of PBB, rats and mice dosed for 6 months were observed for an additional 23 or 24 months, respectively.
Of great importance, she said, was the demonstration that liver tumors were observed only in those animals which exhibited frank hepatotoxicity. For this protocol she commented on the unfortunate absence of historical control tumor incidence data for the 6-month time period. She said this made it difficult to determine the importance of the squamous cell carcinoma of the bladder in a female rat administered 10mg/ kg. Furthermore, the small number of animals available after two additional years may have introduced some bias in the final result. She concluded, however, that the evidence for carcinogenicity was clear. Since the test compound is a mixture, the results of this study can be appliedonly to the mixture used and not to other mixtures of different combinations of PBBs or those with different contaminants. Nonetheless, she indicated that this was indeed the specific chemical mixture involved in the accidental exposure in Michigan.
As a second principal reviewer, Dr. Shore said it was refreshing to see a study using multiple dose groups and lookirrg at several toxicity end-points. However, there were weaknesses in the carcinogene- sis part of the study relating to the rather small numbers of animals in the controls and some of the dose groups. He asked whether the animals used for immunology and subchronic pathology were selected randomly. Dr. Moore, NTP, replied that the selection was essentially random, but whether this was planned prior to sacrifice or by animal number at the outset is not clear. Dr. Shore suggested it would have been a better design to start with more animals. Dr. Williams asked that information be inserted which reports the lack of mutagenic effects of PBBs in several Salmonella tester strains.
Dr. Hitchcock recommended that the report on the bioassay of polybrominated biphenyl mixture (Firemaster FF-1) be accepted with the additions suggested. Dr. Shore seconded the motion, and the technical report was approved unanimously by the Peer Review Panel.
Polybrominated Biphenyl Mixture I O

I. INTRODUCTION
Polybrominated Biphenyl Mixture

I. INTRODUCTION
POLYBROMINAT ED BIPH ENY L MIXTURE
CAS NO. 67774-32-7
Fire safety legislation during the last decade plastics flame retardant because it added a high greatly stimulated the production and applica- level of flame resistance to polymer systems. tion of flame retardant chemicals (Anderson, Commercially, Firemaster BP-6 was blended1976). By 1975 production of these compounds with an anticaking agent (2% calcium trisilicate) reached approximately 350 million pounds. At and renamed Firemaster FF-I. This PBB mix- present, more than 60% of the total production ture (Firemaster BP-6) was found to contain at of flame retardant is used to fireproof carpets least 13 different bromobiphenyls and was also and rugs. The balance is impregnated into cloth- contaminated with approximately 200 ppm of ing, home furnishing, and a wide variety of con- bromonaphthalenes (Hass et al., 1978). Thestruction, electrical, and electronic products. major components of Firemaster BP-6 analyzed
Firemaster BP-6 is a mixture of several poly- by gas chromatography/ mass spectrometry are brominated biphenyls (PBB) and was used as a given in Table 1.
TABLE 1. POLYBROMINATED BIPHENYL ISOMERS FOUND BY GAS CHROMATOGRAPHY/MASS SPECTROME- TRY ANALYSIS OF FIREMASTER BP-6 (0)
Isomers Percentage
Pentabromobiphenyl 2.8 (d) Pentabromobiphenyl 1.2(d)
Hexabromobiphenyl 1.4(d) Hexabromobiphenyl 56.0(b) Hexabromobiphenyl 5.2(d)
Heptabromobiphenyl 4:O (4 Heptabromobiphenyl 27.3 (c) Heptabromobiphenyl 2.1 (d)
Total 100.0 %
(a) Hass et al. (1978). (b) 2,2’,4,4’,5,5’-Hexabromobiphenyl. (c) 2,2’,3,4,4’,5,5’-Heptabrornobiphenyl. (d) Isomeric configuration unknown.
Polybrominated Biphenyl Mixture 12

I . INTRODUCTION
PBBs were first used commercially in 1970, and their manufacture increased 100-fold by 1974 (Mumma and Wallace, 1975). Firemaster BP-6 was manufactured solely by the Michigan Chemical Corporation, St. Louis, Michigan. The single U.S. producer of hexabromobiphenyl (HBB) ceased production in November 1974, having produced an estimated 2.2 million kg in 1974 and about 5.1 million kg in the period 1970-1974 (IARC, 1978). During 1970-1973, 45,350 kg of octabromobiphenyl and decabro- mobiphenyl were produced by a New Jersey chemical firm (Mumma and Wallace, 1975).
Pure hexabromobiphenyl, the major compo- nent of Firemaster BP-6, begins to melt a t 72OC and decomposes in the range of 300° to 400OC (IARC, 1978), and no residue remains at 500OC (Anon., 1971). Virtually insoluble in water, it is highly soluble in organic solvents and fat (lipo- philic). Polybrominated biphenyls are not easily degraded in the environment (Jacobs et al., 1978), and therefore, potential exists for long- term cumulative environmental build-up similar to that with the closely-related polychlorinated biphenyls (Kay, 1977; Kasza et al., 1978). How- ever, under laboratory conditions, ultraviolet radiation readily degraded the PBB (2,2’,4,4’,5,5’- hexabromobiphenyl and Firemaster BP-6) in methanol solution (Ruzo and Zabik, 1975).
Widespread animal toxicity due to Firemaster FF-1 occurred in Michigan in 1973 as a result of inadvertent substitution of this flame retardant for a mineral feed supplement, magnesium oxide (Mercer et al., 1976; Cook et al., 1978). The Michigan PBB incident has been termed the most costly and disastrous chemical contamina- tion ever to occur in United States agriculture. The most commonly cited hypothesis as to how the Michigan PBB disaster came about has been recorded by Carter (1976). Sometime during the summer of 1973, ten to twenty 50-pound bags of “Firemaster” were somehow included in a truck load of “Nutrimaster”(magnesium oxide, a com- pound used to “sweeten” acidic feeds) and was shipped to a large feed mill. Under normal cir- cumstances, the Firemaster, which resembled Nutrimaster in physical appearance, would have been packaged in bags lettered in red. Because of a shortage of bags with preprinted labeling, the Firemaster as well as the Nutrimaster were pack- aged in plain brown bags on which the trade names were stenciled in black. How the Fire- master and Nutrimaster bags became mixed at the manufacturing plant remains unknown.
There is no question that 500 to 1,000poundsof PBB were mixed into animal feeds that were then widely sold and distributed to Michigan farmers. The circumstantial human error and the events that followed this tragedy have been well documented by Carter (1976). The contami- nated feed was consumed by a large number of farm animals and poultry. A toxic syndrome associated with the feeding of PBB contami- nated protein concentrate to dairy cattle was first reported by Jackson and Halbert (1974). The clinical signs in affected cattle included anorexia, decreased milk production, increased frequency of urination, lacrimation, lameness,, hematoma, loss of hair, and abnormal growth of the hooves. The time of exposure was approxi- mately 9 months, and during this period the contaminated dairy products and eggs were widely consumed by farmers and their families, and later, by the general population of Michigan (Humphrey and Hayner, 1975).
Due to this contamination, a t least 29,800 cattle, 5,920 hogs, 1,470 sheep, and 1.5 million chickens were destroyed (Carter, 1976; Dunckel, 1975). Also removed from the commercial market were at least 865 tons of animal feed, 17,790 pounds of cheese, 2,630 pounds of butter, 34,000 pounds of dry milk products and nearly 5 million eggs (Carter, 1976). This mixing error has been alleged to have caused health problems in people who consumed the milk and food con- taminated with PBB (Brown and Nixon, 1979). However, in other reports, positive correlation between exposure (as determined by serum or adipose tissue PBB levels) and reported health problems in some residents of Michigan was not observed (Meester and McCoy, 1977; Isbister, 1977; Humphrey et al., 1979; Barr, 1980). There has been a recent report of primary hypothyroid- ism in 4 men (1 1.4% of 35 men examined) employed in a plant which produced the PBBs, decabromobiphenyl, and decabromobiphenyloxide (Bahn et al., 1980). Hepatic’porphyria has not been found in people exposed to PBBs in Michigan; nonetheless, an alteration in the uri- nary porphyrin pattern, which may reflect pre- liminary changes, has been reported (Strik et al., 1979).
Polybrominated biphenyl was discovered in human hair samples, fish, plants, soil, and water near two New Jersey facilities which manufac- tured PBBs for export(Anon., 1977). PBBs were also found in human hair, fish, and soil near a chemical firm on Staten Island, New York. This
13 Polybrominated Biphenyl Mixture
I . INTRODUCTION
‘ chemical firm did not manufacture PBB, but used it in the manufacture of wire coatings (Anon., 1977). Oil extracted samples of hair from men from Staten Island contained as much as 17 ppm, whereas hair samples taken near the New Jersey firms had PBB levels as high as 210 Ppm.
The Michigan Department of Health evalu- ated 298 persons exposed to PBB-contaminated products (Humphrey and Hayner, 1975). Blood samples from adults showed that the exposed group had a median PBB valueof0.014 ppmand ranged from 0.002 ppm to 2.26 ppm. Human breast milk has been found to contain PBB from 0.21 to 92.66 ppm(median 10.80 ppm). Concen- trations of PBB in adipose tissue ranged from0. I to 174.0 ppm. In another report, a comparison was made in the serum PBB levels of residents of Michigan exposed to PBB and in that of the residents of Wisconsin, not known to have been exposed to PBB (Wolff et al., 1979). Among the 993 dairy farm residents and 55 chemical workers in Michigan, 96% (902 persons) had higher than 0.3 ppb of PBB in the serum, whereas only 5% (8 persons) of those from Wisconsin had similar levels: 6 of the 8 people with detectable PBB in their sera were members of a family who recently moved from Michigan to Wisconsin (Wolff et al., 1979). Nine farm residents and 14 employees of the chemical com- pany’which manufactured PBB were reexam- ined after 18 months. In each case, serum values for PBB were similar to previous findings.
To determine the extent of human exposure, PBB concentrations were measured in human breast milk, collected in a random sample survey from nursing mothers throughout Michigan (Brilliant et al., 1978); 5 1 of 53 (96%) breast milk samples from the lower peninsula and 18 of 42 (43%) samples from the less densely-populated upper peninsula contained detectable amounts of PBB. Theoretically, 8 million of Michigan’s 9.1 million residents had detectable amounts of PBB (Brilliant et al., 1978). A detailed continu- ing survey of the general population of Michigan for health effects of PBB exposure was also reported by Selikoff and Anderson (1979).
Matthews et al. (1977) observed that PBB con- centration in adipose tissue from rodents would not be expected to show an appreciable decline during the lifetime of the animal. The intestinal absorption, distribution, and excretion of 2,2’,4,4’,5,5’-hexabromobiphenyl,the majorcomponent of Firemaster BP-6, was studied in the rat (Matthews et al., 1977). Radiolabeled
2,2’,4,4’,5,5’-[’%] hexabromobiphenyl was ad- ministered orady as well as intravenously. Hexa- bromobiphenyl was readily absorbed from the intestine, initially distributed throughout the body, and finally stored primarily in the adipose tissue of the rat. There was no appreciablemetabolism of‘PBB, which was excreted almost exclusively in the feces a t a very slow rate. Approximately 90% of an oral dose was absorbed from the rat intestine. The extrapola- tion of the data from the rate of excretion to infinity indicated that less than 10% of the total dose would ever be excreted (Matthews et al., 1977).
Polybrominated biphenyl was reported to have a relatively low acute toxicity; the single oral LD,, in the laboratory rat was stated to be 21.5 g/kg bod,y weight (Anon., 1971; 1976; Hill Top Research, 1970). However, PBB was found to be more toxic when given in small repeated doses (Gupta and Moore, 1979). In Fischer 344 rats, PBB was given orally at 30, 100, 300, and 1,OOO mg/ kg body weighti day (5 days/ week, 22 total doses) for 4.5 weeks and observed for 90 days after the start of dosing. The LD,, for female rats was estimated to be 65 mg/ kg/day (total 1.43 g/kg) and for male rats, 149 mg/ kg/ day (total 3.28 g/ kg) when given in mul- tiple doses and observed for 90 days.
A comparative toxicity study of Firemaster FF-I and pure 2,2’,4,4’,5,5’-hexabromobiphe-nyl, the major component of Firemaster FF-I, was conducted in rats and mice (Gupta et al., 1981). The Firemaster FF-I was found to be more toxic than the pure hexabromobiphenyl, as determined by measurement of porphyrins and severity of pathologic findings principally in the liver. Rats and mice treated with hexabro-mobiphenyl tended to recover during the postex- posure period (Gupta et al., 1981). Several previous studies have shown that the hepatic toxicity of PBB was quite similar to that induced by PCB in rats (Kasza et al., 1978). In another study, rats fed a diet containing 10 ppm PBB for 30 days developed a slight hepatotoxic effect, and pups nursed by PBB-exposed dams also had microscopic and ultrastructural lesions in the liver (Sleight and Sanger, 1976). Hepatic changes such as necrosis, fibrosis, and neoplas- tic nodules were found in rats 10 months after a single large oral dose (1.0 g/kg) of PBB (Kimbrough et al., 1977; 1978). Atypical foci in the liver were also observed in rats as early as 6 months after exposure to 22 daily doses of PBB
Polybrominated Biphenyl Mixture 14

I. INTRODUCTION
at 30.0 or 100.0 mg/ kg body weight over a one- month period (Gupta and Moore, 1979). In a recent report, liver tumors were induced by PBB in female Sherman rats given either a single dose of 1,000 mg PBBikg or 12 doses of 100 mgPBB/ kg body weight; the respective incidence of hepatocellular carcinoma was 41.4 and 67.8% during a 2-year period (Kimbrough et al., 1981).
Polybrominated biphenyl was shown to be embryotoxic and teratogenic to rat embryos (Beaudoin, 1977; Corbett et al., 1975; Harris et al., 1978). Other studies have shown that PBB transfers to the fetus transplacentally (Aftosmis et al., 1972; Detering et al., 1975; Rickert et al., 1978) and is readily excreted in the milk (Fries and Marrow, 1975; Fries, 1978; Gutenmann and Lisk, 1975; Moore et al., 1978). Toxicity and distribution of PBB were investigated by feeding rations containing different concentrations of PBB to sows during pregnancy and lactation (Werner and Sleight, 1981). Mortality was increased among pigs nursed by sows fed rations containing PBB. Although transplacental pas- sage of PBB resulted in an appreciable amount of PBB in tissues of new-born pigs, far more PBBs were transferred to the pigs through the milk (Werner and Sleight, 1981).
In a long-term feeding study in mink, PBB derived from contaminated beef and poultry tissues was more toxic than the Firemaster FF-I commercial mixture of PBB incorporated exper- imentally into beef (Aulerich and Ringer, 1979). Toxicity of polybrominated biphenyl in poultry and the compound’s effects on avian reproduc- tion have also been reported (Cecil and Bitman, 1978; Ringer and Polin, 1975 and 1977; Chang and Zindel, 1975; Lillie et al., 1975).
Norris et al. (1975) found evidence of thyroid hyperplasia in rats fed octabromobiphenyl for 30 days at 8.0 mg/ kg/ day. Morphologic changes in thyroid glands were also observed in male rats exposed to PBB (Kasza et al., 1978; Gupta and Moore, 1979). Increased thyroid gland weights, slight hyperplasia of follicular cells of the thy-
roid, thin and scant colloid, and decreased serum concentrations of thyroid hormones of pigs nursed by PBB-exposed sows have been reported (Werner and Sleight, 1981).
Since the PBB mishap in Michigan, several investigators have tried to lower the body burden of PBB after experimental exposures. McConnell et al. (1 980) used activated charcoal and cholestyramine, along with restricted caloric intake, ir\ an effort to mobilize PBBs stored in fat. Neither these compounds nor the restricted caloric intake was found effective in reducing tissue bromine levels. In another study, different diets and mineral oil were used to study the PBB concentration in tissues (Kimbrough et al., 1980). Chemical analyses for PBBs in blood, liver, and adipose tissue showed no significant differences among the differently treated groups.
PBB exposure severely depressed cell-mediated immunity in both mice and rats (Luster et al., 1978). It was concluded that PBB exposure may lead to suppression of both humoral and particu- larly cell-mediated immune responses.
Several studies have been carried out at the National Institute of Environmental Health Sciences/ National Toxicology Program to achieve a greater understanding of the chemical disposition, toxicological, behavioral and immu- nological effects of PBB in rats, mice, and guinea pigs (Luster et al., 1980; Goldstein et al., 1979; Tilson et al., 1978; Tilson and Cabe, 1979; Mat- thews et al., 1977). Hexabromobiphenyl(36355-01-8) did not induce any mutagenic response in Salmonella typhimurium tester strains TA98, 100, 1535,and 1537 (with or without metabolic activation). Exogenous metabolic activation was provided by 9000 x g liver supernatant (S-9) fractions from Aroclor 1254Wnduced male Sprague-Dawley rats and male Syrian hamsters. Likewise, this chemical did not cause chromo- some aberrations or sister chromatid exchanges in Chinese hamster ovary cells (NTP, unpub- lished results). The toxicological, pathological, and carcinogenic studies of PBB in rats and mice are described in this technical report.
15 Polybrominated Biphenyl Mixture

Polybrominated Biphenyl Mixture 16

II. MATERIALS AND METHODS
Test Chemical
Animals and Husbandry
Experimental Design (Six-Month Administration)
Dose Selection
Necropsy Examination
Clinical Pathologic Examination
Electron Microscopic Examination
Excess Porphyrin Determination
Carcinogenic Potential of Polybrominated Biphenyl After Six-Month Exposure
Experiment al Design
Statistical Analysis
17 Pol?brominated Biphenyl M i x t u r e

I I . MATERIALS AND METHODS: TEST CHEMICAL
Test Chemical
Firemaster FF-I (Firemaster BP-6 and 2% calcium trisilicate, Lot No. 1312 FT Batch 03) was obtained from Michigan Chemical Corpo- ration, St. Louis. Michigan. The chemical com- position of the PBB mixture was analyzed (Table 1 ) and reported earlier by Hass et al. ( 1978).
Firemaster FF-I (PBB) was mixed with corn oil. Stock solutions of PBB werediluted 1:5 and the concentrations were verified by measuring the 2,2',4,4',5,5'-hexabromobiphenyl(HBB) con- tent of the corn oil using selected ion monitoring gas chromatography/ mass spectrometry. The calculated amount of PBB in stock solutions was 20.0 mg/ml; the estimated amount was 20.2 k20% mg/ml when analyzed and compared with a standard of 2,2',4,4',5,5'-hexabromo-biphenyl in corn oil. Standard curves were gener- ated using 2,2',4,4',5,5'-HBB.
Animals and Husbandry
Seven- to 8-week-old male and female Fischer 344/N rats (Charles River Laboratories, Wil- mington, MA) and B6C3F1 mice(Har1an Indus- tries, Indianapolis, IN) were used. Details of animal maintenance are given in Table 2. Groups of 3 rats or 5 mice of each sex were housed in polycarbonate cages. Pelleted food and water were provided ad libitum. Ground corn cob was used as bedding for rats, and hard wood chips for mice. Cool white fluorescent light was provided 12 hours per day. The temper- ature was maintained at 70° f2OF, and relative humidity was 50%k5%.
Experimental Design (Six-Month Ad min is tra t ion)
The rats and mice were ranked according to body weight and then randomly assigned to one of six groups (51 rats of each sex and 50 mice of each sex per group). PBB was administered by gavage at doses of 0, 0.1, 0.3, 1.0, 3.0 or 10.0 mg/ kg body weight on 5 consecutive days per week for 25 consecutive weeks (125 total doses during a 6-month period). The concentrations of the solutions in corn oil were adjusted weekly based on the mean body weight of the dose group, so that each rat received a constant
volume of 0.2: ml/day and each mouse 0.1 ml/day. Animads that received no PBB received equal volumes of corn oil.
All animals were observed daily for clinical appearance. Each animal was weighed once per week; food consumption by cage was deter- mined once each week.
Dose Selection The LD50 of PBB was mathematically deter-
mined to be 65 mg/ kg/day (total 1.43 g/kg) for F344/N female rats and 149 mg/ kg/day (total 3.28 g/kg) for the males (Gupta and Moore, 1979). These results were obtained from rats exposed to 22 multiple doses of PBB during a one-month period, and observed for 90 days. There was loo(% and 38% mortality in female and male rats respectively given doses of PBB at 100 mg/ kg, and mo deaths in the 30 mg/ kg dose ,
groups. On the basis of the above observations (mor-
tality, body weight gain effect, thymic atrophy, and hepatotoxicity), 10.0 mg/ kg of PBB was selected as the highest dose level for a 6-month study. The lower 4 doses were selected on a logarithmic basis, i.e., 10.0,3.0, 1.0,0.3, andO.l mg/ kg/ day.
At the termination of this 6-month dosing period, potential hepatocarcinogenic effects of PBB were suspected because of a high dose-re- lated incidence of atypical foci in the liver. Therefore, it was decided to observe for their lifetime those rats that were not killed at 6 months.
Necropsy Examination At the end of the 6-month exposure, randomly
selected groups of 10 rats or mice/ dose/ sex were killed. The rats were anesthetized by exposure t o high levels of CO, until respiration ceased; the mice were anesthetized with methoxyfluorane. Blood samples were then collected from the rat via orbital sinus and from the mouse by cardiac puncture. All animals were then killed by exsan- guination. Weights of lung, heart, liver, spleen, thymus, right kidney, right adrenal gland, right gonad, both thyroid glands, uterus, and brain were recorded and organ to body weight ratios calculated. In addition to the organs weighed, tissue samples from pinna, ear and ear canal, eye, trachea, urinary bladder, sternum, quadri- ceps muscle, accessory male and female sex organs, six levels of gastro-intestinal tract, lum- bar spinal cord, sciatic nerve, spinal ganglion,
Polybrominated Biphenyl Mixture 18

II. MATERIALS A N D METHODS: CLINICAL PATHOLOGICAL EXAMINATION
salivary glands, mesenteric and thoracic lymph nodes, mammary glands, and nasal turbinates were fixed in buffered, pH 7.0, 10%formalin for histopathologic examination. These specimens were embedded in paraffin, sectioned 6 p m thick and stained with hematoxylin and eosin. Cryo- stat prepared sections (10 p m thick) of formalin- fixed liver were also stained with oil red 0 for examination of neutral lipids. Paraffin sections of liver and spleen from selected rats and mice of each sex were also stained with Mallory's method for iron (Luna, 1968). Tumor-bearing hepatic tissues were also stained with periodic acid Schiff (PAS).
Clinical Pathologic Examination Blood examinations were conducted using
routine hematologic and serum chemistry proce- dures. Hematologic examinations included total erythrocyte ( R BC) counts, erythrocyte indices, hemoglobin ( H b) concentration, packed cell volume (PCV), platelet counts, leukocyte counts (WBC), and differential counts of leukocytes. Serum chemistry included serum glutamic pyruvic transaminase (SGPT), gamma glutamyl transpeptidase (GGTP), alkaline phosphatase (AP), blood (serum) urea nitrogen (BUN), glu- cose, triglycerides, cholesterol, total protein, albumin, and total globulin and globulinfractions.
Serum thyroxine (T4) concentrations and tri- iodothyronine (T3) uptake were determined using TETRA-TAB and TRI-TAB T3 uptake kits (Nuclear Medical Labs, Dallas, TX). The test was performed as recommended by the manufacturer except that 20 p l of bovine serum
' was used for T4 determination instead of 10pl. T3 was determined using the Serulate Total T-3
Kit (Ames Co., Division of Miles Laboratories, Elkhart, IN) with the following modifications: the T3 antiserum was diluted to provide approx- imately 40% retention of 13 ' I-T3 on the column in the absence of nonradioactive T3 (zero stand- ard), and the incubation period was changed from 2 hours to 1 hour.
Electron Microscopic Examination
Portions of liver from selected male and female rats (highest dose group and control) were fixed in 2.5% glutaraldehyde and 2.0% paraformaldehyde in cacodylate buffer (pH 7.4) for 6 hours, then washed with cacodylate buffer (pH 7.4) for 2 hours, dehydrated in alcohol and propylene oxide, and embedded in Epon 812. Thick sections (0.5pm) for light microscopy were cut with an ultramicrotome and stained with toluidine blue. Thin sections (400-600 A)were stained with uranyl acetate and Reynolds' lead citrate (Reynolds, 1963) for electron microscopic examination (Philips 200 electron microscope).
Excess Porphyrin Determination
At necropsy, liver, sternum, bones, and inci- sor teeth of all rats and mice were examined under longwavelength(366 nm) ultraviolet ( U V ) light (model B-100 Black-Ray Ultraviolet Lamp, Ultraviolet Products, Inc., San Gabriel, CA) for reddish pink fluorescence as an indication of excess porphyrin accumulation. A portion of liver from rats and mice was frozen for determi- nation of total hepatic porphyrins (Abritti and De Matteis, 1971).
19 Polybrominated Biphenyl Mixture

II. MATERIALS A N D METHODS: CARCINOGENIC POTENTIAL AFTER SIX-MONTH EXPOSURE
CARCINOGENIC POTENTIAL OF POLYBROMINATED BIPHENYL
AFTER SIX-MONTH EXPOSURE
Experimental Design The number of animals remaining in each Since the results of the 6-month evaluation group for lifetime observation varied from I I to
showed tissue changes suggestive of prencopla- 40 for rats (Table 3), and 8 to 27 for mice (Table sia, the surviving animals were kept for lifetime 4).The main reason for this vast range in the observation. No PBB was given during this number of a n h a l s among different groups and
for the small sample size was the utilization of period . some animals by immunotoxicologists, bio-After termination of the 6-month dosing, 320 chemists, and behavioral toxicologists to studyrats and 229 mice (treated and controls of each the other parameters of PBB toxicity (Luster et sex) were kept for 23 and 24 additional months, al., 1978; 1980; Goldstein et al., 1979; Tilson et respectively, for further observation (Tables 2 al., 1978; Tilson and Cabe, 1979). and 3) . At this time, -10% of the surviving rats
and mice were killed.
TABLE 2. SOURCES A N D DESCRIPTIONS OF MATERIALS USED FOR ANIMAL MAINTENANCE IN T H E PBB STUDIES.
Frequency of Change Item Manufacturer Specifications or Cleaning
Cages Lab Products, Inc. Rochelle Park, NJ
Polycarbonates cages Rats-45x20~20 cm Mice-30x I7x 12 cm
I x week
Racks Contracted by N I H Stainless steel Rats-25 cages/ rack Mice-30 cages/ rack
I x week
Bedding Rats- Bed-o’cobs The Andersons Ground corn cob 1 x week
Maumee, OH 50 Ib/bag Mice-Betta Chip@ Bedding Granville Milling Co.
Creedmoore, NC Hardwood chips 50 Ibi bag
I x week
Water Bottles Girton Manufacturing Co. Millville, PA
Polypropylene 1 x week
Watering Tubes Ancare Products Manhassett, N Y
TD100, 21” length 1 x week
Feed (pelleted) Gardners, PA Zeigler Brother
25 Ib/ bag NIH-31 1 x week
Water City of Durham Public Utility
Cage & Bottle Washer Girton Manufacturing Co. Millville, PA
Tunnel wash Daily check;Quarterly maintenance
Rack Washer Girton Manufacturing Co. Millville, PA
- Daily check; Quarterly maintenance
Autoclave Castle Rochester, N Y
Sterox-o-matic Monthly maintenance
Washing Compound Economic Labs. Inc. St. Paul, M N
Spearhead
Polybrominated Biphenyl Mixture 20

TABLE 3. UTILIZATION OF RATS EXPOSED TO PBB FOR 6 MONTHS
~ ~~~~~ ~~
0.0 mg/kg 0.1 mg/kg 0.3 mg/kg 1.0 mg/kg 3.0 mg/kg 10.0 mg/kg
M F M F M F M F M F M F
No. Available 50 (a) 51 50(a) 51 Sofa) 51 51 51 51 50(a) 51 51 at end of 6 months
Subchronic 10 (b) 10 IO I O 10 I O 10 I O I O IO I O I O pathology
Immunology (c) - 21 - 20 - 20 - 21 - 21 - 21
Behavioral Toxicology (d)
7(8) (e) 4 1 2 ) - - - - 8 8 7(8) 4 8 ) 7(8) 4 8 )
No. available 33 20 40 21 40 21 33 12 34 19 34 20 for lifetime observation
No. examined for pathology
33 20 39 (f, 21 40 21 31 cf) I I cf) 33 (13 19 32cf) 20
(a) Difference in numbers shown and 51 rats per group at start is number lost to study due to gavage error. (b) Five males and females from all treatment groups used for clinical pathology and T,, T, assays. All rats of each sex
used for organ weights, hepatic porphyrin levels and histopathology.
(e) Luster, et al., (1980). (d) Tilson and Cabe (1979). (e) Numbers indicate rats removed for behavioral toxicology at end of six months. ( ) = additional rats tested for
behavioral toxicology during 6 months exposure but included in lifetime observation group. cf) Difference in number examined for pathology and number available is due to post mortem autolysis.
TABLE 4. UTILIZATION OF MICE EXPOSED TO PBB FOR 6 MONTHS
0.0 mg/kg 0.1 mg/kg 0.3 mg/kg 1.0 mg/kg 3.0 mg/kg 10.0 mg/kg
M F M F M F M F M F M F
No. Available 46 (a) 50 49 (a) 50 41 (a) 41 (a) 48 (a) 43 (a) 45 (a) 49 (a) 44 (a) 38(a) at end of 6 months
Subchronic lO(b) I O I O 10 I O IO I O I O I O I O I O I O pathology
Immunology (c) 1 1 21 I I 21 1 1 21 I I 21 I I 21 I I 20
Behavioral Toxicology
(15)fd) (15 ) - - _ - (10) (10) (10) (10) (8) (8)
No. available 25 19 28 19 26 16 27 12 24 18 23 8 for lifetime observation
No. examined 25 13(e) 27(e) 19 24(e) l5(e) 25(e) 1Ife) 23fe) 17 22 (e) 8 for pathology
(a) Difference in numbers shown and 50 mice per group at start is number lost to study due to gavage error. (b) Five males and females from all treatment groups used for clinical pathology. Ten mice of each sex used for
organ weights, hepatic porphyrin levels, and histopathology. (c) Luster et al. (1980). (d) ( ) = Mice tested during exposure phase and included in lifetime observation group. (e) Difference in number examined for pathology and number available is due to accidental deaths or post mortem
autolysis.
21 Polybrominated Biphenyl Mixture

I I . MATERIALS AND METHODS: CARCINOGENIC POTENTIAL AFTER SIX-MONTH EXPOSURE
Statistical Analysis FOI.weight gain, organ weight, hematology.
and clinical chemistry data. the Kruskal-Wallis nonparametric anal1,sis of variance (Hollander and Wolfe. 1973) was used to determine the significance of among-group differences. The s i gn if ica n ce of d ose-response trends was assessed by Jonckheere’s test (Jonckheere, 1954). I f an overall effect were detected, then pairwise comparisons were made by Mann-Whitney U tests (Hollander and Wolfe, 1973).
Probabilities of survival were estimated by the product limit procedure of Kaplan and Meier ( 1958). and survival differences were analyzed by life table analysis (Cox. 1972).
For the statistical analysis of neoplastic and nonneoplastic lesions, two different methods of adjusting for intercurrent mortality were employed. Each used the classical methods for combining contingency tables developed by Mantel and Haenszel (1959). Tests of signifi- cance included pairwise comparisons of high- and low-dosed groups with controls and tests for overall dose-response trends.
For lesions judged to be “nonfatal”(i.e., those observed at necropsy in animals dying of an
unrelated cause), the incidental tumor test pro- posed by Pet0 et al. (1980) was employed to compare incidence rates in PBB and control groups. By means of this approach, the observed proportions of necropsied animals with lesions were compared in each of five time intervals: 0-1.75 years, 1.75-2 years, 2-2.25 years, 2.25 years-terminal kill, and terminal kill. These results were then combined by the Mantel- Haenszel methods to obtain an overall P-value. For male rats, when markedly reduced survival made the incidental tumor test not feasible (since, e.g., there was little overlapping survival in the highest arid control groups), Fisher’s exact test and the Cochran-Armitage trend test (Armitage, 1971; Gart et al., 1979) were employed to calmpare incidence rates. Lesions considered to be nonfatal were bile duct hyper- plasia, hyperplastic gastropathy, hepatocellular adenoma, and atypical foci or neoplastic nodules of the liver.
For lesions judged to be “fatal” (i.e., that either directly or indirectly caused the death of the animal), life table methodology was employed to coimpare incidence rates in PBB and control grclups (Cox, 1972). Examples of these lesions include hepatocellular carcinoma, cholangiocarcinoma, and malignant lymphoma.
Polybrominated Biphenyl Mixture 22

III. RESULTS
RESULTS OF SIX-MONTH OBSERVATION Clinical Observation Food Consumption Organ Weights Hematologic Findings Clinical Chemistry Necropsy Findings Histopathologic Findings
RESULTS OF LIFETIME OBSERVATION Survival Time in Rats Survival Time in Mice Body Weights in Rats and Mice Necropsy Findings in Rats and Mice Histopathologic Findings in Rats Necropsy Findings in Mice Histopathologic Findings in Mice
23 Polybrominated Biphenyl Mixture

III. RESULTS: SIX-MONTH OBSERVATION
RESULTS OF SIX-MONTH OBSERVATION
Clinical Observation The body weight gain in female mice (10.0 mg/ During the 6-month dosing period, animals kg/ day) was elevated, whereas in the male mice,
were clinically normal in appearance. No deaths it was depressed (Fig. 2). There was no signifi- related to PBB administration were observed. cant difference in body weight gain in other There were depressed rates of body weight gain groups of dosed and control mice. in rats as a function of time and dose (Fig. 1).
Male Rats Control 1 .O mg- 280-
61 0.1 mg 0 3 . 0 mg5 I O . 3 mg ~ 1 0 . 0mg +I 260- 2 = c 240-5
.:
g 2 2 0 -.-m c.-C-E 200-2
LL
1 8 0 -Q E
160-s
B 1 4 300 L 60 90 120 150 180
Days
Female Rats140-OControl a 1 . 0 m gh9 0.1 mg ~ 3 3 . 0mgf3 0.3 mg .10.0 mg
+I 120-0
30 60 90 120 150 180 Days
Figure 1 . Histogram Showing Difference in Body Weight Gain in Rats Exposed to Polybrominated Biphenyl Mixture, a Total of 125 Doses During a 6-Month Period
Polybrominated Biphenyl Mixture 24
0 OmgQ Mice IOmg 8 Mice 6310mgQ Mice B l O m g d Mice
"i 0 30 60 90 120 150 180
,Days
Figure 2. Histogram Showing Changes in the Body Weights of Male and Female Mice Exposed to Polybrominated Biphenyl Mixture at lO.Omg/kg Body WeighdDay, 125 Total Doses During a 6-Month Period
25 Polybrominated Biphenyl Mixture
I I I . RESULTS: SIX-MONTH OBSERVATION
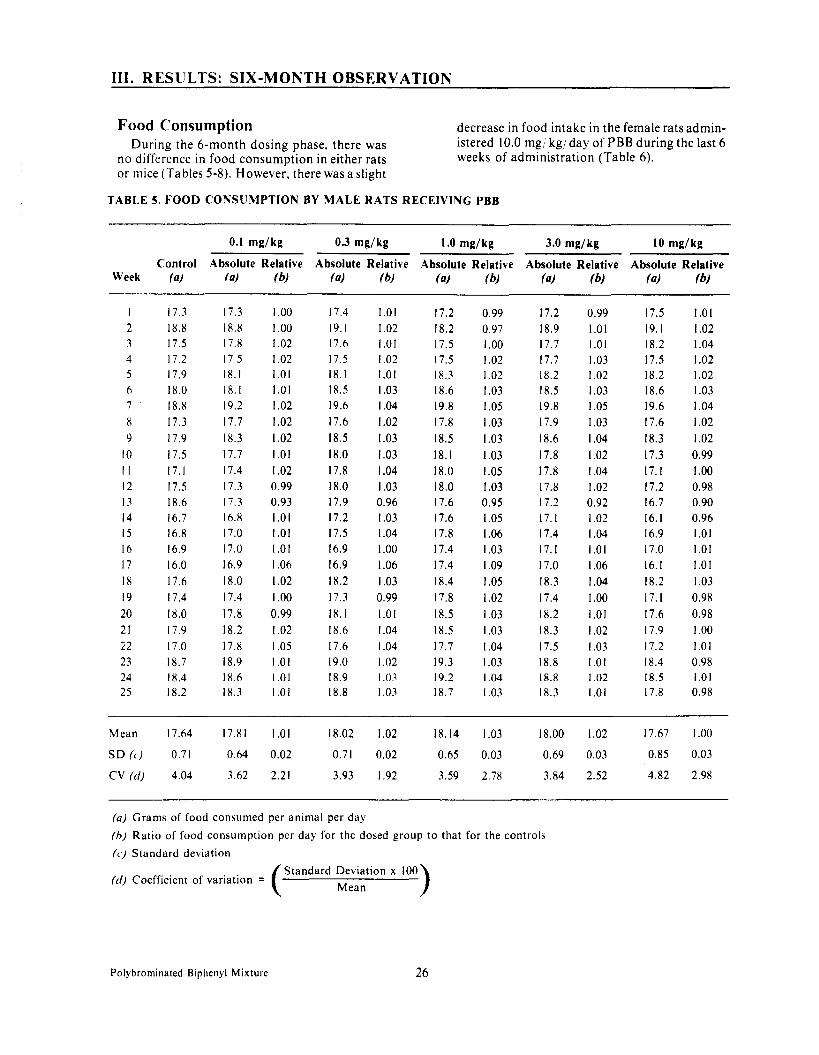
Food Consumption decrease in food intake in the female rats admin- During the 6-month dosing phase, there was istered 10.0 mg/ kg/day of P B B during the last 6
no difference in food consumption in either rats weeks of administration (Table 6 ) . or mice (Tables 5-8). However, there was a slight
TABLE 5. FOOD CONSUMPTION BY MALE RATS RECEIVING PBB
~~ ~ ~
0.1 mg/kg 0.3 mg/kg 1.0 mg/kg
~
3.0 mg/kg 10 mg/kg Control Absolute Relative Absolute Relative Absolute Relative Absolute Relative Absolute Relative
Week (a) (0) (b) (a) (b) (0) (b) (a) (b) (a) (b)
I 17.3 17.3 I .oo 17.4 1.01 17.2 0.99 17.2 0.99 17.5 1.01 2 18.8 18.8 I .oo 19.1 I .02 18.2 0.97 18.9 1.01 19. I I .02 3 17.5 17.8 I .02 17.6 1.01 17.5 1.oo 17.7 1.01 18.2 I .04 4 17.2 17.5 1.02 17.5 I .02 17.5 I .02 17.7 I .03 17.5 I .02 5 17.9 18.1 1.01 18.1 1.01 18.3 I .02 8.2 I .02 18.2 I .02 6 18.0 18.1 1.01 18.5 I .03 18.6 I .03 8.5 I .03 18.6 I .03 7 18.8 19.2 I .02 19.6 I .04 19.8 I .05 9.8 I .05 19.6 I .04 8 17.3 17.7 I .02 17.6 I .02 17.8 1.03 7.9 I .03 17.6 1.02 9 17.9 18.3 I .02 18.5 I .03 18.5 I .03 8.6 I .04 18.3 I .02
I O 17.5 17.7 I .01 18.0 1.03 18.1 1.03 7.8 I .02 17.3 0.99 I I 17.1 17.4 I .02 17.8 I .04 18.0 I .05 7.8 I .04 17.1 I .oo 12 17.5 17.3 0.99 18.0 I .03 8.0 I .03 7.8 I .02 17.2 0.98 13 18.6 17.3 0.93 17.9 0.96 7.6 0.95 17.2 0.92 16.7 0.90 14 16.7 16.8 1.01 17.2 I .03 7.6 I .05 17. I 1.02 16.1 0.96 15 16.8 17.0 I .01 17.5 I .04 7.8 I .06 17.4 I .04 16.9 1.01 16 16.9 17.0 1.01 16.9 1.oo 7.4 I .03 17.1 1.01 17.0 1.01 17 16.0 16.9 1 .Oh 16.9 I .06 7.4 I .09 17.0 I .06 16.1 1.01 18 17.6 18.0 I .02 Ix.2 I .03 8.4 I .05 18.3 I .04 18.2 I .03 19 17.4 17.4 I .oo 17.3 0.99 17.8 1.02 7.4 1 .oo 17.1 0.98 20 18.0 17.8 0.99 ix .1 1.01 18.5 1.03 8.2 1.01 17.6 0.98 21 17.9 18.2 I .02 I x.6 I .04 18.5 I .03 8.3 I .02 17.9 I .oo 22 17.0 17.8 I .05 17.6 I .04 17.7 I .04 7.5 I .03 17.2 1.01 23 18.7 18.9 I .01 19.0 I .02 19.3 1.03 8.8 1.01 18.4 0.98 24 18.4 18.6 I .01 18.9 I .03 19.2 I .04 8.8 I .02 18.5 1.01 25 18.2 18.3 1.01 18.8 I .03 18.7 I .03 8.3 1.01 17.8 0.98
Mean 17.64 17.81 1.01 18.02 1.02 18.14 1.03 18.00 1.02 17.67 1.00
SD ((9 0.71 0.64 0.02 0.71 0.02 0.65 0.03 0.69 0.03 0.85 0.03
CV ((1) 4.04 3.62 2.21 3.93 1.92 3.59 2.78 3.84 2.52 4.82 2.98
(u) Grams of food consumed per animal per day (b) Ratio of food consumption per day for the dosed group to that for the controls (19 Standard deviation
Standard Deviation x 100(d) Coefficient of variation = ( Mean
Polybrominated Biphenyl Mixture 26

TABLE 6. FOOD CONSUMPTION BY FEMALE RATS RECEIVING PBB
0.1 mg/kg 0.3 mg/kg 1.0 mg/kg 3.0 mg/kg 10 mg/kg
Control Absolute Relative Absolute Relative Absolute Relative Absolute Relative Absolute Relative Week (a) (4 (b) (4 (b) (a) (b) (0) (4 (4 (b)
I 12.5 12.6 1.01 12.5 I .oo 12.4 0.99 12.2 0.98 12.7 r.02 2 12.8 12.8 1 .oo 12.7 0.99 12.8 I .oo 12.4 0.97 12.9 1.01 3 12.3 12.1 0.98 12.4 1.01 12.1 0.98 12.0 0.98 12.4 1.01 4 1 1 . 1 11.3 1.02 11.0 0.99 1 1 . 1 I .oo 10.9 0.98 11.4 I .03 5 12.1 13.0 I .07 12.0 0.99 12.2 1.01 11.7 0.97 12.6 I .04 6 12.7 11.9 0.94 12.1 0.95 12.5 0.98 11.8 0.93 12.9 I .02 7 12.6 12.7 I .01 12.4 0.98 12.5 0.99 12.0 0.95 13.0 I .03 8 11.5 11.9 I .03 11.6 1.01 11.6 1.01 11.0 0.96 12.0 I .04 9 11.7 11.9 I .02 11.7 1 .oo 11.7 I .oo 11.3 0.97 12.3 1.05
10 12.0 12.0 1 .oo 11.8 0.98 11.8 0.98 11.4 0.95 12.7 I .Oh I I 11.5 11.3 0.98 11.2 0.91 11.4 0.99 11.0 0.96 11.8 I .03 12 11.4 11.3 0.99 11.2 0.98 11.4 1.oo 10.9 0.96 11.3 0.99 13 11.6 11.6 1.oo 11.3 0.91 11.7 1.01 11.0 0.95 11.0 0.95 14 11.5 12.0 I .04 11.5 I .oo 11.4 0.99 11.2 0.97 10.8 0.94 15 11.0 1 1 . 1 1.01 10.7 1.06 11.0 1.oo 10.9 0.99 10.6 0.96 16 11.8 12.0 I .02 11.7 0.99 11.7 0.99 I .5 0.97 11.0 0.93 17 11.0 10.5 0.95 10.3 0.94 10.6 0.96 0.2 0.93 9.6 0.87 18 11.3 12.9 1.14 11.6 1.03 12.2 1.08 I .3 I .oo 11.2 0.99 19 11.6 11.8 1.02 11.3 0.97 11.6 I .oo I .2 0.97 10.4 0.90 20 12.5 12.2 0.98 12.0 0.96 12.6 I .01 I .9 0.95 10.7 0.86 21 1 1 . 1 11.5 I .04 11 .1 I .oo 11.8 I .06 I .o 0.99 9.2 0.83 22 12.0 11.6 0.97 11.5 0.96 12.0 I .oo 11.2 0.93 9.9 0.83 23 12.4 12.2 0.98 12.0 0.97 12.7 I .02 11.4 0.92 9.7 0.78 24 12.1 12.2 1.01 11.8 0.98 12.5 I .03 11.7 0.97 9.6 0.79 25 12.0 12.2 I .02 11.9 0.99 12.5 I .04 11.4 0.95 9.5 0.79
Mean 11.84 11.94 1.01 11.69 0.99 11.91 1.01 11.38 0.96 11.25 0.95
SD (c) 0.55 0.60 0.04 0.53 0.03 0.58 0.03 0.50 0.02 1.23 0.09
CV (d) 4.66 5.00 3.96 4.57 2.51 4.87 2.53 4.36 2.12 10.97 9.67
(a) Grams of food consumed per animal per day (b) Ratio of food consumption per day for the dosed group to that for the controls ((9 Standard deviation
Standard Deviation x 100 (L/)Coefficient of variation = ( Mean
27 Polybrominated Biphenyl Mixture

TABLE 7. FOOD CONSUMPTION BY MALE MICE RECEIVING PBB
0.1 mg/kg 0.3 mg/kg 1 .O mg/kg 3.0 mg/kg 10 mg/kg
Control Absolute Relative Absolute Relative Absolute Relative Absolute Relative Absolute Relative Week (a) (a) (b) (a) (b) (0) (b) (0) (b) (a) (b)
I 3.2 3.5 1.09 3. I 0.97 3.1 0.97 3. I 0.97 2.9 0.91 2 3.6 3.7 1.03 4.0 1.1 I 3.4 0.94 3.8 I .06 3.6 1.oo 3 4.4 4.4 I .oo 4.4 1.oo 4.5 I .02 4.3 0.98 4.6 1.05 4 4.3 4.4 I .02 4.3 I .oo 4.3 1.oo 4.5 1.05 4.3 1 .oo 5 4.7 4.8 1.02 4.7 1.oo 4.8 1.02 4.9 1.04 4.9 I .04 6 5 .O 4.8 0.96 4.8 0.96 4.8 0.69 5.1 1.02 4.9 0.98 7 4.8 5 .O I .04 4.8 I .oo 4.8 I .oo 5.3 1.10 5.2 I .08 8 4.8 5.0 1.04 4.7 0.98 4.8 1 .oo 5.4 1.13 4.9 1.02 9 4.7 4.9 I .04 5 .O 1.06 4.7 I .oo 4.9 1.04 4.9 1.04
I O 4.8 5.0 I .04 5.0 I .04 4.7 0.98 4.8 1.oo 4.8 1.oo I I 4.7 4.9 1.04 4.2 1.11 5.2 1 . 1 1 4.9 1.04 4.9 I .04 12 4.7 4.9 I .04 4.9 1.04 4.9 1.04 5.0 1.06 4.9 I .04 13 4.4 4.7 I .07 4.7 I .07 4.7 I .07 4.6 I .05 4.8 I .09 14 4.6 4.7 1.02 4.9 I .07 4.9 I .07 4.9 I .07 4.3 0.93 15 4.7 4.6 0.98 5.1 1.09 4.9 1.04 4.7 1.oo 4.6 0.98 16 4.8 4.7 0.98 4.9 1.02 4.7 0.98 4.9 I .02 4.8 I .oo 17 4.7 4.9 I .04 5.2 1.1 I 4.8 I .02 4.9 I .04 4.9 1.04 18 4.6 4.8 1.04 4.8 I .04 4.6 1.oo 4.9 1.07 5.1 1 . 1 I 19 4.6 4.7 I .02 4.7 1.02 4.6 1.oo 4.6 1.oo 4.9 1.07
20 5.0 5. I 1.02 5.2 I .04 4.7 0.94 5.7 1.14 5.7 1.14 21 5.0 5.2 I .04 5.3 I .06 4.9 0.98 5.3 1.06 5.7 1.14 22 4.9 5.3 I .08 5.2 I .06 5.0 I .02 5.2 1.06 5.9 1.20 23 4.8 5. I 1.06 5.0 1.04 4.8 1.oo 5 .O 1.04 5.6 1.. 17 24 4.7 4.7 I .oo 4.7 1 .oo 4.7 1.oo 5.3 1.13 5.4 1.15 25 4.6 4.8 1.04 4.7 1.02 4.7 I .02 4.8 1.04 5 .O 1.09 26 4.7 4.8 I .02 4.8 I .02 4.7 I .oo 4.7 1 .oo 5. I 1.09
Mean 4.61 4.75 1.03 4.77 1.04 4.64 1.01 4.83 1.06 4.87 1.05
SD ( ( 8 ) 0.40 0.40 0.03 0.45 0.04 0.44 0.04 0.52 0.04 0.63 0.07
CV (d) 8.66 8.41 2.05 9.47 4.00 9.58 3.74 10.67 4.15 12.86 6.77
(a) Grams of food consumed per animal per day (h) Ratio of food consumption per day for the dosed group to that for the controls ((9 Standard deviation
Standard Deviation x 100 (d) Coefficient of variation = ( Mean
Polybrominated Biphenyl Mixture 28

TABLE 8. FOOD CONSUMPTION BY FEMALE MICE RECEIVING PBB
0.1 mg/kg 0.3 mg/kg 1.0 mg/kg 3.0 mg/kg 10 mg/kg
Control Absolute Relative Absolute Relative Absolute Relative Absolute Relative Absolute Relative Week (a) (a) (b) (a) (b) (a) (b) (a) (4 (a) (b)
I 3.7 4. I 1.1 I 3.3 0.89 4.0 I .08 3.4 0.92 3.4 0.92 2 3.6 3.5 0.97 3.3 0.92 3.3 0.92 3.5 0.97 3.2 0.89 3 3.8 3.7 0.97 3.6 0.95 3.7 0.97 3.7 0.97 4.0 I .05 4 3.9 3.8 0.97 4.0 I .03 4.0 I .03 3.9 I .oo 4.2 I .08 5 4.2 4.2 I .oo 4.3 1.02 4.5 I .07 4.4 1.05 4.5 I .07 6 4.0 4.2 1.05 4.3 I .08 4.4 1.10 4.1 I .03 4.3 1.08 7 3.9 4.0 I.03 4.2 I .08 4.4 1.13 4.0 I .03 4.3 1.10 8 4.0 4.2 I .05 4.3 1.08 3.8 0.95 4. I I .03 4.3 1.08 9 4.0 4. I I .03 4.2 I .05 4.3 I .08 4.2 1.05 4.4 1.10
I O 3.9 3.9 1.oo 4.1 , 1.05 4.3 1.10 4.0 I .03 4.4 1.13 I I 4.1 4.2 I .02 4.2 I .02 5 .O I .22 4.3 I .05 4.7 1.15 12 3.9 3.8 0.97 3.7 0.95 4.4 1.13 3.8 0.97 4.2 I .08 13 4.0 4.2 1.05 4.3 I .08 4.3 I .08 4.2 I .05 4.6 1.15 14 3.8 3.4 0.89 4.0 1.05 3.0 0.79 3.7 0.97 4. I 1.08 15 3.6 3.8 1.06 3.9 1.08 4.3 1.19 3.9 I .08 4.3 1.19 16 3.7 3.9 I .05 4.2 1.14 4.3 1.16 3.9 1.05 4.6 1.24 17 3.9 3.9 1.oo 4.2 I .08 4.2 I .08 4. I I .05 4.8 I .23 18 3.9 4. I I .05 4.0 1.03 4.4 1.13 4. I I .05 4.7 1.21 19 4.0 3.9 0.98 4.1 I .03 4.3 1.08 4. I 1.03 4.6 1.15 20 4.8 4.2 0.88 4.3 0.90 4.5 0.94 4.3 0.90 4.7 0.98 21 4. I 4.2 1.02 4.4 I .07 4.5 1.10 4.4 I .07 4.9 I .20 22 4.2 4.4 I .05 4.4 1.05 4.4 I .05 4.4 1.05 4.8 1.14 23 4. I 3.6 0.88 4. I I .oo 4.7 1.15 4.2 I .02 5.8 1.41 24 4.0 4.0 I .oo 4.2 I .05 4.5 1.13 4.2 I .05 4.7 1.18 25 3.9 3.9 I .oo 4.2 I .ox 4.3 1.10 4. I 1.05 4.7 1.21 26 4.0 3.9 0.98 4.2 I .05 4.3 1.08 4.2 1.05 4.8 1.20
Mean 3.96 3.97 1.00 4.08 1.03 4.23 1.07 4.05 1.02 4.46 1.13
S D ((9 0.23 0.24 0.06 0.30 0.06 0.41 0.09 0.26 0.05 0.49 0.1 I
cv ((1) 5.89 6.13 5.59 7.29 6.01 9.72 8.64 6.49 4.43 10.96 9.37
-
(a) Grams of food consumed per animal per dah (h) Ratio of food consumption per da) for the dosed group to that for the controls ((,) Standard dekiation
Standard Deviation x 100(d) Coefficient of variation = ( Mean
29 Polybrominated Biphenyl Mixture

III. RESULTS: SIX-MONTH OBSERVATION
Organ Weights Dose-related increases in liver weights were There was a dose-related increase in the abso- observed in male and female mice(Tab1e 1 I ) . No
lute and relative liver weights in dosed female significant differences in the thymus weights rats and in male rats receiving 0.3 mg kg day or were observed. Spleen weight was increased only more of PBB (Tables 9 and 10):Thymus weights in higherdose female mice. Another notable were significantly ( P<0.05) decreased in rats effect was a decrease in uterine weights a t the given 0.3 mg kg or more of PBB. The weight of 10.0 mg dose. the spleen was increased in those rats given I .O mg kg or more of PBB (Tables 9 and IO).
TABLE 9. ABSOLL'TE A N D RELATIVE WEIGHTS (% OF BODY WEIGHT) O F LIVER, SPLEEN, A N D THYMUS OF MALE RATS AFTER A 6-MONTH EXPOSURE TO PBB
Liver Weight Spleen Weight Thymus Weight Dose
(mg/kg/day) Absolute (9) Relative (%) Absolute (8) Relative (%) Absolute (g) Relative (%)
0 13.2 5 .14 3.2 k.03 0.58 5.03 0.14 5.01 0.14 5.01 0.034 f.001
0. I 13.9 5 .43 3.4 f . 0 8 (a) 0.57 f . 0 2 0.14 f . 0 1 0. I3 k.01 0.033 f .002
0.3 15.8 5 . 2 7 (h) 4.0 5 . 1 5 (h) 0.63 k.02 0.16 f . O 1 0.12 5.01 (a) 0.030 f.OO1
I .o 18.8 +.32 (h) 4.8 k.04(b) 0.64 31.02 (a) 0.16 f . 01 (a) 0.1 I 5.00 (h) 0.029 f . O O 1 (h)
3.0 21.4 f . 51 (h) 5.9 k.08(b) 0.77 f . 0 3 (h) 0.21 k.01(b) 0.07 f.O1 (b) 0.020 f .002 (b)
10.0 20.8 L 3 4 (h) 6.7 f . 0 5 (h) 0.76 3I.04 (h) 0.25 k.01 (b) 0.04 5.00 (h) 0.012 k.001 (h)
Dose Response P <0.01 P <0.01 P <0.01 P <0.01 P <0.01 P <0.01
Data are expressed as mean f S E M of I O rats. (a) Significantly (P <0.05) different compared with control. (b) Significantly (P <0.01) different compared with control.
Polybrominated Biphenyl Mixture 30

0
TABLE IO. ABSOLUTE AND RELATIVE WEIGHTS (% OF BODY WEIGHT) O F LIVER, SPLEEN, AND THYMUS O F FEMALE RATS AFTER A 6-MONTH EXPOSURE TO PBB
Liver Weight Spleen Weight Thymus Weight Dose
(mg/kg/day) Absolute (9) Relative (%) Absolute (g) Relative (%) Absolute (9) Relative (%)
6.2 f .I2 2.9 f . 0 6 0.38 f .01 0.18 f . 0 1 0.14 5.00 0.070 f .002
0. I 6.8 f . 2 3 (a) 3.1 f . 0 7 (a) 0.38 f . O 1 0.17 f . O 1 0.13 f . 0 1 0.061 f .002
0.3 6.6 f . 2 1 (a) 3.3 f.11 (h) 0.39 f.O1 0.19 f .01 0.12 f.01(b) 0.056 f .002 (h)
1 .o 7.1 f . 2 7 (a) 3.4 k.09 (h) 0.41 f.01 0.20 f . 0 1 (a) 0.1 I f . 0 1 (h) 0.052 f .002 (h)
3.0 7.8 f . 2 2 (a) 4.3 & . I O (b) 0.49 f . 0 2 (b) 0.21 f .01 (h) 0.07 f .00 (b) 0.037 f .002 (h)
10.0 8.6 f . 2 4 (b) 5.6 f . 0 9 (b) 0.43 f . 0 2 (h) 0.28 f . 01 (b) 0.04 f .01 (h) 0.024 f . 0 0 4 (h)
Dose Response P <0.01 P <0.01 P < 0.01 P <0.01 P < 0.01 P < 0.01
Data are expressed as mean fSEM of I O rats.
(a) Significantly (P < 0.05) different compared with control.
(b) Significantly (P < 0.01) different compared with control.
TABLE 11. ABSOLUTE WEIGHT (9) AND RELATIVE (%) LIVER TO BODY WEIGHT O F MALE AND FEMALE MICE AFTER A 6-MONTH EXPOSURE TO PBB
Liver Weight of Male Mice Liver Weight of Female Mice
Dose (mg/kg/day) Absolute (g) Relative (%) Absolute (g) Relative (%)
0 1.8 f . 0 6 5.0 f . 1 5 1.2 f . 0 4 4.5 f . 0 8
0. I 2.0 f . 0 3 4.9 f . 0 8 1.3 f . 0 3 4.5 f . 0 7
0.3 1.8 f . 0 5 4.9 *.I 1 1.3 f . 0 3 (a) 4.9 f . 0 7 (h)
1 .o 2.1 f . 0 8 (a) 5.6 f . 1 6 (a) I .6f . 0 6 (h) 5.7 f . 1 9 (b)
3.0 2.5 f . 0 7 (b) 6.4 f . 1 7 (b) 1.9 f . 0 3 (h) 6.7 f.09(b)
10.0 4.3 f.10(b) 12.4 f . 3 2 (h) 4.6 f .10 (h) 15.0 f . 2 9 (b)
Dose Response P < 0.01 P <0.01 P <0.01 P <0.01
Data are expressed as mean fSEM of I O mice. (a) Significantly (P < 0.05) different compared with control.
(h) Significantly ( P <0.01) different compared with control.
31 Polybrominated Biphenyl Mixture

III. RESULTS: SIX-MONTH OBSERVATION
Hematologic Findings decreased. The WBC count was significantly The hemoglobin and packed cell volume (P<0.05)increased in dosed female rats at dose
values were decreased in both male and female levels of 1.0, 3.0 and 10.0 mg/kg due to an rats at the two highest dose levels (Table 12). increase in both neutrophils and lymphocytes Similarly, mean corpuscular volume (MCV) and (Table 13). However, this trend was not mean corpuscular hemoglobin (MCH) were also observed in treated male rats.
TABLE 12. ERYTHROCYTE VALUES A N D PLATELET COUNTS OF RATS AFTER A 6-MONTH EXPOSURE TO PBB
Mean Cor- Mean Cor-Red Blood puicular puscular
Dose Hemoglobin Packed Cell Cells Volume Hemoglobin Platelets Sex (mg/kg/day) (g/100 ml) Volume (I)(106/cmm) (@) (wg) (lOe/cmm)
MALE 0 16.9 m . 3 50.6 m . 9 5.8 m.1 85.9 f 1 . 3 29.2 m.5 138.6 * 7.3 0.1 17.0 k0.4 49.4 m.9 5.6 m . 3 89.3 f 5 . 1 30.8 f 2 . 1 165.8 rt 7.4 (a) 0.3 16.6 M . 2 48.1 39.3 (a) 6.1 M.I 79.4 k1.5(a) 27.4 f0.7 150.3 f 8.6 1 .o 15.5 f 0 . 2 (a) 45.7 f0.8(b) 5.5 m.1 83.0 k2.5 28.2 f l . 0 161.1 f 5.1 (a) 3.0 15.0 f 0 . 3 (a) 43.8 MS (b) 6.3 f o . 2 (a) 69.4 k2.2 (a) 23.9 kl.0 (a) 180.0 f10.9(a)
10.0 13.6 f 0 . 2 (a) 39.5 f l . 1 (b) 5.6 M.I 71.2 k l . 8 (a) 24.5 33 .2 (a) 117.2 f t 2 . 7 Dose Response P <0.01 P <0.01 NS P <0.01 P <0.01 NS
FEMALE 0 17.8 M . 3 50.0 k l . 4 5.4 f 0 . 2 91.9 f l . 9 32.8 M . 7 134.7 f 2.8 0. I 17 .2f0 .5 48.133.7 5.3kO.l 90 .8f1 .0 3 2 . 6 M . 7 1 2 5 . 5 f 4 . 1 0.3 16.7 53 .3 (a) 49.2 f 1 . 2 6.3 M . 2 (a) 77.6 M . 9 (a) 26.4 f 0 . 7 (a) 240.9 M3.2 I .o 17.0f0.5 4 8 . 1 M . 7 6 . 0 M . 1 (a) 80.3*1.3(b) 28.4+0.6(b) 218.3k39.7 3.0 16.1 k0.4 (a) 43.9 f 0 . 8 (a) 5.7 33.03 77.6 k1.5 (b) 28.5 k0.6(b) 124.5 k 6.7
10.0 16.3 M . 6 (a) 46.2 +IS 6.1 M . 3 76.1 f1.8(b) 26.9 f0.9(b) 113.8 f 1 0 . 3 Dose Response P <0.01 P < 0.01 NS P <0.01 P < 0.01 NS
Values are the Mean f SEM (a) P <0.05. significantly different compared with control of same sex. {b) P <0.01, significantly different compared with control of same sex.
TABLE 13. BLOOD LEUKOCYTE AND DIFFERENTIAL COUNTS OF RATS AFTER A 6-MONTH EXPOSURE TO PBB
Total Lympho- Neutrc-Dose Leukocytes cytes phlls Eosinophils Monocytes
Sex (mg/kg/dsy) (tO3/cmm) (10l/cmm) (lOl/cmm) (IO’/emm) (103/cmm)
M A L E 0 9.9 i0.9 7.4 k0.7 2.2 3 3 . 3 0.1 5rO.02 0.3 kO.1 0. I 12.3 f 3 . 0 6.9 39.3 4.7 k2 .8 0.1 m.05 0.6 f 0 . 1 0.3 9.0 f0.5 6.6 f 0 . 5 2.1 M.I 0.1 f0 .03 0.3 fO.l I .o I 2 . 0 f 2 . 2 6 . 8 f 0 . 6 2 . 3 M . 2 0 . l f 0 . 0 2 0 . 5 f 0 . 1 3.0 16.1f2.2(0) 9 . 3 f 0 . 6 l a ) 6.052.1 0 . 2 i 0 . 0 0 0 . 8 f 0 . 2
10.0 7 . 8 f 0 . 7 5 . 8 f 0 . 4 1 .810 .3 O . O f O . O O 0 . 3 i O . l Dose Response N S NS NS NS NS
FEMALE 0 5.3 f 0 . 4 4.0 f 0 . 3 0.9 M . 2 0.1 fO.01 0.3 kO.l 0. I 6.3 f 0 . 2 (a) 4.5 f 0 . l 1.5 50.2 (a) 0.1 k0.04 0.2 M.03 0.3 5.5 M . 5 4.3 f 0 . 6 1.3 M . 4 0.1 M . 0 4 0.2 f0 .03
I .o 7.7 k0.2 (h) 5 . 7 M . 5 (a) 1.7 M . 3 0.1 f0 .03 0.3 f0 .04 3.0 7.8 i l . 0 (a) 6.0 k0.8 1.5 M . 2 0.1 f0.00 0.3 f O . l
10.0 10.7 f 1 . 6 (h) 8.3 f 1 . 6 (h) 2 .1 k0.4 (h) 0.0 M.OO 0.3 f0.02 Dose Response P < 0.01 P <0.01 P <0.01 NS NS -
Values are the Mean f SEM (a) P <0.05, significantly different compared with control of same sex (h) P <0.01. significantly different compared with control of same sex.
Polybrominated Biphenyl Mixture 32

III. RESULTS: SIX-MONTH OBSERVATION
There was a significant (P<O.O I ) dose-related ence between dosed and control male mice increase in the RBC count in male and in female (Table 14). Leukocytosis was due primarily to an mice (Table 14). The MCV was decreased in increase in lymphocytes in female mice at the both male and female mice in a dose-related highest dose level(Tab1e 15). No consistent dose- fashion. Platelet counts were significantly related effect on these parameters was observed (P<O.Ol) decreased in the female mice given 3.0 in mice. and 10.0 mg/kg of PBB, but these was no differ-
TABLE 14. ERYTHROCYTE VALUES AND PLATELET COUNTS OF MICE AFTER A 6-MONTH EXPOSURE TO PBB
Mean Cor- Mean Cor- Red Blood puscular puscular
Dose Hemoglobin Packed Cell Cells Volume Hemoglobin Platelets Sex (mg/kg/day) (g/100 ml) Volume (%) (IOVcmm) (P) ( W b ) (1Or/ cmm)
MALE 0 16 .4M.7 43.3f1.4 5.36f0.3 81.6f4.7 30.8f1.7 269.5 f26.0 0.I I 5 . O f 0 . 5 4 2 . 3 f l . l 5.3339.4 81 .4 f6 .7 28 .9 fZ . l 305.6 f21.4 0.3 17.4 f 0 . 3 45.5 M . 8 6.28 f O . l (b) 72.5 10.2 27.7 M.5 308.1 f24.9 I.o 16.5 f 0 . 4 44.2 M . 6 6.07 f O . l (0) 72.5 f 0 . 7 27.2 M . 5 279.3 f18.1 3.0 17.3 f0.2 44.9 M.8 6.17 f0.3 (a) 73.5 f3.3 28.3 11.5 297.8 f20.9
10.0 17.1 10.2 43.9 M . 4 6.19 f O . l (b) 71.0 11.3 (b) 27.7 M . 5 268.0 f l 3 . 5 Dose Response NS N S P <0.01 P <0.01 NS N S
FEMALE 0 16.0 50.6 45.8 M . 4 6.40 M.I 71.6 10.9 25.0 M . 9 291.2 f 2.7
0. I 16.1 M . 6 46.5 10.7 6.25 f O . l 74.5 12.0 25.8 f I . 0 254.1 f 1 3 . 6
0.3 15 .1M.8 44 .7M.9 6 . 4 9 M . I 68.9f0.4(b) 2 3 . 3 M . 9 277.7 117.9
I.o 16.6 53.1 46.4 M . 5 6.63 M.I (a) 70.0 M . 6 25.1 M . 3 221.3 f30.2 (b) 3.0 16.6 f 0 . 2 46.0 M . 4 7.32 M.I (r) 62.8 M . 2 (c) 22.7 M.I 210.7 f 7.2 (c)
10.0 16.7 M . 3 45.5 M . 7 7.08 M.I (c) 64.3 f0 .8 (c) 23.6 10.4 191.1 f 8.1 (c)
Dose Response NS NS P <0.01 P <0.01 P = 0.026 P <0.01
Values are the Mean fSEM (a) P 0.056. significantly different compared with control of same sex. (b) P <0.05, significantly different compared with control of same sex. (c) P <0.01, significantly different compared with control of same sex.
TABLE IS. BLOOD LEUKOCYTE AND DIFFERENTIAL COUNTS OF MICE AFTER A 6-MONTH EXPOSURETOPBB
Total Lympha- Neutro-Dose Leukocytes cytes phils Eosinophils Monocytes
Sex (mg/kg/day) (1O3/cmm) (lOS/cmm) (lO*/cmm) (10a/cmm) (I03/cmm) ~~
MALE 0 6.9f0.8 4.5 M . 6 2.2f0.7 0.03 f0 .03 0.2 M.04 0.I 8.913.2 5.7fZ.l 2.9f1.3 0.0 f O . O O 0.2 M . 0 7
0.3 11.4f1.2 7.7f0.7 (b) 3.4f0.9 0.0 fO.OO 0.3 33.07
I .o 9.0f1.2 5 . 9 M . 4 2 . 9 f l . I 0.0 M.OO 0.2 f0 .06
3.0 6.6 f 0 . 3 4.9 M . 4 I.6 10.4 0.03 f0.03 0.1M . 0 2
10.0 7.1 f 0 . 8 4 . 6 M . 6 2.3M.3 0.0 10.00 0.2 f0 .06
Dose Response N S NS NS NS NS
FEMALE 0 4 .0 f0 .7 3.010.5 0.910.2 0.0 M.00 0.IM . 0 3
0.1 4.0f0.4 3 . 2 M . 3 0.7f0.2 0.02 fO.02 0.1 f0 .02
0.3 3.4 f 0 . 4 2.7 M . 3 0 .6 f0 .1 0.0 M.00 0.1 M . 0 2
I.o 4 .8f1.3 3.633.8 1.110.5 0.0 f0.00 0.1 M . 0 4 3.0 4. I f 0 . 8 3.2 f 0 . 6 0.8f O . I 0.0 f O . O O 0.1 f0.02
10.0 6.3 f 0 . 6 4.9 M . 4 (0) 1.3M . 2 0.0 10 .00 - 0.1 f0 .04 Dose Response N S P = 0.06 NS NS NS
Values are the Meanf SEM (a) P = 0.06. significantly different compared with control of same sex. (h) P < 0.05. significantly different compared with control of same sex.
33 Polybrominated Biphenyl Mixture

I I I . RESULTS: SIX-MONTH ,OBSERVATION
Clinical Chemistry observed in SGPT, AP, and BUN values in male Total serum protein was decreased in a dose- and female dosed and control rats.
related fashion in female rats, primarily due to a Serum levels of GGTP were increased only in dose-related decrease in albumin (Table 16). female micegiven 10.0 mg/ kg of PBB (Table 18). There was a significant (P <0.05) increase in the There was a 5- to 6-fold increase in the activity of serum levels of gamma glutamyl transpeptidase SGPT in male and female mice in the 10.0mg/ kg (GGTP) only in female rats given 10.0 mg/ kg groups (Table 18).Serum enzyme activity of AP dose (Table 17). There was a dose-related was also increased in mice given the highest dose decrease in serum glucose in female rats, a dose- of PBB. There was a significant increase in the related decrease in the serum triglyceride level in serum levels of cholesterol in female mice at the treated male rats, except at the lowest dose (0.1 highest dose (Table 18). Serum glucose was sig-mg/ kg), and a dose-related increase in the serum nificantly ( P <0.05) decreased in female mice levels of cholesterol in both male and female rats administered 10.0 mg/ kg of PBB. (Table 17). No significant differences were
TABLE 16. SERUM PROTEIN VALUES O F RATS AFTER A 6-MONTH EXPOSURE TO PBB
MALE 0 6.89 f.55 3.33 f . 2 2 3.57 f . 3 4 0.94 f . 0 3 0.1 7.34 f . 6 8 3.51 f . 19 3.83 f . 5 1 0.95 f . 0 6 0.3 6.66 f . 2 6 3.30 f.12 3.35 f.15 0.99 f . 03 1.o 6.63 f . 2 2 3.28 f . 0 9 3.34f.15 0.99 f . 0 3 3.0 6.19 f . 5 6 2.94 f . 2 8 3.25 k.29 0.91 k.03
10.0 6.66 f . 1 9 3.16 f . 0 9 3.50 f . 10 0.90 f.01 Dose Response NS NS NS NS
FEMALE 0 6.62 f.10 3.52 f . 09 3.10 f.05 1.I4 f . 0 3 0. I 6.61 f . 2 2 3.51 f . 1 0 3.10f.14 I , 14 f.04 0.3 6.43 f.13 3.44 f . 0 9 3.00 f . 0 6 1.15 f . 0 3 1.o 5.73 f . 09 (a) 2.71 f . 0 7 (a) 3.02 f . 0 4 0.90 f . 0 2 (a)
3.0 5 .95f .19 (a) 2.75f.10 (a) 3.20f.11 0.86 f . 0 3 (a)
10.0 5.75 f . 2 6 (a) 2.67 f . 1 5 (a) 3.08 f . 1 2 0.86 f . 0 2 (a)
Dose Response P <0.01 P <0.01 NS P <0.01
Values are the Mean f SEM (a) P < 0.05, significantly different compared with control of same sex.
Polybrominated Biphenyl Mixture: 34

TABLE 17. SERUM CLINICAL CHEMISTRY VALUES OF RATS AFTER A 6-MONTH EXPOSURE TO PBB
Gamma glutamyl
transpepti- Serum Serum Serum Dose dase glucose triglyceride cholesterol
Sex (me/kg/day) (IU/Liter) (mg/100 ml) (mg/100 ml) (mg/100 ml)
MALE 0 3.1 M.7 135 f l 2 335 f146 89 f 1 2 0.1 3.3fo.8 133f13 324 f139 110f 2 1 0.3 2.6 fo.6 138 f 1 2 1 5 5 f 15 9 4 5 6 1 .O 3.0MS 143f 1 0 119f 8 ( b ) 116f 5 3.0 3.5 M.3 120f 4 152f 12 (a) 1 6 0 f 1 8 (a)
10.0 3.9 M.6 122f 6 1 5 5 f 18 243 f 15 (a) Dose Response NS N S P < 0.05 P <0.01
FEMALE 0 3.3 fo .7 131 f 1 3 109f 7 123f 5 0.1 3.2 M . 5 1 1 8 f 3 l l O f 13 136f10 0.3 2.6 fo.4 120f 8 122f 32 141k 6 1.O 2.2 fo.4 113f 6 9 1 f 19 146f 6 (a) 3.0 4.5 fo.6 116f 4 l l 5 f 10 181 f l l (a)
10.0 7.9 f1.2 (a) 101f 1 0 107f 5 147 512 Dose Response P <0.05 P C 0.05 NS P <0.01
Values are the Mean f SEM
(a) P € 0.05, significantly different compared with control of same sex. (b) P <0.01, significantly different compared with control of same sex.
TABLE 18. SERUM CLINICAL CHEMISTRY VALUES OF MICE AFTER A 6-MONTH EXPOSURE TO PBB
Gamma Serum Glutamyl Glutamic Serum
Trans- Pyruvic Serum Serum Alkaline Dose peptidase Transaminase Cholesterol Glucose Phosphatase
Sex (mg/kg/day) (IU/Liter) (IU/Liter) (mg/100 ml) (mg/lM ml) (IU/Liter)
MALE 0 I f o .0 36 f 1 4 108f 6 143 f 1 6 3 0 f 4 0.1 2 f0 .4 3 4 f 7 116f 5 128 f 2 3 2 7 f 4 0.3 2 M . 3 77 f 2 9 107f 4 148 f18 3 0 f 3 I .O I M.4 43 *IO 103f 5 149f 6 3 4 f 2 3.0 133.3 6 1 f 8 9 8 f 2 150f 1 9 3 1 f 2
10.0 2 f l . 0 214 f 3 4 (a) 131f 9 146f 8 127f10 (a)
Dose Response NS P <0.01 NS NS P <0.01
FEMALE 0 1 M . 2 58 f l 2 7 9 f 4 151 f 1 7 64f 7 0.1 1 f0 .3 2 9 f 5 8 3 f 4 148 f l 2 7 0 f 3 0.3 133.2 2 2 f 3 (a) 8 l f 2 159f10 6 4 f 6 1.O 1 M.2 24f 2 (a) 81 f l i 147211 72 f 1 9 3.O 1 fo.2 79 f 4 5 9 6 f 9 137f12 6 8 f 2
10.0 15 f4.7. ) 312f30 (a) 213f 8 ) 108 f 2 I ) 103f l l (a)~
Dose Response NS NS P <0.01 P < 0.05 P <0.05
Values are the Mean f SEM
(a) P <0.05, significantly different compared with control of same sex.
35 Polybrominated Biphenyl Mixture

There was a dose-related decrease in serum PBB produced dose-related hepatic porphyria thyroxine (T4) values in male and female rats in male and female rats and mice (Table 20). At (Table 19). Serum triiodothyronine (T,) levels the highest doses, hepatic prophyrin levels were were decreased in dose-related fashion in female increased several hundred-fold in females of rats. each species. Male rats and mice were affected
much less than females.
TABLE 19. SERUM THYROID HORMONE VALUES IN RATS AFTER A 6-MONTH EXPOSURE TO PBB
T4 ( /M100 ml) T3 (ng/100 ml) T3 Uptake Dose
(mg/kg) Male Female Male Female Male Female
Control 5.3 f . 2 3.1 k . 2 1 2 6 k 7 123-1.14 61.9 M . 9 58.1 k1.0 0. I 4.5 32.8 3.6 k . 3 99-1.15 1 0 6 k 9 62.6k1.4 58.4 k0.7 0.3 4.4 k . 3 (a) 3.3 f . 4 IIl-1.13 1 1 2 k 8 59.9 k0 .6 58.7 M.5 I .o 4.0 f . 3 (a) 2.1 1 . 2 (b) 1 3 3 k l l 86k.10 58.9 50.7 61.7 M . 6 (a)
3.0 3.0 f . 3 (b) 1.7 k . 2 (b) 107k10 80-1. 8(a) 59.7k1.4 59.2'M.6 10.0 2. I f.I (b) I .5 +.2 (h) 104k 3 77 k 9 (a) 56. I 50.5 (b) 60.3M . 6
Dose Response P < 0.01 P < 0.01 NS P <0.01 P <0.01 P = 0.02
Values represent the m e a n k SEM of 10 rats.
(a) Significantly (P < 0.05) different compared with control. (b) Significantly (P <0.01) different compared with control.
TABLE 20. HEPATIC PORPHYRIN LEVELS @g/g) IN RATS A N D MICE AFTER A 6-MONTH EXPO- SURE TO PBB
Rats Mice
Male Female Male Female ~~
Control l . O * 0.2 0 . 7 k 0.1 1.0+ 0.1 1 .1 k 0.2 0.1 0.8* 0.1 0 . 5 k 0.1 l . 0k 0.1 0.7 k 0. I
0.3 2.0 * 0.3 (b) 15.8* 8.2(b) l.2k 0.1 (a) 0.9 k 0.1 I .o 15.3 * 4.2(b) 1002.0k65.0(b) 1.7 k 0. I (b) 3.5 f 2.0
3.0 36.1 k 8.3 (b) 1369.0 k65.0 (b) 1 8 . 7 1 4.3(b) 97.0 -1.23.0 (b)
10.0 45.3kIl.O(b) 517.0 k80.0(b) 58.0 klO.O(h) 435.0 -1.20.0(b) Dose Response P < 0.01 P <0.01 P <0.01 P < 0.01
Values represent the mean k S E M of I O animals.
(a) Significantly (P < 0.05) increased compared with controls. (b) Significantly (P <0.01) increased compared with controls.
Polybrominated Biphenyl Mixture 36

III. RESULTS: SIX-MONTH OBSERVATION
Necropsy Findings Liver, bones, and teeth of female rats given 1 .O
to 10.0 mg/kg of PBB had slight to marked reddish pink fluorescence under UV light, denot- ing excess porphyrin accumulation. The number of positive samples and intensity of red fluores- cence was less in dosed male rats compared with the dosed females. These tissues from all female mice administered 10.0 mg/ kg of PBB showed slight to marked fluorescence, whereas only 8 out of 10 male mice were positive in the same dose level.
The livers of dosed rats and mice of each sex were moderately to markedly enlarged, espe- cially at the higher dose levels. Two male rats (one given 0.3 mg/ kg and the other 10.0 mg/ kg) had several grayish white nodules (about 5 mm in diameter) in the liver. One female rat out of 10 given 10.0 mg/ kg of PBB had a grayish white space-occupying mass involving the interior of the urinary bladder. The thymus of dosed rats (10.0 mg/ kg) appeared smaller compared with the control. No lesions were observed in other organs.
Eight of 10 male mice and 1 of 10 females in the 10.0 mg/ kg groups had several small grayish white foci in the liver. One male mouse out of 10 controls also showed a similar lesion.
Histopathologic Findings Microscopic alterations in the liver of rats and
mice related to PBB administration are given in Table 21. Dose-related changes were observed in the liver in all groups of dosed male rats and in the 1.O, 3.0, and 10.0 mg/ kg female groups. The microscopic appearance of these livers was char- acterized by disorganization of trabecular cords, moderate to marked enlargement of hepato- cytes, some of which were multinucleated, mod- erate fatty infiltration (oil red 0 stain) and hyalinization of cytoplasm of other hepatocytes. Some of the hepatocytes had a foamy appear- ance. Numerous granulomatous foci with occa- sional multinucleated giant cells were observed, primarily near the central vein. These foci invari- ably contained golden brown granular pigment which was positive for iron (Mallory’s method for iron; Luna, 1968). Occasionally, the reacting cells in the center of these granulomas formed rosette-like structures around the hemosiderin granules. Small fatty acid clefts were occasion- ally observed in these foci. Single cell hepatocel- lular necrosis with infiltration of neutrophils was also observed. There was slight to moderate focal or diffuse bile duct proliferation in the liver. Lipid accumulation was more prominent in male than female rats (Table 22) and was primarily located around the central veins.
TABLE 21. HEPATIC LESIONS IN RATS (u)AND MICE (u)AFTER A 6-MONTH EXPOSURE TO PBB
Microscopic Alterations in the Liver
No. of Livers Positive
Sex Dose
(mg/kg/day)
MALE 0 0.1 0.3 1 .o 3.0
10.0
FEMALE 0 0.1 0.3 1 .o 3 .O
10.0
Rat Liver
Normal A few foamy cells Slight swelling, foamy cells Slight swelling, foamy cells Marked swelling Marked swelling, fatty
Normal Normal Normal Slight swelling, foamy cells Moderate swelling Marked swelling, fatty
Mouse Liver
Normal N ormal Normal Slight swelling Moderate swelling Marked swelling
Normal Normal Normal Slight swelling Moderate swelling Marked swelling
for Atypical Foci Rat Mouse
0 1 0 0 0 1
1 0
0 0 0 8
(a) There were I O rats or mice/group:sex at each dose level examined after 6-month exposure. (b) One female rat of this group developed squamous cell carcinoma involving urinary bladder.
37 Pol) brominated Biphenyl Mixture

III . RESULTS: SIX-MONTH OBSERVATION
Atypical foci were observed in the livers of 3 of 100 (3.0%)dosed rats, although no definite dose or sex relationship was observed (Table 21). None were observed in control rats. These foci were well delineated groups of hypertrophic hepatocytes with enlarged nuclei containing prominent nucleoli and foamy or eosinophilic ground glass cytoplasm.
Observed on ultrastructural examination of the liver were increased amounts of rough endo- plasmic reticulum (RER) and lipid globules of different sizes in the hepatocytes of male rats given the highest dose of PBB. In the dosed female rats (highest dose), the changes in the liver were much more severe, as denoted by marked proliferation and disorganization of RER, dilated cristae, and dense mitochondrial matrices. Occasionally, intramitochondrial floc- culent deposits were also observed.
The space-occupying mass in the urinary bladder of a female rat in the 10.0 mg/ kg group was diagnosed as a squamous cell carcinoma. This neoplastic mass protruded into the lumen and was covered with one to several layers of atypical flattened epithelium. Composed of islands of squamous epithelium, some contained concentric laminations of keratin. The connec- tive tissue stroma was heavily infiltrated with inflammatory cells. Although the neoplastic cells infiltrated into the deepcr muscular wall of the urinary bladder, no metastases were observed.
Although there was no significant difference in thyroid gland weights, slight to moderate morphologic changes were observed, primarily in the male rats administered 10.0 mg/kg of PBB. Microscopic changes in the thyroid gland were characterized by thin, sparse, or bluish col- loid with basophilic stippling. Some follicles were lined with columnar epithelium and also
contained a few epithelial papillary projections. Changes in the thyroid gland of dosed female rats (highest dose) were not very remarkable compared with the female controls.
The kidneys of male rats at the 10.0 mg/ kg dose level of PBB consistently showed atrophy of a few glomerular tufts with marked dilation of Bowman’s capsule, which contained amorphous eosinophilic staining material. A few glomerular tufts also appeared edematous. Some renal tubules in both cortical and medullary regions were dilated and contained either serous fluid or proteinaceous casts. Significant lesions were not observed in the other organs.
Microscopic alterations in the livers of male and female mice (10.0 mg/ kg dose levels) were marked swelling of hepatocytes, primarily around the central veins, foamy or vacuolated cytoplasm with hyaline bodies, and focal coagu- lative necrosis or scattered single cell necrosis of hepatocytes. Only slight to moderate swelling of hepatocytes was observed in mice administered 1.O and 3.0 mg/ kg of PBB, and no lesions were observed at lower doses (Table 21). Atypical hepatocellular foci were present in 9 male and 2 female dosed mice of 100 examined (1 1.O%), and in 1 of 20 (5.0%) control mice (Table 21). These foci were similar to those described in the rat.
Iron positive granules, probably hemosiderin, were observed primarily in the red pulp of the spleen of all dosed and control animals. How- ever, these granules were more prominent in the spleen of the dosed female rats than in that of the dosed male rats, and they were more prominent in dosed rats of either sex than in the controls. There was no difference in the spleens of dosed and control male mice. However, the spleen of control female mice tended to have more iron positive granules compared with the PBB-dosed female mice.
Polybrominated Biphenyl Mixture 38

TABLE 22. MICROSCOPIC OBSERVATION OF EXCESS LIPID ACCUMULATION (OIL R E D 0 STAIN) IN THE LIVER OF RATS AFTER A 6-MONTH EXPOSURE TO PBB
Dose Sex (mg/kg/ day)
~~ ~
MALE 0 0.I 0.3 I .o 3.0
10.0
FEMALE 0 0.1 0.3 1.o 3 .O
10.0
(a) Increasing order of intensity
Staining Intensity (a)
f f + ++ ++ ++t
f f f f + ++
Size of Lipid Globules
Fine to medium Fine Fine to medium Medium to large Fine to large Fine to large
Fine to medium Fine Fine Fine Fine to large Fine to large
Location of Positive Hepatocytes
Scattered or midzonal Scattered Centrilobular Centrilobular Midzonal and centrilobular All over
Scattered Centrilobular Scattered Scattered Scattered Midzonal and centrilobular
= f,+, ++, and +++
39 Polybrominated Biphenyl Mixture

III. RESULTS: SIX-MONTH OBSERVATION
RESULTS OF LIFETIME OBSERVATION
Survival Time in Rats 762 days. The mean survival time in control female rats was 702 days, and the dosed (0.1,0.3,
A dose-dependent decline in survival time was 1.0, and 3.0 mg/ kg) groups lived longer than the observed in dosed male rats (Fig. 3, Table 23). controls (Fig. 4, Table23). Although the survival Male rats given 1.0, 3.0, or 10.0 mg/ kg of PBB time in 10.0 mg/ kg dosed female rats was slightly lived an average life of 677, 680, or 615 days, lower (662 vs. 702 days) than that in the controls, respectively, as compared to control survival of this difference was not statistically significant.
100
90 -8 0 -
-70
' 6 0 -
5 0 -3 5 4 0 -
L 30-
c-
00 0.1 mg
0.3 mg 1.0mg ---20 - 3.0mg
-10
01 270 300 330 360 390 420 450 480 510 540 510 600 630 660 690 120 750 780 810 840 870 900
TIME (DAYS)
Fipre 3. Survival Curves for Male Rats Administered Polybrominated Biphenyl Mixture in Corn Oil by Gavage
Polybrominated Biphenyl Mixture 40

TABLE 23. EFFECT O F POLYBROMINATED BIPHENYL ADMINISTRA- TION ON SURVIVAL IN RATS A N D MICE
Survival Time (Days) (a)Dose
Sex (mg/kg/day) Rats Mice
MALE 0 762 f18(33) 784 f23(25)
0.1 744 f16( 39) 785 f25(27)
0.3 733 *10(40)(c) 766 f28(24)
I .O 677 fI 5( 3 1) (c) 765 f30(25)
3.0 680fl3(33)(c) 790 f29(23)
10.0 615 f18(32)(c) 682 f28(22) (b)
Dose Response P <0.01 P =0.01
FEMALE 0 702 k33(20) 8 13 f 2 8 ( 13)
0.1 756 f22(21) 840 f 2 4 ( 19)
0.3 800*16(21)(b) 843 f 2 7 ( 15)
1.o 830f18(11)(c) 871 f21(11)
3.0 761 f 2 5 ( 19) 842f18( 17)
10.0 662 f42(20) 74 I f37(8)
Dose Response NS NS
(a) Data reported as mean f S E (number of animals examined). (b) Survival significantly (P <0.05) different than controls. ((9 Survival significantly (P < 0.01) different than controls.
TIME (DAYS)
Figure 4. Survival Curves for Female Rats Administered Polybrominated Biphenyl Mixture in Corn Oil by Gavage
41 Polybrominated Biphenyl Mixture
00

III. RESULTS: LIFETIME OBSERVATION
Survival Time in Mice controls (Fig. 5 , Table 23). There was no statisti- There was significant ( P <0.05) reduction in cally significant difference in the survival time
the survival time in male mice at the highest dose between the dosed females (all dosage groups) (10.0 mg/ kg group) when compared with the and the control females (Fig. 6 , Table 23).
240 270 300 330 360 390 420 450 400 510 540 570 600 630 660 690 720 750 780 810 840 870 900 930 9 TIME (DAYS)
Figure 5. Survival Curves for Male Mice Administered Polybrominated Biphenyl Mixture in Corn Oil by Gavage
510 540 570 600 630 660 690 720 750 780 810 840 870 900 930 960 TIME (DAYS)
Fipre 6. Survival Curves for Female Mice Administered Polybrominated Biphenyl Mixture in Corn Oil by Gavage
Polybrominated Biphenyl Mixture 42

III. RESULTS: LIFETIME OBSERVATION
Body Weights in Rats and Mice (Tables 24 and 25). The body weights of male mice were slightly reduced only at the 10.0 mg
The dose-related body weight differences in dose level (Table 26). However, there appeared rats that existed at the end of the 6-month dosing to be nodose-related effect on body weight in the persisted throughout the lifetime of the animals female mice (Table 27).
TABLE 24. BODY WEIGHTS (g) O F MALE RATS DURING LIFETIME OBSERVATION PHASE OF PBB STUDY
Weeks Post
Exposure Control 0.1 mg/kg 0.3 mg/kg 1.0 mg/kg 3.0 mg/kg 10.0 mg/kg
0 407f3(5I)(u) 408f3(50) 405f3(50) 395f3(51) 353f3(51) 298 *3(51) 12 45 3 f 6 ( 20) 454 f5(26) 444 f4(26) 437 f 5 ( 18) 388 f5(20) 327 st5(20) 24 482 f6(20) 477 f5(26) 474 f5(26) 463 f 5 ( 18) 417 f6(20) 354 f 4 ( 19) 36 498 f6(20) 497 f5(25) 493 f5(26) 481 f 5 ( 18) 432 f6(20) 378 f 5 ( 19) 48 49 1 f 6 ( 18) 493 f5(25) 488 f4(26) 483 f 7 ( 17) 429 f 5 ( 19) 376f6(18) 60 490 f 6 ( 17) 490 f4(24) 483 f4(25) 463 f 6 ( 16) 414 f l I ( 16) 379f4( 15) 72 469 f 5 ( 17) 474f5(23) 463f8(20) 433514(1l) 4 0 9 f l l ( l l ) 350 st I2(5) x4 4 1 2 ~ 1l(12) 421 +12(12) 407f15(l I ) 414+25(4) 370f34(2) - (0) 9(l 380 k l3(5) 368 f 9 ( 4 ) (0) (0) (0) (0)
- __ - __-
Dat,~prcsented are Mean f S E M (u) Data in parentheses indicate the number of rats examined at that time point.
TABLE 25. BODY WEIGHTS (9) OF FEMALE RATS DURING LIFETIME OBSERVATION PHASE OF PBB STUDY
~~~
Weeks Post
Exposure Control
0 218f2(5l)(u) 12 242 f3(20) 24 264 f4(19) 36 294 f 5 (18) 48 307 f 5 (18) 60 322 *5( 15) 72 31 8 f 5 ( 14) 84 286 f9 (9 ) 96 293 f 12( 2)
D a t a presented a r e Mean f S E M
0.1 mg/kg 0.3 mg/kg 1.0 mg/kg 3.0 mg/kg 10.0 mg/kg
221 f l ( 5 1 ) 213f2(51) 205f2(51) 183f1(50) 161 f l ( 5 l ) 243 f3(20) 236 f3(20) 229 f 5 ( I I ) 197 f 2 ( 19) 184 f2(18) 264f4(20) 257f4(20) 258f7(11) 215*3(19) 195f2(77) 297f6(20) 287f4(20) 291 f8(11) 236f5(19) 204f2(17) 3IO f 6 ( 20) 304 f 3 ( 20) 306 f 7 ( 11) 260 f 6 ( 19) 2 14 f 4 ( 17) 334 f 7 ( 17) 320 f4(20) 325 f 6 ( 1 1) 279 f 7 ( 17) 225 f 5 ( 16)
332f10(17) 325f7(18) 333f6(10) 294f7(14) 232f5(14) 318 f l 3 ( 9 ) 317 f 6 ( 13) 3 I7 f 6 ( I O ) 283 f 9 ( IO) 226 f6(6) 344f10(6) 312f8(7) 305 f5(6) 266 H ( 7 ) - (0)
(a) Data in parentheses indicate the number of rats examined at that time point.
43 Polybrominated Biphenyl Mixture

TABLE 26. BODY WEIGHTS (g) OF MALE MICE DURING LIFETIME OBSERVATION P H A S E O F PBB STUDY
Weeks Post
Exposure Control 0.1 mg/kg 0.3 mg/kg 1.0 mg/kg 3.0 mg/kg 10.0 mg/kg
0 38f1(46)(a) 38f1(49) 39 f l ( 4 7 ) 38 kI(48) 37 fO(45) 35 fO(44) 12 40+1(25) 39 +1(28) 41 f l ( 2 6 ) 39 i l ( 2 7 ) 39 kl(24) 37 fO(23) 24 43 f l ( 2 5 ) 40 f l ( 2 8 ) 42f1(26) 41 f l ( 2 6 ) 41 f l (23 ) 38f1(23) 36 41 f l ( 2 5 ) 41 f l ( 2 8 ) 4211(26) 41 f l ( 2 6 ) 41 f l ( 2 3 ) 38 f l ( 2 2 ) 48 42 f l ( 2 5 ) 41 f l ( 2 6 ) 43 i l ( 2 5 ) 42 f l ( 2 6 ) 42 f l (23 ) 38 i l ( 2 0 ) 60 43 f l ( 2 4 ) 42 ztl(25) 44*1(21) 43 f l ( 2 5 ) 43 *1(23) 39*I(18)
100 35 f l ( 7 ) 33 f2(6) 35 f l(4) 37 *3(5) 36 f2(4) - (0)
Data presented are Mean f S E M (a) Data in parentheses indicate the number of mice examined at that time point.
TABLE 27. BODY WEIGHTS (g) O F FEMALE MICE DURING LIFETIME OBSERVATION PHASE O F PBB STUDY
Weeks Post
Exposure Control 0.1 mg/ kg 0.3 mg/ kg 1 .O mg/ kg 3.0 mg/ kg 10.0 mg/kg
0 27 fO(50) (a) 27 fO(50) 28 fO(47) 28 fO(43) 28 f O ( 10) 30 fO(39) 12 31 f I (19 ) 30 + I ( 19) 30 f O ( 16) 31 f l ( 12) 31 f I ( 1 8 ) 31 f l ( 8 ) 24 32+1(19) 31 f l ( 1 9 ) 31 *1(16) 33 f l ( 1 2 ) 3311(18) 3 2 f 1 ( 8 )
36 34 * I ( 19) 33 * I ( 19) 3 3 f l ( 16) 34 f l ( 12) 36 f 2 ( 18) 34f1(8) 48 36 f l ( 19) 34 *I (19) 35 *I ( I 6) 36 f 2 ( 12) 36 i i ( 18) 36f1(8) 60 41 * I ( 19) 37 fI ( 18) 36 * I ( 15) 39 *2( 12) 40 fI ( I 8) 38 ~ 7 )
100 39 f2 (4 ) 33 i l ( 10) 35 f2 (7 ) 40 *3(6) 35 i 3 ( 6 ) - (0)
Data presented are Mean +SEM (a) Data in parentheses indicate the number of mice examined at that time point.
Polybrominated Biphenyl Mixture 44
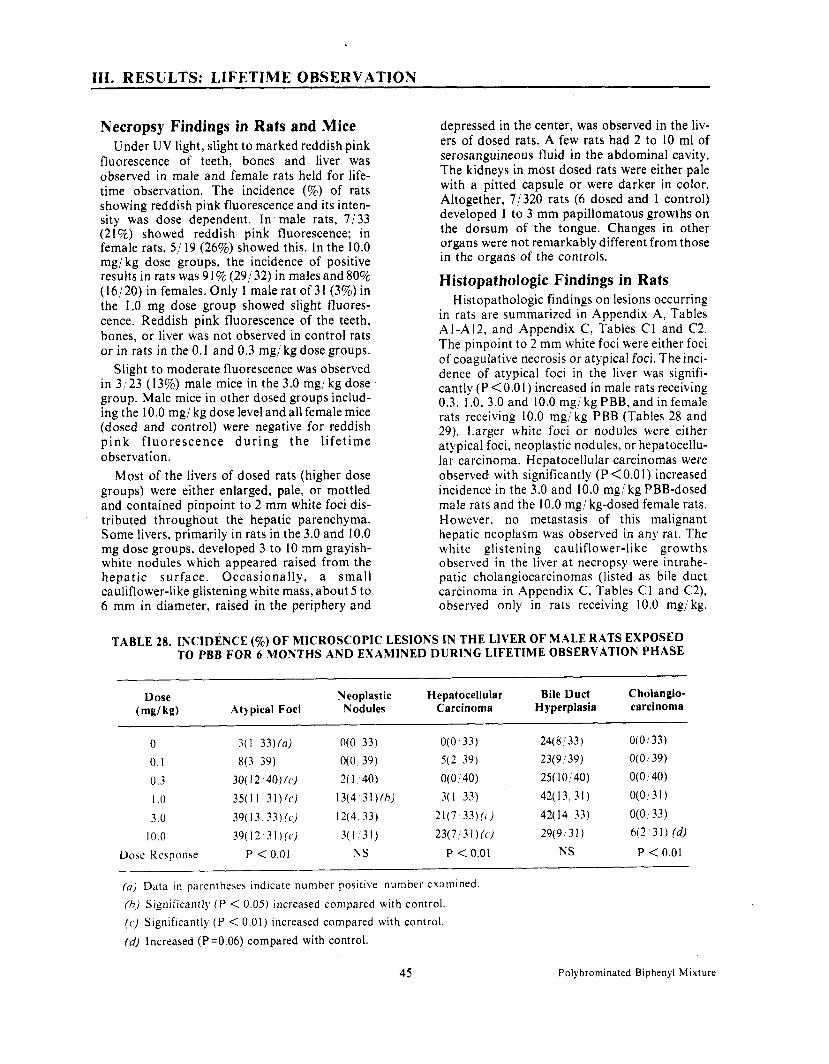
III . RESULTS: LIFETIME OBSERVATION
Necropsy Findings in Rats and Mice Under U V light, slight to marked reddish pink
fluorescence of teeth, bones and liver was observed in male and female rats held for life- time observation. The incidence (%) of rats showing reddish pink fluorescence and its inten- sity was dose dependent. In male rats, 1 /33 (21%) showed reddish pink fluorescence; in female rats, 5 / 19 (26%) showed this. In the 10.0 mg/ kg dose groups, the incidence of positive results in rats was 9 1% (29/ 32) in males and 80% (16/20) in females. Only 1 male rat of 3 1 (3%) in the 1.0 mg dose group showed slight fluores- cence. Reddish pink fluorescence of the teeth, bones, or liver was not observed in control rats or in rats in the 0.1 and 0.3 mg/ kg dose groups.
Slight to moderate fluorescence was observed in 3/23 (13%) male mice in the 3.0 mg/kg dose group. Male mice in other dosed groups includ- ing the 10.0 mg/ kg dose level and all female mice (dosed and control) were negative for reddish p ink f luorescence d u r i n g t h e l ifetime observation.
Most of the livers of dosed rats (higher dose groups) were either enlarged, pale, or mottled and contained pinpoint to 2 mm white foci dis-tributed throughout the hepatic parenchyma. Some livers, primarily in rats in the 3.0 and 10.0 mg dose groups, developed 3 to I O mm grayish- white nodules which appeared raised from the hepatic surface. Occasionally, a small cauliflower-like glistening white mass, about 5 to 6 mm in diameter, raised in the periphery and
depressed in the center, was observed in the liv- ers of dosed rats. A few rats had 2 to 10 ml of serosanguineous fluid in the abdominal cavity. The kidneys in most dosed rats were either pale with a pitted capsule or were darker in color. Altogether, 7/320 rats (6 dosed and 1 control) developed 1 to 3 mm papillomatous growths on the dorsum of the tongue. Changes in other organs were not remarkably different from those in the organs of the controls.
Histopathologic Findings in Rats Histopathologic findings on lesions occurring
in rats are summarized in Appendix A, Tables AI-A12, and Appendix C, Tables Cl and C2. The pinpoint to 2 mm white foci were either foci of coagulative necrosis or atypical foci. Theinci- dence of atypical foci in the liver was signifi- cantly ( P <0.01) increased in male rats receiving 0.3, 1 .O, 3.0 and 10.0mg/ kg PBB, and in female rats receiving 10.0 mg/ kg PBB (Tables 28 and 29). Larger white foci or nodules were either atypical foci, neoplastic nodules, or hepatocellu-lar carcinoma. Hepatocellular carcinomas were observed with significantly (P <O.O 1) increased incidence in the 3.0 and 10.0 mg/ kg PBB-dosed male rats and the 10.0 mg] kg-dosed female rats. However, no metastasis of this malignant hepatic neoplasm was observed in any rat. The white glistening cauliflower-like growthsobserved in the liver at necropsy were intrahe- patic cholangiocarcinomas (listed as bile duct carcinoma in Appendix C, Tables Cl and C2), observed only in rats receiving 10.0 mg/ kg.
TABLE 28. INCIDENCE (%) OF MICROSCOPIC LESIONS I N THE LIVER OF MALE RATS EXPOSED TO PBB FOR 6 MONTHS A N D EXAMINED DURING LIFETIME OBSERVATION PHASE
Dose Neoplastic Hepatocellular Bile Duct Cholangio-(mg/ kg) Atypical Foci Nodules Carcinoma Hyperplasia carcinoma
0 3(1 33)(a) O(0 33) O(0 33) 24(8 33) O(0133) 0.1 8(3 39) O(0 39) 5 ( 2 39) 23(9 39) O(0 39)
0.3 30(12 40)(0 2(1 40) O(0 40) 25( 10140) O(0 I 40)
1 0 35(11 31)(() 13(4 31)(h) 3(1 33) 42(13 31) O(0i 31)
3.0 39(13 M)(() 12(4 33) 21(7 33)(() 42(14 33) O(0 33) I O 0 39(12 31)(() 3(1 31) 23(7 31)(() 29(9 31) 6(2 31) (4
Dosc Re5ponre P < 0.01 NS P <0.01 NS P <0.01
(u) D'ita in parentheses indicate number positive number examined (h) Significantly (P< 0.05) increased compared with control. (L)Significantly ( P < 0.01) increased compared with control. (d) lncreased (P =0.06) compared with control.
45 Polybrominated Biphenyl Mixture

III. RESULTS: LIFETIME OBSERVATION
TABLE29 . INCIDENCE (%) OF MICROSCOPIC LESIONS IN THE LIVER OF FEMALE RATS EXPOSED TO PBB FOR 6 M O N T H S A N D EXAMINED DURING LIFETIME OBSERVATION PHASE
Dose Neoplastic Hepatocellular Bile Duct Cholangio-(me/kg) Atypical Foci Nodules Carcinoma Hyperplasia carcinoma
(a) Data in parentheses indicate number positive/ number examined. (h) Significantly ( P <0.01) increased compared with control.
These tumors were characterized ‘by small to these cholangiocarcinomas were not observed in large acinar formation, with some distended any rat. The term “cholangiocarcinoma” was acini containing mucus. In some instances, the used as a diagnosis for this tumor because of its neoplasms contained large mucous (PAS posi- morphologic appearance. However, the histo- tive) filled spaces and only a few epithelial cells, genesis of this neoplasm may actually be of hepa- probably the remnant of preexisting acini which tocellular rather than bile duct origin. The were ruptured due to distension by excess incidence of myelomonocytic (mononuclear mucous secretion. Occasionally, tissue com- cell) leukemia was found to be significantly posed of bile duct epithelium protruded into the (P<0.05)increased only in male rats at the 0.3 central veins of the liver. However, metastases of mg/kg dose level (Table 30).
TABLE 30. INCIDENCE (%) OF MODERATE OR MARKED CHRONIC PROGRESSIVE NEPHROPATHY (CPN) A N D MYELOMONO- CYTIC LEUKEMIA (ML) IN RATS EXPOSED TO PBB FOR 6 MONTHS A N D EXAMINED DURING LIFETIME OBSERVA- TION PHASE
Male Rat Female Rat Dose (mg/ kg) CPN ML CPN ML
0 39(13/33)(u) 9(3/33) 0(0/20) 25(5/20) 0.1 28(11/39) 13(5/ 39) 5(1/21) 19(4/21) 0.3 45( I 8 / 40) (h) 20(8 / 40) (6) 0(0/21) 19(4/21) I .o 77(23/30) (c) 13(4/31) O ( O / l l ) 9(1/11) 3.0 82(27 / 33) ((9 6(2 / 33) O(O/ 19) 11(2/ 19)
10.0 84(27/32)(c) 6(2/32) 5(1/20) 20(4/20) Dose Response P <0.01 NS NS NS
(a) Data in parentheses indicate number positivelnumber examined. (b) Significantly( P < 0.05)increased compared with controls. (c) Significantly(P < 0.01) increased compared with controls.
Polybrominated Biphenyl Mixture 46

III. RESULTS: LIFETIME OBSERVATION
Four (2 males and 2 females) out of 51 rats (8%) given the highest dose (10.0 mg/ kg) of PBB developed foci of pancreas-like tissue in the liver. These were present primarily near or around the central veins of the liver. The epithelium forming the acini of pancreas-like tissue was tall colum- nar and the nuclei were located near the' basal area of the cell. The apical portion of these cells contained red granules similar to the zymogen granules of pancreatic exocrine glands.
A significantly ( P <0.01) higher incidence of chronic progressive nephropathy (Barthold, 1979) was observed in male rats at the 1.0, 3.0, and 10.0 mg/kg dose levels (Table 30). Both kidneys were moderately to markedly affected and were characterized by the presence of hya- line proteinaceous casts of varying staining intensity, sclerosis and thickening of glomerular tufts and Bowman's capsule, and interstitial fibrosis, along with mononuclear leukocyte infiltration.
Gastric ulcers and hyperplastic gastropathy of the glandular portion were observed with signifi- cantly (P<0.05) increased incidence in male rats receiving 3.0 and 10.0 mg/ kg PBB (Table 31). The hyperplastic lesions were focal and diag- nosed only on microscopic examination. These changes were characterized by hyperplasia of mucosal epithelium, metaplasia from parietal to mucous cells, hyperchromasia, and increased mitosis. These lesions were usually delineated from the rest of the gastric mucosa. There was microcystic dilatation of crypts and downward growth on extension. Frequently, the gastric pits were considerably elongated and occasionally formed small cysts. Usually, there was infiltra- tion of lymphocytes in the vicinity of the lesion.
The papillomatous growths on the dorsum of the tongue of 7 rats (6 dosed and 1 control) were squamous cell papillomas.
TABLE 31. INCIDENCE (%) O F FOCAL HYPERPLASTIC GASTROPATHY A N D GASTRIC ULCERS IN RATS EXPOSED TO PBB FOR 6 MONTHS A N D EXAMINED DURING LIFETIME OBSERVATION PHASE
Male Rat Female Rat
Dose Hyperplastic Gastric Hyperplastic Gastric Gastropathy Ulcers Gastropathy Ulcers(mg/kg)
0 O(O/33)(a) 24(8/33) 5( 1/ 20) 1O(2 / 20) 0.I 3(1/38) 13(5/38) 5(1/21) 14(3 / 21) 0.3 5(2/40) 20(8140) 5(1/21) 29(6/21)
I .o 10(3/30) 30(9/ 30) fh) O(O/ 1 1 ) 9(1/11) 3.0 18(6/33)(b) 55(18/33)(c) 5(1119) 16(3/ 19)
10.0 I 4( 4 29) (h) 4I ( I 21 29)fc) 15(3 / 20) 15(3 / 20) Dose Response P=0.03 P <0.01 N S NS
(a) Data in parentheses indicate number positive1 number examined. (h) Significantly (P <0.05) increased compared with controls. (c) Significantly ( P <0.01) increased compared with controls.
47 Polybrominated Biphenyl Mixture

III. RESULTS: LIFETIME OBSERVATION
Necropsy Findings in Mice The abdomen of most of the affected mice was
markedly distended due to marked enlargement of the liver and the presence of serosanguineous fluid in the peritoneal cavity. Multifocal white foci and nodules 5 to 15 mm in diameter were observed in the liver. Some of the nodular livers were multicystic and contained serosanguineous fluid. The incidence of grossly observed hepatic nodules was higher in the highest-dose (10.0mg/kg) mice of each sex compared with controls.
Histopathologic Findings in Mice Histopathologic findings on lesions occurring
in mice are summarized in Appendix B, Tables BI-Bl2, and Appendix C, Tables C3 and C4. Most of the hepatic nodules observed grossly
were hepatocellular carcinomas and occasion- ally hepatoblastoma. The incidence of hepato-cellular carcinoma was significantly (P <0.01) increased in both male and female mice at the 10.0 mg/kg dose compared with the control (Table 32). Hepatocellular carcinomas were tra- becular or solid or both types in a single lesion. There was a significantly (P <0.05) increased incidence of metastases of hepatocellular carci- noma into the lungs of female mice receiving 10.0 mg/ kg PBB (Table 32). The incidence of hepatocellular adenoma was not significantly increased in mice administered PBB compared with controls. The incidence of heuatoblastoma in control male mice was 12% (3725), and 9% (2/22) in the dosed male mice (highest dose). Hepatoblastoma was not observed either in con- trol or dosed female mice.
TABLE 32. INCIDENCE (%) O F MICROSCOPIC LESIONS IN THE LIVER OF MALE A N D FEMALE MICE EXPOSED TO PBB FOR 6 MONTHS A N D EXAM- INED DURING LIFETIME OBSERVATION PHASE
Dose Hepatocellular Hepatocellular Metastasis Sex
~~
MALE
FEMALE
- ~
(mg/kg)
0 0.1 0.3 1.o 3.0
10.0 Dose Response
0 0.1
0.3 I .o 3.0
10.0 Dose Response
Adenoma Carcinoma to Lung
48( 12/25) 16(4/25) 30(8 / 27) o(oi 27) 33(8/24) 8(2i 24) 48( 12/25) 25) 65( 15/23) I3(3/ 23) 95(2 1 i 22) (b) l9(4/ 2 I )
P <0.01 NS
O(0i 13) O(0119)
13(2 15) 18(2/ 11) 18(3/ 17)
88(7/ 8) fb) P < 0.01
(a) Data in parentheses indicate number positive! number examined.
(b) Significantly ( P < 0.01) increased compared with controls. (c) Significantly ( P < 0.05) increased compared with controls.
Polybrominated Biphenyl Mixture 48

III. RESULTS: LIFETIME OBSERVATION
The incidence of malignant lymphoma was malignant lymphoma and (2) increased inci- significantly (P <0.05) decreased in female mice dence of hyperplasia or adenoma of the follicu- receiving 0.1, 0.3, 1 .O, or 3.0 mg/ kg PBB (Table lar cells of the thyroid, may not be considered 33). Hyperplasia and adenoma of follicular cells major findings because of the smaller sample size of the thyroid tended to be increased in dosed and low incidence. mice. These findings, ( 1 ) decreased incidence of
TABLE 33. INCIDENCE O F MALIGNANT LYMPHOMA IN MICE EXPOSED TO PBB FOR 6 MONTHS A N D EXAMINED DURING LIFETIME OBSERVATION PHASE
Dose (mg/kg) Male Mice Female Mice
0 16(4/25) (~) 77( I O / 13)
0.1 22(6/27) 3 W 1 19) fb) 0.3 29(7 / 24) 40(6/ 15) fb)
1 .O 24( 6 / 25) 45(5 / 1 1) fb) 3.O I3(3/23) 35(6,i 17)(b)
10.0 9(2/ 22) 25(2/8) Dose Response NS NS
(a) Data in parentheses indicate number positive/ number examined. (b) Significantly (P < 0.05) decreased compared with control.
49 Polybrominated Biphenyl Mixture

Polybrominated Biphenyl Mixture 50

IV. DISCUSSION AND CONCLUSIONS
51 Polybrominated Biphenyl Mixture

IV. DISCUSSION AND CONCLUSIONS
Conflicting reports have been publishedregarding the relative toxicity of the flame retardant Firemaster FF-I. This PBB was con- sidered to be relatively nontoxic because the LD,, of the single oral dose for rats was quoted to be 21.5 g/kg (Anon., 1971; 1976; Hill Top Research, 1970). However, Gupta and Moore (1979) demonstrated that the PBB was more toxic if given in small repeated doses, and the L.D,, in female rats was lower than that in males. The LD,, for female rats was estimated to be 65 mg/ kg/ day (total 1.43 g/kg) and for male rats, 149 mg/ kg/day(total3.28 g/kg) when given in multiple doses and observed for 90 days. The lower 90-day LD,, in this experiment likely resulted from multiple dosing and increased duration of observation. The LD5o of haloge- nated aromatic hydrocarbons or those chemicals which may have a relatively long biological half- life with delayed toxicity is more accurately determined after multiple dosing and an extended period of observation (Gupta and Moore, 1979).
Firemaster FF-I, a flame retardant composed of polybrominated biphenyls, was responsible for widespread environmental contamination and animal losses in Michigan starting in 1973. This study was undertaken to characterize the long-term toxic and carcinogenic potential of this PBB mixture in rats and mice of each sex. Fischer 344/ N rats and B6C3F1 mice were given 125 oral doses of PBB over a6-month period -0, 0.1,0.3, 1.0,3.0, or 10.0 mg/ kg body weight/ day ( 5 days/ week).
The effects of PBB were studied in rats and mice of each sex. There was no significant differ- ence in feed consumption between PBB-dosed rats and mice compared with controls, yet there was a persistent decrease in body weight gain in dosed male and female rats and dosed male mice. This suggests that PBB may cause poor feed utilization. Similar weight-gain effects unrelated to feed intake have been observed in monkeys exposed to PBB (Allen et al., 1978), and in other species of animals with structurally similar halogenated aromatic hydrocarbons such as the PCB (Allen and Abrahamson, 1973), the diben- zodioxins (McConnell et al., 1978), and dioxin- contaminated technical grade pentachlorophe- nol (McConnell et al., 1980).
Interestingly, there was an increase in body weight of female mice administered PBB at 10.0 mg/kg/day, 125 total doses during a 6-month period. The explanation for this disparity is not clear. A more plausible explanation is that the body weight gain may be related to fluid accu-
mulation in different tissues of the body. Extra- cellular fluid (subcutaneous edema, ascites, and hydropericardium) is often found in mice dying from acute intoxication from these classes of compounds (McConnell and Moore, 1979), and in fact mice showing this lesion do actually gain weight just prior to death.
The size and weight of the thymus were decreased in PBB-dosed (0.3 mg/ kg or higher) rats but not in dosed mice a t the end of the 6-month dosing. Administration of PBB to rats and mice was reported to cause suppression of both humoral and particularly cell-mediated immunity (Luster et al., 1978). In a 6-month administration of PBB to rats and mice, this chemical was not considered to be a potent immunosuppressant in rodents, since high doses were required to elicit immune effects (Luster et al., 1980).
The results of the comparative study clearly demonstrate that the pathologic changes in rats administered PBB are quantitatively much more pronounced than the pathologic changes in ani- mals exposed to HBB (Gupta et al., 1981). Since the dose levels of HBB reflected a proportional amount of this pure isomer in the equivalent dose of PRB, i.e., 16.8 mg of 2,2’,4,4’,5,5’-hexa- bromobiphenyl represented the proportion of this isomer in 30.0 mg of PBB, the pathobiologic changes of PBB are not primarily due to this isomer. However, Firemaster BP-6 is a mixture of 13 different bromobiphenyls and also con- tains 200 ppm of brominated naphthalenes (Hass et al., 1978). While these naphthalenes (mainly hexa- and penta-isomers) are not potent inducers of mixed function oxidases (Goldstein et al., 1979), as are the more toxic chlorinated naphthalenes, they are highly toxic in vivo (McConnell, 1980). N o evidence was found for the presence of bromodibenzo-p-dioxins or bro- modibenzofurans in Firemaster BP-6 (Hass et al., 1978). The most logical explanation for the toxicity of PBB is that it probably represents an additive effect of the more toxic biphenyl iso- mers supplemented to some extent by the bromonaph thalenes.
Chronic administration of hexachloroben-zene, PCBs, or 2,3,7,8-tetrachlorodibenzo-p-dioxin (TCDD) to rats produces hepaticporphyria characterized by delayed onset and massive accumulation of uroporphyrins in the liver (Ockner and Schmid, 1961; Goldstein etal., 1973; 1974; 1976). In the present study, PBBs also produced hepatic porphyria at doses as low as 0.3 mg/ kg1 day, with the rat being more sensi-tive than the mouse. In each species, the female
Polybrominated Biphenyl Mixture 52

IV. DISCUSSION AND CONCLUSIONS
was much more susceptible than the male. This sex difference has been reported previously for the porphyrogenic action of hexachlorobenzene in rats (San Martin de Viale et al., 1970). How- ever, this is the first report of a similar sex differ- ence in mice. The porphyrogenic effects of PBBs in the rat may be of particular importance since an equivalent disease has been produced in humans through accidental consumption of hexachlorobenzene in Turkey in 1956 (Ockner and Schmid, 1961). Hepatic porphyria has not been found in people exposed to PBBs in Michigan; however, an alteration in the urinary porphyrin pattern which may reflect preliminary changes has been reported (Strik et al., 1979).
Under UV light, the incidence (9%) of rats showing reddish pink fluorescence, an indica- tion of excess porphyrin accumulation, and its intensity declined slightly in 1 .O and 3.0 mg/ kg dose groups, but remained the same in 10.0mg/ kg dose groups (male and female rats) during the lifetime observation when compared with the 6-month results. However, results in all dosed female mice were negative, and only a few (3/ 23; 13% in the 3.0 mg/ kg dose group) male mice showed slight to moderate reddish pink fluores- cence during the lifetime observation. This further indicates that the rats are more sensitive than mice to the porphyrogenic effect of PBB and remain positive throughout the lifetime, even after discontinuation of the dosing.
The pigment (hemosiderin) accumulation in the liver and spleen probably represents by- products of a breakdown of erythrocytes, which in turn are phagocytized by the reticuloendothe- lial cells in these organs. Breakdown of RBCs would also explain the mild anemia. A slight decrease in mean corpuscular volume (M CV) and mean corpuscular hemoglobin (MCH) dem- onstrated that the anemia was microcytic and hypochromic. There was no indication of an increase in the number of circulating nucleated red blood cells. These findings suggest a direct depression of red blood cell precursors. Anemia and bone marrow depression have been observed in all species of animals exposed to toxic levels of dioxin and furans, especially in long-term studies (Huff et al., 1980).
PBB decreased the serum thyroxine (T,) con-centrations. The absence of any influence on uptake indicates that this effect was not due to alterations in binding to plasma protein. The binding of thyroid hormone to serum proteins was not affected by PBB, as indicated by the T, uptakes. Mild microscopic changes in thyroidglands were observed, but only at higher doses.
Morphologic changes in thyroid glands were also observed in male rats exposed to PBB (Kasza et al., 1978), but serum levels of thyroid hormones were not measured. Norris et al. (1975) found evidence of thyroid hyperplasia in rats fed octabromobiphenyl for 30 days at 8.0 mg/ kg/ day *
T C D D and PCB have also been found to decrease serum thyroxine levels and produce goiters in rats (Bastomsky, 1974, 1977a, 1977b). The goiters were more evident in animals on a low iodine diet. The effect of TCDDand PCB on serum thyroxine concentrations appears t o be secondary t o an increase in the hepatic glucuron- idation and bilary excretion of thyroxine. Inter- estingly, there has been a recent report of primary hypothyroidism in 4 men ( 11.4% of those examined) employed in a plant which pro-duced the PBBs, decabromobiphenyl and deca- bromobiphenyl oxide (Bahn et al., 1980). From these data, it would seem advisable to examine serum thyroxine levels in people exposed to high levels of PBB.
Ulceration and focal hyperplastic gastropathy characterized by microcystic dilatation of crypts, downward growth of mucosa, and meta- plasia of parietal cells to mucous cells were observed in PBB-dosed rats. Similar but more extensive hyperplastic gastrointestinal lesions were reported in monkeys exposed to PBB (Lambrecht et al., 1978; Allen et al., 1978), PCB (McConnell et al., 1979; Allen and Norback, 1973) or exposed to diesel motor lubricating oil (Lushbaugh, 1947; 1949); and in rats exposed to motor lubricating oil (Lushbaugh and Hackett, 1948). Although the pathogenesis of these gas- trointestinal tract lesions is not known, the lesions may be due to the long latent periodafter the initial insult.
Several studies have shown that the liver is the target organ for PBB in most species and that these lesions persist even after withdrawal of the treatment. However, some PBB isomers have an extremely long biological half-life and signifi- cant levels of PBB are present in the liver and fat long after exposure ceases (Lee et al., 1975; Matthews et al., 1977; Tuey and Matthews, 1980). Neoplastic nodules were reported in the livers of rats 10 months after a single oral dose of PBB (Kimbrough et al., 1977; 1978). Simitar atypical nodules in the liver were also observed in rats as early as 6 months after the rats were given multiple doses of PBB (Gupta and Moore, 1979).
53 Polybrominated Biphenyl Mixture

IV. DISCUSSION AND CONCLUSIONS -
Increases in the absolute and relative liver weights of rats and mice and microscopic altera- tions were the characteristics of hepatotoxicity. The primary target organ was the liver. The toxic changes were characterized by hepatomegaly due to cytomegaly, increase in endoplasmic reticulum, and excess lipid accumulation. The increase in GGTP and SGTP in mice was also probably related t o hepatotoxicity.
At the end of the 6-month continuous admin- istration 3.0% of dosed rats, no control rats, I I .O% of dosed mice, and 5.0% of control mice developed atypical hepatocellular foci. Since the incidence of atypical foci in the liver was so low at the 6-month observation, a definite conclu- sion for the potential hepatocarcinogenicity of PBB could not be drawn at that time.
However, rats exposed for 6 months and held for their lifetime showed a significantly (P <0.05) increased incidence of hepatocellular carcinoma and cholangiocarcinoma. A similar
increased incidence of hepatocellular carcinoma has recently been reported in female Sherman rats exposed to PBB (Kimbrough et al., 1981).Hepatocellular 'carcinoma in exposed mice was also observed when the animals were held for lifetime observation. Hepatic neoplasms were observed only in those groups of animals in which PBB was given in sufficient dose to induce marked liver toxicity. Those dosed animals hav- ing less or minimal hepatotoxicity did not develop a significantly increased incidence of hepatic neoplasia when compared with controls.
Conclusions: Under the conditions of these studies, polybrominated biphenyl mixture (Fire- master FF-I) was carcinogenic .for Fischer 3441 N rats and B6C3F1 mice of each sex, induc- ing neoplastic nodules, hepatocellular carcino- mas, and cholangiocarcinomas in rats, and hepatocellular carcinomas in mice. Other toxici- ties included porphyrogenic effects and hepato- toxicity.
Polybrominated Biphenyl Mixture 54

V. REFERENCES
55 Polybrominated Biphenyl Mixture
V. REFERENCES
Abritti, G., and De Matteis, F. (1971). Decreased levels of cytochrome P-450 and catalase in hepatic porphyria caused by substituted acetamides and barbiturates. Chem.- Biol. Interact., 4:281-286. Aftosmis, J.G., Culik, R., Lee, K.P., Sherman, H., and Waritz, R.S. (1972). Toxicology of brominated biphenyls. I . Oral toxicity and embryotoxicity. Toxicol. Appl. Pharmacol., 22:316 (Abstr.). Allen, J.R., and Abrahamson, L.J. (1973).Morphological and biochemical changes in the liver of rats fed polychlorinated biphenyls. Arch. Environ. Cont. Toxicol., 1:265-280. Allen, J.R., Lambrecht, L.K., and Barsotti, D.A. (1978). Effects of polybrominated biphenyls in nonhuman primates. J . Amer. Vet. Med. Assoc., 173:1485-1489. Allen, J.R., and Norback, D.H. (1973). Poly- chlorinated biphenyl- and triphenyl-induced gastric mucosal hyperplasia in primates.Science, I79:498-499. Anderson, E.V. (March 22, 1976). Government rules: problems, opportunity. Chem. Eng. News, 54: 12. Anonymous (1971). Firemaster BP-6. A new flame retardant additive from Michigan Chemical Corp. 2nd revision. Anonymous (1976). Michigan State University Agricultural Experiment Stat ion, MSU Research on PBBs. Mich. Sci. Action. Anonymous (June 22. 1977). Pesticide and Toxic Chemical News, pp. 9-1 1 .
Armitage, P. (1971). Statistical Methods in Medical Research. New York, John Wiley & Sons, Inc. pp. 362-365.
Aulerich, R.J., and Rinpcr. R.K. (1979). Toxic effects of dietary polybrominated biphenyls on mink. Arch. Environ. Contam. Toxicol., 8:487- 498.
Bahn, A.K., Mills, J.L., Snyder, P.J., Gann, P.H., Houten, L., Bialik, 0..Hollmann, L., and Utiger, R.D. (1980). Hypothyroidism in workers exposed to polybrominated biphenyls. New England J . Med., 302:31-33.
Barr, M. (1980). Pediatric aspects of the Michigan polybrominated biphenyl contamina- tion. Environ. Res., 21:255-274.
Barthold, S.W. (1979). Chronic progressivenephropathy in aging rats. Toxicol. Pathol., 7 :1-6.
Bastomsky, C.H. (1974). Effect of a polychlori-nated biphenyl mixture (Aroclor 1254) and DDT on biliary thyroxine excretion in rats. Endocrinology, 95: 1150-1155. Bastomsky, C.H. (1977a). Enhanced thyroxine metabolism and high uptake goiters in rats after a single dose of 2,3,7,8-tetrachlorodibenzo-p-dioxin. Endocrinology, 101:292-296. Bastomsky, C.H. (1977b). Goiters in rats fed polychlorinated biphenyls. Can. J . Phys. Pharmacol., 55:288-292. Beaudoin, A.R. (1977). Teratogenicity of polybrominated biphenyls in rats. Environ. Res., 14231-86. Brilliant, L.B., Wilcox, K., Amburg, G.V., Eyster, J., Isbister, J., Bloomer, A.W., Humphrey, H., and Price, H. (1978). Breast- milk monitoring to measure Michigan’s contamination with polybrominated biphenyls. Lancet, No. 809 I , Vol. II: 643-646. Brown, G.G., and Nixon, R. (1979). Exposure to polybrominated biphenyls. Some effects on personality and cognitive functioning. J . Amer. Med. Assoc., 242523-527, Carter, L.J. (1976). Michigan’s PBB incident: Chemical mix-up leads to disaster. Science, 192:240-243. Cecil, H.C., and Bitman, J . (1978). Toxicity of polybrominated biphenyl and its effects on reproduction of White Leghorn hens. Poultry Sci., 57:1027-1036. Chang, T.S., and Zindel, H.C. (1975). Toxic effects of polybrominated biphenyl on young poultry. Poultry Sci., 54: 1743-1744. Cook, H., Helland, D.R.. Vanderweele, B.N., and Dejong, R.T. (1978). Histotoxic effects of polybrominated biphenyls in Michigan dairy cattle. Environ. Res.. 15232-89. Corbett, T.H., Beaudoin. A.R., Cornell, R.G., Anver, M.R., Schumacher, R., Endres, J . , and S z w a b o w s k a , M . (1975) . Tox ic i ty of polybrominated biphenyls (Firemaster BP-6) in rodents. Environ. Res., 10:390-396.
Cox, D.R. (1972). Regression models and life tables. J . R. Stat. SOC., B34:187-220.
Detering, C.N., Prewitt. L.R., Cook, R.M., and Fries, G.F. (1975). Placental transfer of polybrominated biphenyl by Holstein cows. J . Dairy Sci., 58:764 (Abstr.).
Dunckel, A.E. (1975). An updating on the polybrominated biphenj 1 disaster in Michigan. J . Amer. Vet. Med. Assoc., 167:838-841.
Polybrominated Biphenyl Mixture 56
V. REFERENCES
Fries, G.F. (1978). Distribution and kinetics of polybrominated biphenyls and selected chlorinated hydrocarbons in farm animals. J. Amer. Vet. Med. Assoc., 173:1479-1484. Fries, G.F., and Marrow, G.S. (1975). Excretion of polybrominated biphenyls into the milk of cows. J . Dairy. Sci., 58:947-951. Gart, J., Chu, K., and Tarone, R. (1979). Statistical issues in interpretation of chronic bioassay tests for carcinogenicity. J . Natl. Cancer Inst., 62:957-974. Goldstein, J.A., Hickman, P., Bergman, H., and Vos, J.G. (1973). Hepatic porphyria induced by 2,3,7,8-t e t rac hl orod iben zo-p-d i oxin in the mouse. Res. Commun. Chem. Pathol. Phar- macol., 6:9 19-928. Goldstein, J.A., Hickman, P., and Jue, D.L. (1974). Experimental hepatic porphyria induced by polychlorinated biphenyls. Toxicol. Appl. Pharmacol., 27:437-448. Goldstein, J.A., Hickman, P., and Bergman, H. (1976). Induction of hepatic porphyria and drug- metabolizing enzymes by 2,3,7$-tetrachlorodi- benzo-p-dioxin (TCDD). Fed. Proc., 35:708 (Abstr.). Goldstein, J.A., Linko, P.C., Levy, L.A., McKinney, J.A., Gupta, B.N., and Moore, J.A. (1979). A comparison of a commercial poly- brominated biphenyl mixture, 2,4,5,2’,4’,5’-hexabromobiphenyl and 2,3,6,7-tetrabromo-naphthalene as inducers of liver microsomal drug-metabolizing enzymes. Biochem. Phar-macol., 28:2947-2956. Gupta, B.N., and Moore, J.A. (1979). Toxico- logic assessments of a commercial polybromi- nated biphenyl mixture in the rat. Amer. J . Vet. Res., 40, 1458-1468. Gupta, B.N., McConnell, E.E., Harris, M.W., and Moore, J.A. (1981). Polybrominated biphe- nyl toxicosis in the rat and mouse. Toxicol. Appl. Pharmacol., 57:99-118. Gutenmann, W.H., and Lisk, D.J. (1975). Tissue storage and excretion in milk of polybrominated biphenyls in ruminants. J . Agric. Food Chem., 23: 1005-1007.
Harris, S.J., Cecil, H.C., and Bitman, J . (1978). Embryotoxic effects of polybrominated biphe- nyls (PBB) in rats. Environ. Health Perspect., 23:295-300. Hass, R.J., McConnell, E.E., and Harvan, D.J. (1978). Chemical and toxicologic evaluation of Firemaster BP-6. Agricul. Food Chem., 26~94-99.
Hill Top Research (1970). Acute toxicity and irritation studies on Firemaster BP-6 hexabro- mobiphenyl for Michigan Chemical Corpora- tion. Hill Top Research Inc.
Hollander, M., and Wolfe, D.A. (1973). Non- parametric Statistical Methods. Wiley, New York. Huff, J.E., Moore, J.A., Saracci, R., and Tomatis, L. (1980). Long-term hazards of polychlorinated dibenzodioxins and polychlori- nated dibenzofurans. Environ. Health Perspect., 36:22 1-240.
Humphrey, H.E.B., and Hayner, N.S. (1975). Polybrominated biphenyls: An agricultural inci- dent and its consequences. I I . An epidemiologi- cal investigation of human exposure, p. 57-63. In: D.D. Hemphill (Ed.), Trace Substances in Environmental Health, IX.Univ. of Missouri Press, Columbia. IARC, International Agency for Research on Cancer (1978). IARC Monographs on the Eval- uation of the Carcinogenic Risk of Chemicals to Humans. Polychlorinated Biphenyls and Poly- brominated Biphenyls. Vol. 18, Lyon, France. Humphrey, H.E.B., Wilcox, K.R., Isbister, J.L., and Bloomer, A.W. (1979). Health status of per- sons exposed to PBB. Toxicol. Appl. Phar- macol., 48: 175 (Abstr.). Isbister, J.L. (1977). PBBs in human health. Clin. Med., 84:22-24. Jackson, T.F., and Halbert, F.L. (1974). A toxic syndrome associated with the feeding of poly- brominated biphenyl contaminated protein con- centrate to dairy cattle. J . Amer. Vet. Med. ASSOC., 165:437-439. Jacobs, L.W., Chow, S.F. , and Tiedje, J .M. (1978). Field concentrations and persistence of polybrominated biphenyls in soils and solubility of PBB in natural waters. Environ. Health Per- spect., 23: 1-8. Jonckheere, A.R. (1954). A distribution-free K-sample test against ordered alternatives. Bio- metrika, 41: 133-145. Kaplan, E.L., and Meier, P. (1958). Nonpara- metric estimation of incomplete observations. J . Amer. Stat. Assoc., 53:457-481. Kasza, L., Collins, W.T., Capen, C.C., Garthoff, L.H., and Friedman, L. (1978). Comparative toxicity of polychlorinated biphenyl and poly- brominated biphenyl in the rat thyroid gland: Light and electron microscopic alterations after subacute dietary exposure. J . Environ. Path. Toxicol.. 1:587-599.
57 Polybrominated Biphenyl Mixture

V. REFERENCES
Kasza, L., Weinberger, M.A., Hinton, D.E., Trump, B.F., Patel, C . , Friedman, L., and Garthoff, L. H. ( I 978). Comparative toxicity of polychlorinated biphenyl and polybrominated biphenyl in the rat liver: Light and electron microscopic alterations and subacute dietary exposure. J. Environ. Pathol. Toxicol., 11241-257. Kay, K. (1977). Polybrominated biphenyls ( P B B ) environmental contaminat ion i n Michigan. 1973-1976. Environ. Res.. 13:74-93. Kimbrough, R.D., Burse, V.W., Liddle, J.A., and Fries, G.F. (1977). Toxicity of polybromi- nated biphenyl. Lancet, No. 8038(2):602-603. Kimbrough, R.D., Burse, V.W., and Liddle, J.A. (1978). Persistent liver lesions in rats aftera single oral dose of polybrominated biphenyls (Firemaster FF-I) and concomitant PBB tissue levels. Environ. Health Perspect., 23:265-273. Kimbrough. R.D., Groce, D.F., Korver, M.P., and Burse, V.W. (1981). lnduction of liver tumors in female Sherman strain rats by polybrominated biphenyls. J . Natl. Cancer Inst., 66:535-542. Kimbrough, R.D., Korver, M.P., Burse, V.W., and Groce, D.F. (1980). The effect of different diets or mineral oil on liver pathology and poly- brominated biphenyl concentration in tissues. Toxicol. Appl. Pharmacol., 52:442453. Lambrecht, L.K., Barsetti, D.A.,and Allen, J.R. (1978). Responses of nonhuman primates to a polybrominated biphenyl mixture. Environ. Health Perspect., 23:139-145. Lee, K.P., Herbert, R.R., Sherman, H., Aftosmis, J.G., and Waritz, R.S. (1975). Bro- mine tissue residue and hepatotoxic effects of octabromobiphenyl in rats. Toxicol. Appl.Pharmacol., 34:115-127. Lillie, R.J.,Cecil, H.C., Bitman, J., Fries, G.F., and Verrett, J . (1975). Toxicity of certain polychlorinated and polybrominated biphenyls on reproductive efficiency of caged chickens. Poultry Sci., 54:1550-1555. Luna, L.C. (1968). Manual of Histologic Stain- ing Methods of the Armed Forces Institute of Pathology. 3rd Edition, McGraw-Hill Co., New York, pp. 183-184. Lushbaugh, C.C. (1947). Experimental hyper- plastic gastritis and gastric polyposis in mon- keys. J . Natl. Cancer Inst., 7:313-320. Lushbaugh, C.C. (1949). Infiltrating adenoma- tous lesions of the stomach, cecum and rectum of monkeys similar to early human carcinoma and carcinoma in situ. Cancer Res., 9:385-394.
Lushbaugh, C.C., and Hackett, A. (1948). An infiltrating adenomatous lesion of the colon of rats ingesting motor lubricating oil (SGF No. 1 oil). J . Natl. Cancer Inst., 9:159-172. Luster, M.1., Boorman, G.A., Harris, M.W., and Moore, J.A. (1980). Laboratory studies on polybrominated biphenyl-induced immune alterations following low-level chronic or pre/ postnatal exposure. Int. J. Immunopharmac., 2:69-80. Luster, M.I., Faith, R.E., and Moore, J.A. (1978). Effects of polybrominated biphenyls (PBB) on immune response in rodents. Environ. Health Perspect., 23:227-232. Mantel, N., and Haenszel, W. (1959). Statistical aspect of the analysis of data from retrospective studies of disease. J. Natl. Cancer Inst., 22:719-748. Matthews, H.B., Kato, S . , Morales, N.M., and Tuey, D.B. (1977). Distribution and excretion of 2,4,5,2’,4’,5’-hexabromobiphenyl,the major component of Firemaster BP-6. J . Toxicol. Environ. Health, 3599-605. McConnell, E.E. (1980). Acute and chronic tox- icity, carcinogenesis, reproduction, teratogene- sis, and mutagenesis in animals. In: Halogenated Biphenyls, Terphenyls, Naphthalenes, Dibenzo- dioxins, and Related Products. R. D. Kimbrough, Ed.. EIsevier,’North Holland Bio- medical Press, New York, 109-150. McConnell, E.E., Harris, M.W., and Moore, J.A. (1980). Studies on the use ofactivated char- coal and cholestyramine for reducing the body burden of polybrominated biphenyls. Drug. Chem. Toxicol., 3:277-292. McConnell, E.E., Hass, J.R., Altman, N., and Moore, J.A. (1979). A spontaneous outbreak of polychlorinated biphenyl (PCB) toxicity in Rhe- sus monkeys (Macaca mulatta): Toxicopathol-ogy. Lab. Anim. Sci., 29:666-673. McConnell, E.E., and Moore, J.A. (1979). Toxi- copathology characteristics of the halogenated aromatics. Ann. NY Acad. Sci., 320:138-150. McConnell, E.E., Moore, J.A., and Dalgard, D.W. ( I 978). Toxicity of 2,3,7,8-tetrachlorodi- benzo-p-dioxin in rhesus monkeys (Maraca muluttu) following a single oral dose. Toxicol. Appl. Pharmacol., 43: 175-187. McConnell, E.E., Moore, J.A., Gupta, B.N., Rakes, A.H., Luster, M.I., Goldstein, J.A., Haseman, J.K., and Parker, C.E. (1980). The chronic toxicity of technical and analytical pen- tachlorophenol in cattle. Toxicol. Appl. Phar- , macol.. 52:468-490.
Polybrominated Biphenyl Mixture 58

V. REFERENCES
Meester, W.D., and McCoy, D.J. (1977). Human toxicology of polybrominated biphe- nyls. Clin. Toxicol., 10:474. Mercer, H.D., Teske, R.H., Condon, R.J., Furr, A., Meerdink, G . , Buck, W., and Fries, G. (1976). Herd health status of animals exposed to polybrominated biphenyls (PBB). J . Toxicol. Environ. Health, 2: 3 35-349.
Moore, R.W., Dannan, G.A., and Aust, S.D. (1978). Induction of drug metabolizing enzymes in polybrominated biphenyls-fed lactating rats and their pups. Environ. Health Perspect., 23:159-165. Mumma, C.E., and Wallace, D.D. (June 1975). Survey of industrial processing data. Task I I -Pollution potential of polybrominated biphe- nyls. EPA-560/3-75-004.
Norris, J.M., Kociba, R.J., Schwetz, B.A., Rose, J.Q., Humiston, C.G., Jewett, G.L., Gehring, P.J., and Mailhes, J.B. (1975). Toxi- cology of octabromobiphenyl and decabromo- diphenyl oxide. Environ. Health Perspect., 1 I : 153-161,
Ockner, R.K., and Schmid, R. (1961). Acquired porphyria in man and rat due to hexachloroben- zene intoxication. Nature, 189:499.
Peto, R., Pike, M., Day, N., Gray, R., Lee, P., Parish, S . , Peto, J., Richard, S. , and Wahrendorf, J . (1980). Guidelines for simple, sensitive, significant tests for carcinogenic effects in long-term animal experiments. lnter- national Agency for Research Against Cancer. Monographs on the long-term and short-term screening assays for carcinogens: A critical appraisal. Geneva: World Health Organization. Supplement 2:31 I .
Reynolds, E.S. (1963). The use of lead citrate at high pH as an electron-opaque stain in electron microscopy. J . Cell. Biol., 17:208-212.
Rickert, D.E., Dent, J.G., Cagen, S.Z., McCormack, K . M . , Melrose, P., and Gibson, J.E. (1978). Distribution of polybrominated biphenyls after dietary exposure in pregnant and lactating rats and their offspring. Environ. Health Perspect., 23:63-66.
Ringer, R.K., and Polin, D. (1975). Effects of polybrominated biphenyl on laying hens. Poul- try Sci., 54:1810.
Ringer, R . K . , and Polin, D. (1977). The biologi- cal effects of polybrominated biphenyls in avian species. Fed. Proc., 36: 1894-1898. Ruzo, L.O., and Zabik, M.J. (1975). Polyhalo- genated biphenyls: Photolysis of hexabromo- and hexachlorobiphenyls in methanol solution. Bull. Environ. Contam. Toxicol., 13: 18 1-1 82. San Martin de Viale, l.C., Nacht, S. , and Grinstein, M. (1970). Experimental porphyria induced in rats by hexachlorobenzene: A study of the prophyrins excreted by urine. Clin. Chim. Acta., 28: 13-23. Selikoff, I.J., and Anderson, H.A. (1979). A Survey of the General Population of Michigan for Health Effects of Polybrominated Biphenyl Exposure. Report to the Michigan Department of Public Health, September 30, 1979. Environ- mental Sciences Laboratory, Mount Sinai School of Medicine, New York, N.Y. Sleight, S.D., and Sanger, V.L. (1976). Patho- logic features of polybrominated biphenyl toxi- cosis in the rat and guinea pig. J , Amer. Vet. Med. Assoc., 169:1231-1235. Strik, J.J.T.W.A., Doss, M., Schraa, G., Robertson, L .W. , Tiepermann, R . , and Harmisen, E.G.M. (1979). Coproporphyrinuria and chronic hepatic porphyria type A found in farm families from Michigan (USA). Tilson, H.A., and Cabe, P.A. (1979). Studies on the neurobehavioral effects of polybrominated biphenyls in rats. Ann. N.Y. Acad. Sci., 320:325- 336. Tilson, H.A., Cabe, P.A., and Mitchell, C.L. (1978). Behavioral and neurological toxicity of polybrominated biphenyls in rats and mice. Environ. Health Perspect., 23:257-263. Tuey, D.B., and Matthews, H.B. (1980). Distri- bution and excretion of 2,2',4,4',5.5'-hexabromobiphenyl in rats and man: Pharmacokinetic model predictions. Toxicol. Appl. Pharmacol., 53:420-43 1 . Werner, P.R., and Sleight, S.D. (1981). Toxico- sis in sows and their pigs caused by feeding rations containing polybrominated biphenyls to sows during pregnancy and lactation. Am. J . Vet. Res., 42:183-188. Wolff, M ,S.9Anderson, H.A., Rosenman, K.D. and Selikoff, I.J. (1979). Equilibrium of poly-brominated biphenyl (PBB) residues in serum and fat of Michigan residents. Bull. Environ. Contam. Toxicol., 21:775-781.
59 Polybrominated Biphenyl Mixture

Polybroniinated Biphenkl Mixture 60

APPENDIX A INDIVIDUAL ANIMAL PATHOLOGY IN RATS
ADMINISTERED POLYBROMINATED BIPHENYL MIXTURE IN CORN OIL BY GAVAGE (LIFETIME OBSERVATION)
61 Polybrominated Biphenyl Mixture

TABLE A l .
INDIVIDUAL ANIMAL PATHOLOGY I N MALE RATS ADMINISTERED 10.0 mg POLYBROMINATED BIPHENYL MIXTURE/kg BODY WEIGHT IN CORN OIL BY GAVAGE
(LIF ETlME 0BSE RVATION) 2 3 0 4 1 1 0 1 2 2 0 2 1 1 0 2 1 0 0 2
Animal Wumber 1 9 4 6 9 8 4 7 0 . 4 3 1 6 4 9 4 2 0 1 0 5 4 8 1 0 1 7 5 1 3 7 6 9 6 4 2 2 7 8 0
lleeks on Study 0 4
0 4
0 7
0 7
0 7
0 0
0 a
0 0
0 0
0 a
0 0
0 0
0 a
0 9
0 9
0 9
0 9
0 9
0 9
0 9
2 4 3 4 7 1 . 2 4 4 5 6 J 7 0 1 2 2 4 4 4 Skin & Subcutaneous Tissue + + t t t + + + t o + t t + t t t + + +
Fibroma Henatopoi e t i c Sys tem
LungL i v e r
Yyelomonocytlc Leukemia t
+ t
+
+ t
t
+ t
t
+ +
+
+ +
+
t +
t
+ +
+
+ +
+
t +
t
+ +
+
+ +
t
+ t
X +
+ +
+
+ +
+
+ +
+
+ t
+
+ +
X +
+ t
t
+ +
t
t +
Atyp ica l Foci Neopl a s t ic Nodule Hepatocel lu lar Carcinoma Pancreas-like Tissue
x
X x x
X
X
x x
X
X
X
X
X
B i l e Duct Hyperplasia B i l e Duct Adenoma
X X x x X X
B i l e Duct Carcinoma X Pancreas + + o + t + + t + o + + + t t + + t + +
Exocrine Ce l l Adenoma Exocrine Ce l l Carcinoma
Stomach t + o t t + + t t o + t + t t + + + t + U1 ce r X X x x x x Hyperpl as tic Gas tropa thy
TongueLarge In tes t l ne
Adenomatous Polyp Kidney
Chronic Progressive Nephropathy* Trans i t iona l Ce l l Carcinoma
+ +
+
+ o
+
o o
+
t t
+
t +
3 +
+ +
3 +
t +
2 t
+ +
2 t
+ +
2 +
+ o
2 +
t +
2 +
+ +
1 t
x + +
3 t
x t +
3 t
t +
3 +
t +
2 +
X t +
3 +
+ +
3 +
+ t
2 t
X + t
3
X +
P i t u i t a r y Gland Adenoma
t + o + t t + + + + t t + t + t t t t +
Thyroid Gland F o l l i c u l a r Ce l l Adenoma
+ + o + t t + t t o t t + t t + + + t t
F o l l i c u l a r Ce l l Carcinoma C-cel l Hyperplasia C-cel l Adenoma X
Parathyrold Gland Hyperpl as ia Adenoma
+ + O t + t X
t t t ~ + + +
X
+ + t X
t t t X
t
Adrenal Gland + + t t + t + t t t + t + t + + + + t t Testes + + o + + t + + t o + t + t + t t t + t
Leydig Ce l l Tumor Ear + + +
x +
x +
x +
x +
x +
x + +
x +
x t
x +
x t
x t
x +
x +
x +
x t
x t
I n f l a m t i o n , Tympanlc Bul lab Bra ln + + o + + + + t + + t + + t + t t +
X t t
t Tissue examined 0 Tissue no t examined x Lesions present * Chronic progressive nephropathy (CPN)
1 = S l i g h t CPN 2 = Moderate CPti 3 = Marked CPN
Polyhrominatcd Biphenyl Mixturc 62

- -
TABLE A l . MALE RATS: ANIMAL PATHOLOGY (CONTINUED) 10.0 mg
Animal Hnnber i 4 6 1 4 2 7 2 1 1 6 4 2 2 7 9 8 8 6 4 0 5 0 3 T o t a l
Weeks on Study 0 0 0 0 0 0 0 0 1 1 1 1 Tissues 9 9 9 9 9 9 9 9 0 0 0 0 or 4 4 5 6 7 7 7 9 1 1 1 3 Lesions
Skin 6 Subcutaneous Tissue + + + + + + o + + + + + 30 F ibrama X 1
Hematopoietic System + + + + + + + + + + + + 32 Myelononocytic Leukemi a 2
Lung + + + + + + o + + + + + 31 L i v e r + + + + + + o + + + + + 31
Atypica l FOCI x x X X x x 12 Neoplastic Module X 1 Hepatocel lular Carcinomd X 7 Pancreas-1ike Tissue X 2 B i l e Duct Hyperplasia X x x 9 B l l e Duct Adenoma X 1 B i l e Duct Carcinoma X 2
Pancreas + + + + + + o + + + + + 29 Exocrine C e l l Adenoma X X 2 Exocrine C e l l Carcinoma X 1
Stomach + + + + + + o + + + + + 29 U1cer X X X x x x 12 Hyperplastic Gastropathy 4
+ + + + + + I I + + + + + 30 L%wIntes tine + + + + + + + + + + + + 29
Menoamtous Polyp 1 Kidney + + t t + + t + + + + + 32
Chronlc Progressive NepHropathy* 3 2 3 3 2 3 3 2 3 2 3 3 28 Transi t lonal Ce l l Carcifloma X 1
P i t u i t a r y Gland + + + + + + + + + + + + 31 Adenoma X X 2
Thyrold Gland + + + + t + o + + + + + 29 F o l l i c u l a r C e l l A d e m X 1 F o l l i c u l a r C e l l Carcinmb X 1 C - C e l l Hyperplasia X 1 C - C e l l Adenoma
Parathyroid Gland + + + + + + ( I + + + + +24 Hyperplasia X X X 6 Adenoma 1
Adrenal G1 and + + + + + + o + + + + + 31 Testes + + + + + + + + + + + + 30
Leydig Ce l l Tumor x x x x x x x x x x x x 28 Ear + + + + + + + + + + + + 32
I n f l a m t i o n , Tympanlc Bullae 1 Brain + + + t + + t >+ + + + t 31
+ Tissue examined 0 Tissue no t examined x Lesions present
Chronic progressive nephropathy (CPN) 1 - S l i g h t CPN
r t e CPN 5 me!CPH
63 Polybrominated Biphenyl Mixture

TABLE A2.
INDIVIDUAL ANIMAL PATHOLOGY I N MALE RATS ADMINISTERED 3.0 mg POLYBROMINATED BIPHENYL MIXTURE/kg BODY WEIGHT IN CORN OIL BY GAVAGE
(LIFETlME OBSERVATION) 3 2 2 1 2 0 3 0 2 0 0 2 0 0 1 2 1 2 2 0
Animal Number 7 9 6 8 7 5 3 1 2 9 6 5 6 9 2 ' 6 0 5 8 0 0 3 5 6 4 9 7 9 1 3 3 8 1 6 8 1 7 2 9 5
Weeks on Study 0 0 0 0 0 0 0 0 0 0 0 0 0 0 0 0 0 0 0 1 6 7 8 8 8 8 9 9 9 9 9 9 9 9 9 9 9 9 9 0 2 7 3 5 5 7 2 3 3 5 5 6 6 8 8 8 8 8 9 0
Sk in & Subcutaneous Tissue t t t t t t t t t t t t t t t t t t t t Fibroma Matnnary Gland Fibroadenoma P r e p u t i a l G1 and Adenoma X X Basal C e l l Tumor X
Mesothelioma, Abdominal Cav i ty X Hema topo ie t ic System t t t t t t t t t t t t t t t t t t t t
Myelomonocyti c Leukemia Hemangiosarcoma (Spleen) Plasma C e l l Tumor X
Lung t t t t t t t t t t t t t t t t t t t t A l veol ogeni c Adenoma X
L i v e r t t t t t t t t t t t t t t t t t t t t Atyp ica l FOCI X X X x x x x x X Neoplast ic Nodule X Hepatocel l u l a r Carcinoma X X x x x B i l e Duct Hyperplasia X X x x x x x x x x x
Pancreas t t t t t t t t t t t t t t t t t t t t Exocr ine Ce l l Adenoma X Exocr ine C e l l Carcinoma X I s l e t Ce l l Adenoma X
Stomach t t t t t t t t t t t t t t t t t t t t Ulcer X x x x X x x x x x Hyperp las t ic Gas t ropa thy x x x x
Tongue t t t t t t t t + t t + t t t t t t t + Kidney t t t t t t t t t t t t t t t t t t t t
Chronic Progressive Nephropathy* 2 2 1 3 3 1 3 3 3 3 3 3 3 2 3 3 3 3 2 Adenoma X Liposarcoma X
P i t u i t a r y G1 and t t t t t t t t t t t t t t t t t t t t Adenoma X X X Carcinoma X
Thyroid Gland t t + + t t + t + t + + t + + t t + t + F o l l i c u l a r Ce l l Adenoma X X X F o l l i c u l a r Ce l l Carcinoma X C-cel l Adenoma C-cel l Carcinoma
Parathyroid G1 and t t + t + + t t t + + + t t t ++ t t t Hyperplasia X X x x
Adrenal Gland t + t t t + t t t t + t t t t t + t + t Cor t i ca l Hyperplasia X Pheochromocytoma X
Testes t o t t t + t t + + t o t t + ++ t t + Leydig Ce l l Tumor x x x x x x x x x x x x x x x
Ear t t t t t t + + + t t + t t t +t t t t I n f l a m t i o n , Tympanic Bul lae
Bra in t t t t t t t t t t t t t t t + + + t t
t Tissue examined 0 Tissue no t examined x Lesions present * Chronic progressive nephropathy (CPN)
1 = S l i g h t CPN 2 = Moderate CPN 3 = Marked CPN
Polybrominated Biphcnyl Mixture 64

TABLE A2. MALE RATS: ANIMAL PATHOLOGY (CONTINUED) 3.0 mg -
2 1 2 1 2 2 1 3 1 0 4 0 2 Animal Number 7 5 8 a 3 5 9 9 2 4 1 8 9
- 6 0 8 8 4 4 4 7 9 5 1 1 6 Total Weeks on Study 1
0 1 0
1 0
1 0
1 0
1 0
1 0
1 0
1 0
1 0
1 1
1 1
1 1
Tissues o r
0 2 2 3 3 4 4 5 8 8 2 2 2 Lesions Skin E Subcutaneous Tissue t t + t t + t t t t t t + 33
Fibroma X 1 M a m r y G1 and F i broadenoma Preputial Gland Adenoma Basal Ce l l Tumor
X 1 2 1
Mesothelioma, Abdominal Cavi ty Hematopofetfc System
Myel omnocy t i c Leukemia Hemangiosarcoma (Spleen) Plasma C e l l Tumor
LungA l veologenic Adenoma
L i v e r
t
t
t
t
t
+
t
t
t
t
+
t
t
+
t
t
t
t
t X X
t
t
t
t
t
t
t
t
t
t
t
t
t
t
t
t
t
+ X
+
t
1 33
2 1 1
33 1
33 A typ i ca l Foci Neoplastic Nodule Hepatocell u l a r Carcinoma B i l e Duct Hyperplasia
Pancreas
X
t
X
t x +
x + t
X +
x
t
x
t
x
+
X X
t
X
+
X
t t
13 4 7
14 33
Exocrine C e l l Adenoma X X 3 Exocrine C e l l Carcinoma 1 I s l e t Ce l l Adenoma 1
Stomach t t t t + + t t t t t + t 33 U1 ce r X x x x x x x x 18 Hyperp last ic Gastropathy
TongueK1 dney
Chronic Progressive Nephropathy* Adenoma
t t 2
t t 3
t t 3
X t t 3
t t. 3
+ t 1
t t 3
X t t 3
t t 2
t t 1
t t 2
t t 3
t t 1
6 33 33 32
1 Liposarcoma
P t t u t t a r y Gland Adenoma
t t t t t X
t t X
t t t t t t 1
33 5
C a r d noma 1 Th r o i d Gland t t t t + + + t t + t t + 33
f o l l i c u l a r Ce l l Adenoma X 4 F o l l i c u l a r Ce l l Carcinoma X 2 C-cel l Adenoma X 1 C-cel l Carcinoma X 1
Parathyrotd Gland Hyperpl as l a
Adrenal G1 and
t
+
t
t
t
t
t
t
t
t
t x +
t x +
+
+
+
t
+
t
+
t
+ X +
t
t
33 7
33 Cor t i ca l Hyperplasia Pheochromocytoma
Testes + t t t t t t +
X
+ +
X x t
x t
X
t
4 3
31 Leydig Ce l l Tumor
Ear x +
x t
x t
x t
x t
x t
x t
x t
x +
x +
x +
x +
x +
28 33
I n f l a m t i o n , Bra in
Tympanic Bul lae t t
X t t t t t + + t t t
X t
2 33
t Tissue examined 0 Tissue no t examined x Lesions present * Chronic progressive nephropathy (CPN)
1 - S l i g h t CPN 2 = Moderate CPN 3 = Marked CPN
65 Polybrominated Biphenyl Mixture
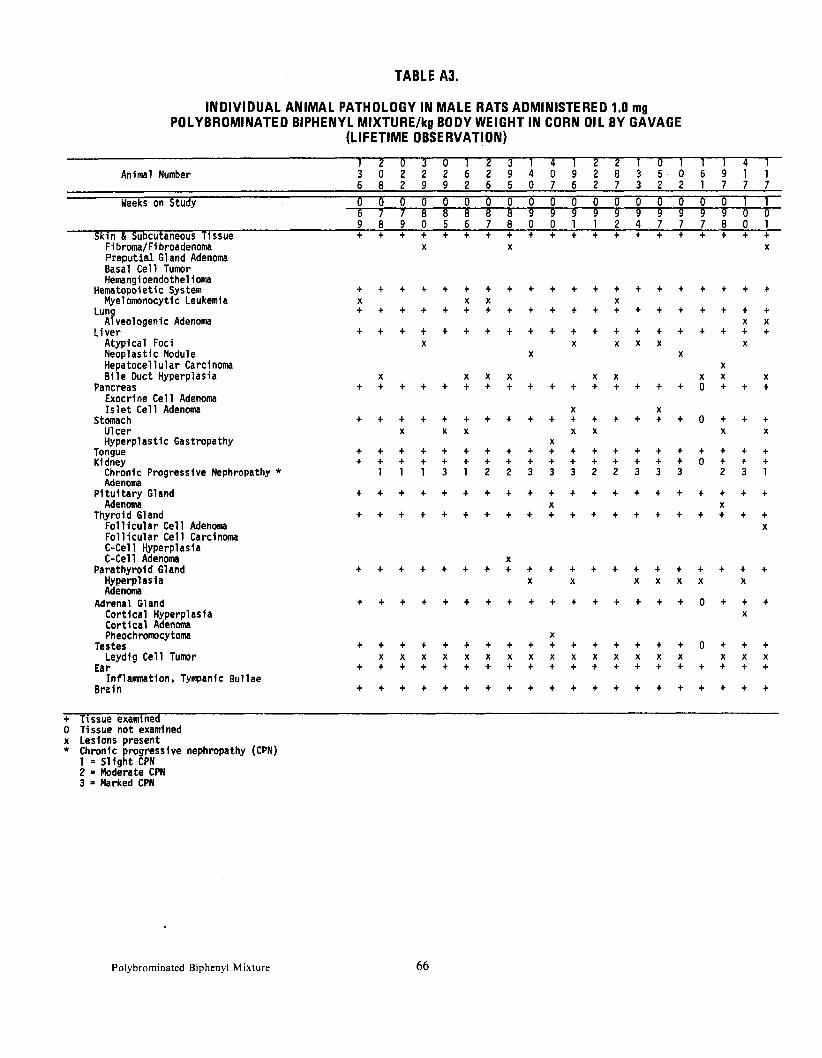
TABLE A3.
INDIVIDUAL ANIMAL PATHOLOGY IN MALE RATS ADMINISTERED 1.0 mgPOLYBROMINATED BIPHENYL MIXTURE/kg BODY WEIGHT IN CORN OIL BY GAVAGE
(LIFETIME OBSERVATION)
Animal Number 3 0 2 2 2 6 2 9 4 0 9 2 8 3 5 0 6 9 1 1 6 8 2 9 9 2 6 5 0 7 6 2 7 3 2 2 1 7 7 7
~
Weeks on Study 0 0 0 0 0 0 0 0 0 0 0 0 0 0 0 0 0 0 1 11
9 8 9 0 5 6 7 8 0 0 1 1 2 4 7 7 7 8 0 1 Skin L Subcutaneous Tissue . . . . . . . . . . . . . . . . . . . .
F i broma/Fi broadenoma X X X P r e p u t i a l G1 and Adenoma Basal C e l l Tumor Hemangioendothelioma
Hem topo i e t i c Sys tern . . . . . . . . . . . . . . . . . . . . Myel omonocytic Leukemia X x x X
Lung . . . . . . . . . . . . . . . . . . . . A l veologenic Adenoma x x
L i v e r . . . . . . . . . . . . . . . . . . . . Atyp ica l Foci X X x x x X Neoplastic Nodule X X Hepatocel lu lar Carclnoma X B i l e Duct Hyperplasia X x x x x x x x X
Pancreas . . . . . . . . . . . . . . . . . . . . . Exocrine C e l l Adenoma I s l e t C e l l Adenoma X X
Stomach . . . . . . . . . . . . . . . . . . . . .
U1 ce r X x x x x X X Hyperp last ic Gastropathy X
Tongue . . . . . . . . . . . . . . . . . . . . Kidney . . . . . . . . . . . . . . . . . . . . .
Chronic Progressive Nephropathy * 1 1 1 3 1 2 2 3 3 3 2 2 3 3 3 2 3 1 Adenoma
P i t u i t a r y Gland . . . . . . . . . . . . . . . . . . . . Adenoma X X
Thyro id Gland . . . . . . . . . . . . . . . . . . . . F o l l i c u l a r Ce l l Adenoma X F o l l i c u l a r C e l l Carcinoma C-cel l HyperplasiaC-cel l Adenoma X
Parathyro id Gland . . . . . . . . . . . . . . . . . . . . Hyperplasia X X x x x x X Adenoma
Adrenal Gland + + + + + + + + + + + + + + + + o + + + C o r t i c a l Hyperpl as ia X C o r t i c a l Adencina Pheochromocytoma X
Testes . . . . . . . . . . . . . . . . . . . . Leydlg C e l l Tumor x x x x x x x x x x x x x x x x x x
Ear . . . . . . . . . . . . . . . . . . . . In f lamnat ion. Tympanic Bul lae
B r c i n . . . . . . . . . . . . . . . . . . . .
+ Tissue examined 0 Tissue no t examined x Lesions present * Chronic progress ive nephropathy (CPN)
1 = S l i g h t CPN 2 = Moderate CPN 3 = Harked CPN
Polybrominated Biphenyl Mixture 66

TABLE A3. MALE RATS: ANIMAL PATHOLOGY (CONTINUED) 1.0 mg
Animal Number 11
07
08
17
10
46
42
03
09
18
17
1 3 2 6 0 5 5 8 7 3 2 Total Weeks on Study
0 1
0 1
0 1
0 1
0 1
1 1
1 1
1 1
1 1
1 1
1 1
or Tissue
Skin & Subcutaneous Tissue 2+ 3+ 6+ 7+ 7+ 0+ 1+ 2+ 2+ 7+ 8+ Lesions
31 F i broma/Fi broadenoma Preputial Gland Adenoma Basal Cell Tumor
X X
X X
X
6 1 1
Hemangioendothel ioma Hematopoietic Sys tern
Myel omonocyti c Leukemia Lung
Alveologenic Adenoma Liver
+ + +
+ + +
+ + +
+ + +
+ + +
+ + +
+ + +
+ + +
+ + +
+ + +
X+ + +
131 4 31 231
Atypical Foci Neoplastic Nodule Hepatocellular Carcinoma Bile Duct Hyperplasia
Pancreas
x
X+
x
+ X+
X
+ +
X
+ X+ +
x X+
x
+
X
+
1 1 4 1
1330
Exocrine Cell Adenoma X X 2 Islet Cell Adenoma
Stomach + + + + + + + + + + + 2 30
U1 cer X X 9 Hyperplastic Gastropathy
TongueKidney
Chronic Progressive NephroDathy * Adenoma
Pituitary Gland Adenoma
Thyroid Gland Foll icul ar Cell Adenoma Follicular Cell Carcinoma C-cell Hyperplasia C-cell Adenoma
Parathyroid Gland HyperplasiaAdenoma
Adrenal Gland
x+ + 3
+ X+
X
+ X
+
x+ + 2
+ +
+ X+
+ + 2
+ X+ X
+
+
+ + 2 X+ +
+ X
+
+ + 3
+ X+
+
+
+ + 3
+ +
X
+ x
+
+ + 2
+ +
+ x
+
+ + 2
+ +
+ x
+
+ + 1
+ +
+
+
+ + 2
+ X+
+ X
+
+ + 2
+ + X
+
+
3 31 30 29 1 31 6
31 2 1 2 1
31 13 1
30 Cortical Hyperplasia Cortical Adenoma X
x x 3 1
PheochromocytomaTestes + + + + +
X + + + t t +
2 30
Leydig Cell Tumor Ear
BrainInflamtion, Tympanic Bullae
+ +
x+ +
x+ +
x+ +
x+ +
x+ + x
x+ + x
x+ +
x+ +
x+ +
x+ +
28 31
31 2
+ Tissue examined 0 Tissue not examined x Lesions present * Chronic progressive nephropathy (CPN)
1 = Slight CPN 2 = Moderate CPN 3 = Marked CPN
67 Polybrominated Biphenyl Mixture

TABLE A4.
INDIVIDUAL ANIMAL PATHOLOGY I N MALE RATS ADMINISTERED 0.3 mg POLYBROMINATED BIPHENYL MIXTURE/kg BODY WEIGHT IN CORN OIL BY GAVAGE
(LIFETIME OBSERVATION) 2 0 1 2 2 1 2 0 1 3 0 1 1 1 0 2 0 ~ 4 1
Animal Number 5 3 3 0 1 1 1 0 2 1 0 6 1 7 5 4 7 0 7 6 1 1 8 0 1 6 0 7 1 4 8 6 8 3 8 7 7 1 5 5
\leeks on Study 0 0 0 0 0 0 0 0 0 0 0 0 1 1 1 1 1 1 1 1
8 5 7 0 3 4 4 4 5 7 9 9 4 5 5 5 6 6 6 6 Sk in & Subcutaneous Tissue . . . . . . . . . . . . . . . . . . . .
F i broma/Fi broadenoma Fibrosarcoma X
X X
X
P r e p u t i a l Gland Adenoma Odontoma X
X
Basal C e l l Tumor X Mesothelioma, Abdominal Cav i ty Hematopoietic System . . . . . . . . . . . . . . . . . . . .
Hemangioperlcytoma, Mal Ignant Myelomonocyt i c Leukemia
Lung . X . . . x . x . . . . . X
. X . . . . . . X . . . Metas ta t i c Tumors X X
L i v e r . . . . . . . . . . . . . . . . . . . . A typ i ca l Foci Neoplast ic Nodule B i l e Duct Hyperplasia Me tas ta t i c Tumors
X
X
X
X
X
X
X X
X
X
x x
X
x
x x
Pancreas . . . . . . . . . . . . . . . . . . . . Exocr ine Ce l l Adenoma I s l e t Ce l l Adenoma X
Stomach . . . . . . . . . . . . . . . . . . . . U1 c e r x x X X Hyperp las t ic Gas t ropathy
Tongue . . . X . . . . . . . . . X . . . . . . . . Squamous Ce l l Papil loma
Small I n t e s t i n e . . . . . . . . . . . . . . . . . X . . . Adenocarcinoma X
Large I n t e s t i n e Adenomatous Polyp
Kidney
.
. . .
.
. . .
.
. . .
.
. . .
.
. . .
.
. . .
.
. . .
.
. . .
.
. . .
.
. . .
Chronic Progressive Nephropathy* Adenoma
2 1 1 1 1 1 3 1 1 2 1 1 2 3 3 1 1 1 2 1
P i t u i t a r y Gland Adenoma
. . . . . . . . X
. . . . . . . . . . . x
. x
Thyro id Gland . . . . . . . . . . . . . . . . . . . . F o l l i c u l a r C e l l Adenoma X X C-ce l l Hyperplasia C-ce l l Adenoma X C-ce l l Carcinoma
Para thyro id Gland . . . . . . . . . . . . . . . . . . . . Hyperplasia
Adrenal Gland . . . . . . X . . . . . . . . X . . . . X . . Co r t i ca l Hyperplasia Pheochromocytoma
Testes . . . . . . . . . . . . . . . . X
. . . X
. Leydig Ce l l Tumor
Ear x . x . x . x . x . x . x . . X . . . x . x . x . x . x . x . x . x . x .
Inf lamnat ion,B ra in
Tympanic Bu l l ae . . . . . . . . . . . . . . . . . . . . X
+ Tissue examined 0 Tissue no t examined x Lesions Dresent * Chronic progressive nephropathy (CPN)
1 = S l i g h t CPN 2 = Moderate CPN 3 = Marked CPN
Polybrominated Biphenyl Mixture 68

TABLE A4. MALE RATS: ANIMAL PATHOLOGY (CONTINUED) 0.3 mg
1 4 2 1 0 3 2 3 3 3 1 2 4 2 4 1 0 2 4 1 Animal Number 2 6 0 0 5 1 0 9 5 5 2 8 3 2 0 3 6 3 6 5
3 9 7 9 6 8 4 6 7 1 5 6 6 0 1 0 2 3 4 4 Total Weeks on Study
0 1
0 1
D 1
O 1
0 1
1 1
1 1
1 1
1 1
1 1
1 1
1 1
1 1
1 1
1 1
1 1
1 1
1 1
1 1
1 1
o r Tissue
7 7 8 8 9 0 1 1 2 2 2 2 3 3 3 3 3 5 6 6 Lesions 7 n & Subcutaneous Tissue . . . . . . . . . . . . . . . . . . . . 40
F i broma/Fi broadenoma Fibrosarcoma
X X X x x 7 2
P repu t ia l Gland Adenoma Odontoma
1 1
Basal Ce l l Tumor 1 Mesothelioma, Abdominal Cavity Hematopoietic Sys tem
Hemangiopericytoma, MalignantMyel omonocytic Leukemia
LungMetastat ic Tumors
. X .
.
.
.
.
.
.
. x .
. x .
X .
.
.
.
.
.
.
.
.
.
.
.
.
.
.
.
.
.
.
.
.
.
.
.
.
.
.
.
1 40
1 8
40 2
L i ve r Atyp ica l Foci Neoplastic Nodule B i l e Duct Hyperplasia Metastat ic Tumors
. . X
. .
X
. . .
X
. X
. . . . . X
. . . X
X
. . x
. x
. 40 12
1 10 2
Pancreas . . . . . . . . . . . . . . . . . . . . 40 Exocrine Ce l l Adenoma X X 2 I s l e t Ce l l Adenoma 1
Stomach . . . . . . . . . . . . . . . . . . . . 40 U1 cer Hyperplastic Gas tropathy
TongueSquamous Ce l l Papilloma
Small I n t e s t i n e Adenocarcinoma
Large I n t e s t i n e Adenomatous Polyp
KidneyChronic Progressive Nephropathy* Adenoma
X
.
.
.
. 1
.
.
.
. 3
.
.
.
. 3
.
.
.
. 1 X
.
.
.
. 1
.
.
.
. 2
X
.
.
.
. 1
.
.
.
. 2
.
.
.
. 2
.
.
.
. 1
.
.
.
. 1
X
.
.
.
. 2
.
.
.
. 3
.
.
.
. X
1
.
.
.
. 2
.
.
.
. 2
.
.
.
. 2
X
.
.
.
. 1
.
.
.
. 1
.
.
.
. 2
8 2
40 1
40 1
40 1
40 40
1 P i t u i t a r y Gland
Adenoma Thyroid Gland
F o l l i c u l a r Ce l l Adenoma
. X .
.
. . .
.
. . .
.
. . .
.
. . .
.
. .
X .
.
. . .
.
. . .
.
. .
x .
X
. x
. . .
X
.
. 40
7 40 4
C-cell C-cel l C-cel l
HyperplasiaAdenoma Carcinoma X
X X x x
X 2 4 1
Parathyroid Gland Hyperplasia
Adrenal Gland
.
. . .
. x .
. x .
. .
. .
. .
. X .
. .
. .
. .
. .
. X
. . .
. x
. .
x .
. x
. .
x .
. .
. X
. 40 12 39
Cor t i ca l Hyperplasia Pheochromocytoma
Testes .
x
.
x
. . . . . X . . .
x .
x . . .
X X
. . . . . X
.
4 6 39
Leydig C e l l Tumor Ear
x . x . x . x . x . x . x . x . x . x . x . x . x . x . x . x . x . x . x . x . 37 40
Inflammation, Tympanlc B u l l ae Bra in . . . . X . . X . . X . . . X . . . . X . . . . .
6 40
+ Tissue examined 0 Tissue no t examined x Lesions present * Chronic progressive nephropathy (CPN)
1 = S l i g h t CPN 2 = Moderate CPN 3 = Marked CPN
69 Polybronlinated Biphenyl Mixture

TABLE A5.
INDIVIDUAL ANIMAL PATHOLOGY I N MALE RATS ADMINISTERED 0.1 mg POLYBROMINATED BIPHENYL MIXTURE/kg BODY WEIGHT I N CORN OIL BY GAVAGE
(LIF ETlME OBSERVATION) 0 1 0 1 0 2 0 0 2 3 1 2 2 1 3 1 1 0 1 4
Animal Number 3 0 a 5 6 7 3 4 9 . 0 4 5 5 1 o 2 7 7 3 7 2 8 3 3 8 5 3 9 5 3 7 3 9 5 5 7 4 0 1 0
Weeks on Study 0 5
0 7
0 B
0 8
0 8
0 9
0 9
1 0
1 0
1 0
1 0
1 0
1 0
1 0
1 0
1 0
1 0
1 0
1 0
1 0
4 7 1 7 9 4 9 0 1 2 2 2 3 5 5 7 7 7 8 0 Skin 6 Subcutaneous Tlssue o + + t + + + + + + t + + + + + t + t t
F i broma/Fi broadenoma Fibrosarcoma X
X X x x x X
P repu t ia l Gland Adenoma Prepu t ia l Gland Carcinoma Myxoma
Mesothelioma, A M a n i n a l CavityHema topo le t i c System
Myel omonocytic Leukemia Lung
Metas ta t i c Tumors
+
+
+
t
X +
t
t
t X
t
t
+
+
+
+
+
+
t
+ X
+
t
t
t
t
+ X
+
t
t
t
+
t
+
t
+
+
+
+
t
+
+
+
L i v e r + t t t + + t + + + + + t t + + + t + + Atyp ica l Foci Hepatocell u l a r Carcinoma B i l e Duct Hyperplasia
Pancreas o
X
x t
x t t +
x x
+ x x
+ x + t
X
+ +
X
X + + t t + t + + +
Exocrine Ce l l Adenoma I s l e t Ce l l Adenoma
Stomach o + + + t + + + + + + + + + t + t + + t U1 ce r X X X Hyperplast ic Gastropathy
TongueKidney
Chronic Progressive Nephropathy* Adenoma
t +
t t
t +
t +
t +
t + 1
t + 1
t t 2
t + 1
t + 1
t + 2
t + 2
t + 3
t t 3
t t 1
+ + 1
X t t 3
+ t 1
t t 1
t + 1
P i t u i t a r y Gland Adenoma
o + + t t t t t X
t + X
+ t x
t x
t + t + t t t
Carcinoma X Thyroid Gland
F o l l I c u l a r Ce l l Adenoma o + + + + + + + t t + + t t + t + t t +
C-cel l C-cel l
HyperplasiaCarcinoma
X
Parathyroid Gland HyperplasiaAdenoma
o t t t t t t + + t X
+ + + X
+ + t t X
+ t +
Adrenal Gland o t + t + t t t + t t + t t t t + t + + Cor t ica l Hyperpl asla Pheochromocytoma
Testes o + t t + t t o t t X
+
X
+ t + X
t t t t + + Leydig Ce l l Tumor
Ear o x +
x t
x t
x t
x t
x t t
x t
x t
x t
x +
x +
x +
x +
x t
x +
x t
x t
x t
I n f 1 a m tion, Bra 1 n
Tympanic Bu l l ae o t t t + + t t t + t t + + t t
x + x
t + +
t Tissue examined 0 Tissue no t examined x Lesions present * Chronic progressive nephropathy (Cm)
1 = S l i g h t CPN 2 = Moderate CPN 3 Marked CPN
Polybrominated Biphenyl Mixture 70

TABLE A5. MALE RATS: ANIMAL PATHOLOGY (CONTINUED) 0.1 mg -
4 4 2 1 2 0 3 2 4 2 0 2 1 0 3 1 2 1 1 Animal Number 6 5 0 5 6 9 5 6 5 3 8 6 7 9 1 4 7 5 6
8 4 9 6 8 9 4 9 9 1 9 6 1 1 2 1 0 8 8 Total Weeks on Study 1 1 1 1 1 1 1 1 1 1 1 1 1 1 1 1 1 1 1 Tissue
0 0 1 1 1 1 1 1 1 1 1 1 1 2 2 2 2 2 2 o r 8 8 0 0 1 2 2 2 3 5 7 8 8 2 2 3 3 3 3 Lesions
Skin & Subcutaneous Tissue + + + + t + t + t t + t t t t + t t t 38 F i broma/Fi broadenoma x x x x x x X X 14 Fibrosarcoma X 2 P repu t ia l Gland Adenoma X 1 P repu t ia l Gland Carcinoma X 1 Myxoma X 1
Mesothelioma, Abdominal Cavi ty 1 tlematopoi e t i c System + + + t + + + + t t t + t + t t + t t 39
Myel oconocyt ic Leukemia X X 5 Lung + + + t + + t + t t + + + + t t t + t 39
Metastat ic Tumors X X X 3 1.i ver + t + + + t + + t t + + t t + + + t t 39
Atyp ica l Foci 3 Hepatocel lular Carcinoma 2 B i 1 e Duct Hyperplasia X X X 9
f'ancreas t t + + + + t + t + t t + + t t t t t 38 Exocrine Ce l l Adenoma X X 2 I s l e t Ce l l Adenoma X 1
Stomach + + + t + + + + + t + + t + t t t t + 38 U1 cer X X 5 Hyperplastic Gastropathy 1
Tongue + + + t + t t + + + + + + + t t t t + 39 Kidney t t t + + t + + + + + + + t t t t + + 39
Chronic Progressive Nephropathy* 1 1 2 2 3 2 2 1 1 1 1 1 1 1 1 1 1 1 33 Adenoma X 1
P i t u i t a r y G1 and + + + t t + t + t + t + + t t t t t t 38 Adenoma x x x x X x x x 12 Carcinoma x x 3
Thyroid Gland + t + + + t + t t t + + + t t t t t + 38 F o l l i c u l a r Ce l l Adenoma X 1 C-Cel? Hyperplasia X X X X 5 C-cel l Carcinoma X X 2
Parathyro id Gland + t + + t + + t + t t + + + + + t + t 38 Hyperplasia X X x x x x x 10 Adenoma X 1
Adrenal Gland + + + + t + t + + t + + t + t t t t + 38 C o r t i c a l Hyperplasia X 2 Pheochromocytoma x x x X X X X X 10
l e s t e s + + t t + t t + t t t t t t t + + t t 37 Leydig C e l l Tumor X x x x x x x x x x x x x x x x x x 36
Ear + + t + + + t t t t + + t t t t t + t 38 I n f lamnati on, Tympanic B u l l ae X X X 5
B r a i n t + + + t + + t t t t + + + t + t t + 38
+ Tissue examined 0 Tissue no t examined x Lesions present * Chronic progressive nephropathy (CPN)
1 = S l i g h t CPN 2 = Moderate CPN 3 = Marked CPN
71 Polybrominated Biphenyl Mix ture

TABLE A6.
INDIVIDUAL ANIMAL PATHOLOGY IN CONTROL MALE RATS ADMINISTERED 0 mg POLYBROMINATED BIPHENYL MIXTURE/kg BODY WEIGHT IN CORN OIL BY GAVAGE
(L1FETlME OBSERVATION) 3 0 0 2 2 1 4 3 4 2 0 1 0 3 0 0 2 3 3 7 -
Animal Number 7 5 4 2 5 1 5 0 0 6 5 9 9 9 8 0 5 2 0 8 1 3 6 3 5 4 1 1 5 3 1 1 2 1 5 3 6 4 7 5
Weeks on Study o 7
o 7
o 7
o 8
l 0
l 0
l 0
l 0
l 0
l 0
l 0
l 0
l 0
l 0
l 1
l 1
l 1
l 1
l 1
l 1
1 1 5 4 0 1 2 3 4 6 7 8 8 9 1 1 1 1 2 3 Skin 6 Subcutaneous Tissue t t t t t t t t t t t t t t t t t t t t
F ibroma/Fi broadenoma Fibrosarcoma X
X X
Prepu t ia l Gland Adenoma Squamous Ce l l Carcinoma Zymbal Gland Adenoma
Mesothelioma, Abdominal Cavity Mesothelioma, Thoracic Cavi ty Hematopoi e t i c System t
X
t t
X
t t t t t t t
X X t t t t t
X
t
X
t t t t
Lung
L i v e r
Myel m n o c y t i c Leukemia
A l veologenic Adenoma t
t
t
t
t
+
t
t
t
t
t
t
t
t
t
t
t
t
t
t
t
t
t
t
t
t
t
t
t
t
t
t
x t
t
x t
t
t
t
t
t
Pancreas
Atyp ica l Foci B i l e Duct Hyperplasia
t x
t x
t t X
t + t t X
t t t t t t t
X
t t t t t Exocrine Ce l l Adenoma I s l e t Ce l l Cardnoma
Stomach t t t t t t t t t t t t t t t t t t t t U1 cer
TongueKidney
Chronic Progressive Nephropathy * Adenoma
t +
t t
t t 1
t t
t t 3
X t t 3
t t 3
t t 3
t t 1
X t t 2
t t 1
t t 1
t t 1
t t 1
X t t 2
t t 2
X t t 2
t t 1
X t t
2
t t
2 X
P i t u i t a r y G1 and Adenoma
t t t t t X t t
X t t t
X t t t
x t
x t t t t t
X t
Carcinoma Thyroid Gland
F o l l i c u l a r Ce l l Adenoma t t t t t t
X t t t
X
X t t t t t t t t t t t
C-cell C-cel l
HyperplasiaAdenoma X X
X X
- C-cel l Carcinoma X X Parathyroid Gland
HyperplasiaAdenoma
t t t t t t t t t t X
t t t t t t t t t t
X Adrenal Gland t t t t t t t t t t t t t t t t t t t t
Cor t i ca l Hyperplasia Cor t i ca l Adenoma
X
PheochromocytomaTestes t t t t o t t t t t
X t t t t t t t t t +
Leydig Ce l l Tumor E a r t
x t
x t
x t t
x t
x t
x t
x t
x t
x t
x t
x t
x t
x t
x t
x t
x t
x t
x t
Brain I n f l a m t l o n . Tympanic Bul lae
t t t t t t t t t t t t t t t t t t t t Astrocytoma X
t Tissue examined 0 Tissue not examined x Lesions present
Chronic progressive nephropathy (CPN)1 = S l i g h t CPN 2 = Moderate CPN 3 Marked CPN
Polybrominated Biphenyl Mixture 72

TABLE A6. MALE RATS: ANIMAL PATHOLOGY (CONTINUED) 0 mg
Animal Number 1 ! 4 2 1 0
! 2 0
! 4 1
7 4 6 ' 8 2 1
2 0 0 1
3 2 0
4 Total Weeks on Study 1
1 1 1
1 1
1 1
1 2
1 2
1 2
1 2
1 2
1 2
1 2
1 2
1 2
Tissue o r
6 7 8 9 1 2 2 2 3 3 3 3 3 Lesions Skin E Subcutaneous Tissue + + + + + + + + t t t t + 33
F i broma/Fi broadenoma Fibrosarcoma
x x X x x 7 1
Prepu t ia l G1and Adenoma Squamous Ce l l Carcinoma Zymbal Gland Adenoma
Mesothelioma, Abdominal Cavi ty Mesothel ioma, Thoracic Cavi ty Hema topoi e t ic System
Myel omnocyt i c Leukemia + +
X
+ + + + + + X
X
+ + t t t
2 2 1 2 1
33 3
L i v e r
l u nAfveologenic Adenoma
+
+
+
+
+
+
+
+
t
+
+
+
+
+
+
+
+
+
t
+
t
+
t
i X
t
t
33 1
33 Atyp ica l Foci B i l e Duct Hyperplasia
Pancreas + + X + + + + +
X + + t
X t t
X t
1 8
33 Exocrine Ce l l Adenoma X x x x 4 I s l e t Ce l l Carcinoma X 1
Stomach + + + + t + + t t + t t t 33 U1cer x x X 8
Kidney Chronic Progressive Nephropathy *
Tongue
Adenoma P i t u i t a r y Gland
Adenoma
t + 1
t X
+ + 1
+
+ + 1
+
+ + 1
+
+ + 2
+
t + 2
t X
+ t 2
+
+ + 1
+ X
+ t 1
o
t t 1
t x
t t 1
t x
t t 1
t x
t t 1
t x
33 3330
1 32 13
Carc inoma 2 Thyroid G1 and
F o l l i c u l a r Ce l l Adenoma + + + + + + + + + + + t i 33
1 C-cel l HyperplasiaC-cel l Adenoma
X 2 3
C-cel l Carcinoma Parathyroid Gland
Hyperplasia Adenoma
+ t t t t x
t x
t x
t t t t t +
1
2 33 4
Adrenal Gland Cor t i ca l Hyperplasia Cor t i ca l Adenoma Pheochromocytoma
Testes
t
X
t
t
t
t
t x
t
+ x
+
t x
+
+ x
t
t x
t
t
t
+
t
t
t
t
t
t X
t
t
33 1 1 7 32
Levdia Ce l l Tumor - - x x x x x x x x x x x x x 31 Ear t t t t + t + t t t t t t 33
Bra inInf lamnat ion. Tympanic Bu l lae + +x +x + + + + + + +X + + + 3
33 Astrocytoma 1
+ Tissue examined 0 Tissue no t examined x f
Lesions present Chronic progressive nephropathy (CPN)1 = S l i g h t CPN 2 = Moderate CPN 3 = Marked CPN
73 Polybrominated Biphenyl Mixture

TABLE A7.
INDIVIDUAL ANIMAL PATHOLOGY IN FEMALE RATS ADMINISTERED 10.0 mg POLYBROMINATED BIPHENYL MIXTURE/kg BODY WEIGHT IN CORN OIL BY GAVAGE
(L1FETIME 0BSERVATlON) 5 7 6 7 5 8 7 5 5 7 6 6 8 6 6 6 5 8 8 7
Animal Number 1 0 0 1 4 2 5 2 5 3 1 5 5 6 7 3 1 8 4 9
- 5 4 4 0 0 3 4 9 6 2 5 0 9 8 6 6 3 9 1 4 Total Weeks on Study
3 4
0 3 6
0 4 1
0 7 4
0 8 6
0 9 4
0 9 8
0 0 3
1 0 3
1 0 5
1 0 6
1 0 6
1 0 8
1 0 9
1 1 2
1 1 3
1 1 5
1 1 6
1 1 7
1 1 8
1 or
Lesions
Tissues
Skin II Subcutaneous Tissue t t t t t t t t t t t t t t t t t t t t 20 Mamnary Gland Fibroadenoma
Hematopoietic Sys tern Myel m n o c y t ic Leukemia
LungMetastasis, Ovarian carcinoma
t
t
t
t
t
t
t
t
t
t
t
t
t X t
t
t
t X t
t
t
t X t
t
t
t
t
t
t
t
t
t
t
X t
t
t X t
X t
t X
t
t
2 204 20
1 L i ve r t t t t t t t t t t t t t t t t t t t t 20
Atypical Foci Neoplastic Nodule Hepatocel lu lar Carcinoma Pancreas-Like Tissue
X
X X
X x x
x
x
x
x
x X
X
X X
x
x
x
x x x
X
X x x
8 8 7 2
B i l e Duct Hyperplasia B i l e Duct Carcinoma
X X x x
X X
X x x
X X x x
X 7 7
Pancreas t t t t t t t t t t t t t t t t t t t t 20 Stomach t t t t t t t t t t t t t t t t t t t t 20
U lcer X x x 3 Hyperplast ic Gastropathy
TongueKidney
Chronic Progressive Nephropathy* Metastat ic Ovarian Carcinoma
t t
t t
t t
t t
X t t
t t 1
t t
t t 1
X t t 1
t t 1
X t t 1
t t 1
t t 2
t t 1
t t 1
t t 1
t t 1
t t 1
t t 1 X
t t 1
3 20 20 14 1
Uterus t t t t t t t t t t t t t t t t t t t t 20 PolypAdenocarcinoma
X X
1 1
VaginaPolyp
P i t u i t a r y Gland Adenoma
t
t
t
t
t
t
t
t X
t
t
t
t
t X t x
t
t x
t
t
t
t X
t
t
t
t
t
t
t
t
t
t
t
t
t
t
t
t
t
t
t
t
20 1
20 4
Thyroid Gland C-cel l Hyperplasia C-cel l Adenoma
t t t t t t t t t X
t t t t t
X
t t t X
t t t 20 2 1
Parathyroid G1 and Hyperplasia
Adrenal Gland
t
t
t
t
t
t
t
t
t
t
t
t
t
t
t
t
t
t
t
t
t
t
t
t
t
t
t
t
t
t
t
t
t
t
t X t
t
t
t
t
20 1
20 Cor t l ca l Hyperplasia
Ovarycys tCarcinoma
t t t t t t t t t t X
t X t t t t t t t
X
x t t
2 20
1 1
Ear t t t t t t t t t t t t t t t t t t t t 20 Inf lamnat lon, Tympanic Bul lae
Brain t t t t t t t t t t X t t t t t
X t t t t
X t
3 20
Astrocytoma X 1
t Tissue examined x Lesions present * Chronic progressive nephropathy (CPN)
1 = S l i g h t CPN 2 = Moderate CPN
Polybrominated Biphenyl Mixture 74

TABLE A8.
INDIVIDUAL ANIMAL PATHOLOGY IN FEMALE RATS ADMINISTERED 3.0 mg POLYBROMINATED BIPHENYL MIXTURE/kg BODY WEIGHT IN CORN OIL BY GAVAGE
(LIFETIME OBSERVATION)
Animal Number 6 3 0
5 7 5
7 5 7
8 5 4
5 0 2
8 7 1
6 6 9
4 8 2
5 5 3
4 9 5
8 5 6
7 5 0
8 9 5
6 0 9
8 5 7
5 6 6
7 3 7
5 2 6
7 1 5 Total
Weeks on Study 0
i 8
0
i 8
0
7 8
0
2 9
0
4 9
1
2 0
1
5 0
1
9 0
1
9 0
1
0 1
1
2 1
1
1 2
1
3
1
3 2
1
3 2
1
3 2
1
3 2
1
4 2
1
4 2
Tissues
Lesions ~or
Skin & Subcutaneous Tlssue Mamnary Gland,Flbroadenoma Zymbal Gland Adenoma Cl1 toral Gland Aderroma Epidermal Cyst
Hematopoiet i c Sys tem Myel omonocytlc Leu kemla Spleen, Metastatic Granulosa Cell Tumor
LungLiver
Atypical Foci Neopl astlc Nodule Hepatocellular carclnoma Bile Duct Hyperplasia
Pancreas Stomach
Ulcer Hyperplas tlc Gastropathy
TongueSquamous Cell Papilloma
KidneyChronic Progressive Nephropathy Tubular Cell Hyperplasia, Focal
Uterus Endometrial Cyst Adenoma Carcinoma
VaginaPltultary Gland Adenoma Carcinoma
Thyroid Gland C-cell Hyperplasia
Parathyroid Gland Hyperpl asla
Adrenal Gland Cortical Hyperplasia Cortical Adenoma Pheochromocytoma
OvarycystGranulosa Cell Tumor
Ear Inflamnatlon. Tympanlt Bullae
Brain
+
t
+ t
X x t +
X t
+ 1
t
t +
+
t
t
t
+
+
+
t
t t X
x + +
+
+
+
+ +
X +
+
+
+
t
+
+
+
t +
X
+ t
+
t
+
t +
+
t
+
+
t
+
+
+ X
+ t X
+ + X
t
+
+
t +
+
+
t
t
t
+
+
t
t +
X
t +
+ X +
+
+ +
+
+
t
+
+
t
t
X
t
+ t
x + +
+
+ 1
t
+ +
+
+
t
+
+
t
t
+ X
+ +
x X x + t
t
+ 1
+
+ t
+
+
t
+
t
t
+ X
t
t t
x
t t
t X t
+
+ t
+
t X +
X
t
t
t
t
t
X t + X
+ + X
+
t
+
t t
t
t
+
t
X t
+
t
X
+
+ +
+ +
+
t
+
+ t
t
+
t
+
+ X t
t X
t
+ +
X
t +
+
t 1
+
X
t +
t
t
t
t
t
+
+
X t
+ t
X
t +
t
+
+
t t
t X +
t
+
t
+
x
t
+
t +
t t
t X t 1 X t
+ +
t
t
t
t
t
+
x
t
t
+ + X
+ t
t
+
t
X t +
t
t
t
t
t
t
x
t
t
t t
+ t
+ X + 1
+
+ t
t
t
t
+ X
t
+
t
t
t t
t t X
+
t 1
t
t t
t
+
t
X t
t
+
t
t
t t
t t
t
t 1
t X
+ t x
t
t
t
t
t
+
x t
t
+ +
t t
t
t 1
t
t t x
t
t
t
t
t
+
x t
t
t +
t t
t
+ 1
t
t t
+
+
t X
t
t
+
x 19 51 1 1 19 2 119 19 4 5 3 419 19 3 119 4 19 10 119 1 1 1 19 19 5 119 1 19 119 1 1 1 19 1 119 119
+ Tissue examined x Leslons present * Chrontc progressive nephrbpathy (CPN)
1 = Slight CPN
75 Polybrominated Biphenyl Mixture

TABLE A9.
INDIVIDUAL ANIMAL PATHOLOGY IN FEMALE RATS ADMINISTERED 1.0 mg POLYBROMINATED BIPHENYL MlXTUREAg BODY WEIGHT IN CORN OIL BY GAVAGE
(LIF ETIME 0BSERVAT1 ON)
Aniwl Number 4 6
6 0
7 9
5 0
5 0
5 2
8 4
8 4
8 2
6 0
4 7
2 0 3 4 7 2 2 7 5 2 9 Total Weeks on Study
Skin 6 Subcutaneous Tissue k m r y Gland Fibroadenoma F i b e E idennal Cyst
Myelomonocytlc Leukemla
Atyp ica l Foci Neoplastic Nodule B i l e Duct Hyperplasia
Pancreas Stomach
Ulcer TongueK1dney
Chronic Progressive Nephropathy * Uterus
Endometrial Cyst VaginaP i t u i t a r y Gland
Adenoma C a r c i n m
Thyroid Gland C-cel l Hyperplasia
ParathyroidAdrenal Gland
RRbdanpSaKORMHemtopolet ic System
LungL l v e r
Ovarycys tGrclnulora Ce l l Tumor
Ear Bra in
9 0
6 t
X
t
t t
X X t t
t t 1 t
t t X
t
t + t
t +
1 1
2 t
t
+ t
t t
t
X
t 1 t
t +
t
+ t t
X
X
X
t t
1 1
4 t X
t
t +
X
t t
t t
t
t t x
t
t + t
t t
2 1
0 t
+
t t
t +
t X
t
t
t t x
+
t t t X
t t
2 1
2 t
t
+ t
t t
t +
+
t t x
+
t t t
t t
2 1
3 t x
t
+ +
t t
t
X
+
t
t t
t
+ t +
t t
2 1
3 t x
+
t +
t t
t t
t
t t
t
+ t t
X
X
+ t
2 1
3 t x
+
+ +
t +
t + 1 +
t t
t
t t t
t t
2 1
3 t
t
t +
+ t
t
X
X
t
t
t t
t
t + t
t +
2 1
4 t
X
t
t +
t t
t t 1 t
+ t x
t
t t +
X
X t +
2 1
4 t
t
t +
t +
t t 1 +
+ + x
+
t t t
t t
or Tissue
Lesions 11 4 1 1 1
11 1
11 11 2 2 1
11 11 1ii 11 5
11 1
11 11 6 2
11 2
11 11 11 2 1
11 11
t Tissue examined x Lesions present
Chronic progressive nephrophthy (CPN) 1 = S l i g h t CPN
Polybrominated Biphenyl Mixture 76

TABLE A10.
INDIVIDUAL ANIMAL PATHOLOGY I N FEMALE RATS ADMINISTERED 0.3 mg POLYBROMINATEO BIPHENYL MlXTUREAg BODY WEIGHT IN CORN OIL BY GAVAGE
(LIFETIME. OBSE RVATION) 5 6 8 5 7 5 6 6 6 7 4 6 7 6 7 7 7 6 6 7 7
Animal Number i i 0 7 0 3 a 8 7 4 9 2 7 5 0 2 3 2 4 o i 9 7 5 0 1 8 2 7 8 1 1 6 4 2 9 1 9 2 7 8 1 Total
Weeks on Study 0 9
0 9
1 0
1 0
1 0
1 0
1 0
1 1
1 1
1 1
1 1
1 2
1 2
1 2
1 2
1 2
1 2
1 2
1 2
1 2
1 2
Tissues o r
Skin & Subcutaneous Tissue 5 t
6 t
0 t
3 t
3 t
4 t
9 t
0 t
3 t
9 t
9 t
0 t
2 t
3 t
3 t
3 t
3 t
3 t
4 t
4 t
4 t
Lesions 21
Manary G1 and, P i broadenoma C l it o r a l Gland Adenoma
Hematopoi e t Ic Sys tem Myel omonocytic Leukemla
LungAlveologenlc Adenoma
L i v e r
X
t
t
t
t
t
t
X
t
t X t
t
t
t
t
t
t
t
t
t
X
t X t
t
X t
t
t
t
t
t
t x t
t
t x t
t
x
t
t
t
x
t X t
t
x
t
t
t
x
t
t
t
t
t
t
t
t
t
X
t
t
t
t
t
t
x X t
t
t
x
t
t
t
10 2
21 4
21 1
21 Atyp ica l Foci
Pancreas t t t t t X t t t t t t t t t t t t t t t t
1 21
Stomach t t t t t t t t t t t t t t t t t t t t t 21 Ulcer X X X x x x 6 Hyperplastic Gas t ropa t hy
TongueKidney
Chronic Progresslve Nephropathy* Tubular Ce l l Hyperplasia, Focal
Uterus
t t
t
t t 1
t
t t 1
t
t t 1
t
t t
t
t t 1
t
t t 1
t
t t 1
t
t t
t
t t
t
t t
t
t t 1
t
t t
t
t t 1
t
t t
t
t t
t
t t
t
t t 1
t
t t
t
t t 1
t
X t t 1 X t
1 21 21 11 1
21 Endometrial Polyp
VaglnaP l t u i t a r y Gland
Adenoma
t t
t t
t t
t t X
t o
t t
t t
t t
t t
t t
X t t X
t t
t t
t t
t t X
t t
X t t
t t X
t t
t t
t t
2 21 20 4
Carcl noma X X x x x X 6 Thyrold Gland
C-cel l HyperplasiaC-cel l Adenoma
t X
t t
X
t t t X
t t X
t t t t t t t t t t
X
t t
x
t
x
21 3 4
C-cel l Carcfnoma Parathyrold Gland
Adenoma t t t t t t t t t t t t t t t t + t
X t t
X t
1 21 1
Adrenal G1 and t t t t t t + t t t t t t t t t t t t t t 21 0var.y
cys tGranulosa Cel l Tumor
t t t t t t X
t t t t t t t t
X
t t t t t
X
t t 21 1 2
Ear t t t t t t t t t t t t t t t t t t t t t 21 Inflamnatlon,
B ra ln Tympanlc Bul lae
t t t t t t t t t t t t t X t t t t t t t t
1 21
t fssueexamlned Lesions present Chronic progressive nephropathy (CPN) 1 = S l i g h t CPN
77 Polybrominated Biphenyl Mixture

TABLE A l 1.
INDIVIDUAL ANIMAL PATHOLOGY IN FEMALE RATS ADMINISTERED 0.1 mg POLYBROMINATED BIPHENYL MIXTURE/kg BODY WEIGHT IN CORN OIL BY GAVAGE
(LIFETIME OBSERVATION) 5 5 7 5 8 7 5 7 6 5 6 7 8 4 8 7 0 6 5 8 7
Animal Number 0 9 6 2 4 8 3 7 2 3 0 3 3 8 6 7 0 7 4 9 5 9 4 3 3 4 9 6 9 9 9 7 8 5 3 1 1 0 3 6 8 6 Total
Weeks on Study 0 7
0 8
0 8
0 9
0 9
1 0
1 0
1 0
1 0
1 0
1 0
1 1
1 1
1 1
1 1
1 2
1 2
1 2
1 2
1 2
1 2
Tissues o r
Skln 8 Subcutaneous Tissue 0 . 2 . 3 . 8 . 9 . 1 . 3 . 5 . 6 . 8 . 8 . 3 . 4 . 6 . 6 . 3 . 3 . 4 . 4 . 4 . 4 . Lesions
21 Mamnary Gland, Fibroadenoma Mamnary Gland, Carcinoma RhabdomyosarcomaF i brosarcoma
x x X
X
X x x
X
x x x X
X 10 1 1 1
C l it o r a l 61and Adenoma X X 2 HemangiomaBasal Ce l l Tumor
Hema topo i e t ic System + + + + + X
+ + + + + + + + + + + + + + + X+ 1 1
21 M y e l m n o c y t i c Leukemia Spleen, Metas ta t i c F i b r o s a r c m . . . .
x
. x
. . X . . X
. . . . . X
. . . . . . . 4 1
21
Metastat ic Carcinoma Lu#veologent c Adenoma X
X 1 1
Metastat ic Fibrosarcoma X 1 L i v e r . . . . . . . . . . . . . . . . . . . . . 21
Neoplastic Nodule Pancreas . . . . . . . X . . . . . . . X . . . . . . . 2
21 Stomach . . . . . . . . . . . . . . . . . . . . . 21
U1 cer x x X 3 Hyperplast ic Gastropathy
Tongue + + X+ + + + + + + + + + + + + + + + + + +
1 21
Squamous Ce l l Papilloma K1dney
Chronic Progressive Nephropathy Metas ta t i c Fibrosarcoma
Uterus
.
.
.
.
. 2
.
.
.
.
.
. 1
.
. 1
.
. 1 X .
.
.
. 1
.
.
.
X .
.
.
.
. 1
.
. 1
.
.
.
.
.
. . 1
. .
.
.
. 1
. 1
1 21 10 1
20 MyxomaEndometrial Polyp HemangiomaDeciduoma
X X
X X
1 1 1 1
VaginaPolyp
. . . . . . . . . . . . . . . . . . . . . . X X
20 2
P i t u i t a r y Gland Adenoma
. . . . . . . . . . . . . . . . . . . . . . x x x x x xx x x x x
20 11
Thyroid Gland C-cel l Hyperplas t a C-cel l Adenoma
. . . . . . . . . . . . . X
. . . x
. x
. . . . X
21 3 1
C-cel l C a r c i n mParathyroid G1 and . . . X. . . . . X. . . . . . . . . . . . . 221
HyperplasiaAdrenal Gland . . . . . . . . . . . . . . . .
X . . . . .
1 21
Adrenal Cor t i ca l Hyperplasia Pheochromocytoma
Ovarycys t
Ear
X X
. . . . . . . . . . . . . . . . . . . . . . X . . . . . . . . . . . . . . . . . . . . .
1 1
20 1
21 Bra1n . . . . . . . . . . . . . . . . . . . . . 21
+ Tissue examined x Lesions present 0 Tissue no t examined * Chronic progressive nephropathy (CPN)
1 = S l i g h t CPN 2 = Moderate CPN
Polybrominated Biphenyl Mixture 78

TABLE A12.
INDIVIDUAL ANIMAL PATHOLOGY IN CONTROL FEMALE RATS ADMINISTERED 0 mg POLYBROMINATED BIPHENYL MlXTUREhg BODY WEIGHT I N CORN OIL BY GAVAGE
(LIFETIME OBSERVATIONS) 5 8 0 7 0 5 6 6 6 6 7 5 7 8 0 5 8 5 6 7
--Animal Number 2
4 1 9
0 7
6 4
3 4
4 4
6 5
0 0
4 8
0 3
8 7
9 6
9 9
2 1
3 1
2 7
7 2
7 7
3 7
7 8 Total
Weeks on Study 0 5
0 5
0 7
0 7
0 a
0 0
0 9
1 0
1 0
1 0
1 1
1 1
1 1
1 1
1 1
1 1
1 1
1 2
1 2
1 2
Tissues o r
0 9 7 7 4 7 0 6 6 8 1 1 1 2 4 4 9 0 3 4 Lesions -- Skin E Subcutaneous issue
Mamnary Gland, Fibroadenoma Epidermal Cyst Zymbal Gland Carcinoma C l i t o r a l Gland Adenoma
X X
X
X
X
X
x
X
x
x x
5 1 2 3
Hematopoietic System Myelomonocyic Leukemia
LungMetastat ic Carcinoma, C-cel l Metastat ic Carcinoma, Zymbal Gland
L i v e r
.
.
.
.
.
.
.
. X
.
.
.
.
.
.
.
.
.
.
.
.
.
. X
.
.
.
.
.
. X
.
.
.
. X
.
. x
.
.
. x
.
.
.
.
.
.
.
.
.
.
.
. X
.
.
.
.
.
.
.
.
.
.
.
20 5
20 1 1
20 Metastat ic Myxosarcoma B i l e Ouct Hyperplasia
Pancreas . X
. . . . . X
. . . X
. . . . . . . . . . . 1 2
20 Stomach . . . . . . . . . . . . . . . . . . . . 20
U1 cer x x 2 Hyperplastic Gastropathy
TongueSquamous Ce l l Papilloma
KidneyChronic Progressive Nephropathy * Tubular Ce l l Adenoma
.
. . .
.
. . .
.
. . .
.
. X
.
. 1
.
. 1
.
. . .
.
. . .
.
. . .
1
.
. . .
.
.
X
1
.
. X
1
.
. 1
1 20 1
20 6 1
Uterus Endometrial PolypEndometrial Cyst ic Hyperplasia
VaginaMyxosarcoma
P i t u i t a r y Gland Adenoma Carcinoma
.
.
.
.
. X .
. X
.
.
.
.
.
.
.
.
.
.
.
.
. . X
.
. .
.
. . x
. X
. . x
.
. .
x
.
. .
x
.
. .
x
. X
. .
x
.
. .
x
.
. .
x
.
. .
.
. .
x
.
. .
x
.
. .
20 2 1
20 1
20 9 2
Thyroid Gland F o l l i c u l a r Ce l l Carcinoma
. . . . . . . . . . . . X
. . . . . . . . 20 1
C-cel l C-cel l
HyperplasiaCarcinoma X X
X X X 3 2
Adrenal Cor t i ca l Adenoma
Parathyroid Gland Adrenal Gland
.
. X
.
. . .
.
. . .
.
. . .
.
. . .
.
. . .
.
. . .
.
. . .
.
. . .
.
. . .
.
. 20 20 1
PheochromocytomaOvaryEar
.
. . .
.
. . .
.
. . .
.
. . .
.
. . .
.
. . .
.
. . .
.
. . .
.
. . .
X . .
.
. 1
20 20
I n f l amnati on, Tympanic Bul l ae B ra in . . . . . . . . . .
X . . . . . . . . . .
1 20
+ f i s s u e examined x Lesions present
Chronic progressive nephropathy (CPN) 1 = S l i g h t CPN
79 Polybrominated Biphenyl Mixture

Polybrominated Biphenyl Mixture 80

APPENDIX B INDIVIDUAL ANIMAL PATHOLOGY IN MICE
ADMINISTERED POLYBROMINATED BIPHENYL MIXTURE IN CORN OIL BY GAVAGE
(LIFETIME OBSERVATION)
81 Polybrominated Biphenyl Mixture

TABLE B1.
INDIVIDUAL ANIMAL PATHOLOGY IN MALE MICE ADMINISTERED 10.0 mg POLYBROMINATED BIPHENYL MlXTURE/kg BODY WEIGHT IN CORN OIL BY GAVAGE
Animal Number
Weeks on Study
Skin & Subcutaneous Tissue F ibrosarcoma
Hematopoietic Sys tern Malignant Lynphoma
Lung Metastat ic Hepatocel lu lar Carcinoma
L i ve r Hepatocel lu lar Adenoma Hepatocel lu lar Carcinoma HepatoblastomaB i l e Duct Carcinoma
Pancreas Stomach TongueKidneyP i t u i t a r y Gland Thyroid Gland Parathyroid Gland Adrenal Gland Testes EyeBra in
+ Tfssue examined 0 Tissue no t examined x Lesions present
(LIFETIME OBSERVATION) 0 1 1 1 0 2 1 2 2 0 0 4 7 9 5 5 7 6 0 4 1 5 0 5 4 4 4 5 0 8 6 3 3 0 0 0 0 0 0 0 0 0 0 0 5 6 6 7 8 9 9 9 9 9 9 7 6 9 4 0 1 2 2 5 6 6
0 2 0 2 2 1 2 2 2 0 1 8 2 3 4 8 1 9 0 9 4 5 2 6 0 1 0 3 1 6 4 7 3 Total 0 1 1 1 1 1 1 1 1 1 1 Tissue 9 0 0 1 1 1 1 1 1 2 2 o r 7 0 3 0 3 3 4 6 8 0 6 Lesions
t t t t t t t t t t t t t t t t t t t t t t 22 X X 2
t t t t t t + t t t t t t t t t t t t t t t 22 X X 2
t t t t t t t t t t t t o t t + t t t t t t 21 X X X X 4
t t t t t t t t t + t t t t t t t ~ t + t t t 22 X 1
x x x x x x x x x x x x x x x x x x x x x 21 X X 2 X 1
t t t t t t t t t t t t t t t t t t + t t t 22 t t t t t + t t t t t t t t t t t t t t t t 22 t t t t t t t t t t t t t t t t t t t t t t 22 t t t + t t t + t t t t t t t t t t t t t t 22 + t + t t t t t t t t t o t t t t + t t t t 21 t t t t t t t t t + t t o t t t + t t t t + 21 t t t o t t t t t + + t o t t + t t t t t t 20 t t t t t t t t t t t t t t t t t t t t t t 22 t t t t t t t t t t t t t t t t t + t t t t 22 t t t t t t t t o t t t o t t t + t t t t + 20 t t t t t t t t t t t t o t t t t t t t t t 21
Polybrominated Biphenyl Mixture 82

TABLE B2.
INDIVIDUAL ANIMAL PATHOLOGY I N MALE MICE ADMINISTERED 3.0 mg POLYBROMINATED BIPHENYL MlXTURElkg BODY WEIGHT IN CORN OIL BY GAVAGE
(LIFETIME OBSERVATION) - 2 3 0 2 0 0 1 3 1 1 3 3 3 2 1 0 3 0 0 2 1 1 0 Animal Number E 4 9 5 6 3 5 2 8 8 3 1 4 2 6 5 4 2 4 1 0 9 9
1 0 4 4 6 5 9 7 8 0 7 6 4 5 5 5 3 9 6 6 0 3 1 Total--Weeks on Study 0 0 0 0 0 0 1 1 1 1 1 1 1 1 1 1 1 1 1 1 1 1 1 rissue
4 9 9 9 9 9 0 1 1 1 1 1 1 2 2 2 2 2 2 3 3 3 3 or 5 3 5 6 7 7 2 0 2 5 6 8 8 4 4 5 5 7 8 1 1 1 1 Lesions-
Skin & Subcutaneous Tissue t t t t t t t t t t t t t ' t t t t t t t t t t 23 Fibroma X X 2 Fibrosarcoma X X x x 4 Rhabdomyosarcoma X 1 Preput ia l Gland Carcinma X 1
Hematopoietic System + t t t t t t t t t t t t t t t t t t t t t t 23 Halignant Lylnphoma X x x 3 Hemangioma, Spleen X 1 Hemangiosarcoma, Spleen X 1
Lung + t t t t t t t t t t t t t t t t t t t t t t 23 Adenoma tos i s X X 2 Alveologenic Adenoma X - x X 3 Metas t a t l c Hepatocel l u l a r Caninoma x x X 3
Liver t t t t t t t t t t t t t t t i ! t t t t t t t 23 Hepatocellular Adenoma X X 2 Hepatocellular Carcinoma X x x x x x x x x x x x x x x 15 Hemangiosarcoma X 1 Metastatic Carcinoma X 1
Pancreas t t t t t t t t t t t t t t t t t t t t t t t 23 Stomach t t t t t t t t t t t t t t t t t t t t t t t 23
Hyperplastic Gastropathy X 1 Tongue t t t t t t t t t t t t t t t t t t t t t t t 23 Large In test ine t t t t t t t t t t t ' t t t t t t t t t t t t 23
Carcinoma X 1 K1 dney t t t t t t t t t t t t t t t t t t t t t t t 23
Adenoma X 1 P i tu i t a ry Gland t t t t t t t t t t t t t t t t t t t t t t t 23
Adenoma X 1 Thyroid Gland t t t t t t t t t t t t t t t t t t t t t t t 23
Fo l l i cu la r Cell Hyperplasla X X 2 Parathyroid Gland t t t t t t t t t + t t t * t t t t t t t t t 23 Adrenal Gland t t t t t t t t t * * t t t . t t t t t t t t t 23
Cort ical Adenoma X 1Cort ical Carc inoma X 1Pheochromocytom X 1
Testes t t t t t t t t t t t t t t t t t t t t t t t 23 Eye t t t t t t t t t t t t t t t t t t t t t t t 23 Brain t t t t t t t t t t t t t t t t t t t t t t t 23
Epidermal Cyst X 1 -t l i ssue examined x Lesions present
83 Polybrominated Biphenyl Mixture

TABLE 83.
INDIVIDUAL ANIMAL PATHOLOGY IN MALE MICE ADMINISTERED 1.0 mg POLYBROMINATED BIPHENYL MIXTURE/kg BODY WEIGHT IN CORN OIL BY GAVAGE
(LIFETIME OBSERVATION) 0 1 0 0 1 3 2 2 0 1 2 3 1 1 2 3 2 3 1 2
Animal Number 4 3 8 4 0 2 8 1 9 9 7 4 9 1 5 1 2 0 3 5 1 2 1 2 9 9 3 3 9 9 6 2 6 8 5 0 4 7 3 0
Weeks on Study 0 0 0 0 0 0 0 0 0 1 1 1 1 1 1 1 1 1 1 1 3 8 9 9 9 9 9 9 9 0 0 0 1 1 2 2 2 2 2 3 9 5 0 1 7 7 7 7 8 3 4 6 1 2 2 2 2 4 6 1
Skin 6 Subcutaneous Tissue . . . . . . . . . . . . . . . . . . . . F i broma X ~ibrosarcma x x X X Prepu t ia l Gland Adenoma X Schwanoma Rhabdomyosarcoma X
Hematopoi e t i c Sys tem . . . . . . . . . . . . . . . . . . . . . Malignant Lymphoma X X X X X . . . . . . . . . . . . . . . . . . . .
Lu!!veologenic Adenoma X X A l veol ogen ic Carc inoma Metastat ic Hepatocel lu lar Carcinoma X X Metastat ic Fibrosarcoma X
L ive r . . . . . . . . . . . . . . . . . . . . Atypical Foci X Hepatocel lu lar Adenoma Hepatocel lu lar Carcinoma x x x x x X x x x x x
Pancreas . . . . . . . . . . . . . . . . . . . . I s l e t Ce l l Adenoma
Stomach . . . . . . . . . . . . . . . . . . . . Hyperplast ic Gastropathy
Tongue . . . . . . . . . . . . . . . . . . . . Small I n t e s t i n e . . . . . . . . . . . . . . . . . . . .
Adenocarcinoma X Kidney . . . . . . . . . . . . . . . . . . . .
Adenoma P i t u i t a r y Gland . . . . . . . . . . . . . . . . . . . . Thyroid Gland . . . . . . . . . . . . . . . . . . . .
F o l l i c u l a r Ce l l Hyperplasia Parathyroid Gland . . . . . . . . . . . . . . . . . . . . Adrenal Gland . . . . . . . . . . . . . . . . . . . .
Pheoc hromocytoma X Testes . . . . . . . . . . . . . . . . . . . . Eye . . . . . . . . . . . . . . . . . . . .
Harderian Gland Adenoma X Brain . . . . . . . . . . . . . . . . . . . .
+ Tissue examined x Lesions present
Polybrominated Biphenyl Mixture 84

TABLE 83. MALE MICE: ANIMAL PATHOLOGY (CONTINUED) 1.0 mg 0 1 3 1 2
Animal N u d e r 7 2 1 6 8 1 0 9 1 6 Total
Weeks on Study Ti ssue --H++-+ or i i i 1 1 Lesions
Skin 6 Subcutaneous Tissue + + + + + 25 Fi b m 1 Fibrosarcoma 4 Reputial Gland Adenoma 1 Schwanoma, 1 Rhabdomyosarcana 1
Hematopoietic System + + + + 25 Malignant Lymphoma X 6
Lung + + + + 25 Alveologenic Adenoma X 3 Alveologenic Carclnana X 1 Metastatic Hepatocellulaf Carcinoma 2 Metastatic Fibrosarcoma 1
Liver t + + + + 25 Atypical Foci 1 Hepatocellular Adenoma X X 2 Hepatocellular Carcinoma 12
Pancreas + + + 25 Islet Cell Adenoma X 1
Stomach + + + 25 Hyperplastic Gastrowthy 1
Tongue + + + 25 Small Intestine + + + 25
Adenocarcinoma 1 K1 dney + + + + 25
Adenana X Pituitary Gland + + + 25
1
+ + + 25Thyroid Gland ~ollicular Cell Hyperplas ,la X 1
Parathyroid Gland + + + 25 Adrenal Gland + + + 25 Pheochranocytoma 1
Testes + + + + + 25 + + + + + 25
EY:arderian Gland AdenoW 1 Brain + + + + + 25
+ Tissue examined x Lesions present
85 Polybrominated Biphenyl Mixture

TABLE 84.
INDIVIDUAL ANIMAL PATHOLOGY I N MALE MICE ADMINISTERED 0.3 mg POLYBROMINATED BIPHENYL MlXTURE/kg BODY WEIGHT I N CORN OIL BY GAVAGE
-(LIFETIME OBSE RVATl ON)
0 0 1 0 0 3 1 2 2 0 2 0 3 3 0 0 2 2 2 3 1 2 1 3 Animal Number 7 1 0 2 7 2 7 0 5 2 5 8 2 2 4 1 1 3 6 4 1 7 4 3
- 2 9 6 8 6 3 4 3 7 5 3 9 2 5 5 6 9 2 0 1 2 0 6 4 Total Weeks on Study 0
7 0 7
0 7
0 8
0 9
0 9
0 9
0 9
0 9
1 0
1 0
1 1
1 1
1 1
1 2
1 2
1 2
1 2
1 3
1 3
1 3
1 3
1 3
1 3
Tissue or
0 4 5 1 7 7 9 9 9 8 9 0 1 8 0 3 3 4 0 1 1 1 1 1 Lesions Skin h Subcutaneous Tissue t t t t t t t t t t t t t t t t t t t t t t t t 24
Fibroma X 1 Fibrosarcoma x x x x 4 LeiomyosarcomaPreput ia l Gland Carcinoma Hemangioma
Hematopoietic Sys tem Mal ignant Lymphoma
LungAdenomatosis
t
t
t
t
t
t
t
t
t
t
t X t
t
t
t X t
t
t
t X t X
X
t
t
t
t
t x t
t x t
t
t
t
t
X
t
t
t
t
t
t
t
t
t
t
X t X t
t
t
t X t
1 1 1
24 7
24 1
Alveologenic Adenoma Metastatic Fibrosarcoma X
X X X 3 1
Metastatic Hepatocellular Carcinoma
L iver t t t t t t t t X t t t t t t
X t t t t t t t t t t
2 24
Hepatocellular Adenoma Hepatocellular Carcinoma
Pancreas t t t t t t X t t
x t
x t
x t
X
t t t x t
x t t
X
t X t t
X
t X t t
X
t
4 8
24 Stomach t t t t t t t t t t t t t t t t t t t t t t t t 24
Hyperplastic Gastropathy TongueSmall In tes t ine
t t
t t
t t
t t
t t
t t
t t
t t
t t
t t
t t
t t
t t
t t
t t
t t
t t
t t
t t
t t
t t
X t t
t t
t t
1 24 24
HemangiomaKidneyP i t u i t a r y G1 and Thyroid Gland Parathyroid Gland
Adenoma Adrenal Gland
t t t t
t
t t t t
t
t t t t
t
t t t t
t
t t t t
t
t t t t
t
t t t t
t
t t t t
t
t t t t
t
t t t t
t
t t t t
t
t t t t
t
t t t 4
t
t t t t
t
t t t t
t
t t t t
t
t t t t
t
X t t t t
t
t t t t
t
t t t t
t
+ t t t X t
t t t t
t
t t t t
t
t t t t
t
1 24 24 24 24 1
24 Cor t ica l Adenoma
Testes t t t t t X t t t t t t t t t t t t t t t t t t t
1 24
EyeHarderian Gland Adenoma
t t t t t t t t t t t t x
t x
t x
t t t t t t t t t t 24 3
Brain t t t t t t t t t t t t t t t t t t t t t t t t 24
t Tissue examined x Lesions present
Polybrominated Biphenyl Mixture 86

TABLE 85.
INDIVIDUAL ANIMAL PATHOLOGY IN MALE MICE ADMINISTERED 0.1 mg POLYBROMINATED BIPHENYL MlXTURE/kg BODY WEIGHT IN CORN OIL BY GAVAGE
- (LIFETIME OBSERVATION) 0 2 0 0 1 2 2 0 0 0 2 3 2 0 3 3 2 3 0 0
Animal Number 1 9 8 1 5 0 8 5 4 5 9 0 1 7 3 2 0 1 8 1
- 7 7 4 2 5 9 8 8 8 9 6 2 2 3 1 1 0 1 5 5 Weeks on Study 0
6 0 6
0 8
0 9
0 9
0 9
0 9
1 0
1 0
1 0
1 1
1 1
1 1
1 1
1 1
1 2
1 2
1 2
1 2
1 2 - 7 7 5 3 6 7 9 1 6 9 1 4 6 6 6 1 3 3 4 6
Skin & Subcutaneous Tissue t t t t t t t t t t t t t t t t t t t t Fibroma X x x F l brosarcoma x x x x X X X RhabdomyosarcomaBasal Ce l l Tumor X
X
Xanthoma X Hemangl m a
Hmtopoi e t i c System Malignant Lymphoma
Lung
t
t
t
t
t
t
t
t
t
t
t X t
t
t
t
t
t
t
t
t
X t
t
t
t
t X t
t
t
t X t
t
t
t
t
t
t
t x t
t x t
A l veal ogenic Carc f nom L i v e r t t t t t t t t t t t t t t t
X t t t t t
Atypica l Foci Hepatocel lular Adenoma Hepa t o c e l l ul a r Carci nonla H i s t i o c y t i c Sarcoma
Pancreas t t t t
X
t t
X
t
X
t
X
t X t t
X
t t
x
t
x
t
x
t
x
t t t t I s l e t Cel l Adenoma
Stomach t t t t t t t t t t t t t t t t t t t t
TongueSmall I n t e s t i n e
Hyperplastic Gastropathy t t
t t
t t
t t
t t
t t
t t
t t
t t
t t
t t
t t
t t
t t
X t t
t t
t t
t t
t t
t t
Adenocarcinoma
KidneyP i t u i t a r y Gland Thyroid Gland
Lipoma
F o l l i c u l a r C e l l Adenoma
t t t
t t t
t t t
t t t
t t t
t t t
t t t
t t t
t t t
t t t
t t t
t t t
t t t
t t t
t t t
t t t
t t t
t t t
t t t X
t t t
Parathyroid Gland Adrenal Gland
t t
t t
t t
t t
t t
t t
t t
t t
t t
t t
t t
t t
t t
t t
t t
t t
t t
t t
t t
t t
Testes t t t t t t t t t t t t t t t t t t t t EyeBrain
t t
t t
t t
t t
t t
t t
t t
t t
t t
t t
t t
t t
t t
t t
t t
t t
t t
t t
t t
t t
-t Tissue examlned x Lesions present
87 Polybrominated Biphenyl Mixture

TABLE B5. MALE MICE: ANIMAL PATHOLOGY (CONTINUED) 0.1 3 1 1 3 1 2 2
Animal Number 2 4 8 0 2 7 8 4 4 5 5 7 2 5 Total
Weeks on Study 1 1 1 1 1 1 1 T I ssue -o r 0 1 1 1 1 1 1 Lesions
Skin & Subcutaneous Tissue + t + t t t + 27 F1 broma X 4 Fibrosarcoma 7 Rhabdomyosarcoma 1 Basal Ce l l Tumor 1 Xanthoma 1 Hemangioma 1
Hema topo i e t ic System t t + t t t + 27 Malignant Lymphoma X 6
Lung t + t t t t t 27 Alveologenic Carcinoma 1
L l ve r t t + + t t t 27 Atyp ica l FOCI 1 Hepatocel lu lar Adenoma 1 Hepatocel lu lar Carcinoma X a H i s t i o c y t i c Sarcoma 1
Pancreas + t + t + t t 27 I s l e t Ce l l Adenoma X 1
Stomach + t t t t t + 27 Hyperplast ic Gas tropathy X 2
Tongue t t t + t t + 27 Small I n tes t i ne t t t t t t t 27
Adenocarcinoma X 1 Lipoma X 1
Kidney t t t t t t t 27 P i t u i t a r y Gland t t + + t t * 27 Thyroid Gland t t t t t t t 27
F o l l i c u l a r Ce l l Adenoma 1 Parathyroid Gland t t t t t t t 27 Adrenal Gland + t + t + + t 27 Testes t t t t t t t 27 Eye t t t t t t t 27 Bra in + t t + + + + 27
t Tissue examined x Lesions present
88Polybrominated Biphenyl Mixture

TABLE 86.
INOlVlOUAL ANIMAL PATHOLOGY IN CONTROL MALE MICE AOMlNlSTEREO 0 mg POLYBROMINATED BIPHENYL MIXTURE/kg BODY WEIGHT IN CORN OIL BY GAVAGE
(LIFETIME OBSERVATION)
1 2 0 1 3 1 0 0 2 2 1 1 2 0 0 1 2 3 2 3 0 1 0 0 3 Anlmal Number 6 1 8 6 1 0 7 0 6 6 3 1 6 1 2 4 2 3 5 2 1 3 6 3 4
6 0 8 3 5 0 7 2 2 4 6 4 6 0 3 7 7 0 2 0 4 5 5 9 7 ~ ~ t ~ l Weeks on Study 0
8 0 8
0 9
0 9
0 9
0 9
0 9
1 0
1 0
1 0
1 1
1 1
1 1
1 1
1 1
1 1
1 1
1 3
1 3
1 3
1 3
1 3
1 3
1 3
1 3
Tissues or
Skin ti Subcutaneous Tissue 0 t
6 t
1 t
1 t
4 t
5 t
7 f
1 t
7 t
9 t
0 t
1 t
3 t
3 t
6 t
6 t
8 t
1 t
1 +
1 t
1 t
1 t
1 t
1 t
1 +
Leslons 25
F lbroma X 1 F lbrosarcoma X X 2 Rhabdomyosarcoma
Malignant Lymphoma
Alveologenlc Adenoma
Carcinoma
Hematopoletlc Sys tm
Lung
Metastatic Hepatocellular
X t
t
t
t
t
t
t
t
t
t
t
t
x
t
t
x
t
t X t
t
t
t X t
t
t
t
t
t X
+
t
t
t X t
t
t
t
t
t
t
t
t
t
t
+
t
t
X
t
t
t
t X t
t
X
1 25
4 25
1
.4
Hepatocellular Adenoma Hepatocellular Carcinoma Hepatoblastoma
Pancreas
L lver t
t
t
t
t
x
t
t
x
t
+
t
t
x
t
t
x
+
t
x X t
t
t
t
t
t
t
t
x
t
t
x
t
t X
t
t
t
t
t
t
x
t
t
x
t
t
t
t
X X t
t
t
t
X X t
t X
t
t
t
t
x
t
2s 2
12 3
25 S t m c h t t t t t t t t t t + t t t t t t t t t t t t t t 25 ton ue %SI I n tes t i ne
t t
t t
t t
t t
t t
t t
t t
t t
t t
t t
t +
t t
t t
t t
t t
t t
t t
t t
t t
t t
t t
t t
t t
t t
t t
25 25
Adenoma X 1 Large In tes t l ne
Adenocarclnoma t t t t t
X t t t t t t t t t t t t t t t t t t t t 25
1 K1dney
Carclnoma t t t t t t t t t t t t t t t t t t t t t t
X t t t 25
1 P l t u l t a r y Gland Thyroid Gland Parathyroid Gland Adrenal Gland
TestesPheochromocytoma
t t t t
t
t t t t
t
t t t t
t
t t t t
t
t t + t
t
t t t t
t
t t t t
t
t t t t
t
t t t t
t
t t t t
t
t t t +
+
t t t t
t
t t t t
t
t t t t
t
t t t t
+
t t t t
t
t t t t
t X
t t t t
t
t t t t
t
t t t t
t
t t t t
t
t t t t
t
t t t t
t
t t t +
t
t t t t
t
25 25 25 25 1
25 t t t t t t t t t t t t t t t t t t t t t t t t t 25
i%ln t t t t + t t t t t t t t t t t t t t t t t t t t 25
t Tissue examlned x les ions present
89 Polybrominated Biphenyl Mixture

TABLE 87.
INDIVIDUAL ANIMAL PATHOLOGY IN FEMALE MICE ADMINISTERED 10.0 mg POLYBROMINATED BIPHENYL MIXTURE/kg BODY WEIGHT IN CORN OIL BY GAVAGE
(LIFETIME OBSE RVATl ON)
4 4 4 6 6 5 3 3 Animal Number 1 2 9 6 3 6 5 6
3 3 2 3 8 2 1 9 Total Weeks on Study 0 0 1 1 1 1 1 1 Tissue
8 9 0 0 0 1 2 2 o r 2 1 1 5 7 1 1 8 Lesions
Skin & Subcutaneous Tissue t t t + t t t + a Hematopoietic System t t + t t t t t a
Ma1 ignan t Lymphoma x x 2 Lung t t t t t t t t 8
Alveologenic Adenoma X 1 Metastat ic Hepatocel lular Carcinoma x x X 3
L i v e r t t t t t t t t a Hepatocel lular Adenoma X 1 Hepatocel lular Carcinoma x x x x x x x 7
Pancreas + + + + + + + + a Stomach t t t t t t t t a Tongue + t t t t + t t 8 Kidney t t + t t t t t 8 P i t u i t a r y Gland + + + + + + + + a
Adenoma X 1 Thyroid Gland t t t + t t t t a
F o l l i c u l a r Ce l l Hyperplasia X 1 F o l l i c u l a r Ce l l Adenoma X 1
Parathyroid Gland t t t t t t t t a Adrenal Gland + + + + + + + + a Ovary t t + t t t t t a
c y s t i c X 1 Uterus t t t t t t t t a
Leiomyosarcoma X 1 Eye + + + + + + + + a Brain t t t t t t t t a
t Tissue examined x Lesions present
Polybrominated Biphenyl Mixture 90

TABLE 68.
INDIVIDUALANIMAL PATHOLOGY IN FEMALE MICE ADMINISTERED 3.0 mg POLYBROMINATED BIPHENYL MlXTURE/kg BODY WEIGHT IN CORN OIL BY GAVAGE
- (LIFETIME OBSERVATION)
Animal Number 7 0
4 8
3 9
0 0
6 9
3 9
4 5
5 2
4 1
5 2
5 3
6 1
3 7
3 5
6 9
5 5
6 3
-- 8 2 1 1 9 7 8 0 0 4 0 1 9 2 3 8 2 Total Weeks on Study
Skin E Subcutaneous TissueMarnary Gland Adenoma Cl i toral Gland Adenoma
-O 99 +
l 07 +
l 07 +
l 08 +
t 13 + X
l 16 +
l 18 + X
l 19 +
l 20 +
l 21 +
l 30 +
l 31 +
l 31 +
l 31 +
l 31 +
l 31 +
l 31
+
Tissue or
Lesions 171 1
Clitoral Gland Carcinoma X 1 LiposarcomaSal ivary Gland cystadenoma
Hematopoi etic System Malignant LymphomaSpleen, Mast Cell Tumor
HemangiomLung
+
+
+ X
+
+
+
+ X
+
+
+
+
+
+
+
+ X
+
+
+
X
+
+
+ X
+
+
+
+ x
+
+ x
+
X+
+
+
+
+ X
X+
1 1
17 6 1 1 17
Adenoma tos i sAlveologenic Adenoma Al veol ogenic Carcinoma Metastatlc Hepatocellular Carcinoma
Atypical Foci Hepatocellular Adenoma Hepatocellular Carcinoma
Liver
PancreasExocrine Cell Adenoma
X
+
+
+
+ X
+
+
+
+
+
+
+
+
+
+
+
+
X
X +
+
+
+
X +
+
+
+
X
+
+ X
*
+
X +
+
X
X
X
+
+
X
X
+
+
1 21 1
1 3
17 3
17 1
Kidney Pituitary Gland
Adenoma Thyroi d G1and
Follicular Cell HyperplasiaFoll icular Cell Adenoma
Parathyroid Gland
Stomach
Tongue
Islet Cell Adenoma Hyperplastic Gastropathy
+ ++ + +
+
+ ++ + +
+
+ ++ + +
+
+ ++ + +
+
+ ++ + + X+
+ ++ + +
+
+ ++ + +
+
+ ++ + + X+
+ ++ + +
+
+ ++ + x+
+
+ ++ + x+
+
+ ++ + x+
+
+ ++ + + x
+
+ ++ + x+ x
+
X+ ++ + x+
+
+ ++ + +
+
+ ++ + X+ X+
X
1 17 117 1717 617 2 317
Adrenal G1and Ovary
Brain
cystic Granulosa Cell Tumor Luteoma
CystadenomaLeiomyomaHemagiosarcoma
Harderlan Gland Adenoma
Uterus
Eye
+ +
+
+
+
+ +
+
X
+
+
+ +
+
X
+
+
+ +
+
+
+
+ +
+
+ X
+
+ +
+
+
+
+ +
+
+
+
+ +
+
+
+
+ +
+
+
+
+ +
+
X +
+
+ +
+
+
+
+ +
+
+
+
+ +
+
+
X
+
+ +
+
+
+
+ +
X +
+
*
+ +
+
x
+
+
+ +
+
x
+
X +
17 17
1 1 17 1 1 1 17 117
3
-+ Tissue examined x Lesions present
91 Polybrominated Biphenyl Mixture

INDIVIDUAL ANIMAL PATHOLOGY IN FEMALE MICE ADMINISTERED 1.0 mg POLYBROMINATED BIPHENYL MIXTURE/kg BODY WEIGHT IN CORN OIL BY GAVAGE
(LIFETIME OBSERVATION) 4 5 6 6 5 3 4 7 6 6 4
Antmal Number 0 1 3 4 3 6 1 0 1 5 8 4 3 1 3 8 7 4 6 6 4 3 Total
Weeks on Study 0 1
0 1
1 1
2 1
3 1
3 1
3 1
3 1
3 1
3 1
3 1
o r Ttssue
Skin & Subcutaneous Ttssue 7 t
9 t
3 t
1 t
0 t
1 t
1 t
1 t
1 t
1 t
1 t
Lesions 11
F i broadenom, Mamnary Gland F1 brosarcoma
X X
1 1
Hemangtoma Hematopoietic System
Mal tgnant Lymphoma Lung
Alveologentc Carcinoma Metastat ic Hepatocel lular Carctnoma
L tve r
+
t
x t
t X t
t
t
t
t
t X t
t
t
t
t
t X t
t
t
t
t
t
t
t
t
t
t
X t x t X
t
t x t
t
1 11 5
11 1 1
11 Hepatocel lular A d e n m Hepatocel lular C a r c t n m . Metastattc Lelomyosarcoh
Pancreas
X
t t X t t t
X
t t t t
X
t t
1 2 1
11 Stomach t t t t t t t t t t t 11
Ulcer X 1 TongueKidneyP i t u t t a r y Gland
Adenoma
t t t
t t o
t t t
t t t
t t t X
t t t
t t t
t t t
t t t
t t t X
t t t
11 11 10 2
Th r o t d Gland t t t t t t t t t t t 11
F o l l t c u l a r Ce l l Adenoma Parathyrotd Gland
HyperplastaAdrenal Gland
f o l l t c u l a r Ce l l Hyperplhsia
t
t
t
t
t
t
t
t
X t
t
t
t
t
+
X
t
t
t X t
t
t
t
t
1 11
1 11
1
OvaryGranulosa Cel l Tumor
t t t t t t t t t X
t t 11 1
Uterus t + t t t t t + t t t 11 Endometrtal Cyst t c Hyperplas t a LelomyosarcomaAdenocarct n m
X x x
X
2 1 1
EyeBrain
t +
o o
t t
t t
t t
t t
t t
t t
t t
+ t
t t
10 10
t Ttssue examined 0 Tissue not examtned x Lestons present
Polybrominated Biphenyl Mixture 92

TABLE B10.
INDIVIDUAL ANIMAL PATHOLOGY I N FEMALE MICE ADMINISTERED 0.3 mg POLYBROMINATED BIPHENYL MIXTURE/kg BODY WEIGHT IN CORN OIL BY GAVAGE
(LIFETIME OBSE RVATl ON)
Anlmal Number 5 8 2
3 6 8
0 0 2
5 8 4
6 5 3
6 2 3
5 5 1
3 5 8
4 8 6
3 9 2
4 6 5
6 7 4
6 7 5
3 0 3
5 7 9 Total
Weeks on Study
Skin & Subcutaneous Tissue Fibrosarcoma
Hematopoietic Sys tem Malignant Lymphoma
LungAdenomatosis Alveologenic Carcinoma
L i v e r Hepatocel lu lar Carcinoma Metas ta t i c Sarcoma
Pancreas Stomach
Ulcer Tongue KidneyP i t u i t a r y Gland
Thyroid Gland
Parat hyro l d G1andAdrenal Gland
Ovary
Uterus
Adenoma
F o l l i c u l a r Ce l l Hyperplasia
Pheochromocytoma
c y s t i c
0 a 4 t
t X t
t
t t
t t +
t
t t
t
t
1 o 2 t
t
t
t
t t X t t t
t
t t
t
t
1 0 6 t
t
t X
t X
t t
t t t
t
t t
t
t X
1 1 0 t
t
t
t
X t t
t t t
t
t t
t
t
1 1 1 t
t
t
t
t t
t t t
t
t t
t
t
X
1 1 4 t
t
t
t
X t t
t t t
t
t t
t
+
1 2 8 t
t
t
t
t t
t t t
t
t t
t
t
1 3 1 t
t x t
t
t t
t t t
t
t t
t
t
1 3 1 t
t x t
+
t +
t t t
t X t t
t
t
X
1 3 1 t
t x t
t
t t
t t t
t
t t X t
t
1 3 1 t
t
t
t
t +
t t t
t
t t
t
t
1 3 1 t
t
t
X t
t t
t t t
t
t t
t
t
x
1 3 1 t
t
t
t
t t
t t t
t X t t
t
t
x
X
1 3 1 t X t x t
t
t t
t t t
t
t t
t
t
1 3 1 t
t x t
t X
t t
t t t
t X t t
t
t
T i ssue Lesionsor
15 1
15 6
15 1 1
15 2 2
15 15 1
15 15 15 4
15 3
15 15 1
15
152
Endometrial Cyst ic Hyperplas l a Histiocytic Sarcoma Le i omyosarcoma Adenoma
EyeBra in
+ t
t t
t t
X X
t t
t t
X
t t
X
t t
X
X t t
t t
t t
t t
t t
t t
t t
t t
1 1 1
15 15
3
t fi
Tissue examined Lesions present
93 Polybrominated Biphenyl Mixture

TABLE B l l .
INDIVIDUAL ANIMAL PATHOLOGY IN FEMALE MICE ADMINISTERED 0.1 mg POLYBROMINATED BIPHENYL MIXTURE/kg BODY WEIGHT IN CORN OIL BY GAVAGE
(LIFETIME OBSERVATION) 4 6 4 5 6 6 3 4 6 7 5 5 5 6 4 5 3 4 6
Animal Number 4 4 7 7 7 4 9 9 1 0 9 1 0 7 2 1 9 4 8 0 6 0 8 1 2 5 1 0 2 5 6 3 7 7 0 9 1 2 Total
Weeks on Study 0 8
0 9
1 0
1 0
1 0
1 1
1 1
1 2
1 2
1 3
1 3
1 3
1 3
1 3
1 3
1 3
1 3
1 3
1 3
Tissue o r
Skin & Subcutaneous Tissue 5 t
5 t
1 t
4 t
4 t
3 t
9 t
1 t
5 t
1 t
1 t
1 t
1 t
1 t
1 t
1 t
1 t
1 t
1 t
Lesions 19
Adenoma, Mamnary Gland Fibrosarcoma
X X
X 2 1
Hematopoietic System Malignant Lymphoma
LungAlveologenic Adenoma Metastat ic Sarcoma
t
t
t x t
t x t
t
t
t
t
t
t
t x t
t x t
t
t
X
t
t
t
t
t
t
t X t
t
t
t
t
t
t
t
t
t
t
t X t X
19 6
19 1 1
L i v e r t t t t t t t t t t t t t t t t t t t 19 Atyp ica l Foci Hepatocel lular Adenoma Angiosarcoma Me tas t a tic sarcoma X
X X
X X
1 2 1 1
Pancreas t t t t t t t t t t t t t t t t t t t 19 Stomach t t t t t t t t t t t t t t t t t t t 19 TongueSmall I n t e s t i n e
t t
t t
t t
t t
t t
t t
t t
t t
t t
t t
t t
t t
t t
t t
t t
t t
t t
t t
t t
19 19
HemangiomaKidneyP i t u i t a r y Gland
Adenoma
t t
t t
t t
t t
t t
t t
t t
t t
t t
t t
t t
t t
t t
X t t
t t
t t
t t
t t
t t X
1 19 19
1 Thyroid Gland
F o l l i c u l a r Ce l l Hyperplasia Parathyroid Gland Adrenal Gland
t
t t
t
t t
t
t t
t
t t
t
t t
t
t t
t
t t
t
t t
t
t t
t
t t
t X t t
t
t t
t
t t
t
t t
t
t t
t
t t
t
t t
t
t t
t
t t
19 1
19 19
Ovaryc y s t i c
Uterus
t
t
t
t
t
t
t
t
t
t
t X t
t
t
t
t
t
t
t X t
t
t
t
t
t
t
t
t
t
t
t
t
t
t
t
t
t
t
19 2
19 Endometrial Cyst ic Hyperplasia Myxoma
EyeBrain
X
t t
t t
t t
t t
X
t t
t t
t t
X
t t
t t
t t
X t t
t t
t t
X
t t
t t
t t
t t
t t
t t
4 1
19 19
Metastat ic Sarcoma X 1
t Tissue examined x Lesions present
Polybrominated Biphenyl Mixture 94

TABLE 812.
INDIVIDUAL ANIMAL PATHOLOGY IN CONTROL FEMALE MICE ADMINISTERED 0 mgPOLYBROMINATED BIPHENYL MIXTURE/kg BODY WEIGHT IN CORN OIL BY GAVAGE
(LIFETIME OBSERVATION)
4 6 3 6 3 5 3 6 3 4 6 5 4 Animal Number 3 9 6 2 6 0 0 0 0 2 7 6 6
9 1 0 0 7 7 6 8 2 8 2 7 4 T o t a l Weeks on Study 0 0 1 1 1 1 1 1 1 1 1 1 1 Tissue
8 9 0 1 1 1 1 2 2 3 3 3 3 o r 4 7 4 2 3 6 6 1 1 1 1 1 1 Lesions
Skin II Subcutaneous Tissue t t t t t t t t t t t t t 13 Mamnary G1 and Adenoma X 1 Fibrosarcoma X 1
Hematopoietic System t t t t t t t t t t t t t 13 Malignant Lymphoma X x x x x x x x x x 10
Lung t t t t t t t t t t t t t 13 L i ve r t t t t t t t t t t t t t 13 Pancreas t t t t t t t t t t t t t 13
I s l e t Ce l l Adenoma X 1 Stomach t t t t t t t t t t t t t 13 Tongue t t t t t t t t t t t t t 13 Kidney t + t t t t t t t t t t t 13
Hemangioma X 1 P i t u i t a r y Gland t t t t t t t t t t t t t 13
Adenoma X x x X 4 Thyroid Gland t t t t t t t t t t t t t 13 Parathyroid Gland t t t t t t t t t t t t t 13
Adenoma X 1 Adrenal G1and t t t + t t t t t t t t t 13 Ovary t t t t t t t t t t t t t 13
cys t X X 2 Uterus t t t t t t t t t t t t t 13
Endometrial Cyst lc Hyperplasia X X 2 Hemangioma X 1
Eye t t t t t t t t t t t t t i jHarderian Gland Adenoma X X 2
Bra in t t t t t t t t t t t t t 13 Astrocytoma X 1
t Tissue examined x Lesions present
95 Polybrominated Biphenyl Mixture

Polybrominated Biphenyl Mixture 96
APPENDIX C SUMMARY OF THE INCIDENCE OF LESIONS IN RATS AND
MICE ADMINISTERED POLYBROMINATED BIPHENYL MIXTURE IN CORN OIL BY GAVAGE
(LIFETIME OBSERVATION)
91 Polybrominated Biphenyl Mixture
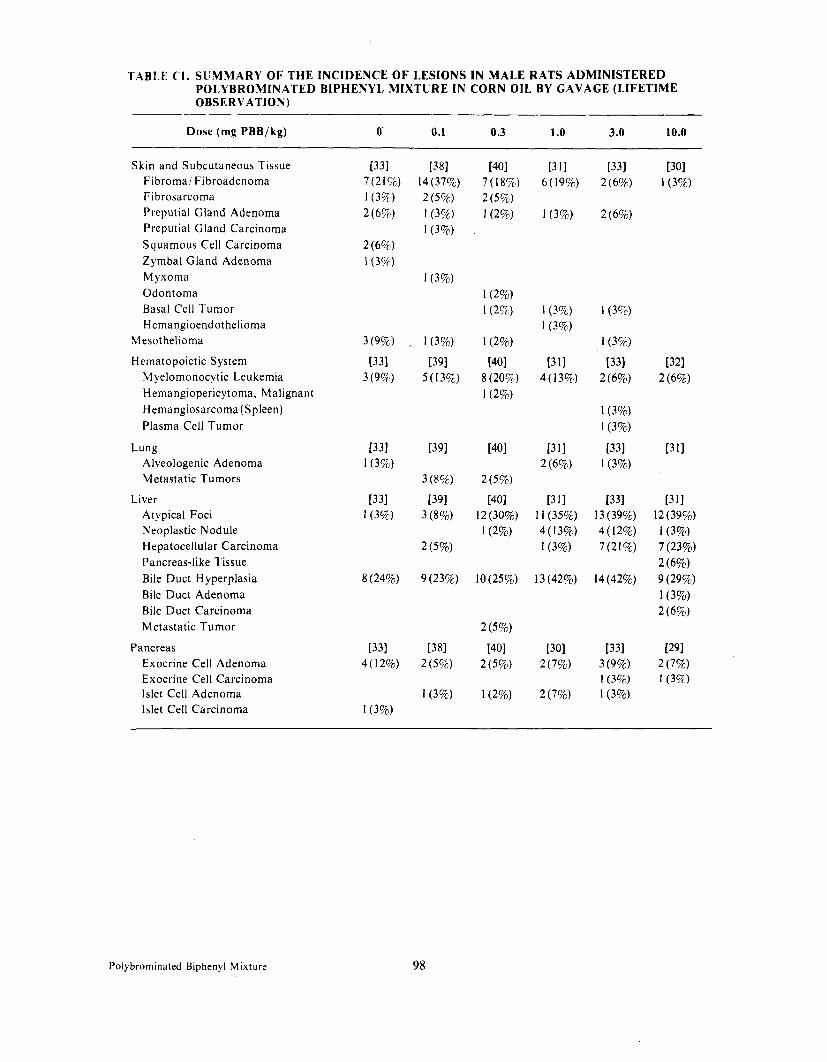
TAB1.E C l , SUMMARY O F THE INCIDENCE O F LESIONS IN MALE RATS ADMINISTERED POLYBROMINATED BIPHENYL MIXTURE IN CORN OIL BY GAVAGE (LIFETIME OBSERVATION)
Dose (mg PBB/kg) 0 0.1 0.3 1.O 3.0 10.0
Skin and Subcutaneous Tissue Fibroma1 Fibroadenoma Fibrosarcoma Preputial Gland Adenoma Preputial Gland Carcinoma
2 (6%)
Squamous Cell Carcinoma Zymbal Gland Adenoma Myxoma Odontoma Basal Cell Tumor Hemangioendothelioma
Mesothelioma
Hematopoietic System Myelomonocytic Leukemia Hemangiopericyt oma. M alignant Hemangiosarcoma (Spleen) Plasma Cell Tumor
Lung Alveologenic Adenoma Metastatic Tumors
Liver Atypical Foci Neoplastic Nodule Hepatocellular Carcinoma Pancreas-like Tissue Bile Duct Hyperplasia Bile Duct Adenoma Bile Duct Carcinoma Metastatic Tumor
Pancreas Exocrine Cell Adenoma Exocrine Cell Carcinoma Islet Cell Adenoma Islet Cell Carcinoma
Polybrominated Biphenyl Mixture 98

TABLE C l . SUMMARY OF THE INCIDENCE OF LESIONS IN MALE RATS ADMINISTERED POLYBROMINATED BIPHENYL MIXTURE IN CORN OIL BY GAVAGE (LIFETIME OBSERVATION) (Continued)
Dose (mg PBB/kg) 0 0.1 0.3 1.0 3.0 i0.0
Stomach Ulcer Hyperplastic Gastropathy
Tongue Squamous Cell Papilloma
Kidney Chronic Progressive Nephropathy Adenoma Transitional Cell Carcinoma Liposarcoma
Pituitary Gland Adenoma Carcinoma
Thyroid Gland Follicular Cell Adenoma Follicular Cell Carcinoma C-cell Hyperplasia C-cell Adenoma C-cell Carcinoma
Parathyroid Gland Hyperplasia Adenoma
Adrenal Gland Cortical Hyperplasia Cortical Adenoma Pheochromocytoma
Testes Leydig Cell Tumor
Ear Inflammation, Tympanic Bullae
Brain Astrocytoma
[ 1: Number of animals with tissue examined microscopically.
99 Polybrominated Biphenyl Mixture

10.0
TABLE C2. SUMMARY OF THE INCIDENCE OF LESIONS IN FEMALE RATS ADMINISTERED POLYBROMINATED BIPHENYL MIXTURE IN CORN OIL BY GAVAGE (LIFETIME OBSERVATION)
Dose (mg PBB/kg) 0 0.1 0.3 1.o 3.0
Skin and Subcutaneous Tissue Mammary Gland Fibroadenoma Mammary Gland Carcinoma Zymbal Gland Adenoma Zymbal Gland Carcinoma Clitoral Gland Adenoma Epidermal Cyst Rhabdomyosarcoma Fibroma Fibrosarcoma Hemangioma Basal Cell Tumor
Hematopoietic System Myelomonocytic Leukemia Spleen, Metastatic Granulosa
Cell Tumor Spleen, Metastatic Fibrosarcoma
Lung Alveologenic Adenoma Metastatic Carcinoma Metastatic Fibrosarcoma
Liver Atypical Foci Neoplastic Nodule Hepatocellular Carcinoma Pancreas-like Tissue Bile Duct Hyperplasia Bile Duct Carcinoma Metastatic Myxosarcoma
Pancreas
Stomach Ulcer Hyperplastic Gastropathy
Polybrominated Biphenyl Mixture IO0

TABLE C2. SUMMARY OF THE INCIDENCE O F LESIONS IN FEMAL,E RATS ADMINISTERED POLYBROMINATED BIPHENYL MIXTURE IN CORN OIL BY GAVAGE (LIFETIME OBSERVATION) (Continued)
Dose (mg PBB/kg) 0 0.1 0.3 1.O 3.0 10.0
Tongue Squamous Cell Papilloma
K id ney Chronic Progressive Nephropathy Tubular Cell Adenoma Tubular Cell Hyperplasia Metastatic Fibrosarcoma Metastatic Ovarian Carcinoma
Pituitary Gland Adenoma Carcinoma
Thyroid Gland C-cell Hyperplasia C-cell Adenoma C-cell Carcinoma Follicular Cell Carcinoma
Parathyroid Gland Hyperplasia Adenoma
Adrenal Gland Cortical Hyperplasia Cortical Adenoma Pheochromocytoma
Ovary cyst Granulosa Cell Tumor Carcinoma
Uterus Endometrial Cyst Adenoma Carcinoma Adenocarcinoma Polyp Myxoma Hemangioma Deciduoma Endometrial Cystic Hyperplasia
101 Polybrominated Biphenyl Mixture

10.0
TABLE C2. SUMMARY O F THE INCIDENCE O F LESIONS IN FEMALE RATS ADMINISTERED POLYBROMINATED BIPHENYL MIXTURE IN CORN OIL BY GAVAGE (LIFETIME OBSERVATION) (Continued)
Dose (mg PBB/kg) 0 0.1 0.3 1.o 3.0
Vagina Myxosarcoma Polyp
Brain Astrocytoma
[ 1: Number of animals with tissue examined microscopically.
Polybrominated Biphenyl Mixture I02

TABLE C3. SUMMARY OF THE INCIDENCE OF LESIONS IN MALE MICE ADMINISTERED POLYBROMINATED BIPHENYL MIXTURE IN CORN 011, BY GAVAGE (LIFETIME OBSERVATION)
Dose (mg PBB/kg) 0 0.1 0.3 1.o 3.0 10.0
Skin and Subcutaneous Tissue Fibrosarcoma Fibroma Rhabdomyosarcoma Preputial Gland Carcinoma Preputial Gland Adenoma Schwanoma ,
Leiomyosarcoma Hemangioma Basal Cell Tumor Xanthoma
Hematopoietic System Malignant Lymphoma Hemangioma, Spleen Hemangiosarcoma, Spleen
Lung Alveologenic Carcinoma Alveologenic Adenoma Metastatic Hepatocellular Carcinoma Adenomatosis Metastatic Fibrosarcoma
Liver Hepatocellular Adenoma Hepatocellular Carcinoma Hepatoblastoma Bile Duct Carcinoma Hemangiosarcoma Metastatic Carcinoma Atypical Foci Histiocytic Sarcoma
Pancreas Islet Cell Adenoma
Stomach Hyperplastic Gastropathy
I03 Polybrominated Biphenyl Mixture

10.0
TABLE C3.SUMMARY O F THE INCIDENCE O F LESIONS IN MALE MICE ADMINISTERED POLYBROMINATED BIPHENYL MIXTURE IN CORN 011, BY GAVAGE (LIFETIME OBSERVATION) (Continued)
Dose (mg PBB/kg) 0 0.1 0.3 1.o 3.0
Tongue
Kidney Adenoma Carcinoma
Pituitary Gland Adenoma
Thyroid Gland Follicular Cell Hyperplasia Follicular Cell Adenoma
Parathyroid Gland Adenoma
Adrenal Gland Cortical Adenoma Cortical Carcinoma Pheochromocytoma
Small Intestine Adenocarcinoma Lipoma Adenoma Hemangioma
Large Intestine Carcinoma Adenocarcinoma
Testes
Eye Harderian Gland Adenoma
Brain Epidermal Cyst
[ 1: Number of animals with tissue examined microscopically.
Polybrominated Biphenyl Mixture I04

TABLE C4. SUMMARY O F THE INCIDENCE O F LESIONS IN FEMALE MICE ADMINISTERED POLYBROMINATED BIPHENYL MIXTURE IN CORN OIL BY GAVAGE (LIFETIME OBSERVATION)
Dose(mg PBB/kg) 0 0.1 0.3 1.o 3.0 10.0
Skin and Subcutaneous Tissue Mammary Gland Adenoma Mammary Gland Fibroadenoma Clitoral Gland Carcinoma Clitoral Gland Adenoma Salivary Gland Cystadenoma Liposarcoma Fibrosarcoma Hemangioma
Hematopoietic System Malignant Lymphoma Spleen, Mast Cell Tumor Hemangioma
Lung Alveologenic Adenoma Alveologenic Carcinoma Adenomatosis Metastatic Hepatocellular Carcinoma Metastatic Sarcoma
Liver Atypical Foci Hepatocellular Adenoma Hepatocellular Carcinoma Metastatic Sarcoma Metastatic Leiomyosarcoma . Angiosarcoma
Pancreas Exocrine Cell Adenoma Met Cell Adenoma
Stomach Ulcer Hyperplastic Gastropathy
105 Polybrominated Biphenyl Mixture

10.0
TABLE C4. SUMMARY O F THE INCIDENCE O F LESIONS IN FEMALE MICE ADMINISTERED POLYBROMINATED BIPHENYL MIXTURE IN CORN OIL BY GAVAGE (LIFETIME OBSERVATION) (Continued)
Dose (mg PBB/ kg) 0 0.1 0.3 1.o 3 .O
Tongue
Kidney Hemangioma
Pituitary Gland Adenoma
Thyroid Gland Follicular Cell Hyperplasia Follicular Cell Adenoma
Parathyroid Gland Hyperplasia Adenoma
Adrenal Gland Pheochromocytoma
Small Intestine Hemangioma
Ovary Cystic Granulosa Cell Tumor Luteoma
Uterus Endometrial Cystic Hyperplasia Hemangioma Myxoma Histiocytic Sarcoma Leiomyosarcoma Adenoma Adenocarcinoma Cystadenoma Leiomyoma Hemangiosarcoma
Eye Harderian Gland Adenoma
Brain Astrocytoma Metastatic Sarcoma
[ 1: Number of animals with tissue examined microscopically.
* U . S . GOVERNMENT PRINTING OFFICE: 1983-381-132:3143
Polybrominated Biphenyl Mixture 106