transmission and distribution implementation of phasor … · 2014-06-17 · transmission and...
TRANSCRIPT
energize - June 2014 - Page 32
TRANSMISSION AND DISTRIBUTION
Phasor measurement unit (PMU) technology has come to the forefront in terms of smart measurement of the power system in general because it provides accurate, high resolution monitoring of important analysis metrics.
Eskom initiated a project for the installation of PMU modules and substation-class p h a s o r d a t a c o n c e n t r a t o r ( P D C ) equipment at 15 key substations. This included the installation of the PDC, the synchronised measurements historian, an interface to the energy management system (EMS), and visualisation and stability applications at the national control centre (NCC). The project covered the short term requirements but has been engineered to meet future requirements as well. It has completed the factory acceptance test for the control centre’s wide area measurement system (WAMS) application and substation equipment. The installation of the PMU modules is currently in progress. The integrated site acceptance test will commence after Eskom has completed PMU installations at eight substations. The future WAMS scope includes an increase in coverage of critical nodes in the network to install a total of 52 substations.
PMU measurement technology
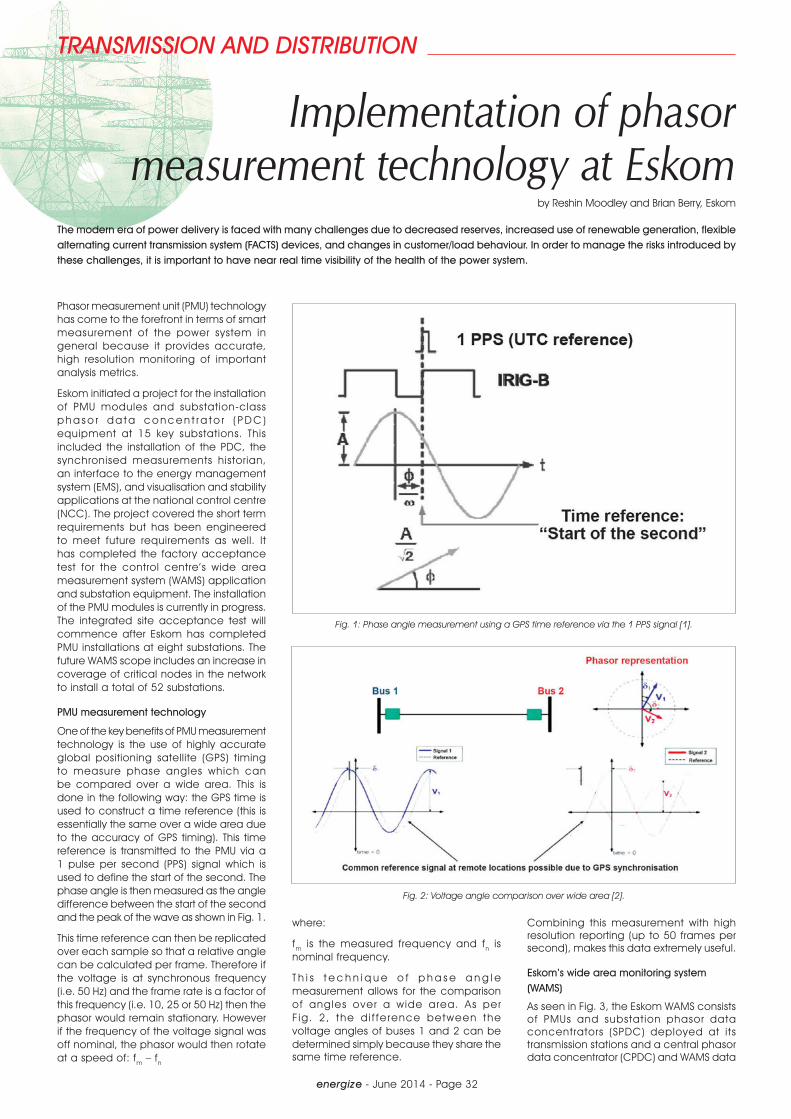
One of the key benefits of PMU measurement technology is the use of highly accurate global positioning satellite (GPS) timing to measure phase angles which can be compared over a wide area. This is done in the following way: the GPS time is used to construct a time reference (this is essentially the same over a wide area due to the accuracy of GPS timing). This time reference is transmitted to the PMU via a 1 pulse per second (PPS) signal which is used to define the start of the second. The phase angle is then measured as the angle difference between the start of the second and the peak of the wave as shown in Fig. 1.
This time reference can then be replicated over each sample so that a relative angle can be calculated per frame. Therefore if the voltage is at synchronous frequency (i.e. 50 Hz) and the frame rate is a factor of this frequency (i.e. 10, 25 or 50 Hz) then the phasor would remain stationary. However if the frequency of the voltage signal was off nominal, the phasor would then rotate at a speed of: fm – fn
where:
fm is the measured frequency and fn is nominal frequency.
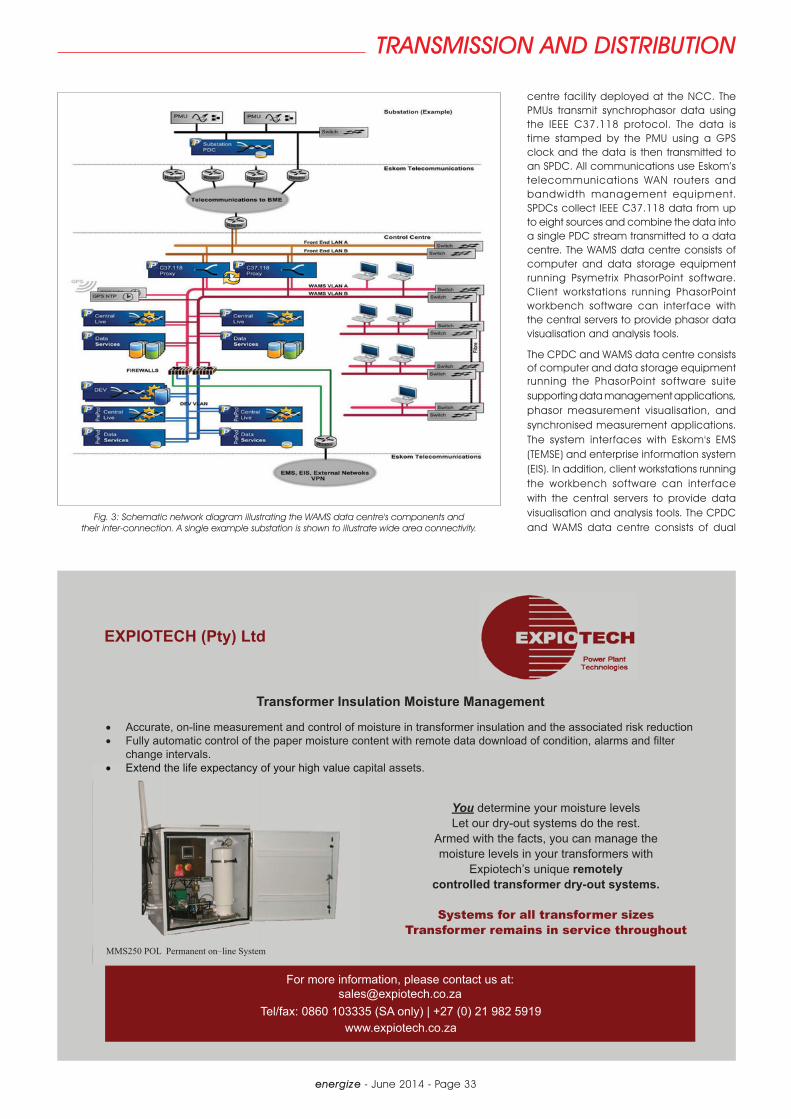
T h i s t e c h n i q u e o f p h a s e a n g l e measurement allows for the comparison of angles over a wide area. As per F ig. 2, the d i f fe rence between the voltage angles of buses 1 and 2 can be determined simply because they share the same time reference.
Combining this measurement with high resolution reporting (up to 50 frames per second), makes this data extremely useful.
Eskom’s wide area monitoring system (WAMS)
As seen in Fig. 3, the Eskom WAMS consists of PMUs and substation phasor data concentrators (SPDC) deployed at its transmission stations and a central phasor data concentrator (CPDC) and WAMS data
Implementation of phasor measurement technology at Eskom
by Reshin Moodley and Brian Berry, Eskom
The modern era of power delivery is faced with many challenges due to decreased reserves, increased use of renewable generation, flexible alternating current transmission system (FACTS) devices, and changes in customer/load behaviour. In order to manage the risks introduced by these challenges, it is important to have near real time visibility of the health of the power system.
Fig. 1: Phase angle measurement using a GPS time reference via the 1 PPS signal [1].
Fig. 2: Voltage angle comparison over wide area [2].
energize - June 2014 - Page 33
TRANSMISSION AND DISTRIBUTION
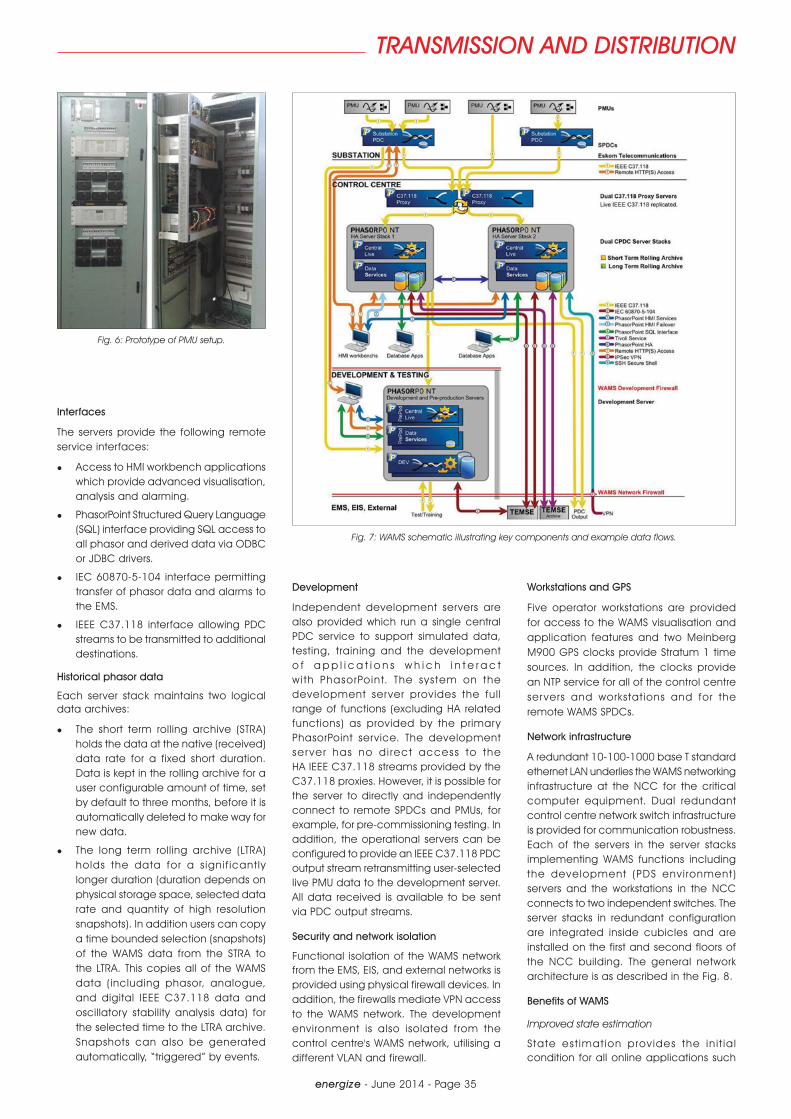
centre facility deployed at the NCC. The PMUs transmit synchrophasor data using the IEEE C37.118 protocol. The data is time stamped by the PMU using a GPS clock and the data is then transmitted to an SPDC. All communications use Eskom’s telecommunications WAN routers and bandwidth management equipment. SPDCs collect IEEE C37.118 data from up to eight sources and combine the data into a single PDC stream transmitted to a data centre. The WAMS data centre consists of computer and data storage equipment running Psymetrix PhasorPoint software. Client workstations running PhasorPoint workbench software can interface with the central servers to provide phasor data visualisation and analysis tools.
The CPDC and WAMS data centre consists of computer and data storage equipment running the PhasorPoint software suite supporting data management applications, phasor measurement visualisation, and synchronised measurement applications. The system interfaces with Eskom's EMS (TEMSE) and enterprise information system (EIS). In addition, client workstations running the workbench software can interface with the central servers to provide data visualisation and analysis tools. The CPDC and WAMS data centre consists of dual
Fig. 3: Schematic network diagram illustrating the WAMS data centre's components and their inter-connection. A single example substation is shown to illustrate wide area connectivity.
Transformer Insulation Moisture Management
Accurate, on-line measurement and control of moisture in transformer insulation and the associated risk reduction Fully automatic control of the paper moisture content with remote data download of condition, alarms and lter
change intervals.Extend the life expectancy of your high value capital assets.Extend the life expectancy of your high value ca
You determine your moisture levelsLet our dry-out systems do the rest.
Armed with the facts, you can manage the moisture levels in your transformers with
Expiotech’s unique remotely controlled transformer dry-out systems.
Systems for all transformer sizes Transformer remains in service throughout
For more information, please contact us at: [email protected]
www.expiotech.co.zaTel/fax: 0860 103335 (SA only) | +27 (0) 21 982 5919
EXPIOTECH (Pty) Ltd
MMS250 POL Permanent on–line System

energize - June 2014 - Page 34
TRANSMISSION AND DISTRIBUTION
Fig. 5: Three panel scheme design incorporating eight PMUs.
Fig. 4: Substation architecture – communications.
redundant mirrored servers, providing a highly available data storage and processing facility.
Substation architecture
WAMS commun ica t ions w i t h i n t he substation between the PMUs and the SPDC operates via a dedicated network switch as shown in Fig. 4. The infrastructure supports up to eight PMUs connected to an
SPDC. PMUs and the SPDC are allocated IP addresses and communications between devices is mediated by the IEEE C37.118 protocol over TCP/IP. At the substation, SPDCs cache all received IEEE C37.118 stream data. This provides a short term data repository (seven days) that permits data to be retrieved directly from the substation if required.
Production scheme design
Each production scheme consists of two portions:
Common services items such as the DC secure supply (chop over) system, sPDC, GPS, auxil iar y relays, global MCBs and the cubicle (panel) itself.
PMU module items including the Alstom Grid MiCOM P847B, PK-2 test blocks, PMU-specific MCBs and a voltage transformer selection scheme.
Eskom’s specification for the WAMS requires up to eight PMUs communicating with the WAMS control centre through one SPDC. The design drawings, exploiting the modular concept, incorporate eight PMU modules in three panels as shown in Fig. 5.
A 48U PMU panel accommodates a maximum of three PMU modules (capacity for twelve sets of currents, and three sets of voltages). The synchronising unit has one IRIG-B BNC output and 4 x 1 PPS outputs and it is able to synchronise up to four PMUs.
Control centre
High availability
A robust, highly available (HA), control centre architecture is provided. The core phasor processing, analysis, visualisation and storage functions are duplicated across two PhasorPoint HA server stacks. Each stack consists of two servers. In addition, two C37.118 proxy servers ensure a robust duplication of identical data streams to each server stack. The server stacks operate as a mirrored redundant pair, both processing and analysing the identical data streams provided via the proxy servers.
Each consists of multiple servers operating together in a functional ly integrated server stack. The two server stacks are located on different floors of the NCC and operate together to maximise both the integri ty and accessibi l i ty of the WAMS data collection, analysis and event notifications. A single server stack operates as the master server affording workbench and CPDC configuration. In the event of single server failure, no data is lost as both servers receive and store the stream data. In addition, workbench clients connected to the failed server detect the service interruption and migrate to the available server.
Once the failed server is operational, recover y i s automat ica l l y in i t ia ted, synchronis ing the conf igurat ion and restoring missing stream and processed data from the operational server. The two server stacks continuously monitor each other. If one server stack becomes functionally unavailable, an associated event is created on the pair server.
energize - June 2014 - Page 35
TRANSMISSION AND DISTRIBUTION
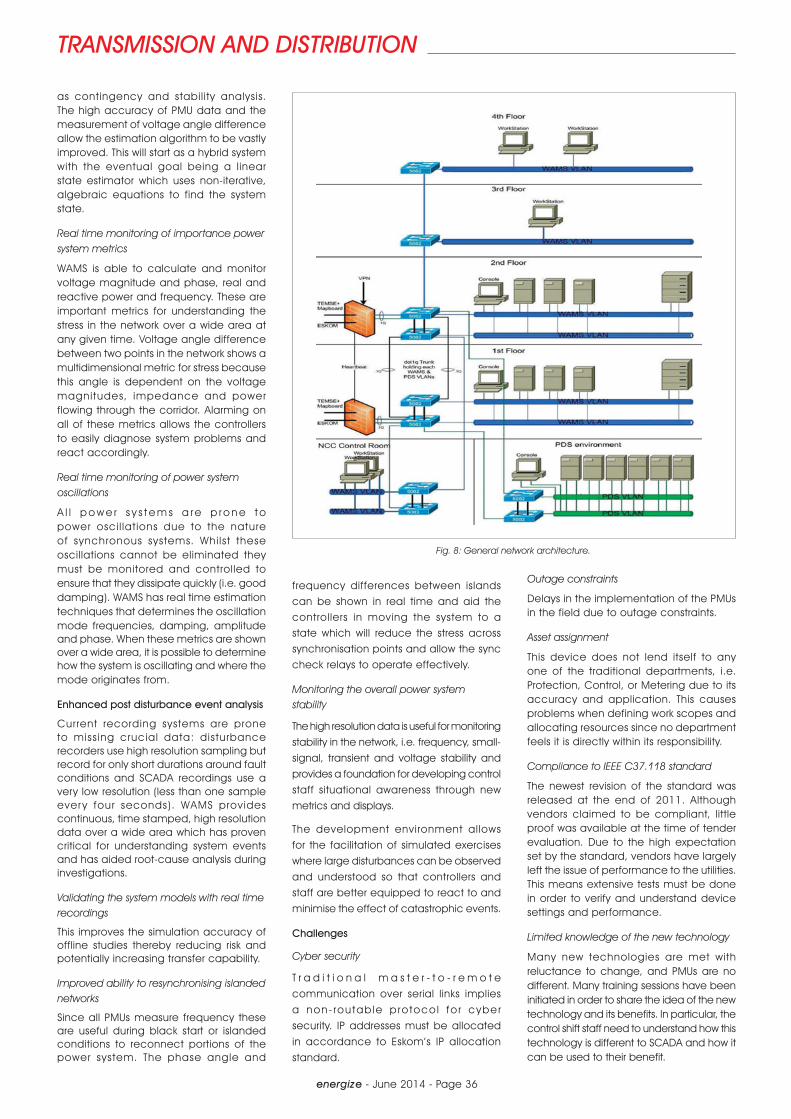
Fig. 6: Prototype of PMU setup.
Fig. 7: WAMS schematic illustrating key components and example data flows.
Interfaces
The servers provide the following remote service interfaces:
Access to HMI workbench applications which provide advanced visualisation, analysis and alarming.
PhasorPoint Structured Query Language (SQL) interface providing SQL access to all phasor and derived data via ODBC or JDBC drivers.
IEC 60870-5-104 interface permitting transfer of phasor data and alarms to the EMS.
IEEE C37.118 interface allowing PDC streams to be transmitted to additional destinations.
Historical phasor data
Each server stack maintains two logical data archives:
The short term rolling archive (STRA) holds the data at the native (received) data rate for a fixed short duration. Data is kept in the rolling archive for a user configurable amount of time, set by default to three months, before it is automatically deleted to make way for new data.
The long term rolling archive (LTRA) holds the data for a s ignif icantly longer duration (duration depends on physical storage space, selected data rate and quantity of high resolution snapshots). In addition users can copy a time bounded selection (snapshots) of the WAMS data from the STRA to the LTRA. This copies all of the WAMS data (including phasor, analogue, and digital IEEE C37.118 data and oscillatory stability analysis data) for the selected time to the LTRA archive. Snapshots can also be generated automatically, “triggered” by events.
Development
Independent development servers are also provided which run a single central PDC service to support simulated data, testing, training and the development o f a p p l i c a t i o n s w h i c h i n t e r a c t wi th PhasorPoint. The system on the development server provides the ful l range of functions (excluding HA related functions) as provided by the primary PhasorPoint service. The development ser ver has no d i rect access to the HA IEEE C37.118 streams provided by the C37.118 proxies. However, it is possible for the server to directly and independently connect to remote SPDCs and PMUs, for example, for pre-commissioning testing. In addition, the operational servers can be configured to provide an IEEE C37.118 PDC output stream retransmitting user-selected live PMU data to the development server. All data received is available to be sent via PDC output streams.
Security and network isolation
Functional isolation of the WAMS network from the EMS, EIS, and external networks is provided using physical firewall devices. In addition, the firewalls mediate VPN access to the WAMS network. The development environment is also isolated from the control centre's WAMS network, utilising a different VLAN and firewall.
Workstations and GPS
Five operator workstations are provided for access to the WAMS visualisation and application features and two Meinberg M900 GPS clocks provide Stratum 1 time sources. In addition, the clocks provide an NTP service for all of the control centre servers and workstat ions and for the remote WAMS SPDCs.
Network infrastructure
A redundant 10-100-1000 base T standard ethernet LAN underlies the WAMS networking infrastructure at the NCC for the critical computer equipment. Dual redundant control centre network switch infrastructure is provided for communication robustness. Each of the servers in the server stacks implementing WAMS functions including the development (PDS envi ronment) servers and the workstations in the NCC connects to two independent switches. The server stacks in redundant configuration are integrated inside cubicles and are installed on the first and second floors of the NCC building. The general network architecture is as described in the Fig. 8.
Benefits of WAMS
Improved state estimation
State est imat ion prov ides the in i t ia l condition for all online applications such
energize - June 2014 - Page 36
TRANSMISSION AND DISTRIBUTION
Fig. 8: General network architecture.
as contingency and stabil ity analysis. The high accuracy of PMU data and the measurement of voltage angle difference allow the estimation algorithm to be vastly improved. This will start as a hybrid system with the eventual goal being a linear state estimator which uses non-iterative, algebraic equations to find the system state.
Real time monitoring of importance power system metrics
WAMS is able to calculate and monitor voltage magnitude and phase, real and reactive power and frequency. These are important metrics for understanding the stress in the network over a wide area at any given time. Voltage angle difference between two points in the network shows a multidimensional metric for stress because this angle is dependent on the voltage magnitudes, impedance and power flowing through the corridor. Alarming on all of these metrics allows the controllers to easily diagnose system problems and react accordingly.
Real time monitoring of power system oscillations
A l l p o w e r s y s t e m s a r e p r o n e t o power osci l lat ions due to the nature of synchronous systems. Whi lst these oscillations cannot be eliminated they must be monitored and controlled to ensure that they dissipate quickly (i.e. good damping). WAMS has real time estimation techniques that determines the oscillation mode frequencies, damping, amplitude and phase. When these metrics are shown over a wide area, it is possible to determine how the system is oscillating and where the mode originates from.
Enhanced post disturbance event analysis
Current recording systems are prone to missing crucial data: disturbance recorders use high resolution sampling but record for only short durations around fault conditions and SCADA recordings use a very low resolution (less than one sample ever y four seconds). WAMS provides continuous, time stamped, high resolution data over a wide area which has proven critical for understanding system events and has aided root-cause analysis during investigations.
Validating the system models with real time recordings
This improves the simulation accuracy of offline studies thereby reducing risk and potentially increasing transfer capability.
Improved ability to resynchronising islanded networks
Since all PMUs measure frequency these are useful during black start or islanded conditions to reconnect portions of the power system. The phase angle and
frequency differences between islands can be shown in real time and aid the controllers in moving the system to a state which will reduce the stress across synchronisation points and allow the sync check relays to operate effectively.
Monitoring the overall power system stability
The high resolution data is useful for monitoring stability in the network, i.e. frequency, small-signal, transient and voltage stability and provides a foundation for developing control staff situational awareness through new metrics and displays.
The development environment allows for the facilitation of simulated exercises where large disturbances can be observed and understood so that controllers and staff are better equipped to react to and minimise the effect of catastrophic events.
Challenges
Cyber security
T r a d i t i o n a l m a s t e r - t o - r e m o t e
communication over serial links implies
a non- rou tab le p ro toco l fo r cyber
security. IP addresses must be allocated
in accordance to Eskom’s IP allocation
standard.
Outage constraints
Delays in the implementation of the PMUs in the field due to outage constraints.
Asset assignment
This device does not lend itself to any one of the traditional departments, i.e. Protection, Control, or Metering due to its accuracy and application. This causes problems when defining work scopes and allocating resources since no department feels it is directly within its responsibility.
Compliance to IEEE C37.118 standard
The newest revision of the standard was released at the end of 2011. Although vendors claimed to be compliant, little proof was available at the time of tender evaluation. Due to the high expectation set by the standard, vendors have largely left the issue of performance to the utilities. This means extensive tests must be done in order to verify and understand device settings and performance.
Limited knowledge of the new technology
Many new technologies are met with reluctance to change, and PMUs are no different. Many training sessions have been initiated in order to share the idea of the new technology and its benefits. In particular, the control shift staff need to understand how this technology is different to SCADA and how it can be used to their benefit.
energize - June 2014 - Page 37
TRANSMISSION AND DISTRIBUTION
Short term 1 – 3 years Medium term 3 – 5 years Long term > 5 years
Situational awareness – advanced visualisation tools
Advanced situational awareness applications
State measurement (linear)
Post mortem analysisModel benchmarking: Parameter estimation (dynamic)
Real-time control
State estimation (improve) State estimation (hybrid system) Adaptive protection
Model benchmarking: Parameter estimation (Steady state/dynamic)
Advanced stability monitoring applications
WA stabilisations (WA-PSS)
Power system restorationPlanned power-system separation – special protection systems
Voltage stability monitoring
Small signal stability monitoring applications
Table 1: Eskom's short, medium, and long term requirements.
Future WAMS scope
PMUs at more substations will result in more visualisation to support the real time grid operators. Ultimately the network should have a linear state estimator which uses only PMU data to provide full visibility. To achieve this, 33% of the transmission network will require PMUs.
The intention is to increase coverage of critical nodes in the network by installing WAMS in a total of 52 substations. This will result in:
More advanced situational awareness and stability in monitoring applications
Adding new EMS applications to fully exploit PMU data
Integrating the PMU functionality with the protection relay
The use o f synchrophasor s and IEC 61850 data
The development of protective control schemes which dynamically adapt to current power system conditions, thereby preserving the integrity of the power system grid as an entity.
The implementation and acquisition of phasor measurements data is predicated on the following requirements as per Table 1 over the short, medium and long term.
Conclusion
After the successful completion of a number of research projects, Eskom realised the benefits of phasor measurement technology and is currently in the process of installing 59 PMUs in transmission substations
as part of phase 1 of the WAMS project. PMU technology is not a replacement to the traditional SCADA system but complements it. The phasor measurements data with its advanced visualisation features and early detection of abnormal events, will be used to enhance the control staff decision making allowing the staff to move from a purely reactive response mode to a predictive and proactive process. The WAMS applications provide powerful tools to improve power system security and ensure we march towards a smarter grid.
Acknowledgement
This paper was presented at the Distributech Africa conference 2014 and is republished here with permission.
References[1] IEEE Power System Relaying Committee: "IEEE
Standard for Synchrophasor Measurements for Power Systems", 2011.
[2] North American SynchroPhasor Initiative Performance and Standards Task Team: "PMU System Testing and Calibration Guide”, 2007.
[3] Alstom grid and Psymetrix: "Eskom WAMS System Design Report".
[4] Alstom grid and Psymetrix: "Eskom WAMS Control Centre Detailed Design".
[5] Alstom grid and Psymetrix: "Eskom WAMS Control Centre Functional Specification".
[6] Alstom grid and Psymetrix: "Eskom WAMS Substation Detailed Design".
Contact Reshin Moodley, Eskom, Tel 011 871-2557, [email protected]