unit 5 - liam lee
TRANSCRIPT

Unit 5 Research Project
Worthing College Sports ScienceLiam Lee
2015

‘To investigate the affect of premiership standard back 5 forward height and the amount of lineouts won per game.’
P2: Carry out / P4: Produce
Abstract
The aim of the study was to investigate the relationship between the height of the starting back five forwards in elite level male rugby and their lineout success rate. The study had a sample size of around 80 male professional rugby players who were involved in the Aviva rugby premiership season between 2014-2015. the data for the study was collected using the Aviva rugby premiership website. The data collected was shown using excel on a spearmint rank order correlation and on a scatter graph. The results on the spearmint correlation showed that there was very little correlation between the height and lineout success rate. One thing to look into in the future would be the hookers throwing technique and if it affects accuracy and another would be to look at the height of the lifters in the lineout as they can have a huge part on the height of the lift.
P2: Carry out / P4: Produce
Contents: GeneralPage 3 – Aim Page 4 – Abstract Page 5 – General contents Page 6 – Contents appendices Page 7 – Contents figures and tables Page 8 – Acknowledgments Page 9 – IntroductionPage 10 – Literature review and references Page 11 – Project hypothesis Page 12 – Method Page 13 – Data collectionPage 14 – Data analysis Page 15 – Results Page 16 – Discussion Page 17 – ConclusionPage 18 – Assessment criteria page 19-26Page 19 – Review 1/3Page 20 – Review 2/3Page 21 – Review 3/3Page 22 – Future recommendations 1/5Page 23 – Future recommendations 2/5Page 24 – Future recommendations 3/5Page 25 - Future recommendations 4/5Page 26 - Future recommendations 5/5
P2: Carry out / P4: Produce

Contents: Appendices
Page 27 – Research project appendices Page 28 - Appendix 1 Page 29 - Appendix 2Page 30 - Appendix 3Page 31 - Appendix 4 Page 32 - Appendix 5
P2: Carry out / P4: Produce
Contents: Figures and Tables
Page 33 - Research project figures and tables Page 34 - Figures and tables 1/5Page 35 - Figures and tables 2/5Page 36 - Figures and tables 3/5Page 37 - Figures and tables 4/5Page 38 - Figures and tables 5/5
P2: Carry out / P4: Produce

Acknowledgements
• I would like to thank my peers who have given me advice throughout my project.
• I would also like to thank my teachers Mark Sambrook and Paul Cox for their advice and guidance throughout my project.
P2: Carry out / P4: Produce
Introduction
My project is ‘To investigate the affect of premiership standard back 5 forward height and the amount of lineouts won per game.’ I chose this aim because I wanted to see if the height of the back five forwards affects lineout success rates in elite level rugby. My timescale for this project was one month.
P2: Carry out / P4: Produce

Literature Review and References
Here is a link to my literature review. https://worthingsportscience.wordpress.com/2015/02/26/unit-5-literacy-review-liam-lee/
P2: Carry out / P4: Produce

Project Hypothesis
1. At the end of my research project I expect to find that teams with taller back five forwards will have a better lineout success rate.
2. At the end of my research project I expect to find that teams with the highest average lineout success rate will have higher league positions then those who have a low lineout success rate.
P2: Carry out / P4: Produce
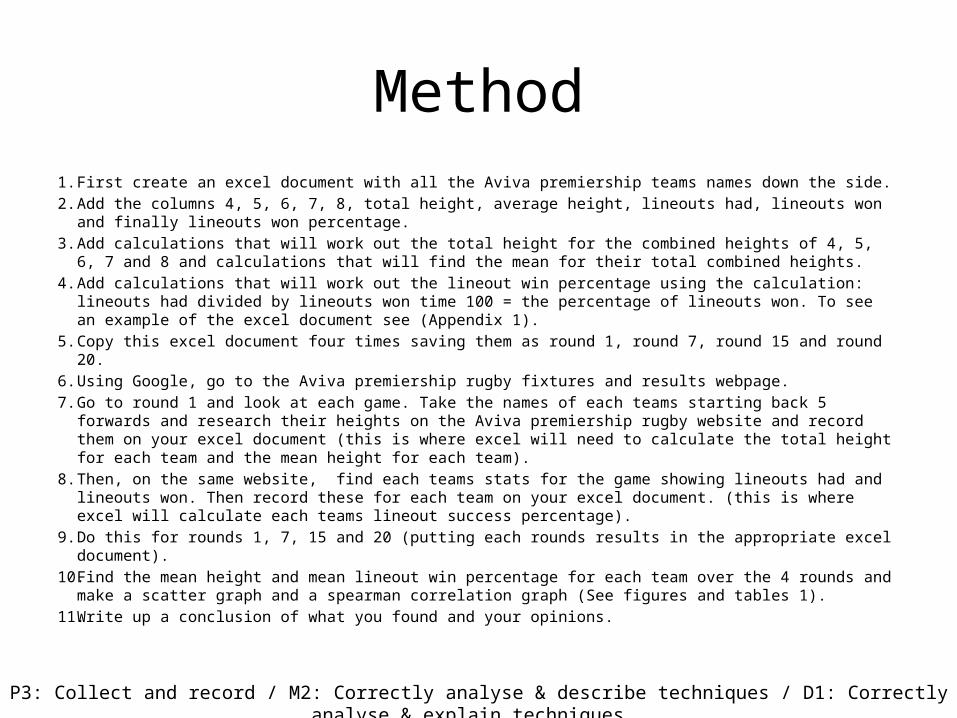
Method1. First create an excel document with all the Aviva premiership teams names down the side. 2. Add the columns 4, 5, 6, 7, 8, total height, average height, lineouts had, lineouts won and finally lineouts
won percentage. 3. Add calculations that will work out the total height for the combined heights of 4, 5, 6, 7 and 8 and
calculations that will find the mean for their total combined heights. 4. Add calculations that will work out the lineout win percentage using the calculation: lineouts had divided by
lineouts won time 100 = the percentage of lineouts won. To see an example of the excel document see (Appendix 1).
5. Copy this excel document four times saving them as round 1, round 7, round 15 and round 20.6. Using Google, go to the Aviva premiership rugby fixtures and results webpage. 7. Go to round 1 and look at each game. Take the names of each teams starting back 5 forwards and research
their heights on the Aviva premiership rugby website and record them on your excel document (this is where excel will need to calculate the total height for each team and the mean height for each team).
8. Then, on the same website, find each teams stats for the game showing lineouts had and lineouts won. Then record these for each team on your excel document. (this is where excel will calculate each teams lineout success percentage).
9. Do this for rounds 1, 7, 15 and 20 (putting each rounds results in the appropriate excel document).10. Find the mean height and mean lineout win percentage for each team over the 4 rounds and make a scatter
graph and a spearman correlation graph (See figures and tables 1).11. Write up a conclusion of what you found and your opinions.
P3: Collect and record / M2: Correctly analyse & describe techniques / D1: Correctly analyse & explain techniques
Data Collection
I carried out a desk based research project that consisted of collecting secondary based quantitative data from a reliable source (see appendix 2). It consisted of looking at each teams lineout stats for games 1,7,15 and 20 and recording them in excel. It also consisted of looking at each teams starting back 5 forwards and researching their individual height using the teams official webpage on the Aviva rugby site. The benefit of using these sites to get my data is that they are a reliable source whereas using a website such as Wikipedia may not have accurate information.
P3: Collect and record / M2: Correctly analyse & describe techniques / D1: Correctly analyse & explain techniques
Data Analysis
I will analyse my secondary data using excel by looking at each teams average starting back 5 forwards height and comparing it to their lineout win percentage. I will then make a scatter graph on excel which will allow me to see if there is a correlation between height and lineout win percentage. I will also make a spearmint correlation graph which will allow me to see if there is any correlation between height and lineout win percentage.
P3: Collect and record / M2: Correctly analyse & describe techniques / D1: Correctly analyse & explain techniques

Results
My results show that there is a very low correlation between the height of the back 5 starting forwards and the lineout win percentage in the Aviva rugby premiership (see figures and tables 2 and 3).
P3: Collect and record / M2: Correctly analyse & describe techniques / D1: Correctly analyse & explain techniques
Discussion
I found that the average height of Aviva premiership rugby teams starting back 5 forwards has no correlation to them having a better lineout success rate. This finding was not what I expected as I thought the opposite and so this result was quite a surprise to me. The trend that I identified was that the average height of the back 5 forwards rarely changed and was quite consistent throughout my project, this indicates to me that the height of the team which is picked is not a tactical decision.
P2: Carry out / P4: Produce
Conclusion
‘To investigate the affect of premiership standard back 5 forward height and the amount of lineouts won per game.’My key trends were that all the sources will support my research project. Another is that all my sources are valid and will help me during my project. Another key trend is that my sources are all looking at elite level male athletes. And finally that they are all related to the height and weight of athletes. Overall, my results did not support my hypotheses and my results were not what I expected as they showed that there was no correlation between average height of the back 5 forwards and lineout win percentage
P2: Carry out / P4: Produce
Review (1/3)
My project conclusion did not meet my project aims very well at all. My conclusion found no correlation between what I was looking into (as shown on figures and tables 2) and so has left me a bit disappointed as I truly thought there would be one. My conclusion also did not prove any of my hypotheses which was also a disappointment.
P5: Describe / M3: Explain / D2: Justify
Review (2/3)
• One strength of my research project is the reliability of my data because I used a very accurate and reliable source (see appendix 2).
• Another strength is the organisation of my data and how it has been presented on excel. This is a strength as the data can easily been seen (See figures and tables 1,2 and 3).
• Another strength of my research project is the validity of my data. It is valid because it allows me to clearly see whether height affects lineout win percentage.
P5: Describe / M3: Explain / D2: Justify
Review (3/3)
My area to improve during my project would be to set dates in which research will be completed and stick to them in order to stay on track and keep up to date with work. This will allow me to plan my time more effectively and will allow me to know exactly what I should be doing and when.
P5: Describe / M3: Explain / D2: Justify
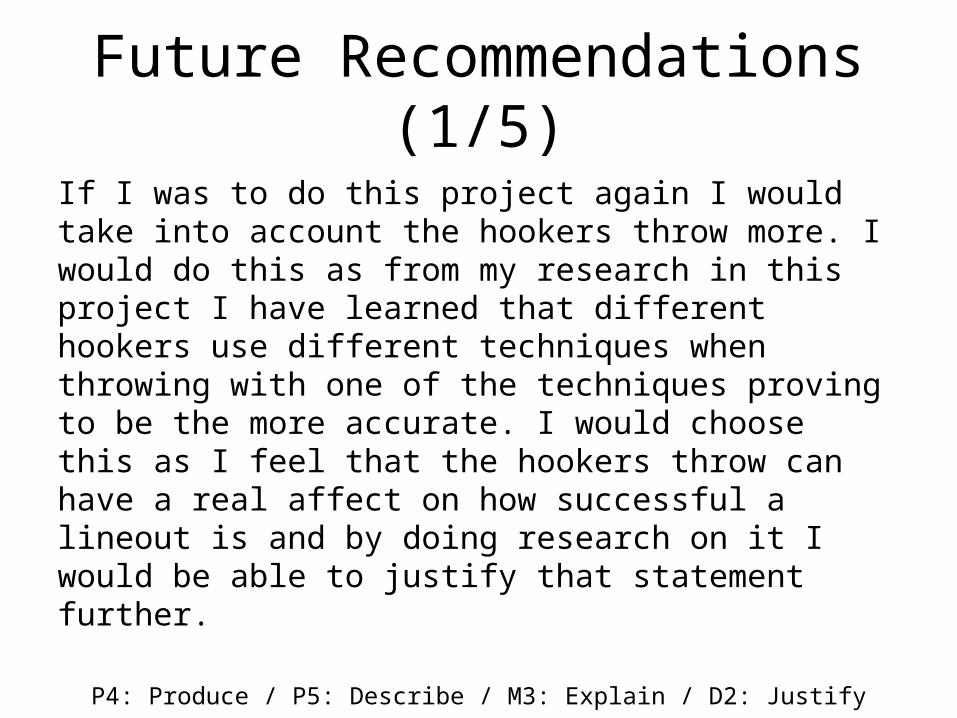
Future Recommendations (1/5)
If I was to do this project again I would take into account the hookers throw more. I would do this as from my research in this project I have learned that different hookers use different techniques when throwing with one of the techniques proving to be the more accurate. I would choose this as I feel that the hookers throw can have a real affect on how successful a lineout is and by doing research on it I would be able to justify that statement further.
P4: Produce / P5: Describe / M3: Explain / D2: Justify

Future Recommendations (2/5)
The benefit of taking the hookers throw into account would be that you would be able to see which is more effective in terms of the lineout, the height of the back 5 forwards or the hookers throw accuracy/technique. It will also help support whether this research projects aim was correct or whether it could be questioned with evidence to back it up.
P4: Produce / P5: Describe / M3: Explain / D2: Justify
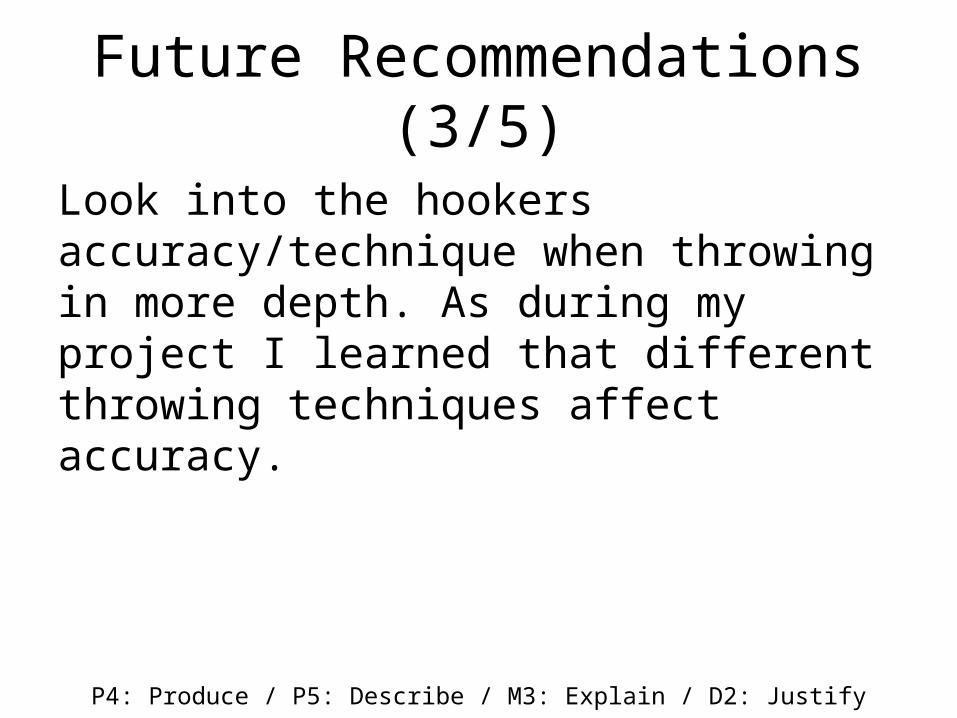
Future Recommendations (3/5)
Look into the hookers accuracy/technique when throwing in more depth. As during my project I learned that different throwing techniques affect accuracy.
P4: Produce / P5: Describe / M3: Explain / D2: Justify

Future Recommendations (4/5)
Look at the height of the lifters in the lineout. I think this would be a good thing to look into as taller lifters can get more height in the lift which could course a tactical advantage.
P4: Produce / P5: Describe / M3: Explain / D2: Justify

Future Recommendations (5/5)
Repeat the same research project but over the whole season with a longer timescale. This will give more accurate results over a season which will make them more valid. This will help me get a real look at whether height does affect lineout success rate over a season.
P4: Produce / P5: Describe / M3: Explain / D2: Justify

Research Project Appendices

Appendix 1
Here is a photo of my excel sheet used to show data I collected.


Research Project Figures and Tables
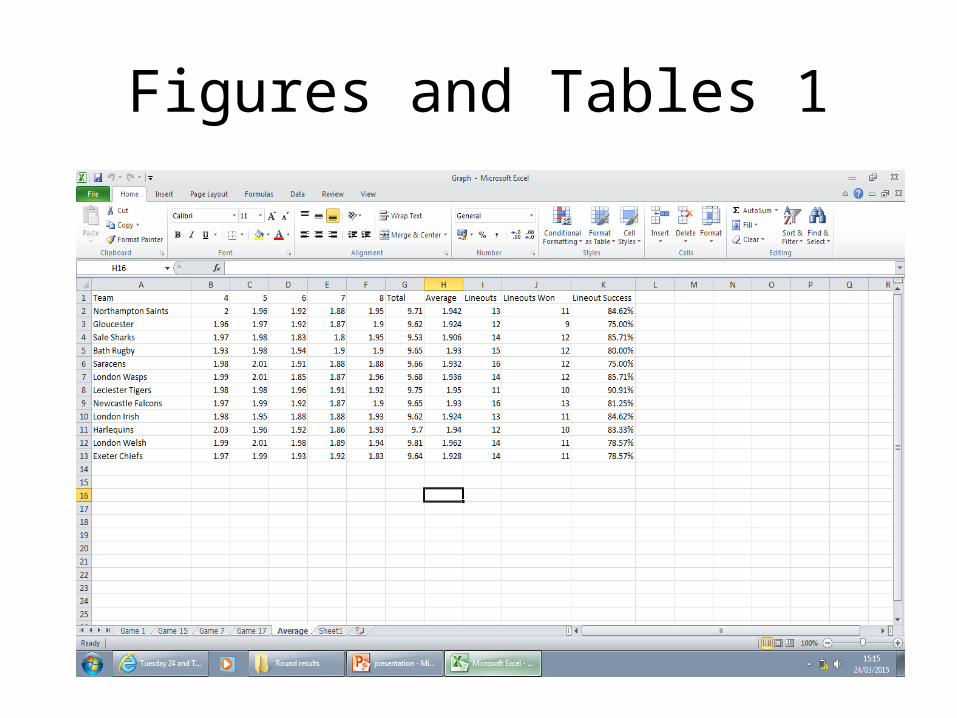
Figures and Tables 1

Figures and tables 3
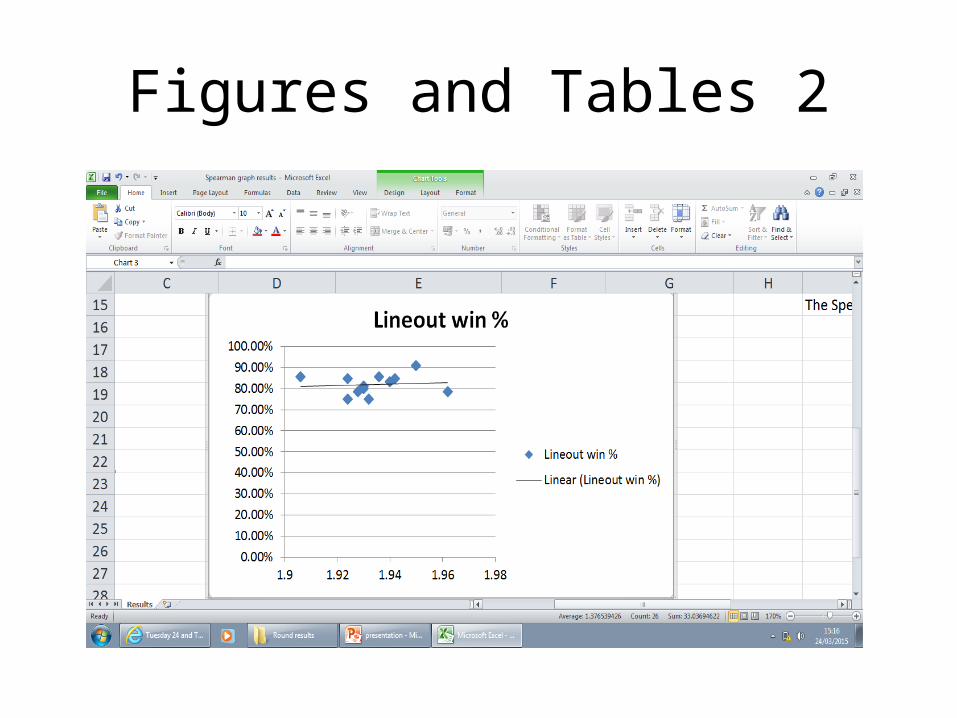
Figures and Tables 2