united states environmental protection · pdf filedegradation studies were characterized by...
TRANSCRIPT

UNITED STATES ENVIRONMENTAL PROTECTION AGENCY WASHINGTON D.C., 20460
OFFICE OF PREVENTION. PESTICIDES AND
TOXIC SUBSTANCES
PC Code: 109801 DP Barcode: D285550 Date: March 6,2007
MEMORANDUM
Subject: Iprodione drinking water assessment, including proposed new use on pistachio (IR4) and label revisions affecting rates for strawberries, stone fruits, and grapes.
To: Shaja Brothers, Reviewer, Minor Use Inerts and Emergency Response Branch, RD Tamue Gibson, Fungicides Branch, RD Toiya Goodlow, Chemist, RRB1, HED Christina Swartz, Chief, RAB2, HED
From: Dirk F.Young, Ph.D., Environmental Engineer Environmental Risk Branch IV Environmental Fate and Effects Division (7507P)
- \-
Thru: Elizabeth Behl, Chief Marietta Echeverria, Risk Assessment Process Leade Environmental Risk Branch IVIEFED (7507P) (3'
Executive Summary The Environmental Fate and Effects Division (EFED) conducted a drinking water
assessment for iprodione in response to label amendments and proposed new uses that differ from the uses evaluated in the 1998 iprodione RED. The drinking water concentrations calculated here have been completely revised from previous calculations (i.e., as presented in the 1998 iprodione RED and subsequent drinking water memos). The need for a complete revision was due to the availability of newer models than those available for the 1998 RED as well as submissions of newer fate data by the registrant.
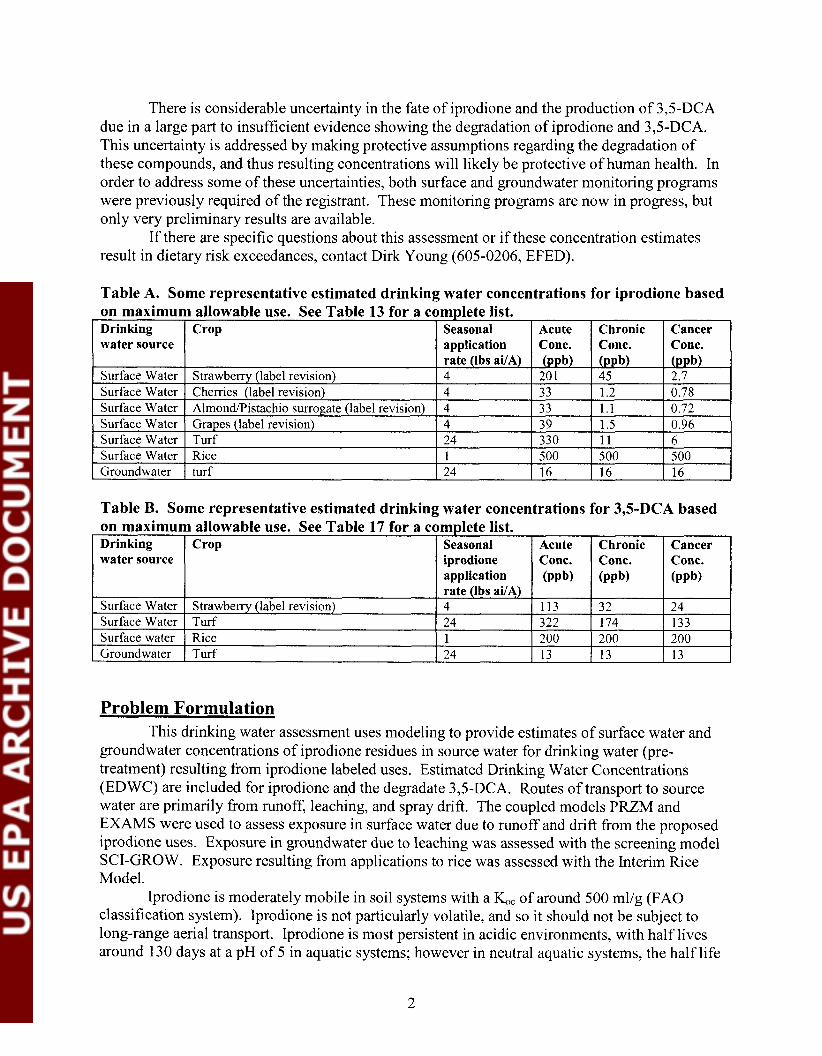
EFED calculated concentrations for both iprodione and the iprodione degradate 3,5- dichloroaniline (3,5-DCA), which HED has reported to be of toxicological concern. Some representative drinking water concentrations to be used HED's human health assessment are summarized in Table A for iprodione and in Table B for the degradate 3'5-dichloroaniline (3'5- DCA). These tables include the highest concentrations calculated (from rice and turf) as well as concentrations that resulted from the new uses and label amendments. A more extensive list of estimated drinking water concentrations is included within this document (see Tables 10 and 15).
Text Searchable Document
There is considerable uncertainty in the fate of iprodione and the production of 3,5-DCA due in a large part to insufficient evidence showing the degradation of iprodione and 3,5-DCA. This uncertainty is addressed by making protective assumptions regarding the degradation of these compounds, and thus resulting concentrations will likely be protective of human health. In order to address some of these uncertainties, both surface and groundwater monitoring programs were previously required of the registrant. These monitoring programs are now in progress, but only very preliminary results are available.
If there are specific questions about this assessment or if these concentration estimates result in dietary risk exceedances, contact Dirk Young (605-0206, EFED).
Table A. Some representative estimated drinking water concentrations for iprodione based on maximum allowable use. See Table 13 for a complete list.
I Drinking I Crop 1 Seasonal 1 Acute I Chronic I Cancer 1 I water source I I application I Conc. I Conc. I Conc. I
Surface Water I Rice 1 500 1 500 1 500 Groundwater 1 turf 1 24 1 16 1 16 1 16
Problem Formulation This drinking water assessment uses modeling to provide estimates of surface water and
groundwater concentrations of iprodione residues in source water for drinking water (pre- treatment) resulting from iprodione labeled uses. Estimated Drinking Water Concentrations (EDWC) are included for iprodione and the degradate 3,5-DCA. Routes of transport to source water are primarily from runoff, leaching, and spray drift. The coupled models PRZM and EXAMS were used to assess exposure in surface water due to runoff and drift from the proposed iprodione uses. Exposure in groundwater due to leaching was assessed with the screening model SCI-GROW. Exposure resulting from applications to rice was assessed with the Interim Rice Model.
Iprodione is moderately mobile in soil systems with a kc of around 500 mllg (FA0 classification system). Iprodione is not particularly volatile, and so it should not be subject to long-range aerial transport. Iprodione is most persistent in acidic environments, with half lives around 130 days at a pH of 5 in aquatic systems; however in neutral aquatic systems, the half life
Table B. Some representative estimated drinking water concentrations for 3,s-DCA based on maximum allowable use. See Table 17 for a complete list. Drinking water source
Surface Water Surface Water Surface water Groundwater
Crop
Strawberry (label revision) Turf Rice Turf
Seasonal iprodione application rate (Ibs ai/A) 4 24 1 24
Acute Conc. @pb)
113 322 200 17
Chronic Conc. ( P P ~ )
3 2 174 200 17
Cancer Conc. ( P P ~ )
24 133 200 17
drops off to 4.7 days (pH of 7), and in basic systems, iprodione quickly dissipates (27 minutes at pH of 9). For aquatic systems, there is no strong evidence of effective mechanisms of iprodione degradation other than hydrolysis. Submitted iprodione degradation studies involving soils are characterized by high levels of unextracted and unidentified residues which lead to uncertain degradation characterizations; thus it is uncertain whether iprodione undergoes degradation in soil systems or whether it is simply temporararily sequestered and can be released over time.
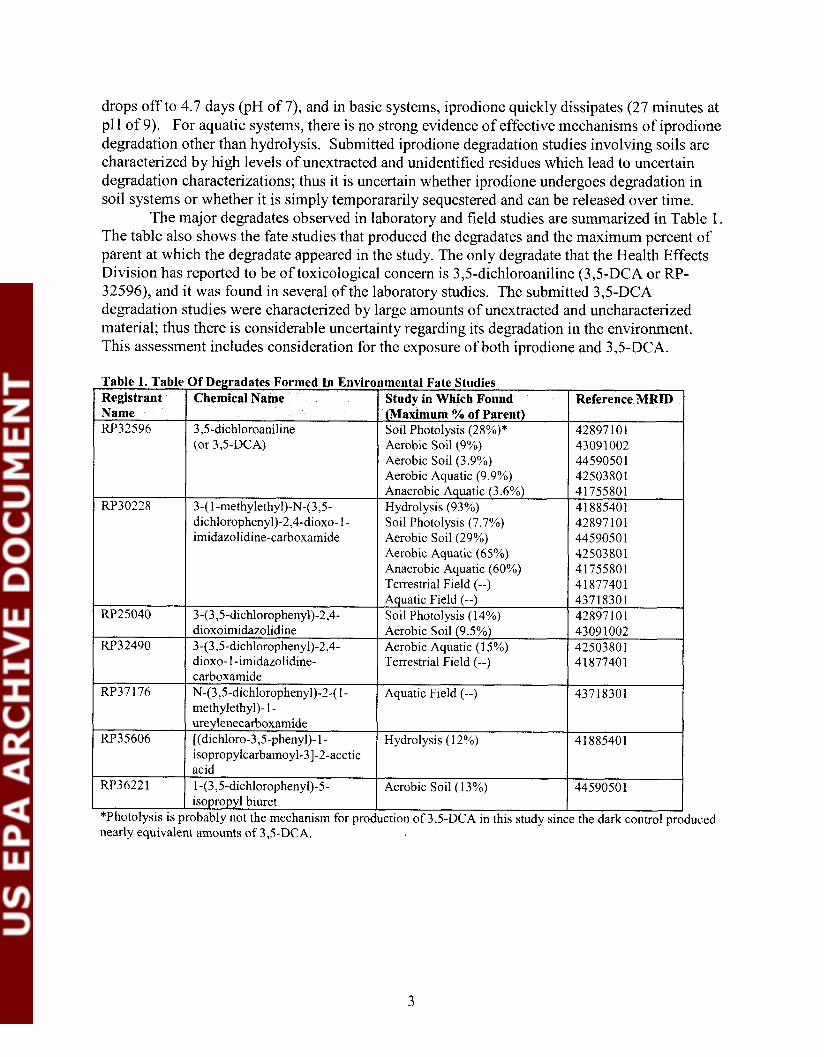
The major degradates observed in laboratory and field studies are summarized in Table 1. The table also shows the fate studies that produced the degradates and the maximum percent of parent at which the degradate appeared in the study. The only degradate that the Health Effects Division has reported to be of toxicological concern is 3,5-dichloroaniline (3,5-DCA or RP- 32596), and it was found in several of the laboratory studies. The submitted 3,5-DCA degradation studies were characterized by large amounts of unextracted and uncharacterized material; thus there is considerable uncertainty regarding its degradation in the environment. This assessment includes consideration for the exposure of both iprodione and 3,5-DCA.
Table 1. Tablt Registrant Name RP32596
(or 3,5-DCA)
Of Degradates Formed In Environmental Fate Studies
Aerobic soil (9%) Aerobic Soil (3.9%) Aerobic Aquatic (9.9%)
I Name 3,5-dichloroaniline
I Aquatic Field (--) 1 43718301 3-(3,5-dichloropheny1)-2,4- 1 Soil Photolysis (14%) 1 42897101
Study in Which Found CMaximum % of Parent) Soil Photolysis (28%)*
3-(1-methylethyl)-N-(3,5- dichloropheny1)-2,4-dioxo- 1- imidazolidine-carboxamide
dioxoimidazolidine I Aerobic Soil (9.5%) 1 43091002 3-(3,5-dichloropheny1)-2,4- I Aerobic Aquatic (15%) 1 42503801
Reference MRID
42897101
Anaerobic kquatic (3.6%) Hydrolysis (93%) Soil Photolysis (7.7%) Aerobic Soil (29%) Aerobic Aquatic (65%) Anaerobic Aquatic (60%) Terrestrial Field (--)
dioxo- 1 -imidazhlidine- carboxamide N-(3,5-dichloropheny1)-2-(1- methylethyl)- l - ureylenecarboxamide [(dichloro-3,5-pheny1)- 1 - isopropylcarbamoyl-31-2-acetic
RP36221
Terrestrial Field (--)
Aquatic Field (--)
Hydrolysis (12%)
41877401
43718301
41885401
*Photolysis is probably not the mechanism for production of 3,5-DCA in this study since the dark control produced nearly equivalent amounts of 3,5-DCA.
acid 1 -(3,5-dichloropheny1)-5- isopropyl biuret
Aerobic Soil (13%) 44590501

Analvsis
Use Characterization Iprodione [3-(3,5-dichloropheny1)-N-(1 -methylethyl)-2,4-dioxo- 1 -
imidazolidinecarboxamide] is a contact and/or locally systemic fungicide. Application methods include aircraft aerial applications, groundsprays, chemigation, and dipping. It is registered for use on a variety of fruit, vegetables, and ornamentals (see Appendix 1 for more examples of registered uses). The registrant is proposing to add a new uses on pistachio (IR4), and to increase label application rates for strawberries, stone fruits and grapes. The current formulations are for outdoor use only.
EFED obtained all relevant labels from the Registration Division and then summarized the relevant content in detail (see Appendix 1). EFED conducted model simulations for most of the labeled uses (in some cases multiple scenarios for a given use) in order to derive EDWCs. Some of uses could not be directly simulated but were adequately simulated with close scenario approximations (e.g., California almond used for pistachio and Florida cabbage for Florida Chineese Mustard). The simulations that were performed were sufficiently broad to provide a realistic assessment of the varied uses of iprodione.
Environmental Fate and Transport Characterization Iprodione is moderately mobile (per FA0 classification system) in soil systems with a
&, around 500 mllg. It is not particularly volatile, and so it should not be subject to long-range aerial transport. Iprodione is most persistent in acidic environments, with half lives around 130 days at a pH of 5 in aquatic systems; however, in neutral aquatic systems, the half life drops to 4.7 days (pH of 7), and in basic systems, iprodione quickly dissipates (27 minutes at pH of 9). For aquatic systems, there is no strong evidence of effective mechanisms of iprodione degradation other than hydrolysis.
Submitted iprodione degradation studies involving soils are characterized by high levels of unextracted and unidentified residues which lead to uncertain degradation characterizations. For example, in a submitted aerobic soil degradation study, 75 to 87% of the residues were unextracted and uncharacterized after 300 days. Thus it remains unknown if and how much of these residues are parent iprodione or degradates of concern. Nevertheless, terrestrial and aquatic field dissipation studies tend to imply that iprodione dissipates in the environment with a DTso of 3 to 7 days. However, because of the extraction concerns raised in the soil studies, it is unknown whether these DTSo values represent true degradation or simply a temporary sequestering of iprodione (or degradates of concern) that can be released over time.
The major degradates observed in laboratory and field studies are summarized in Table 1. The table also shows the fate studies that produced the degradates and the maximum percent of parent at which each of the degradates appeared in the studies. The only degradate that the Health Effects Division has reported to be of toxiclogical concern is 3,5-dichloroaniline (33- DCA or RP-32596), and it was found in several of the laboratory studies. This assessment includes consideration for the exposure of both iprodione and 3,5-DCA
Table 2A summarizes the general fate properties of iprodione as determined from submitted studies, and Table 3 presents the properties of 3,5-DCA. Summaries of the information available to EFED regarding the fate of iprodione and 3,5-DCA and which were used to construct these tables are presented in the following sections.

Table 2. Summary of General Fate Properties of Iprodione 3-(3,5-dichloropheny1)-N-(1-methylethyl)-2,4- dioxo-1-imidazolidine-carboxamide Property I value I SourcelMRID ( comments Molecular formula I C I ~ H I ~ C ~ ~ N ~ O ~ I Molecular weight (MW)
Vapor pressure (20°C):
Henry's Constant
330.2 glmole
2 . 7 ~ 1 o - ~ tom
OctanolIWater Coefficient
Solubility in water (20°C)
Hydrolysis half life
I ncn Iprodione
9 . 0 ~ 1 o - ~ atm m7/mol
Photolysis aquatic half life Photolysis soil half life Aerobic soil degradation half
Table 3. Summary of Fate Properties of the Iprodione Degradate 3,s-DCA Property I Value I SourceIMRID I comments Molecular wt 1 162 ( Product I
Loglo KO, = 3.1
13 mgiL
131 day(pH=5) 4.7 day (pH= 7)
life Aerobic aquatic degradation half life Anaerobic aquatic degradation half life
Sorption (K,,)
nLu
Iprodione RED Iprodione RED
41885401 27 min (pH= 9) 67 days negligible 30 to 300 days
calculated
24 to 100 days
9 days
7-14 days
426 mllg
Solubility Henry's Law Constant Aerobic soil
I I I I exponent = 0.6 to 0.7 I
=(vp/760)/(MWlsol); vp in
torr; sol in mg/L; MW in glmol
41861901 42897101 4309 1002
degradation half life Sorption (KO,)
Hydrolysis
near surface. clear water
There were high amounts of 44590501 4 192760 1 42503801
41755801
43349202
784 mg/L 10" atm m'imol Possibly > 9 months
The pH-dependent hydrolysis half life of iprodione is 13 1 days at a pH of 5,4.7 days at a pH of 7, and 27 minutes at a pH of 9. These values were derived from laboratory studies (MRID# 41 885401) in sterile aqueous buffered solutions at 25OC. The major degradates observed were RP35606 with a maximum of 11.9% of the applied at pH 5, and RP30228, with a maximum of 93.3% of the applied at pH 9. [RP-30228 is 1-(3,5-dich1orophenyl)carbamoyl-3- isopropyl-hydantoin, and RP-35606 is 3-(isopropylcarbamoyl)-5-(3,5-dichlorophenyl)hydantoic acid.]
unextracted material (75-87%) (likely due solely to hydrolysis) (likely due solely to hydrolysis)
(average of 4 soils), reasonably linear isotherms, Freundich exponents average 0.96
500 to 850 mllg (based on Kf)
chemistry data EPI Suite EPI Suite 45239201 high levels of un-extracted
451 14101
- residues (see text) Nonlinear, Freundlich
Photolysis in Water Iprodione degraded slowly with a half life of 67 days in a pH 5 buffered solution
irradiated continuously with a UV-filtered xenon-arc lamp (MRID# 41 861901). The test ran for 33 days in conditions reported to simulate Florida sunlight. Iprodione did not degrade significantly in the dark control. No major degradates (210% of the applied) were observed in this study. Laboratory photolysis studies such as these are intended to provide the photolysis rate that could occur at the surface of a clear water body with access to unobstructed solar radiation; thus rates in an actual environment would be considerably lower.
Photolysis on Soil Iprodione degraded at a somewhat higher rate under irradiated conditions than in the dark
control in a soil photolysis study (MRID# 42897101). On irradiated soils, iprodione degraded with an observed DTS0 of 7-14 days in sandy loam soil that was irradiated with a xenon-arc lamp for 8.8 hourslday for 30 days; whereas, in the dark controls, iprodione degraded with an observed DTS0 of 14-21 days. Registrant-calculated half lives, using a first-order degradation model, were 4.64 days for the irradiated sample and 5.15 days for the dark control, thus degradation by irradiation is minimal. The major degradate observed in the irradiated soil was RP32596 [3,5- DCA] with a maximum of 28% of the applied at 14 days; while the dark control produced 37% of 3,5-DCA. Other degradates include a mixture of RP25040 [3-(3,5-dichloropheny1)-2,4- dioxoimidazolidine] and LS720942 with a maximum of 13.75% of the applied at day 7 (3% in the dark control), and RP30228 with a maximum of 7.72% immediately post treatment (1 1% in the dark control).
Aerobic Aquatic Metabolism Iprodione degraded with an observed DTso of 3-7 days in a flooded silt loam sediment
system incubated in the dark (MRID# 41927601 and 42503801). However, the pH of the system was 8.5, which is a level at which hydrolysis is a major mechanism of degradation. In the pH range between 7 and 9, iprodione degrades with a half life between 27 minutes and 4.7 days, as shown in a separate hydrolysis study (MRID 41885401). Thus hydrolysis is likely the means of degradation in these studies. The major degradates were RP30228, with a maximum of 64.6% of the applied at 14 days, and RP32490 [l-(3,5-dichloropheny1)-3-carbamoyl hydantoin], with 14.6% of the applied at 2 days. RP32596 [3,5-dichloroaniline] was a maximum of 9.9% of the applied in the sediment at 30 days.
Anaerobic Aquatic Metabolism Iprodione, at approximately 6 ppm, degraded with an observed DTso of 7-14 days in
anaerobic (flooded plus nitrogen atmosphere) silt loam sediment that was incubated in the dark at 25°C in an anaerobic aquatic metabolism study (MRID 41755801). The pH of the water was 7.4, which is a level at which hydrolysis is likely the most significant degradation mechanism. A sterile control showed that iprodione degrades at about the same rate under sterile conditions, but the degradate (RP-30228) did not dissipate (accounting for about 90% of applied after 1 year); whereas in the unsterilized test, it accounted for only about 10% after 1 year. Thus degradation of the parent does not appear to be microbially mediated, but degradation of RP-30228 does appear to be microbially mediated. The major degradates were RP30228 with a maximum of 70.7% of the applied at 14 days post-treatment; RP32490 with a maximum of 8.4% of the
applied at 30 days. C02 accounted for 5.5-6.3% of the applied at 365 days. Organic volatiles were 50.6%, and unextracted residues were 16.7-20.0% of the applied.
Aerobic Soil Metabolism In an aerobic soil metabolism study (MRID# 43091 002) conducted in a sandy loam soil
that was incubated in the dark at 25OC and 75% of 0.33 bar moisture for 276 days, unextracted and uncharacterized residues accounted for 75.8 to 86.9% of the applied I4c at 181-276 days (last test interval). Thus it is difficult to estimate actual degradation rates. The half life could be higher than 300 days if all the unidentified unextracted material were iprodione. The DTso of the extracted iprodione was 14-30 days. The following degradates were observed: RP30228, with a maximum of 6.92% of the applied at 14 days; RP32596 (3,5-DCA), with a maximum of 9.02% of the applied at 30 days; and RP25040, with a maximum of 9.47% of the applied at 30 days. Volatile residues totaled 5.27% of the applied at 276 days (of which 5.23% was C02). Note: the soil used was the same soil used in the soil photolysis study (i.e., MRID# 42897101).
In a shorter 100-day study (MRID 44590501), iprodione degraded with a half-life between 23.9 and 100 days. The shorter half life was based on the regression of extractable iprodione only. The longer half life was based on the observation that at 100 days there was more than 50% unrecovered and uncharacterized material that could have been iprodione. Degradates were RP30228 (observed at a maximum of 29.5 %), RP36221 (observed at a maximum of 12.7%), and 3,5-DCA (observed at a maximum of 3.9%).
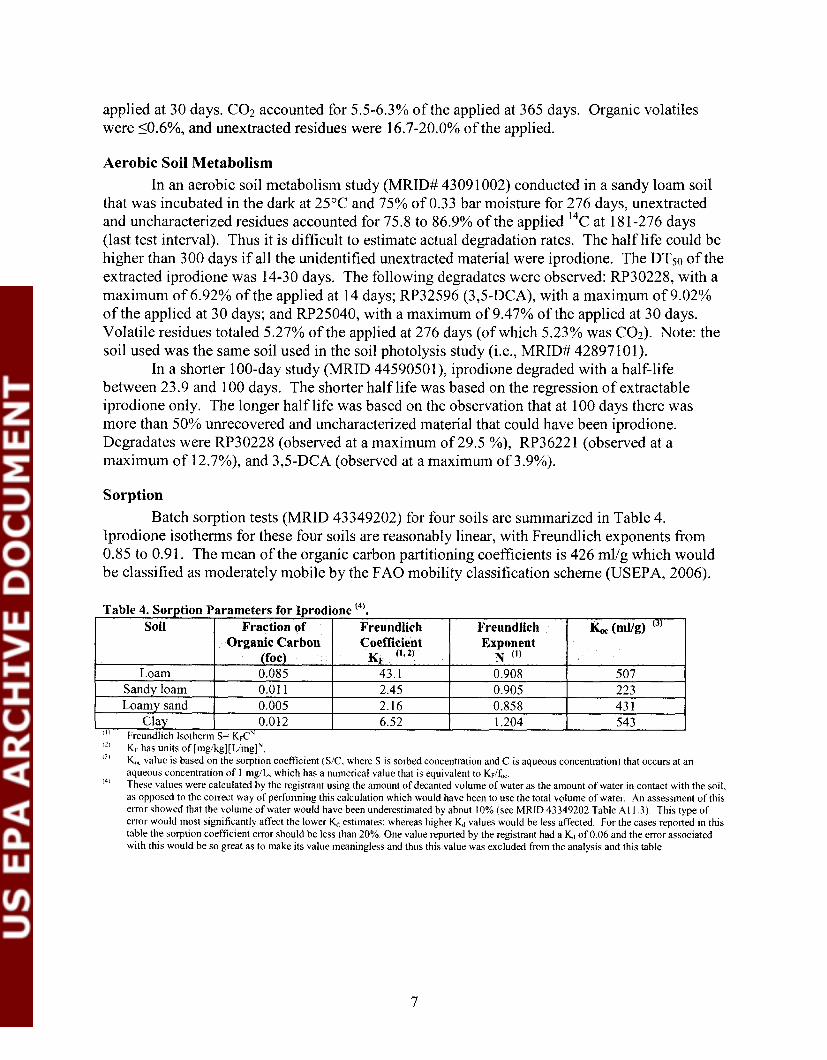
Sorption Batch sorption tests (MRID 43349202) for four soils are summarized in Table 4.
Iprodione isotherms for these four soils are reasonably linear, with Freundlich exponents from 0.85 to 0.91. The mean of the organic carbon partitioning coefficients is 426 mllg which would be classified as moderately mobile by the FA0 mobility classification scheme (USEPA, 2006).
' KF has units of [mgIkg][UmglN, "' K,, value is based on the sorption coefficient (SIC. where S is sorbed concentration and C is aqueous concentration) that occurs at an aqueous concentration of 1 mg/L, which has a nulnerical value that is equivalent to K F / ~ , .
1 4 ' These values were calculated by the registrant using the amount of decanted volume of water as the amount of water in contact with the soil, as opposed to the correct way of performing this calculation which would have been to use the total volume of water. An assessment of this error showed that the volulne of water would have been underestimated by about 10% (see MRlD 43349202 Table A1 1.3). This type of elror would most significantly affect the lower Kt estimates; whereas higher 91 values would be less affected. For the cases repo~ted in this table the sorption coefficient e~ror should be less than 20%. One value reported by the registrant had a k of 0.06 and the error associated with this would be so great as to make its value meaningless and thus this value was excluded from the analysis and this table.
Table 4. Sorption Parameters for Iprodione '4'.
Soil
Loam Sandy loam Loamy sand
Clay ' I ' Freundlich lsothenn S= K~C'
Fraction of Organic Carbon
(foc) 0.085 0.01 1 0.005 0.012
Freundlich Coefficient
KF (l,2)
43.1 2.45 2.16 6.52
Freundlich Exponent
N '1'
0.908 0.905 0.858 1.204
KC W g ) '3'
507 223 43 1 543
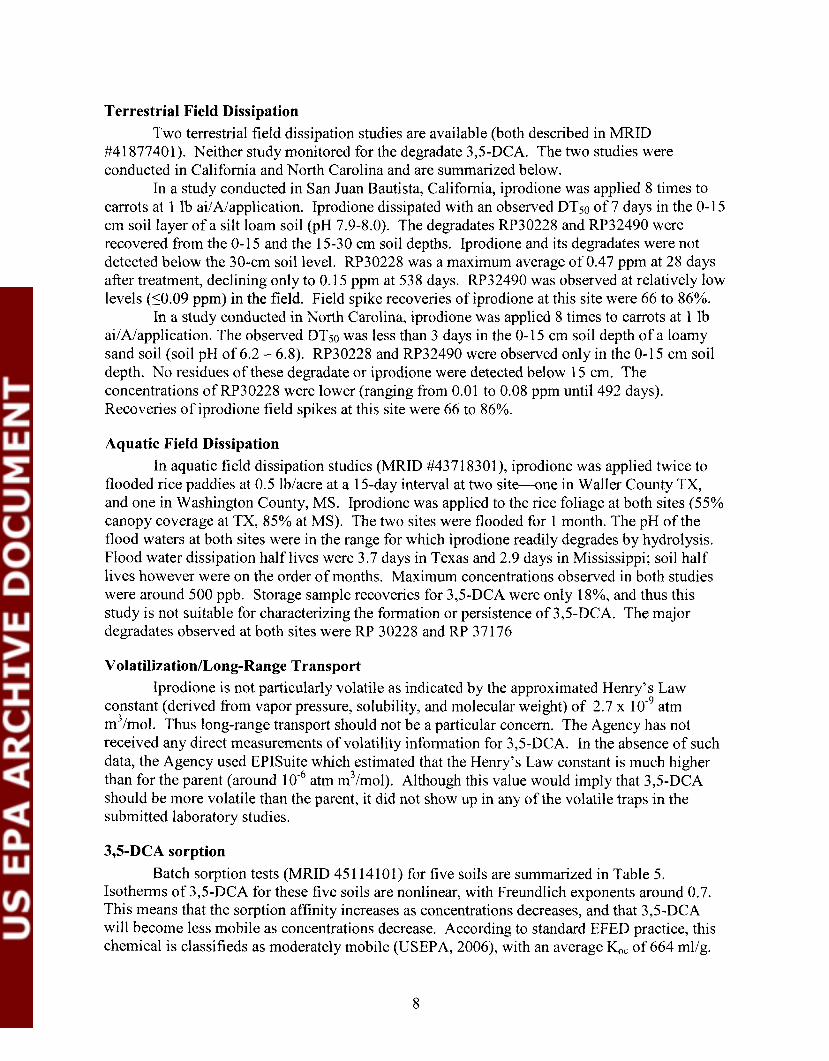
Terrestrial Field Dissipation Two terrestrial field dissipation studies are available (both described in MRID
#41877401). Neither study monitored for the degradate 3,5-DCA. The two studies were conducted in California and North Carolina and are summarized below.
In a study conducted in San Juan Bautista, California, iprodione was applied 8 times to carrots at 1 lb ailAlapplication. Iprodione dissipated with an observed DTS0 of 7 days in the 0-1 5 cm soil layer of a silt loam soil (pH 7.9-8.0). The degradates RP30228 and RP32490 were recovered from the 0-1 5 and the 15-30 cm soil depths. Iprodione and its degradates were not detected below the 30-cm soil level. RP30228 was a maximum average of 0.47 ppm at 28 days after treatment, declining only to 0.15 ppm at 538 days. RP32490 was observed at relatively low levels (10.09 ppm) in the field. Field spike recoveries of iprodione at this site were 66 to 86%.
In a study conducted in North Carolina, iprodione was applied 8 times to carrots at 1 lb ai/A/application. The observed DTso was less than 3 days in the 0-1 5 cm soil depth of a loamy sand soil (soil pH of 6.2 - 6.8). RP30228 and RP32490 were observed only in the 0-1 5 cm soil depth. No residues of these degradate or iprodione were detected below 15 cm. The concentrations of RP30228 were lower (ranging from 0.01 to 0.08 ppm until 492 days). Recoveries of iprodione field spikes at this site were 66 to 86%.
Aquatic Field Dissipation In aquatic field dissipation studies (MRID #43718301), iprodione was applied twice to
flooded rice paddies at 0.5 lblacre at a 15-day interval at two site---one in Waller County TX, and one in Washington County, MS. Iprodione was applied to the rice foliage at both sites (55% canopy coverage at TX, 85% at MS). The two sites were flooded for 1 month. The pH of the flood waters at both sites were in the range for which iprodione readily degrades by hydrolysis. Flood water dissipation half lives were 3.7 days in Texas and 2.9 days in Mississippi; soil half lives however were on the order of months. Maximum concentrations observed in both studies were around 500 ppb. Storage sample recoveries for 3,5-DCA were only 18%, and thus this study is not suitable for characterizing the formation or persistence of 3,5-DCA. The major degradates observed at both sites were RP 30228 and RP 37176
Volatilization/Long-Range Transport Iprodione is not particularly volatile as indicated by the approximated Henry's Law
constant (derived from vapor pressure, solubility, and molecular weight) of 2.7 x atm m3/mol. Thus long-range transport should not be a particular concern. The Agency has not received any direct measurements of volatility information for 3,5-DCA. In the absence of such data, the Agency used EPISuite which estimated that the Henry's Law constant is much higher than for the parent (around atm m3/mol). Although this value would imply that 3,5-DCA should be more volatile than the parent, it did not show up in any of the volatile traps in the submitted laboratory studies.
3,s-DCA sorption Batch sorption tests (MRID 451 14101) for five soils are summarized in Table 5.
Isotherms of 3,5-DCA for these five soils are nonlinear, with Freundlich exponents around 0.7. This means that the sorption affinity increases as concentrations decreases, and that 3,5-DCA will become less mobile as concentrations decrease. According to standard EFED practice, this chemical is classifieds as moderately mobile (USEPA, 2006), with an average &, of 664 mllg.
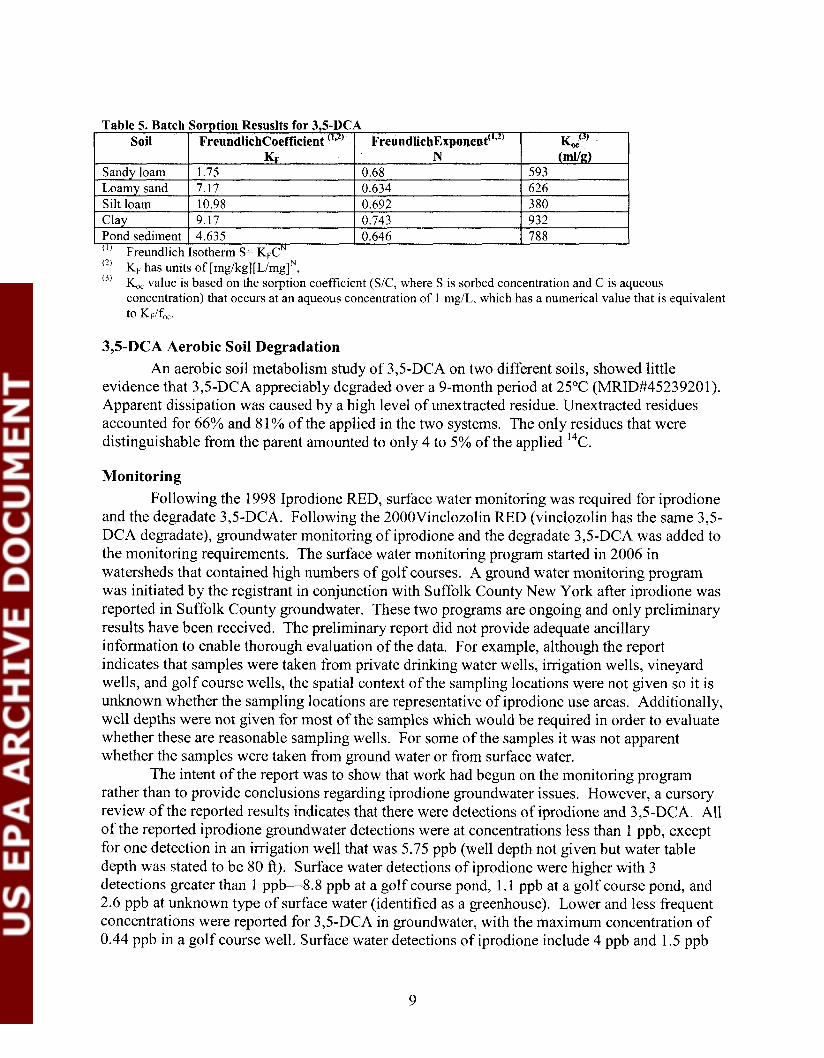
Table 5. Batch Sorption Resuslts for 3,5-DCA I Soil 1 Freundlichcoefficient "" [ ~reund l i ch~x~onent ( '~~ ' ( I&C@)
"' KF has units of [mglkg][~;mglY, '3' KO, value is based on the sorption coefficient (SIC, where S is sorbed concentration and C is aqueous
concentration) that occurs at an aqueous concentration of 1 mgiL, which has a numerical value that is equivalent to KF/f,,.
Sandy loam Loamy sand Silt loam Clay Pond sediment
3,s-DCA Aerobic Soil Degradation An aerobic soil metabolism study of 3,5-DCA on two different soils, showed little
evidence that 3,5-DCA appreciably degraded over a 9-month period at 25OC (MRID#45239201). Apparent dissipation was caused by a high level of unextracted residue. Unextracted residues accounted for 66% and 81% of the applied in the two systems. The only residues that were distinguishable from the parent amounted to only 4 to 5% of the applied 14C.
Monitoring
"' Freundlich Isotherm S= K ~ C ~
1.75 7.17 10.98 9.17 4.635
Following the 1998 Iprodione RED, surface water monitoring was required for iprodione and the degradate 3,S-DCA. Following the 2000Vinclozolin RED (vinclozolin has the same 3 3 - DCA degradate), groundwater monitoring of iprodione and the degradate 3,5-DCA was added to the monitoring requirements. The surface water monitoring program started in 2006 in watersheds that contained high numbers of golf courses. A ground water monitoring program was initiated by the registrant in conjunction with Suffolk County New York after iprodione was reported in Suffolk County groundwater. These two programs are ongoing and only preliminary results have been received. The preliminary report did not provide adequate ancillary information to enable thorough evaluation of the data. For example, although the report indicates that samples were taken from private drinking water wells, irrigation wells, vineyard wells, and golf course wells, the spatial context of the sampling locations were not given so it is unknown whether the sampling locations are representative of iprodione use areas. Additionally, well depths were not given for most of the samples which would be required in order to evaluate whether these are reasonable sampling wells. For some of the samples it was not apparent whether the samples were taken from ground water or from surface water.
The intent of the report was to show that work had begun on the monitoring program rather than to provide conclusions regarding iprodione groundwater issues. However, a cursory review of the reported results indicates that there were detections of iprodione and 3,5-DCA. All of the reported iprodione groundwater detections were at concentrations less than 1 ppb, except for one detection in an irrigation well that was 5.75 ppb (well depth not given but water table depth was stated to be 80 ft). Surface water detections of iprodione were higher with 3 detections greater than 1 ppb-8.8 ppb at a golf course pond, 1.1 ppb at a golf course pond, and 2.6 ppb at unknown type of surface water (identified as a greenhouse). Lower and less frequent concentrations were reported for 3,5-DCA in groundwater, with the maximum concentration of 0.44 ppb in a golf course well. Surface water detections of iprodione include 4 ppb and 1.5 ppb
0.68 0.634 0.692 0.743 0.646
593 626 380 932 788

in golf course ponds, along with three other golf course pond samples less than 1 ppb. The iprodione/3,5-DCA assessment may need to be reevaluated upon receipt of the final monitoring reports.
The 1998 Iprodione RED reviewed several non-targeted surface and groundwater studies (e.g., Oregon, Wisconsin, California, STORET) that showed little evidence of iprodione with mostly less than 0.1 ppb detections, but with higher values (1 to 3.5 ppb) reported in one drainage ditch. A recent check (Jan 2006) of NAQWA revealed no information regarding iprodione or 3,5 DCA detections.
Drinking Water Exposure Modeling Drinking water concentrations were determined for both iprodione and the degradate 3,5-
DCA. The parent concentrations are calculated in the first section that follows, and the degradate concentrations are calculated in the section that follows the parent.
Drinking Water Estimates for Parent Iprodione
Methods for Determining Parent (Iprodione) Concentrations Iprodione drinking water estimated concentrations were determined for the iprodione
uses listed in Table 6. For surface water concentration calculations due to all uses except rice, the models used were PRZM 3.12beta and EXAMS 2.98.04 along with the appropriate index reservoir scenario. For the rice use, surface water concentrations were determined using the Interim Rice Model. For groundwater concentrations, SCIGROW 2.3 was used.
Input parameters for PRZM/EXAMS are given in Tables 6 and 7. Input parameters for the Interim Rice Model are given in Table 8. Input parameters for Scigrow are given in Table 9. Parameter selections were determined according to EFED guidance (EFED, 2002) unless otherwise specified.
For the PRZM/EXAMS simulations, various application dates were simulated in an attempt to capture the well-known variability associated with application dates. The application dates that are given in Table 6 are the ones that were used for presenting the primary results, and these dates were chosen with consideration for the label recommendations for application timing and preharvest interval (see Appendix 1) along with the crop dates associated with each PRZM scenario file. The primary application dates used in these simulations were selected from the approximate middle of the possible window of applications (using the model user's best judgement); however, the selection of the date is not a precise process, and there may be some variability about the date selection. In order to address this variability, simulations were also made using applications dates before and after those dates given in Table 6, but within the temporal window of possible application dates. The possible temporal window was evaluated using the application information from the labels (see Appendix 1) along with the emergence and harvest dates associated with each scenario.

Table 6. Use-Specific Scenarios and Usage Inputs for Surface Water Modeling Iprodione
I canola I ground sorav I NDCanola I 0.45 1 1 I Jul 1
Use
altnondlpistachio
altnondlpistachio
I cotton 1 in furrow I NC Cotton I 0.27 1 1 1 June 1
- Application method
ground spray
aerial spray
canola
cotton
cotton
FEED Scenario
CA Almond
CA Almond
aerial
in furrow
in furrow
stone fruits
stone fruits
benies
gt-apes
grapes - .
sttawbet~y
stuawbet~y
Iprodione Application Rate
Ilb. a.iJA) 1
I
ND Canola
CA Cotton
MS Cotton
aerial
aerial
ground spray
ground spray
ground snrav
bean
- . - Aerial Spray
Aetial Spray
bean
carrot
carrot
Number of
4
4
0.45
0.27
0.27
GA Peaches
MI Cherries
Or Berries
NY G~apes
CA G~anes
Aerial Spray
onion
onion
Date of Application (interval)
Feb7, 14.28, Mar7
Feb7, 14.28, Mar7
FL St~awbeny
FL Strawbeny (new use)
Aerial Spray
Aerial Spray
Aerial Splay
onion
onion
~ettuce '
1
I
I
I
1
I
1
1
MI Beans
Aerial Splay
Aerial Spray
potato
Turf (golf courses, sod fa~ms. otnatnental tutf)
Turf (golf courses, sod fanns, ornamental turf)
Turf(golf coutses. sod fanns. o~natncntal turf)
Tutf (golf couwes, sod fatms, ornamental tufl
Jul 1
May 5
May 1
0.5
1 .0
OR Beans
FL Cat~ot
FL Carrot 5 Ib
Aerial Splay
Aerial Spray
Aerial /Ground Spray
otna~nentals
Rice
4
4
4
4
4
1
GA onion
CA onion
Aerial Spray
Ground spray
Ground splay
Ground splay
Ground spray
Mar 1,8,15,22
Apr25 May1.8.15
May 20.3 1.14.30
June20.30, July 10,20
Mav l.11.21.31
10
4
1
1
0.5
GA onion
CA onion
CA
(2) Lettuce label only allows that the 1" application be aerial, and the othets are ground spray. Because itnple~nentation of this mixed scheme is inconvenient with current modeling tools, two si~nulations were tnade---one with all aerial and one with all ground spray. The expected results lie somewhere between the two. As the results show. the differences are negligible.
Ground spray
Not applicable
< .
May 1,8,15,22, Junel 1,18,25,Jul 2,22,29
May1.8.15.22
2
0.75
0.75
Me Potatoes
PA tutf
FL Turf
PA tutf
FL Turf
June 1.21
2
4
10
0.5
0.5
1
OR Otnatnental
Interim Rice Model
May 5.26
Nov 20.27, Dec3,lO
starting Oct 9 (7 day interval)
5
5
I
4
4
1.25
I .25
start Mar 1 (14 day interval)
start Jan 10 (14 day interval)
10
10
3
1.25
0.5
start Mar I (7 day interval)
start Feb 18 (7 day interval)
start Feb 20 (10 day interval)
4
6
6
4
4
start on July I (I 0 day interval)
July 1 start ( 14 day interval)
July 1 start (14 day interval)
July 2 1 start (7 day interval)
July I start (7 day intetval)
4
2
July 1 start (7 day interval)
Not applicable
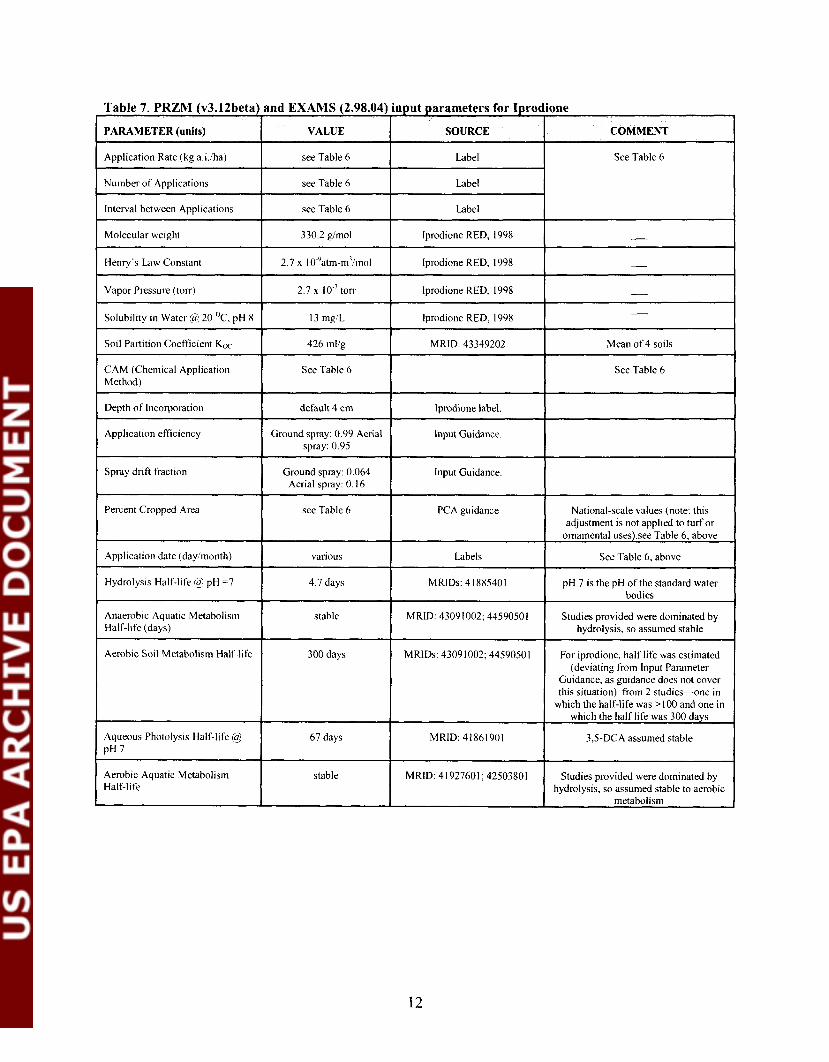
PARAMETER (units) j VALUE
I Application Rate (kg a.i.iha) I see Table 6
I Number of Applications
y u t parameters for Iprodione
SOURCE 1 COMMENT
see Table 6
1
Label 1 Label
I Interval between Applications I
See Table 6
see Table 6 Label I I Molecular weight
- -
lprodione RED, 1998
I Henry's Law Constant Iprodione RED, 1998
Vapor Pressure (ton.) 2.7 10.' tom
Solubility in Water @ 20 'c, pH 8 13 mgiL
I Soil Paltition Coefticient I
lprodione RED, 1998
lprodione RED, 1998
MRID: 43349202
-
-
I CAM (Chemical Application Method)
See Table 6
I Depth of lncomporation default 4 cm Iprodione label.
I Application efficiency Ground spray: 0.99 Aerial spray: 0.95
lnput Guidance.
Percent Cropped Area
I Application date (daylmonth) 1 various
Mean of 4 soils
See Table 6
I Spray drift fraction Ground spray: 0.064 Aerial splay: 0.16
Input Guidance
see Table 6 PCA guidance
I Hydrolysis Half-life @ pH =7 I --- -
4.7 days
Anaerobic Aquatic Metabolism stable Hal[-11fe (days)
Aerobic Soil Metabolism Half-life 300 days
Aqueous Photolysis Half-life @ I O l d a y s
Aerobic Aquatic Metabolism I stable Half-life
Labels
MRIDs: 4 188540 1
MRID: 43091002; 44590501
MRIDs: 43091002; 4459050 1
MRID: 41861901
National-scale values (note: this adjustment is not applied to turf or
ornamental uses).see Table 6, above
See Table 6, above
pH 7 is the pH of the standard water bodies
Studies provided were dominated by hydrolysis, so assumed stable
For iprodione, half life was estimated (deviating from lnput Parameter
Guidance, as guidance does not cover this situation) from 2 studies-one in
which the half-life was >I00 and one in which the half life was 300 days
3,5-DCA assumed stable
MRID. 4 1927601 ; 42503801
-- - - --
Studies provided were dominated by hydrolysis, so assumed stable to aerobic
metabolis~n
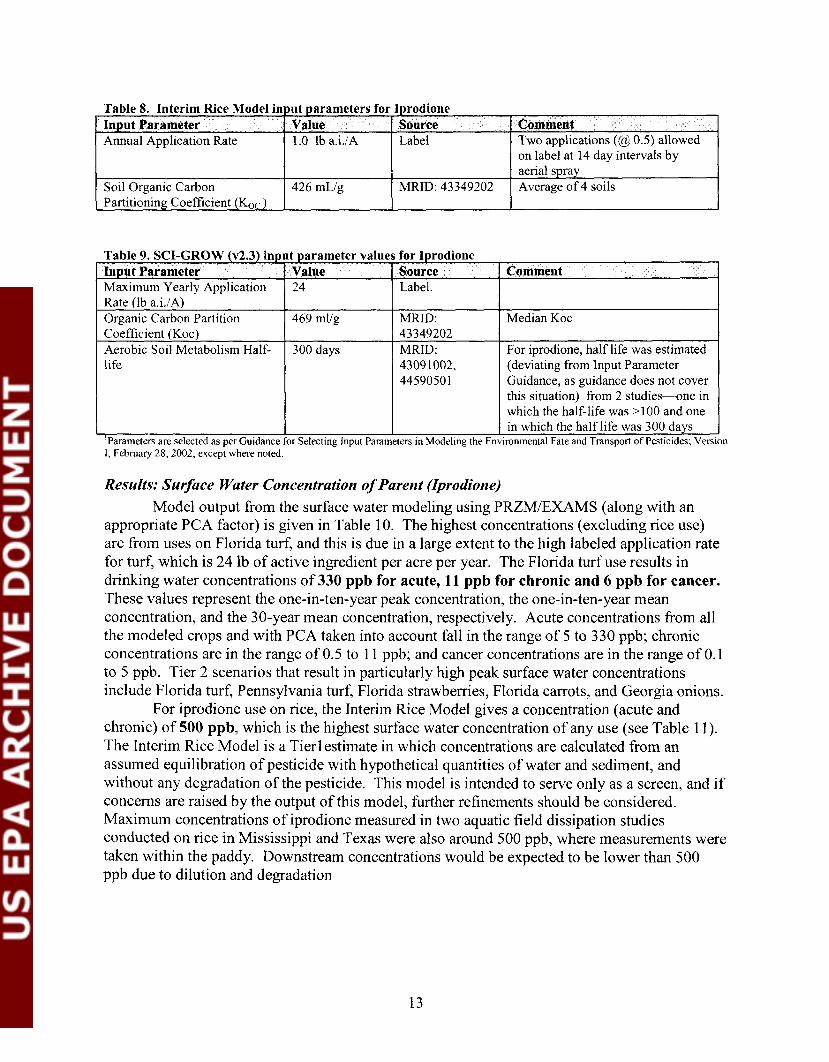
Table 9. SCI-GROW (v2.3) input parameter values for Iprodione Input Parameter I Value I Source I Comment 1 Maximum Yearly Application 1 24 ] Label. I I Rate (lb a.i./A)
life
I Coefficient (Koc)
(deviating from Input Parameter Guidance, as guidance does not cover this situation) from 2 studies-one in which the half-life was >lo0 and one
Organic Carbon Partition 1 469 mllg I MRID: I Median Koc 1 43349202 I
I in which the half life was 300 days 'parameters are selected as per Guidance for Selecting Input Parameters in Modeling the Environtnental Fate and Transport of Pesticides; Version
Aerobic Soil Metabolism Half- I 300 days I MRID: I For iprodione, half life was estimated
- . 1, Feb~uary 28,2002, excep; where noted.
Results: Surface Water Concentration of Parent (Iprodione) Model output from the surface water modeling using PRZMIEXAMS (along with an
appropriate PCA factor) is given in Table 10. The highest concentrations (excluding rice use) are from uses on Florida turf, and this is due in a large extent to the high labeled application rate for turf, which is 24 lb of active ingredient per acre per year. The Florida turf use results in drinking water concentrations of 330 ppb for acute, 11 ppb for chronic and 6 ppb for cancer.
- - - -
These values represent the one-in-ten-year peak concentration, the one-in-ten-year mean concentration, and the 30-year mean concentration, respectively. Acute concentrations fkom all the modeled crops and with PCA taken into account fall in the range of 5 to 330 ppb; chronic concentrations are in the range of 0.5 to 1 1 ppb; and cancer concentrations are in the range of 0.1 to 5 ppb. Tier 2 scenarios that result in particularly high peak surface water concentrations
. - -
include Florida turf, Pennsylvania turf, Florida strawberries, Florida carrots, and Georgia onions. - For iprodione use on rice, the Interim Rice Model gives a concentration (acute and
chronic) of 500 ppb, which is the highest surface water concentration of any use (see Table 1 1). The Interim Rice Model is a Tier1 estimate in which concentrations are calculated from an assumed equilibration of pesticide with hypothetical quantities of water and sediment, and without any degradation of the pesticide. Th is model-is intended to serve only as a screen, and if concerns are raised by the output of this model, further refinements should be considered. Maximum concentrations of iprodione measured in two aquatic field dissipation studies conducted on rice in Mississippi and Texas were also around 500 ppb, where measurements were taken within the paddy. Downstream concentrations would be expected to be lower than 500 ppb due to dilution and degradation

- . (2) Lettuce label only allows that the I " applicationbe aerial, and the others are ground spray. Because irnplernentation of this mixed scheme is inconvenient with cutrent modeling tools. two si~nulations were made-one with all aerial and one with all ground spray. The expected results lie somewhere between the two. As the results show, the differences are negligible.
Results: Groundwater Concentration of Parent (Iprodione) SCI-GROW was used to estimate the ground water concentration resulting from the use
of iprodione. SCI-GROW is based on the fate properties of the pesticide (i.e., the median I& and mean aerobic soil metabolism half-life), the application rate, and the concentration data from 13 small-scale ground water monitoring studies. The concentration for parent iprodione estimated using SCI-GROW is approximately 0.65 ppbllb of iprodione. Thus for the highest application rates such as those on turf (24 lblacre), groundwater concentration would be 15.6 ppb (see Table 1 1).

Table 11. Ground Water Estimated Drinking Water Concentrations (EDWC) of Iprodione.
Drinking Water Estimates for the degradate 3,5-DCA
Generic 1 lblacre
Methods for Determining Parent (Iprodione) Con centrations
Peak & Chronic EEC fppb)
15.6
Use
turf
All processes that describe iprodione degradation that the registrant has submitted show that every pathway forms 3,5-DCA. Therefore, it is reasonable to assume that 3,5-DCA can be simulated with the same scenarios as iprodione and with the same molar application rate as iprodione. Six scenarios were chosen for 3,5-DCA simulations by selecting scenarios that gave the highest parent concentration fiom Table 10 (i.e., FL turf, PA turf, FL strawberry, CA lettuce, GA onion, and FL carrot). For groundwater, the ppb-per-pound-applied concept was used as previously described for the parent above. Application rates for these scenarios are the same as the equivalent iprodione applications except that they were adjusted by the molecular weight ratio (1 621330). Chemical input parameters are summarized in Tables 12 for surface water, Table 13 for rice, and Table 14 for ground water.
As supported by registrant-submitted information, the fundamental assumption here is that all iprodione degrades to 3,5-DCA at one time or another. However, it is not known when the formation of 3,5-DCA will occur with respect to the time of application of iprodione to a field. It is not likely (as supported by registrant studies) that this transformation would occur rapidly. Rapid formation of 3,5-DCA from iprodione promotes high acute estimates because of the greater availability of DCA at one time; whereas slower formation would dampen peak 33 - DCA formation, but have less impact on long-term average concentration. Thus, acute estimates derived in this manner are likely conservative. Importantly, conservative assumptions were made during the calculations of both 3,5-DCA and its parent iprodione, which would be contradictory if both assumptions occurred. For example, in the calculation of 3,5-DCA, it was assumed that rapid transformation of iprodione to 3,5-DCA occurred; whereas in the calculation for iprodione, it was assumed that iprodione degraded slowly. Clearly both cases cannot occur, but it is uncertain which case is the actual case. Thus both cases are presented in this assessment with the understanding that the concentrations derived for 3,5-DCA and iprodione are not intended to represent concurrent exposure concentrations.
Iprodione App. Rate (Ibs aVA)
24
1 0.65
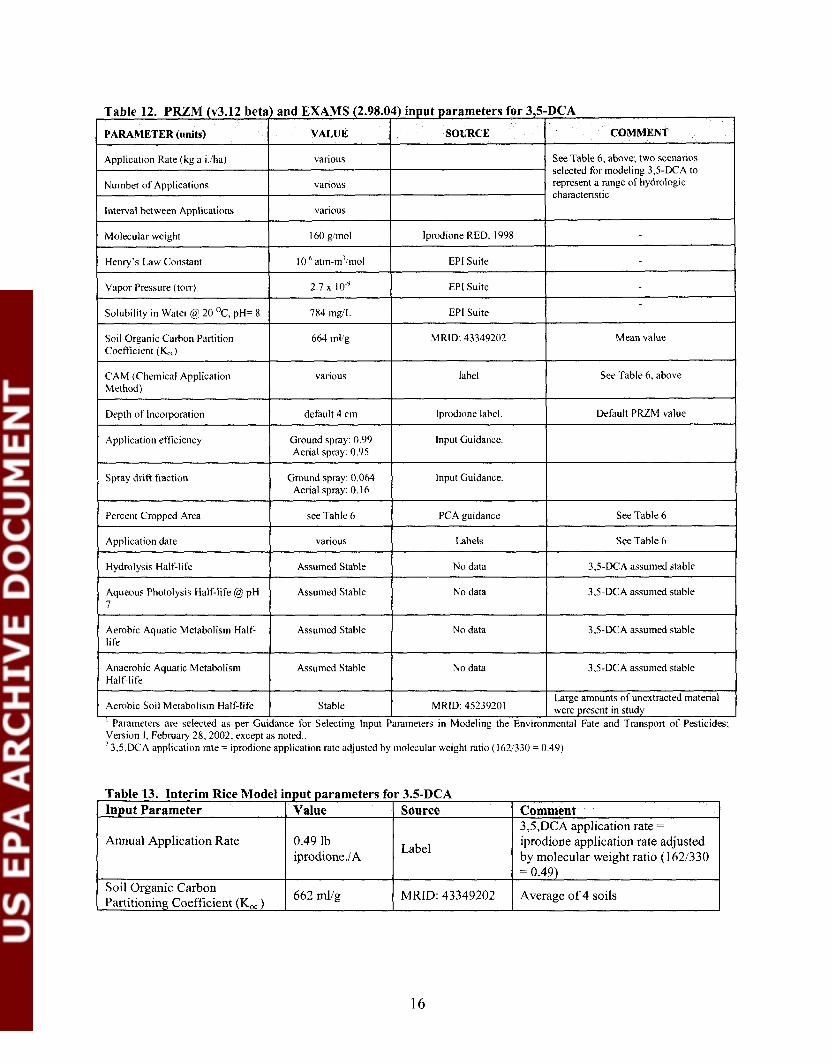
Table 12. PRZM (v3.12 beta) and EXAMS (2.98.04) input parameters for 3,5-DCA
Application Rate (kg a.i./ha)
Number of Applications
COMMENT
Interval between Applications
I I I
SOURCE PARAMETER (units)
various
various
various
Molecular weight
VALUE
See Table 6, above; two scenarios selected for modeling 3.5-DCA to represent a range of hydrologic
I
I I I
Henry's Law Constant
characteristic
I I I
160 gi~nol
Vapor Pressure (to1-r)
Soil Organic Ca~bon Partition Coefficient (K,,,) I
Ip~vdione RED, 1998
I I I
I0 "tm-tn'lmol
Solubility in Water @ 20 OC, pH= 8
MRID: 43349202 I Mean value I
EPI Suite
I 2.7 x 10.'
CAM (Chemical Application Method)
EPI Suite
I I I I 784 mg/L
label I See Table 6, above I
EPI Suite
I Depth of lnco~po~ation I default 4 cm lprodione label. / Default PRZM value I Application efficiency Ground spray: 0.99
Aerial spray: 0.95 Input Guidance.
Spray drift fixtion Ground spray: 0.064 Aerial spray: 0.16
Input Guidance. I I Application date 1 various 1 Labels I See Table 6 I
Percent Cropped Area
Aqueous Photolysis Half-life @ pH Assumed Stable
see Table 6
Hydrolysis Half-life
No data I 3.5-DCA assumed stable
PCA guidance
Assumed Stable
Anaerobic Aquatic Metabolism I Assumed Stable Half-life
See Table 6
Aerobic Aquatic Metabolism Half- life
No data I 3.5-DCA assumed stable
No data 3,s-DCA assumed stable
Assumed Stable
L .
Ve~sion I, Februa~y 28,2002, except as noted.. ' 3,5,DCA application rate = iprodione application rate adjusted by ~nolecular weight ratio (1621330 = 0.49)
I I I
No data 3.5-DCA assumed stable
Aerobic Soil Metabolism Half-life
Table 13. Interim Rice Model input parameters for 3.5-DCA
I Paramete1-s are selected as oer Guidance for Selectine lnaut Palameters in Modeline the Environ~nental Fate and Transoort of Pesticides:
MRID: 45239201 Stable Large amounts of unextracted material were present in study
Input Parameter
Annual Application Rate
Soil Organic Carbon Partitioning Coefficient (KO, )
Value
0.49 Ib iprodione./A
662 mllg
Source
Label
MRID: 43349202
Comment 3,5,DCA application rate =
iprodione application rate adjusted by molecular weight ratio (1 621330 = 0.49)
Average of 4 soils

Table 14. SCI-GROW (v2.3) input Input Parameter
Maximum Application Rate (Ib a.i./A)
Number of Applications per Year
Organic Carbon Partition Coefficient (K,,) Aerobic Soil Metabolism Half-life
arameter values for 3,s-DCA. Value
Turf 4 Label
Source
Turf 2.94
stable I MRID: 45239201
Label
Comment 3,5,DCA application rate =
iprodione application rate adjusted by molecular weight ratio (1621330 = 0.49) These represent highest and lowest annual applications (see Table 6, above)
Median Koc
Results: Surface Water Concentration of Degradate 3,s-DCA
Results for surface water concentrations of 3,5-DCA are given in Table 15 for rice and the six PRZMIEXAMS surface water simulations. As with the parent, the highest concentrations (excluding rice) resulted from the Florida turf scenario with acute concentration of 3 2 2 ppb a chronic concentration of 174 ppb and a cancer concentration of 133 ppb For ground water (see Table 16), SCIGROW results give 0 .53 ppb of 3,5-DCA for every pound of iprodione applied; therefore a 24 pound application would give 13 ppb.
Table 15. Summary of surface water simulations resulting in high 3,s-DCA concentrations (PCA factor
1 Generic 1 lbiacre I 1 lbs ai/A I 0.53 ppb 1
Table 16. Ground Water Estimated Drinking Water Concentrations (EDWC) of 13,s-DCA
Drinking Water Treatment Effects
Use
turf
No specific information on the effects of drinking water treatment are available for iprodione or its degradate 3,5-DCA
Application Rate of the parent (iprodione)
24 lbs ai/A
Peak & Chronic Concentrations of 3,s-DCA
13 P P ~
Uncertainties and Data Gaps Prominent uncertainties include the characterization and quantification of the degradation
of iprodione and 3,5-DCA.. Uncertainties also are associated with the formation of 3,5-DCA. Degradation quantification was confounded by large amounts of unextracted material that was reported in the degradation studies conducted with soil for both iprodione and 3,5-DCA. The amount of unextracted and uncharacterized material hindered accurate estimation of degradation rates, but did tend to suggest that iprodione and 3,5-DCA do degrade very slowly in the presence of soil. Another uncertainty is the formation rate 3,5-DCA. Although proposed pathways for degradation (included with submitted studies), suggest that 3,5-DCA is formed during nearly all degradation processes, it was not frequently observed in high amounts except in the soil photolysis study. Yet in the soil photolysis study, photolysis did not appear to be the cause of 3,5-DCA formation since nearly equivalent amounts were observed in the dark controls; therefore the mechanism for 3,5-DCA formation in the study that produced the most 3,5-DCA is not clear. These uncertainties have led to the conservative exposure assessment described here.
There is also uncertainty associated with general model representativeness as well as in the selection of input parameters. In this regard, one of the potentially important parameters that can impact concentration estimates is the selection of appropriate application dates. Although the pesticide application dates were selected to be most appropriate according to the model user's best judgment and with considerations for label restrictions and simulated cropping dates, variability nevertheless results because the application window (the time span during a season that a pesticide may likely be applied) for a pesticide may be wide and the actual application dates are unknown. Some of this variability has been captured and is presented in Appendix 2. Such variability is caused by the temporal proximity of a pesticide application to rain events. As with all model estimates, the values presented here should not be viewed as precise estimates.
References
EFED (2002). Guidance for Selecting Input Parameters in Modeling the Environmental Fate and Transport of Pesticides; Version I, February 28,2002.
USEPA (2006). Standardized Soil Mobility Classification Guidance. U.S. Environmental Protection Agency, Office of Prevention, Pesticides and Toxic Substances, Office of Pesticide Programs, Environmental Fate and Effects Division, Memorandum, April 2 1, 2006.
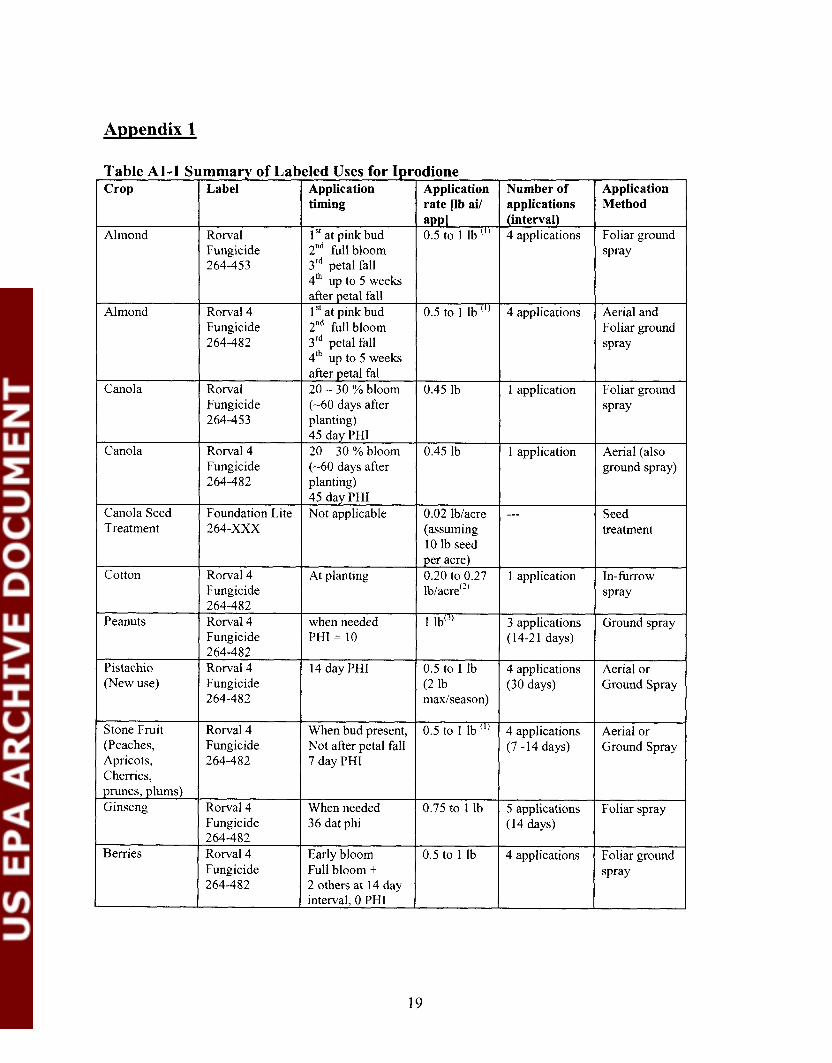
Appendix 1
I I appl Almond I Rorval I I at pink bud 1 0.5 to 1 Ib ' I '
Table Al-1 Summary of Labeled Uses for Iprodione
Fungicide 2nd full bloom / 264-453 1 3rd petal fall 4'h up to 5 weeks
Crop
( after petal fall I
Almond I Rorval4 1 1"atpinkbud 1 0.5 to 1 lb ( I )
Fungicide 2nd f;ll bloom / 264-482 1 3rd petal fall 4Ih UP to 5 weeks
Label Application timing
I
I Canola
Application rate [Ib ail
I
~ 1 Canola
I
I - -
I Treatment I 264-XXX (assuming 10 Ib seed
Rorval
I
I per acre) Cotton I Rorval4 I At planting 1 0.20 to 0.27
after petal fa1 20 - 30 % bloom 1 0.45 Ib
Fungicide 264-453
Rorval4 Fungicide 264-482
1 45 day PHI
I - I Fungicide ..
I ~blacre'~'
Canola Seed 1 Foundation Lite I Not applicable 1 0.02 lbiacre
(-60 days after planting) 45 day PHI 20 - 30 % bloom (-60 days after planting)
I Fungicide ( PHI = 10 1
0.45 1b
Peanuts 2641482 Rorval4
Pistachio (New use)
prunes, plums) 1 Ginseng I Rorval4 I When needed 1 0.75 to 1 lb
Stone Fruit (Peaches, Apricots, Cherries,
- 1 Fungicide 1 36 dat phi I
when needed
264-482 Rorval4 Fungicide 264-482
( 264-482 I I Berries I Rorval4 I Early bloom 1 0.5 to 1 Ib
1 lb"'
Rorval4 Fungicide 264-482
14 day PHI 0.5 to 1 Ib (2 Ib maxlseason)
When bud present, Not after petal fall 7 day PHI
Fungicide 264-482
Foliar ground
Number of applications (interval) 4 applications
0.5 to 1 Ib "I
Full bloom + 2 others at 14 day interval, 0 PHI
I
1 application I Foliar ground
Application Method
Foliar ground
Seed treatment
(14-21 days)
(30 days) Ground Spray
(14 days)
4 applications (7 -14 days)
Aerial or Ground Spray
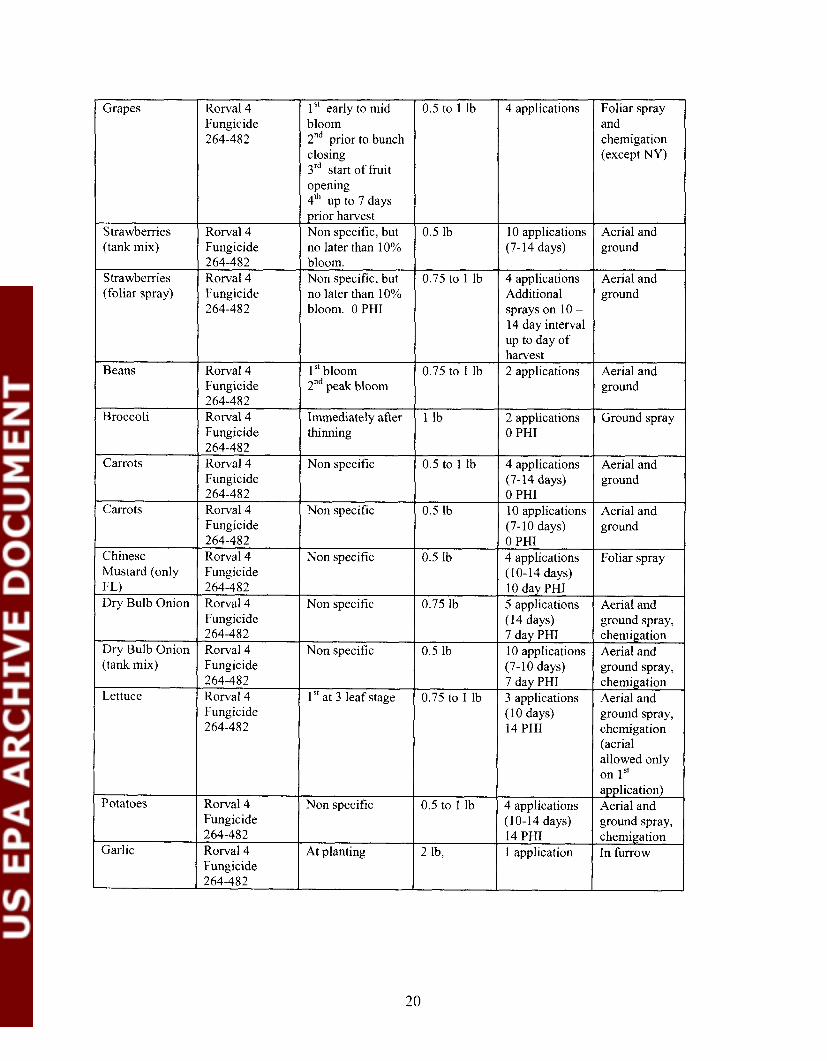
Grapes
Strawberries (tank mix)
Strawberries (foliar spray)
Beans
Broccoli
Carrots
Carrots
Chinese Mustard (only FL) Dry Bulb Onion
Dry Bulb Onion (tank mix)
Lettuce
Potatoes
Garlic
Foliar spray and chemigation (except NY)
Aerial and ground
Aerial and ground
Aerial and ground
Ground spray
Aerial and ground
Aerial and ground
Foliar spray
Aerial and ground spray, chemigation Aerial and ground spray, chemigation Aerial and ground spray, chemigation (aerial allowed only on 1 application) Aerial and ground spray, chemigation In furrow
Rorval4 Fungicide 264-482
Rorval4 Fungicide 264-482 Rorval4 Fungicide 264-482
Rorval4 Fungicide 264-482 Rorval4 Fungicide 264-482 Rorval4 Fungicide 264-482 Rorval4 Fungicide 264-482 Rorval4 Fungicide 264-482 Rorval4 Fungicide 264-482 Rorval4 Fungicide 264-482 Rorval4 Fungicide 264-482
Rorval4 Fungicide 264-482 Rorval4 Fungicide 264-482
1" early to mid bloom 2nd prior to bunch closing 3 1 ~ start of fruit opening 4Ih up to 7 days prior harvest Non specific, but no later than 10% bloom. Non specific, but no later than 10% bloom. 0 PHI
1 bloom 2nd peak bloom
Immediately after thinning
Non specific
Non specific
Non specific
Non specific
Non specific
1" at 3 leaf stage
Non specific
At planting
0.5 to 1 lb
0.5 Ib
0.75 to 1 lb
0.75 to 1 lb
1 lb
0.5 to 1 Ib
0.5 Ib
0.5 Ib
0.75 lb
0.5 lb
0.75 to 1 lb
0.5 to 1 lb
2 lb,
4 applications
10 applications (7-14 days)
4 applications Additional sprays on 10 - 14 day interval up to day of harvest 2 applications
2 applications 0 PHI
4 applications (7-14 days) 0 PHI 10 applications (7-10 days) 0 PHI 4 applications (10-14 days) 10 day PHI 5 applications (14 days) 7 day PHI 10 applications (7- 10 days) 7 day PHI 3 applications (10 days) 14 PHI
4 applications (10-14 days) 14 PHI 1 application

aerial
Foliar spray
Rice (Not in CA)
Turf
Turf (foliar drench)
I
I
I !
I
Ornamental I
'"Assuming that ( 2 ) Actual rate depends on row spacing "' Label appears to be inconsistent, max is either 3 Ib or 2.5 Ib.
Rorval4 Fungicide 264-482
Chipco Brand 260 19 Fungicide 432-891 432-889
Super GT 432- 1408 Chipco Brand 26019 Fungicide 432-891 432-889
Super GT 432-1408
26136 Fungicide 432-RURU Super GT 432-1408
rate on label refers
1 st joint movement to booting 2"d not after 75% heading Non specific
Non specific
Non specific
to product and not the
0.5 lb
17.6 oz product per 1000 ft21year (equivalent to 24 lb ai lacrelyear)
1.25 lblacre ai
0.5 to 1.25 lb
ai, ai = 0.5 x
2 applications (14 days)
6 applications
4 applications (7-14 days)
4 applications (7 to 14 days)
product
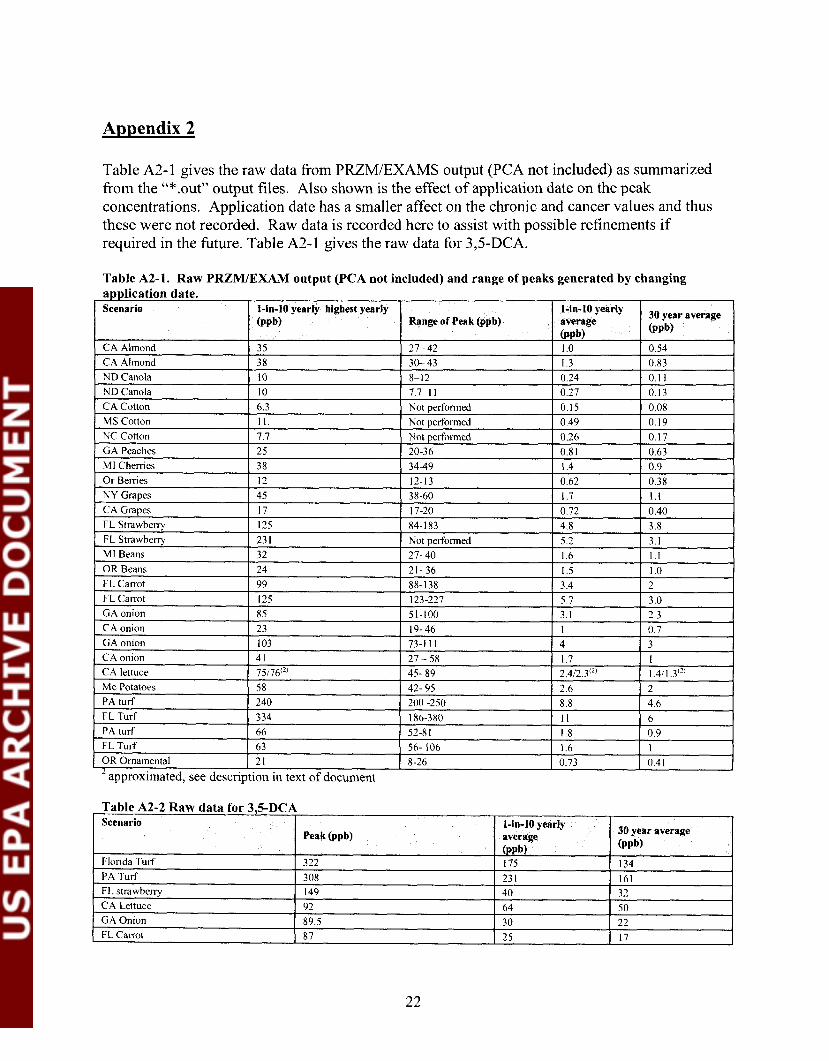
Appendix 2
Table A2- 1 gives the raw data from PRZMIEXAMS output (PCA not included) as summarized from the "*.outV output files. Also shown is the effect of application date on the peak concentrations. Application date has a smaller affect on the chronic and cancer values and thus these were not recorded. Raw data is recorded here to assist with possible refinements if required in the future. Table A2-I gives the raw data for 3,5-DCA.
Table A2-1. Raw PRZMIEXAM output (PCA not included) and range of peaks generated by changing
30 year average ( P P ~ )
0 54 0 83 0 1 1 0 13 0 08 0 19 0 17 0 63 0 9 0 38 1 1 0 40 3 8 3 1 1 I 1 0 2 3 0 2 3 0 7 3 I 1411 3"' 2 4 6 6 0 9 1 041
1-in-20 yearly average @ ~ b ) 1 0 1 3 0 24 0 27 0 15 0 49 0 26 0 81 1 4 0 62 1 7 0 72 4 8 5 2 1 6 1 5 3 4
-
5 7 3 1 1 4 1 7 2 412 3'*' 2 6 8 8 I I 1 8 1 6 0 73
application date. Scenario
CA Almond CA Almond ND Canola ND Canola CA Cotton MS Cotton NC Conon GA Peaches MI Chernes 01 Belnes NY Grapes CA Grapes FL S t~awbe~iy FL Strawbeny MI Bedns OR Bedns FL Ca~rot FL Carrot GA onlon CA onlon GA onlon CA onlon CA lettuce Me Potatoes PA turf FL Turf PA turf FL Turf OR Ornamental
approximated, see description
I-in-10 yearly highest yearly @ ~ b )
35 3 8 10 10 6 3 1 1 7 7 25 38 12 45 17 125 23 1 32 24 99 - -
125 85 23 103 41 75/76'" 58 240 334 66 63 2 1
in text of document
Range of Peak @pb)
27- 42 30- 43 8-1 2 7 7-11 Not performed Not performed Not performed 20-36 34-49 12-13 38-60 17-20 84-183 Not performed 27- 40 21-36 88-138 -- 123-227 51-100 19-46 73-1 1 1 27 - 58 45- 89 42- 95 200 -250 186-380 52-8 1 56- 106 8-26