université libre de bruxellesiridia.ulb.ac.be/iridiatrseries/link/iridiatr2006-024.pdf ·...
TRANSCRIPT

Université Libre de BruxellesInstitut de Recherches Interdisciplinaires et de Développements en Intelligence Artificielle
Games on Graphs
Francisco C. Santos
IRIDIA – Technical Report Series
Technical Report No.
TR/IRIDIA/2006-024
September 2006

IRIDIA – Technical Report Series
ISSN 1781-3794
Published by:
IRIDIA, Institut de Recherches Interdisciplinaires
et de Developpements en Intelligence Artificielle
Universite Libre de Bruxelles
Av F. D. Roosevelt 50, CP 194/61050 Bruxelles, Belgium
Technical report number TR/IRIDIA/2006-024
The information provided is the sole responsibility of the authors and does not necessarilyreflect the opinion of the members of IRIDIA. The authors take full responsability forany copyright breaches that may result from publication of this paper in the IRIDIA –Technical Report Series. IRIDIA is not responsible for any use that might be made ofdata appearing in this publication.

Universite Libre de BruxellesFaculte des Sciences AppliqueesIRIDIA - Institut de Recherches Interdisciplinaireset de Developpements en Intelligence Artificielle
Games on Graphs
par
Francisco C. Santos
Memoire presente en vue de l’obtention du Diplome d’Etudes Approfondiesen Sciences Appliquees
Annee Academique 2005/2006

2

3
Directeur de Memoire:
Prof. Hugues BersiniIRIDIA et Universite Libre de Bruxelles
Co-directeurs de Memoire:
Dr. Tom LenaertsSWITCH Lab et Flemish Institute for Biotechnology
Prof. Jorge M. PachecoUniversidade de Lisboa
Prof. Marco DorigoIRIDIA et Universite Libre de Bruxelles

4

Contents
1 Introduction 71.1 Setting the stage . . . . . . . . . . . . . . . . . . . . . . . . . 71.2 Structure and methods . . . . . . . . . . . . . . . . . . . . . . 11
2 Graphs and Simulations 152.1 Networks of contacts . . . . . . . . . . . . . . . . . . . . . . . 152.2 The Prisoner’s Dilemma Game . . . . . . . . . . . . . . . . . 192.3 Individual Fitness . . . . . . . . . . . . . . . . . . . . . . . . 192.4 Evolutionary game dynamics on graphs . . . . . . . . . . . . 202.5 Simulations . . . . . . . . . . . . . . . . . . . . . . . . . . . . 21
3 Unraveling heterogeneity e!ects 233.1 Hub dynamics . . . . . . . . . . . . . . . . . . . . . . . . . . . 243.2 Designing cooperation . . . . . . . . . . . . . . . . . . . . . . 273.3 Averaging the payo!s . . . . . . . . . . . . . . . . . . . . . . 293.4 Evolution on small communities . . . . . . . . . . . . . . . . . 293.5 Minimal model . . . . . . . . . . . . . . . . . . . . . . . . . . 313.6 Evolution under extrinsic constraints . . . . . . . . . . . . . . 333.7 Conclusions . . . . . . . . . . . . . . . . . . . . . . . . . . . . 35
4 Tackling pure small-world e!ects 374.1 Introduction . . . . . . . . . . . . . . . . . . . . . . . . . . . . 374.2 Homogeneous small worlds . . . . . . . . . . . . . . . . . . . . 384.3 Evolution of cooperation . . . . . . . . . . . . . . . . . . . . 394.4 Conclusion . . . . . . . . . . . . . . . . . . . . . . . . . . . . 42
5 Di!erent tensions, di!erent dilemmas 455.1 Introduction . . . . . . . . . . . . . . . . . . . . . . . . . . . . 455.2 Defining the Space of Social Dilemmas . . . . . . . . . . . . . 465.3 Simulations . . . . . . . . . . . . . . . . . . . . . . . . . . . . 485.4 Results and Discussion . . . . . . . . . . . . . . . . . . . . . . 50
5

6 CONTENTS
6 Social co-evolution 556.1 Introduction . . . . . . . . . . . . . . . . . . . . . . . . . . . . 556.2 A Minimal Co-evolutionary Model . . . . . . . . . . . . . . . 566.3 Setup . . . . . . . . . . . . . . . . . . . . . . . . . . . . . . . 58
6.3.1 Graphs . . . . . . . . . . . . . . . . . . . . . . . . . . 586.3.2 Evolution of strategies . . . . . . . . . . . . . . . . . . 596.3.3 Computer Simulations . . . . . . . . . . . . . . . . . . 59
6.4 Results and Discussion . . . . . . . . . . . . . . . . . . . . . . 606.4.1 Co-evolution of strategy and structure . . . . . . . . . 606.4.2 Role of selection pressure on strategy and on structure 63
6.5 Conclusion . . . . . . . . . . . . . . . . . . . . . . . . . . . . 65
List of Figures 69
Bibliography 75

Chapter 1
Introduction
1.1 Setting the stage
Being an essential ingredient of evolution, cooperation has played a keyrole in the shaping of species, from the simplest organisms to vertebrates[23]. In this context, one of the most fascinating challenges has been tounderstand how cooperation may survive in communities of self-regardingagents, a problem which has been typically formalized in the framework ofEvolutionary Game Theory [34, 25, 21], adopting the Prisoners Dilemma(PD) as a metaphor for studying cooperation between unrelated individuals[7, 6, 37, 39, 40].
A community is e"ciently modelled as a set of N agents, each one en-dowed with one of two strategies: cooperator or defector. In the one-shotPD, each pair of agents interacts only once. A defector exploiting a co-operator gets an amount T and the exploited cooperator receives S, bothagents receiving R upon mutual cooperation and P upon mutual defection,such that T > R > P > S. Therefore, it is best to defect regardless ofthe opponent’s decision. In well-mixed populations, in which each agentinteracts with all other agents, evolution under replicator dynamics [25, 21]shows that cooperators are unable to resist invasion by defectors. The fateof cooperators is somewhat alleviated whenever the PD evolves on a spa-tially structured population [39], such that agents are constrained to playwith their nearest neighbours. Indeed, in spatially structured populationscooperators are now able to resist invasion by defectors, but only for a verylimited range of game parameters. Nevertheless, the impact of topologicalconstraints is known to induce profound evolutionary e!ects, as beautifullydemonstrated experimentally in the study of the evolution of di!erent strainsof Escherichia coli [27].
The two scenarios described above may be naturally associated withregular graphs (Figure 1.1a), in which agents occupy the vertices and theNetwork Of Contacts (NOCs) is defined by the edges linking the vertices.
7

8 CHAPTER 1. INTRODUCTION
Figure 1.1: NOCs a) Regular graph with N = 12 vertices and z = 4 edgeseach. z = N−1 leads to a complete graph. b) Small-World graphs, obtainedby rewiring all edges in a) with probability pSW = 0.2 (see main text). c)Random graph, the limit pSW = 1. d) Scale-free graph, generated usingmodel of Barabasi-Albert for m = m0 = 2; Histograms : Degree distribu-tions d(k) computed for each type of graphs and N = 104; d(k) = Nk/N ,where Nk gives the number of vertices with k edges. In all cases the averageconnectivity z of the graphs is 4.

1.1. SETTING THE STAGE 9
They correspond to homogeneous NOCs, in the sense that all agents aretopologically equivalent, having the same number of neighbours, such thatthe associated graphs exhibit a characteristic single-peak shape for the de-gree distribution d(k), defined and illustrated in Figure 1.1.
Recently, compelling evidence has been accumulated that a plethora ofnatural, social and technological real-world NOCs are heterogeneous [9, 4,3, 16], exhibiting multi-peaked degree distributions Figure 1.1, reflecting thediversity of connections of di!erent agents. Moreover, they often portray thecoexistence of local connections (spatial structure) with non-local connec-tions (or shortcuts). The celebrated small-world graphs [57] and scale-freegraphs [9] illustrated in Figure 1.1 provide examples of such NOCs, whichhave been recently associated with realistic NOCs.
The heterogeneity of NOCs is known to have a strong impact in di!erentfields, notably epidemiology, the case of AIDS constituting a paradigmaticexample [33]. At the heart of the theory, heterogeneity leads to an ubiq-uitous modification of the basic reproductive number R0, which ultimatelydefines the threshold for epidemic outbreaks [32, 5, 33] . Compared to itshomogeneous counterpart, the modified R0 grows proportionally to the sec-ond moment of the degree distribution, so that on extreme heterogeneousNOCs, such as scale-free NOCs, the likelihood of epidemic outbreaks dra-matically increases. This, in turn, is associated with the fact that, sincenow di!erent individuals undergo di!erent numbers of contacts, highly con-nected individuals will naturally acquire higher chance of infecting others(becoming infected) whenever they are infected (susceptible).
How does heterogeneity a!ect the co-evolution of defectors and cooper-ators under natural selection?
In heterogeneous populations, di!erent agents will typically undergo adi!erent number of interactions, which in turn will proceed along di!er-ent patterns of connectivity. Since the payo! accumulated by each agentthroughout one generation (see below) will be used as its fitness, dictatingthe success with which the agents strategy will be replicated in the nextgeneration, heterogeneity will certainly have an impact on the co-evolutionof defectors and cooperators.
Figure 1.2 illustrates a detail of a typical heterogeneous community. Weconcentrate on two focal agents, a cooperator with N1 neighbours (N1 = 7),and a defector with N2 neighbours (N2 = 5), and let us imagine that bothhave the same number of defectors, say (ND = 2). After interacting withall their neighbours, the cooperator accumulates a payo! of
PC = (N1 −ND).R + ND.S (1.1)
whereas the defector ends up with
PD = (N2 −ND).T + ND.P (1.2)

10 CHAPTER 1. INTRODUCTION
Figure 1.2: Individual interactions in heterogeneous NOCs. Fitness corre-sponds to the payo! accumulated after each agent interacts with all neigh-bours, which maybe di!erent in number and kind (cooperators, circles ordefectors, squares) for di!erent agents. The focal cooperator and defector,connected via the solid edge have both two defector neighbours among a to-tal of seven and five, respectively (dashed edges). At the end of a generationtheir fitness is indicated. Depending on the payo! matrix, the cooperatormay end up with a higher or lower fitness than the defector. In a ho-mogeneous network in which both agents would have the same number ofdefectors as neighbours, defectors would always have a fitness advantage.

1.2. STRUCTURE AND METHODS 11
If the NOCs were homogeneous, all one needs to do is to make N1 = N2
= z, the average connectivity of the population, in the previous expressions.This, however, leads to very di!erent outcomes in what concerns the accu-mulated payo!s in homogeneous and heterogeneous NOCs. Indeed, whereasin homogenous NOCs the answer to whether PD < PC relies exclusivelyon the relative ordering of (T,R,P,S), in heterogeneous NOCs the answerdepends now on the fact that N1 "= N2 . In other words, the pattern ofconnectivity also contributes to define the accumulated payo! of each indi-vidual, a feature which, being natural, is absent in homogeneous NOCs. In-deed, heterogeneity embeds the intuition that agents pertaining to di!erentneighbourhoods are involved in di!erent patterns of connectivity, opening anew route to the evolution of cooperation: Cooperators will increase theirfitness to the extent they succeed in maximizing their amount of coopera-tive interactions per generation. However, defectors will also increase theirfitness by exploiting more cooperators per generation. Therefore, it remainsan open problem who defectors or cooperators will be able to profit fromheterogeneity, and to which extent.
1.2 Structure and methods
The previous example illustrates nicely how the structure of the popula-tion and the way agents choose to interact may change the final outcomeof this evolutionary process. Although, it is absolutely non trivial to assignan answer to it. Is the most rational strategy dependent on the underlyingties that defines a certain community of interacting agents? How will therational player act? This thesis constitues a small contribution to the un-derstanding of role played by topological features of social networks in theindividual behaviour. We shall use a very minimal model in order to reducethe amount of free parameters, to easily understand the topology’s contri-bution. Because no analytic solutions exist for this problem, agent-basedsimulations [39, 24] provide a viable alternative to study the evolution ofcooperation in realistic populations, a framework we shall adopt here.
We shall use extensively the recent developments in the area of complexnetworks, which have been able provide important inputs in all major sci-entific areas. Complex network researchers have found that a great varietyof real-world systems can be mapped and represented as networks, openinga unifying research track that can be followed by scientists from physicsand computer science to biology and social sciences. We tried to includesuch advances together with its abstract and multi-disciplinar point of view,which is also in the base of most of the research made in the Artificial Lifedomain.
It is noteworthy that biologically and sociologically [13] inspired modelshave been on the basis of several studies of the emergence of cooperation,

12 CHAPTER 1. INTRODUCTION
both in the framework of artificial intelligence [28] and Artificial Life re-search [2]. Nonetheless, the inherent complexity of the problem leads to ar-tificial individual agents which, instead of embodying an intrinsically adap-tive structure, often exhibit a pre-defined (and complex) set of rules whichare used to establish cooperation. Here we undertake a di!erent approach,in which individual agents are devoid of any complexity, capable only ofadopting a (binary) strategy. However, the individual strategy is allowed toevolve and, therefore, to adapt to the context in which such a simple agentis immersed which, as will be shown, may lead to surprisingly cooperativescenarios, whenever the adaptive co-evolution of these strategies takes placein populations with a structure exhibiting context preservation.
Such approach ends up in a very simple framework. Perhaps even over-simplified. Most biologists and social scientists may argue that this modelsmay never grasp Life in it, and even when we increase the complexity ofthe system, the modeller, as is often stated, will be always missing ”some-thing”. Against this, it’s hard to argue [54]. We don’t believe that is thepoint of mathematical, computational and abstract modelling of biologicalphenomena. First, by simplifying reality, it becomes easier to be simulated.This may sound a curious argument, besides its obvious practical relevance.But, in fact, no matter how powerful is your computer, it will be always toounsophisticated to simulate all details of social and biological characteristicsof animal behaviour, the all set of intricate ties of our neural network or thecomplete reaction networks which maintain all living cells[54]. Second, eventhe simplest model can give the answer, or at least important insights, abouta certain problem, since it’s able to attain its essential biological features.The identification of this aspects of living systems is obviously not easy,but we can easily say that, for instance, the game theory framework usedin this thesis can be quite successful on that task for some kinds of prob-lems. Furthermore, considering the power of simple systems representingnature, traditionally given by mathematics, physics and dynamical systems,in which completely unpredictable outcomes raise from the most fundamen-tal and straightforward equations, it is hard to neglect the contributionsgiven by such kind of abstract approaches.
The structure of this thesis is the following. In the next chapter, wesuccinctly introduce the basic methods and assumptions that will providethe basis for the following chapters. The evolutionary algorithms are pre-sented together with complex networks methods and concepts which are inthe core of our results. After that, we extensively explore the implicationsof an heterogeneous network of contacts under the well known Prisoner’sdilemma metaphor[49, 53]. After understanding the role played by topolog-ical heterogeneity, we try to understand the role played by other topologicalfeatures that ofter remain hidden under the powerful shade of heterogeneity.This track is followed in chapter 4. We introduce a new kind of small-worldnetwork where the degree distribution remain unchanged, while other net-

1.2. STRUCTURE AND METHODS 13
work characteristics may change[52]. Under this framework we revisit thePrisoner’s dilemma and explore its outcome. This chapter is followed by acomplete study of all possible dilemmas in structured populations[50]. Theevolutionary algorithm (stochastic replicator dynamics[39, 48]) is general-ized and a 2D space of all kinds of social tensions is introduced. By meansof this social dilemmas’ cartography, we were able to study the influence oftopological features in all kinds of dilemmas. Finally, in the last chapter,we consider a system where the network is no longer static and evolves inthe same way as strategies evolve[51]. In first part of the thesis, we showedhow the topology influence the dynamics defined on a graph. In this lastchapter, we show how the dynamics of cooperation influence the topologicalevolution evolution of social networks. We start the thesis by explainingthe influence of real world topologies in social dynamics, and we end upexplaining the formation of such real world topologies, as a result of socialtensions and dynamics. This topological evolution was previously calledmeta-dynamics [10, 14, 15, 12], and the delicate relationship between thedynamics and meta-dynamics of a system has been extensively studied inthe framework of artificial chemical and biological networks, artificial im-mune systems and Hopfield networks (for an overview of the work in thisarea, check ref[11]). This final chapter may represent an extension of thoseideas to social systems and networks.

14 CHAPTER 1. INTRODUCTION

Chapter 2
Graphs and Simulations
2.1 Networks of contacts
The histogram degree distribution d(k) illustrated in Fig. 1 is defined, foreach particular graph with N vertices, as
d(k) =Nk
N(2.1)
where Nk gives the number of vertices with k edges. In terms of the degreedistribution, the average connectivity can be written as
z =!
kd(k) (2.2)
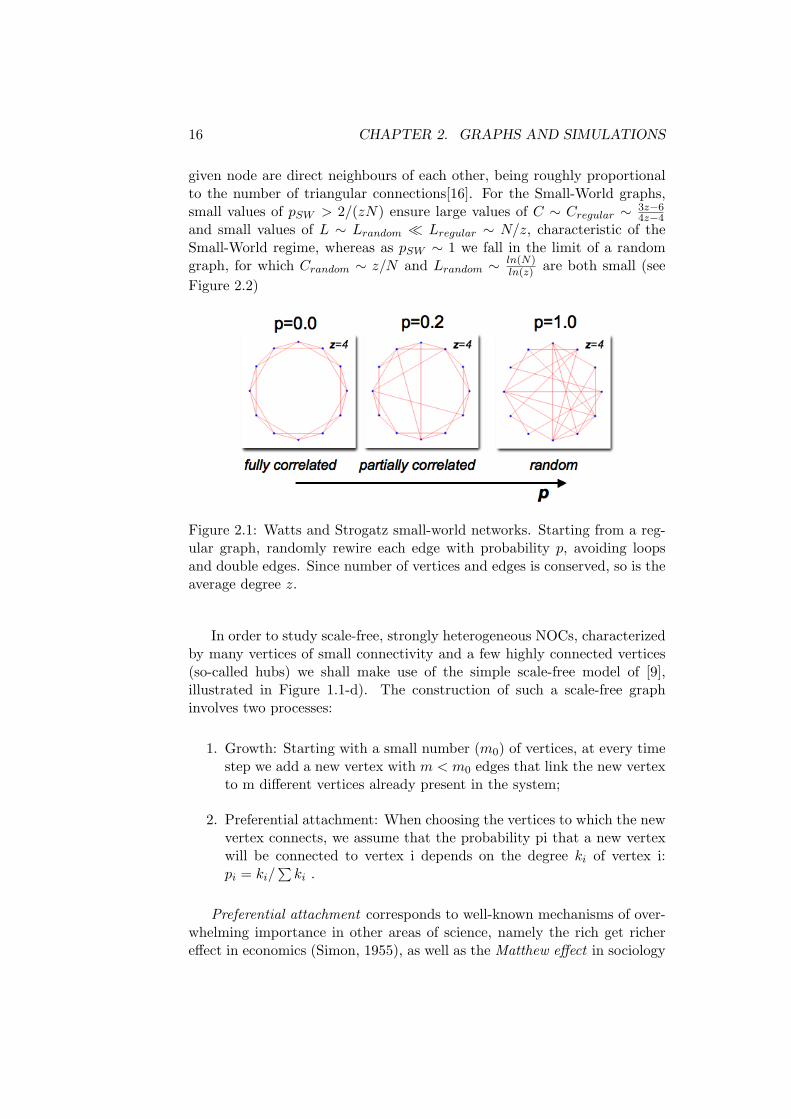
We shall consider two basic types of heterogeneous NOCs: Watts-StrogatzNOCs [57], for which heterogeneity is moderate, and scale-free NOCs, forwhich heteregeneity is strong. Starting from a regular ring Figure 1.1-awith a fixed number N of vertices with z connections per vertex, we gen-erate a Watts-Strogatz graph by rewiring, with probability pSW , each edgeof the graph Figure 1.1-b. Rewiring means here replacing the original edgemaintaining its origin and choosing randomly the ending vertex, such thatself-connections loops and double connections are excluded. For pSW = 0,we have a regular graph, whereas for pSW = 1 we obtain a graph very sim-ilar to a random graph, except that there are no vertices with connectivitysmaller than z/2 (see Figure 2.1). The larger the probability pSW , the moreheterogeneous is the associated graph (Figure 1.1-c). Besides the degree dis-tribution d(k), the probabilistic nature of the construction of Watts-Strogatzsmall worlds graphs leads to many di!erent realizations of NOCs for givenvalues of parameters. Consequently, other quantitities provide additionalinformation which characterizes a given class of NOCs namely, the averagepath length L, providing the number of edges in the shortest path betweentwo nodes, averaged over all pairs of vertices, and the cluster coe"cientC, which provides a measure of the extent to which direct neighbours of a
15
16 CHAPTER 2. GRAPHS AND SIMULATIONS
given node are direct neighbours of each other, being roughly proportionalto the number of triangular connections[16]. For the Small-World graphs,small values of pSW > 2/(zN) ensure large values of C ∼ Cregular ∼ 3z!6
4z!4and small values of L ∼ Lrandom $ Lregular ∼ N/z, characteristic of theSmall-World regime, whereas as pSW ∼ 1 we fall in the limit of a randomgraph, for which Crandom ∼ z/N and Lrandom ∼ ln(N)
ln(z) are both small (seeFigure 2.2)
Figure 2.1: Watts and Strogatz small-world networks. Starting from a reg-ular graph, randomly rewire each edge with probability p, avoiding loopsand double edges. Since number of vertices and edges is conserved, so is theaverage degree z.
In order to study scale-free, strongly heterogeneous NOCs, characterizedby many vertices of small connectivity and a few highly connected vertices(so-called hubs) we shall make use of the simple scale-free model of [9],illustrated in Figure 1.1-d). The construction of such a scale-free graphinvolves two processes:
1. Growth: Starting with a small number (m0) of vertices, at every timestep we add a new vertex with m < m0 edges that link the new vertexto m di!erent vertices already present in the system;
2. Preferential attachment: When choosing the vertices to which the newvertex connects, we assume that the probability pi that a new vertexwill be connected to vertex i depends on the degree ki of vertex i:pi = ki/
"ki .
Preferential attachment corresponds to well-known mechanisms of over-whelming importance in other areas of science, namely the rich get richere!ect in economics (Simon, 1955), as well as the Matthew effect in sociology

2.1. NETWORKS OF CONTACTS 17
Figure 2.2: Dependence of the Cluster coe"cient (C) and average pathlength in the parameter pSW . In the interval 0 < pSW < 0.1, as one increasepSW , inside this interval the value of L drops significantly compared withLregular, where C ∼ Cregular. For 0.1 < pSW < 1.0, L remains small whereasC drops significantly.

18 CHAPTER 2. GRAPHS AND SIMULATIONS
[36]. After t time steps this algorithm produces a graph with N = t+m0 ver-tices and mt edges. Because vertices appear at di!erent moments in graph-generation time, so-called age-correlations arise [3, 16](see Figure 2.3). Inorder to single out the role of heterogeneity in evolution, we subsequentlyexchange randomly and repeatedly the ends of pairs of edges of the originalgraphs [31, 38], in this way eliminating any type of correlations betweenthe vertices, without changing the scale-free degree-distribution. In ourstudy, scale-free graphs with N individuals have been generated, startingwith m = m0 = z/2 vertices and iterating the appropriate number of time-steps until N vertices are created. It is on top of these graphs that we initiatethe evolutionary studies with the PD.
For Scale-Free graphs generated by this method, typically[16] the ClusterCoe"cient C ∼ Cregular whereas L ∼ ln(N)
ln(ln(N)) , reflecting the ultra-smallworld neature of these networks.
Figure 2.3: Age correlations in the Barabasi and Albert growing model. Asis easy to see, as a result of the growing process, older the nodes the moreconnected they become.
In all our simulations, the NOCs will be associated with static graphs(that is, topology remains unchanged throughout evolution) with as manyvertices as agents in the population, each agent adopting a well-definedstrategy cooperator or defector. Since we fix the size N and the averageconnectivity z, in all cases the number of edges of all graphs will be thesame.

2.2. THE PRISONER’S DILEMMA GAME 19
2.2 The Prisoner’s Dilemma Game
Following [39], we shall adopt a simple one-parameter formulation of thePD such that 2 ≥ (T = b) > (R = 1) > (P = S = 0), b representing thetemptation to defect. Given a population of N agents (the N vertices ofthe graph), inter-connected following the edges of the graph, during eachgeneration (which constitutes our unit of discrete evolutionary time), allpairs of individuals x and y, directly connected, engage in a single round ofthe game, their accumulated payo! being stored as Px and Py, respectively.This means that during one generation, there will be as many rounds ofthe game as edges in the NOCs. At the end of a generation, after all indi-viduals have played once with all their partners, all strategies are updatedsynchronously, that is, one selects which strategy will occupy each vertex inthe next generation simultaneously for all vertices.
2.3 Individual Fitness
At the end of a generation agents will have an accumulated payo! resultingfrom their one-round interactions with each of their immediate neighbours.This accumulated payo! is associated with the individual fitness, which inturn dictates whether the strategy located in a given vertex will be replicatedto the next generation or, instead, will be replaced by the strategy of a betterfit neighbour.
In their seminal work Foster and Young [20] introduce stochastic e!ectsin order to account, among other features, for the variability in the numberof individuals of a given type who meet individuals of another type in anygiven time period. Clearly, in biological terms not only quality but alsoquantity actually [23]. As such, the accumulated payo! provides a naturalchoice for the individual fitness of these agents at the end of their life-cycle (one generation) and , due to the heterogeneity of the network ofcontacts, accounts for the fact that di!erent individuals interact at di!erentrates throughout their life span. Such a choice for fitness goes in line withrecent studies on cooperation [1] economics [26] social learning [60] and therecently developed evolutionary graph theory [29]. In this way agents havethe opportunity to explore heterogeneity to increase the chance of survival oftheir strategy to the next generation. We make no discrimination whatsoeverwith respect to who may benefit from that : Both cooperators and defectorsmay profit from such a possibility.
A more realistic model, on the other hand, should not overlook thatindividuals who interact more may expend more energy in doing so, whichwould likely act to e!ectively diminish their fitness. The work of Jacksonand Wolinsky [26] provides a feasible pathway towards inclusion of suchrefinements. A simpler (and cruder) model would be to impose a cuto! in

20 CHAPTER 2. GRAPHS AND SIMULATIONS
the maximum number of interactions that each individual may engage onper generation, in this way redefining the underlying NOCs.
Other studies, on the other hand, have adopted the criterium of dividingthe accumulated payo! by the number of interactions that each agent en-gages on. The rationale behind such a procedure may be generally relatedto the assumption that agents interact at a similar rate, a feature whichwould favour such averaging.
Although we believe this reasoning is not in accord with what happens inrealistic settings, both biological and social, we shall also study the evolutionof cooperation making use of such artificial procedure. Clearly, the previousdiscussion in connection with Figure 1.2 may be easily extended to the casein which averaging of accumulated payo!s is performed, showing that evenin this case heterogeneity plays a role, in spite of its natural attenuation dueto the partial cancellation resulting from averaging.
2.4 Evolutionary game dynamics on graphs
At the end of a generation, the strategy associated with a given vertex xwill be replicated or not to the next generation according to the followingtransition probabilities, which constitute the finite population analogue ofreplicator dynamics [21, 24], to which the results of our simulations convergein the limit of well-mixed populations (a complete, regular graph with z =N − 1) :
We first select a neighbour y at random among all kx neighbours ofx. If Py < Px the vertex x will maintain the same strategy in the nextgeneration. Otherwise, the strategy occupying vertex x will be replaced bythat associated with vertex y with a probability
p =Py − Px
k>(T − S), (2.3)
where k> is the largest between kx and ky, ensuring that 0 ≤ p ≤ 1.The present results are very robust with respect to changes in the de-
tailed form used for strategy update : No qualitative changes occur if weadopt an asynchronous updating of strategies [24] as well as if we replacethe denominator k>(T − S) in p by, for example, kmax(T − S), with kmax
the maximum degree of connectivity of the network. However, we believethat the update rule we adopted is more suitable to describe the (necessar-ily) simple biological entities which may be modelled as engaging in roundsof such a simple game. Indeed, the present update rule does not requiresophisticated cognitive capabilities at an individual level, since informationprocessed by each agent is restricted to his immediate neighbourhood. Onthe contrary, replacing k> by kmax implies that individuals must be awareof the entire network topology, which requires extraordinary cognitive capa-bilities in communities with 104 individuals.

2.5. SIMULATIONS 21
Figure 2.4: Evolutionary dynamics on graphs. The box in the bottomrepresents the equivalent of the replicator dynamics equation (top) whenz = N − 1.
2.5 Simulations
Individuals are connected to vertices on rings with N = 104 vertices, suchthat each graphs has as many vertices as agents; we used the values z =4, and m = m0 = 2 (z =< d(k) >= 2m). Following [24], equilibrium fre-quencies of cooperators and defectors are obtained by averaging over 103
generations after a transient time of 104 generations. We confirmed that av-eraging over larger periods or using di!erent transient times did not changethe results, although the transient period depends on z and N. Simulationsstart with an equal percentage of strategies cooperators and defectors -randomly distributed among the elements of the population. For di!erentvalues of the parameters, the evolution of the fraction of cooperators whosurvive evolution as a function of b for the PD has been computed. Tothis end, each data point depicted in the figures corresponds to an averageover 100 simulations: 10 realizations of the same type of NOCs specifiedby the appropriate parameters (N, z, m = m0) and 10 runs for each of therealizations.

22 CHAPTER 2. GRAPHS AND SIMULATIONS

Chapter 3
Unraveling heterogeneityeffects
The results of our agent-based simulations for Watts-Strogatz NOCs arepresented in Figure 3.1. It is shown what happens as one moves away fromregularity, such that d(k) is no longer a delta distribution (we consistentlyinterpret z as < d(k) >, the average value of the degree distribution). Inthe interval 2/(zN) < pSW < 0.1, in the Small-World regime, the shapeof the curve for the frequency of cooperation gets gradually smoother withincreasint pSW , up to the shape shown for pSW = 0.1. As one increase pSW
inside this interval, the value of L drops significantly compared with Lregular,where C ∼ Cregular. For 0.1 ≤ pSW ≤ 1.0, L remains small whereas C dropssignificantly. For large pSW we observe an overall enhancement of cooper-ation, which constitutes a remarkable result. It is clear that heterogeneity,though moderate, strongly a!ects the evolution of cooperation. Moreover,the results indicate that cooperators profit more from heterogeneity thandefectors, with a resulting sizeable enhancement of cooperation, when com-pared to the results associated with homogeneous NOCs.
Since the heterogeneity of Watts-Strogatz NOCs is moderate when com-pared to real-world NOCs, it is worth investigating the impact of morerealistic scale-free NOCs in the evolution of cooperation. To this end letus start with scale-free model of Barabasi and Albert, illustrated in Figure1.1-d). However, and in order to single out the scale-free features of theNOCs, without introducing any additional age-correlations, let us random-ize the connections without changing the degree-distribution, as detailed inthe previous chapter.
The results obtained on such random scale-free NOCs are shown in Fig-ure 3.2 with solid squares, and unravel an additional enhancement of cooper-ation as a result of such strong heterogeneous features. Indeed, now cooper-ators are able to resist invasion by defectors for all values of the temptationto defect b. This remarkable result shows clearly that cooperators benefit
23

24 CHAPTER 3. UNRAVELING HETEROGENEITY EFFECTS
Figure 3.1: Fraction of cooperators for Small-World network of contacts(NOCs) of Watts and Strogatz, for di!erent values of pSW . An overallenhancement of cooperation is observed with respect to well mixed limit(were cooperation is doomed for all values of b) and regular graphs, althoughcooperation is better sustained for small values of the benefit (b).
most from the heterogeneity of the NOCs.Further insight into the mechanism responsible for the strong enhance-
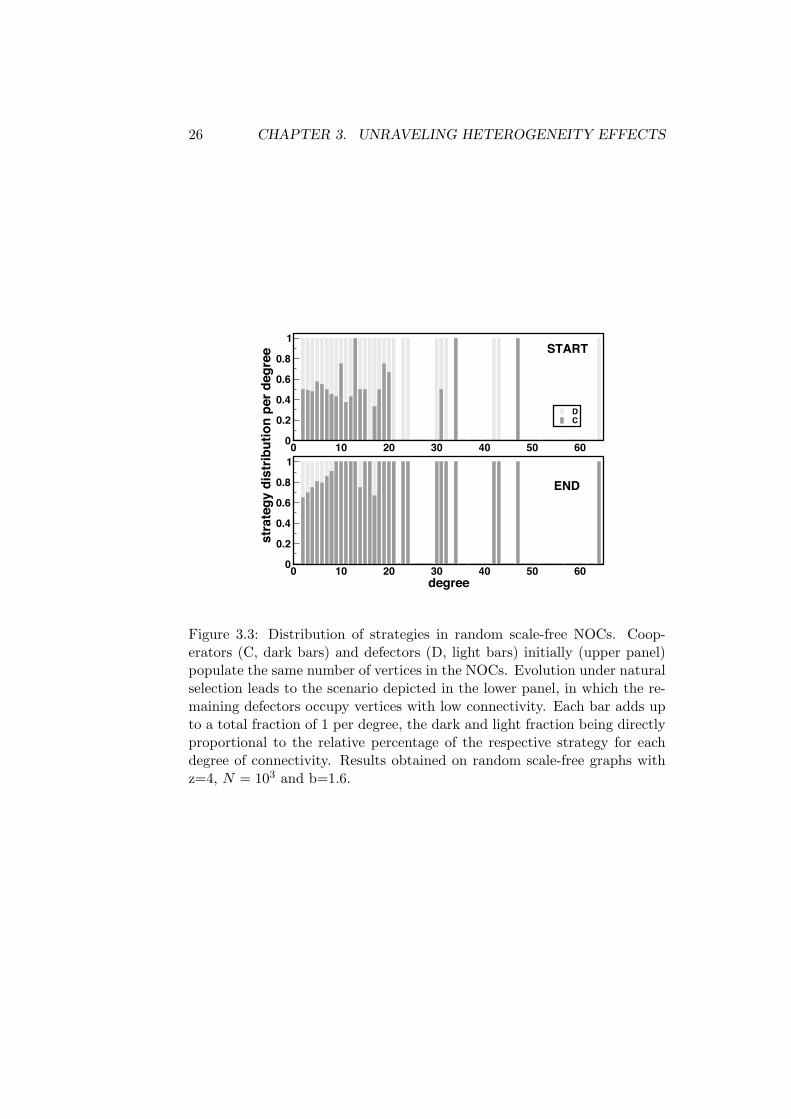
ments depicted in Figure 3.2 is provided by the results shown in Figure 3.3,in which we plot the relative distribution of strategies per degree, whichallows one to assess directly which degree is preferred by which strategythroughout evolution: In the beginning (upper panel), strategies are equallydistributed. Evolution leads to a stationary regime (lower panel) in whichthe distribution becomes strongly asymmetric. Indeed, cooperators occupyall (few) vertices of high degree, whereas defectors manage to survive onlyon vertices of moderate degree. How can this happen?
3.1 Hub dynamics
From an individual agent perspective, and given two individuals x and y ,if x is a cooperator (defector), y’s strategy which maximizes x’s payo! in aone-shot prisoners dilemma will be given by max(R,S) ( max(T,P) ) corre-sponding, in both cases to a cooperator. In other words, it is better both fordefectors and cooperators to be surrounded by cooperators. As such, highlyconnected defectors surrounded by a significant amount of cooperators willbe very successful. The more successful they become, the easier it will be

3.1. HUB DYNAMICS 25
Figure 3.2: Evolution of cooperation in heterogeneous NOCs. The fractionof cooperators in the population which survive evolution is plotted as afunction of the temptation to defect b for random NOCs (solid circles) andtwo types of scale-free NOCs: Random (solid squares) and age-correlated(solid triangles), according to the model of Barabasi-Albert. Results forregular, homogeneous NOCs are shown with a solid line. In all cases andz=4 and N = 104. Heterogeneity generally promotes cooperation, whichmay dominate via introduction of special correlations among the agents inthe population.
26 CHAPTER 3. UNRAVELING HETEROGENEITY EFFECTS
0 10 20 30 40 50 600
0.2
0.4
0.6
0.8
1
DC
0 10 20 30 40 50 60degree
0
0.2
0.4
0.6
0.8
1
s
trate
gy d
istr
ibu
tio
n p
er
deg
ree START
END
Figure 3.3: Distribution of strategies in random scale-free NOCs. Coop-erators (C, dark bars) and defectors (D, light bars) initially (upper panel)populate the same number of vertices in the NOCs. Evolution under naturalselection leads to the scenario depicted in the lower panel, in which the re-maining defectors occupy vertices with low connectivity. Each bar adds upto a total fraction of 1 per degree, the dark and light fraction being directlyproportional to the relative percentage of the respective strategy for eachdegree of connectivity. Results obtained on random scale-free graphs withz=4, N = 103 and b=1.6.

3.2. DESIGNING COOPERATION 27
to invade most of their cooperator neighbours. However, in doing so theirfitness will tend to decrease, since defector-defector interactions contributeless to fitness than defector-cooperator interactions. As a result, highlyconnected defectors see their fitness decrease down to values comparable tothose attained by the remaining cooperator neighbours, which will then geta chance to invade such a highly connected vertex (hub).
Once cooperators manage to invade such (few) hubs, the situation changesprofoundly. Indeed, as stated before, cooperators benefit most by interactingwith like cooperators. Therefore, as their fitness increases, so will increasethe fraction of their neighbours which become cooperators, a feature whichacts to self-sustain the cooperators sitting on such hubs. In other words,once a cooperator invades a hub, his fitness will rapidly increase, makingit very di"cult to become invaded by a defector. This, in turn, can onlyhappen to the extent that the NOCs are heterogeneous, since in this waycooperators will maximize their fitness by maximizing the number of coop-erative interactions. On the other hand, the previous discussion exemplifieshow heterogeneity may be evolutionary disadvantageous to defectors. In-deed, via this mechanism cooperators manage to outperform defectors andendure evolution under natural selection.
The previous line of reasoning is entirely corroborated by the study ofthe following odd configuration, in which we show the evolutionary dynam-ics of a single defector in an otherwise cooperative population in scale-freeNOCs. In the homogeneous limit we know that such initial configurationwill lead to the rapid extinction of all cooperators for the values of b em-ployed in Figure 3.4 : b = 1.5 and b = 1.9. For scale-free NOCs, it is easy toconvince oneself that the most advantageous location for placing a single de-fector is on the vertex with largest connectivity. Starting from this scenario,the evolutionary dynamics is startling, as shown in Figure 3.4 . The initialdefector quickly invades roughly 80% of the nearest (cooperative) neigh-bours. This will reduce his fitness in such a way that a cooperator nearbysuceeds in invading. Cooperator invasion leads to the steep jump observed inthe percentage of cooperators surrounding the cooperator hub, providing animpressive account of the self-sustaining e"ciency induced by a cooperator-hub. Finally, Figure 3.4 shows that, in what concerns the largest hub in theNOCs, the actual value of b acts only to delay the number of generationsrequired for invasion to take place. This result, however is not general andrelies on the special initial conditions chosen here.
3.2 Designing cooperation
Understanding how cooperators manage to outperform defectors enables usto design NOCs in which cooperators may acquire an overall evolutionaryadvantage. In fact, the original NOCs of Barabasi-Albert provide an ex-

28 CHAPTER 3. UNRAVELING HETEROGENEITY EFFECTS
Figure 3.4: Evolution of cooperators around largest hub. Starting with asingle defector placed in the hub with largest connectivity, the fraction ofdirect neighbours who are cooperators is computed throughout evolution, fora population of N = 104 individuals, and for the two values of b indicated.The overall behaviour, independent of b, shows that the initial defectorinvades approximately 80% of its immediate neighbours, after which thelargest hub is invaded by a cooperator (originating typically from anotherhub, taking place right before each jump), leading to a rapid saturation ofthe hub’s neighbours with cooperators.

3.3. AVERAGING THE PAYOFFS 29
cellent means to this end, since growth and preferential attachment lead toNOCs which exhibit age-correlations between vertices, very convenient forthis purpose. Indeed, during graph generation the older vertices are notonly those which exhibit largest connectivity, but also they become natu-rally interconnected with each other. Such direct inter-connections providean ideal scenario for highly-connected cooperators to self-sustain each other.Indeed, once hubs are occupied by cooperators, the fact that they are di-rectly connected means that it will be even harder for defectors to invadecooperator-hubs. In other words, cooperator-hubs protect each other fromdefector invasion, which will naturally result in an enhancement of cooper-ation. This reasoning is fully supported by the corresponding results shownin Figure 3.2 with solid triangles, where cooperators now dominate over theentire range of values of b, whenever populations exhibit such age-correlationpatterns of connectivity between individuals. Taking into account that thedegree distributions of the NOCs used to generate both age-correlated andrandom scale-free results coincide, the results of Figure 3.2 put in evidencethe power of this mechanism. As expected, cooperation will be suppressedwhenever the edges which directly connect the strong cooperators are artifi-cially clipped by hand. In retrospect, the random scale-free NOCs consideredbefore provide an automatic means to destroy such links.
3.3 Averaging the payoffs
Finally, we would like to point out that the results for the evolution of co-operation are a!ected if, instead of using the accumulated payo! for eachagent, its fitness is associated with the accumulated payo! divided by thenumber of interactions each agent engages during his life-cycle. The corre-sponding results are shown in Figure 3.5, which shows that heterogeneity isstill capable of promoting cooperation, in particular ensuring the survivalof cooperators to larger values of the temptation to defect, when comparedto the results in homogeneous populations. Nonetheless, it is clear thatby averaging the payo!s, the mechanisms discussed before will be severelyhampered, as such precluding the clear cut dominance of cooperators overdefectors obtained.
3.4 Evolution on small communities
How does cooperation evolve in small communities? Clearly, for small com-munities the concept of a Scale-Free degree distribution lacks a precise mean-ing. As such, it is worth investigating what happens as we decrease the pop-ulation size. To this end, we have repeated the simulations carried out inconnection with Fig.3.2 for N = 104, but now for smaller population sizes.Figure 3.6 shows the results obtained for N=512 (upper panels) and N=128

30 CHAPTER 3. UNRAVELING HETEROGENEITY EFFECTS
Figure 3.5: Evolution of cooperation in heterogeneous NOCs with averagedpayo!s. The fraction of cooperators in the population which survive evolu-tion is plotted as a function of the temptation to defect b for random NOCs(solid circles) and the scale-free NOCs, generated according to the modelof Barabasi-Albert (solid triangles). In both cases z = 4 and N = 104.Although the incidence of cooperators is strongly suppressed whenever av-eraging of payo!s is enforced, the survivability of cooperators is sizeablyenhanced when compared to regular graphs, without any sharp transitionto zero. Clearly, by averaging the payo!s of each individual one is preclud-ing cooperators from taking advantage of the heterogeneity of the NOCs tooutperform defectors.

3.5. MINIMAL MODEL 31
(lower panels) for both types of NOCs considered in before, such that allsimulations were performed for an average connectivity z = 4 . The resultsclearly demonstrate that the evolution of cooperation in small communitiesevolves very much in the same way as it does in much larger ones. In otherwords, growth and preferential attachment cooperate to produce NOCs inwhich cooperation dominates. For values of N smaller than N ≈ 100, theaverages over many realizations of graphs of a given type do not convergeto a well defined value, a feature which is not surprising, taking into ac-count the probabilistic rules of construction of the graphs. Indeed, for smallvalues of N, stochastic extinction of cooperators or defectors happens forparticular realizations of a given NOCs, as such precluding a clear cut resultfor the evolution of cooperation. This feature is a size e!ect which clearlydisappears for large N.
3.5 Minimal model
How realistic are the SF NOCs studied so far ? Empirical evidence gatheredto date [16] indicates that in social and biological NOCs:
1. vertices of highest connectivity exhibit degrees substantially lower thanthose produced with the simple Barabasi and Albert model;
2. display values for the cluster coe"cient which are much larger thanthose obtainable with that model (the cluster coe"cient provides ameasure of the extent to which direct neighbours of a given vertexare direct neighbours of each other, being roughly proportional to thenumber of such triangular connections).
Furthermore, one may argue that the single-round PD suits best interactionsbetween simple organisms [27], unable to retain memory of past encountersas well as to anticipate future encounters. For such organisms, growth canbe easily envisaged as an active mechanism during the generation of NOCs,whereas preferential attachment seems too sophisticated as a rule. Indeed,preferential attachment, in the way formulated by Barabasi and Albert, re-quires that the newly added individual is aware of the entire topology of theexisting network, so that a decision may be taken based on the connectivityof each individual in the population, a feature which is unlikely for sim-ple organisms and/or large communities. On the contrary, these organismsmost likely adopt local rules of attachment, in reaction to local propertiesof the NOCs, and independent of its global topology. In this context, theminimal model of SF NOCs recently developed [17] provides a nice meansof overcoming these di"culties. Indeed, not only the NOCs generated ac-cording to the minimal model lead to NOCs exhibiting the same power-lawdegree-distribution obtained with the Barabasi and Albert model, of the

32 CHAPTER 3. UNRAVELING HETEROGENEITY EFFECTS
Figure 3.6: Evolution of Cooperation on small communities. Simulationswere carried out for N=512 (upper panel) and N=128 (lower panel) for twotypes of graphs: Barabasi and Albert (solid squares) and regular graphs(solid circles). In all cases z = 4 . Comparison between these results andthose of Fig. 2 show that the qualitative features of the evolution of coop-eration are the same, for values of N spanning three orders of magnitude.For N=128 the oscillations at high values of b obtained for the Barabasi andAlbert NOCs indicate that, for such unfavourable regimes for cooperators,the small population size leads to an increasing sensitivity of the results onthe particulars of each realization of the NOCs.

3.6. EVOLUTION UNDER EXTRINSIC CONSTRAINTS 33
type d(k) ∼ k3, but also these new NOCs exhibit large values for the clus-ter coe"cient (C). In the minimal model, during growth each new vertexattaches to both ends of a randomly chosen edge. As such, this rule favoursthe creation of triangular relations between individuals, thereby greatly en-hancing the cluster coe"cient of the NOCs. In accord with the previousdiscussion, such a simple rule can be seen as a local procedure, which doesnot require previous knowledge of the topology of the NOCs. Such dif-ferent ways of producing similar degree distributions exhibiting intricatevertex correlations actually posit the interesting challenge of identifying themechanisms underlying the formation of specific NOCs. In what concernsthe present study, it is worth investigating the evolution of cooperation ongraphs generated according to this model. The results are shown in Figure3.7, for N = 104 and z = 4 (note that, by definition, these graphs sharethe same number of edges as the corresponding Barabasi-Albert graphs),in which overall cooperation can be seen to become further enhanced withrespect to the results of the Barabasi and Albert model. This enhancementof cooperation, however, should not be associated with the correspondingincrease of the cluster coe"cient. Indeed, it is quite obvious that an in-crease of the cluster coe"cient, per se, cannot promote cooperation, sincethe cluster coe"cient is maximal for a fully-connected graph (well-mixedpopulation limit) in which case, as is well known, cooperators are easilyinvaded by defectors and cooperation cannot be sustained. On the otherhand, the results of this section reinforce the fact that growth and preferen-tial attachment, even if implemented in a di!erent fashion, lead to a cleardominance of cooperation.
3.6 Evolution under extrinsic constraints
Up to now, we have tacitly assumed that individuals have no limitations inwhat concerns the number of interactions they engage on per generation.This assumption will generally depend on what type of individuals are atstake and the kind of cooperation one is modelling, but it is reasonable toconceive communities in which extrinsic factors limit the interacting capac-ity of individuals. What is the impact of this e!ect on the evolution ofcooperation?
Let us imagine that individuals engaging in a PD round with a neighbourexpend a certain energy. Finite resources may impose, therefore, an upperlimit to the number of connections that individuals in a population maysustain, which in turn imposes constraints on the topology of the NOCs.A simple means of modelling this feature is by introducing a cut-o! in thedegree-distribution such that whenever the connectivity of an individualreaches the cut-o! limit, no further connections to this individual may beestablished from that moment on during graph generation.

34 CHAPTER 3. UNRAVELING HETEROGENEITY EFFECTS
Figure 3.7: Results for the evolution of cooperation in NOCs exhibiting SFand truncated SF degree-distributions according to the models described inmain text. In all cases the size is N = 104 and the average connectivityis z = 4. The results for the Barabasi and Albert model (solid circles) arecompared with those obtained with the minimal model of Dorogotsev et al.(solid squares) and the truncated Barabasi and Albert model, imposing cut-o!s of 20 (open triangles), 40 (dashed line) and 60 (open squares) for themaximum connectivity. In all cases, vertex-correlations built-up during thegeneration of the graphs due to growth and preferential attachment ensurethat cooperation dominates for 1 ≤ b ≤ 2. As one continues to reduce thecut-o! for maximum vertex connectivity, a sudden collapse of cooperationtakes place, the behaviour resembling closely that obtained for the evolutionof cooperation on regular networks.

3.7. CONCLUSIONS 35
The Barabasi and Albert model leads to typical values for the maximumconnectivity well above 200, for N = 104 and z = 4. In Figure 3.7 weshow the result of introducing such cut-o!s in the Barabasi and Albertmodel, for di!erent values of the cut-o! parameter. It is noteworthy that,in spite of limiting the maximum connectivity of the vertices, still growth andpreferential attachment remain active and determinant mechanisms in thegeneration of the NOCs. Clearly, Fig. 5 shows that cooperation dominateseven when the connectivity of each node is severely truncated down to valuesof the order of 20. These are impressive results which evidence the robustnessof these mechanisms in sustaining cooperation.
As one imposes cut-o!s below 20 (for N = 104 and z = 4) coopera-tion collapses to a behaviour which first approaches that obtained with thegrowth-only model (not shown), where the two steps that characterize theBarabasi and Albert model are replaced by growth and an uniform attach-ment. This is a clear signal that below a certain critical cut-o! value, pref-erential attachment is no longer e!ective during graph generation. Subse-quent reduction of the cut-o! limit leads to further hindrance of cooperation.However, since the resulting degree distributions remain heterogeneous, co-operation is still enhanced when compared to the behaviour obtained on,e.g., regular graphs. This is not surprising, and reflects the fact that het-erogeneity in the pattern of vertex connectivity promotes cooperation. Yet,as clearly evidenced by the results obtained for the NOCs corresponding torandomized scale-free networks, shown in Fig.3.2 , heterogeneity alone is notenough to sustain cooperation as the dominating trait.
3.7 Conclusions
To sum up, the diversity of connectivity patterns in a population, whichtranslates into heterogeneous NOCs, is e"ciently explored by cooperatorsto outperform defectors, leading to evolutionary outcomes in which cooper-ators easily survive and may even dominate. NOCs exhibiting strong het-erogeneities and tight connections between the few most connected agentsfavour the dominance of cooperation. Throughout evolution, the topol-ogy of the NOCs itself must have evolved, a feature which is not includedhere. Nonetheless, it is clear that whatever NOCs one may envisage orhave emerged throughout evolution, they are certainly heterogeneous, andas such provide a better ground for cooperators to resist defectors and en-dure selection and evolution. In this context, it is worth mentioning thatthe impact of heterogeneity in what concerns cooperation between individ-uals may possibly extend beyond the framework considered here. In whatconcerns kin-selection, for instance, local dispersal and population structureplay a sizeable role [47]. To the best of our knowledge, heterogeneity e!ectsin the population have not been addressed yet in such a context. We hope

36 CHAPTER 3. UNRAVELING HETEROGENEITY EFFECTS
our work will stimulate the study of heterogeneity e!ects in other areas ofevolutionary biology.

Chapter 4
Tackling pure small-worldeffects
In this chapter, we introduce a new class of small-world networks - homo-geneous small-worlds - which, in contrast with all previously studied small-worlds, exhibit a homogeneous connectivity distribution, in the sense thatall nodes have the same number of connections. This feature allows theinvestigation, for the first time, of pure small-world e!ects, detached fromany associated heterogeneity. Furthermore, we use at profit the remark-able similarity between the properties of homogeneous small worlds and theheterogeneous small-worlds of Watts-Strogatz to assess the separate rolesof heterogeneity and small-world e!ects. We investigate the dependence ofthe co-evolution of cooperators and defectors under natural selection. Withrespect to the well-studied regular homogeneous limits, we find a subtle in-terplay between these mechanisms. They exhibit opposite behaviour in theevolution of cooperation, such that the overall results mask the true natureof their individual contribution to this process.
4.1 Introduction
The study of networks pervades all of science, and the recent and spectaculardevelopments in computers and communication networks made it easier tounderstand that the world in which we live and which we create and shape isin fact a huge web of networks of di!erent kinds, some of which were recentlyfound to obey scaling laws. In fact, only very recently [3, 16] such featureshave been recognized as playing an ubiquitous role on many processes takingplace in di!erent types of communities. These can be typically mapped ontonetworks, in which community members occupy the nodes and their interac-tions are represented by the links between nodes. Moreover, networks oftenportray the coexistence of local connections (spatial structure) with non-local connections (or shortcuts). The celebrated Watts-Strogatz [58] small
37

38 CHAPTER 4. TACKLING PURE SMALL-WORLD EFFECTS
world (SW) networks, introduced in previous chapters, proved instrumentalto understand and characterize such network features. As a result, manystudies originating from diverse areas of science have been carried out toinvestigate the impact of SW-e!ects on the static and dynamic properties ofphenomena taking place on networks. As a rule, such impact of SW-e!ectshas been sought by comparing the behaviour of the system with that knownfrom analytical studies typically carried out at a mean-field level, or in spa-tially homogeneous layouts. However, in contrast with spatial configurationsand mean-field models, in which the homogeneity of node connectivity trans-lates into a degree distribution characterized by a well-defined, single peak,all SW networks studied so-far are inherently heterogeneous, with associatedmulti-peaked degree distributions (for a network with N nodes, the degreedistribution is defined as d(k) = Nk/N , where Nk gives the number of nodeswith k links). In other words, up to now it has not been possible to dis-sociate the SW e!ect from heterogeneity, a feature which precludes a clearunderstanding of the role of SW-e!ects. For instance, it has been recentlyshown[45] how computer networks exhibiting the ubiquitous scale-free de-gree distributions d(k) ≈ k!3 are extremely fragile to epidemic outbreaks,such that in the limit of infinite size, these networks show no threshold forsuch outbreaks. This result, extended to other epidemiological contexts inref.[33], was shown to result from the divergence of the second moment ofthe degree distribution in the limit of infinite size, a typical heterogeneitye!ect. As such, the specific contribution of SW-e!ects to the characteri-zation of epidemic thresholds, for instance, remains unclear (this topic wasexplored in ref. [52]).On the following, we start by defining a new class of SW networks - Ho-mogeneous SW (HoSW ) - which exhibit SW features without giving-upthe homogeneity of the associated degree distribution. These networks willprove very useful in our investigations of the contributions of pure SW-e!ectsand of network heterogeneity to the phenomena of evolution of cooperationtaking place on networks.
4.2 Homogeneous small worlds
Inspired by the algorithm developed in ref.[58] to generate Watts-StrogatzHeterogeneous SW (HeSW ), we generate HoSW starting from a (undi-rected) regular graph with average connectivity z and size N , which fixesthe number of edges E = Nz/2.
We introduce a dimensionless parameter f which gives the fraction ofedges to be randomly rewired: for f = 0 we have a regular graph, whereas forf = 1 all edges are randomly rewired (see Figure 4.2). We adopt, however, arewiring mechanism which does not change the degree distribution[31]. Thealgorithm resumes to repeat the following two-step circular procedure until

4.3. EVOLUTION OF COOPERATION 39
Figure 4.1: Creating homogeneous small worlds. Starting from a regulargraph, swap pairs of randomly selected edges until f.E edges are swapped.Never swap same edge more than once, avoiding loops and double edges.
fE edges are successfully rewired: i) choose - randomly and independently- two (di!erent) edges which have not been used yet in step ii) and ii) swapthe ends of the two edges if no duplicate connections arize.The procedure of edge-swapping, as is well-known[31], does not change
the overall degree distribution. On the other hand, since the edges arerandomly chosen, by swapping the ends of each pair of edges one is actuallyintroducing shortcuts in the original regular graph, in this way stronglya!ecting the properties of the associated network. Indeed, and similarly tothe HeSW rewiring probability p, the parameter f has a strong non-linearimpact on both local and global properties of the resulting network. InFigure 4.2 a comparison is shown between key features of HoSW and HeSWas functions of f and p, respectively. Specifically, we plot the average pathlength L and cluster coe"cient C [3], for both HoSW and HeSW , dividedby the corresponding values at f = p = 0 (lower panel). The networksare characterized by N = 104 and z = 8, and Figure 4.2 shows that, inspite of the fact that for HoSW the degree distribution is independent of f ,the behaviour of L and C for both types of networks is remarkably similar.In other words, heterogeneity constitutes the main distinctive feature ofHeSW when compared to HoSW . What is the contribution of each ofthese mechanisms to a given dynamical process taking place on networks?The answer will depend on the process under study. Here we select oneexample: the evolution of cooperation under natural selection, for which weadopt the single-round Prisoner’s Dilemma (PD) [39, 44, 53, 49].
4.3 Evolution of cooperation
Like we stated in Chapter 1, the ongoing challenge[23] of understanding theemergence of cooperation in the context of Darwinian evolution is tradition-ally addressed in the framework of Evolutionary Game Theory[21], combined

40 CHAPTER 4. TACKLING PURE SMALL-WORLD EFFECTS
Figure 4.2: HoSW versus HeSW . The Cluster Coe"cient C and AveragePath Length L, divided by their values for regular networks (C0 and L0,repectively), are shown as a function of f for the HoSW proposed in thiswork, and of the SW rewiring probability p for HeSW . We divided thedomains of f and p in two subregions, which were found to be associatedwith di!erent regimes for the processes studied here. On the left panel(in a log scale) we detail the behaviour for the region in which L changessignificantly while C remains nearly constant. The remaining domain, shownin the right panel, is dominated by changes in C while changes in L are verysmall.

4.3. EVOLUTION OF COOPERATION 41
with games such as the PD, used as metaphors of cooperation between unre-lated individuals[21]. Adopting the same framework used before, individualsare either cooperators or defectors, acting accordingly whenever two of theminteract. They both receive R upon mutual cooperation and P upon mu-tual defection. A defector exploiting a cooperator gets an amount T andthe exploited cooperator receives S, such that T > R > P > S (Prisoner’sdilemma domain). Also, we shall follow common practice[39, 44, 49, 53] andadopt the simplest parametrization for the PD, making 2 > T = b > R =1 > P = S = 0, where b represents the temptation to defect. Whenevercooperators and defectors are spatially arranged on a regular, homogeneousnetwork for which z $ N [44] cooperators can hardly resist invasion bydefectors. On the other hand, we have shown how cooperation is signifi-cantly enhanced (see also [44]) whenever the populations are mapped ontoHeSW , being maximal for p = 1 (for fixed z), although the origin of thisenhancement remains to be clarified (see below).Follow the same framework of the previous chapter, we simulate evolutionby implementing the finite population analogue of replicator dynamics[21,44, 48]: In each generation, all pairs of individuals x and y, directly con-nected, engage in a single round of the PD, their accumulated payo!s beingstored as Px and Py, respectively. Whenever a site x is updated, a neighboury is drawn at random among all kx neighbours; whenever Py > Px the cho-sen neighbour takes over site x with probability given by (Py − Px)/(Dk>),where k> is the largest between kx and ky and D = T − S, ensuring theproper normalization of the probability. Initially, an equal percentage ofstrategies (cooperators or defectors) is randomly distributed among the el-ements of the population. Evolution undergoes a transient period before astationary regime is reached, in which we compute the equilibrium frequen-cies of cooperators and defectors. As a result, we determine the dependenceof the equilibrium frequency of cooperators on the temptation to defect b.
In Figure 4.3 we show the results of extensive computer simulationscarried out both for HoSW (upper panel) and for HeSW (lower panel). Inall cases, we make z = 4 and N = 104, although the results we obtain hereare robust both for larger populations as well as for smaller communitiesand other values of z. Each data point in Figure 4.3 results from an averageover 100 simulations, resulting from 10 di!erent realizations of each type ofnetwork, and 10 runs for each network realization.The solution corresponding to the evolution of cooperation on homogeneousregular graphs (f = p = 0) is shown with a solid line in both panels. Thebehaviour of cooperation remains unchanged with respect to the regularlimit up to f = p ≈ 0.005, at which point we have, on average, 0.5%of the edges randomly rewired, and L has decreased typically one orderof magnitude from its value for f = p = 0, indicating that the overallincidence of cooperators is again insensitive to L. For f = p = 0.01, oneobtains small changes as a function of b. Comparison between the results for

42 CHAPTER 4. TACKLING PURE SMALL-WORLD EFFECTS
HoSW and HeSW show no qualitative di!erence, however, which meansthat the e!ects responsible for this change have a SW origin (cf. Figure 4.2).f = p = 0.01 marks the onset of a more rapid change of C, whereas most ofthe variation in L has already taken place, which indicates that cooperationmay be more sensitive to changes in C. This is indeed what happens, asshown in Figure 4.3. For f = p = 0.1, a sizeable change of behaviour isobtained, being also markedly di!erent for both types of networks. Indeed,cooperators are now able to resist invasion by defectors up to values ofb ≈ 1.35 in both networks. The fact that the onset of survival for cooperatorsis essentially identical in both types of networks, indicates that SW-e!ectsare responsible for this enhancement of the survivability of cooperators,independently of any heterogeneity e!ects. SW-e!ects alone, however, leadto a sizeable reduction of the fraction of cooperators for small b. Largervalues of f ≤ 0.5 lead to an amplification of both behaviours, whereas forf > 0.5 no further qualitative changes take place. It is noteworthy that Cstill changes significantly as f varies from f = 0.5 to f = 1, suggesting thatabove a certain value SW-e!ects are not anymore influenced by C.
Comparison between the two panels in Figure 4.3 for p = f ≥ 0.1 alsoshows the e!ect of adding heterogeneity on top of the SW-e!ects (this sit-uation was briefly discussed in the previous chapter): Overall, the fractionof cooperators who survive evolution in HeSW is considerably enhanced.Moreover, both curves in Figure 4.3 show how heterogeneity counter bal-ances SW-e!ects such that, for small b, the levels of cooperation now over-shoot those obtained on regular networks. For larger values of b, cooperationis also sizeably enhanced. These non-trivial e!ects demonstrate the detailedinterplay between these mechanisms taking place in the evolutionary dynam-ics of cooperation. In HeSW individuals do not interact the same numberof times per generation. As such, cooperators have a better chance of in-creasing their relative fitness by placing themselves on the nodes with largerconnectivity. Indeed, like we have seen previously, heterogeneity increasinglyassumes a dominant role such that, on scale-free networks, cooperation maybecome the dominating trait for all values of b[44, 48].
4.4 Conclusion
To summarize, the present results show that conventional SW-e!ects re-sult from the concurrent contributions of heterogeneity and pure SW-e!ectswhich, depending of the process being studied, may exhibit constructive ordestructive interference. The role of SW-e!ects in the evolution of cooper-ation is quite subtle. On one hand, SW-e!ects increase the survivability ofcooperators up to larger values of the temptation to defect b. On the otherhand, the overall incidence of cooperators decreases whenever the tempta-tion to defect is small. Heterogeneous e!ects, in turn, lead to an overall

4.4. CONCLUSION 43
Figure 4.3: Evolution of cooperation in HoSW (upper panel) and HeSW(lower panel). We computed the fraction of cooperators who survive evo-lution, as a function of the PD parameter b, for selected values of the SWparameters f and p. All networks have size N = 104 and z = 4. Com-parison between the two panels shows that while the range of b values forwhich cooperators resist invasion by defectors results from SW-e!ects alone,the overall fraction of cooperators that survives evolution is sizeably en-hanced via heterogeneity e!ects, which completely mask the hindrance ofcooperation induced by pure SW-e!ects for large values of b.

44 CHAPTER 4. TACKLING PURE SMALL-WORLD EFFECTS
enhancement of cooperation for all values of b which, even for the moderateheterogeneity considered here, completely mask the modifications inducedby pure SW-e!ects, notably the reduction of the incidence of cooperatorsinduced by SW-e!ects for small values of b.The possibility to separate heterogeneity and pure SW-e!ects may providefurther insights into the detailed dynamics of complex phenomena takingplace on networks. Work along these lines is in progress.

Chapter 5
Different tensions, differentdilemmas
In the previous chapters, we have shown the role of played by real-worldtopological features in the evolution of cooperation under the framework ofa specific dilemma - the prisoner’s dilemma. Although, social interactionsmay be as well represented by other kind of tensions and dilemmas. Inthis chapter, we present a unifying framework to study well-known social-dilemmas, in which cooperation may be undermined by Fear and Greed.Here we show that an entirely new picture emerges whenever the patternof interaction in populations exhibits scale-free behaviour, for all possibledilemmas. We show that Fear is more detrimental to cooperation thanGreed, which ceases to be a threat in strongly heterogeneous populations.Furthermore, we show how the introduction of age correlations betweenindividuals helps promoting cooperative behaviour and on which kinds ofdilemmas the intricate ties of interactions are more detrimental. The pictureemerging from our study shows that in a world in where cooperation isdetermined by a balance between greed and fear, cooperation constitutes aviable trait to the extent that the threat posed by fear is minor.
5.1 Introduction
The problem of evolution of cooperation has been conveniently formulatedin the framework of evolutionary game theory which, when combined withgames such as the Prisoner’s Dilemma (PD), used as a metaphor for study-ing cooperation between unrelated individuals, enables one to investigatehow collective cooperative behaviour may survive in a world where individ-ual selfish actions produce better short-term results. Analytical solutions forthis problem have been obtained whenever populations are assumed infiniteand their interactions homogeneous. Under these assumptions, cooperationis not an evolutionary competitive trait, which is at odds with empirical ob-
45

46 CHAPTER 5. DIFFERENT TENSIONS, DIFFERENT DILEMMAS
servation. Such an unfavourable scenario for cooperation in the PD, as wellas the wish to contemplate other possible cooperative scenarios has led tothe adoption of other games [24, 54], such as the Snowdrift-Game (SG) (alsoknown as Hawk-Dove or Chicken, more favourable to cooperation) or theStag-Hunt game (SH) (a coordination-type game favouring cooperation) aswell as numerical simulations in finite, often spatially extended, populations[39], which nonetheless retain a homogeneous pattern of connectivity.
In this chapter, we examine how cooperation evolves whenever individ-uals interact following heterogeneous, scale-free NOC, engaging in singlerounds of a social dilemma characterized by given intensities of greed andfear. Because no analytic solutions exist for this problem, once again, agent-based simulations [24, 39] provide a viable alternative to study the evolutionof cooperation in these more realistic population structures, a frameworkwhich was already presented in the previous chapters. We shall convenientlymap a given population onto a graph, in which individuals (agents) occupythe vertices and their patterns of interactions are defined by the edges linkingthe vertices [44, 48].
The chapter is structured as follows. First, we discuss how the di!er-ent social dilemmas are defined wherein the emergence of cooperation willbe investigated. The next section describes how the simulations were con-structed,the stochastic evolutionary dynamics adopted and the parametersettings. Finally the results for all dilemmas in the well-mixed and hetero-geneous scenarios are described and compared in a discussion section.
5.2 Defining the Space of Social Dilemmas
At the most elementary level, social dilemmas can be formalized in terms ofsymmetric two-person games based on two choices - to cooperate (C) or todefect (D). These two choices lead to four possible outcomes: CC, CD, DCand DD. With each outcome, a particular payo! is associated: R (reward)and P (punishment) are the payo!s for mutual cooperation (CC) and de-fection (DD), respectively, whereas S (sucker) and T (temptation) are thepayo!s associated with cooperation by one player and defection by the other,respectively. Several social dilemmas [30] arise naturally, depending on therelative ordering of these four payo!s, obeying the following constraints:
i) R > P : players prefer mutual cooperation (CC) over mutual defection(DD).
ii) R > S: players prefer mutual cooperation over unilateral cooperation(CD).
iii) T > R: players prefer unilateral defection (DC) to mutual cooperationor P > S: players prefer mutual defection to unilateral cooperation(CD).

5.2. DEFINING THE SPACE OF SOCIAL DILEMMAS 47
Figure 5.1: Two dimensional space of all dilemmas, with the standard nor-malization of the di!erence between mutual defection and mutual coopera-tion to one. (R=1 and P=0).
Dilemmas will exhibit di!erent degrees of tension between individualand collective interests, based on the above relations. Given that R > P ,tension becomes apparent when the preferred choices of each player leadto individual actions resulting in mutual defection, in spite of the fact thatmutual cooperation is more beneficial. The extent to which such individualactions occur may be adjusted introducing di!erent intensities of greed (thetemptation to cheat, whenever T > R), of fear (of being cheated, wheneverP > S) or both, leading to three well-known social-dilemma games:
• The Snowdrift game SG game, for which T > R > S > P , wheretension is due to greed but not fear,
• the game of Stag Hunt (SH), for which R > T > P > S, where tensionresults from fear but not greed, and
• the PD game, in which both fear and greed are present, that is, T >R > P > S.
Formally, these dilemmas span a four-dimensional parameter space. Wesimplify the problem by normalizing the advantage of mutual cooperationover mutual defection, in all games, to the same base value, making R = 1and P = 0. With this choice for R and P, we are left with two parameters,T and S. Depending on their values, these parameters may add (or not)di!erent intensities of greed, fear or both to each game (see Figure 5.1).

48 CHAPTER 5. DIFFERENT TENSIONS, DIFFERENT DILEMMAS
We study the behaviour of all dilemmas in the ranges 0 ≤ T ≤ 2 and−1 ≤ S ≤ 1, which will be shown to be su"cient to characterize the gamesunder study, fear being present whenever S < 0, while greed is presentwhenever T > 1 (see Figure 5.1).
5.3 Simulations
In the language of graph theory, well-mixed populations of size N are rep-resented by complete graphs, which correspond to a regular, homogeneousgraph with average connectivity z = N − 1, since all vertices share thesame number of connections. To generate heterogeneous networks, we usedthe same algorithms introduced in previous chapters. Again, we considerthe Barabasi-Albert [9] model provides as the best-known model leading todistributions d(k) ∼ k!! , with γ = 3.
Because vertices appear at di!erent moments in graph-generation time,so-called age-correlations [16] arise. In order to single out the role of het-erogeneity in evolution, we may remove any correlations (including age-correlations) by subsequently exchanging, randomly and repeatedly, theends of pairs of edges of the original graph [31], a procedure which wasintroduced in chapters 2 and 3.
Since we are using a generalized framework in order to study all possibledilemmas, the procedures used before have to be slightly adapted.
For R = 1, P = 0, 0 ≤ T ≤ 2 and −1 ≤ S ≤ 1, evolution is carried outimplementing the finite population analogue of replicator dynamics [59, 21,25], to which simulation results converge in the limit of homogeneous, well-mixed populations (see Figure 5.2). Like previously, we define the followingtransition probabilities: In each generation, all pairs of individuals x and y,directly connected, engage in a single round of the game, their accumulatedpayo! being stored as Px and Py, respectively. For reasons explained before,we calculate the individual fitness using the non-normalized accumulatedpayo!. Whenever a site x is updated, a neighbour y is drawn at randomamong all kx neighbours; then, only if Py > Px the chosen neighbour takesover site x with probability given by
(Py − Px)[k>D>]
, (5.1)
where k> = max(kx, ky) and D> = max(T,R, S, P )−min(T,R, S, P ). Thesmall di!erence introduced in the transition probability, is only due thenecessity of a proper normalization in order to maintain p between 0 and 1.
Simulations were carried out on graphs with N = 103 vertices and av-erage connectivity z=4 (except in connection with Figure 5.3, where wherez = N − 1). Equilibrium frequencies of cooperators and defectors wereobtained, for each value of T and S, by averaging over 103 generations af-ter a transient time of 104 generations (we confirmed that averaging over

5.3. SIMULATIONS 49
Figure 5.2: Analytical results, under the replicator dynamics equation andwell-mixed population of all 3 dilemmas studied here.

50 CHAPTER 5. DIFFERENT TENSIONS, DIFFERENT DILEMMAS
larger periods or using di!erent transient times did not change the results).Furthermore, final data results from averaging over 100 realizations of thesame type of NOC specified by the appropriate parameters (N and z). Allsimulations start with an equal percentage of strategies (cooperators anddefectors) randomly distributed among the elements of the population.
5.4 Results and Discussion
Figure 5.3 shows the results of our simulations for all social dilemmas as acontour plot. The underlying NOC correspond to complete, fully connectedgraphs, which provide the finite population analogue to the infinite, well-mixed limit well-known from the standard analytical treatment [59] (seeFigure 5.2) . In particular, the results confirm the
i) dramatic fate of cooperators under the simultaneous threat of greed andfear (PD);
ii) a similar fate for cooperators in the absence of greed (SH) wheneverfear exceeds the advantage of mutual cooperation over temptation todefect.
iii) the coexistence of cooperators and defectors in the absence of fear, suchthat cooperators increasingly dominate the lower the intensity of greed(SG).
Replacing the well-mixed ansatz for the population by a heterogeneous pop-ulation exhibiting a scale-free degree distribution such that all connectionsbetween individuals are purely random, leads to the results shown in Figure5.4-a.
The results in Figure 5.4-a evidence the determinant role played by pop-ulation structure on the evolution of cooperation for all dilemmas.
Using Figure 5.3 as reference we observe that, overall, scale-free NOCe"ciently neutralize the detrimental role of greed in the evolution of coop-eration, whereas fear remains a strong deterrent of cooperation. Indeed,under greed alone (SG) cooperators dominate for all values of greed. Underfear alone (SH) cooperation becomes now more likely for small intensitiesof fear. For the PD the domain of coexistence between cooperators anddefectors is clearly broadened. Moreover, the small slope of the border-line between cooperators and defectors provides further evidence that fearconstitutes the major threat to cooperation.
The net results shown in Figure 5.4-a hide in fact a detailed interplay oftwo mechanisms, related to the small-world and heterogeneous nature of theunderlying scale-free NOC: The occurrence of many long-range connections(so-called shortcuts) in scale-free graphs precludes the formation of compactclusters of cooperators, thereby facilitating invasion by defectors. However,

5.4. RESULTS AND DISCUSSION 51
Figure 5.3: Evolution of cooperation in well-mixed NOC. Results for thefraction of cooperators in the population is plotted as a contour, drawn asa function of the intensity of greed and fear which characterizes a givendilemma. In the absence of greed and fear (lower right square) cooperatorstrivially dominate. Fear without greed leads to the SH game (lower leftsquare), greed without fear leads to the SG (upper right square), and whenboth fear and greed are present we obtain the PD game (lower right square).Results were obtained in complete NOC, the finite population analog ofinfinite well-mixed populations. These results provide the reference scenariowith which the role of population structure will be assessed (see Figure 5.4).
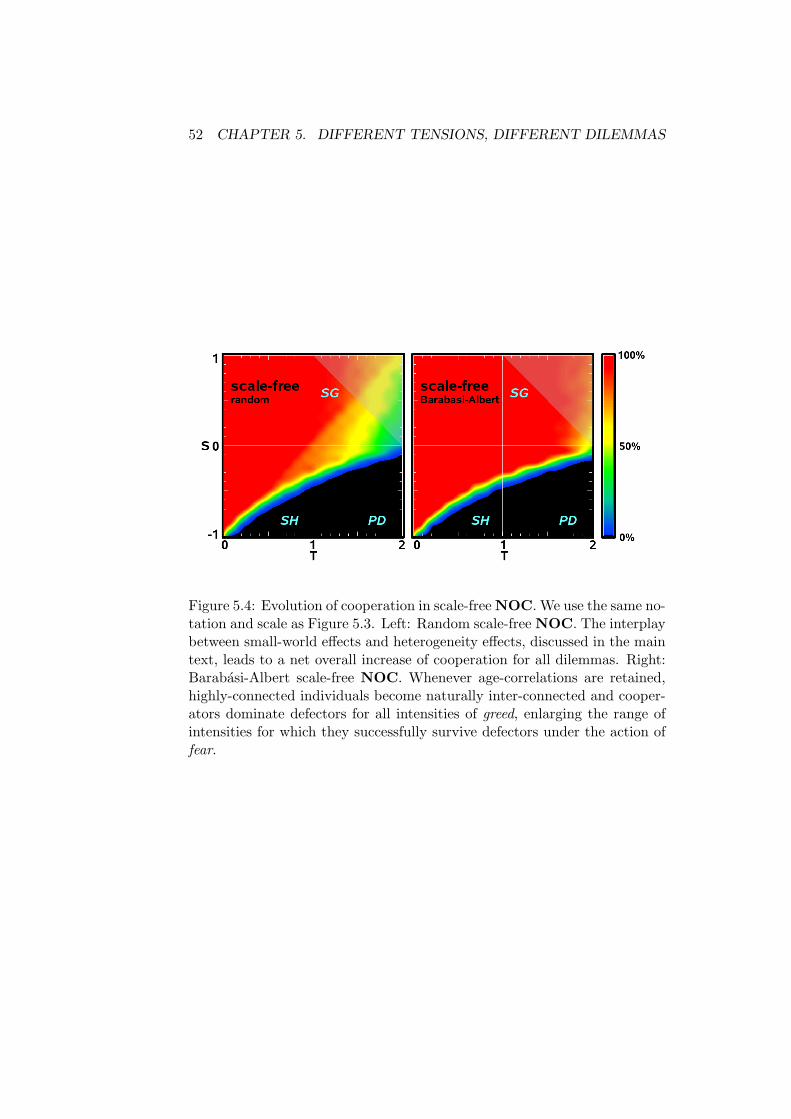
52 CHAPTER 5. DIFFERENT TENSIONS, DIFFERENT DILEMMAS
Figure 5.4: Evolution of cooperation in scale-free NOC. We use the same no-tation and scale as Figure 5.3. Left: Random scale-free NOC. The interplaybetween small-world e!ects and heterogeneity e!ects, discussed in the maintext, leads to a net overall increase of cooperation for all dilemmas. Right:Barabasi-Albert scale-free NOC. Whenever age-correlations are retained,highly-connected individuals become naturally inter-connected and cooper-ators dominate defectors for all intensities of greed, enlarging the range ofintensities for which they successfully survive defectors under the action offear.

5.4. RESULTS AND DISCUSSION 53
the increase in heterogeneity of the NOC opens a new route for cooperationto emerge, since now di!erent individuals interact di!erent number of timesper generation, which enables cooperators to outperform defectors. In otherwords, while on one hand the increased di"culty in aggregating clusters ofcooperators would partially hamper cooperation, heterogeneity, on the otherhand, counteracts this e!ect, with a net increase of cooperation [48].
The scale-free NOC of Barabasi and Albert [9] help us demonstratehow one may go beyond the scale-free properties of given NOC with thepurpose of increasing cooperation. Indeed, if we do not randomize the pat-tern of connectivity between individuals, such that the NOC exhibit thecorrelations arising naturally in the Barabasi and Albert model, a di!erentresult emerges for the evolution of cooperation, as shown in Figure 5.4-b).As is well-known, this model exhibits so-called age-correlations, in which theolder vertices not only become the ones acquiring highest connectivity, butalso they become naturally interconnected with each other. In other words,the formation of compact clusters of cooperators which was inhibited bythe occurrence of many shortcuts in random scale free NOC, will be partlyregained in such NOC, mostly for the few individuals which exhibit highconnectivity. Of course, such a clustering of cooperators will only occur tothe extent that cooperators are able to occupy such highly connected sites,which indeed happens.
The results in Figure 5.4-b) show that now greed poses no threat tocooperation, defectors being wiped out from populations under greed alone(SG). Under fear alone (SH), cooperators now wipe out defectors wherebefore (Figure 5.4-a) they managed to coexist. Under the joint threat ofgreed and fear (PD), cooperators also get a strong foot-hold up to largerintensities of fear.
The present results show that inclusion of realistic population structurein evolutionary game theory restores cooperation as a competitive evolu-tionary trait, being more competitive the more heterogeneous the patternof interactions of a given population.
Furthermore, re-formulating three well-known dilemmas in terms of therelative intensities of greed and fear allows a unified analysis of all dilem-mas, showing the relative importance of greed and fear as deterrents ofcooperation. Finally, by understanding the mechanisms which ensure thesustainability of cooperation, it is possible to conceive specific interactionpatterns with the purpose of promoting cooperation. At any rate, fear isa much stronger deterrent of cooperation than greed, a feature which iswell-supported by empirical evidence on many biological species, includinghumans.

54 CHAPTER 5. DIFFERENT TENSIONS, DIFFERENT DILEMMAS

Chapter 6
Social co-evolution
6.1 Introduction
Conventional evolutionary game theory predicts that natural selection favoursthe selfish and strong [42], in spite of existing evidence showing that coop-eration is more widespread than theory predicts [35]. When cooperation ismodelled in terms of the prisoner’s dilemma [46] (PD), the solution of thereplicator dynamics equation in infinite, well-mixed populations [25, 21, 41]dictates the extinction of cooperators by defectors. Cooperators becomeevolutionary competitive, however, whenever individuals are constrained tointeract with few others along the edges of sparse graphs as concluded in twoindependent studies [50, 43]. Both studies place individuals on the nodes ofa static graph, and associate their social ties with the vertices linking thenodes such that, throughout evolution, every individual has the possibilityof changing her strategy, but not her social ties. In [50] it has been shownthat, under strong selection (fitness is determined by the game payo!, likein the previous chapters) heterogeneous graphs lead to a significant increasein the overall survivability of cooperation, modelled in terms of the mostpopular social dilemmas, played on networks of di!erent degrees of hetero-geneity [30]. For the classical PD in which the act of cooperation involvesa cost c to the provider, resulting in a benefit b (b > c) for the recipient, asimple relation has been obtained in [43] for a single cooperator to have achance to survive in a population of defectors, whenever selection is weak(game payo! introduces a small perturbation onto fitness): b/c > z, wherez stands for the average number of ties each individual has (z is the aver-age degree of the graph). Both studies show that games on graphs opena window for the emergence of cooperation, showing how social viscosityalone [43] can contribute to the emergence of cooperation. However, recentdata shows that realistic networks [4, 16, 3, 22] exhibit average connectivityvalues ranging from 2 to 170, with an associated heterogeneity intermedi-ate between single and broad scale [4] which di!ers from the connectivity
55

56 CHAPTER 6. SOCIAL CO-EVOLUTION
values typically used in previous studies [50, 43]. For instance, the networkof movie actor exhibits an average connectivity of 30 [3] whereas collabora-tion networks based on co-authorship of published papers vary from averagevalues of 4 (mathematics), to 9 (physics) up to 15 (biology) [16]. In termsof the simple rule for the evolution of cooperation for graphs, the reportedvalues of z require benefits to often exceed costs by more than one orderof magnitude for a single cooperator to survive [43]. None of the previ-ous results on strong [50] and weak [43] selection on graphs is capable ofexplaining how cooperation thrives on such social networks. Other mecha-nisms have to be at work here that allow for the survival of cooperation. Inmost evolutionary models developed so-far, social interactions are fixed fromthe outset (for di!erent approaches specific to the prisoner’s dilemma, cf.[55, 19, 8, 18]. Such immutable social ties, associated naturally with staticgraphs, imply that individuals have no control over the number, frequencyor duration of their ties; they can only evolve their behavioural strategy. Asimilar observation can be made on studies related to the physical proper-ties of complex networks [4, 3, 16, 22]. The analyzed networks constitutebut one static snapshot of networks that have been typically produced bysome growth process. Yet, networks have naturally evolved before and willcontinue to evolve after the snapshot has been taken. Hence, assuming afixed population size, one may ask: What role do changes in the interactionframework play in the evolution of cooperation and to which extent willthe social dilemmas influence the topology and heterogeneity of the evolv-ing network? Using a minimal model that combines strategy evolution withtopological evolution, and in which the requirements of individual cognitivecapacities are very small, we investigate under which conditions cooperationmay thrive. Network heterogeneity, which now emerges as a result of anentangled co- evolutionary dynamics, will be shown to play a crucial role infacilitating cooperative behaviour.
6.2 A Minimal Co-evolutionary Model
Let us consider two types of individuals - cooperators and defectors, whoengage in several of the most popular social dilemmas of cooperation (seebelow). They are not required to accumulate information on all other play-ers, except those they are immediately connected with. Moreover, they areable to decide, on an equal footing, those ties that they want to maintainand those they want to change. Given an edge with individuals A and B atthe extremes, we say that A (B) is satisfied with the edge if the strategy ofB (A) is a cooperator, being dissatisfied otherwise. If A is satisfied, she willdecide to maintain the link. If dissatisfied, then she may compete with Bto rewire the link (as illustrated and described in Fig. 6.1, rewiring beingattempted to a random neighbor of B. The intuition behind this reasoning is

6.2. A MINIMAL CO-EVOLUTIONARY MODEL 57
the following: For rational individuals with limited information, a neighborof an inconvenient partner may turn out to be a good choice, since she ismore likely to be a cooperator than a defector. Indeed, for all social dilem-mas described below, a link with a cooperator maximizes the fitness of anyindividual, irrespective of its (fixed) strategy. Consequently, all individu-als naturally seek establishing links with cooperators. Hence, rewiring to aneighbor of a defector is certainly a good choice for individuals with localinformation only.
Figure 6.1: Evolving the neighborhood. Cooperators and defectors interactvia the edges of a graph. B (A) is satisfied (dissatisfied), since A (B) isa cooperator (defector). Therefore, A wants to change the link whereas Bdoesn’t. The action taken is contingent on the fitness #(A) and #(B) ofA and B, respectively. With probability p = (1 + e!"(!(B)!!(A)))!1 (whereβ = 0.005, (see section 6.3)) A redirects the link to a random neighbor ofB. With probability 1 − p, A stays linked to B. Other possibilities occur:Whenever both A and B are satisfied, nothing happens. When both A andB are dissatisfied, rewiring takes place such that the new link keeps attachedto A with probability p and attached to B with probability 1− p
The social dilemmas of cooperation examined in this work are definedby the order of the payo! values R (the reward for mutual cooperation), P(the punishment for mutual defection), T (the temptation to cheat) and S(the disadvantage of being cheated) [30] which lead to define the game thePD (T > R > P > S), the Snowdrift game (SG) (T > R > S > P ) and theStag-Hunt game (SH) (R > T > P > S). We adopt the convention of theprevious chapter and normalize the di!erence between mutual cooperation(R) and mutual defection (P) to 1, making R = 1 and P = 0, respectively.Hence, we investigate all dilemmas in the two dimensional parameter space,depicted in the figures of chapter 5 and in Figure 6.2, where the temptationto cheat T satisfies 0 < T < 2 and the disadvantage of being cheated Ssatisfies −1 < S < 1. Tension between the players arises whenever they

58 CHAPTER 6. SOCIAL CO-EVOLUTION
prefer unilateral defection to mutual cooperation (T > 1), mutual defectionto unilateral cooperation (S < 0) or both. This is precisely what happensin the SG game, the SH game and the PD game respectively. The fitness ofeach individual corresponds to the total accumulated payo! resulting fromsingle interactions (see secion 6.3) with all her neighbors.
The fact that in our model cooperators and defectors interact via so-cial ties they both decide upon establishes a coupling between individualstrategy and population structure: The game payo! induces now an entan-gled co-evolution of strategy and structure. Such an adaptive individualbehaviour introduces a new time scale (τa), not necessarily equal to thetime scale associated with strategy evolution (τe). Depending on the ra-tio W = #e
#a, di!erent fates may occur for cooperation. Indeed, whenever
W = 0 we recover the results of [50, 43]. On the other hand, with increasingW, individuals become apt to adapt their ties with increasing e"ciency. Ingeneral, however, one expects the two time scales to be of comparable mag-nitude in realistic situations (see Figs. 6.2 and 6.3). W provides a measureof individuals’ inertia to react to their rational choices both at strategy andtopological levels: Large values of W reflect populations in which individualsreact promptly to adverse ties, whereas smaller values reflect some overallinertia for topological change (compared with strategy change). In general,the type of response will change from individual to individual. Hence, Wreflects here an average characteristic of the population.
6.3 Setup
6.3.1 Graphs
We place individuals on the nodes (a total of N) of a graph. Edges (a totalof NE) represent the social ties between individuals. Graphs evolve in timeas individuals change their ties. The average connectivity
z =NE
2.N(6.1)
is conserved since we do not introduce or destroy edges. We also computedthe degree of heterogeneity of the graph
h = N!1!
k
k2Nk − z2 (6.2)
(where Nk gives the number of vertices with k edges) and the cumulativedegree distribution
D(k) = N!1N!1!
k
Ni (6.3)
6.3. SETUP 59
Since D(k) = 0 for k > kmax , with kmax the maximum value of the connec-tivity of a graph, both h and kmax provide simple measures of the hetero-geneity of a graph.
6.3.2 Evolution of strategies
Whenever W > 0, evolution of strategy and structure proceed togetherunder asynchronous updating. Choice of type of update event depends onW ; assuming (without loss of generality τe = 1 , a strategy update event ischosen with probability
Pe =1
1 + W(6.4)
a structural update event being selected otherwise. A strategy update eventis defined in the following way, corresponding to the so-called pairwise com-parison rule [56]: One node A is chosen at random and another node B ischosen randomly among A’s first neighbours. The individuals A and B in-teract with all their neighbours (those directly connected to them by edges)according to the social dilemma specified, accumulating payo!s #A and #B
respectively. The strategy of B replaces that of A with a probability givenby the (well known Fermi distribution) function
p =1
e!"(!B!!A)(6.5)
The value of β, which plays the role of an inverse temperature in statis-tical physics, controls here the intensity of selection (β ∼ 0 leads to neutraldrift whereas β ∼ ∞ leads to the so-called imitation dynamics, often usedto model cultural evolution).
6.3.3 Computer Simulations
We start from a homogeneous random graph [52], in which all nodes havethe same number of edges (z), randomly linked to arbitrary nodes. Popu-lation size is N = 103 and average connectivities z=10, 20, 30 and 40 (thevalue z=30 used in Figure 6.2 reflects the mean value of the average con-nectivities reported in ref. [16] for socials networks). We start with 50%of cooperators randomly distributed in the population. We run 100 inde-pendent simulations for each set of parameters (T, S, W) and compute thefraction of times that evolution stopped at 100% of cooperative strategies.If, after 108 generations, the population has not converged to an absorbingstate, we take as the final result the average fraction of cooperators in thepopulation over the last 1000 generations. Indeed, especially for the SG,the time for reaching an absorbing state may be prohibitively large [56]. Atthe end of each evolution we also computed the heterogeneity and maximalconnectivity kmax associated with the final graph and the cumulative degree

60 CHAPTER 6. SOCIAL CO-EVOLUTION
distribution (D(k)), which are on the basis of the results plotted in Figure6.3. We have confirmed that our results are valid for N > 500.
6.4 Results and Discussion
6.4.1 Co-evolution of strategy and structure
The contour plots in Fig. 6.2 show how cooperators survive for di!erentvalues of the ratio W in networks with high connectivity. For the most pop-ular social dilemmas of cooperation we plot the fraction of cooperators whosurvive evolution, averaged over 100 independent realizations for the samevalues of the temptation to cheat T, the disadvantage of being cheated S,and W. For W=0 and moderate selection intensity, tuneable by the inversetemperature of selection β the results reproduce, as expected [50], the pre-dictions for finite, well-mixed populations [50, 49] (whereas here N = 103
and z = 30). Yet, with increasing W we observe a wave of cooperation mov-ing South-East towards the lower right corner of each contour plot. Hence,the PD for T = 2 and S = −1 constitutes the hardest challenge for co-operation within the parameter space studied. Nonetheless, for su"cientlylarge values of W one obtains as a result of the entangled co-evolution ofstrategy and structure a full cooperative scenario. The swifter the responseof individuals to the nature of their ties, the easier it gets for cooperators towipe out defectors.
Additional insight is provided in Fig. 6.3 (upper panel) where we in-vestigate how cooperation wins over defection as a function of W, for thePD when T = 2 and S = −1 (corresponding to b/c = 2 in the classicalPD) and di!erent values of z ∈ [10, 40]. For small W cooperators haveno chance. Their fate changes as W approaches a critical value Wcritical
- which increases monotonically with z cooperators wiping out defectorsabove Wcritical (the increase of Wcritical with z is expected, since there aremore links to be rewired). Thus, the survival of cooperation relies on thecapacity of individuals to adjust to adverse ties, even when the average con-nectivity is high. In Figures 6.3 (lower panel) and 6.4 we investigate howthe evolved network topology changes with W, by plotting the overall net-work heterogeneity. In the lower panel of Fig. 6.3 we plot the maximumvalue of the connectivity (kmax) as a function of W for T = 2 and S = −1.For small W heterogeneity remains low since cooperators react slowly toadverse ties, being wiped out. As W approaches Wcritical, heterogeneity de-velops exhibiting a peak at ∼Wcritical, where the interplay between strategyand structure is maximal. In accord with the results of [50], heterogeneityconstitutes a viable mechanism to promote cooperation. Above Wcritical,heterogeneity decreases, since individual rewiring is fast enough to wipe outdefectors. For any W > 0 individual choices lead to heterogeneous graphs inwhich some individuals interact more and more often than others. In view

6.4. RESULTS AND DISCUSSION 61
Figure 6.2: Co-evolution for di!erent dilemmas and time-scales. Results forthe fraction of successful evolutionary runs ending in 100% cooperation fordi!erent values of the time scale ratio W. We study the most popular socialdilemmas of cooperation: the Prisoner’s dilemma (PD) (T > 1 > 0 > S),the Snowdrift game (SG) (T > 1 > S > 0) and the Stag-Hunt game (SH)(1 > T > 0 > S). For W = 0 (N = 103, z = 30 and β = 0.005) theresults fit the predictions from well-mixed populations. With increasing Wthe rate at which individuals readjust their ties increases, and so does theviability of cooperation. Above a critical value (Wcritical ≈ 4.0), detailedin Figure 6.3, cooperators e"ciently wipe out defectors. According to [43],only when b/c > 30 would cooperation be favored. Co-evolution leads tofull cooperation even when b/c = 2 (T = 2, S = −1).

62 CHAPTER 6. SOCIAL CO-EVOLUTION
0
0.2
0.4
0.6
0.8
1fra
ctio
n of
coo
pera
tors
z = 10z = 20z = 30z = 40
0 2 4 6 8 10W
0
50
100
150
200
k max
β = 0.005
Figure 6.3: Co-evolution in the PD for di!erent time-scales. PD with b/c = 2(T = 2, S = −1 and β = 0.005). (Upper panel): fraction of cooperators atend as a function of W for di!erent values of z, each drawn with a di!erentcolor. For each value of z, there is a critical value of W - Wcritical - abovewhich cooperators wipe out defectors. (Lower panel): maximum value of theconnectivity in population as a function of W . With increasing z, Wcritical
increases. In all cases, the heterogeneity of the associated network becomesmaximal at Wcritical, stagnating for higher values.

6.4. RESULTS AND DISCUSSION 63
of the results shown in Fig. 6.2, we show in the top-left panel of Fig. 6.4 thecumulative degree distributions (see section 6.3) for the most di"cult chal-lenge to cooperation in our parameter space: The PD with (T = 2,S = −1),corresponding to b
c = 2. Starting from a distribution exhibiting a sharpcuto! at kmax = z, as soon as W > 0 the distribution widens, reflecting theincrease in heterogeneity of the pattern of ties in the population, where oneobserves both single scale and broad scale heterogeneities in accord withempirical evidence [4] . As shown explicitly in the contours of Fig. 6.4,the amount of heterogeneity depends on the underlying social dilemma. Inother words, di!erent challenges to cooperation lead to the evolution of dif-ferent societal organization, in which simple to broad scale heterogeneity isubiquitous [4]. For large values of the temptation T, the SG game leads (inwell-mixed populations) to a coexistence between cooperators and defectorslargely favoring the latter. Consequently, for low values of W and large Tthe minority of cooperators is both unable to wipe defectors and not easilywiped out by defectors. This means that surviving cooperators will accumu-late many links, leading to the most heterogeneous co-evolutionary networksencountered. Clearly, the nature of the game induces a wide diversity in theemerging topology of co-evolutionary networks. In general, one may statethat the temptation to cheat (T) induces a more pronounced increase ofthe heterogeneity than the disadvantage of being cheated (S) [50]. Nonethe-less, the overall onset of increase of heterogeneity qualitatively follows thewave of cooperation shown in Fig. 6.2. The results shown suggest that thesimple adaptive dynamics of social ties introduced here coupled with thesocial dilemmas accounts for the heterogeneities observed in realistic socialnetworks [4].
6.4.2 Role of selection pressure on strategy and on structure
The pairwise comparison rule [56] based on the Fermi distribution function(see section 6.3), has been used in updating both strategies and social ties.In general, selection may be controlled by two independent parameters: βe
for strategy update and βa for adjustment of ties, both ranging from zero toinfinity. Up to now we have assumed that βa = βe = β. In the following, westudy the influence of changing the intensity of selection β on the evolutionof cooperation. In a nutshell, reducing the intensity of selection will decreasethe influence of the game, increasing the survival capabilities of the less fit.
In Fig. 6.5 we plot the fate of cooperators as a function of W, fordi!erent intensities of selection (for fixed T = 2 and S = −1, that is, aclassical PD game with b/c = 2). Clearly, the smaller the value of β, thesmaller Wcritical. Indeed, for small W, although cooperators are in generalless fit, their survival probability increases with decreasing β. This increasedsurvivability makes it more e"cient for structural updating (W > 0) tofavour assortative interactions between cooperators. As a result, the critical

64 CHAPTER 6. SOCIAL CO-EVOLUTION
1
-1
0
1
-1
0
S
0
SH
0 1 2
SH PD
SG
SH PD
SG
SH PD
SG
W = 0.0
W = 3.0
W = 1.0
T
0 1 2
T
SH PD
SG
SH PD
SG
W = 3.0
W = 1.0
0
0
0
0
9680
10655 7217
961 703
<k
2>
- <k>
2
<k
2>
- <k>
2<
k2>
- <k>
2
<k
2>
- <k>
2<
k2>
- <k>
2
100
0.01
0.1
1W = 0.0W = 0.5W = 3.0W = 4.0W = 4.5
D(k
)
k
Figure 6.4: Co-evolution and heterogeneity. We study the same social dilem-mas of cooperation as in Figure 6.2. (Top left panel) Cumulative degree dis-tributions (see section 6.3), for the most di"cult challenge to cooperationin our parameter space: The PD with T = 2 and S = −1, corresponding tob/c = 2. Starting from a distribution exhibiting a sharp cuto! at kmax = z,as soon as W > 0 the distribution widens, resulting in both single scale net-works (W = 0.5) and broad scale networks (W > 3), reflecting the increasein the overall heterogeneity of the pattern of ties in the population. (Con-tour plots) The amount of heterogeneity, measured in terms of the varianceof the degree distribution (see section 6.3 ), depends on the underlying socialdilemma and the value W . In other words, di!erent challenges to coopera-tion lead to the evolution of di!erent societal organization, in which simpleto broad scale heterogeneity develops as soon as W "= 0. The red colorcorresponds to the area of the game where the conflict between strategy andtopology dynamics is the strongest. For small W , heterogeneity is maximalfor the SG and large T . For W ≈ 4, heterogeneity is maximal for the PDwith (T=2, S=-1), in spite of the fact that cooperators wipe out defectorsfor all dilemmas.

6.5. CONCLUSION 65
value of W at which cooperators successfully take over defectors decreaseswith decreasing β. Let us further examine the separate role of βa andβe in the evolution of cooperation. To this end, we imposed T = 1 − S(moving along a diagonal in the PD domain, see Figure 6.2, from S = 0and T = 1 to S = −1 and T = 2, corresponding to a classical PD in which+∞ > b
c ≥ 2), kept a constant W = 2.0 and computed the survivabilityof cooperators and the maximum degree of connectivity as a function ofT. The results are shown in Fig. 6.6 for three di!erent values of βe, eachassociated with a di!erent panel and, within each panel, for the three valuesof βa indicated. Since W > 0, we obtain heterogeneous populations in allcases (insets). Also, in all cases a transition from full cooperation to fulldefection is observed at a critical value Tc, which depends on βa and βe. Inaccord with the expectations, small values of βe are associated with smoothertransitions from full cooperation to full defection around Tc. Furthermore,insets show that the larger the value of βe, the sharper is the peak of aroundTc. As T > Tc, heterogeneity reduces to an overall baseline residual value(associated with single scale networks), which depends on βe. Figure 6.6also sheds light onto the role played by βa. Overall, βa follows the e!ect ofβe, shifting Tc in the same direction. Indeed, the smaller the value of βa
1. the larger the value of Tc and
2. the smother the transition from full cooperation to full defection.
In general, with increasing βa the most fit will be favoured, since decisions onlink rewiring will become less ambiguous. As Fig. 6.6 illustrates, however,these two parameters are not independent of each other, in spite of theirsimilar role.
6.5 Conclusion
Giving individuals control over the number and nature of their social ties,based exclusively on their immediate self-interest, leads to the emergenceof long-term cooperation even in networks of high connectivity. As a con-sequence, network adaptability is required next to social viscosity to evolvecooperation in realistic social networks. For given values of connectivity inthe population, and selection pressure, there is a critical value of W abovewhich cooperators wipe out defectors. Overall, the critical value grows withincreasing intensity of selection β and with the average connectivity z. Thepresent results convey a simple yet powerful message for the evolution ofcooperation: The more individuals interact, the more they must be able topromptly decide upon their partnerships for cooperation to thrive. And, ofcourse, the less important the game is (weak selection), the less alert in-dividuals need be. The present work assumes that population size remains

66 CHAPTER 6. SOCIAL CO-EVOLUTION
Figure 6.5: Influence of the intensity of selection in the PD for di!erent time-scales. Fraction of cooperators at the end as a function of W for di!erentvalues of β = βe = βa , N = 103 and z = 30. As depicted in Fig. 6.3,the dilemma corresponds here to the PD with b/c = 2 (T = 2, S = −1).Decreasing values of β increase the viability of the less fit, which in turnmakes it easier for cooperators to wipe out defectors.

6.5. CONCLUSION 67
Figure 6.6: Role of di!erent β in evolution of cooperation. Fraction of coop-erators as a function of T for di!erent values of βe and βa . We maintainedz = 30 an N = 103. The dilemma corresponds to the diagonal in the PDdomain from (S = 0, T = 1) to (S = −1, T = 2) corresponding to a classicalPD in which +∞ > b/c ≥ 2. The insets provide the maximum degree of thenetwork for the di!erent values of T and S. Both βe and βa contribute sim-ilarly (but not independently) to the evolution of cooperation. The smallerthe values of βe and/or βa, the more the less fit will have a chance of survival;hence, the easier it is for cooperation to thrive.

68 CHAPTER 6. SOCIAL CO-EVOLUTION
constant throughout the co-evolutionary process. This is clearly a simplifi-cation, and it remains an open problem the role of a changing populationsize. Yet, the message conveyed here is powerful and shows that highly in-teractive, large social networks can exhibit sustained cooperation even whenthe benefits do not significantly exceed the costs. Finally, the process bywhich individuals re-assess their social ties may change depending on thesocial context, the game at stake, and the species under consideration. Inother words, other (perhaps more sophisticated) mechanisms may be envis-aged which will certainly build upon the simple model studied here. Yet,the prospect is quite optimistic since, as shown here, simple mechanisms de-void of large information processing requirements are capable of promotingsustained cooperation.

List of Figures
1.1 NOCs a) Regular graph with N = 12 vertices and z = 4edges each. z = N − 1 leads to a complete graph. b) Small-World graphs, obtained by rewiring all edges in a) with prob-ability pSW = 0.2 (see main text). c) Random graph, thelimit pSW = 1. d) Scale-free graph, generated using model ofBarabasi-Albert for m = m0 = 2; Histograms : Degree distri-butions d(k) computed for each type of graphs and N = 104;d(k) = Nk/N , where Nk gives the number of vertices with kedges. In all cases the average connectivity z of the graphs is 4. 8
1.2 Individual interactions in heterogeneous NOCs. Fitness cor-responds to the payo! accumulated after each agent interactswith all neighbours, which maybe di!erent in number andkind (cooperators, circles or defectors, squares) for di!erentagents. The focal cooperator and defector, connected via thesolid edge have both two defector neighbours among a totalof seven and five, respectively (dashed edges). At the endof a generation their fitness is indicated. Depending on thepayo! matrix, the cooperator may end up with a higher orlower fitness than the defector. In a homogeneous network inwhich both agents would have the same number of defectorsas neighbours, defectors would always have a fitness advantage. 10
2.1 Watts and Strogatz small-world networks. Starting from aregular graph, randomly rewire each edge with probability p,avoiding loops and double edges. Since number of verticesand edges is conserved, so is the average degree z. . . . . . . 16
2.2 Dependence of the Cluster coe"cient (C) and average pathlength in the parameter pSW . In the interval 0 < pSW < 0.1,as one increase pSW , inside this interval the value of L dropssignificantly compared with Lregular, where C ∼ Cregular. For0.1 < pSW < 1.0, L remains small whereas C drops signifi-cantly. . . . . . . . . . . . . . . . . . . . . . . . . . . . . . . 17
69

70 LIST OF FIGURES
2.3 Age correlations in the Barabasi and Albert growing model.As is easy to see, as a result of the growing process, older thenodes the more connected they become. . . . . . . . . . . . . 18
2.4 Evolutionary dynamics on graphs. The box in the bottomrepresents the equivalent of the replicator dynamics equation(top) when z = N − 1. . . . . . . . . . . . . . . . . . . . . . 21
3.1 Fraction of cooperators for Small-World network of contacts(NOCs) of Watts and Strogatz, for di!erent values of pSW .An overall enhancement of cooperation is observed with re-spect to well mixed limit (were cooperation is doomed forall values of b) and regular graphs, although cooperation isbetter sustained for small values of the benefit (b). . . . . . 24
3.2 Evolution of cooperation in heterogeneous NOCs. The frac-tion of cooperators in the population which survive evolutionis plotted as a function of the temptation to defect b for ran-dom NOCs (solid circles) and two types of scale-free NOCs:Random (solid squares) and age-correlated (solid triangles),according to the model of Barabasi-Albert. Results for reg-ular, homogeneous NOCs are shown with a solid line. In allcases and z=4 and N = 104. Heterogeneity generally pro-motes cooperation, which may dominate via introduction ofspecial correlations among the agents in the population. . . . 25
3.3 Distribution of strategies in random scale-free NOCs. Coop-erators (C, dark bars) and defectors (D, light bars) initially(upper panel) populate the same number of vertices in theNOCs. Evolution under natural selection leads to the scenariodepicted in the lower panel, in which the remaining defectorsoccupy vertices with low connectivity. Each bar adds up toa total fraction of 1 per degree, the dark and light fractionbeing directly proportional to the relative percentage of therespective strategy for each degree of connectivity. Resultsobtained on random scale-free graphs with z=4, N = 103 andb=1.6. . . . . . . . . . . . . . . . . . . . . . . . . . . . . . . . 26

LIST OF FIGURES 71
3.4 Evolution of cooperators around largest hub. Starting witha single defector placed in the hub with largest connectiv-ity, the fraction of direct neighbours who are cooperators iscomputed throughout evolution, for a population of N = 104
individuals, and for the two values of b indicated. The overallbehaviour, independent of b, shows that the initial defectorinvades approximately 80% of its immediate neighbours, afterwhich the largest hub is invaded by a cooperator (originat-ing typically from another hub, taking place right before eachjump), leading to a rapid saturation of the hub’s neighbourswith cooperators. . . . . . . . . . . . . . . . . . . . . . . . . 28
3.5 Evolution of cooperation in heterogeneous NOCs with aver-aged payo!s. The fraction of cooperators in the populationwhich survive evolution is plotted as a function of the tempta-tion to defect b for random NOCs (solid circles) and the scale-free NOCs, generated according to the model of Barabasi-Albert (solid triangles). In both cases z = 4 and N = 104.Although the incidence of cooperators is strongly suppressedwhenever averaging of payo!s is enforced, the survivabilityof cooperators is sizeably enhanced when compared to regu-lar graphs, without any sharp transition to zero. Clearly, byaveraging the payo!s of each individual one is precluding co-operators from taking advantage of the heterogeneity of theNOCs to outperform defectors. . . . . . . . . . . . . . . . . . 30
3.6 Evolution of Cooperation on small communities. Simulationswere carried out for N=512 (upper panel) and N=128 (lowerpanel) for two types of graphs: Barabasi and Albert (solidsquares) and regular graphs (solid circles). In all cases z = 4. Comparison between these results and those of Fig. 2 showthat the qualitative features of the evolution of cooperationare the same, for values of N spanning three orders of magni-tude. For N=128 the oscillations at high values of b obtainedfor the Barabasi and Albert NOCs indicate that, for suchunfavourable regimes for cooperators, the small populationsize leads to an increasing sensitivity of the results on theparticulars of each realization of the NOCs. . . . . . . . . . . 32

72 LIST OF FIGURES
3.7 Results for the evolution of cooperation in NOCs exhibit-ing SF and truncated SF degree-distributions according tothe models described in main text. In all cases the size isN = 104 and the average connectivity is z = 4. The resultsfor the Barabasi and Albert model (solid circles) are comparedwith those obtained with the minimal model of Dorogotsevet al. (solid squares) and the truncated Barabasi and Albertmodel, imposing cut-o!s of 20 (open triangles), 40 (dashedline) and 60 (open squares) for the maximum connectivity.In all cases, vertex-correlations built-up during the genera-tion of the graphs due to growth and preferential attachmentensure that cooperation dominates for 1 ≤ b ≤ 2. As one con-tinues to reduce the cut-o! for maximum vertex connectivity,a sudden collapse of cooperation takes place, the behaviourresembling closely that obtained for the evolution of cooper-ation on regular networks. . . . . . . . . . . . . . . . . . . . 34
4.1 Creating homogeneous small worlds. Starting from a regulargraph, swap pairs of randomly selected edges until f.E edgesare swapped. Never swap same edge more than once, avoidingloops and double edges. . . . . . . . . . . . . . . . . . . . . . 39
4.2 HoSW versus HeSW . The Cluster Coe"cient C and Aver-age Path Length L, divided by their values for regular net-works (C0 and L0, repectively), are shown as a function of ffor the HoSW proposed in this work, and of the SW rewiringprobability p for HeSW . We divided the domains of f andp in two subregions, which were found to be associated withdi!erent regimes for the processes studied here. On the leftpanel (in a log scale) we detail the behaviour for the regionin which L changes significantly while C remains nearly con-stant. The remaining domain, shown in the right panel, isdominated by changes in C while changes in L are very small. 40
4.3 Evolution of cooperation in HoSW (upper panel) and HeSW(lower panel). We computed the fraction of cooperators whosurvive evolution, as a function of the PD parameter b, forselected values of the SW parameters f and p. All networkshave size N = 104 and z = 4. Comparison between the twopanels shows that while the range of b values for which co-operators resist invasion by defectors results from SW-e!ectsalone, the overall fraction of cooperators that survives evo-lution is sizeably enhanced via heterogeneity e!ects, whichcompletely mask the hindrance of cooperation induced bypure SW-e!ects for large values of b. . . . . . . . . . . . . . 43

LIST OF FIGURES 73
5.1 Two dimensional space of all dilemmas, with the standardnormalization of the di!erence between mutual defection andmutual cooperation to one. (R=1 and P=0). . . . . . . . . . 47
5.2 Analytical results, under the replicator dynamics equationand well-mixed population of all 3 dilemmas studied here. . . 49
5.3 Evolution of cooperation in well-mixed NOC. Results for thefraction of cooperators in the population is plotted as a con-tour, drawn as a function of the intensity of greed and fearwhich characterizes a given dilemma. In the absence of greedand fear (lower right square) cooperators trivially dominate.Fear without greed leads to the SH game (lower left square),greed without fear leads to the SG (upper right square), andwhen both fear and greed are present we obtain the PDgame (lower right square). Results were obtained in completeNOC, the finite population analog of infinite well-mixed pop-ulations. These results provide the reference scenario withwhich the role of population structure will be assessed (seeFigure 5.4). . . . . . . . . . . . . . . . . . . . . . . . . . . . 51
5.4 Evolution of cooperation in scale-free NOC. We use the samenotation and scale as Figure 5.3. Left: Random scale-freeNOC. The interplay between small-world e!ects and hetero-geneity e!ects, discussed in the main text, leads to a net over-all increase of cooperation for all dilemmas. Right: Barabasi-Albert scale-free NOC. Whenever age-correlations are re-tained, highly-connected individuals become naturally inter-connected and cooperators dominate defectors for all intensi-ties of greed, enlarging the range of intensities for which theysuccessfully survive defectors under the action of fear. . . . . 52
6.1 Evolving the neighborhood. Cooperators and defectors inter-act via the edges of a graph. B (A) is satisfied (dissatisfied),since A (B) is a cooperator (defector). Therefore, A wantsto change the link whereas B doesn’t. The action taken iscontingent on the fitness #(A) and #(B) of A and B, respec-tively. With probability p = (1 + e!"(!(B)!!(A)))!1 (whereβ = 0.005, (see section 6.3)) A redirects the link to a randomneighbor of B. With probability 1 − p, A stays linked to B.Other possibilities occur: Whenever both A and B are satis-fied, nothing happens. When both A and B are dissatisfied,rewiring takes place such that the new link keeps attached toA with probability p and attached to B with probability 1− p 57

74 LIST OF FIGURES
6.2 Co-evolution for di!erent dilemmas and time-scales. Resultsfor the fraction of successful evolutionary runs ending in 100%cooperation for di!erent values of the time scale ratio W. Westudy the most popular social dilemmas of cooperation: thePrisoner’s dilemma (PD) (T > 1 > 0 > S), the Snowdriftgame (SG) (T > 1 > S > 0) and the Stag-Hunt game (SH)(1 > T > 0 > S). For W = 0 (N = 103, z = 30 andβ = 0.005) the results fit the predictions from well-mixedpopulations. With increasing W the rate at which individu-als readjust their ties increases, and so does the viability ofcooperation. Above a critical value (Wcritical ≈ 4.0), detailedin Figure 6.3, cooperators e"ciently wipe out defectors. Ac-cording to [43], only when b/c > 30 would cooperation befavored. Co-evolution leads to full cooperation even whenb/c = 2 (T = 2, S = −1). . . . . . . . . . . . . . . . . . . . . 61
6.3 Co-evolution in the PD for di!erent time-scales. PD withb/c = 2 (T = 2, S = −1 and β = 0.005). (Upper panel):fraction of cooperators at end as a function of W for di!er-ent values of z, each drawn with a di!erent color. For eachvalue of z, there is a critical value of W - Wcritical - abovewhich cooperators wipe out defectors. (Lower panel): maxi-mum value of the connectivity in population as a function ofW . With increasing z, Wcritical increases. In all cases, theheterogeneity of the associated network becomes maximal atWcritical, stagnating for higher values. . . . . . . . . . . . . . 62

LIST OF FIGURES 75
6.4 Co-evolution and heterogeneity. We study the same socialdilemmas of cooperation as in Figure 6.2. (Top left panel)Cumulative degree distributions (see section 6.3), for the mostdi"cult challenge to cooperation in our parameter space: ThePD with T = 2 and S = −1, corresponding to b/c = 2. Start-ing from a distribution exhibiting a sharp cuto! at kmax = z,as soon as W > 0 the distribution widens, resulting in bothsingle scale networks (W = 0.5) and broad scale networks(W > 3), reflecting the increase in the overall heterogeneityof the pattern of ties in the population. (Contour plots) Theamount of heterogeneity, measured in terms of the varianceof the degree distribution (see section 6.3 ), depends on theunderlying social dilemma and the value W . In other words,di!erent challenges to cooperation lead to the evolution ofdi!erent societal organization, in which simple to broad scaleheterogeneity develops as soon as W "= 0. The red color cor-responds to the area of the game where the conflict betweenstrategy and topology dynamics is the strongest. For smallW , heterogeneity is maximal for the SG and large T . ForW ≈ 4, heterogeneity is maximal for the PD with (T=2, S=-1), in spite of the fact that cooperators wipe out defectors forall dilemmas. . . . . . . . . . . . . . . . . . . . . . . . . . . . 64
6.5 Influence of the intensity of selection in the PD for di!erenttime-scales. Fraction of cooperators at the end as a functionof W for di!erent values of β = βe = βa , N = 103 andz = 30. As depicted in Fig. 6.3, the dilemma correspondshere to the PD with b/c = 2 (T = 2, S = −1). Decreasingvalues of β increase the viability of the less fit, which in turnmakes it easier for cooperators to wipe out defectors. . . . . 66
6.6 Role of di!erent β in evolution of cooperation. Fraction ofcooperators as a function of T for di!erent values of βe andβa . We maintained z = 30 an N = 103. The dilemmacorresponds to the diagonal in the PD domain from (S =0, T = 1) to (S = −1, T = 2) corresponding to a classical PDin which +∞ > b/c ≥ 2. The insets provide the maximumdegree of the network for the di!erent values of T and S. Bothβe and βa contribute similarly (but not independently) to theevolution of cooperation. The smaller the values of βe and/orβa, the more the less fit will have a chance of survival; hence,the easier it is for cooperation to thrive. . . . . . . . . . . . 67

76 LIST OF FIGURES

Bibliography
[1] G. Abramson and M. Kuperman. Social games in a social network.Phys Rev E, 63(3 Pt 1):030901, 2001.
[2] E. Akiyama and K. Kunihiko. Evolution of cooperation, di!erentiation,complexity and diversity in an iterated three-person game. ArtificialLife, 2:293–304, 1995.
[3] R. Albert and A. L. Barabasi. Statistical mechanics of complex net-works. Rev. Mod. Phys., 74:47–97, 2002.
[4] L. A. Amaral, A. Scala, M. Barthelemy, and H. E. Stanley. Classesof small-world networks. Proc Natl Acad Sci U S A, 97(21):11149–52,2000.
[5] R. M. Anderson and R. M. May. Infectious disease of humans: dynam-ics and control. Oxford University Press, 1991.
[6] R. Axelrod. The Evolution of Cooperation. Penguin Books, Har-mondsworth, 1989.
[7] R. Axelrod and W. D. Hamilton. The evolution of cooperation. Science,211(4489):1390–6, 1981.
[8] V. Bala and S. Goyal. Conformism and diversity under social learning.Econ. Theory, 17:101–120, 2001.
[9] A. L. Barabasi and R. Albert. Emergence of scaling in random networks.Science, 286(5439):509–12, 1999.
[10] Hugues Bersini. The interplay between the dynamics and the meta-dynamics of the immune network. In Proceedings of the Third ArtificialLife Conference, 1992.
[11] Hugues Bersini. Des reseaux et des sciences : Biologie, informatique,sociologie : l’omnipresence des reseaux. Vuibert, 2005.
[12] Hugues Bersini, Tom Lenaerts, and F. C. Santos. Growing biologicalnetworks: Beyond the gene-duplication model. Journal of TheoreticalBiology, 241(3):488–505, 2006.
77

78 BIBLIOGRAPHY
[13] E. Bonabeau, M. Dorigo, and G. Theraulaz. Swarm Intelligence: FromNatural to Artificial Systems. Oxford University Press, 1999.
[14] V. Calenbuhr, H. Bersini, J. Stewart, and F. Varela. Natural tolerancein a simple immune network. Journal of Theoretical Biology, 177:199–213, 1995.
[15] V. Calenbuhr, F. Varela, and Hugues Bersini. Immune idiotypic net-work. International Journal of Bifurcation and Chaos, 6(9):1691–1702,1996.
[16] S. N. Dorogotsev and J. F. F. Mendes. Evolution of Networks: FromBiological Nets to the Internet and WWW. Oxford University Press,Oxford, 2003.
[17] S. N. Dorogovtsev, J. F. Mendes, and A. N. Samukhin. Size-dependentdegree distribution of a scale-free growing network. Phys Rev E, 63(6Pt 1):062101, 2001.
[18] H. Ebel and S. Bornholdt. Coevolutionary games on networks. PhysRev E, 66(5 Pt 2):056118, Nov 2002.
[19] V. M. Eguiluz, M. Zimmerman, C. Cela-Conte, and M. San-Miguel.Cooperation and the emergence of role di!erentiation in the dynamicsof social networks. Am. Journal of Sociology, 110:977–1008, 2005.
[20] Deano Foster and Peyton Young. Stochatic evolutionary game dynam-ics. Theoretical Population Biology, 38(2), 1990.
[21] H. Gintis. Game Theory Evolving. Princeton University Press., Prince-ton, NJ, 2000.
[22] R. Guimera and L. A. N. Amaral. Functional cartography of complexmetabolic networks. Nature, 433(895), 2005.
[23] Peter Hammerstein. Genetic and Cultural Evolution of Cooperation.MIT Press, Cambridge, Massachusetts, 2003.
[24] C. Hauert and M. Doebeli. Spatial structure often inhibits the evolutionof cooperation in the snowdrift game. Nature, 428(6983):643–6, 2004.
[25] J. Hofbauer and K. Sigmund. Evolutionary Games and PopulationDynamics. Cambridge Univ. Press, Cambridge, UK, 1998.
[26] M. O. Jackson and A. Wolinsky. A strategic model of social and eco-nomic networks. Journal of Economic Theory, 71:44–74, 1996.
[27] B. Kerr, M. A. Riley, M. W. Feldman, and B. J. Bohannan. Local dis-persal promotes biodiversity in a real-life game of rock-paper-scissors.Nature, 418(6894):171–4, 2002.

BIBLIOGRAPHY 79
[28] S. Kraus. Negotiation and cooperation in multi-agent environments.Artificial Intelligence, 94:80–95, 1997.
[29] E. Lieberman, C. Hauert, and M. A. Nowak. Evolutionary dynamicson graphs. Nature, 433(7023):312–6, 2005.
[30] M. Macy and A. Flach. Learning dynamics in social dilemmas. Proc.Natl. Acad. Sci. (USA), 99:7229, 2002.
[31] S. Maslov and K. Sneppen. Specificity and stability in topology ofprotein networks. Science, 296(5569):910–3, 2002.
[32] R. M. May, S. Gupta, and A. R. McLean. Infectious disease dynamics:What characterizes a successful invader? Philos Trans R Soc Lond BBiol Sci, 356(1410):901–10, 2001.
[33] R. M. May and A. L. Lloyd. Infection dynamics on scale-free networks.Phys Rev E, 64(6 Pt 2):066112, 2001.
[34] J. Maynard-Smith. Evolution and the Theory of Games. CambridgeUniversity Press, Cambridge, 1982.
[35] J. Maynard-Smith and Szamary. The major transitions in evolution.WH Freeman, 1995.
[36] R. K. Merton. The matthew e!ect in science. the reward and com-munication systems of science are considered. Science, 159(810):56–63,1968.
[37] M. Milinski. Tit for tat in sticklebacks and the evolution of cooperation.Nature, 325(6103):433–5, 1987.
[38] M. Molloy and B. Reed. A critical point for random degree graphs witha given degree sequence. Random Structures and Algorithms, 6:161–180, 1995.
[39] M. A. Nowak and R. M. May. Evolutionary games and spatial chaos,.Nature, 359:826–829, 1992.
[40] M. A. Nowak and K. Sigmund. Tit for tat in heterogeneous populations.Nature, 355:250–3, 1992.
[41] M. A. Nowak and K. Sigmund. Evolutionary games and populationdynamics. Science, 303:793–9, 2004.
[42] M. A. Nowak and K. Sigmund. Evolution of indirect reciprocity. Nature,437:1291–1298, 2005.
80 BIBLIOGRAPHY
[43] H. Ohtsuki, C. Hauert, E. Lieberman, and M. A. Nowak. A simple rulefor the evolution of cooperation on graphs and social networks. Nature,441(7092):502–5, 2006.
[44] J. M. Pacheco and F. C. Santos. Network dependence of the dilemmasof cooperation. In J. F.F. Mendes, editor, Science of Complex Networks:from Biology to the Internet and WWW. AIP Conference Proceedings,2005.
[45] R. Pastor-Satorras and A. Vespignani. Epidemic spreading in scale-freenetworks. Physical Review Letters, 86(3200), 2001.
[46] A. Rapoport and A. M. Chamah. The Prisoner’s Dilemma. Universityof Michigan Press, Ann Arbor, 1965.
[47] F. Rousset and S. Billiard. A theoretical basis for measures of kinselection in subdivided populations: finite populations and localizeddispersal. Journal of Evolutionary Biology, 13:814–825, 2000.
[48] F. C. Santos and J. M. Pacheco. Scale-free networks provide a uni-fying framework for the emergence of cooperation. Phys Rev Lett,95(9):098104, 2005.
[49] F. C. Santos and J. M. Pacheco. A new route to the evolution ofcooperation. J Evol Biol, 19(3):726–33, 2006.
[50] F. C. Santos, J. M. Pacheco, and T. Lenaerts. Evolutionary dynamicsof social dilemmas in structured heterogeneous populations. Proc NatlAcad Sci U S A, 103(9):3490–4, 2006.
[51] F. C. Santos, J. M. Pacheco, and Tom Lenaerts. Cooperation prevailswhen individuals adjust their social ties. (submitted), 2006.
[52] F. C. Santos, J. F. Rodrigues, and J. M. Pacheco. Epidemic spreadingand cooperation dynamics on homogeneous small-world networks. PhysRev E, 72(5 Pt 2):056128, 2005.
[53] F. C. Santos, J. F. Rodrigues, and J. M. Pacheco. Graph topologyplays a determinant role in the evolution of cooperation. Proc Biol Sci,273(1582):51–5, 2006.
[54] K. Sigmund. Games of Life. Oxford University Press, 1993.
[55] B. Skyrms and R. Pemantle. A dynamic model of social network for-mation. Proc Natl Acad Sci U S A, 2000.
[56] A. Traulsen, M. A. Nowak, and J. M. Pacheco. Stochatic dynamics ofinvasion and fixation. Phys Rev E, (in press).

BIBLIOGRAPHY 81
[57] D. J. Watts. Small Worlds: The dynamics of networks between orderand randomness. Princeton Studies in Complexity, Princeton Univer-sity Press, NJ, 1998.
[58] D. J. Watts and S. H. Stogatz. Collective dynamics of small-world’networks. Nature, 393(440), 1998.
[59] J. W. Weibull. Evolutionary Game Theory. MIT Press, 1997.
[60] H. Peyton Young. Individual strategy and social structure : An evo-lutionary theory of Institutions. Princeton Paperbacks, Princeton Uni-versity Press, NJ, 2001.