update of stats sa data and other leading indicators dr johan snyman medium-term forecasting...
TRANSCRIPT

MEDIUM-TERM FORECASTING ASSOCIATES Building Economists Tel: (021) 883-8152 PO Box 7119 Fax: (021) 887-1597 STELLENBOSCH, 7599 E-mail: [email protected]
Update of Stats SA data and other Leading Indicators
Dr Johan Snyman
Medium-Term Forecasting Associates
STELLENBOSCH
17 March 2011

The SARB leading indicator is based on 12 indicators that lead the business cycle. This composite indicator gives early warning signals of upper and lower turning points – it is currently marking time
SARB LEADING INDICATOR OVERALL ECONOMY
0
10
20
30
40
50
60
70
80
90
100
110
120
130
140
| 62 | 65 | 68 | 71 | 74 | 77 | 80 | 83 | 86 | 89 | 92 | 95 | 98 | 01 | 04 | 07 | 10 | 13
Source: SARB; MFA DATABASE (Economic Upswings Shaded)
IND
EX
20
00
=1
00

Vehicle sales are performing well, but real residential plans passed seem to be moving sideways at a very low level
COMPARISON TOTAL VEHICLE SALES & TOTAL REAL RESIDENTIAL PLANS PASSED INDEX 1970 = 100
0
50
100
150
200
250
300
350
| 71 | 74 | 77 | 80 | 83 | 86 | 89 | 92 | 95 | 98 | 01 | 04 | 07 | 10 | 13
Source: NAAMSA; Stats SA; SARB; MFA DATABASE
IND
EX
197
0 =
100
TOTAL VEHICLE SALES TOTAL REAL RESIDENTIAL BPP

The percentage improvement in real residential plans passed has lost upward momentum, moderating from +7% to +4%
TOTAL VEHICLE SALES & TOTAL REAL RESIDENTIAL PLANS PASSED ANNUAL PERCENTAGE CHANGE
-60
-40
-20
0
20
40
60
80
100
| 71 | 74 | 77 | 80 | 83 | 86 | 89 | 92 | 95 | 98 | 01 | 04 | 07 | 10 | 13
Source: NAAMSA; STATS SA; SARB, MFA DATABASE (Economic upswings shaded)
AN
NU
AL
PE
RC
EN
TA
GE
CH
AN
GE
TOTAL VEHICLE SALES TOTAL RESIDENTIAL BPP
Shaded areas represent theupswing phases of the business cycle
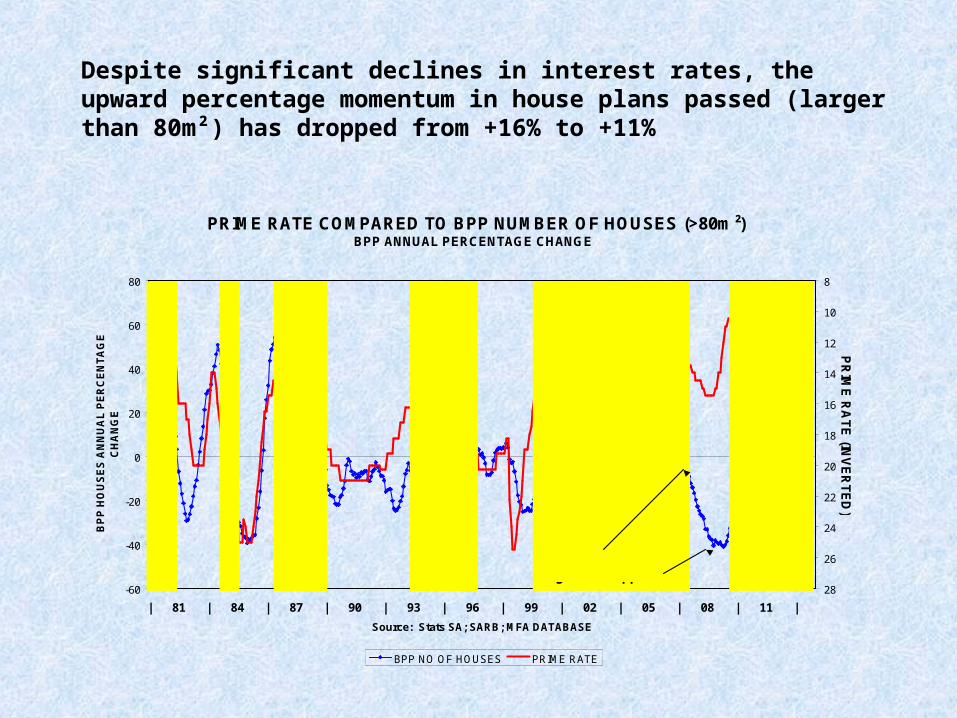
Despite significant declines in interest rates, the upward percentage momentum in house plans passed (larger than 80m²) has dropped from +16% to +11%
PRIME RATE COMPARED TO BPP NUMBER OF HOUSES (>80m²) BPP ANNUAL PERCENTAGE CHANGE
-60
-40
-20
0
20
40
60
80
| 81 | 84 | 87 | 90 | 93 | 96 | 99 | 02 | 05 | 08 | 11 |
Source: Stats SA; SARB; MFA DATABASE
BP
P H
OU
SE
S A
NN
UA
L P
ER
CE
NT
AG
E
CH
AN
GE
8
10
12
14
16
18
20
22
24
26
28
PR
IME
RA
TE
(INV
ER
TE
D)
BPP NO OF HOUSES PRIME RATE
Introduction of National Credit ActBanks' stricter lending criteria applied

Mortgage finance is difficult to come by because of the stringent requirements of the National Credit Act …
BANKS' LENDING CRITERIA Percentage of respondents
30
40
50
60
70
80
90
100
| 02 | 03 | 04 | 05 | 06 | 07 | 08 | 09 | 10 | 11 | 12 |
Source: BER; Ernst & Young; MFA DATABASE (Economic upswings shaded)
VE
RY
EA
SY
< E
AS
IER
<
> S
TR
ICT
ER
> V
ER
Y S
TR
ICT
Global FinancialCrisis
National Credit ActIntroduced STRICT
EASY

The consequences of the National Credit Act and the stricter lending requirements of the banks are clearly reflected in key building statistics …
Consider the next graph that shows that despite much lower interest rates, a gap has opened up between interest rates and the number of square metres for house plans passed … this shows that effective demand has dropped sharply
Also consider the second graph that shows an unusual gap opening up between lower interest rates and new mortgage loans granted for the construction of new houses

NUMBER OF SQUARE METRES of DWELLING HOUSES (BPP) vs THE PRIME RATE (INVERTED)
0
350000
700000
1050000
1400000
| 86 | 87 | 88 | 89 | 90 | 91 | 92 | 93 | 94 | 95 | 96 | 97 | 98 | 99 | 20 | 01 | 02 | 03 | 04 | 05 | 06 | 07 | 08 | 09 | 10 | 11
NU
MB
ER
OF
SQ
UA
RE
ME
TR
ES
0
4
8
12
16
20
24
28
32
PR
IME
RA
TE
(IN
VE
RT
ED
)
Sq m of DH BPP PRIME RATE
Square metres have fallen despite significantly lower interest rate levels …

There seems to be very little money available for new homebuilding …
THE COST AND AVAILABLITY OF MORTGAGE FINANCE FOR NEW HOUSES(with the Prime Interest Rate inverted)
0
500
1000
1500
2000
2500
3000
3500
4000
4500
5000
| 80 | 81 | 82 | 83 | 84 | 85 | 86 | 87 | 88 | 89 | 90 | 91 | 92 | 93 | 94 | 95 | 96 | 97 | 98 | 99 | 00 | 01 | 02 | 03 | 04 | 05 | 06 | 07 | 08 | 09 | 10 |
Source: Stats SA; SARB; MFA DATABASE
Rm
pe
r m
on
th a
t c
on
sta
nt
20
09
pri
ce
s
0
5
10
15
20
25
30
Inte
res
t ra
te p
er
ce
nt
INV
ER
TE
D
Building loans granted Prime interest rate
THIS UNUSUAL GAP HAS WORSENED THE DOWNTURN IN HOMEBUILDING

… consequently, plans and completions for houses larger than 80m² have dropped to historic lows
BPP & BC: NUMBER of DWELLING HOUSES LARGER THAN 80m² 3 MONTH MOVING AVERAGE
0
1000
2000
3000
4000
5000
| 80 | 81 | 82 | 83 | 84 | 85 | 86 | 87 | 88 | 89 | 90 | 91 | 92 | 93 | 94 | 95 | 96 | 97 | 98 | 99 | 00 | 01 | 02 | 03 | 04 | 05 | 06 | 07 | 08 | 09 | 10 | 11 | 12 | 13 |
Source: Stats SA; MFA DATABASE
NU
MB
ER
OF
DW
EL
LIN
G H
OU
SE
S
BPP BC
Historical Peak4502
Lowest Point1000
LONG TERM MONTHLYAVERAGE2100 housesapproved

In terms of square metres, the Jan 2011 figures were just as poor as the lowest point recorded in Jan 2010
BUILDING PLANS PASSED DWELLING HOUSES NUMBER OF SQUARE METRES
0
200000
400000
600000
800000
1000000
1200000
1400000
| 86 | 87 | 88 | 89 | 90 | 91 | 92 | 93 | 94 | 95 | 96 | 97 | 98 | 99 | 20 | 01 | 02 | 03 | 04 | 05 | 06 | 07 | 08 | 09 | 10 | 11 | 12 | 13 |
Source: Stats SA; MFA DATABASE
NU
MB
ER
OF
SQ
UA
RE
ME
TR
ES

Townhouses and flats data were just a little better in Jan 2011 than in Dec 2010 – could Dec 2010 be the trough in the cycle?
BUILDING PLANS PASSED TOWNHOUSES AND FLATS NUMBER OF SQUARE METRES
0
100000
200000
300000
400000
500000
600000
700000
800000
| 86 | 87 | 88 | 89 | 90 | 91 | 92 | 93 | 94 | 95 | 96 | 97 | 98 | 99 | 20 | 01 | 02 | 03 | 04 | 05 | 06 | 07 | 08 | 09 | 10 | 11 | 12 | 13 |
Source: Stats SA; MFA DATABASE
NU
MB
ER
OF
SQ
UA
RE
ME
TR
ES

Still performing poorly … but a trough seems to be forming
BPP: RESIDENTIAL ADDITIONS & ALTERATIONS NUMBER OF SQUARE METRES
0
200000
400000
600000
800000
| 86 | 87 | 88 | 89 | 90 | 91 | 92 | 93 | 94 | 95 | 96 | 97 | 98 | 99 | 20 | 01 | 02 | 03 | 04 | 05 | 06 | 07 | 08 | 09 | 10 | 11 | 12 | 13 |
Source: Stats SA, MFA DATABASE
SQ
UA
RE
ME
TR
ES
RES ADD & ALT 13mma

Average sizes seem to be rising gradually
AVERAGE SIZE OF TOWNHOUSES & FLATS SQUARE METRES (SMOOTHED)
0
20
40
60
80
100
120
140
160
180
| 86 | 87 | 88 | 89 | 90 | 91 | 92 | 93 | 94 | 95 | 96 | 97 | 98 | 99 | 20 | 01 | 02 | 03 | 04 | 05 | 06 | 07 | 08 | 09 | 10 | 11 | 12 | 13 |
Source: Stats SA; MFA DATABASE
AV
ER
AG
E S
IZE
SQ
UA
RE
ME
TR
ES
CURRENTLY IMPROVING FROM 88 to 105SQUARE METRES
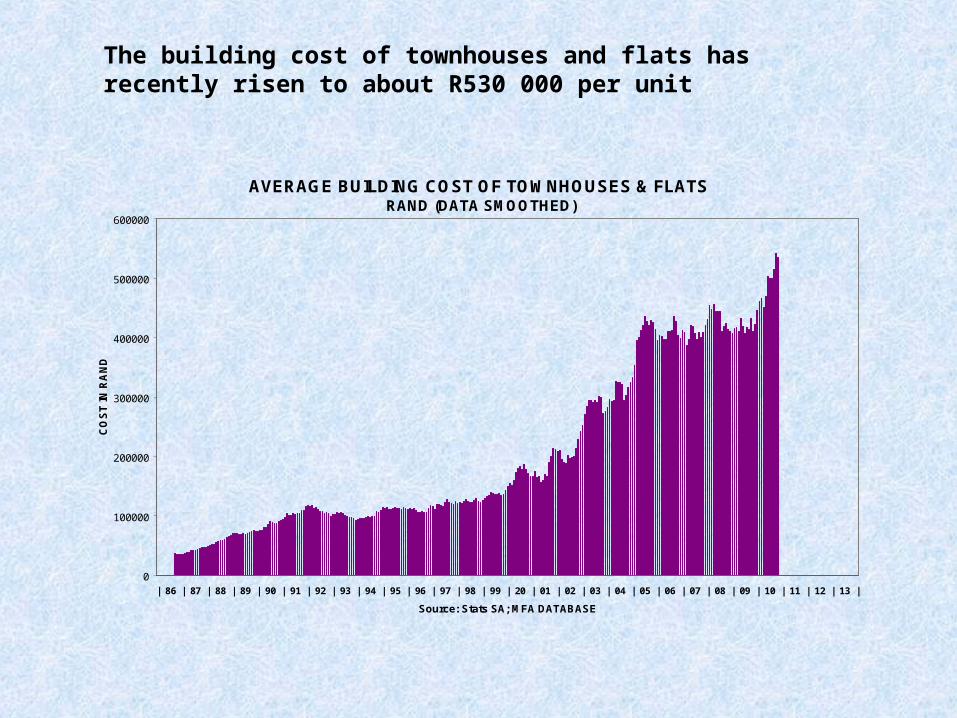
The building cost of townhouses and flats has recently risen to about R530 000 per unit
AVERAGE BUILDING COST OF TOWNHOUSES & FLATS RAND (DATA SMOOTHED)
0
100000
200000
300000
400000
500000
600000
| 86 | 87 | 88 | 89 | 90 | 91 | 92 | 93 | 94 | 95 | 96 | 97 | 98 | 99 | 20 | 01 | 02 | 03 | 04 | 05 | 06 | 07 | 08 | 09 | 10 | 11 | 12 | 13 |
Source: Stats SA; MFA DATABASE
CO
ST
IN
RA
ND
CURRENTLY ABOUT R530 000 PER UNIT(on average)

The demand for new office space has dropped to a new low in Jan 2011 …
OFFICES BUILDING PLANS PASSED: SQUARE METRES
0
40000
80000
120000
160000
200000
| 86 | 87 | 88 | 89 | 90 | 91 | 92 | 93 | 94 | 95 | 96 | 97 | 98 | 99 | 20 | 01 | 02 | 03 | 04 | 05 | 06 | 07 | 08 | 09 | 10 | 11 | 12 | 13 |
Source: Stats SA; MFA DATABASE
SQ
UA
RE
ME
TR
ES
3mma 13mma

… because real office rentals are under severe pressure and office vacancies are still high on a nationwide basis (vacancies line inverted)
OFFICE VACANCIES & BUILDING PLANS PASSED OFFICES
0
50000
100000
150000
200000
| 92 | 93 | 94 | 95 | 96 | 97 | 98 | 99 | 20 | 01 | 02 | 03 | 04 | 05 | 06 | 07 | 08 | 09 | 10 | 11 | 12 | 13 |
Source: SARB; Stats SA; RODE DATABASE; SAPOA; MFA DATABASE
BP
P S
QU
AR
E M
ET
RE
S (
3 M
MA )
2
3
4
5
6
7
8
9
10
11
12
13
14
15
16
17
% N
AT
ION
AL
OF
FIC
E V
AC
AN
CIE
S
(IN
VE
RT
ED
)
BPP OFFICES VACANCIES
BPP
VACANCIESINVERTED(RIGHT HANDSCALE)

Closer inspection reveals that a shopping mall in KwaZulu-Natal was responsible for 66% of the higher Jan 2011 figure, another shopping centre in Mpumalanga contributed 27%. That leaves 6% for the remainder of the country. Conclusion: the higher Jan 2011 figure is a flash-in-the-pan …
SHOPPING SPACE BUILDING PLANS PASSED: SQUARE METRES
0
40000
80000
120000
160000
200000
240000
| 86 | 87 | 88 | 89 | 90 | 91 | 92 | 93 | 94 | 95 | 96 | 97 | 98 | 99 | 20 | 01 | 02 | 03 | 04 | 05 | 06 | 07 | 08 | 09 | 10 | 11 | 12 | 13 |
Source: Stats SA; MFA DATABASE
SQ
UA
RE
ME
TR
ES

The Jan 2011 figures were poor and lower than in Jan 2010 …
INDUSTRIAL & WAREHOUSING BUILDING PLANS PASSED: SQUARE METRES
0
50000
100000
150000
200000
250000
300000
| 86 | 87 | 88 | 89 | 90 | 91 | 92 | 93 | 94 | 95 | 96 | 97 | 98 | 99 | 20 | 01 | 02 | 03 | 04 | 05 | 06 | 07 | 08 | 09 | 10 | 11 | 12 | 13 |
Source: Stats SA; MFA DATABASE
SQ
UA
RE
ME
TR
ES

… because industrial vacancies are still relatively high (vacancies line inverted)
INDUSTRIAL VACANCIES & INDUSTRIAL BUILDING PLANS PASSED
0
50000
100000
150000
200000
250000
300000
| 90 | 91 | 92 | 93 | 94 | 95 | 96 | 97 | 98 | 99 | 20 | 01 | 02 | 03 | 04 | 05 | 06 | 07 | 08 | 09 | 10 | 11 | 12 | 13 |
Source: RODE; STATS SA; SARB; MFA DATABASE
IND
US
TR
IAL
BB
P S
QU
AR
E M
ET
RE
S (
3m
ma)
0.0
0.5
1.0
1.5
2.0
2.5
3.0
3.5
4.0
4.5
5.0
HIG
HE
R
<
VA
CA
NC
Y R
AT
E
>
LO
WE
R
(IN
VE
RT
ED
)
INDUSTRIAL BPP INDUSTRIAL VACANCIES
VACANCIES INVERTEDRIGHT HAND SCALE
BPP

An earlier bounce back petered out in Dec 2010/Jan 2011
BUILDING PLANS PASSED: NON-RESIDENTIAL ADD & ALT SQUARE METRES
0
50000
100000
150000
200000
250000
300000
350000
| 86 | 87 | 88 | 89 | 90 | 91 | 92 | 93 | 94 | 95 | 96 | 97 | 98 | 99 | 20 | 01 | 02 | 03 | 04 | 05 | 06 | 07 | 08 | 09 | 10 | 11 | 12 | 13 |
Source: Stats SA; MFA DATABASE
SQ
UA
RE
ME
TR
ES

Overall data for Jan 2011 were poor, but somewhat better than the Jan 2010 low point
TOTAL BUILDING PLANS PASSED (SQUARE METRES)
0
750000
1500000
2250000
3000000
3750000
| 86 | 87 | 88 | 89 | 90 | 91 | 92 | 93 | 94 | 95 | 96 | 97 | 98 | 99 | 20 | 01 | 02 | 03 | 04 | 05 | 06 | 07 | 08 | 09 | 10 | 11 | 12 | 13 |
Source: Stats SA; MFA DATABASE
SQ
UA
RE
ME
TR
ES
TOTAL BPP 13mma

This comparison shows the relative performance of the various market segments since 1987. Only shops showed somewhat of an improvement because of two malls in KZN and Mpumalanga
COMPARISON: DWELLING HOUSES, TOWNHOUSES & FLATS, OFFICES, SHOPS, INDUSTRIAL SQUARE METRES (13 mma SMOOTHED) INDEX JAN 1987 = 100
0
100
200
300
400
500
600
700
| 87 | 88 | 89 | 90 | 91 | 92 | 93 | 94 | 95 | 96 | 97 | 98 | 99 | 20 | 01 | 02 | 03 | 04 | 05 | 06 | 07 | 08 | 09 | 10 | 11 | 12 | 13 |
Source: STATS SA; SARB; MFA DATABASE
SQ
UA
RE
ME
TR
ES
SM
OO
TH
ED
IN
DE
X J
AN
198
7 =
10
0
DH TH & FLATS OFFICES SHOPS INDUSTRIAL
Offices
Houses
Shops
Industrial
Townhouses& Flats
BUILDING PLANSPASSED

This comparison shows the lagged two-year pattern (residential is still dropping and non-residential has further to fall)
COMPARISON TO ILLUSTRATE THE LAG BETWEEN RESIDENTIAL & NON-RESIDENTIAL BUILDING PLANS PASSED. INDEX Jan 1987 = 100
0
50
100
150
200
250
| 87 | 88 | 89 | 90 | 91 | 92 | 93 | 94 | 95 | 96 | 97 | 98 | 99 | 20 | 01 | 02 | 03 | 04 | 05 | 06 | 07 | 08 | 09 | 10 | 11 | 12 | 13 |
Source: Stats SA; SARB; MFA DATABASE
IND
EX
Ja
n 1
98
7 =
10
0
RESIDENTIAL BPP NON-RESIDENTIAL
33 MONTH LAG
18 MONTH LAG
26 MONTH LAG
30 MONTH LAG
NON-RESIDENTIAL LAGS RESIDENTIAL BY 27 MONTHS, ON AVERAGE, OR BY JUST MORE THAN 2 YEARS
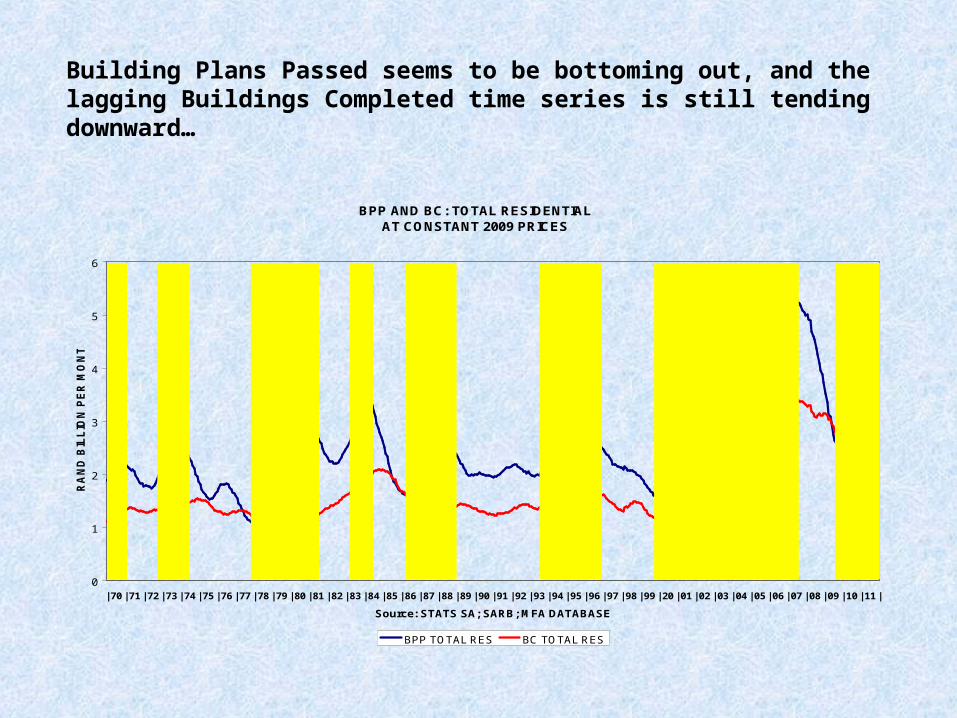
Building Plans Passed seems to be bottoming out, and the lagging Buildings Completed time series is still tending downward…
BPP AND BC: TOTAL RESIDENTIALAT CONSTANT 2009 PRICES
0
1
2
3
4
5
6
| 70 | 71 | 72 | 73 | 74 | 75 | 76 | 77 | 78 | 79 | 80 | 81 | 82 | 83 | 84 | 85 | 86 | 87 | 88 | 89 | 90 | 91 | 92 | 93 | 94 | 95 | 96 | 97 | 98 | 99 | 20 | 01 | 02 | 03 | 04 | 05 | 06 | 07 | 08 | 09 | 10 | 11 |
Source: STATS SA; SARB; MFA DATABASE
RA
ND
BIL
LIO
N P
ER
MO
NT
H
BPP TOTAL RES BC TOTAL RES
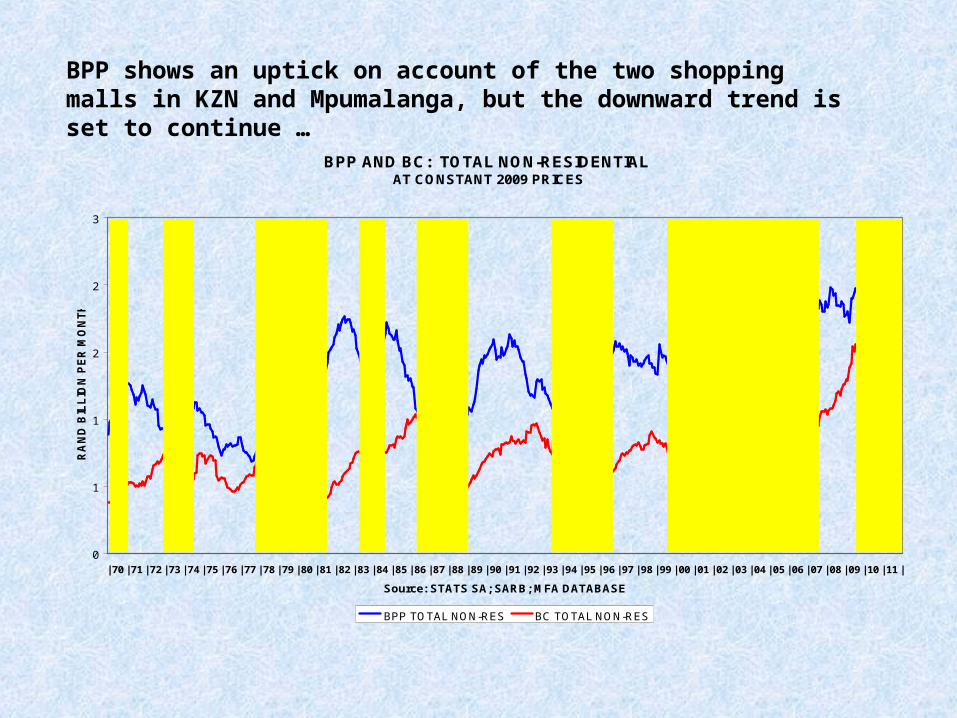
BPP shows an uptick on account of the two shopping malls in KZN and Mpumalanga, but the downward trend is set to continue …
BPP AND BC: TOTAL NON-RESIDENTIAL AT CONSTANT 2009 PRICES
0
1
1
2
2
3
| 70 | 71 | 72 | 73 | 74 | 75 | 76 | 77 | 78 | 79 | 80 | 81 | 82 | 83 | 84 | 85 | 86 | 87 | 88 | 89 | 90 | 91 | 92 | 93 | 94 | 95 | 96 | 97 | 98 | 99 | 00 | 01 | 02 | 03 | 04 | 05 | 06 | 07 | 08 | 09 | 10 | 11 |
Source: STATS SA; SARB; MFA DATABASE
RA
ND
BIL
LIO
N P
ER
MO
NT
H
BPP TOTAL NON-RES BC TOTAL NON-RES

BPP could be bottoming out … but the lagging BC series will probably decline further
BPP AND BC: TOTAL ADDITIONS AND ALTERATIONS AT CONSTANT 2009 PRICES
0
1
1
2
2
3
3
| 70 | 71 | 72 | 73 | 74 | 75 | 76 | 77 | 78 | 79 | 80 | 81 | 82 | 83 | 84 | 85 | 86 | 87 | 88 | 89 | 90 | 91 | 92 | 93 | 94 | 95 | 96 | 97 | 98 | 99 | 00 | 01 | 02 | 03 | 04 | 05 | 06 | 07 | 08 | 09 | 10 | 11 |
Source: STATS SA; SARB; MFA DATABASE
RA
ND
BIL
LIO
N P
ER
MO
NT
H
BPP TOTAL ADD & ALT BC TOTAL ADD & ALT

In deflated value terms, it seems as if BPP total could be approaching a trough, but BC is expected to fall further
TOTAL BUILDING PLANS PASSED AND BUILDINGS COMPLETED AT CONSTANT 2009 PRICES
0
2
4
6
8
10
12
| 70 | 71 | 72 | 73 | 74 | 75 | 76 | 77 | 78 | 79 | 80 | 81 | 82 | 83 | 84 | 85 | 86 | 87 | 88 | 89 | 90 | 91 | 92 | 93 | 94 | 95 | 96 | 97 | 98 | 99 | 00 | 01 | 02 | 03 | 04 | 05 | 06 | 07 | 08 | 09 | 10 | 11 |
Source: STATS SA; SARB; MFA DATABASE
RA
ND
BIL
LIO
N P
ER
MO
NT
H
BPP TOTAL BC TOTAL
