update of stats sa building statistics aug 2012 data dr johan snyman medium-term forecasting...
TRANSCRIPT
Update of Stats SA Building Statistics
AUG 2012 Data
Dr Johan Snyman
Medium-Term Forecasting Associates
STELLENBOSCH
21 October 2012
MEDIUM-TERM FORECASTING ASSOCIATESBuilding Economists Tel: (021) 881-3887 PO Box 7119 Fax: (021) 881-3887STELLENBOSCH, 7599 E-mail: [email protected]

Vehicle sales show a V-shaped recovery, with a U-shaped revival in the case of residential buildings. In the case of BPP, Aug 2012 data were a little better than July 2012 figures. Since end-2009, BPP Res data are moving virtually sideways within a fairly narrow band
COMPARISON TOTAL VEHICLE SALES & TOTAL REAL RESIDENTIAL PLANS PASSED INDEX 1970 = 100
0
50
100
150
200
250
300
350
| 71 | 74 | 77 | 80 | 83 | 86 | 89 | 92 | 95 | 98 | 01 | 04 | 07 | 10 | 13
Source: NAAMSA; Stats SA; SARB; MFA DATABASE
IND
EX
19
70
= 1
00
TOTAL VEHICLE SALES TOTAL REAL RESIDENTIAL BPP

The trend in the cyclical movements correspond closely; vehicle sales in Sep 2012 were 12% higher than a year ago, with residential BPP -8% lower y-o-y in Aug 2012
TOTAL VEHICLE SALES & TOTAL REAL RESIDENTIAL PLANS PASSED ANNUAL PERCENTAGE CHANGE
-60
-40
-20
0
20
40
60
80
100
| 71 | 74 | 77 | 80 | 83 | 86 | 89 | 92 | 95 | 98 | 01 | 04 | 07 | 10 | 13
Source: NAAMSA; STATS SA; SARB, MFA DATABASE (Economic upswings shaded)
AN
NU
AL
PE
RC
EN
TA
GE
CH
AN
GE
TOTAL VEHICLE SALES TOTAL RESIDENTIAL BPP
Shaded areas represent theupswing phases of the business cycle

The year-on-year improvement in the annual percentage change of the number of houses (left-hand scale) is currently 3%, pointing to a modest revival, with interest rates at their lowest levels since 1973 (right-hand scale inverted). Observe the “mini-growth cycle” developing in houses, similar to the period 1999/2004
PRIME RATE COMPARED TO BPP NUMBER OF HOUSES (>80m²) BPP ANNUAL PERCENTAGE CHANGE
-60
-40
-20
0
20
40
60
80
| 81 | 84 | 87 | 90 | 93 | 96 | 99 | 02 | 05 | 08 | 11 |
Source: Stats SA; SARB; MFA DATABASE
BP
P H
OU
SE
S A
NN
UA
L P
ER
CE
NT
AG
E
CH
AN
GE
8
10
12
14
16
18
20
22
24
26
28
PR
IME
RA
TE
(INV
ER
TE
D)
BPP NO OF HOUSES PRIME RATE
Introduction of National Credit ActBanks' stricter lending criteria applied
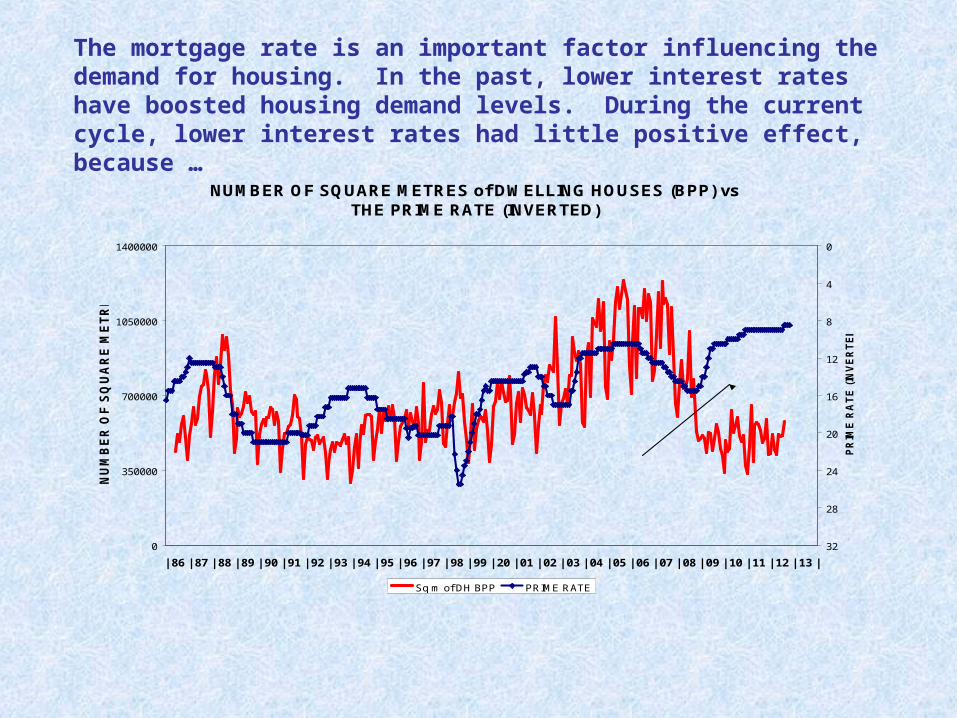
The mortgage rate is an important factor influencing the demand for housing. In the past, lower interest rates have boosted housing demand levels. During the current cycle, lower interest rates had little positive effect, because …
NUMBER OF SQUARE METRES of DWELLING HOUSES (BPP) vs THE PRIME RATE (INVERTED)
0
350000
700000
1050000
1400000
| 86 | 87 | 88 | 89 | 90 | 91 | 92 | 93 | 94 | 95 | 96 | 97 | 98 | 99 | 20 | 01 | 02 | 03 | 04 | 05 | 06 | 07 | 08 | 09 | 10 | 11 | 12 | 13 |
NU
MB
ER
OF
SQ
UA
RE
ME
TR
ES
0
4
8
12
16
20
24
28
32
PR
IME
RA
TE
(IN
VE
RT
ED
)
Sq m of DH BPP PRIME RATE
This unusual gap reflects poor housing demand
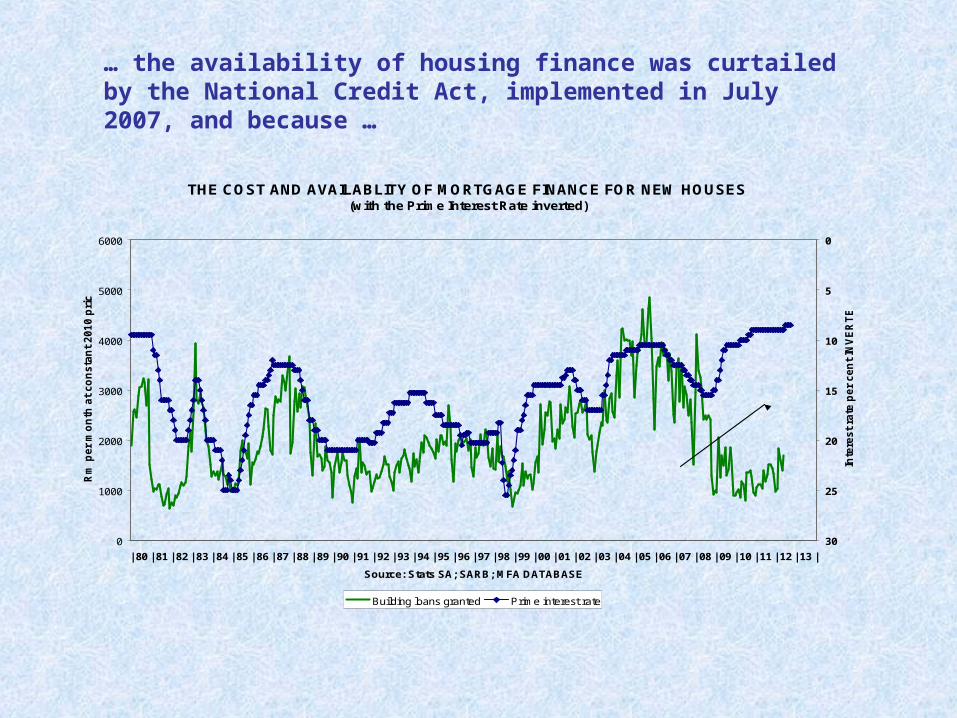
… the availability of housing finance was curtailed by the National Credit Act, implemented in July 2007, and because …
THE COST AND AVAILABLITY OF MORTGAGE FINANCE FOR NEW HOUSES(with the Prime Interest Rate inverted)
0
1000
2000
3000
4000
5000
6000
| 80 | 81 | 82 | 83 | 84 | 85 | 86 | 87 | 88 | 89 | 90 | 91 | 92 | 93 | 94 | 95 | 96 | 97 | 98 | 99 | 00 | 01 | 02 | 03 | 04 | 05 | 06 | 07 | 08 | 09 | 10 | 11 | 12 | 13 |
Source: Stats SA; SARB; MFA DATABASE
Rm
per
mo
nth
at
co
ns
tan
t 2
01
0 p
rice
s
0
5
10
15
20
25
30
Inte
rest
rate
pe
r c
en
t IN
VE
RT
ED
Building loans granted Prime interest rate
THIS UNUSUAL GAP HAS WORSENED THE DOWNTURN IN HOMEBUILDING

… the banks applied stricter credit lending criteria during the global recession. They currently view their lending criteria as slightly “stricter” than “normal” given the prevailing monetary environment. One can conclude that they are being more cautious in the prevailing uncertain economic conditions.
BANKS' LENDING CRITERIA Percentage of respondents
30
40
50
60
70
80
90
100
| 02 | 03 | 04 | 05 | 06 | 07 | 08 | 09 | 10 | 11 | 12 | 13 |
Source: BER; Ernst & Young; MFA DATABASE (Economic upswings shaded)
VE
RY
EA
SY
< E
AS
IER
<
> S
TR
ICT
ER
>
VE
RY
ST
RIC
T
Global FinancialCrisis
National Credit ActIntroduced
STRICT
EASY EASY
VERYSTRICT
NORMAL

In terms of (smoothed) numbers, private house plans in Aug 2012 were about 3% (y-o-y) better than in Aug 2011
BPP & BC: NUMBER of DWELLING HOUSES LARGER THAN 80m² 3 MONTH MOVING AVERAGE
0
1000
2000
3000
4000
5000
| 80 | 81 | 82 | 83 | 84 | 85 | 86 | 87 | 88 | 89 | 90 | 91 | 92 | 93 | 94 | 95 | 96 | 97 | 98 | 99 | 00 | 01 | 02 | 03 | 04 | 05 | 06 | 07 | 08 | 09 | 10 | 11 | 12 | 13 |
Source: Stats SA; MFA DATABASE
NU
MB
ER
OF
DW
EL
LIN
G H
OU
SE
S
BPP BC
Historical Peak4502
Lowest Point1000
LONG TERM MONTHLYAVERAGE2100 housesapproved
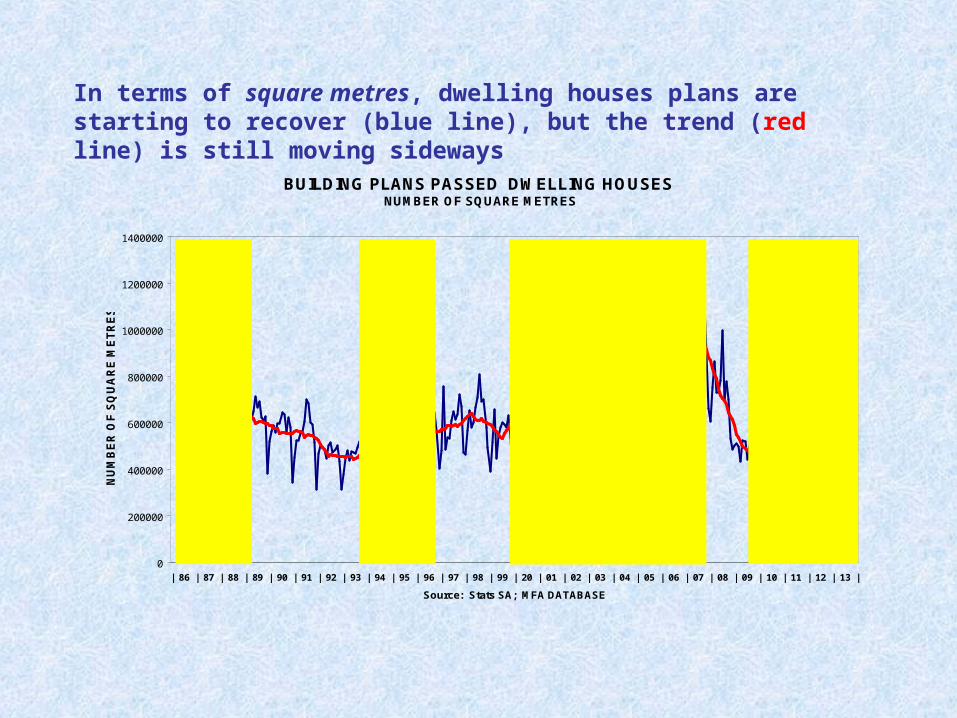
In terms of square metres, dwelling houses plans are starting to recover (blue line), but the trend (red line) is still moving sideways
BUILDING PLANS PASSED DWELLING HOUSES NUMBER OF SQUARE METRES
0
200000
400000
600000
800000
1000000
1200000
1400000
| 86 | 87 | 88 | 89 | 90 | 91 | 92 | 93 | 94 | 95 | 96 | 97 | 98 | 99 | 20 | 01 | 02 | 03 | 04 | 05 | 06 | 07 | 08 | 09 | 10 | 11 | 12 | 13 |
Source: Stats SA; MFA DATABASE
NU
MB
ER
OF
SQ
UA
RE
ME
TR
ES
`

Data of townhouses and flats were 11.5% lower in Aug 2012 than in Aug 2011. As is the case with dwelling houses, a prolonged sideways movement at a low level is evident
BUILDING PLANS PASSED TOWNHOUSES AND FLATS NUMBER OF SQUARE METRES
0
100000
200000
300000
400000
500000
600000
700000
800000
| 86 | 87 | 88 | 89 | 90 | 91 | 92 | 93 | 94 | 95 | 96 | 97 | 98 | 99 | 20 | 01 | 02 | 03 | 04 | 05 | 06 | 07 | 08 | 09 | 10 | 11 | 12 | 13 |
Source: Stats SA; MFA DATABASE
NU
MB
ER
OF
SQ
UA
RE
ME
TR
ES
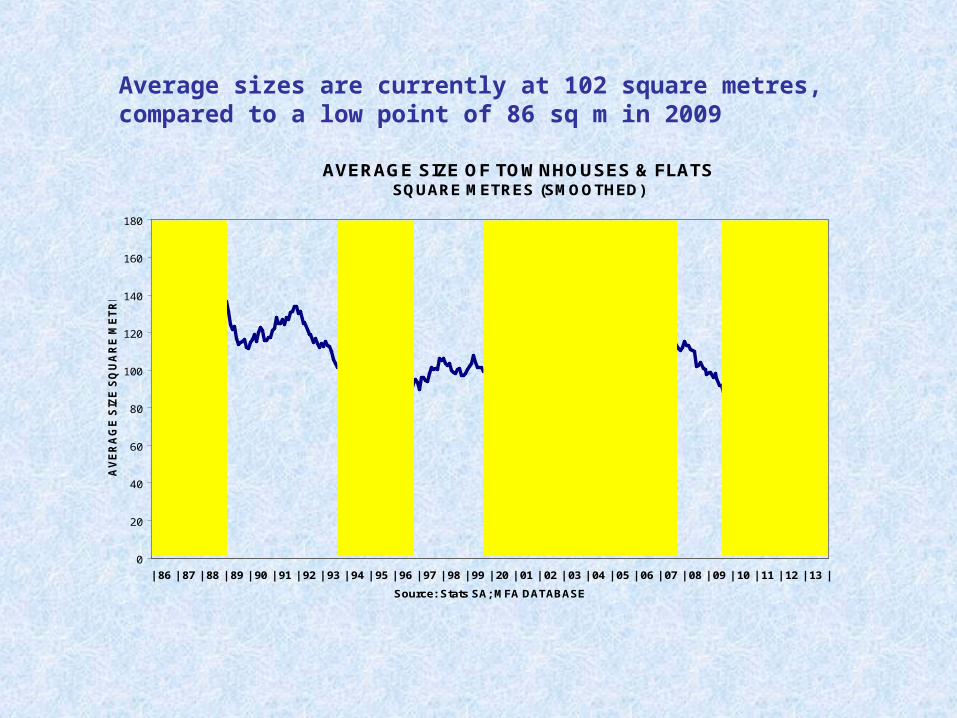
Average sizes are currently at 102 square metres, compared to a low point of 86 sq m in 2009
AVERAGE SIZE OF TOWNHOUSES & FLATS SQUARE METRES (SMOOTHED)
0
20
40
60
80
100
120
140
160
180
| 86 | 87 | 88 | 89 | 90 | 91 | 92 | 93 | 94 | 95 | 96 | 97 | 98 | 99 | 20 | 01 | 02 | 03 | 04 | 05 | 06 | 07 | 08 | 09 | 10 | 11 | 12 | 13 |
Source: Stats SA; MFA DATABASE
AV
ER
AG
E S
IZE
SQ
UA
RE
ME
TR
ES
CURRENTLY RISING FROM A LOW POINT of 86 to 95 SQUARE METRES

The building cost of townhouses and flats is currently at R559 000 per unit
AVERAGE BUILDING COST OF TOWNHOUSES & FLATS RAND (DATA SMOOTHED)
0
100000
200000
300000
400000
500000
600000
| 86 | 87 | 88 | 89 | 90 | 91 | 92 | 93 | 94 | 95 | 96 | 97 | 98 | 99 | 20 | 01 | 02 | 03 | 04 | 05 | 06 | 07 | 08 | 09 | 10 | 11 | 12 | 13 |
Source: Stats SA; MFA DATABASE
CO
ST
IN R
AN
D
CURRENTLY ABOUT R559 000 PER UNIT(on average)
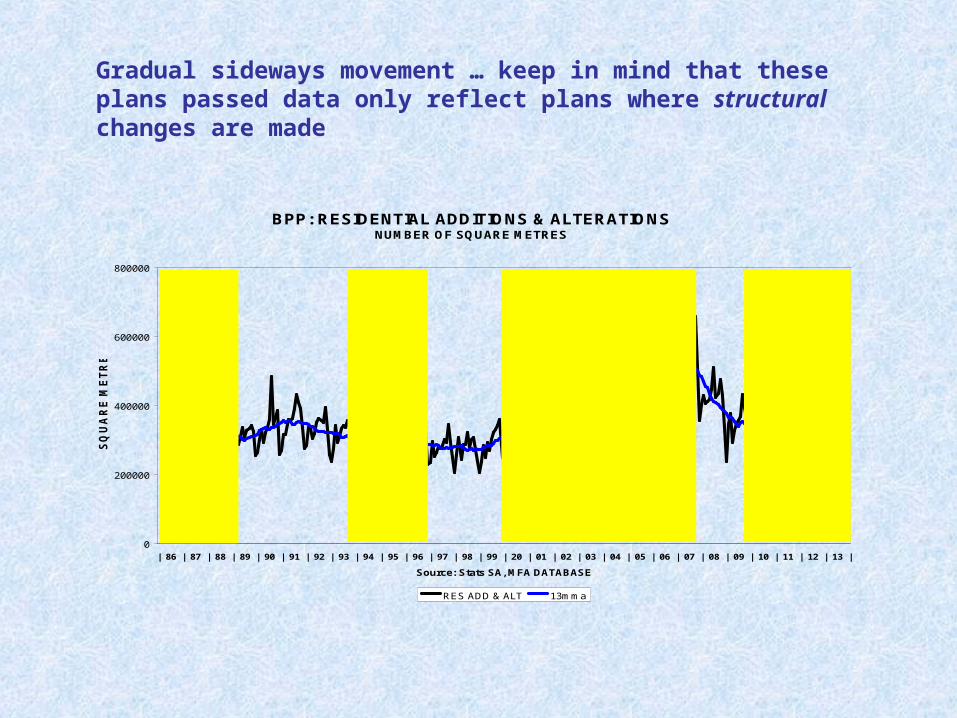
Gradual sideways movement … keep in mind that these plans passed data only reflect plans where structural changes are made
BPP: RESIDENTIAL ADDITIONS & ALTERATIONS NUMBER OF SQUARE METRES
0
200000
400000
600000
800000
| 86 | 87 | 88 | 89 | 90 | 91 | 92 | 93 | 94 | 95 | 96 | 97 | 98 | 99 | 20 | 01 | 02 | 03 | 04 | 05 | 06 | 07 | 08 | 09 | 10 | 11 | 12 | 13 |
Source: Stats SA, MFA DATABASE
SQ
UA
RE
ME
TR
ES
RES ADD & ALT 13mma

It seems as if the lower turning point in offices was recorded late in 2010. Smoothed Aug 2012 data are 28.3% higher than Aug 2011 figures
OFFICES BUILDING PLANS PASSED: SQUARE METRES
0
40000
80000
120000
160000
200000
| 86 | 87 | 88 | 89 | 90 | 91 | 92 | 93 | 94 | 95 | 96 | 97 | 98 | 99 | 20 | 01 | 02 | 03 | 04 | 05 | 06 | 07 | 08 | 09 | 10 | 11 | 12 | 13 |
Source: Stats SA; MFA DATABASE
SQ
UA
RE
ME
TR
ES

Office vacancy levels (vacancies line inverted) remain high at about 10.5% of available space
OFFICE VACANCIES & BUILDING PLANS PASSED OFFICES
0
50000
100000
150000
200000
| 92 | 93 | 94 | 95 | 96 | 97 | 98 | 99 | 20 | 01 | 02 | 03 | 04 | 05 | 06 | 07 | 08 | 09 | 10 | 11 | 12 | 13 |
Source: SARB; Stats SA; RODE DATABASE; SAPOA; MFA DATABASE
BP
P S
QU
AR
E M
ET
RE
S (
3 M
MA
)
2
3
4
5
6
7
8
9
10
11
12
13
14
15
16
17
% N
AT
ION
AL
OF
FIC
E V
AC
AN
CIE
S
(IN
VE
RT
ED
)
BPP OFFICES VACANCIES
BPP
VACANCIESINVERTED(RIGHT HANDSCALE)

Since the low point recorded in April 2011, an improvement is evident. Aug 2012 figures are 4.5% higher than Aug 2011 data
SHOPPING SPACE BUILDING PLANS PASSED: SQUARE METRES
0
40000
80000
120000
160000
200000
240000
| 86 | 87 | 88 | 89 | 90 | 91 | 92 | 93 | 94 | 95 | 96 | 97 | 98 | 99 | 20 | 01 | 02 | 03 | 04 | 05 | 06 | 07 | 08 | 09 | 10 | 11 | 12 | 13 |
Source: Stats SA; MFA DATABASE
SQ
UA
RE
ME
TR
ES

The smoothed data for industrial buildings in Aug 2012 are 17.7% than Aug 2011 figures
INDUSTRIAL & WAREHOUSING BUILDING PLANS PASSED: SQUARE METRES
0
50000
100000
150000
200000
250000
300000
| 86 | 87 | 88 | 89 | 90 | 91 | 92 | 93 | 94 | 95 | 96 | 97 | 98 | 99 | 20 | 01 | 02 | 03 | 04 | 05 | 06 | 07 | 08 | 09 | 10 | 11 | 12 | 13 |
Source: Stats SA; MFA DATABASE
SQ
UA
RE
ME
TR
ES

Industrial vacancies remain relatively high (vacancies line inverted, right-hand scale), but dropped somewhat during recent months
INDUSTRIAL VACANCIES & INDUSTRIAL BUILDING PLANS PASSED
0
50000
100000
150000
200000
250000
300000
| 90 | 91 | 92 | 93 | 94 | 95 | 96 | 97 | 98 | 99 | 20 | 01 | 02 | 03 | 04 | 05 | 06 | 07 | 08 | 09 | 10 | 11 | 12 | 13 |
Source: RODE; STATS SA; SARB; MFA DATABASE
IND
US
TR
IAL
BB
P S
QU
AR
E M
ET
RE
S (
3m
ma
)
0.0
0.5
1.0
1.5
2.0
2.5
3.0
3.5
4.0
4.5
5.0
HIG
HE
R
<
VA
CA
NC
Y R
AT
E
>
LO
WE
R
(IN
VE
RT
ED
)
INDUSTRIAL BPP INDUSTRIAL VACANCIES
VACANCIES INVERTEDRIGHT HAND SCALE
BPP
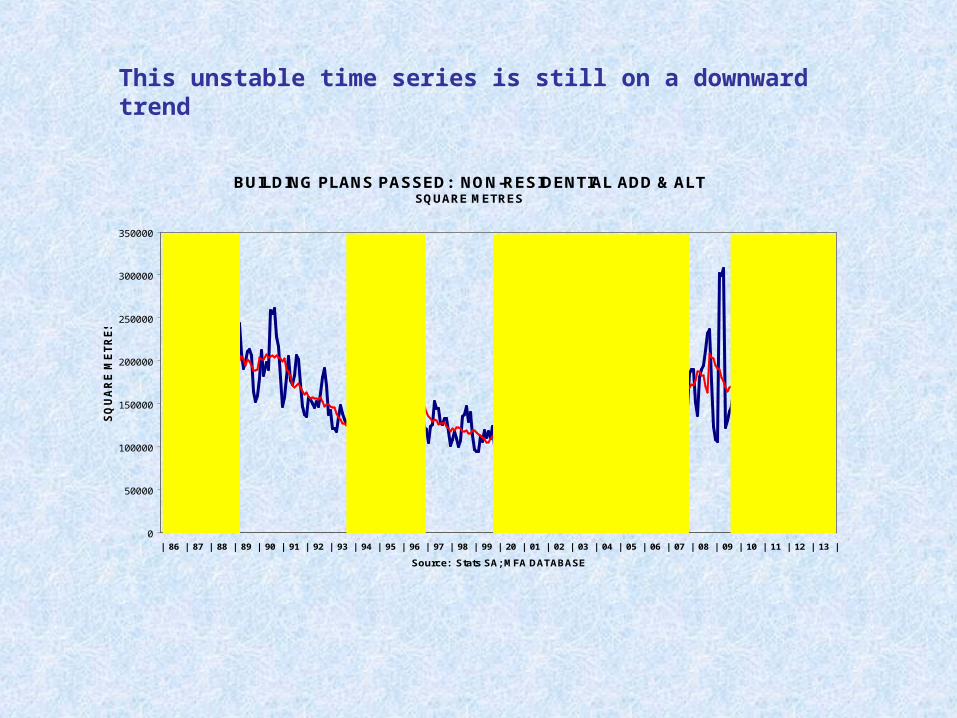
This unstable time series is still on a downward trend
BUILDING PLANS PASSED: NON-RESIDENTIAL ADD & ALT SQUARE METRES
0
50000
100000
150000
200000
250000
300000
350000
| 86 | 87 | 88 | 89 | 90 | 91 | 92 | 93 | 94 | 95 | 96 | 97 | 98 | 99 | 20 | 01 | 02 | 03 | 04 | 05 | 06 | 07 | 08 | 09 | 10 | 11 | 12 | 13 |
Source: Stats SA; MFA DATABASE
SQ
UA
RE
ME
TR
ES
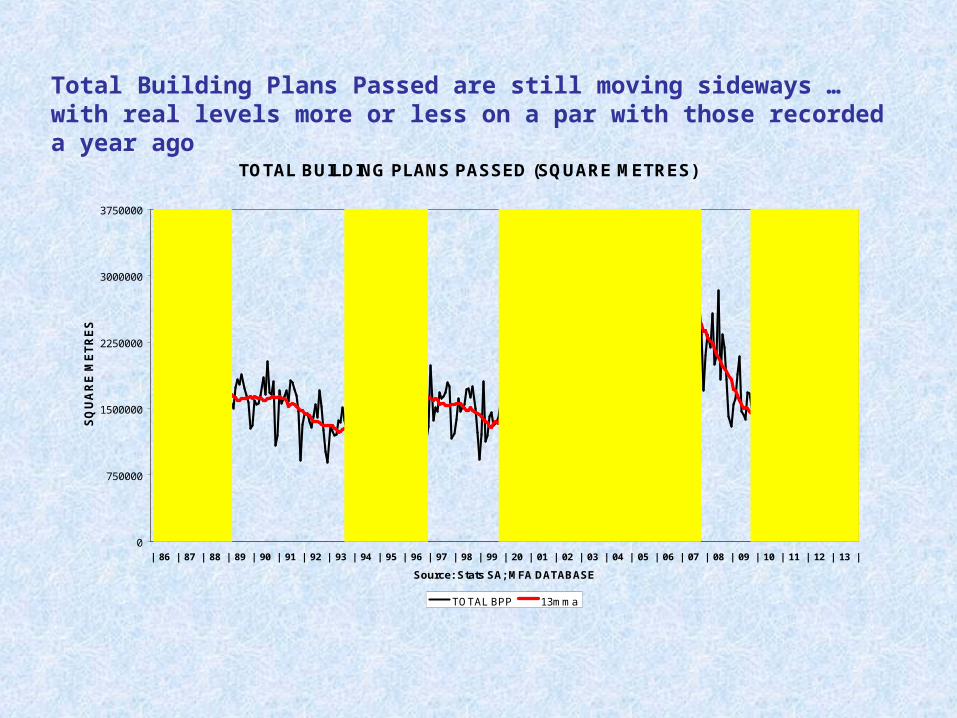
Total Building Plans Passed are still moving sideways … with real levels more or less on a par with those recorded a year ago
TOTAL BUILDING PLANS PASSED (SQUARE METRES)
0
750000
1500000
2250000
3000000
3750000
| 86 | 87 | 88 | 89 | 90 | 91 | 92 | 93 | 94 | 95 | 96 | 97 | 98 | 99 | 20 | 01 | 02 | 03 | 04 | 05 | 06 | 07 | 08 | 09 | 10 | 11 | 12 | 13 |
Source: Stats SA; MFA DATABASE
SQ
UA
RE
ME
TR
ES
TOTAL BPP 13mma
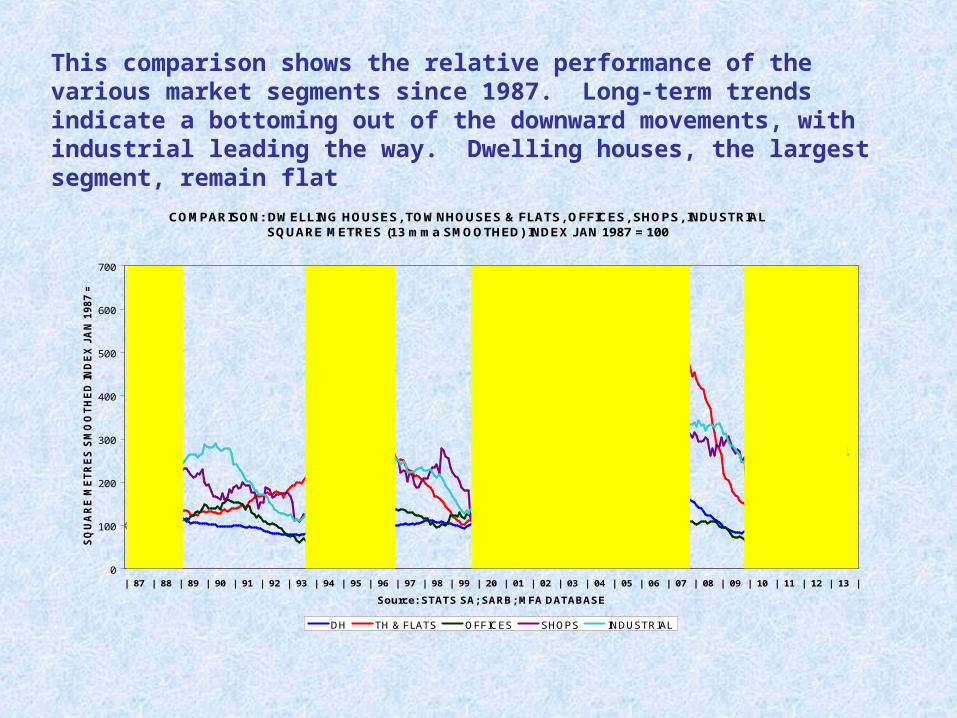
This comparison shows the relative performance of the various market segments since 1987. Long-term trends indicate a bottoming out of the downward movements, with industrial leading the way. Dwelling houses, the largest segment, remain flat
COMPARISON: DWELLING HOUSES, TOWNHOUSES & FLATS, OFFICES, SHOPS, INDUSTRIAL SQUARE METRES (13 mma SMOOTHED) INDEX JAN 1987 = 100
0
100
200
300
400
500
600
700
| 87 | 88 | 89 | 90 | 91 | 92 | 93 | 94 | 95 | 96 | 97 | 98 | 99 | 20 | 01 | 02 | 03 | 04 | 05 | 06 | 07 | 08 | 09 | 10 | 11 | 12 | 13 |
Source: STATS SA; SARB; MFA DATABASE
SQ
UA
RE
ME
TR
ES
SM
OO
TH
ED
IN
DE
X J
AN
19
87
= 1
00
DH TH & FLATS OFFICES SHOPS INDUSTRIAL
Offices
Houses
Shops
Industrial
Townhouses& Flats
BUILDING PLANSPASSED

This comparison of long term trends shows the lagged pattern. Against expectations, the traditional long-term pattern is no longer evident, i.e. non-res seems to be leading during the current cycle. Res has lingered for much longer (2007-2012) in the downswing phase than before
COMPARISON TO ILLUSTRATE THE LAG BETWEEN RESIDENTIAL & NON-RESIDENTIAL BUILDING PLANS PASSED. INDEX Jan 1987 = 100
0
50
100
150
200
250
| 87 | 88 | 89 | 90 | 91 | 92 | 93 | 94 | 95 | 96 | 97 | 98 | 99 | 20 | 01 | 02 | 03 | 04 | 05 | 06 | 07 | 08 | 09 | 10 | 11 | 12 | 13 |
Source: Stats SA; SARB; MFA DATABASE
IND
EX
Ja
n 1
98
7 =
10
0
RESIDENTIAL BPP NON-RESIDENTIAL
33 MONTH LAG
18 MONTH LAG
26 MONTH LAG
30 MONTH LAG
IN THE PAST , NON-RESIDENTIAL LAGGED RESIDENTIAL BY 27 MONTHS, ON AVERAGE, OR BY JUST MORE THAN 2 YEARS

BC is showing the normal lagged pattern
BPP AND BC: TOTAL RESIDENTIALAT CONSTANT 2010 PRICES
0
1
2
3
4
5
6
| 70 | 71 | 72 | 73 | 74 | 75 | 76 | 77 | 78 | 79 | 80 | 81 | 82 | 83 | 84 | 85 | 86 | 87 | 88 | 89 | 90 | 91 | 92 | 93 | 94 | 95 | 96 | 97 | 98 | 99 | 20 | 01 | 02 | 03 | 04 | 05 | 06 | 07 | 08 | 09 | 10 | 11 | 12 |
Source: STATS SA; SARB; MFA DATABASE
RA
ND
BIL
LIO
N P
ER
MO
NT
H
BPP TOTAL RES BC TOTAL RES
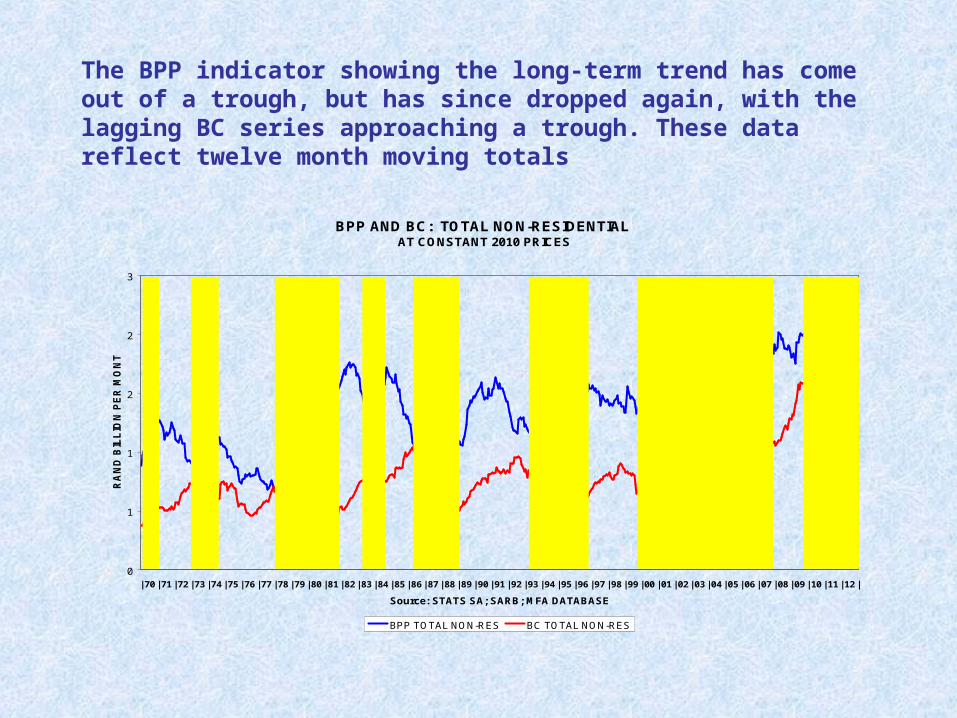
The BPP indicator showing the long-term trend has come out of a trough, but has since dropped again, with the lagging BC series approaching a trough. These data reflect twelve month moving totals
BPP AND BC: TOTAL NON-RESIDENTIAL AT CONSTANT 2010 PRICES
0
1
1
2
2
3
| 70 | 71 | 72 | 73 | 74 | 75 | 76 | 77 | 78 | 79 | 80 | 81 | 82 | 83 | 84 | 85 | 86 | 87 | 88 | 89 | 90 | 91 | 92 | 93 | 94 | 95 | 96 | 97 | 98 | 99 | 00 | 01 | 02 | 03 | 04 | 05 | 06 | 07 | 08 | 09 | 10 | 11 | 12 |
Source: STATS SA; SARB; MFA DATABASE
RA
ND
BIL
LIO
N P
ER
MO
NT
H
BPP TOTAL NON-RES BC TOTAL NON-RES

Both indicators are still reflecting a downward trend
BPP AND BC: TOTAL ADDITIONS AND ALTERATIONS AT CONSTANT 2010 PRICES
0
1
1
2
2
3
3
| 70 | 71 | 72 | 73 | 74 | 75 | 76 | 77 | 78 | 79 | 80 | 81 | 82 | 83 | 84 | 85 | 86 | 87 | 88 | 89 | 90 | 91 | 92 | 93 | 94 | 95 | 96 | 97 | 98 | 99 | 00 | 01 | 02 | 03 | 04 | 05 | 06 | 07 | 08 | 09 | 10 | 11 | 12 |
Source: STATS SA; SARB; MFA DATABASE
RA
ND
BIL
LIO
N P
ER
MO
NT
H
BPP TOTAL ADD & ALT BC TOTAL ADD & ALT

Total BPP seems to be forming a trough, i.e. the movement is sideways, but for the lagging BC series there could be more downside potential …
TOTAL BUILDING PLANS PASSED AND BUILDINGS COMPLETED AT CONSTANT 2010 PRICES
0
2
4
6
8
10
12
| 70 | 71 | 72 | 73 | 74 | 75 | 76 | 77 | 78 | 79 | 80 | 81 | 82 | 83 | 84 | 85 | 86 | 87 | 88 | 89 | 90 | 91 | 92 | 93 | 94 | 95 | 96 | 97 | 98 | 99 | 00 | 01 | 02 | 03 | 04 | 05 | 06 | 07 | 08 | 09 | 10 | 11 | 12 |
Source: STATS SA; SARB; MFA DATABASE
RA
ND
BIL
LIO
N P
ER
MO
NT
H
BPP TOTAL BC TOTAL