us economic outlook · fiscal tightening equal to 1.5% of gdp in 2013 will hold back growth. ......
TRANSCRIPT
© Nomura Securities International Inc.
Stronger economy meets fiscal drag
US Economic Outlook
See Disclosure Appendix A1 for the Analyst Certification and Other Important Disclosures
US Economics
Ellen Zentner; Executive Director
Senior US Economist
(2 12) 667-9668
April 2013
Economic Research
2013 Outlook in a nutshell Strengthening of fundamentals meets fiscal headwinds
Weak wage and salary growth continues, driven by high unemployment and
low-quality job creation.
Borrowing is unlikely to drive the economy forward. We expect personal
consumption to broadly track growth in personal income.
We expect the FOMC to continue its long-term asset purchases through Q1
2014.
A strengthening of the housing market should support investment, job
creation, and aggregate demand.
Wealth effect and housing market are two very important drivers of a stronger
recovery in 2013 and beyond.
Fiscal tightening equal to 1.5% of GDP in 2013 will hold back growth.
© Nomura Global Economics April 23, 2013 2
________________ See “US forecast update”, Special Report, 14 March 2013
Economic Research
“Blessed are the young for they shall inherit the
national debt” – Herbert Hoover, Thirty-First President, 1929-1933
© Nomura Global Economics April 23, 2013 3
The US federal budget deficit has topped $1 trillion for four straight
fiscal years.
Total public debt outstanding is now more than $16.7 trillion (103%
of GDP).
The US pays a low interest on outstanding debt, about 2.6% (and
declining).
Still, the gov’t paid more than $359 billion in interest in FY2012.
We won’t always enjoy these ultra low interest rates.
We have breached the level of “debt intolerance”.
Economic Research
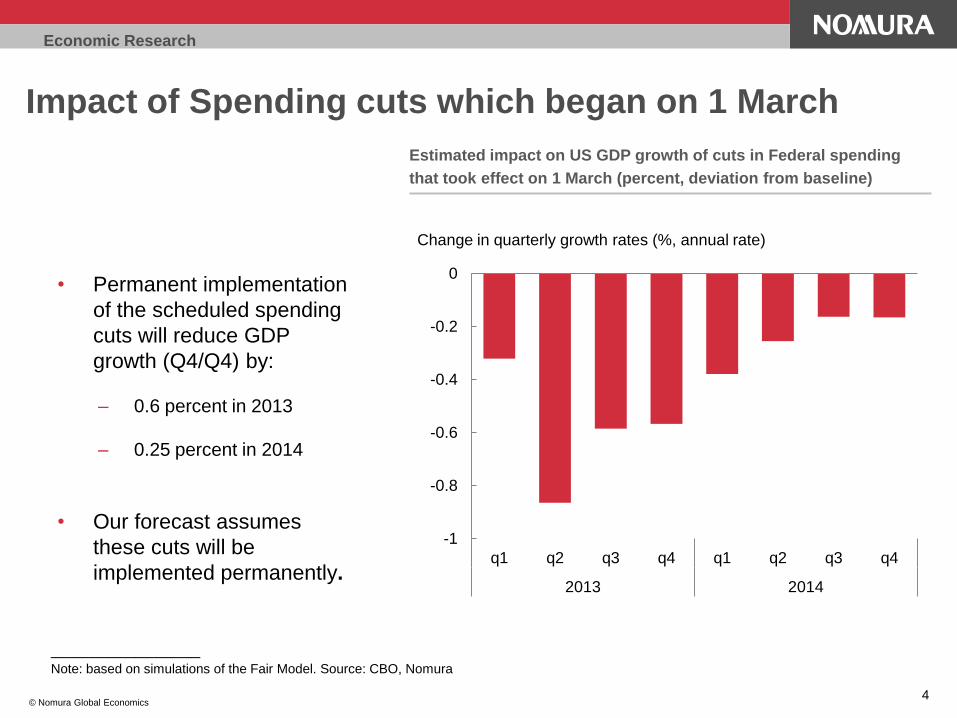
Impact of Spending cuts which began on 1 March
4
Estimated impact on US GDP growth of cuts in Federal spending
that took effect on 1 March (percent, deviation from baseline)
© Nomura Global Economics
• Permanent implementation
of the scheduled spending
cuts will reduce GDP
growth (Q4/Q4) by:
– 0.6 percent in 2013
– 0.25 percent in 2014
• Our forecast assumes
these cuts will be
implemented permanently.
-1
-0.8
-0.6
-0.4
-0.2
0
q1 q2 q3 q4 q1 q2 q3 q4
2013 2014
Change in quarterly growth rates (%, annual rate)
________________ Note: based on simulations of the Fair Model. Source: CBO, Nomura
Economic Research
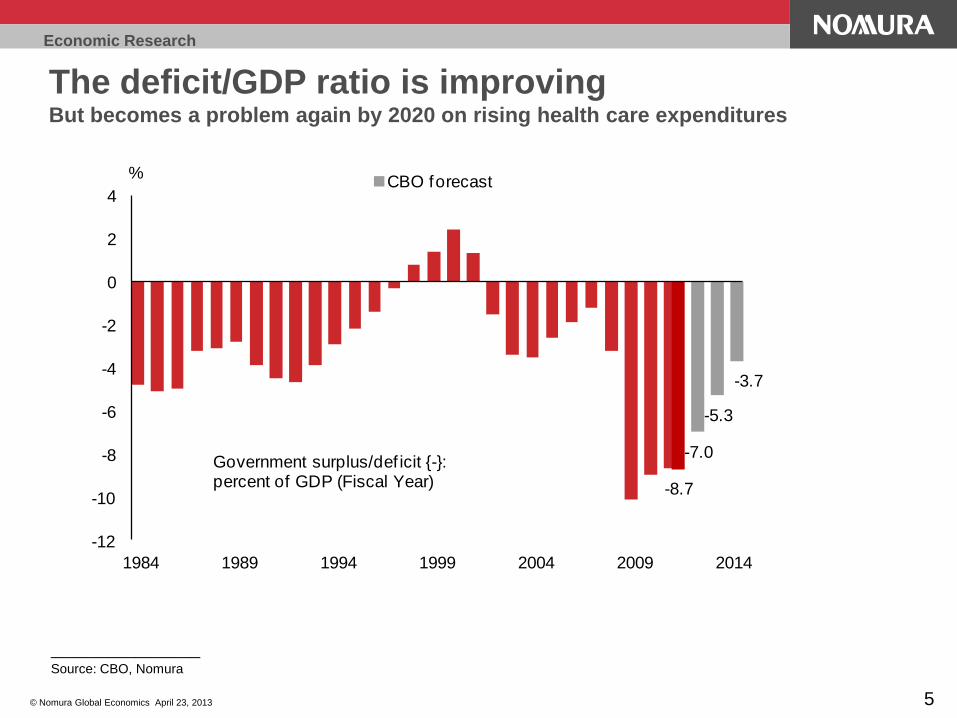
The deficit/GDP ratio is improving But becomes a problem again by 2020 on rising health care expenditures
© Nomura Global Economics April 23, 2013 5
-8.7
-7.0
-5.3
-3.7
-12
-10
-8
-6
-4
-2
0
2
4
1984 1989 1994 1999 2004 2009 2014
CBO forecast%
Government surplus/def icit {-}: percent of GDP (Fiscal Year)
________________ Source: CBO, Nomura
Economic Research
The fiscal debate ahead
The debt limit looms large again.
We have already breached the debt limit, but it has been suspended
through mid-May.
The debt limit will most likely become binding by early August.
Budget negotiations will remain contentious.
Little progress has been made in bridging a large ideological gap between
the two sides.
We expect long-term issues to be dealt with, to the extent possible, in
a version of the “normal” budget process for FY2014.
Ratings agencies have the US debt rating on “negative watch” with a
further downgrade penciled in if no credible long-term debt reduction
plan is reached.
© Nomura Global Economics April 23, 2013 6
________________ Source: Nomura
Economic Research
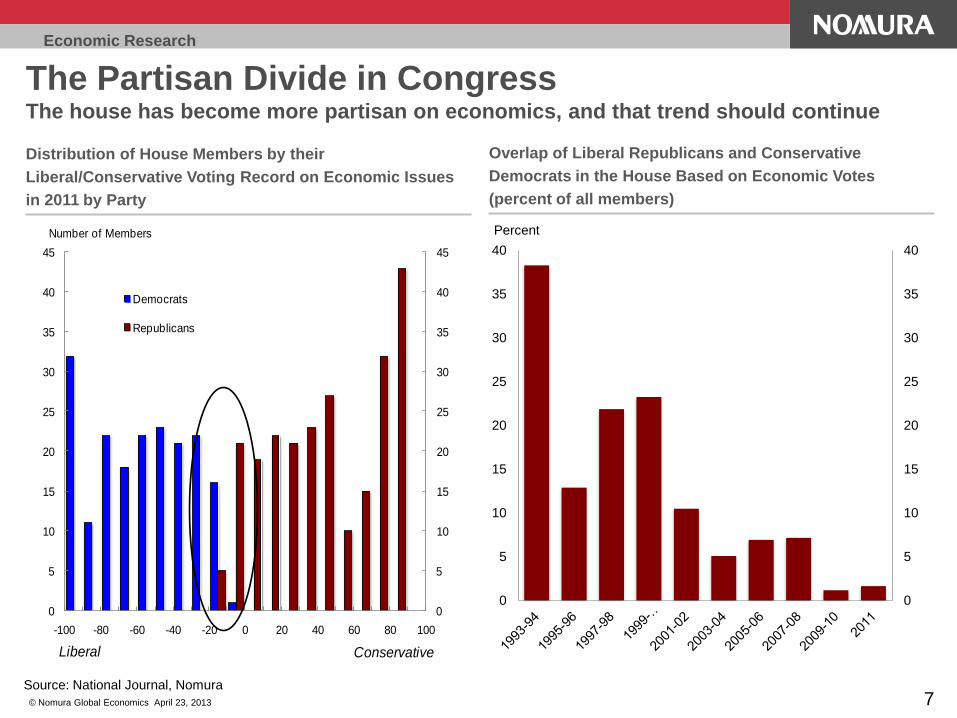
The Partisan Divide in Congress The house has become more partisan on economics, and that trend should continue
Source: National Journal, Nomura
Distribution of House Members by their
Liberal/Conservative Voting Record on Economic Issues
in 2011 by Party
Overlap of Liberal Republicans and Conservative
Democrats in the House Based on Economic Votes
(percent of all members)
-100 -80 -60 -40 -20 0 20 40 60 80 100
0
5
10
15
20
25
30
35
40
45
0
5
10
15
20
25
30
35
40
45
Democrats
Republicans
Liberal Conservative
Number of Members
7 © Nomura Global Economics April 23, 2013
0
5
10
15
20
25
30
35
40
0
5
10
15
20
25
30
35
40
Percent
Economic Research
The long-term fiscal challenge
The debate over fiscal policy should be shaped by the nature of the long-term
fiscal problem.
The cyclical improvement in the US fiscal accounts as the economy continues
to recover is likely to be significantly offset by two other factors.
An eventual normalization of interest rates which would increase interest
costs.
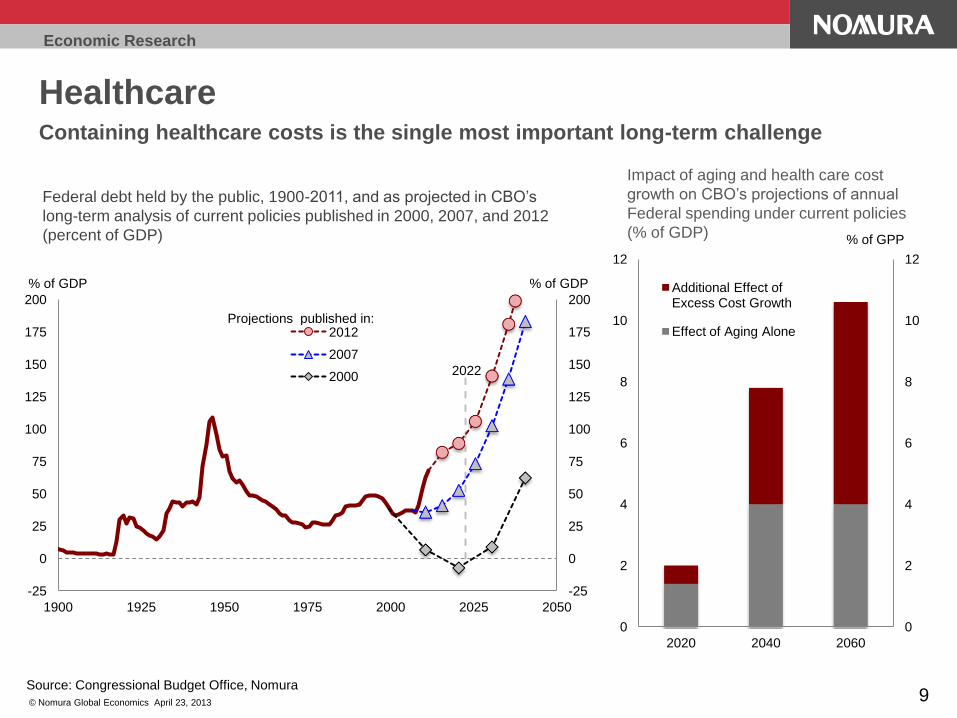
The combined effects of the aging of the population and rapidly increasing
healthcare costs on entitlement spending (the biggest factor driving the long-
term problem).
Stabilizing the US fiscal outlook over the long-term requires some combination
of:
A reduction in healthcare cost growth
Reductions in benefits
Higher taxes
This is challenging as:
There is no silver bullet for containing the cost of healthcare
Entitlements are among the most popular government programs
© Nomura Global Economics April 23, 2013 8
Economic Research
Healthcare Containing healthcare costs is the single most important long-term challenge
Source: Congressional Budget Office, Nomura
© Nomura Global Economics April 23, 2013 9
-25
0
25
50
75
100
125
150
175
200
-25
0
25
50
75
100
125
150
175
200
1900 1925 1950 1975 2000 2025 2050
% of GDP % of GDP
2012
2007
2000 2022
Projections published in:
Federal debt held by the public, 1900-2011, and as projected in CBO’s
long-term analysis of current policies published in 2000, 2007, and 2012
(percent of GDP)
0
2
4
6
8
10
12
0
2
4
6
8
10
12
2020 2040 2060
Additional Effect of Excess Cost Growth
Effect of Aging Alone
% of GPP
Impact of aging and health care cost
growth on CBO’s projections of annual
Federal spending under current policies
(% of GDP)
Economic Research
Legacy of financial crises
The credit-to-GDP ratio balloons in the 10 years leading up to financial
crises
Retrenchment lasts as long as the credit surge
In the 10 years following the crisis:
Deleveraging of private debt damps credit and employment growth (and lasts for
about 7 years)
Housing prices remain significantly lower (by 15-20%)
Unemployment remains significantly higher (in 2/3 of the observations never
returning to pre-crisis level)
Inflation remains lower
GDP growth is about 1% lower in the decade post-crisis (we have averaged 2.1%
growth in the current recovery)
It has taken governments 23 years on average to return debt-to-GDP
ratios to sustainable levels.
© Nomura Global Economics April 23, 2013 10
________________ Source: Carmen and Vincent Reinhart, “After the Fall”, FRBKC Jackson Hole Symposium, 2010; Reinhart, Reinhart, and
Rogoff, “Public Debt Overhangs”; Nomura
Economic Research
The US consumer in 2013
By the end of 2012, US households nearly fully recovered the $16
trillion lost in wealth since the housing meltdown and financial crisis.
Households have also been reducing debt levels for four years.
Household balance sheet adjustment is largely complete.
Trends in consumer spending have diverged greatly across income
groups.
Weak wage and salary growth, elevated energy prices, and
disproportionate tax burden is holding back spending among lower-
income households.
Rising prices for real estate and financial assets have emboldened
upper-income households.
© Nomura Global Economics April 23, 2013 11
________________ See “Spendthrift households to the rescue”, Special Report, 13 March 2013
Economic Research
12
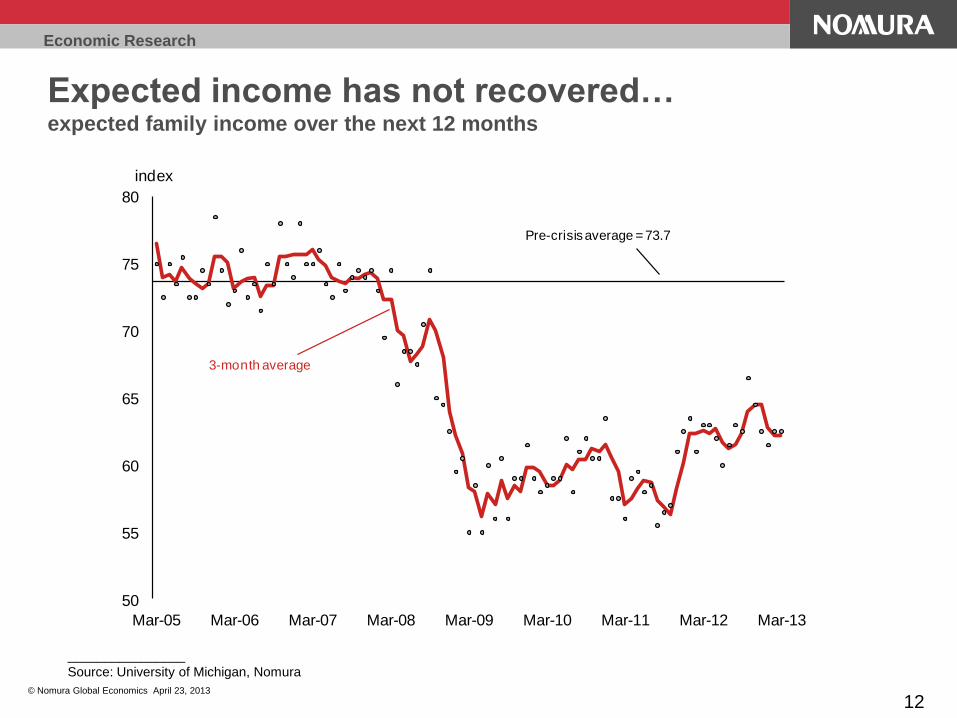
Expected income has not recovered… expected family income over the next 12 months
________________
Source: University of Michigan, Nomura
© Nomura Global Economics April 23, 2013
50
55
60
65
70
75
80
Mar-05 Mar-06 Mar-07 Mar-08 Mar-09 Mar-10 Mar-11 Mar-12 Mar-13
index
3-month average
Pre-crisis average = 73.7
Economic Research
13
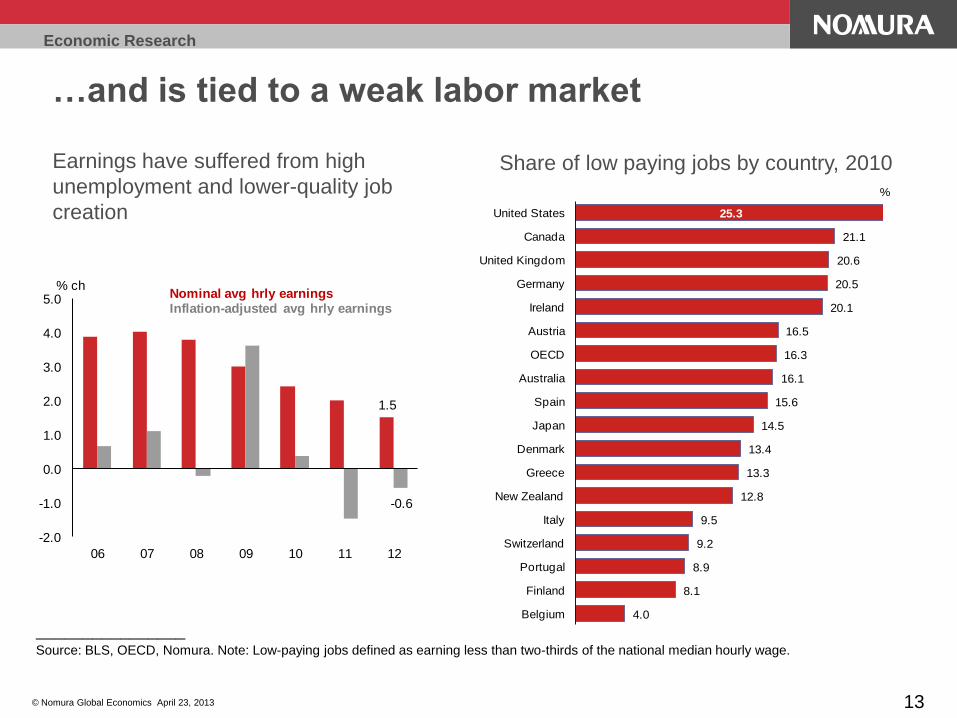
…and is tied to a weak labor market
________________ Source: BLS, OECD, Nomura. Note: Low-paying jobs defined as earning less than two-thirds of the national median hourly wage.
© Nomura Global Economics April 23, 2013
Earnings have suffered from high
unemployment and lower-quality job
creation
1.5
-0.6
-2.0
-1.0
0.0
1.0
2.0
3.0
4.0
5.0
06 07 08 09 10 11 12
% chNominal avg hrly earningsInflation-adjusted avg hrly earnings
Share of low paying jobs by country, 2010
4.0
8.1
8.9
9.2
9.5
12.8
13.3
13.4
14.5
15.6
16.1
16.3
16.5
20.1
20.5
20.6
21.1
25.3
Belgium
Finland
Portugal
Switzerland
Italy
New Zealand
Greece
Denmark
Japan
Spain
Australia
OECD
Austria
Ireland
Germany
United Kingdom
Canada
United States
%

Economic Research
Households are still debt constrained …but balance sheet adjustment is largely complete and low interest rates help
FOR: Payments to after-tax income
________________
Notes: The financial obligations ratio (FOR) is a broader measure than the debt service ratio (DSR). It includes automobile lease payments,
consumer debt payments, rental payments on tenant-occupied property, payments on mortgage debt, homeowners' insurance and property tax
payments. The DSR only includes payments on outstanding mortgage and consumer debt.
Source: Bureau of Economic Analysis, Federal Reserve, Haver Analytics, Nomura
Ratio: Household debt to after-tax income
14 © Nomura Global Economics April 23, 2013
134.6
110.7
20
40
60
80
100
120
140
160
1958 1964 1970 1976 1982 1988 1994 2000 2006 2012
%
household debt as a % of disposable income
15.5
15.0
15.5
16.0
16.5
17.0
17.5
18.0
18.5
19.0
1980 1984 1988 1992 1996 2000 2004 2008 2012
%
Financial obligations ratio
Economic Research
15
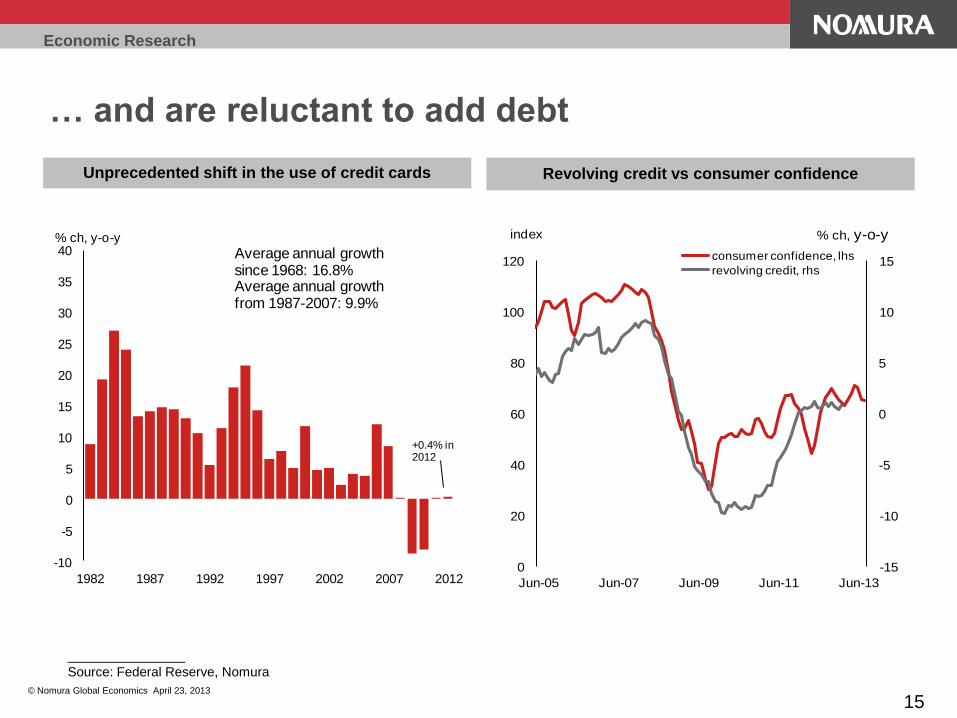
… and are reluctant to add debt
________________
Source: Federal Reserve, Nomura
Unprecedented shift in the use of credit cards Revolving credit vs consumer confidence
© Nomura Global Economics April 23, 2013
-10
-5
0
5
10
15
20
25
30
35
40
1982 1987 1992 1997 2002 2007 2012
% ch, y-o-y
Average annual growth since 1968: 16.8%Average annual growth from 1987-2007: 9.9%
+0.4% in 2012
-15
-10
-5
0
5
10
15
0
20
40
60
80
100
120
Jun-05 Jun-07 Jun-09 Jun-11 Jun-13
consumer confidence, lhs
revolving credit, rhs
index % ch, y-o-y
Economic Research
16
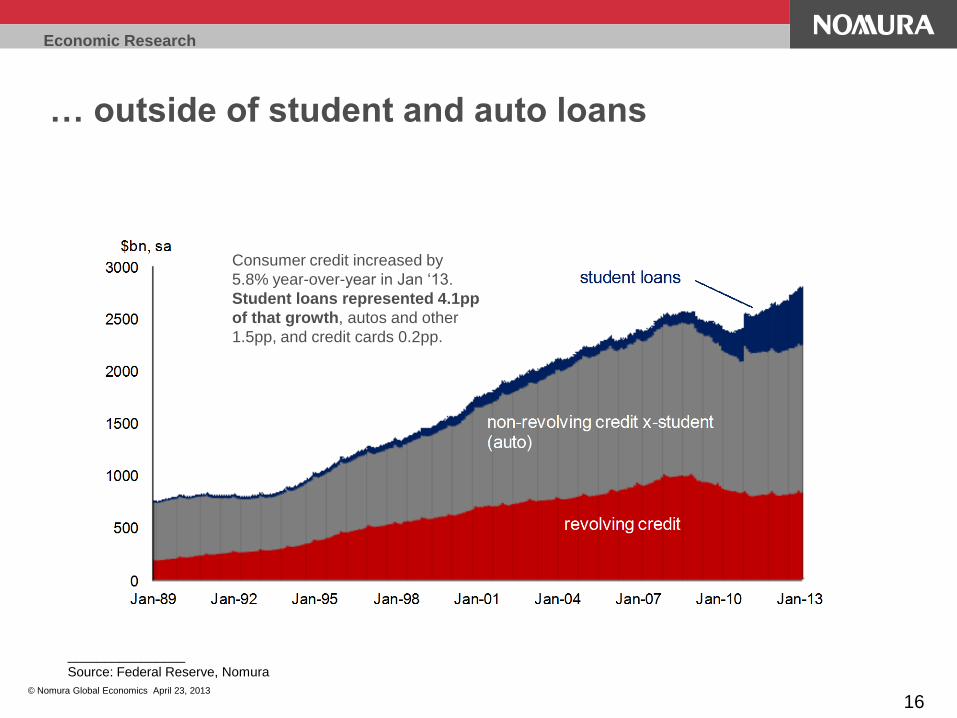
… outside of student and auto loans
________________
Source: Federal Reserve, Nomura
© Nomura Global Economics April 23, 2013
Consumer credit increased by
5.8% year-over-year in Jan ‘13.
Student loans represented 4.1pp
of that growth, autos and other
1.5pp, and credit cards 0.2pp.
Economic Research
17
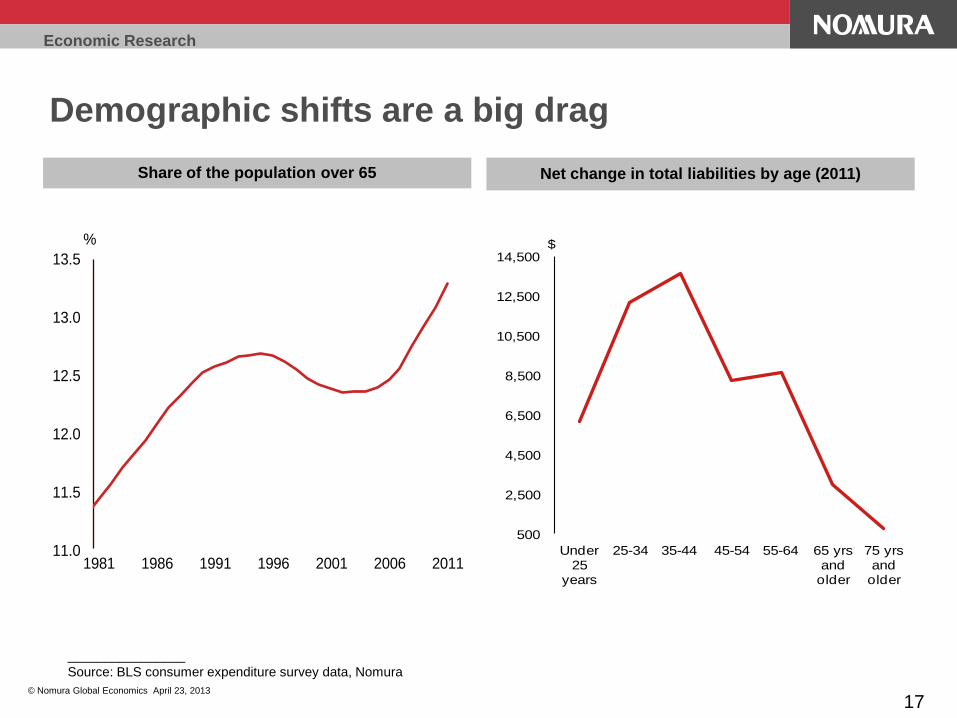
Demographic shifts are a big drag
________________
Source: BLS consumer expenditure survey data, Nomura
Share of the population over 65 Net change in total liabilities by age (2011)
© Nomura Global Economics April 23, 2013
500
2,500
4,500
6,500
8,500
10,500
12,500
14,500
Under 25
years
25-34 35-44 45-54 55-64 65 yrs and
older
75 yrs and
older
$
11.0
11.5
12.0
12.5
13.0
13.5
1981 1986 1991 1996 2001 2006 2011
%
Economic Research
18
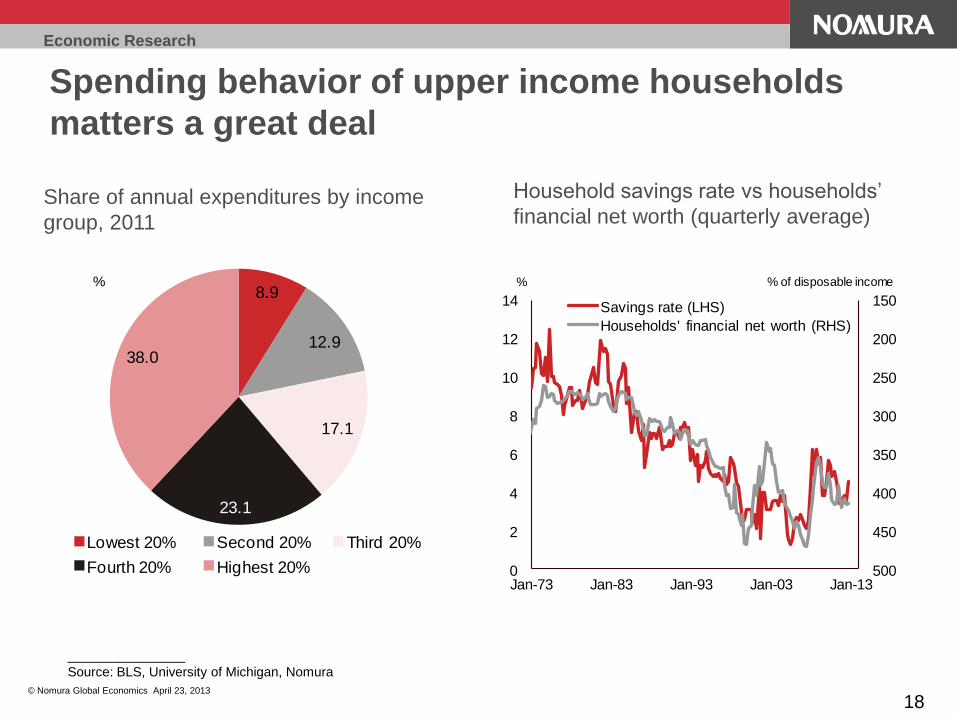
Spending behavior of upper income households
matters a great deal
________________
Source: BLS, University of Michigan, Nomura
© Nomura Global Economics April 23, 2013
Share of annual expenditures by income
group, 2011
Household savings rate vs households’
financial net worth (quarterly average)
8.9
12.9
17.1
23.1
38.0
Lowest 20% Second 20% Third 20%
Fourth 20% Highest 20%
%
150
200
250
300
350
400
450
5000
2
4
6
8
10
12
14
Jan-73 Jan-83 Jan-93 Jan-03 Jan-13
Savings rate (LHS)
Households' financial net worth (RHS)
% % of disposable income
Economic Research
19
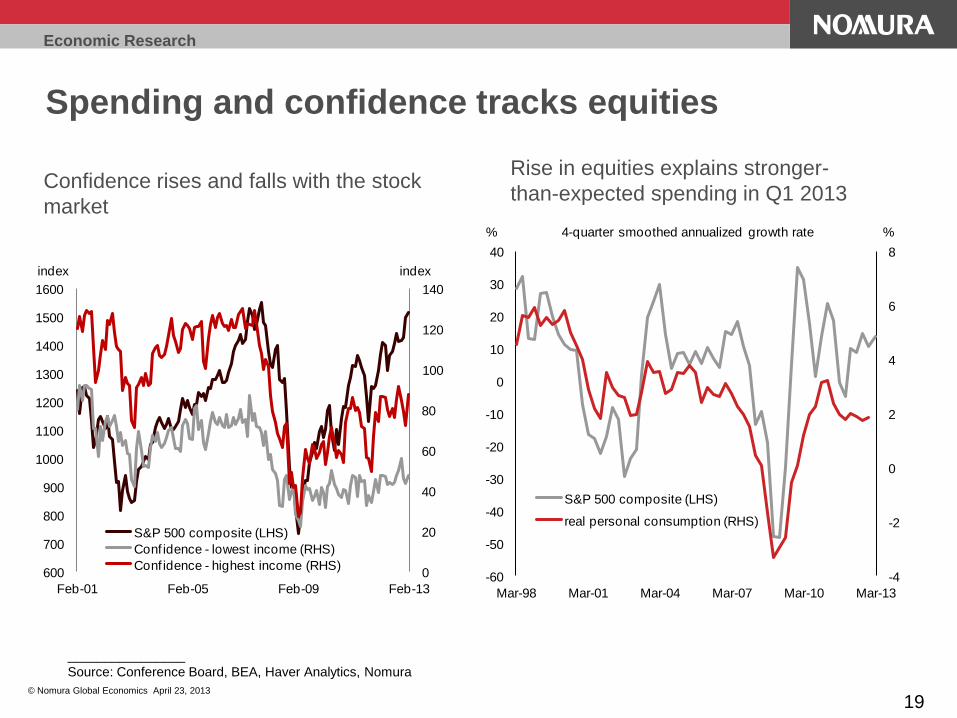
Spending and confidence tracks equities
________________
Source: Conference Board, BEA, Haver Analytics, Nomura
© Nomura Global Economics April 23, 2013
Confidence rises and falls with the stock
market
Rise in equities explains stronger-
than-expected spending in Q1 2013
0
20
40
60
80
100
120
140
600
700
800
900
1000
1100
1200
1300
1400
1500
1600
Feb-01 Feb-05 Feb-09 Feb-13
S&P 500 composite (LHS)
Conf idence - lowest income (RHS)
Conf idence - highest income (RHS)
index index
-4
-2
0
2
4
6
8
-60
-50
-40
-30
-20
-10
0
10
20
30
40
Mar-98 Mar-01 Mar-04 Mar-07 Mar-10 Mar-13
S&P 500 composite (LHS)
real personal consumption (RHS)
4-quarter smoothed annualized growth rate% %
Economic Research
Disclosure Appendix A-1 ANALYST CERTIFICATIONS
I, Ellen Zentner, hereby certify (1) that the views expressed in this report accurately reflect our personal views about any or all of the subject securities or issuers referred to in this report, (2)
no part of our compensation was, is or will be directly or indirectly related to the specific recommendations or views expressed in this report and (3) no part of our compensation is tied to any
specific investment banking transactions performed by Nomura Securities International, Inc., Nomura International plc or any other Nomura Group company.
Important Disclosures
Online availability of research and additional conflict-of-interest disclosures
Nomura research is available on www.nomuranow.com/research, Bloomberg, Capital IQ, Factset, MarkitHub, Reuters and ThomsonOne.
Important disclosures may be accessed through the left hand side of the Nomura Disclosure web page http://go.nomuranow.com/research/globalresearchportal or requested from Nomura
Securities International, Inc., on 1-877-865-5752. If you have any difficulties with the website, please email [email protected] for technical assistance.
The analysts responsible for preparing this report have received compensation based upon various factors including the firm's total revenues, a portion of which is generated by Investment
Banking activities.
Unless otherwise noted, the non-US analysts listed at the front of this report are not registered/qualified as research analysts under FINRA/NYSE rules, may not be associated persons of
NSI, and may not be subject to FINRA Rule 2711 and NYSE Rule 472 restrictions on communications with covered companies, public appearances, and trading securities held by a research
analyst account.
Nomura Global Financial Products Inc. (“NGFP”) Nomura Derivative Products Inc. (“NDPI”) and Nomura International plc. (“NIplc”) are registered with the Commodities Futures Trading
Commission and the National Futures Association (NFA) as swap dealers. NGFP, NDPI, and NIplc are generally engaged in the trading of swaps and other derivative products, any of which
may be the subject of this report.
ADDITIONAL DISCLOSURES REQUIRED IN THE U.S.
Principal Trading: Nomura Securities International, Inc. and its affiliates will usually trade as principal in the fixed income securities (or in related derivatives) that are the subject of this
research report. Analyst Interactions with other Nomura Securities International, Inc. Personnel: The fixed income research analysts of Nomura Securities International, Inc. and its affiliates
regularly interact with sales and trading desk personnel in connection with obtaining liquidity and pricing information for their respective coverage universe.
Valuation methodology – Fixed Income
Nomura’s Fixed Income Strategists express views on the price of securities and financial markets by providing trade recommendations. These can be relative value recommendations,
directional trade recommendations, asset allocation recommendations, or a mixture of all three.
The analysis which is embedded in a trade recommendation would include, but not be limited to:
•Fundamental analysis regarding whether a security’s price deviates from its underlying macro- or micro-economic fundamentals.
•Quantitative analysis of price variations.
•Technical factors such as regulatory changes, changes to risk appetite in the market, unexpected rating actions, primary market activity and supply/ demand considerations.
The timeframe for a trade recommendation is variable. Tactical ideas have a short timeframe, typically less than three months. Strategic trade ideas have a longer timeframe of typically more
than three months.
20
Economic Research
21
Disclaimers
This document contains material that has been prepared by the Nomura entity identified at the top or bottom of page 1 herein, if any, and/or, with the sole or joint contributions of one or more
Nomura entities whose employees and their respective affiliations are specified on page 1 herein or identified elsewhere in the document. The term "Nomura Group" used herein refers to
Nomura Holdings, Inc. or any of its affiliates or subsidiaries and may refer to one or more Nomura Group companies including: Nomura Securities Co., Ltd. ('NSC') Tokyo, Japan; Nomura
International plc ('NIplc'), UK; Nomura Securities International, Inc. ('NSI'), New York, US; Nomura International (Hong Kong) Ltd. (‘NIHK’), Hong Kong; Nomura Financial Investment (Korea)
Co., Ltd. (‘NFIK’), Korea (Information on Nomura analysts registered with the Korea Financial Investment Association ('KOFIA') can be found on the KOFIA Intranet at http://dis.kofia.or.kr);
Nomura Singapore Ltd. (‘NSL’), Singapore (Registration number 197201440E, regulated by the Monetary Authority of Singapore); Nomura Australia Ltd. (‘NAL’), Australia (ABN 48 003 032
513), regulated by the Australian Securities and Investment Commission ('ASIC') and holder of an Australian financial services licence number 246412; P.T. Nomura Indonesia (‘PTNI’),
Indonesia; Nomura Securities Malaysia Sdn. Bhd. (‘NSM’), Malaysia; NIHK, Taipei Branch (‘NITB’), Taiwan; Nomura Financial Advisory and Securities (India) Private Limited (‘NFASL’),
Mumbai, India (Registered Address: Ceejay House, Level 11, Plot F, Shivsagar Estate, Dr. Annie Besant Road, Worli, Mumbai- 400 018, India; Tel: +91 22 4037 4037, Fax: +91 22 4037
4111; SEBI Registration No: BSE INB011299030, NSE INB231299034, INF231299034, INE 231299034, MCX: INE261299034); and NIplc, Madrid Branch (‘NIplc, Madrid’) . ‘CNS Thailand’
next to an analyst’s name on the front page of a research report indicates that the analyst is employed by Capital Nomura Securities Public Company Limited (‘CNS’) to provide research
assistance services to NSL under a Research Assistance Agreement. CNS is not a Nomura entity.
THIS MATERIAL IS: (I) FOR YOUR PRIVATE INFORMATION, AND WE ARE NOT SOLICITING ANY ACTION BASED UPON IT; (II) NOT TO BE CONSTRUED AS AN OFFER TO SELL
OR A SOLICITATION OF AN OFFER TO BUY ANY SECURITY IN ANY JURISDICTION WHERE SUCH OFFER OR SOLICITATION WOULD BE ILLEGAL; AND (III) BASED UPON
INFORMATION FROM SOURCES THAT WE CONSIDER RELIABLE, BUT HAS NOT BEEN INDEPENDENTLY VERIFIED BY NOMURA GROUP.
Nomura Group does not warrant or represent that the document is accurate, complete, reliable, fit for any particular purpose or merchantable and does not accept liability for any act (or
decision not to act) resulting from use of this document and related data. To the maximum extent permissible all warranties and other assurances by Nomura group are hereby excluded and
Nomura Group shall have no liability for the use, misuse, or distribution of this information.
Opinions or estimates expressed are current opinions as of the original publication date appearing on this material and the information, including the opinions and estimates contained herein,
are subject to change without notice. Nomura Group is under no duty to update this document. Any comments or statements made herein are those of the author(s) and may differ from
views held by other parties within Nomura Group. Clients should consider whether any advice or recommendation in this report is suitable for their particular circumstances and, if
appropriate, seek professional advice, including tax advice. Nomura Group does not provide tax advice.
Nomura Group, and/or its officers, directors and employees, may, to the extent permitted by applicable law and/or regulation, deal as principal, agent, or otherwise, or have long or short
positions in, or buy or sell, the securities, commodities or instruments, or options or other derivative instruments based thereon, of issuers or securities mentioned herein. Nomura Group
companies may also act as market maker or liquidity provider (within the meaning of applicable regulations in the UK) in the financial instruments of the issuer. Where the activity of market
maker is carried out in accordance with the definition given to it by specific laws and regulations of the US or other jurisdictions, this will be separately disclosed within the specific issuer
disclosures.
This document may contain information obtained from third parties, including ratings from credit ratings agencies such as Standard & Poor’s. Reproduction and distribution of third party
content in any form is prohibited except with the prior written permission of the related third party. Third party content providers do not guarantee the accuracy, completeness, timeliness or
availability of any information, including ratings, and are not responsible for any errors or omissions (negligent or otherwise), regardless of the cause, or for the results obtained from the use
of such content. Third party content providers give no express or implied warranties, including, but not limited to, any warranties of merchantability or fitness for a particular purpose or use.
Third party content providers shall not be liable for any direct, indirect, incidental, exemplary, compensatory, punitive, special or consequential damages, costs, expenses, legal fees, or
losses (including lost income or profits and opportunity costs) in connection with any use of their content, including ratings. Credit ratings are statements of opinions and are not statements of
fact or recommendations to purchase hold or sell securities. They do not address the suitability of securities or the suitability of securities for investment purposes, and should not be relied on
as investment advice.
Economic Research Any MSCI sourced information in this document is the exclusive property of MSCI Inc. (‘MSCI’). Without prior written permission of MSCI, this information and any other MSCI intellectual property
may not be reproduced, re-disseminated or used to create any financial products, including any indices. This information is provided on an "as is" basis. The user assumes the entire risk of any use
made of this information. MSCI, its affiliates and any third party involved in, or related to, computing or compiling the information hereby expressly disclaim all warranties of originality, accuracy,
completeness, merchantability or fitness for a particular purpose with respect to any of this information. Without limiting any of the foregoing, in no event shall MSCI, any of its affiliates or any third
party involved in, or related to, computing or compiling the information have any liability for any damages of any kind. MSCI and the MSCI indexes are services marks of MSCI and its affiliates.
Investors should consider this document as only a single factor in making their investment decision and, as such, the report should not be viewed as identifying or suggesting all risks, direct or
indirect, that may be associated with any investment decision. Nomura Group produces a number of different types of research product including, among others, fundamental analysis, quantitative
analysis and short term trading ideas; recommendations contained in one type of research product may differ from recommendations contained in other types of research product, whether as a result
of differing time horizons, methodologies or otherwise. Nomura Group publishes research product in a number of different ways including the posting of product on Nomura Group portals and/or
distribution directly to clients. Different groups of clients may receive different products and services from the research department depending on their individual requirements. Clients outside of the
US may access the Nomura Research Trading Ideas platform (Retina) at http://go.nomuranow.com/equities/tradingideas/retina/
Figures presented herein may refer to past performance or simulations based on past performance which are not reliable indicators of future performance. Where the information contains an
indication of future performance, such forecasts may not be a reliable indicator of future performance. Moreover, simulations are based on models and simplifying assumptions which may
oversimplify and not reflect the future distribution of returns.
Certain securities are subject to fluctuations in exchange rates that could have an adverse effect on the value or price of, or income derived from, the investment.
The securities described herein may not have been registered under the US Securities Act of 1933 (the ‘1933 Act’), and, in such case, may not be offered or sold in the US or to US persons unless
they have been registered under the 1933 Act, or except in compliance with an exemption from the registration requirements of the 1933 Act. Unless governing law permits otherwise, any transaction
should be executed via a Nomura entity in your home jurisdiction.
This document has been approved for distribution in the UK and European Economic Area as investment research by NIplc. NIplc is authorised by the Prudential Regulation Authority (‘PRA’),
regulated by the Financial Conduct Authority and the PRA and .is a member of the London Stock Exchange. This document does not constitute a personal recommendation within the meaning of
applicable regulations in the UK, or take into account the particular investment objectives, financial situations, or needs of individual investors. This document is intended only for investors who are
'eligible counterparties' or 'professional clients' for the purposes of applicable regulations in the UK, and may not, therefore, be redistributed to persons who are 'retail clients' for such purposes. This
document has been approved by NIHK, which is regulated by the Hong Kong Securities and Futures Commission, for distribution in Hong Kong by NIHK. This document has been approved for
distribution in Australia by NAL, which is authorized and regulated in Australia by the ASIC. This document has also been approved for distribution in Malaysia by NSM. In Singapore, this document
has been distributed by NSL. NSL accepts legal responsibility for the content of this document, where it concerns securities, futures and foreign exchange, issued by their foreign affiliates in respect
of recipients who are not accredited, expert or institutional investors as defined by the Securities and Futures Act (Chapter 289). Recipients of this document in Singapore should contact NSL in
respect of matters arising from, or in connection with, this document. Unless prohibited by the provisions of Regulation S of the 1933 Act, this material is distributed in the US, by NSI, a US-
registered broker-dealer, which accepts responsibility for its contents in accordance with the provisions of Rule 15a-6, under the US Securities Exchange Act of 1934.
This document has not been approved for distribution to persons other than ‘Authorised Persons’, ‘Exempt Persons’ or ‘Institutions’ (as defined by the Capital Markets Authority) in the Kingdom of
Saudi Arabia (‘Saudi Arabia’) or to clients other than 'professional clients' (as defined by the Dubai Financial Services Authority) in the United Arab Emirates (‘UAE’) by Nomura Saudi Arabia, NIplc or
any other member of Nomura Group, as the case may be. Neither this document nor any copy thereof may be taken or transmitted or distributed, directly or indirectly, by any person other than those
authorised to do so into Saudi Arabia or in the UAE or to any person other than ‘Authorised Persons’, ‘Exempt Persons’ or ‘Institutions’ located in Saudi Arabia or to clients other than 'professional
clients' in the UAE. By accepting to receive this document, you represent that you are not located in Saudi Arabia or that you are an ‘Authorised Person’, an ‘Exempt Person’ or an ‘Institution’ in
Saudi Arabia or that you are a 'professional client' in the UAE and agree to comply with these restrictions. Any failure to comply with these restrictions may constitute a violation of the laws of the UAE
or Saudi Arabia.
NO PART OF THIS MATERIAL MAY BE (I) COPIED, PHOTOCOPIED, OR DUPLICATED IN ANY FORM, BY ANY MEANS; OR (II) REDISTRIBUTED WITHOUT THE PRIOR WRITTEN CONSENT
OF A MEMBER OF NOMURA GROUP. If this document has been distributed by electronic transmission, such as e-mail, then such transmission cannot be guaranteed to be secure or error-free as
information could be intercepted, corrupted, lost, destroyed, arrive late or incomplete, or contain viruses. The sender therefore does not accept liability for any errors or omissions in the contents of
this document, which may arise as a result of electronic transmission. If verification is required, please request a hard-copy version.
Nomura Group manages conflicts with respect to the production of research through its compliance policies and procedures (including, but not limited to, Conflicts of Interest, Chinese Wall and
Confidentiality policies) as well as through the maintenance of Chinese walls and employee training.
Additional information is available upon request. Disclosure information is available at the Nomura Disclosure web page:
http://go.nomuranow.com/research/globalresearchportal/pages/disclosures/disclosures.aspx
22