use the mass spectrometer in - open...
TRANSCRIPT

Use of the mass spectrometer in solid state electronics
Item Type text; Thesis-Reproduction (electronic)
Authors Barry, Michael John, 1941-
Publisher The University of Arizona.
Rights Copyright © is held by the author. Digital access to this materialis made possible by the University Libraries, University of Arizona.Further transmission, reproduction or presentation (such aspublic display or performance) of protected items is prohibitedexcept with permission of the author.
Download date 11/05/2018 16:35:56
Link to Item http://hdl.handle.net/10150/347754

'u s e - o f t h e m a s s s p e c t r o m e t e r i n
SOLID STATE ELECTRONICS
byMichael John Barry
A Thesis Submitted to the Faculty of theDEPARTMENT OF ELECTRICAL ENGINEERING
In Partial Fulfillment of the Requirements For the Degree of.MASTER OF SCIENCE
In the Graduate CollegeTHE UNIVERSITY OF' ARIZONA
1 9 7 1

STATEMENT BY AUTHOR
This thesis has been submitted in partial fulfillment of requirements for an advanced degree at The University of Arizona and is deposited in the University Library to be made available to borrowers under rules of the Library.
Brief quotations from this thesis are allowable without special permission, provided that accurate acknowledgment of source is made. Requests for permission for extended quotation from or reproduction of this manuscript in whole or in part may be granted by the head of the major department or the Dean of the Graduate College when in his judgment the proposed use of the material is in the interests of scholarship. In all other instances, however, permission must be obtained from the author.
SIGNED:
APPROVAL BY THESIS DIRECTOR This thesis has been approved on the date shown below:
FGLAS J. HAMILTON Professor of Electrical Engineering
/v, C UDate

• ACKNOWLEDGMENTS
The author wishes to express appreciation to the personnel of the Solid State Engineering Laboratory of The University of Arizona for their assistance during this' project.
In particular, the author wishes to thank his advisor, Dr.. Douglas J. Hamilton, and Mr. Victor A. Wells for their advice and guidance during the preparation of this thesis.
iii

TABLE OF CONTENTS . "
■ /' PageLIST OF ILLUSTRATIONS „ viLIST OF TABLES » ix
ST e o e o o O Q e d e o e o e e e » e o o o e e . 5CCHAPTER ^
1. INTRODUCTION . . . . . . . . . . . . . . . . . . 12. MASS SPECTROMETRY THEORY . . . . . . . . . . . . 3
Ion Source . . . . . . . . . . . . . . . . . 3Theory of Ion Formation and Mass
Spectra . . . . . . . . . . . . . . . . . 3_3LMonopole Mass Analyzer Theory . . . . . . . 18Ion Detector . . . . . . . . . . . . . . . . 30
3. VACUUM SYSTEM THEORY 34Monopole Vacuum System . . . . . . . . . . . 4 3
Rough Pumping . . . . . . . . . . . . . 43Sorption Pumping . . . . . . . . . . . . 46Getter-Ion Pumping . . . . . . . . . . . > 49
4. EQUIPMENT AND MATERIALS USED . . . . . . . . . . 52Monopole Mass Spectrometer . . . . . . . . . 52Ultek Vacuum System and Ancillary
Vacuum Equipment . . . . . . . . . . . . . 56' Ancillary Readout Equipment . .. . . . . . . 59
5. EXPERIMENTATION AND RESULTS . . . . . . . . . . 63Ultimate Vacuum and Background Noise . . . . 63Standard Analytical Procedures . . . . . . . 66Analysis of Argon . . . . . . . . . . . . . 69Analysis of Nitrogen 75Sensitivity . . . . . . . . . . . . . . . . 76Preferential Pumping and Memory. Effect . . . . . 81Analysis of Diborane . . . . . . . . . . . . . . . 91
6. CONCLUSIONS AND RECOMMENDATIONS . . . .•. . . 98
iv

APPENDIX A. APPENDIX B.
APPENDIX C. APPENDIX D.
REFERENCES
vTABLE OF CONTENTS— Continued .
. ' .PageVACUUM SYSTEM OPERATION . . . . . . . . . . 101MONOPOLE MASS SPECTROMETER
OPERATION 104SAMPLE MASS SPECTRA . . . . . . .. . . . . 107COMPILATION OF ARGON CRACKING
PATTERN . e o o . o o . o o e . e e e . 113o o » e e o a e e e o e e e e e e 1 e e e . a JL1. 0

LIST OF ILLUSTRATIONS
Figure ; Page2.1 Mass Spectrometer 42.2 Mass Spectra of Argon . . . . . . . . . . . . . 5
.2,3 Typical Ion Source . . . . . . . . . . . . . . 72 .4 Monopole Ion Source . . . . . , . . . . . . . . 92.5 Theoretical Mass Spectra . . . . . . . . . . . 162.6 Theoretical Magnetic Mass Analyzer . . . . . . 192.7 Quadrupole Mass Spectrometer . . . . . . . . . 212.8 Quadrupole Stability Diagram from
von Zahn (1963) . . . . . . . . . . . . . . . . . 242.9 Monopole Analyzer . . . . . . . . . . . . . . . 272.10 Ion Trajectories in Monopole Analyzer . . . . . 282.11 Monopole Stability Diagram from von Zahn
(1.9 6 3 ) . . . . . . . . . . . . . . . . . . . 22.12 Electron Multiplier . . . . . . . . . .......... 323.1 Sample Background Mass Spectra . . . . . . . . 393.2 Mass Spectra of Unknown Gas . . . . . . . . . . 413.3 Adjusted Mass Spectra . . . . . . . . . . . . . 423.4 Monopole Vacuum System . . . . . . . . . . . . 443.5 Sorption Pump (Cross Section) . . . . . . . . . 473.6 Getter-Ion Pump . . . . . . . . . . . . . . . . 504.1 Monopole System . . . . , . . . . . . . . . . . 534.2 Monopole Analyzer Tube . . . . . . . . . . . . . . 544.3 Monopole Electronic Control . . . . . ... . . . 55
Vi : : ' y

viiLIST OF ILLUSTRATIONS— Continued
Figure Page4 o 4 Leak Valve 0 « „ 0 <> © » © « © © © © © © © © © 604.5 Rotameters 615.1 Vacuum System Background Noise . „ . © © . . . 675.2 Ionization Efficiency Curve of Argon—
m/e 40 © © © © © © © © © © » © © « © © © © © 715.3 Ionization Efficiency Curve of. Argon—
Itty/ e 3 8 o © e o © o © © © © © " o o e e © e © o 725.4 . Ionization Efficiency Curve of' Argon--
m/ 3 6 © © © © © © © © © © © © © © © © © © © 7 35.5 Ionization Efficiency Curve of Argon—
m/e 20 © © © © © © © © * © © © © © © © © © © 745© 6 Ionization Efficiency Curve of Nitrogen—
in / e 28 © © © © © © © © © © © . © © © © © © © 775.7 Ionization Efficiency Curve of Nitrogen—
m y/ e 29 © © © © © © © © © © © © © © © © © © © 7 85.8 Ionization Efficiency Curve of Nitrogen—
m/e 1 © © © © © © © © © © ©-© © © © © © © © 7 95.9 Calibration Background Reading . © . © . . © © © 835.10 Initial Run for Nitrogen Calibration With
Pico-Ammeter at 10'*"° Scale . © . ' . © . . . . 845.11 Initial Run for Nitrogen Calibration With
' Pico-rAmmeter at 10-5 Scale. . . „ © © © . © © 865.12 Nitrogen Calibration Run + 10 Minutes . © . „ © .875.13 Nitrogen Calibration Run + 24 Hours - © . © . . . 895.14 Preferential Pumping © . . . . © © . © © ©J . © . 905.15 Gas Sampling System . © © . . . ■©■■©, . . .. . © . © . 935.16 Diborane Leaking into System . . . . © © © . © . 955.17 Pure Argon Flow . . . . . . . . . . . . . . . . 96

VI11
LIST OF ILLUSTRATIONS— Continued Figure PageCo 1 Typical Background Mass Spectra 108C„2 Background + 10 Minutes (N^ Admitted) . . . . . . 109Co 3 Background + 15 Minutes (N^ Admitted) „ . . » . 110Co4 Nitrogen Calibration . „ „ » . « . = . . . . . IllC„5 Argon Calibration „ . „ . » » . . » , , . . . . 112

LIST OF TABLES
Table Page2.1 Possible Settings for Monopole Ion Source . . . 112.2 Available Electron Multiplier Voltages . . . . 333.1 Accepted Degrees of Vacuum . . . . . . . . . . 353.2 Effect of Pressure on Density and Mean
Free Path o,f Air 363.3 Getter-Ion Pumping Speeds . . . . . . . . . . . 514.1 Ultex Timer Settings . . . . . . . . . . . . . 585.1 ' Monopole Operational Settings . . . . . . . . . . 685.2 Monopole Cracking Pattern— Argon ... . . . . . 695.3 Comparison, of Argon Cracking Patterns . . . . . 705.4 Monopole Cracking Pattern— Nitrogen . . . . . . 755.5 Comparison of Nitrogen Cracking Patterns . . . . 765.6 Project 44 Cracking Pattern— Diborane . . . . . 92A.1 Initial Vacuum System Settings . . . . . . . . 102B.l Monopole Mass Spectrometer Pre-Settings . . . . 105D.l Argon Cracking Pattern Data 1 Preliminary
i C S.3 3- £> . . . . . . . . . . . . . . . . . . 1-1- 3D.2 Argon Cracking Pattern Data 1 . . . . . . . . . 114D.3 - Argon Cracking Pattern Data 2 Preliminary
Bead rngs . . . . . . . . . . . . . . . . . . 1-15D.4 Argon Cracking Pattern Data 2 . . . . . . . . . 115
ix

ABSTRACT
This work is concerned with the application of mass spectrometry to solid state electronics„ A system which incorporates a mass spectrometer and ancillary vacuum equipment has been utilized to analyze typical gases used in the production of integrated circuits„
After a review of the principles of mass spectrometry and vacuum technology, a standard analytical procedure is. established to.assist in obtaining repeatable results. An analysis of nitrogen and argon is accomplished and the typical cracking patterns and ionization efficiency curves obtained are presented„ Characteristics of the getter-ion vacuum pump are explained and. difficulties encountered with the analysis of dibo.rane are discussed. . Finally, recommendations are made so as to increase the capability of the equipment to assist in future work.
x

CHAPTER 1
INTRODUCTION
In 1883 Thomas Edison noted that a current was able to flow between a hot filament and a positive plate enclosed in a vacuum. Using this observation as a starting point, Fleming, and later de Forrest, developed the vacuum tube.This development marked the beginning of the electronics . industry. At about the same time, J. J. Thompson, looking at the phenomenon noted by Edison, was able to show that the transfer of electric charge in a vacuum was due to the motion of small particles. It was Thompson, investigating these charged particles, who constructed the Parabolic Spectrograph in 1910. This apparatus, first used by Thompson, has developed through the years into today's mass spectrometers (Kiser, 1965). The application of the mass spectrometer in the petroleum industry has been quite extensive. It was this technique which confirmed the theory that petroleum originated from organic matter (McLafferty, 1963). Mass spectrometry is also utilized in such diverse fields as chemistry, nuclear, physics, geochemistry, cosmochemistry, and biochemistry, to name a few. Examples of possible applications are instantaneous breath analysis in medicine and criminology and analysis of atmospheric gases for pollution controls.

■ This thesis is concerned with the possibility of applying the capabilities of the mass spectrometer to work carried on in the Solid State Engineering Laboratory at The University of Arizona, To begin with. Chapter 2 serves to review briefly the theory.of the mass spectrometer and mass spectra, particularly as applied to the monopole mass spectrometer. This is followed in Chapter 3 by a review of vacuum system theory, a knowledge of which becomes important because the efficiency of the mass spectrometer is totally dependent on the ability to achieve a proper level of vacuum. Chapter 4 serves to explain the specific equipment and materials utilized for this project. In Chapter 5, the actual results obtained with the monopole mass spectrometer and its supporting vacuum system are presented and compared, as far as possible, with results obtained by others in this field. Chapter 6 is devoted to conclusions and recommendations, while the appendices contain explicit instructions for the proper operation of both the monopole mass spectrometer and the vacuum system, and examples of recorded mass spectra.
The ultimate goal of this thesis is the characterization of the General Electric Monopole 300 Mass Spectrometer. This is required if any successful utilization of the mass spectrometer in future work at the Solid State Engineering Laboratory is to be achieved.

CHAPTER 2
MASS SPECTROMETRY THEORY
The mass spectrometer is normally composed of three basic components (Fig. 2.1). The first, referred to as the ion source, samples a random amount of gas and converts it to a stream of charged ions. This stream of ions is then directed into the second component, the mass analyzer. The mass analyzer is capable of separating the various ions supplied by their relative atomic mass to charge ratio. The . third component, the ion detector, then produces an indication of the relative abundance of each mass. Generally, the resulting data are in the familiar form of a mass spectra (Fig. 2.2). There are numerous types of ion sources, mass analyzers, and ion detectors that have evolved through the years. Since this project is concerned with the General Electric Mbnopole Mass Spectrometer, only components similar to'those which are found in this particular instrument will be discussed. Many of the references (Kiser, 1965; Roboz,1968) do a more than adequate job in describing other types of components and instruments.
Ion Source . .The monopole mass spectrometer uses a Nier-type, hot
filament, electron-bombardment ion source. This type of ion

4
r
DETECTOR
MASS
ANALYZER
SOURCE
L
ELECTROMETER
X-YRECORDER
Fig. 2.1 Mass Spectrometer

Rela
tive
Ab
unda
nce
(detector
curr
ent)
5
-510 x 10
9
8
7
6
5
4
3
2
1
2030 1040m/e (amu)
Fig. 2.2 Mass Spectra of Argon

sour.ce was developed by. A.' 0. Nier in 1940 (Barnard, 1953),Iand remains as the standard of the industry. Various small improvements have been made, but the basic design is still the same. In a typical electron bombardment ion source (Fig. 2.3) , electrons are emitted from a heated filament and pass through two appropriately spaced electrodes into an ionization chamber. Slits with a diameter of about 1 mm collimate the stream of electrons, while a potential difference or ionization voltage (typically 70 volts) between and the filament serves as an accelerating force. An emission current is read between the filament and E^. A weak external magnetic field of from 100 to 1000 Gaussassists in collimating the path of the electrons and forces
l ' 'them to follow a simple helical path across the chamber.This increases the probability of a collision with thesample gas molecules in the chamber. The magnetic field istoo weak to have any appreciable effect on the much heaviercharged ions produced by the collisions. The stream ofelectrons passes through a slit in electrode E^ and iscollected on an anode or trap which is kept at a potentialhigher than E^ to prevent secondary emission of electronsinto the chamber. Positive ions are forced out of the .ionization chamber by the combined effects of a repellervoltage and accelerating voltage. A slight potentialdifference between the repeller plate and electrode E^directs the ions into an accelerating field caused by a

7
MAGNET
IONIZATION CHAMBER
REPELLER
electrons TrapFil MAGNET
-h "
~h
+
t ™tIONS
-E
•E
V
Fig. 2.3 . Typical Ion Source

potential difference of several thousand volts between E and Eg.- While in this field, the ions usually pass through a focusing electrode E^.
The monopole ion,source (Fig. 2.4) is quite similar to the typical ion source previously discussed. Electrons, are emitted from a thoria-coated iridium filament. Two filaments are provided. A switch on the rear of the monopole control panel allows selection of either filament. Metallic thorium has a high electron emissivity and is used as a coating for many types of filaments (Dushman and Lafferty, 1962). ■ A meter on the front of the monpole control panel (Fig 4.3) measures both the emission current (between the filament and E^) and ionization voltage (between the filament and E2). An intentional 5-minute slow warm up is built into the circuitry which supplies the emission current to provide a longer lifetime to the filaments. In the monopole ion source, emission current may be varied from 0.3 to 5.0 ma at a constant ionization voltage of 90 V 7 while the ionization voltage may be varied from 25 to 150 V, at a constant emission current of 1 ma.
Just as in the typical source the electrons pass through the ionization chamber (a wire mesh cage), where they may collide with molecules of the sample gas. If the energy of the collision is sufficient, at least one electron will be removed from-the original molecule, producing a ’charged ion. Positively charged ions are attracted towards

9
MASSANALYZER
FOCUS
DRAWOUT
FiliJ
r
A
IONS
1-
++ _ t "
t ‘+
1- It I
SHIELDE_
electrons IJTi
EI_____CAGE
/SHIELD
E.
Fig. 2.4 Monopole Ion Source

the drawout electrode„ Its voltage m a y ■be varied from 0 to 300 volts negative with respect to' ground. This drawout. ' potential replaces both the repeller and acceleration voltages found in the typical ion source discussed earlier.Due to the relatively small acceleration voltage, there is no magnetic field utilized in the monopole ion source. The ion in. a typical source receives such a huge acceleration that a weak, magnetic field has little effect on its motion. In the monopole, a small magnetic field would disrupt the ion path and is not used (von Zahn, 1963). As the drawout potential is made more negative, the ions obtain a higher velocity until they finally reach the detector. Ttiis has the overall effect of increasing the sensitivity of the m^nopole. After being accelerated through the slit in the drawout electrode, the ions pass through the focus electrode. The voltage of this electrode can be varied from -100 to +100 volts with respect to ground. This electrode causes the ions to form a narrow beam before passing into the mass analyzer tube. The ion energy adjustment on the monopole control panel (Fig. 4.3) controls the voltage of the wire cage that serves as an ionization chamber. It may be varied from 0 to 50 volts positive with respect to ground. Since the entrance slit to the mass analyzer tube is at ground potential, the energy of the ions entering the analyzer is determined by the value of the positive potential of the cage in which the ions are formed. A higher ion energy setting results in an increased

' 11 number of ions reaching the detector but poorer mass resolution. For convenience, Table 2,1 lists the possible . settings for the monopole ion source, A more detailed discussion of ion sources and ion optics may be found in the references (Barnard, 1953),
Table 2,1, Possible Settings for Monopole Ion Source
Parameter Read Between Range '
Emission Current Filament ■> E1 0.3 to 5.0 maIonization Voltage Filament » e 2 25 to 150 VDrawout Ground Drawout 0 to -300 VFo cus Ground Fo cus -100 to 100 VIon Energy . Ground ■9=- Cage 0\
to 50 V
Theory of Ion Formation and Mass Spectra As has been mentioned, the energy of the collisions
in the ionization chamber is great enough so that a molecule of the sample gas will lose at least one electron and become a charged ion. This is only one of the many possible reactions liable to occur. Some of the types of ions that may be formed will be briefly discussed in this section. For . further detail, see McLafferty (19 63).

• 12The various peaks that appear in the typical mass
spectra (Fig 2.2) correspond to the relative abundance of particular ions with a specific atomic mass weight to charge ratio. As the applied ionization voltage increases, more velocity or kinetic energy is given the stream of electrons emitted from the filament. At a certain point, referred to as the ionization potential, the emitted electrons will have just enough energy to remove an electron from a molecule with which it collides. Such a reaction is:
M + e~ — > M+ + 2e~
This is a simple representation of the reaction which ignores many aspects of both the physical and chemical processes that may. occur. However, it is adequate to describe the observed reaction. For all cases encountered in this research, the ionization potential is in the range of 10 to 20 volts, and could not be duplicated in the monopole ion source.
As the ionization voltage is increased, the ionization process becomes more efficient until it reaches a maximum, and then gradually drops off. A plot of this process is called an ionization efficiency curve. At the same time, as the voltage increases and the collisions in the ionization chamber become more energetic, the sample gas molecule is likely to absorb more energy and split into various types of fragments. These fragments may be positive,

negative, or neutral in charge. The monopole ion source will draw out only the positively charged ions, thus only these will be detected. Others may become involved in other collisions or be disposed of in other ways by the vacuum system. As the ionization voltage is increased, new fragments or peaks will then appear in the mass spectra.The particular voltage required to cause the appearance of each new peak is called the appearance potential of the particular ion fragment. Since the most elementary fragment is an ion with only one electron removed from the original molecule, in most cases the ionization potential and appearance potential of this "parent peak" are identical.
The general theory of mass spectra and of ion-molecule reactions is based on the Franck-Condon Principle.Simply stated, the Franck-Condon Principle requires that thenuclear configuration and momentum of a molecule do notchange during the transition of an electron from oneenergy level to another. The process of electron-impactionization seems to meet these conditions. An electronaccelerated by a potential of only 10 V will reach avelocity of approximately 2 x 10 m/sec. If we assume a
-—10molecular diameter of 1 x 10 m , the accelerated electron will pass through the molecule in 2, x 10~"*" . seconds. Since the frequencies of vibrations of bonds are about 1 x 10 seconds the electron will pass in a fraction of the

• •■■■ , ■- . \ 14-vibrational period of the molecule. A transition from one energy state to another that follows this rule is depicted as a "vertical" transition in a potential energy diagram. Usually an ionization voltage of 70 V is used in mass spectrometry, as at this particular value the fragmentation process seems to level out. Under the same specified conditions, the same ionization voltage will produce the same fragmentation pattern in a particular molecule, thus giving a particular "fingerprint" or "cracking pattern" that serves to identify the gas molecule.
As previously mentioned, one reaction that can occuris:
M + e“ —> M+ + 2e~
This type of ion is referred to as the molecular or parent peak in a mass spectra. The reaction produces an ion quite similar to the original molecule except that the absence of one electron gives it a positive charge. Such ions may be utilized to give ah accurate estimation of the atomic weight of the molecule. Normally, the parent peak is the largest in the mass spectra. Several other types of ions may also be found. Fragment ions may be caused by the
i . ' ,rupture of a particular bond in a molecule. Multiply- - charged ions appear at relative points in the mass spectra. ■ For. example, doubly-charged ions appear at the 1/2 mass point, and are due^ to the removal of two electrons from a

15-molecule in a reaction such as
M + e — M 1 + ' 3 e •
Isotope ions occur in mass spectra and are simply an indication of the abundance of the naturally, occurring isotopes of the sample gas„ Rearrangement ions may be formed in various ways. Possibly a fragment ion and an isotope ion may combine to form a new molecule. Metastable ions are formed by decomposing while in transit to the ion detector. Such ions are normally small in number, may appear at non-integral masses, and have a broad peak shape.A general idea of what each type of ion looks like can be seen in the theoretical mass spectra of Fig., 2,5..
A quasi-equilibrium theory of mass spectra has been developed, to explain the mechanism of ion formation. ..It is based on several assumptions (Robo.z, 1968) and the results obtained are in semi— quantitative agreement with experiments. To begin with, the basic step in all ion formations is the formation of the parent or molecular ion. The exchange of energy between an electron accelerated by 70 volts and a molecule is such that the molecular ion produced is in an excited state. The excess energy is distributed throughout the molecular ion as vibrational energy.Further fragmentation occurs when excess energy concentratesin a particular bond. This buildup of energy occurs within
_ 510 seconds, the exact time depending on the particular

RELATI
VE
ABUN
DANC
E (d
etector
curr
ent)
16
PARENT (molecular) PEAK
MULTIPLY-CHARGED PEAK
REARRANGEMENT OR FRAGMENT PEAKS
ISOTOPEPEAK
METASTABLEPEAK
0520 1015m/e (amu)
Fig. 2.5 Theoretical Mass Spectra

17molecular ion and bond. This serves as an explanation of the phenomenon of no two molecules having exactly the same mass spectra. Rate constants can then be calculated for the formation of fragment ions utilizing quantum mechanical methods. In addition, if a fragment ion is formed with an excess of vibrational energy, it also may fragment into other ions in the same manner as the parent ion. Due to the high vacuum conditions, each reaction may be considered as independent. The rate constants are calculated from the activation energies of the various decomposition processes while the activation energies may be determined from the appearance and ionization potential measurements. The procedure is not as simple as it seems. For example, to examine diborane one would have to determine rate constantsfor each of the following possible reactions (Long, 1970):
2 B2H 6 ^ B H 3 + B3H9 • :BH3 + B2H5 ^ B 3Hq ^ B3H 7 + H2
3 B 2H 6BH3 + B 3H?
B 2H 6. + B3H 7 + H2B 3H 9 + B 3H 72 B3H 7 B2H6 + B4H8
B 3H9 + B4H10 B2H 6 + B5H11 + H2

While.diborane has not been investigated to date by use of the quasi-equilibrium theory, it was found that the calculation of one rate constant for■2 ,3-dithiabutane requires about two hours with a desk.-calculator1. For the entire molecule, a few hundred hours would be necessary. However, when programmed and calculated on an IBM 1410-1401 computer, it took 15 minutes.(Kiser, 1965).
Monopole Mass Analyzer Theory Prior to 1953, most mass spectrometers made use of
powerful magnetic fields to form a predictable path for charged ions (Fig. 2.6). As they left the ion source, positive ions were accelerated and passed through a magnetic field. The strength of the field was determined precisely. Thus, the path of an ion could be varied by changing the accelerating voltage. The principle of operation was simple. A given ion with a specific mass to charge ratio would be displaced a constant distance if a■ icertain accelerating voltage was used to hurl it through a known magnetic field. Many variations were used with great success. However, the huge magnets required made such instruments excessively large. The quadrupole mass spectrometer developed by W. Paul in 1953 was capable of providing mass separation without a magnetic field.

MAGNETIC FIELD
IONDETECTORION
BEAM
Z L ACCELERATING T - VOLTAGE
IONSOURCE
Fig. 2.6 Theoretical Magnetic Mass Analyzer

20
The quadrupole uses'an RF electric field for mass analysis. It consists of four parallel rods which may have either a hyperbolic or cylindrical cross section. An end view is shown in Fig. 2.7. To produce the necessary electric field, both a DC voltage U and an RF voltage Vq cos out are applied to the rods. The rods on the YZ plane become negative electrodes with an applied voltage of -(U + V cos (tit) while the rods on the XZ plane are positive.electrodes with an applied voltage of +(U + Vq cos mt). A field along the axis of this system is produced which may be denoted a s :
quadrupole field along the Z axis. The equations of motion for an ion in this field are:
W = ( U + V cos (tit)o
Ions are accelerated out of an ion source and enter the
m2e(U + V cos mt) Xo = 0
2e(U + V cos (tit) Y
roo2
and

21
Y
Fig. 2.7 Quadrupole Mass Spectrometer

22
These equations can be transposed into Mathieu Equations by introducinq the following change of variables:
2 2a = 8eLJ/mr U)o
.q = 4eV /mr2(JU2o o
which leads to the Mathieu Equations of motion:
—— ^ + (a + 2q cos 20) X = 0 d0
- (a + 2q cos 20) Y = O'<30 : . . .
The solutions to these equations are considered to be quite complex (Kiser, 1965) , and are thoroughly discussed elsewhere (Dawson and Whetten, 1969), Fortunately the practical theory of operation can be discussed without a lengthy mathematical analysis. The ions enter the quadrupole field along the Z axis with the axial motion governed by the equation
the velocity of the,ions in the Z direction is a constant.The ion motion in the X and Y directions are governed by the
\ - - . ■ . ■ ■ ■ "
0
Since integrating this equation leads to
constant

23appropriate Mathieu equations. This motion is oscillatory in nature with an amplitude of oscillation determined by the stable solutions of the Mathieu equations for certain values of a and qr The stable solutions of these equations, are usually plotted on a quadrupole stability diagram (Fig. 2.8). It can be seen that as the values of a and q increase beyond certain points, the oscillations of an ion in either the X or Y direction will approach infinity, or strike the rods near its path on the Z axis. There are, however, certain values of a and q for which the ion path is considered stable. For these values the ion oscillations are such that it will pass through the length of the quadrupole field and reach a detector. This region of stable oscillations is represented on the stability diagram as the region under the intersection of the Y stability boundary and the X stability boundary. For an operating line one selects a constant a/q ratio. For optimum conditions, a = 0.237 and q = 0.706. Substitution of these values leads to:
2 2V = 7.219 (m/e) f r o o
? oU = 1.212(m/e)f roor U/V = 0.1678 so that the operating line passes through
° '
the intersection of the two stability boundaries. This gives an infinite resolution. The quadrupole circuitry

24
a
. 25
.20Quadrupole stable operating points (a, q
.15--
.10
.05
—
.10.2 . 6 .7 .9. 3 . 5 .8.4. 1
Fig. 2.8 Quadrupole Stability Diagram from von Zahn (1963).

usually provides for values of U and that can vary the U/V^ ratio from 0 to 0.2 , allowing the mass resolution to vary so that at near the optimum values mass separation is nearly perfect. As the U/Vq ratio decreases, a larger mass range can pass through the quadrupole field. For best results, the U/V^ ratio is kept as close to 0.16 as possible If this ratio remains constant, the value of the mass that may pass through the field can be determined by varying U and V . or by varying m. There is one other important point. In order for the quadrupole field to achieve mass separationthe ion must remain in the field long enough so that theunstable ions are removed. This is the principal reason for the lack of a large acceleration voltage in the ion source of an RF mass spectrometer. ' The upper limit of the acceleration voltage is then required to be:
< 2 9 2V - 4.2 x 10 L f AM/e acc ' '. ..
where L is the length of the analyzer and AM/e the separable mass difference (Roboz, 1968).
In 1963 Ulf von Zahn described the monopole mass spectrometer (von Zahn, 1963). The principles governing its operation are derived directly from the quadrupole concept. As was previously discussed, the equation of the electric field in the quadrupole analyzer is:

The field .is zero when both X and Y are zero or when X - Y. Thus, along a path of two planes- intersecting at the Z axis and at 45° to XZ and YZ planes there exists a region of no electric field in the quadrupole analyzer. In the monopole analyzer, von Zahn substituted a single right angled electrode in place of three of the rods used in the quadrupole analyzer. This electrode was maintained at ground * potential while a voltage of - (U + cos out) was applied to the single remaining electrode (Fig. 2.9). Although the same Mathieu equations govern the motion of an ion through both the quadrupole and monopole field, the behavior of an ion is found to be considerably different in the monopole field. While the geometry of the monopole is simplified, the mathematical theory behind it is just as complex (von Zahn, 19 63). The motion of the ion in the Y direction represents a beat, and the high frequency oscillations within the beat are not oscillations about the Z axis, although they are about the Z axis in the X direction. The actual path of an ion in the monopole field (Fig. 2.10) has been calculated (Lever, 1966). There are several conditions necessary to enable an ion to pass through the monopole field. As can be seen in the monopole stability diagram (Fig. 2.11), only ions with a and q values placing them in a narrow band to the right of the Y stability boundary will pass through. Additionally,. for stable passage of an ion,Y must be larger than | X | , and the field length must be

27
Fig. 2.9 Monopole Analyzer

28
Y
1/2 beat length
X
Fig. 2.10 Ion Trajectories in Monopole Analyzer

29
aMONOPOLE STABILITY
, REGION
.20
.15 MONOPOLE STABLE OPERATION POINTS (along a/q line)
.05-
-ms* q10.2 .3.1 .4 .5 . 6 7 8 9
Fig. 2.11 Monopole Stability Diagram from von Zahn (1963)

■ ' - \ 30 .less than one half the length of the total beat. Roughly half the injected ions will strike the right angle electrode during passage and become captured. On the other hand, the narrow stability zone allows the U/Vq ratio to vary over a greater range without loss of good mass resolution. In the monopole, mass separation is accomplished by varying the DC voltage, U , and RF voltage, V while keeping their ratioconstant at a constant frequency. Although this method requires more complicated circuitry than if only the RF frequency were varied, voltage sweeping allows a faster sweep capability over a wider mass range (Hudson and Watters, 1966). As a result, the General Electric Monopole Mass Spectrometer incorporates a mass scan of from 1 to 300 amu which may be scanned in its entirety with scan times of 5, 1., and 0.2 seconds, or 4 seconds per amu. An interesting study, on the design considerations of the General Electric Monopole Mass Spectrometer has beenpublished (Hudson and Watters, 1966).
- ( - - ■ ■ . . / :
. Ion DetectorAs has been previously discussed, positively charged
ions are drawn out of the ion source and accelerated through the monopole mass analyzer. It then becomes a problem of . detecting the ions that survive this process. Several methods have been utilized in the past. Photographic ,plates , pico-ammeters, and vibrating reed electrometers: have

: 31been utilized in various ways. In the General ElectricMonopole Mass Spectrometer, an electron multiplier is usedas the ion detector. The principle of operation is based onthe secondary emission of electrons. After passing throughthe mass analyzer, the charged ion impinges on a highvoltage cathode in the electron multiplier (Fig. 2.12).The energy of the collision is such that several electronsmay. be dislodged from the cathode with sufficient energy sothat they collide with the succeeding dynode in the electronmultiplier. Each electron "In turn then dislodges severaladditional electrons so that the single ion is amplified by
6 •a factor of up to 10 by the time the final anode is reachedThe ultimate amplification is dependent upon the initialvoltage of the cathode. In the General Electric Monopole •.Mass Spectrometer, a 10-stage, electron multiplier isutilized. The voltage applied to the cathode can bedetermined by a switch at the rear of the monopole controlpanel. The amplification of the ion current increases asthe voltage of the cathode is increased . This, in turn, V..increases the sensitivity of the monopole. The voltagesavailable to the monopole are listed in Table 2.2.
The voltage to each succeeding dynode becomesprogressively smaller since it must pass through a 1.0megohm resistor between the cathode, each dynode, and the.final anode. The amplification capability of the electron
5 6multiplier varies from 10 to 10 , depending on the initial

32
CATHODE
-q y h o d e
dy h o d b
■qyhode
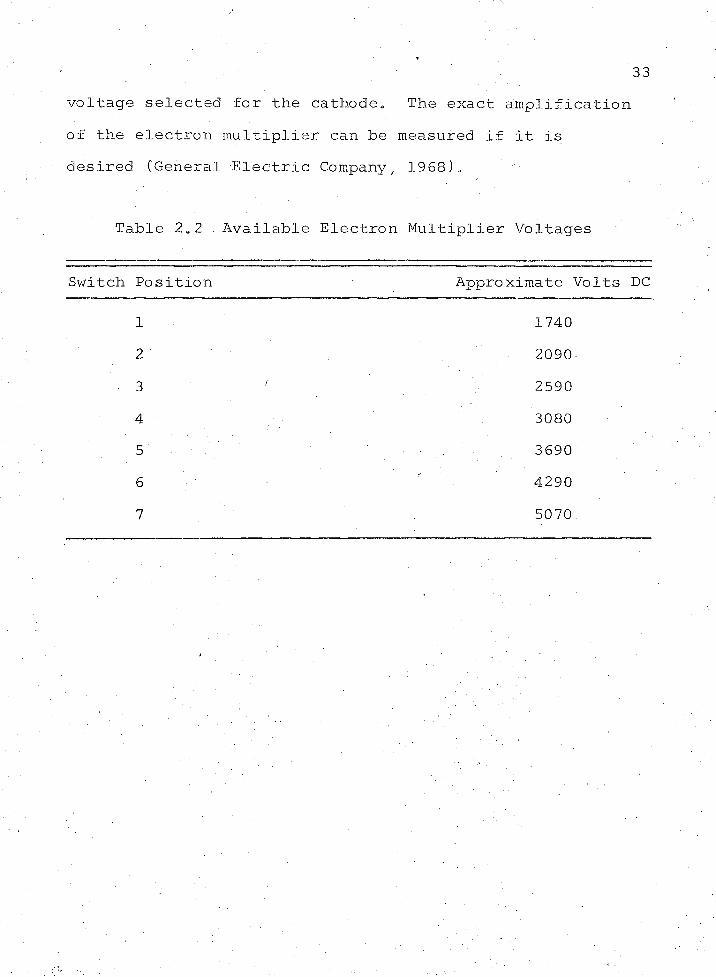
33voltage selected for the cathode. The exact amplification of the electron multiplier can be measured if it is desired (General Electric Company, 1968). "
Table 2.2 Available Electron Multiplier Voltages
Switch Position Approximate Volts DC
123456 7
1740209025903080369042905070

CHAPTER 3
VACUUM SYSTEM THEORY
The General Electric Monopole Mass Spectrometer will operate at pressures up to 10- TORR. To an expert in vacuum techniques, this is an understandable requirement.To someone about to use a mass spectrometer for the first time this may not be the case. A brief review of vacuum technology with regard to how it is applied to the specific system used with the monopole mass spectrometer is theobjective of this chapter.
To begin with, atmospheric pressure has been established as the upper limit of a vacuum, and it is expressed in millimeters of mercury. Atmospheric pressure is considered to be about 760 mm Hg. ' As vacuum technology became more sophisticated, a new measure of vacuum level was introduced. The TORR was defined as 1/760 of a standardatmosphere. There is a slight discrepancy of 1 part in -77 million between mm Hg and the TORR due to the fact that 760 mm Hg is not precisely a standard atmosphere, but the terms TORR and mm Hg are used to mean the same thing.Another term often encountered is the micron. One TORR is
3the equivalent of 10 microns. In addition, there are
• " \ - 34

35certain accepted levels of vacuum. These are.listed in Table 3.1.
Table 3.1. Accepted Degrees of Vacuum
Terminology PressureLow Vacuum 760 TORR to 25 TORRMedium Vacuum 25 TORR to 10~3 TORRHigh Vacuum io"3 TORR to 1 0 ~ 6 TORRVery High Vacuum lO"6 TORR to 10"• 9 'y TORRUltra High Vacuum . 10-9 TORR to ?
There are several excellent books oh vacuum technology (Dushman and Lafferty, 1962; Pirani and Yarwood, 1961), and the field is growing rapidly. The concepts and techniques, of course, change just as rapidly. However, there are two basic concepts that must be understood in connection with the use of a mass spectrometer. The first is the concept of mean free path, and the second is the concept of a partial pressure.
At standard atmospheric pressure and temperature,19 3there are approximately 2.5 x 10 molecules/cm . Each
molecule has a mean free path, £, of 6.6 x 10- ° cm beforeit collides with another neighboring molecule. As thepressure decreases, the number of molecules in a givenvolume decreases, and the mean free path of the molecule

: . . • 36.increases„ The relationship between pressure.and density is
’ 'given by
1 ftn = 9.656 x 10 P/T
while the relationship between pressure and the mean free path is given by
£ = 2.331 x 10~20T/PD2
where P is the pressure in TORR, T is the absolute temperature in ° K , and D is the molecular diameter in cm. Table 3.2 gives an indication of the importance of pressure on the density and mean free path of air at 2 5° C.
Table 3.2. Effect of Air
of Pressure on Density and Mean Free Path
Pressure(TORR)
Density g (Molecule/cm )
Mean Free (cm)
Path
760 2.46 X 10¹⁹ 6. 69 X 10-G
1 3.24 X io16 5.09 X
10~3 3.24 X
00 1—1 o 1—1 5.09 X 10°
H O 1 3.24 X io10 . 5.09 X io310“9 ; 3.24 X io7 5.09 X 10^io"12 3.24 X io4 5.09 X 10^10-15 3.24 X io1 5.09 X 10¹²
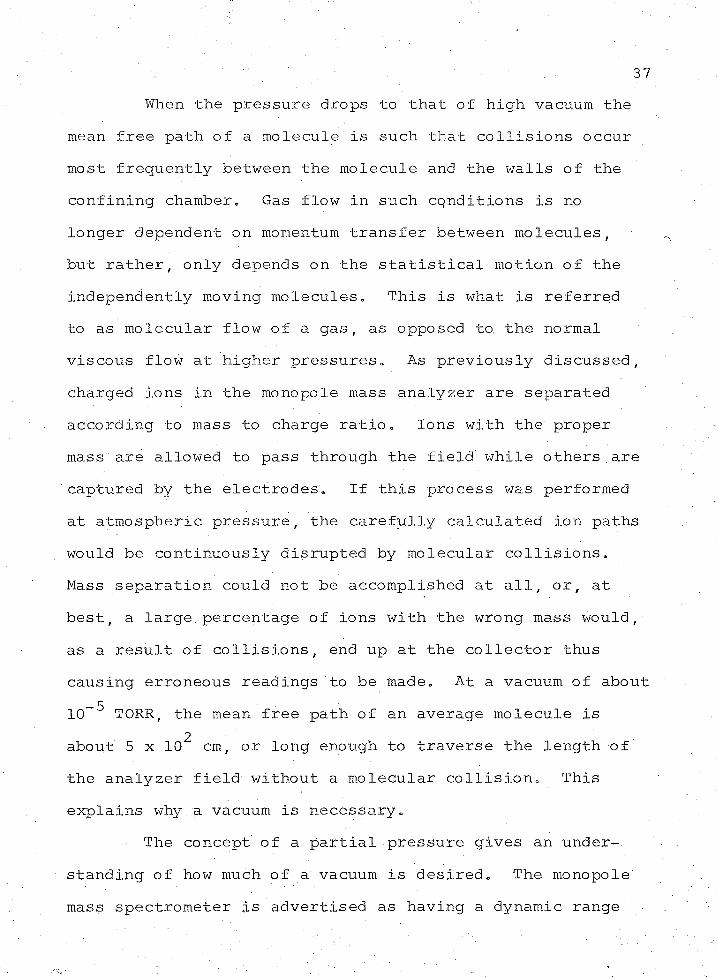
• . ■ 37When the pressure drops to that of high vacuum the
mean free path of a molecule is such that collisions occurmost frequently between the molecule and the walls of theconfining chamber. Gas flow in such conditions is no .longer dependent on momentum transfer between molecules,but rather, only depends on the statistical motion of theindependently moving molecules. This is what is referredto as molecular flow of a gas, as opposed to. the normalviscous flow at higher pressures. As previously discussed,charged ions in the monopole mass analyzer are separatedaccording to mass to charge ratio. Ions with the propermass are allowed to pass through the field while others arecaptured by the electrodes. If this process was performedat atmospheric pressure, the carefully calculated ion pathswould be continuously disrupted by molecular collisions.Mass separation could not be accomplished at all, or, atbest, a large.percentage of ions with the wrong mass would,as a result of collisions, end up at the collector thuscausing erroneous readings to be made. At a vacuum of about10~~* TORR, the mean free path of an average molecule is
2about 5 x 10 cm, or long enough to traverse the length of the analyzer field without a molecular collision. This explains why a vacuum is necessary.
The concept of a partial pressure gives an understanding of how much of a vacuum is desired. The monopole mass spectrometer is advertised as having a dynamic range

6of detectable partial pressures of 10 „ This is- equivalentto detecting as little as one part per million of thecomposition of a sample gas„ This detection capability, isthe most important aspect of the mass spectrometer and mustbe thoroughly understood. Dalton's Law of Partial Pressuresstates that if several gases are present at the same time,the total pressure of the mixture is the sum of the pressuresthat would be exerted by each gas if they were presentseparately,in the same volume. This law is valid in achemically active system when equilibrium is established.The pressure of each gas is called a partial pressure. Thus,the total pressure of a system is the sum of the partialpressures of the gases' present. To obtain an analysis of aparticular gas, the pressure in the analyzer tube vacuum
— 11system is dropped as low as possible, for example, to 10 TORR, At this pressure, a "background" reading is taken with the mass spectrometer. There is, by necessity, enoughgas remaining in the vacuum chamber to exert a total pressure
-11 ‘ ‘ ■ of 10 TORR. Normally this background reading will becomposed of many different gases. In this case, thebackground is composed of gas A, B, and C (Fig. 3.1). Thepressure and current readings are directly equivalent.Peaks on the graph correspond to current readings of3 x 10~"*" Amp,, 6 x 10 ^ Amp. , and 1 x 10~"*" Amp. , or a • /.
~*11total of 10" Amp.. (Fig, 3.1). Under ideal conditions, this will be all the - gas in the chamber. In this example,

I
-1210 x 10
8-
Gas5-
Gas A
3-
Gas C
1-
40 30 10
Fig. 3.1 Sample Background Mass Spectra

40we will suppose that the three gases are of a type thatproduce only a parent peak in a mass spectra and that eachpeak is composed only of the identified gas. Furthermoreit will be assumed that the mass spectrometer is equallysensitive to each of the gases with regard to detectioncapability«, At this point, our unknown sample of gas isallowed to enter the system and we allow the pressure to goup to 10-^ TORR. The current output of the mass spectro-
-5meter will now be 10 Amp., and the mass spectra will havethe appearance of Fig. 3.2. Our background has been"swamped." Assuming our sample is subject to the same gas .properties as gas A f gas B, and gas C , we should not seeany representation of our background until the ammeter is
— 12adjusted to read currents of 10 Amp. If this adjustmentis made, we may then obtain mass spectra such as Fig. 3.3.Notice that gas A and gas B have maintained the same peak height. The sample gas, of course, will cause an off-scale
__ greading, as the meter attempts to read 10 Amp. while in
— 12the 10 range. However, gas C now has a peak height of— 122 x 10 Amp. In our background, it had a peak of— 121 x 10 Amp. Since it would be impossible for it to have
come from anywhere else, this then indicates that thesample had an impurity of one part per million of gas C.
6 z Over a dynamic partial-pressure range of 10 , a change of6one part in 10 of the composition of the total pressure of
the gas can be detected. This is what the General Electric

41
-610 x 10
Sample gas
40
Fig. 3.2 Mass Spectra of Unknown Gas

42
-12•10 x 10
Sample gas
8 -
6 - ■
Gas B
Gas A
Gas C
m/e2040 30 10
Fig. 3.3 Adjusted Mass Spectra

. 43Monopole Mass Spectrometer is supposed to do. However, a
— 1 1.vacuum of 10 " TORR has to be produced in the operatingsystem. The components and theory of operation of this vacuum system will now be discussed.
Monopole Vacuum SystemTo produce the needed vacuum for proper operation of
the monopole mass spectrometer, a three stage vacuum system(Fig.' 3,4) has been assembled, The system consists of threepumping stages, monitored by appropriately mounted gauges.T h e 'first pumping stage is a mechanical pump. The nextstage consists of a sorption pump which lowers the pressureto the point where a getter-ion pump can be utilized, Thisfinal stage of pumping can theoretically produce a vacuum
-9of 10 TORR, Each stage of the pumping process will now be discussed, •
Rough Pumping"Rough pumping" refers to the initial pumping done
on the system resulting in a low vacuum. In the SSEL monopole system, a mechanical rotary pump is utilized to provide this first stage in the pumping process. The pump evacuates the vacuum system from atmospheric pressure to about 400 TORR. The theory of the mechanical vacuum pump has little to do with the results.obtained with the mass spectrometer and is well covered in any reference on vacuum techniques (Dushman and Lafferty, 1962). There are two

44
MONOPOLE MASS -SPECTROMETER
VACUUM CHAMBERSORPTION PUMP
GETTER ION PUMPS (2)
TOPOWERUNIT
VACUUMGAUGE
ROUGHINGPUMP
Fig. 3.4 Monopole Vacuum System
45things, however, that should be understood about rough pumping. First, it is important that the mechanical .pump is utilized any time the vacuum system is allowed to be .exposed to the atmosphere. The reason for this is thatthe pump is completely impartial with regard to different types of gases. It reduces the system pressure by a factor of one half, thus removing one half the partial pressures of any of the noble gases that are present in the chamber. The next two stages of pumping are selective by nature in their pumping speeds of various gases. Without this impartial rough pumping, the insignificant amount of neon and helium found in air can become a huge, problem at lower pressures. It is worthwhile to remove half the problem withthe mechanical pump. There is,, however, a second aspect ofmechanical pumping that has to be controlled carefully. The pump may contaminate the entire system. . As the mechanical pump heats up from operating friction, a gas composed of the oil used to .lubricate the pump is given off. This gas will enter the vacuum system and leave a background trace that is difficult to remove. This problem is alleviated in the SSEL monopole system by the utilization of a graphite lubricated pump. However, contamination by mechanical pumps is a problem to be careful about in vacuum system operation.■

Sorption Pumping .The sorption pump is utilized to lower the vacuum
-2chamber pressure to about 10 microns or 10 TORR. The principle of operation is relatively simple and there.is no hazard of oil contamination. The pumping is accomplished by the sorption of gas molecules by molecular sieve material which is chilled to liquid nitrogen temperature. Prior to use, the sorption pump is closed off from the vacuum chamber and the heating element is turned on for about 12 hours. This heats the molecular sieve to about 250°C and discharges any previously sorbed gases into the atmosphere. The pump is then closed off and liquid nitrogen is added to the dewar. About 15 liters is required for the average pumpdown, the excess being lost to the atmosphere . due to evaporation. After allowing about 1/2 hour for the molecular sieve to chill, the pump is ready for use. The sieve material consists of 1200 grams of Zeolite 5A pellets. After rough pumping the system, the mechanical pump is valved off from the system, and the sorption pump is valyed onto the vacuum system. Due to the lower temperature of the molecular sieve, gases are drawn from the vacuum chamber into the sorption pump. Gases with a freezing point above that of liquid nitrogen are solidified and sorbed by the Zeolite pellets. Gases with a freezing point below that of liquid nitrogen are. reduced in volume (partial pressure) but may not be sorbed (Fig. 3.5).

47
HEATERCOILS
■P- TO VACUUM CHAMBER
"DEWAR"OUTERSECTION
OXOO BAKEOUT SIDEARM
MOLECULARSIEVE
l i q u i dNITROGEN
Fig. 3.5 Sorption Pump (Cross Section)

48Neon and helium are two examples of gases which are
sorbed to a lesser degree than.nitrogen or other atmosphericgases„ In. the atmosphere, the partial pressures of
— 2 —3nitrogen, neon, and helium are 593, 1.4 x 10 , and 4 x 10TORR, respectively (Santeler et a l , 1966). The sorption
— 2pump reduces the system pressure to about 10 TORR. Thus,if there is no rough pumping, and ' we assume that neon is not:sorbed, the system pressure can be lowered to only
— 21.4 x 10 TORR, at which .point the composition of the gasremaining in the chamber will be to a large extent neon anda large percentage of helium. The getter-ion pump wouldthen be forced to pump out a great deal of noble gases, atask at which it is least efficient. If rough pumping wereable to lower the system pressure to a level of .76 TORR,the concentration of the rare gases would already be
-3reduced by a factor of 10This is not the case in the SSEL Monopole System,
but pumpdown to about 400 TORR does help. Other atmospheric gases, such as oxygen, argon, and carbon dioxide are easily, sorbed. When the system pressure reaches about 10. microns, as indicated on the thermocouple vacuum gauge, the getter-ion pump is turned on and the sorption pump valved off.

49■ Getter-Ion Pumping
The getter-ion pump is capable of lowering thevacuum system pressure to below 10~^ TORR„ It makes use ofthe principles of ionization and gettering to remove gasesfrom the system, A schematic drawing of one of the ionpumps used in the SSEL Monopole Vacuum System is shown inFig, 3,6,, An ion pump power unit supplies 5000 volts to ananode. Electrons are emitted between the anode and the wallof the vacuum chamber, which serves as a cathode at groundpotential. For suitable emission, the pressure in thechamber must be at 10 microns or less. For optimum results,
*-“ 5a pressure below 10 TORR is required. The permanent magnets force the emitted electrons to travel in a helical path, thusly increasing the efficiency of the ion. pump. Any neutral molecule of gas in the path of the electrons will collide and be transformed into charged ions. The positive ions will then be driven into the wall of the chamber which serves as a cathode or collector. At the same time, a titanium filament is evaporated, into the system. This results in a constant supply of chemically active titanium in the chamber. The titanium reacts with active gases in the chamber and coats the walls. This process is said to "bury" active gases within the titanium coating and performs a pumping action. Eventually, the chamber walls, especially that region acting as a pump cathode, become saturated, and begin to emit as much gas as they absorb. This pressure is

50
VACUUMCHAMBERWALL
MAGNET
CATHODE (collector)
ANODE+
TITANIUMFILAMENTS
TO +5000 V
*— ANODE (side view)
Fig. 3.6 Getter-Ion Pump

51the ultimate vacuum level„ Getter-ion pumps exhibit preferential pumping to a large extent, as is shown in Table- 3.3 (Roberts and ' Vandersli.ee , 1963).
Table 3.3 Getter-Ion Pumping Speeds
Gas Speed Cliter/sec)Hydrogen 3300Nitrogen 2000Oxygen 1000Carbon Monoxide 1000Air 370 ■Methane 20Argon 5
There are two other major problems encountered with getter-ion type pumps. "Argon instability" occurs when previously buried amounts of argon are released from the walls. Also, the "memory effect" of such pumps is shown when other types of previously buried gases are released. Both effects can give misleading results in gas analysis.

CHAPTER 4
EQUIPMENT AND MATERIALS USED
The principal piece of equipment utilized in this project was the General Electric. Mo no pole Mass Spectrometer. It was mounted on an Ultek Vacuum System capable of attaining a vacuum of 10 TORR. Various ancillary pieces of equipment were mounted in an adjoining cabinet to provide more flexibility in recording data and overall convenience.Gas samples were leaked into the vacuum system afterpassing through a diffusion furnace in the. So.lid State Engineering Laboratory. The entire system is pictured in • Fig. 4.1.
Monopole Mass Spectrometer The General Electric Monopole 300 Mass Spectrometer
consists of two major components, the analyzer tube, (Fig.4.2) and the electronic control (Fig. 4.3). The analyzer tube is mounted vertically directly onto a specially fabricated stainless steel plate. - The use of the steel plate as a cover to the vacuum chamber roughly halved thegas volume to be pumped and eliminated the permeation ofatmospheric helium into the system, a hazard inherent in . the use of the normal bell-jar glass cover. The theory o f ; operation of the analyzer tube has been thoroughly discussed
52

53
Fig. 4.1 Monopole System

54
Fig. 4.2 Monopole Analyzer Tube

Fig. 4.3 Monopole Electronic Control

in Chapter 2. The ion source end of the tube extends into the Ultek Vacuum Chamber. The pressure in the analyzer tube is then maintained at the same pressure as the vacuum system. The analyzer tube is connected to the electronic control by several cables. The electronic control (Fig.4.3) provides the necessary power, metering, and outputs for the proper operation of the analyzer tube. The upper chassis contains the ion source power supply and mass scan generator. The ion source controls and types of mass scans have been previously discussed. The mass meter on the right side of the front panel gives a direct mass reading on a scale from zero to 300. The lower chassis contains the RF and DC power supplies.
The monopole mass spectrometer specifications are:(1) a sensitivity of 50 Amp./TORR for nitrogen (Eg), (2)a dynamic range of detectable partial pressures of
6approximately 10 , and (3) unit resolution throughout its mass range of 1 to 300 amu. .
Ultek Vacuum System and Ancillary .Vacuum Equipment
The Ultek Vacuum System is composed of a stainless steel vacuum chamber with two internally mounted high vacuum ion pumps and an ion pump combination power unit.The ancillary equipment consists of a roughing pump, sorption pump, vacuum gauge, heating tapes, leak valve, and gas sampling system.

57
Power to the rough vacuum pump is controlled by a circuit breaker mounted on the rear of the monopole system cabinet. This pump provides a rough vacuum to the vacuum system.
A General Electric Sorption Pump Model 22HP111 is connected to the vacuum chamber through a side port. It is capable of reducing the chamber pressure from about 400 TORR to 10 microns.
A Hastings Vacuum Gauge Model VC-3C is used to monitor the vacuum system pressure during pumpdown using a DV-3M vacuum gauge tube mounted between the sorption pump and the vacuum chamber. A meter mounted on the front of the monopole system equipment cabinet gives a direct reading of • pressure from atmosphere to 1 micron.
The Ultek Vacuum System is capable of attaining a- 9 ivacuum pressure of 10 TORR. It utilizes the getter-ion
pumping principle. - A meter on the ion pump power unit givesa direct reading of ionization voltage and current at theion pumps. A chart is provided to convert meter currentreadings directly into the equivalent pressure in the vacuumsystem. For convenience, a log-pressure scale is providedon the meter for direct pressure readings. It may beaccurately calibrated for readings of up to one decade toeither side of the calibration pressure. Recorder output-terminals are provided for continuous monitoring of thelog-pressure meter. The combination power unit provides

58power to both the ion pumps and titanium filaments. Up to50 Amp, is provided to the titanium filaments located in thecenter of.the vacuum chamber. There is a switch allowingthe selection of any one of four available filaments. Atimer switch, allows for 0 to 100% filament operation duringa two-minute cycle. Overall, the system pumping speed israted at 500 liters/second if a power setting of 36 to 38Ampt. is utilized under the conditions specified in Table4.1. A, minimum setting of 15% is required for effectivesublimation of titanium because of the time required forheating the filament. Experimentation in specificapplications is recommended to determine intervals at whichthe titanium should be sublimated at pressures below
_95 x 10 TORR.
Table 4.1 , Ultex Timer Settings
Pressure Range Timer Setting (% on)
1 X 10“ 6 TORR and above : 1005 X IQ'? TORR to 1 x 10 6 TORR 801 X IQ-? TORR to 5 x 10™ 7 TORR 505 X
CO1oI— 1 TORR to 1 x 1Q- 7 TORR : : 255 X H O I 00 TORR and below 15

. 59Two Variac potentiometers provide a variable voltage
source for' three heating tapes. • The heating tapes are utilized to "bake out" the mass spectrometer analyzer tube and the vacuum chamber.
A micrometer-type leak valve was utilized to controlthe admission of gas samples into the vacuum chamber. It
. . -xis mounted on the vacuum chamber and connected to the exhaust port of a diffusion furnace in the Solid State Engineering Laboratory (Fig. 4.4).
The internal gas supply system of the Solid State Engineering Laboratory was utilized to supply gas samples to the vacuum system. The exact mixture of a particular gas sample could easily be determined and controlled by means of Brooks Sho-Rate Rotameters (Fig. 4.5). The entire monopole system was designed to be completely portable and can be moved to sample the exhaust of any furnace in the
ilaboratory, allowing any gas available in the laboratory to be sampled.
Ancillary Readout Equipment -The monopole mass spectrometer is capable of reading
— 13pressure of 1 x 10 TORR or lower. The limit is directly dependent on the readout equipment utilized. The equipment utilized in this project provided complete flexibility and compatibility within the range of the mass spectrometer.

Fig. 4.4 Leak Valve
l*
(TiO

Fig. 4.5 Rotameters

' 62 For direct readout, a Hewlett-Packard Model 130-C
oscilloscope was utilized„ This was particularly useful for- . iobserving the vacuum system reaction when back-filling with
- 1 - ' - • sample gases. Photographs could be taken of the changingmass spectra of the sample as it filled the vacuum chamber.A scan speed of 5 seconds was found to be most compatiblewith the response of the equipment.
For more precise data, a Hewlett-Packard Model 7000AX-Y recorder was utilized. The horizontal output of themass spectrometer was directly compatible with the recorderinput. Vertical readings were amplified by means of aKeithley Model 410.C micro-microammeter. This provided the
— 13"capability of reading a current of 10 Amp. The output of the ammeter was directly compatible with the recorder.A.Keithley Model 610B multi-range electrometer was used as a backup to the rack-mounted micro-microammeter. An isolation transformer was used to provide a stabilized operating voltage to the ammeter in use. For additional flexibility, a log voltmeter-converter Model HLVC-150, manufactured by The Houston Omnigraphic Corporation, was available. This instrument made it possible to study the base of parent peaks without driving the recorder beyond its limit on the Y axis.

)
I ■
CHAPTER 5 . ’ ■
EXPERIMENTATION AMD RESULTS
This chapter presents a summary of the results obtained utilizing the monopole mass spectrometer. As time progressed, it became apparent that the capabilities of the monopole were directly related to the ability to. provide suitable vacuum, conditions for operation. This led-to the inclusion of sections in this chapter dealing with the problems encountered with the Ultek getter-ion vacuum system utilized for this project. The mo no po1e mass spectrometer is discussed with respect to its use in analyzingthe gases, argon, nitrogen, and diborane. In each case the
' 'results obtained with the monopole mass spectrometer are compared to results obtained on other types of mass spectrometers.
Ultimate Vacuum and Background NoiseIt has been pointed out that for optimum results, a
vacuum of lO-"*"" TORR should be obtained. The Ultek getter- .ion vacuum system is specified as being capable of reaching
ga vacuum of 10 TORR or better. In fact, during the six months of use in this project the best vacuum it achieved- was 3 x 10" TORR. . This may seem to be a poor result, but
63

' ' • \ 64actually is about the best that can be expected from the equipment as it was utilized.
There are three major obstacles to obtaining a lower ultimate vacuum with the system. The first is the lack of asuitable capability for baking out the vacuum chamber. To
-7 oachieve vacuum lower than 10 TORR, baking at 300 to 450 Cis practically mandatory (Roboz, 1968). Theoretically, atwofold reduction in the absolute temperature will reducethe system pressure by seven orders of magnitude (Santeleret a l , 1966). For example, if a system were heated to600°K while the pressure was pumped to 10" TORR, as thesystem is allowed to cool to 300°K the pressure will drop to
— 14about 10 TORR. On the other hand, if the system was-7 o 'pumped to 10 TORR at room temperature (300 K ) and then .
cooled to 150°K the pressure should drop to about 10~"^ TORR.It is important that the entire system be subjected to theprocess. If, for instance, only 99% is actually subjectedto bakeout, the 1% that is not outgassed causes a phenomenaldrop in the efficiency of the bakeout. Instead of a drop ofseven orders of magnitude, the result is about two orders ofmagnitude. During this project, it was attempted to bakeout the vacuum chamber by means of three heating tapes. Onewas wrapped around the analyzer tube while two were placedaround the vacuum chamber (Fig. 4.1). Obviously, more thanone per cent of the system was not subjected to a pronouncedrise in temperature. Additionally, the heating tapes were

unable to raise the temperature by any appreciable amount.The only apparent advantage to using the tapes at all was to prevent water vapor from condensing on the interior walls of the analyzer tube and vacuum chamber when they were exposed to the atmosphere.
The second major obstacle is the rubber gasket usedbetween the vacuum chamber and plate used to hold theanalyzer tube (Fig, 4.2), One of the most important improvements that can be simply accomplished in a vacuum system is the replacement of all organic seals with metal seals„ Generally this will result in an improvement of an order of magnitude in lowering the system pressure (Santeler et al., 1966)„ The rubber gasket is a Source of contamination to the vacuum chamber and prevents bakeout at high1 temperatures.
The final obstacle is the multitude of high vacuum valves that open directly into the vacuum chamber. The presence of such valves, composed of cast surfaces, multiple 0-rings, and lubricated valve parts, presents a gas load greater than that of the vacuum chamber. These valves (Fig. 4.4) may result in an increase of an order of magnitude in system pressure.
One additional aspect becomes increasingly important. As vacuum conditions become less than ideal, the background noise of the system becomes a limiting factor in detection. When lower ranges are used on a pico-ammeter, the instrument

• . . 66
becomes more sensitive to background noises„ In themonopole mass spectrometer, this background noise isproportional to the pressure in. the system down to about
— 1110 TORR. At about this level, the system would have tobe cryogenically cooled to eliminate the inherent thermal
— 7noise. At a pressure of 5 x 10 TORR the background noise_ 1 0 _ trreading is 2 x 10 Amp. At a pressure of 10 TORR the
-8background noise reading may be as high as 0.2 x 10 Amp, ;, __ Qalthough it generally is approximately 0.1 x 10 Amp.
Figure 5.1 attempts to graphically portray this problem.-8 ' Assuming a background noise of 0.1 x 10 Amp. or an absolute
— 9 — 5noise detection limit of 10 at a pressure of 10 TORR,the detection capability of the monopole mass spectrometeris effectively limited to a dynamic range of 10" or one partin 10,000. Thus it becomes apparent that the vacuum systemplays an extremely important role in the performance of themonopole mass spectrometer.
Standard Analytical Procedures To insure as great a degree of consistency and
reliability as possible, a standard method of analysis had to be utilized. Therefore, the following settings are utilized as far as possible to obtain data with the monopole mass spectrometer (Table 5.1):

67
NOISE LEVEL (Amp.)10
10
- 8,10
-910
-1010
-5 — 6 -7-4 1010 1010
PRESSURE (TORR)
Fig. 5.1 Vacuum System Background Noise

68Table 5.1 Monopole Operational Settings
Control SettingUltek Filament Power OffUltek Pressure Reading 6.0 ma (10 TORR)Monopole Emission Current 3 maMonopole Ionization Voltage 70 volts (or as noted)Monopole Multiplier Voltage
(Mult HV) 4Ion Energy Max Peak OutputDrawout Max Peak OutputFocus Max Peak OutputTemperature Ambient Lab Temperature
In the following sections results are compared as far as possible with the mass spectral data compiled in "Catalog of Selected Mass Spectral Data" (19 70) (Project 44). This is a continuing effort supported by the petroleum industry to assemble in one volume all the information available with regard to typical mass spectrometer cracking patterns. Even these results, used as a standard for the industry, differ from one contributing laboratory to another. For example, there are three distinct cracking patterns given for argon. They were submitted by three different laboratories, although the same model mass spectrometer was utilized in each case. This came about because differing standard conditions were employed and because results may well differ from instrument to instrument.

: ■ ■■■ ■■-. \ 69Analysis of Argon ■-
Argon is frequently used as a calibrating gas with a mass spectrometer. For this analysis, a sample cracking pattern and an ionization efficiency curve have been compiled. Standard conditions have been observed as per Table 5.1. To compile the cracking pattern, data were taken on two separate days at least one month apart. Five runs were made at five different current ranges on the electrometer and the three most consistent values averaged to obtain the information in Table 5.2. Appendix D presents a full description of the methods used to compile these data.
Table 5.2 Monopole Cracking Pattern— Argon
m/e Data 1 Data 2 Average20 4.95 4.72 . 00
36 .28 .32 .3038 .06 .06 .0640 100 100 100
\
When the above data are compared to that of Project 44 in Table 5.3, the results seem to be consistent with the exception of the doubly charged ion at m/e 20. Cracking patterns available from the Project 44 data are filed in

70Table 5* 3 Comparison of Argon Cracking Patterns
m/e • Serial-1581 Serial 1586 Serial 1594 Mo no po le20 o00 1—1 12.9 15. 75 CO
36 .32 .32 . 38 . 3038 .06 .05 . 11 .0640 100 100 100 100
order by serial number„ For convenience the particular serial number is used for identification. .
Data for the ionization efficiency curve were taken at the same time. The procedure was the same except that the ionization voltage was varied from 25 to 115 volts in 10 volt increments to obtain the results in Fig. 5.2. Since the data were available, ionization efficiency curves of the detectable ions of argon are also presented in Figs. 5.3 to 5.5. While more than simple ionization is involved in the case of such ions as the doubly charged one at m/e 20, common usage in the field of mass spectrometry has led to the term "ionization efficiency curve" being accepted for all such curves, rather than some such term as appearance potential efficiency curve, which would be a more accurate .terminology (Kiser, 1965). Separate plots were made for each ion to avoid crowding any one graph. As can be seen in Fig. 5.2, the most efficient voltage for the ionization of argon is 43 volts. The appearance potential of the doubly

71
ELECTRON MULTIPLIER OUTPUT (Amp.)
-310
-410
-510
-610
25 35 45 55 65 75 85 95 105 115IONIZATION VOLTAGE
Fig. 5.2 Ionization Efficiency Curve of Argon— m/e 40

72
ELECTRON MULTIPLIER OUTPUT (Amp.)
- 610
-710
-810
-910
25 45 55 65 7535 85 95 105 115IONIZATION VOLTAGE
Fig. 5.3 Ionization Efficiency Curve of Argon— m/e 38

73
ELECTRON MULTIPLIER OUTPUT (Amp.)
- 610
-710
-810
-910
25 35 45 55 65 75 85 95 105 115IONIZATION VOLTAGE
Fig. 5.4 Ionization Efficiency Curve of Argon— m/e 36

74
ELECTRON MULTIPLIER OUTPUT (Amp.)
-5.10
— 610
-710
-810
75 85 95 105 11525 55 6535 4528
IONIZATION VOLTAGE
Fig. 5.5 Ionization Efficiency Curve of Argon— m/e 20

7 . ■■ : ■' - .. ' , : ■ . ■■ ■ .: ; 7 5 .charged ion at m/e 20 is approximately 28 volts (Fig, 5.5). 'Both these figures agree with previously published dataobtained on other types of mass spectrometers (Roboz, 1968;Barnard, 1953). In all cases, the vertical scale representsactual current output of the monopole electron multiplier,while the horizontal scale represents the ionization voltage.
Analysis of Nitrogen Nitrogen.is another gas often used for calibration
purposes. The data for nitrogen were taken in the same manner as that for argon. The cracking pattern obtained ispresented in Table 5.4. Unfortunately there is only onecracking pattern of nitrogen available in the Project 44. data. Again, as with argon, the comparison is consistent with the exception of the doubly charged ion at m/e 14 (Table 5.5).
Table 5.4 Monopole Cracking Pattern— Nitrogen
m/e Data 1 Data 2 Average14 3.57 3.60 3. 5828 100 100 10029 .79 o00 oCO

' : ; .. .. , ' . ■ • ; 76Table 5„5 Comparison of Nitrogen Cracking Patterns
m/e Serial 1595 Mo no pole14 5.18 - 3.5828 100 10029 .73 .80
The ionization efficiency curves for nitrogen and its appropriate ions are presented in Figs. 5.6 to 5.8. The most efficient voltage for ionization of nitrogen is 51volts while the doubly charged ion at m/e 14 has an(appearance potential of approximately 30 voIts. Both values are in agreement with previously published figures (Kiser,1965). '
SensitivityThe sensitivity of the mass spectrometer is defined
as follows (Roboz, 1968):
Peak Height (divisions) of Base Peak Sensitivity = ------Sample Pressure in Chamber------
The sensitivity should not change as long as experimental conditions remain the same. A calibration run should be made periodically with either argon or nitrogen to insure the proper sensitivity is being utilized. To determine the sensitivity, the system is pumped to as low a pressure as possible and the calibrant gas is admitted until the chamber

77
ELECTRON MULTIPLIER OUTPUT (Amp.)
-410
-510
— 610
-710
25 35 45 55 65 75 85 95 105 115IONIZATION VOLTAGE
Fig. 5.6 Ionization Efficiency Curve of Nitrogen— m/e 28

78
ELECTRON MULTIPLIER OUTPUT (Amp.)
-610
-710
-810
-910
25 45 55 65 7535 85IONIZATION VOLTAGE
Fig. 5.7 Ionization Efficiency Curve of Nitrogen— m/e 29

79
ELECTRON MULTIPLIER OUTPUT (Amp.)
-510
10
-710
-810
25 45 55 65 7535 85 95 105 11530
IONIZATION VOLTAGE
Fig. 5.8 Ionization Efficiency Curve of Nitrogen— m/e 14

■ • . ' 80_ 5 • •pressure stabilizes at 10 TORR. The mass spectra obtained
under these conditions should be that of the typical cracking pattern of the gas„ The first .time argon was calibrated under standard conditions (Table 5.1), the sensitivity was 7.4 Amp. per TORR. After the system was exposed to the atmosphere, a second calibrating run yielded a sensitivity of 1.6 Amp. per TORR. This reduction in sensitivity is attributed to contamination of the ion source filaments and electron multiplier dynodes by atmospheric gases. General Electric recommends a bakeout of the complete analyzer tubewhen it is exposed to the. atmosphere. It is fortunate thatchanges in sensitivity are acceptable conditions because such changes are proportional with respect to all gases in the same manner. 'If the relative sensitivity to all gases can be obtained at one time under Similar experimental conditions, the relative values will remain the same. Thus, a quick calibration run with nitrogen can then confirm whatvalues should be used for any gas. Wifh the technique dis- I • •cussed in the next section, the relative sensitivities ofargon and nitrogen as defined by SR = SQas/ s^ were found to.2be Eg = 1.0, and A ^ = .72. After the relative sensitivities of each specific gas have been determined by individual calibrating runs, trace analysis can be accomplished on any mixture of gases using the following formulas (Roboz, 1968):
Partia! Pressure . i f g j f f i f M

. 81
Mole % of Component = iQO^ Total Pressure
This procedure assumes ideal conditions as discussed in Chapters 2 and 3 „
Preferential Pumping and Memory Effect The two greatest problems encountered during this
project were attributed to preferential pumping and the memory effect of the getter-ion vacuum pumps„ The problem is not clearly understood but was very apparent in results obtained using the monopole mass spectrometer* As was previously discussed, any active gas entering the vacuum chamber reacts with titanium and is "gettered„" Unfortunately, noble gases such as argon do not react with the titanium. They are ionized by the ion pumps and forced against the wall of the vacuum chamber which is held at ground potential. As sublimated titanium is deposited throughout the chamber, these ionized gases are buried under a layer of titanium. This ionization process takes place at a much slower rate than the more prevalent gettering reac- ' tion. Thus, noble gases are pumped at a slower rate. If the vacuum chamber is relatively inactive for a period of time, argon molecules may be attracted to1 the chamber walls and held there by weak Van der Waals forces. Any sudden surge of activity in the chamber, such as the rise in pressure as a sample gas is admitted, may then cause the argon molecules to be dislodged in the chamber creating a

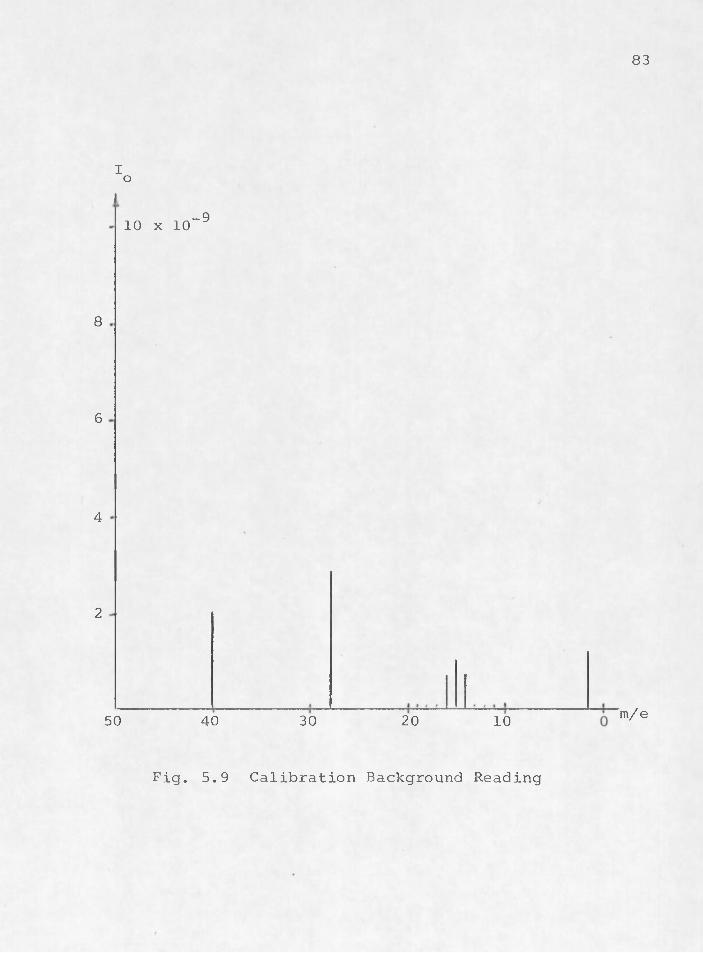
v, ■ . ; . 82memory effect* Even reactive gases may be dislodged by a 1more active sample gas .that has .a greater affinity fortitanium. This situation makes it nearly impossible toobtain accurate results in gas trace analysis. Evencalibration runs pose a problem. The mass spectra inFigs. 5.9 through 5.13 serve to demonstrate typical results.Figure 5.9 is a background reading taken for a calibrationrun with only the major partial pressures shown. The system
•—6pressure was 10 TORR. Nitrogen was admitted to the vacuum chamber through the leak valve and the system pressure was allowed to increase to 10~^ TORR. Figure 5.10 shows the resulting mass spectra taken at that time. The peaks at m/e 2, 14, 15, 16, 28, and 40 have gone off scale. Since only nitrogen was admitted, the peaks at 28 and 14 should have been the only ones to change. The memory effect inherent in a getter-ion type of vacuum system is responsible for the additional peaks. The hydrogen at peak 2 is . an example of how even the most reactive gases can foe dislodged. A trace of helium at peak 4 is an example of atmospheric gas that has not been completely buried. At peaks 15 and.16 traces of methane, formed from carbon impurities from the pump walls and ionized hydrogen are prominent. The production of methane, ethane, and various other higher hydrocarbons is just one more small difficulty encountered with the getter-ion type pump (Santeler et al.,1966). The peaks at 40 and 20 represent argon.
83
Io
-910 x 10
8
6
4
2
m/e2050 40 30 10
Fig. 5.9 Calibration Background Reading

84
Io-9.10 x 10
8
6
4
2
m/e203040 10
Fig. 5.10 Initial Run for Nitrogen Calibration WithPico-Ammeter at 10-8 Scale

85The magnitude of the argon contribution is more
readily apparent in Fig. 5.11. The argon has a peak of 6.3 x 10 ^ Amp. while nitrogen, which should be at least.an
order of magnitude greater than argon, has a peak height of
5.6 x 10“6 Amp. With a sensitivity, for nitrogen of 1.4 Amp. per TORR, we find that
■ _ 6Partial Pressure Amp./T0RR~ = 3» 3 x 10 TORR
V .■and
-6Partial Pressure AR = 2 ) (1. 4 ) Amp .'/TORR
= 6.3 x 10“6 TORR
Thus there is more argon apparently in the vacuum chamber than there is nitrogen. This problem has been reported by others (Bunyard, 1970). The key to recognizing the problem is the lack of the proper indication of the doubly charged ion of argon at mass 20. A s •can be seen in Fig. 5.11, the relative proportions of nitrogen are correct at peak 28 and 14. However, it is more difficult to dislodge a doubly charged ion. Thus there is no response at m/e 20 in Fig. 5.11. The system gradually corrects itself. After 10 minutes, nitrogen becomes the prominent peak (Fig. 5.12) and in 24 hours the argon peak decreases to less than one per cent of the height of the nitrogen peak. A t .this point

86
- 6
8
6
4
2
0 m/e203040 10
Fig. 5.11 Initial Run for Nitrogen Calibration WithPico-Ammeter at 10-5 Scale
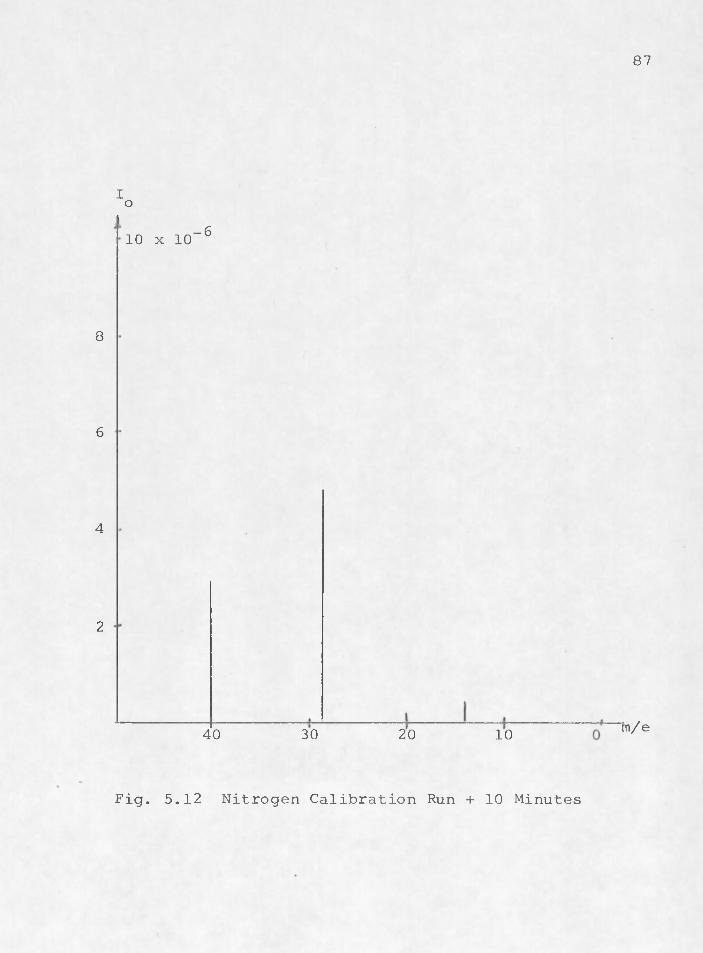
87
Io-610 x 10
8
6
4
2
m/e203040 10
Fig. 5.12 Nitrogen Calibration Run + 10 Minutes

■ 88 calibration of nitrogen may be performed and is seen to be
.1.4 Amp. per TORR (Fig. '5.13)V .The problem of the memory effect is equaled in
magnitude only by the problem of preferential pumping. This phenomenon is demonstrated at this point by simply adjusting .. the rotameters (Fig. 4.5) to allow equal amounts of nitrogen and argon to enter the vacuum chamber. One would expect the nitrogen peak to decrease slowly and gradually become only slightly, larger than the argon peak due to the differences in sensitivity. This is not the case as is shown in Fig.5.14. Within 10 minutes the argon concentration has risen from about 10- (background trace) to a peak of 1.4* x 10-
Amp. It then gradually drops to a . final height of 1.0 x ._ _ 510 Amp. In the meantime the nitrogen peak h as‘become
nearly two orders of magnitude smaller and stabilizes at -7about 10 Amp. after several hours. Thus the preferential
pumping of the getter-ion pump may create an incorrect assumption with regard to the composition of a sample gas. Another problem can be detected in Fig. 5.14. The phenomenon of interference consists of a change in the cracking pattern and/or sensitivity of a gas in the presence of another gas (Roboz, 1968). The argon peak reaches a maximum of 1.4 x 10” Amp. which would give it a sensitivity equal to that of nitrogen. It takes about 30 minutes for it to
_ _ 5drop to about 1 x 10 Amp. and stabilize. Appendix C. . . i „ .presents actual recordings obtained during this project

89
Io
-510 x 10
8
6
4
2
2030 1040
Fig. 5.13 Nitrogen Calibration Run + 24 Hours

90
Io
-410
-510
Ar
-610
-710
200 10 30 40 50MINUTES
Fig. 5.14 Preferential Pumping

91which demonstrate the memory effect and preferential pumping, .
Analysis of DiboraneThe analysis of diborane with a mass spectrometer
has been undertaken by -several individuals (Margrave, 1957; -Shapiro et al., 1961), At least one analysis was completedas far back as 1949 (Project 44), . The diborane availablefor analysis in the Solid State Lab is a mixture of 1035. ppmdiborane in argon, or roughly 1 part per thousand of argon.Initially, the monopole system could not detect diborane.At first this was difficult to understand, since there wasno problem detecting the iso.topic peak, of argon at m/e 3,8..It was certain that peak 38 was ,06% of argon or six partsper ten thousand of peak 40. However, diborane is probablyat least as reactive as nitrogen. Therefore, when admittedinto the vacuum chamber, it will be pumped so as to appearabout two orders of magnitude less than argon, if it isadmitted in equal amounts„ In this case, it was already 1
3part per 10 . When this concentration is reduced by two more orders of magnitude, it becomes an apparent 1 part in 10~’. There is one additional problem. As shown in Table5.6 the cracking pattern of diborane is quite complex as compared to nitrogen or argon.
The base peak is at m/e 2 6 although diborane's atomic mass is 28. There are at least three prominent

92Table 5.6 Project 44 Cracking Pattern--Diborane.
m/e Peak Intensity10 6.3111 28.411.5 .46.12 ' • 18.113 24.414 . 7215 . . .1020 .1621 1.9421.2 .0622 . 11.2 •22.2 .1523 45.724 89.625 56.726 10027 97.428 .25
peaks (24, 2.6, 27) and ■ several other fairly large ones.Since the peaks are, so to speak, spread o ut, the relative sensitivity is likely to be nearly an order of magnitude lower than that of a more simple, single-peaked type of gas. To attempt to increase the sensitivity of the monopole mass spectrometer, a change was made in the gas sampling system. As seen in Fig. 5.15, a stainless steel tube.was inserted to direct the sample gas directly into the ion source of the .monopole analyzer. This served to increase the sensitivity of the monopole by a factor of 4. As a result, it could be shown that diborane was present in the chamber, but a satisfactory cracking pattern or ionization efficiency curve

ANALYZERTUBE
LEAKVALVE
TO SSEL DIFFUSION FURNACE
i -..
X IONSOURCE
_ J I/
STAINLESS STEEL TUBE
VACUUMCHAMBER
Fig. 5.15 Gas Sampling System

94could not be obtained. Due to background contamination and■ • - ■ \ background noise only three peaks could be examined that
would be expected to exhibit the characteristics of diborane.The peaks at m/e 11, 23, and 24 were free from backgroundcontamination. Standard conditions were utilized as perTable 5.1 except that an ionization voltage of 50 volts was
-9used. The picoammeter was used in the 10 range with the— 5system pressure held slightly lower than 10™ TORR. The
noise level was about 5 x 1 0 ™ ^ Amp. After allowing diborane to leak into the vacuum chamber for 24 hours the readings in Fig. 5.16 were taken. The diborane was then turned off and pure argon was allowed to leak into the chamber. Figure 5.17 shows the change in the mass spectra. Background noise is not shown and the vertical scales changed to more graphically portray the results. Peak 11 decreased by 2 units, peak 23 decreased by 4 units, and peak 24 decreased by 7 units. This is exactly what should happen.The intensities of the peaks decreased in the proper proportion as compared to the Project 44 data. Limitations of the vacuum system prevent any more detailed analysis. Other studies of diborane have been normally done on pre- concentrated samples. For example. Margrave in his work used pure diborane, admitting enough argon so that the argon peak and the particular diborane peak he was concerned with . were the same height. The argon was then used as a known reference to determine appearance potentials of the various ,

95
Io-1110 x 10
8
6
4
2
0 m/e2030 1040
Fig. 5.16 Diborane Leaking into System

96
o-11
8
6
4
2
2040 30 10
Fig. 5.17 Pure Argon Flow

diborane ions. This is not possible with the preseht gas sampling system.

CHAPTER. 6
CONCLUSIONS 'AND RECOMMENDATIONS
The .primary purpose of this thesis was to characterize the operation of the monopole mass spectrometer utilizing sample gases available in the Solid State Engineering Laborato.ry at The University of Arizona. This has been accomplished.
Chapters 2 and 3 provide,a sufficient introduction to the theory necessary for proper utilization of the monopole mass spectrometer and its ancillary vacuum system. Chapter 5 can be used as a reference for expected results during calibration runs, and sample ionization efficiency curves.
It is apparent that additional calibration runs would be necessary if gases other than argon and nitrogen are to be examined. Previously published mass spectral data can be used as a guide to expected results with the exception of any doubly charged ions. The results obtained with the instrument are not in agreement with other types of mass spectrometers for this one type of ion. The inability to properly analyze diborane is apparently completely a fault of the vacuum system.
98

; - ■ ■ : • . ; . . 99There are two or three approaches that could be
taken to improve the system. The first, and probably the best, would be to use the mo no pole in a -specially constructed vacuum chamber with a mercury diffusion type vacuum pump. This would eliminate, to a great extent, the problems of the memory effect and preferential pumping. Getter-ion pumps are not recommended for residual gas analysis (Roboz, 1968). '
The second possibility is to improve the present system by the addition of a bakeout capability. This would also include using a copper 0-ring to replace the presently utilized rubber gasket. The bakeout capability should be added in any case, . ' -
There is a possible third way to be considered. A diffusion pump could be connected to the present vacuum chamber through one of the side ports, after a thorough cleaning and bakeout. This would then allow use of the Ultek ion pump as a vacuum gauge in the system. The titanium filaments would not be utilized at all, thereby eliminating both the memory effect and preferential pumping. This method might prove to be practical, and could be easily accomplished.
A mercury diffusion pump would be preferable in this system so as to eliminate, to a large extent, hydrocarbon, contamination at the lower mass points. Since the proper analysis of diborane is desired, every effort should be made

100
to avoid contamination between peaks at m/e 10 to m/e 30. Mercury begins to appear on a mass spectra at m/e 99 (Hg++)„
If preferential pumping is eliminated, the isotopes of argon at m/e 36 and m/e 38 can possibly be used for calibration purposes with diborane. Both ions should be present in relatively the same amounts as the diborane. If a method could be found for obtaining ionization voltages between 10 and 20 volts with the monopole, the ionization potentials of every ion of diborane might possibly be determined by comparison with that of the isotopes of argon.

APPENDIX A
VACUUM SYSTEM OPERATION
■ The following steps should be taken to obtain the best performance from the vacuum system utilized with the monopole mass spectrometer:
1. Insure all valves are closed off, ; Check up to air valve, rough vacuum pump valve, sorption pump valve, and leak valve in turn,
2. Turn on rough vacuum pump,3. Open rough vacuum valve,4. Allow about 30 minutes then close off rough vacuum
valve. CAUTION: be sure to close off the rough vacuum valve before stopping the pump..
5. Turn off rough vacuum pump. ' ,6. Fill sorption pump dewar with liquid nitrogen.
Allow 30 minutes to chill. Insure stopper is firmly placed in sidearm prior to use.
7. Open sorption pump valve. Observe decrease in pressure on vacuum gauge. Pressure should drop to about 30 microns within five minutes. If this does not happen, close off sorption pump valve and check for leaks.
101

1028V When pressure drops to about 20 microns, turn on
getter-ion pump main power switch. Insure controls are‘first set as follows:
Table A, 1 Initial Vacuum System Settings
Control . Setting
Pump OFFMeter Select 5KVFilament Power OFFTimer OFFPower Set 0Filament Selector : ■ ‘ - . 1 /
9„ If new filaments have been installed, they must be outgassed in the following manner. Turn filament power switch on. Slowly turn the power set control up, in increments of 10 A mp., until a reading of 30 Amp. is obtained on the filament current meter. After one minute, reduce power set control to zero, and proceed in the same manner to the other three, filaments. Allow the sorption pump to reduce the system pressure to at least 20 microns prior to beginning each filament. After completion of last

103filament, return, filament selector to 1, filament power to o f f , and power set to zero, as in Table A.i
10; Allow system pressure to drop to approximately 15 microns.
11. Turn on filament power switch.12. Slowly turn power set control, in increments of 10
Amp., until a reading of 35 Amp. becomes stabilized on the filament current meter.
13. Turn the pump switch to start. A voltage of about 350V should be immediately indicated on the 5KV scale. As the voltage increases, valve off the sorption pump. When indicated voltage is 3000 volts or more, turn pump switch to run.
14. Turn meter select switch to TORR.15. Turn timer per cent on to 70. When pressure
— 5indicated on TORR scale is below 10 , turn timerswitch to on. .
— 616. When pressure drops below 10 TORR, adjust timer per cent on control as necessary.
17. When it is apparent the getter-ion pumps will maintain the indicated vacuum, turn on the sorption pump bake. After the liquid nitrogen has boiled off remove stopper and bake for 12 hours.
18. After 12 hours, turn off sorption pump bake and replace stopper.
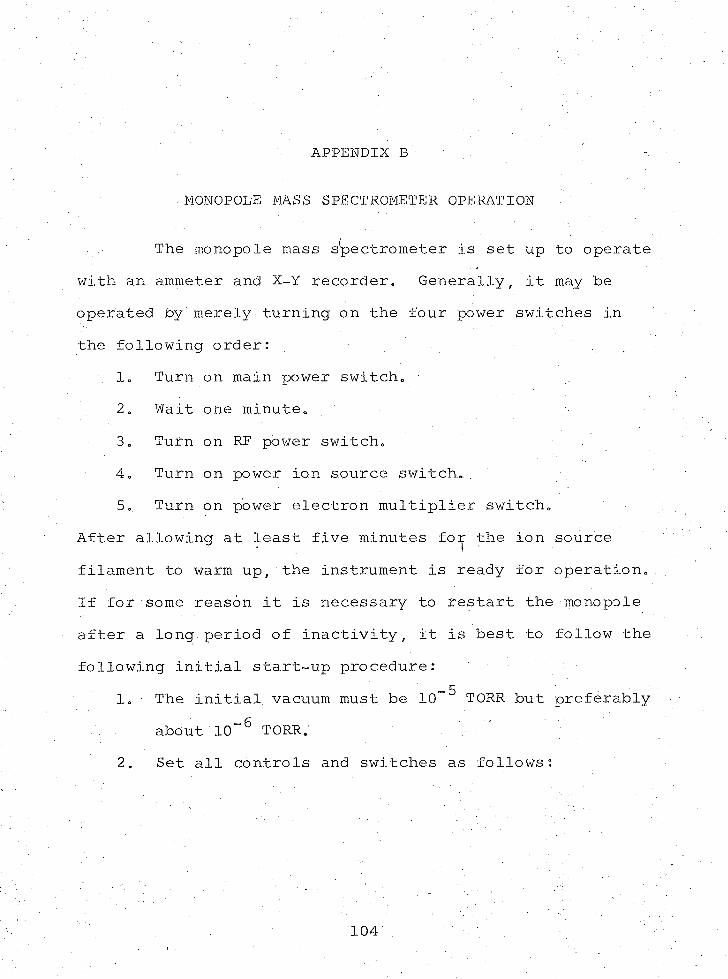
APPENDIX B
MONOPOLE MASS SPECTROMETER OPERATION
The monopole mass spectrometer is set up to operate with an ammeter and X-Y recorder. Generally, it may be operated by'merely turning on the four power switches in the following order:
1. Turn on main power switch.2. Wait one minute.3. Turn on RE power switch.4. Turn on power ion source switch.5.. Turn on power electron multiplier switch.
After allowing at least five minutes fo^ the ion source filament to warm up, the instrument is ready for operation. If for some reason it is necessary to restart the monopole after a long period of inactivity, if is best to follow the following initial start-up procedure:
1. The initial vacuum must be 10~ TORR but preferably about 10~6 TORR.
2. Set all controls and switches as follows:
104

105Table B.l Monopole Mass Spectrometer Pre-Settings
Switch or Control Setting
Scan Selector ManualFast Scan Amplitude 0Manual Scan 0Scan Switch OffMultiplier High Voltage
(Mult HV, on rear of chassis) 4Filament Switch
(Fil 1 or 2 on rear of chassis) 1 or 2 (either)Emission Current Fully counterclockwiseIonization Voltage Fully clockwiseIon Energy 4 '
Drawout 8Fo cus 7
3„ Turn on main power switch. After one minute turn on RF power switch, power ion source switch, and power electron multiplier switch.
4. At this point the ammeter and X-Y recorder may be turned on.
5. After at least five minutes, the RF tank circuit is tuned. Rotate the manual scan control until the plate current meter indicates a maximum value (approximately 1/2 scale). Adjust the tune control

, 106' with a screwdriver until a minimum plate current
reading is obtained„ Continue this procedure until a minimum reading is obtained for the fully rotated manual scan control. The instructions regarding this step in the General Electric manual are incorrect and the above steps should be substituted.
6„ Turn the emission current control until a current of 3MA is indicated on the ion source meter. Depress the press for voltage button and turn the ionization voltage control until 70 volts is indicated on the ion source meter.
7. Push the scan switch up to activate the motor drive.. _ 7Set the ammeter to the 10 Amp. scale, and press
the pen-down button on. the X-Y recorder. A mass spectrum should be recorded by the recorder.
8. Pick out an identifiable peak (usually nitrogen at amu 28 or argon at amu-40). Adjust the drawout, focus, and ion energy controls to obtain a maximum reading. The fast scan amplitude control may be used to "fine.tune" on the particular peak. Insure the scan switch is on off when making this adjustment. -
9. Other adjustments may be made as necessary,or . desired.

APPENDIX C
SAMPLE MASS SPECTRA
This appendix contains 5 actual mass spectra obtained with the equipment utilized in this project. They were obtained using standard conditions as specified in Table 5.1. The sequence is the same as that described in Chapter 5 to obtain the sensitivity of nitrogen and argon. These mass spectra, however, were run after the insertion of the stainless steel tube discussed under the analysis of d iborane.
The first mass spectra. Fig. C.1, is a background reading, taken at 10~ TORR. The results of suddenly raising the pressure in the vacuum chamber are seen in Fig. C.2. Figure C.3 presents a less cluttered look at the problem created by argon. Figures C.4 and C .5 are typical examples of mass spectra utilized for calibration of sensitivity.
107

BACKGROUND(before calibrations)P = 10 x 10~7 TORRI = 10 x 10"9 Amp. o(full scale vertical)
28 20 14 1240 2
Fig. C.l Typical Background Mass Spectra

109
BACKGROUND (10 minutes afteradmission of N ^ )P = 10 x 10“ 6 TORRI = 10 x 10 o Amp.(full scale vertical)
Fig.
C.2
Back
grou
nd
+ 10
Minutes
(N
Admi
tted
)

11irt-: ItrlnH; ::j.■ r r: :±
iilrliiliw • • • • • ‘ • ::::::
11US -
imH i n
ill:...
. • : r ; : •• ' 1 ’ : ••• —lilt 1 1 1
r
—rrizliii4:1Vnibi:
II; vi
: 1: L'-Jl
s i
11 i ■: r M i ■
mijii ISU - , . j
Ij:ii
BACKGROUND(15 minutes afteradmission of )P = 10 x 10"6 TORR
IE iir!;; t.ill!::ai2i
t ; j
111Htii: 11
at;!H'li
I = 10 x 10 o-5 Amp.
(full scale vertical
ill
: r t
S -t. : r
; n: tj;
J -i • :
: .1 nil ‘ • T" :' '
■
: • : :1-1 in Si:
• : 1 • I : 7 '
....
Sj!• i ;.:: I;; : : : r:
i r
i-i
nil IIfrr-
Hr
. ! j i i
■ I i •
i ill::
T'S! niH
40 28 20 14
Fig. C.3 Background + 15 Minutes (N^ Admitted)

LTT'-—
_ _
nr:V.::■ ■ r~ • *:. : ; i : : : i
.i
rr:
r; •: 1 : 1
I I 1H :
fi r!::;;
• ‘ -• • : i|!i
I : !I:;:;, NITROGEN CALIBRATION
-6! i
'ill
•i ■..B
. i ,
P = 10 x 10 I
TORR10 x 10 Amp.
; •Lili(full scale vertical)
■a'; Li":l
: I,;;!; i
„L. .'
:
iBi|i niBill;-!! 1
It,,-:
" TT: :T;.
Ill• : !
Hi ail
liiia:M l
lib:! i : i i
i.i:29 28 14
Fig. C.4 Nitrogen Calibration
111

m
ARGON CALIBRATION P = 10 X 10“Io = 10 x 10“ Amp.(full scale vertical)
TORR
zv40 20
Fig. C.5 Argon Calibration 112

APPENDIX D
. COMPILATION OF ARGON CRACKING PATTERN ■
Due to the relative instability of the vacuum system, no single run could be relied upon for an accurate depiction of data. As previously stated, data were taken on two days approximately one month apart,' with the most consistent values averaged for a final determination. The data on the first day were as shown in Table D.1 with readings given in output Amp. from the electron multiplier anode:
Table D.1 Argon Cracking Pattern Data 1 Preliminary Readings
m/e 20 36 38 40
Run 1 3.9 x 10~6 1.8 x 10“ 7 4.0 x 10“8 5.2 x 10”5Run 2 4.2 x 10™6 2.3 x 10"7. 5.5
001oHX 7.9 x 10“5Run 3 3.7 x 10"6 2.1 x 10“ 7 . 4. 6 x 10~8 7,4 x 10“5Run 4 3.6 x 10“ 6 2.0 x 10“ 7 . 4.3
CO1oHX 7.5 x 10“5Run 5. . 3.7 x 10“6 2.0 x 10“ 7 4.3 x 10 8 - 7.3 x 10“^
The data from the three most consistent runs (3, 4, and 5) were then used to compile the cracking pattern used for Data 1 in Table 5.2, The value at m/e 40 is taken as
U s ... .

; ' H 4• ' ■ \ the base peak and the other peaks are normalized withrespect to it. Simple division leads to the results inTable D.2„ The average readings given in Table D.2 wererounded off to give the values used for Data 1 in Table 5.2.
fable D.2 Argon Cracking Pattern Data 1
m/e 20 36 38 40
Run 3 5.00 .284 .0622 100Run 4 4.80 .267 .0574 100Run 5 • 5.06 . 274 .0590 100Average 4.95 • .275 .0595 100
The readings for Data 2 were obtained nearly one month later, after the system had been exposed to the atmosphere to change titanium filaments in the vacuum chamber. The sensitivity of the instrument had decreased markedly due to atmospheric contamination but the relative results with respect to the cracking pattern were remarkably consistent. The readings are shown in Table D.3. Again taking runs 3, 4, and 5 and normalizing we obtain Table D.4. The average values were then used in Table 5.2 for Data 2.

Table D. 3' Argon Cracking Pattern Data 2 Preliminary - Readings
1 ' ■ - v
m/e 20 36 38 40
Run 1 8.2 X 10⁻⁷ 4.5 X
CO1o 1—1 CO00 X H O ! CO 1.5 X
LO1oI —I
Run 2 8.0 X 10⁻⁷ 4.8 X 10-8 Sol X 10“9 1.6 X 10⁻⁵Run 3 . 7.5 X lO"7 4.8 X 10⁻⁸ 10 X 10"9 1.5 X 10⁻⁵Run 4/ 7.6 X lO-7 5.1 X lO-8 10 X io“9 1.7 X lO-5Run 5 7.5 X 10⁻⁷ 5. 3 X lO"8 9.8 X
CTi1OH 1. 6 X 10⁻⁸
ITable D„4 Argon Cracking Pattern Data 2
m/e 20 36 38 40
Run 3 5.00 . 320 .0667 100Run 4 4.47 .300 .0590 100Run 5 4.69 .332 .0613 100Average 4.72 . 317 .0623 100

REFERENCES
Barnard, G„ P. Modern Mass Spectrometry. London: The Institute of Physics, 1953.
Bunyard, George B. "Vacuum System Monitoring for Process Control," Solid State Technology, XIIIf No. 3 •(March, 1970) , 78-83.
"Catalog of Selected Mass Spectral Data," American Petroleum Institute Research Project 44, Thermodynamics Research Center, Texas A & M University, College Station, Texas (Loose-Leaf Data Sheets, extant,.1970).
Dawson, P. H . , and N. R. Whetten. "Mass Spectroscopy Using R F 'Quadrupole Fields." In Advances in Electronics and Electron Physics, edited by L. Marton. New York: Academic Press, 1969. .
Dushman, Saul, and J. M. Lafferty. Scientific Foundations of Vacuum Technique. 2nd ed. New Y o r k : John Wiley
■ and Sons, Inc., 1962.General Electric Company. Instruction Manual GEK-9733.
Monopole 300 Mass Spectrometer. Schenectady, New York: General Electric C o., 1968.
Hudson, J. B . , and R. L. Watters. ■"The Monopole— A NewInstrument for Measuring Partial Pressures," IEEE Transactions on Instrumentation and Measurement, IM-XV^ No. 3 (September, 19 66), 94^98^ ' :
Kiser, R. T. Introduction to Mass Spectrometry and Its Applications. Englewood Cliffs, New Jersey: Prentice-Hall, Inc., 1965.
Lever, R. F. "Computation of Ion Trajectories in the■Monopole Mass Spectrometer by Numerical Integration of Mathieu5 s Equation," I.B.M. Journal. X, No. 1 (January, 1966), 26-40.
• ' • ' \Long, L. H. "The Mechanisms of Thermal Decomposition of .
Diborane and of Interconversion of the Boranes," Journal of Inorganic and Nuclear Chemistry, XXXII, No. 4 (April, 1970), 1097-1115.
116

117Margrave, John L. "A Mass Spectrometric Appearance
Potential Study of Diborane," Journal of Physical Chemistry, L XI t No. 1 (January, 1957) , 38-40.
McLafferty, F. W. Mass Spectrometry of Organic Ions. New York: Academic Press, 1963.
Pirani, M. S . # and J. Yarwood. Principles of VacuumEngineering. New York: Reinhold Publishing Corp., 1961.
Roberts, Richard W . , and Thomas A. Vanderslice. Ultrahigh Vacuum and Its Applications. Englewood Cliffs, New Jersey: Prentice-Hall, Inc., 1963.
Robo z , J. Introduction to Mass Spectrometry Instrumentation and Technigues. New York: John Wiley and Sons,Inc., 1968.
Santeler, Donald J . , D. H. Holkeboer, D. W. Jones, and F.Pagano. Vacuum Technology and Space Simulation. Washington, D. C . : National Aeronautics and Space Administration, 1966.
Shapiro, Isadore, C. O. Wilson, J. F. Fitter, and W. J.Lehmann. "Mass Spectrometry in Boron Chemistry."In Advances in Chemistry Series Number 32, Borax to Boranes, edited by Robert F. Gould. Washington, D. C . : American Chemical Society, 1961.
von Zahn, Ulf. "Monopole Spectrometer, a New Electric Field Mass Spectrometer," The Review of Scientific Instruments. XXXIV, No. 1 (January, 1963), 1-4.
