utility ceo forum - dsm - indiadsm-india.org/wp-content/uploads/2015/06/annual-report-2013.pdf ·...
TRANSCRIPT
Utility CEO Forum ON DEMAND SIDE MANAGEMENT
Annual Report - 2013

Summary
This report is solely for the use and benefit of Shakti Sustainable Energy Foundation and should not be relied upon by any other part. Utility CEO Forum on Demand Side Management - Annual Report 2013 PwC 3
Summary
The Ministry of Power, Government of India has defined DSM as 'actions of a utility, beyond the customer's
meter, to alter the end-use of electricity - whether it be to increase demand, decrease it, shift it between high
and low peak periods, or manage it when there are intermittent load demands - in the overall interests of
reducing utility costs'.
Despite the obvious benefits, DSM has not been able to take off at a large scale to realize the available potential.
There are several barriers derailing the progress of DSM resource acquisition by Indian Utilities. This situation
demands for increased interaction among the Chief Executive Officers (CEOs) and Senior Management of
distribution utilities (Discoms) in India in order to identify and advance solutions driven dialogue among the
stakeholders. Knowledge exchange and experience sharing could stimulate fresh ideas, identify critical
challenges, replicate best practices, and create an enabling policy environment.
To address the above mentioned challenges, Shakti Sustainable Energy Foundation (SSEF) conceptualized the
'Utility CEO Forum on Demand Side Management’ to share knowledge and experiences on design, development
and delivery of megawatt scale DSM programmes in the country.
In the first year of its inception, the Forum met four times, once in each quarter. Shri Gireesh B Pradhan
(Chairperson, Central Electricity Regulatory Commission) chaired the first three meetings and then Shri Anil
Razdan (Former Secretary, Ministry of Power) took over as the Chairperson in the fourth meeting. The profile
of participants in these meetings includes electric utilities, regulatory commissions, central and nodal agencies,
energy service companies and other industry experts.
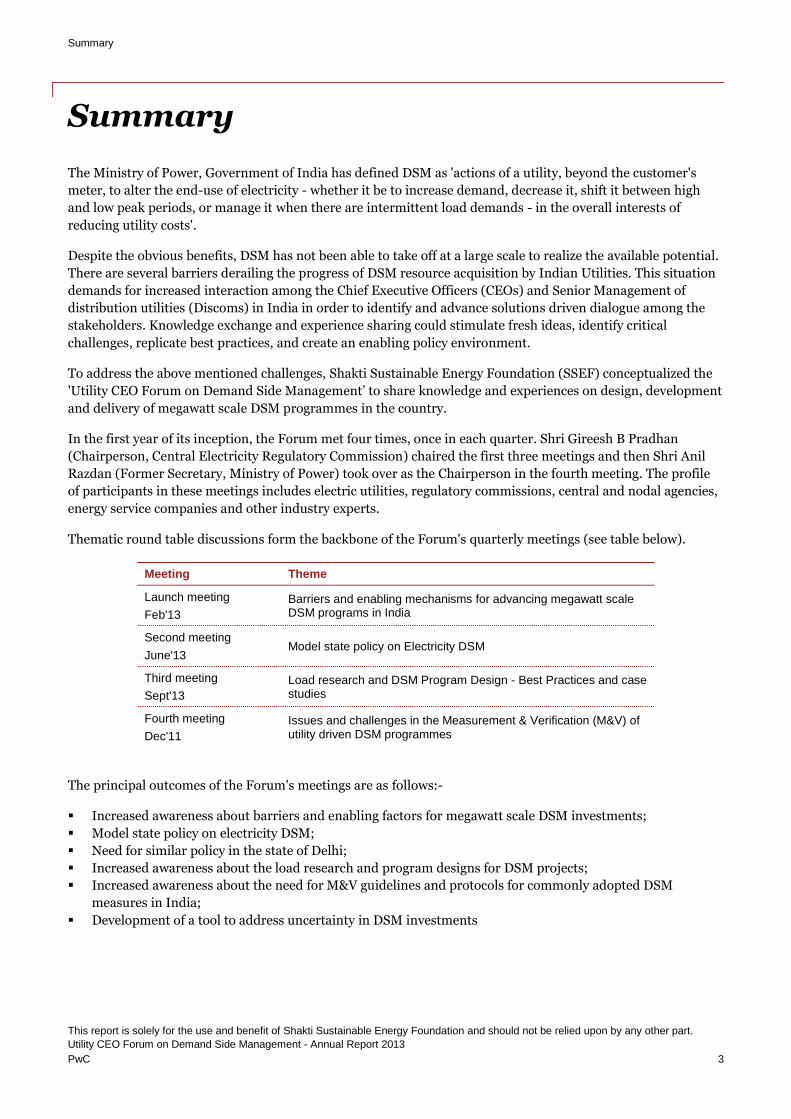
Thematic round table discussions form the backbone of the Forum's quarterly meetings (see table below).
Meeting Theme
Launch meeting
Feb'13 Barriers and enabling mechanisms for advancing megawatt scale DSM programs in India
Second meeting
June'13 Model state policy on Electricity DSM
Third meeting
Sept'13 Load research and DSM Program Design - Best Practices and case studies
Fourth meeting
Dec'11 Issues and challenges in the Measurement & Verification (M&V) of utility driven DSM programmes
The principal outcomes of the Forum's meetings are as follows:-
Increased awareness about barriers and enabling factors for megawatt scale DSM investments;
Model state policy on electricity DSM;
Need for similar policy in the state of Delhi;
Increased awareness about the load research and program designs for DSM projects;
Increased awareness about the need for M&V guidelines and protocols for commonly adopted DSM
measures in India;
Development of a tool to address uncertainty in DSM investments

Table of contents
1. Project Overview 7
1.1. Background 7
1.2. Progress till date 7
2. Challenges 11
2.1. Key challenges 11
2.2. Tactics 11
2.3. Lessons 12
3. Principal Outcomes 13
Appendix 15
A. Charter
B. Theme Paper: Barriers and Enabling Mechanisms for Advancing Megawatt scale DSM Programs in India
C. Proceedings: Launch of the Forum
D. Theme Paper: Model State DSM Policy
E. Proceedings: Second Meeting
F. Theme Paper: Electric utility load research and DSM programme design
G. Proceedings: Third Meeting
H. Theme Paper: Measurement and verification of utility driven DSM programmes: Best practices and case studies
I. Proceedings: Fourth Meeting

Project Overview
This report is solely for the use and benefit of Shakti Sustainable Energy Foundation and should not be relied upon by any other part. Utility CEO Forum on Demand Side Management - Annual Report 2013 PwC 7
1. Project Overview
1.1. Background
Over the past five years, India’s electricity demand has been growing consistently at an annual average rate of
7%. Despite the Government push to increase generation capacity, there has been no substantial reduction in
the demand-supply gap. Moreover, supply side measures, though extremely important, require large
investments and have long gestation periods. Given India’s low per capita consumption of energy and the
anticipated growth in the Indian economy, energy consumption will increase in the time to come. In this
situation, it is imperative that a multi pronged strategy be adopted that focuses not just on the supply side but
also on the demand side through improvements in efficiency in consumption. Demand Side Management
(DSM) emerges as a short term and cost effective tool to curb the demand-supply gap.
Despite the obvious benefits, DSM has not been able to take off at a large scale to realize the available potential.
This may be attributed to several technical, financial and economic barriers. Some progress on program
designing and implementation framework has been achieved jointly by Utilities, Regulatory Commissions, and
the Bureau of Energy Efficiency (BEE). The on-ground implementation responsibility continues to rest with the
Discoms who have not been able to take it off the ground. This situation demands for increased interaction
among the Chief Executive Officers (CEOs) and Senior Management of Discoms in India in order to identify
and advance solutions driven dialogue among the stakeholders. Knowledge exchange and experience sharing
could stimulate fresh ideas, identify critical challenges, replicate best practices, discuss and debate enabling
policy environment. This will eventually pave the way for accelerated implementation of megawatt scale DSM
activities in the country.
To address the above mentioned challenges, Shakti Sustainable Energy Foundation (SSEF) conceptualized the
'Utility CEO Forum on Demand Side Management’ to share knowledge and experiences on design, development
and delivery of megawatt scale DSM programmes in the country. PwC was appointed the Secretariat to the
Forum and assisted in the capacity of knowledge and logistical partner to the Forum’s meetings.
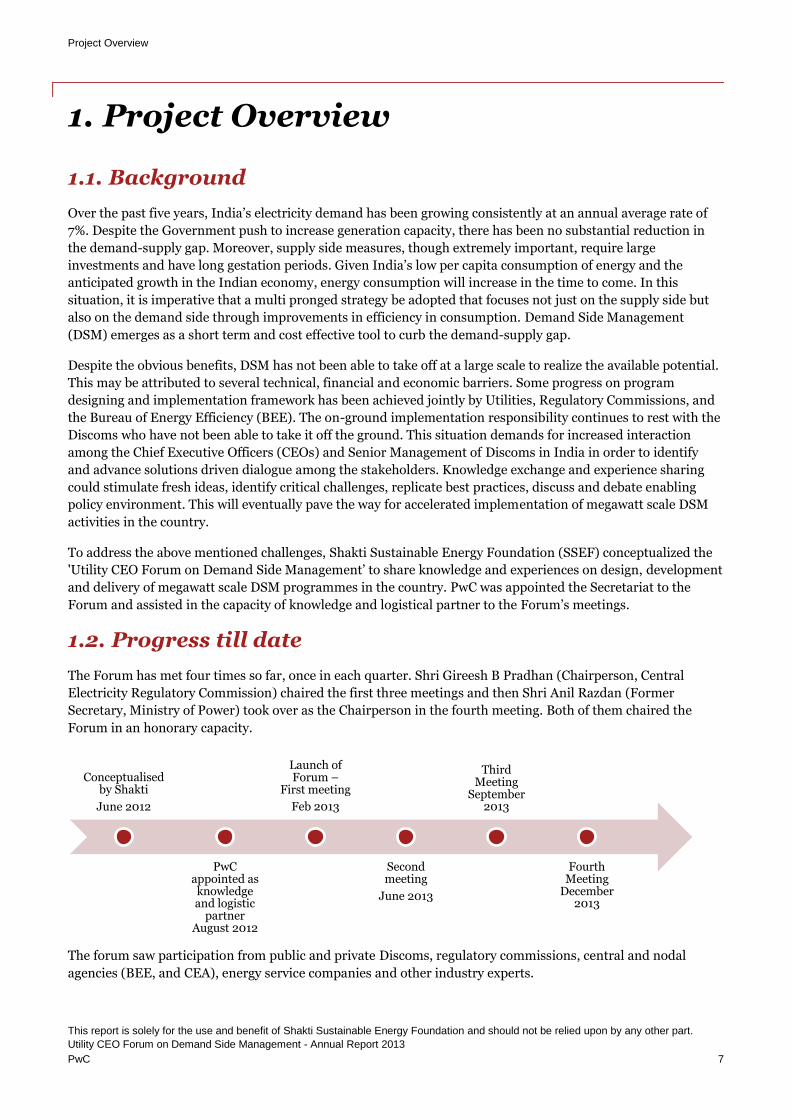
1.2. Progress till date
The Forum has met four times so far, once in each quarter. Shri Gireesh B Pradhan (Chairperson, Central
Electricity Regulatory Commission) chaired the first three meetings and then Shri Anil Razdan (Former
Secretary, Ministry of Power) took over as the Chairperson in the fourth meeting. Both of them chaired the
Forum in an honorary capacity.
The forum saw participation from public and private Discoms, regulatory commissions, central and nodal
agencies (BEE, and CEA), energy service companies and other industry experts.
Conceptualised by Shakti
June 2012
PwC appointed as knowledge and logistic
partner August 2012
Launch of Forum –
First meeting
Feb 2013
Second meeting
June 2013
Third Meeting
September 2013
Fourth Meeting
December 2013
Project Overview
This report is solely for the use and benefit of Shakti Sustainable Energy Foundation and should not be relied upon by any other part. Utility CEO Forum on Demand Side Management - Annual Report 2013 PwC 8
The Forum was launched on 27th of February 2013 in New Delhi and was attended by participants representing
CERC, Tata Power Delhi, Dakshin Haryana Bijli Vitran Nigam Limited, Reliance Infra (Mumbai Distribution),
Tata Power (Mumbai Distribution), TANGEDCO and BESCOM. During the launch meeting, a brief roundtable
discussion was facilitated on the 'barriers and enabling mechanisms for advancing megawatt scale DSM
programs in India'. The principal outcome of the launch meeting was that the participants strongly reckoned
the need for a model state policy on electricity DSM to guide the utilities' efforts for up-scaling investments
towards DSM resources.
Subsequently the Forum developed a model state policy on electricity DSM to promote a favorable policy
framework for the states to invest in demand side resources. The second meeting of this forum saw enriching
discussion and debate on this model policy, and was attended by 21 participants representing various
stakeholders in the Indian power sector. During the meeting government of NCT of Delhi accepted the model
policy and sought Forum’s support to draft a similar policy for the state of Delhi. The participants also reckoned
that the load research and DSM program designs are critical activities in the overall DSM cycle and prioritized
by the Forum. The meeting saw participation from:
CERC, BERC, UPERC, APERC
Principal Secretary, Power, Govt. of NCT of Delhi
Tata Power Delhi, Tata Power Mumbai, Reliance Infra, UHBVN/DHBVN, Assam Power Distribution
Company Limited, CESC limited, Madhya Gujarat Vij Company Limited, Paschimanchal Vidyut Vitran
Nigam Ltd, Jaipur Vidyut Vitran Nigam Limited
BEE, EESL, CEA and UNDP
In the third meeting of the Forum, held on 25th September 2013, the Forum discussed best practices for
undertaking electric utility load research and designing utility driven DSM programs through selective case
studies. The meeting was attended by 19 participants as listed below. The participants reckoned that the
monitoring and verification (M&V) is a key challenge for large scale DSM programs and thus the forum should
review the practices related to M&V in India as well as internationally and discuss enabling mechanisms to
improve the M&V framework in the country.
HERC, KERC, GERC, BERC, APERC, UPERC, UERC
Tata Power Delhi, Tata Power Mumbai, Reliance Infra, UHBVN/DHBVN, CESU Orissa,
EESL and CEA
Philips and other industry experts
The fourth meeting of the Forum, held on 13th December 2013, discussed issues and challenges in the
Measurement & Verification (M&V) of utility driven DSM programmes. The meeting, chaired by Anil Razdan,
Former Secretary, Ministry of Power, was attended by 24 other participants as listed below. The participants
strongly reckoned the need for developing M&V guidelines and protocols for utility driven DSM programmes.
The participants also reckoned the need for separate M&V protocols for the commonly sought DSM
programmes in India.
Bihar Electricity Regulatory Commission and Tripura Electricity Regulatory Commission, Maharashtra
Electricity Regulatory Commission, Joint Electricity Regulatory Commission
Kerala State Electricity Board, BSES Yamuna Power Limited, Tata Power Delhi, Reliance Infrastructure
Limited, UGVCL, MGVCL, CESCOM
BEE, EESL, Gujarat Energy Development Agency
Customised Energy Solutions, Alliance for Energy Efficient Economy
Summary of Forum's meetings
Project Overview
This report is solely for the use and benefit of Shakti Sustainable Energy Foundation and should not be relied upon by any other part. Utility CEO Forum on Demand Side Management - Annual Report 2013 PwC 9
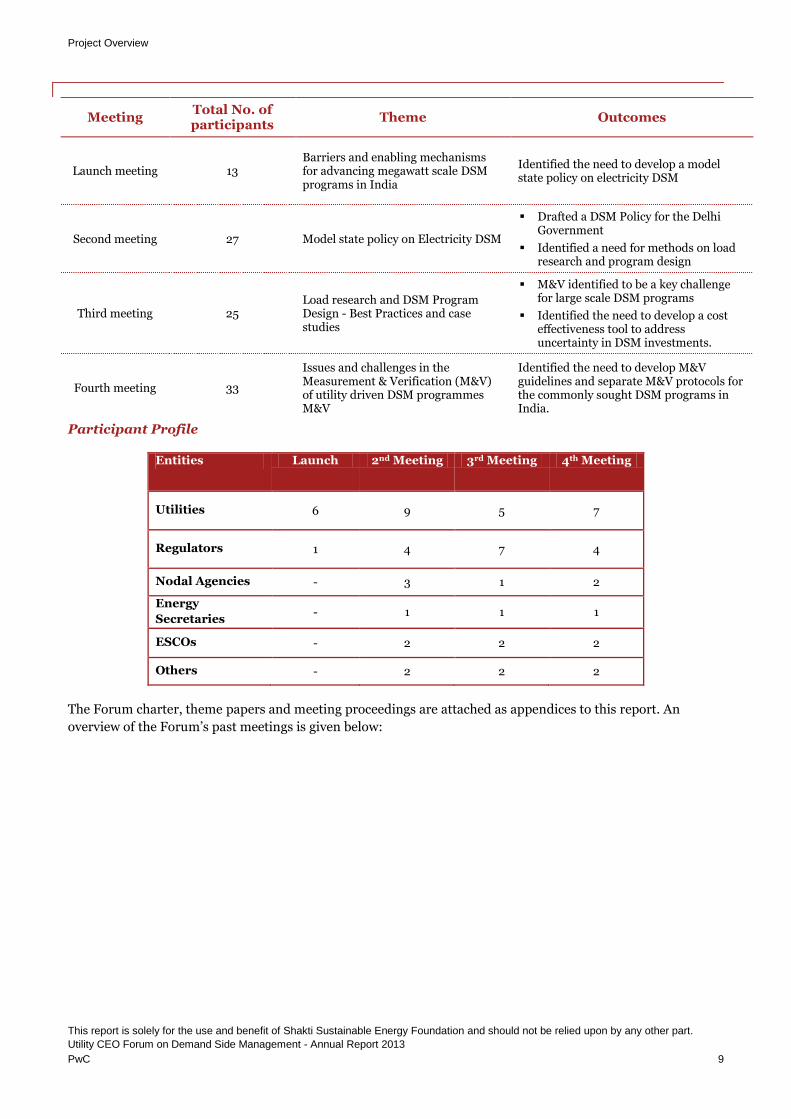
Meeting Total No. of participants
Theme Outcomes
Launch meeting 13 Barriers and enabling mechanisms for advancing megawatt scale DSM programs in India
Identified the need to develop a model state policy on electricity DSM
Second meeting 27 Model state policy on Electricity DSM
Drafted a DSM Policy for the Delhi Government
Identified a need for methods on load research and program design
Third meeting 25 Load research and DSM Program Design - Best Practices and case studies
M&V identified to be a key challenge for large scale DSM programs
Identified the need to develop a cost effectiveness tool to address uncertainty in DSM investments.
Fourth meeting 33
Issues and challenges in the Measurement & Verification (M&V) of utility driven DSM programmes M&V
Identified the need to develop M&V guidelines and separate M&V protocols for the commonly sought DSM programs in India.
Participant Profile
Entities Launch 2nd Meeting 3rd Meeting 4th Meeting
Utilities 6 9 5 7
Regulators 1 4 7 4
Nodal Agencies - 3 1 2
Energy
Secretaries - 1 1 1
ESCOs - 2 2 2
Others - 2 2 2
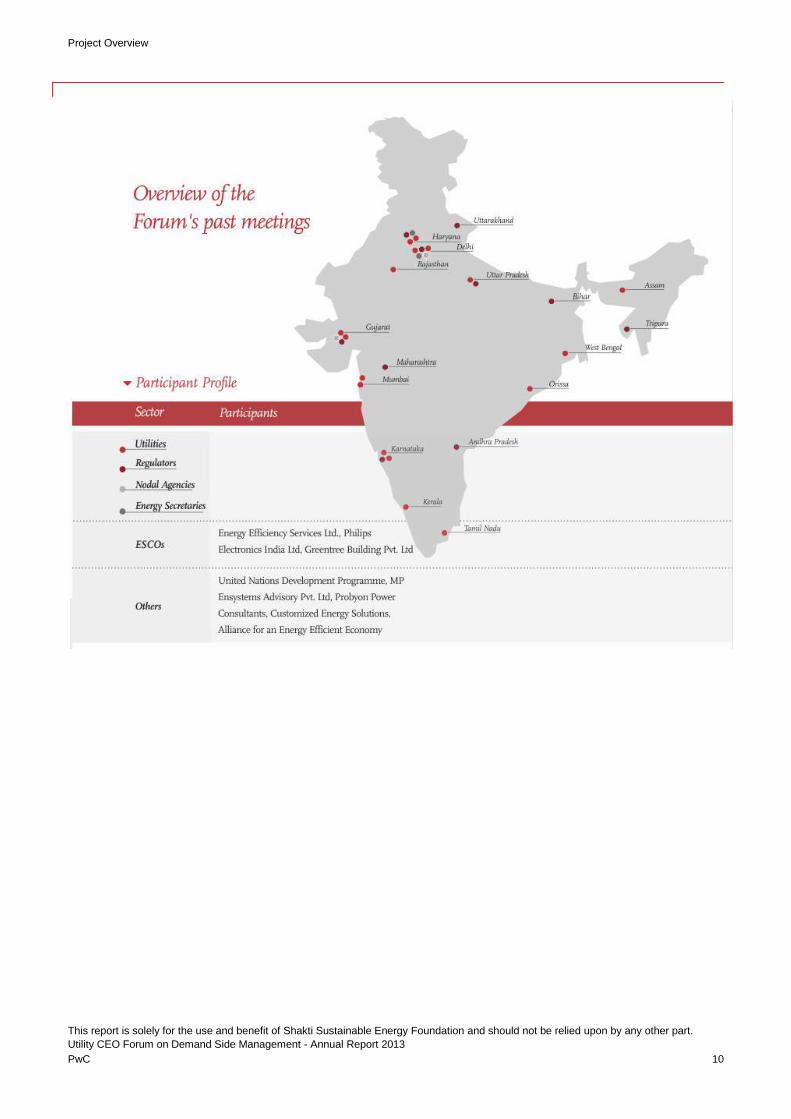
The Forum charter, theme papers and meeting proceedings are attached as appendices to this report. An
overview of the Forum’s past meetings is given below:
Project Overview
This report is solely for the use and benefit of Shakti Sustainable Energy Foundation and should not be relied upon by any other part. Utility CEO Forum on Demand Side Management - Annual Report 2013 PwC 10
Challenges
This report is solely for the use and benefit of Shakti Sustainable Energy Foundation and should not be relied upon by any other part. Utility CEO Forum on Demand Side Management - Annual Report 2013 PwC 11
2. Challenges
In this section, we attempt to articulate some of the challenges faced in establishing the Forum as an important
voice in DSM space. The section also articulates the tactics adopted by the forum's secretariat to overcome these
challenges and make the forum more effective. The section concludes with the key lessons derived from the
experience so far.
2.1. Key challenges
Selection of appropriate theme
Thematic round table discussions form the backbone of the quarterly meeting s of the Forum. The outcome of
forum's meetings largely depends on the relevance of theme to the stakeholders. The challenge faced by the
secretariat was to select appropriate themes which would be of interest to all the stakeholders as well as be the
need of the hour. DSM has many issues pertaining to policy, regulatory, and financial aspects of electric utilities
in India. Therefore selecting a theme required deliberations and consultations with the participants. We also
reckoned that the selection of theme could play a crucial role in the participation of utilities. The participants'
contribution to the discussions also depends on the past experiences derived from dealing with thematic issues.
Enhanced Participation from Discoms
As discussed before, the responsibility to capture demand side resources rests primarily with the electric
utilities (DISCOMS). In this regard, the participation of Indian utilities is crucial to deliver knowledge exchange
and experience sharing sought in the forum's meetings. So far only two private utilities in Mumbai and Delhi
distribution circles have participated in all the four meetings. There is considerable scope to enhance the
participation of the state owned utilities; thereby increasing the knowledge exchange quotient. The current
share of utility participation is about 30-40% of the total organisations participating in the meetings. We hope
with increased awareness about the existence of the DSM forum, this statistic should improve substantially in
the future.
Enhance participation of CEOs
CEOs or the heads of organizations are the decision makers and their participation is crucial to derive
important lessons from the thematic discussions and take appropriate follow-on steps to scale the investments
in DSM. Currently, DSM investments are accorded low priority by the senior management of utilities which
becomes a critical barrier for the growth of utility driven DSM programs. Ensuring a CEO's participation from
any participating organization could effectively mitigate this barrier, but is however beyond the control of the
forum's secretariat. We have circulated the proceedings of all the meetings to the CEOs to keep them informed
about the activities of the forum.
2.2. Tactics
PwC, being the secretariat, was responsible for making all the logistical arrangements for the Forum meetings
and also preparing the knowledge material on selective themes. A key strategy was to select a suitable
Chairperson, who has worked in the power sector and can also effectively motivate utilities, electricity
regulatory commissions and other stakeholders towards the DSM agenda. With both Shakti and PwC’s network
and efforts, we were able to engage Gireesh B Pradhan to chair the Forum's first three meetings and Anil
Razdan for the fourth meeting. Both of these chairpersons served in the honorary capacity.
Challenges
This report is solely for the use and benefit of Shakti Sustainable Energy Foundation and should not be relied upon by any other part. Utility CEO Forum on Demand Side Management - Annual Report 2013 PwC 12
We also adopted a methodological working protocol to organise the quarterly meetings. We first developed a
forum charter and a logo to create a unique identity for the forum. Subsequently, we developed a
comprehensive database of potential participants: electric utilities, regulatory commissions and other
stakeholders. We also reviewed the barriers and enabling mechanisms for megawatt scale DSM programs in the
country and discussed key findings in the first meeting. For subsequent meetings, we identified the theme
based on the sector needs and participants' requests. . We also engaged some speakers, who have implemented
some industry best practices, to present and demonstrate DSM success stories. Personal invites were sent to all
the stakeholders, at least two weeks in advance, on behalf of the chairperson along with a tentative agenda.
Subsequently a dedicated team would rigorously follow up with the offices of potential participants for
gathering confirmations and also coordinate with confirmed participants for arranging travel and
accommodation services. Post the meeting, the team would prepare proceedings documenting the key
discussion points and circulate the same to the participants.
We have developed a sense of awareness about the forum and also have ensured that future prospective
participants are aware of the work that the Forum has undertaken. Adequate steps have been taken by the
secretariat to make the forum effective.
2.3. Lessons
Continued participation from certain stakeholders is essential to create an effective forum
Chairperson plays a crucial role in engaging the participants and facilitating the discussions
Thematic discussions and presentations on successful case studies has improved the awareness among
many stakeholders by facilitating knowledge transfer
Knowledge transfer and improved awareness has led the participants seek for crucial studies, meetings,
and documents to gain further knowledge in DSM topics
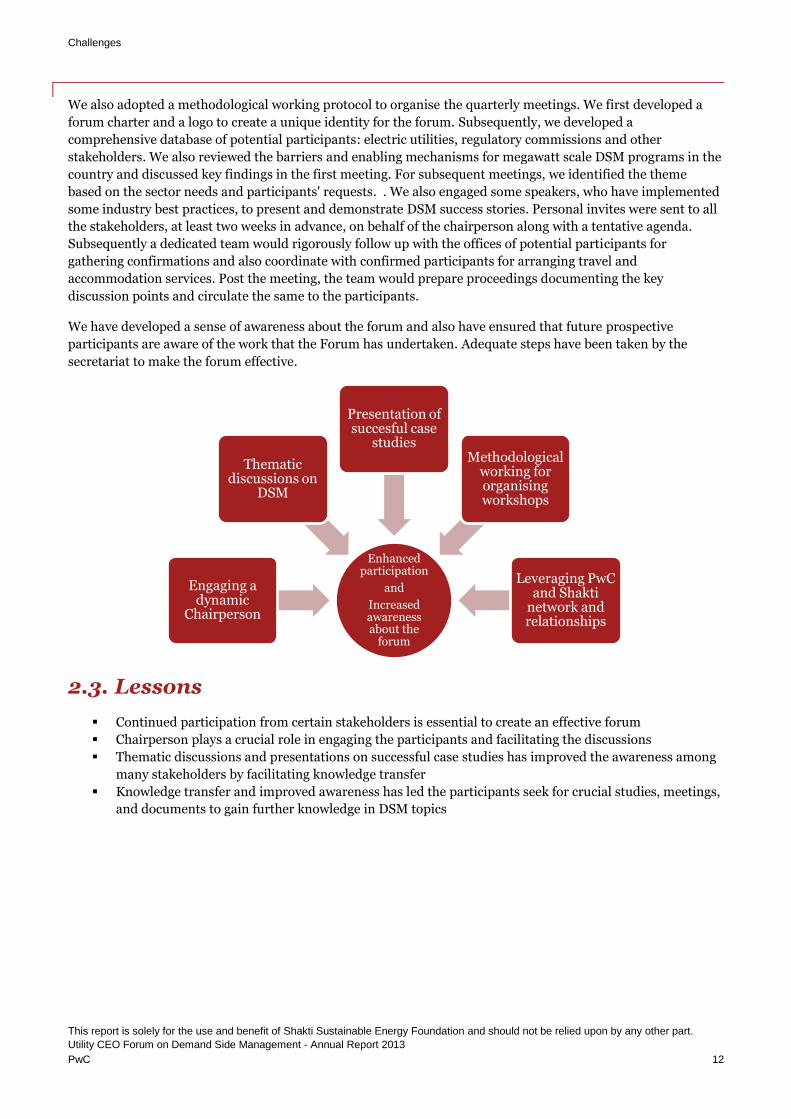
Enhanced participation
and
Increased awareness about the
forum
Engaging a dynamic
Chairperson
Thematic discussions on
DSM
Presentation of succesful case
studies Methodological
working for organising workshops
Leveraging PwC and Shakti
network and relationships
Principal Outcomes
This report is solely for the use and benefit of Shakti Sustainable Energy Foundation and should not be relied upon by any other part. Utility CEO Forum on Demand Side Management - Annual Report 2013 PwC 13
3. Principal Outcomes
The progress of the Forum was tracked against measures such as number of participants, quality of discussions,
post meeting follow-on commitments made or measures undertaken by the stakeholders. After each meeting,
the secretariat team took stock of these parameters and appropriate corrective or follow-on steps were
undertaken wherever required.
In this section, we have described the principal outcomes resulting from the project and assess their progress.
Increased awareness about barriers and enabling factors for megawatt scale DSM investments;
Model state policy on electricity DSM;
Need for similar policy in the state of Delhi;
Increased awareness about the load research and program designs for DSM projects;
Increased awareness about the need for M&V guidelines and protocols for commonly adopted DSM
measures in India;
Development of a tool to address uncertainty in DSM investments
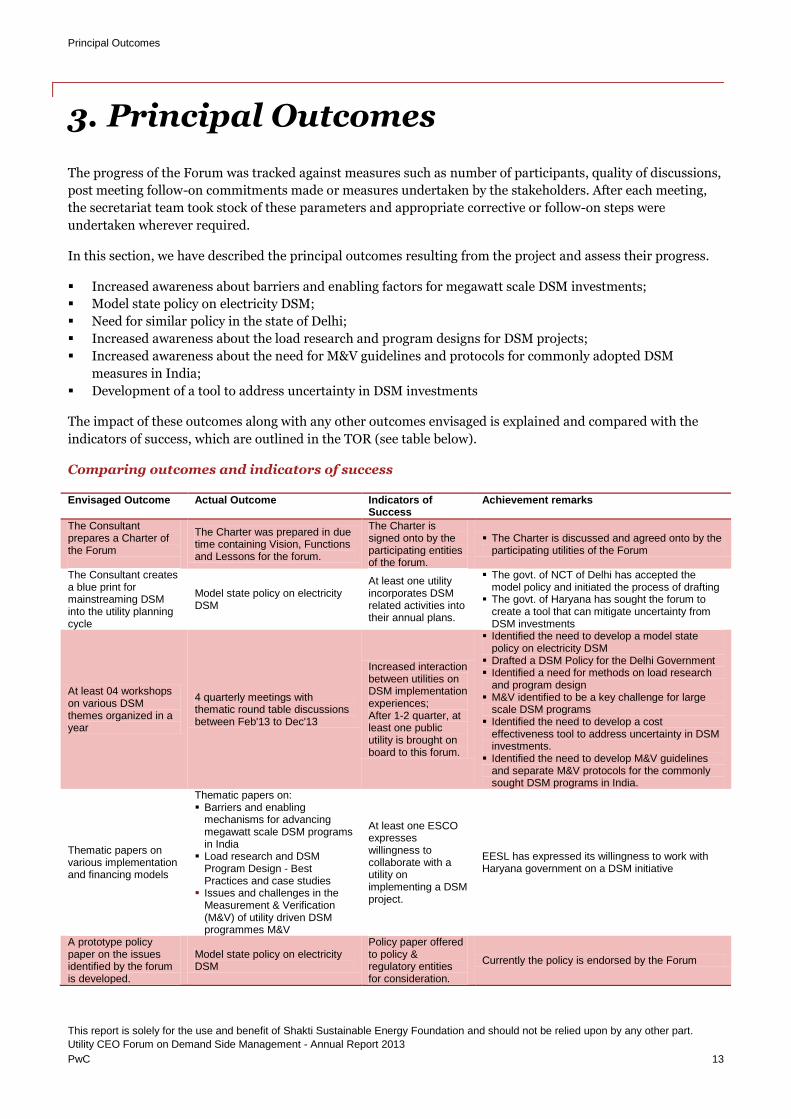
The impact of these outcomes along with any other outcomes envisaged is explained and compared with the
indicators of success, which are outlined in the TOR (see table below).
Comparing outcomes and indicators of success
Envisaged Outcome Actual Outcome Indicators of Success
Achievement remarks
The Consultant prepares a Charter of the Forum
The Charter was prepared in due time containing Vision, Functions and Lessons for the forum.
The Charter is signed onto by the participating entities of the forum.
The Charter is discussed and agreed onto by the participating utilities of the Forum
The Consultant creates a blue print for mainstreaming DSM into the utility planning cycle
Model state policy on electricity DSM
At least one utility incorporates DSM related activities into their annual plans.
The govt. of NCT of Delhi has accepted the model policy and initiated the process of drafting
The govt. of Haryana has sought the forum to create a tool that can mitigate uncertainty from DSM investments
At least 04 workshops on various DSM themes organized in a year
4 quarterly meetings with thematic round table discussions between Feb'13 to Dec'13
Increased interaction between utilities on DSM implementation experiences; After 1-2 quarter, at least one public utility is brought on board to this forum.
Identified the need to develop a model state policy on electricity DSM
Drafted a DSM Policy for the Delhi Government Identified a need for methods on load research
and program design M&V identified to be a key challenge for large
scale DSM programs Identified the need to develop a cost
effectiveness tool to address uncertainty in DSM investments.
Identified the need to develop M&V guidelines and separate M&V protocols for the commonly sought DSM programs in India.
Thematic papers on various implementation and financing models
Thematic papers on: Barriers and enabling
mechanisms for advancing megawatt scale DSM programs in India
Load research and DSM Program Design - Best Practices and case studies
Issues and challenges in the Measurement & Verification (M&V) of utility driven DSM programmes M&V
At least one ESCO expresses willingness to collaborate with a utility on implementing a DSM project.
EESL has expressed its willingness to work with Haryana government on a DSM initiative
A prototype policy paper on the issues identified by the forum is developed.
Model state policy on electricity DSM
Policy paper offered to policy & regulatory entities for consideration.
Currently the policy is endorsed by the Forum
Principal Outcomes
This report is solely for the use and benefit of Shakti Sustainable Energy Foundation and should not be relied upon by any other part. Utility CEO Forum on Demand Side Management - Annual Report 2013 PwC 14
Energy Efficiency Services Limited (EESL) has agreed to join hands with Shakti Sustainable Energy Foundation
for this initiative as a co-promoter of the Forum. This may also be considered to be a significant outcome. EESL
will be the technical advisor and the implementation partner of the Forum. From their implementation
experience in various states and sectors, EESL brings together industry best practices to the Forum, thus
enabling participants to undertake megawatt scale investments in DSM.

This report is solely for the use and benefit of Shakti Sustainable Energy Foundation and should not be relied upon by any other part. Utility CEO Forum on Demand Side Management - Annual Report 2013 PwC 15
Appendix

This report is solely for the use and benefit of Shakti Sustainable Energy Foundation and should not be relied upon by any other part. Utility CEO Forum on Demand Side Management - Annual Report 2013 PwC 15
Appendix


This report is solely for the use and benefit of Shakti Sustainable Energy Foundation and should not be relied upon by any other part. Utility CEO Forum on Demand Side Management - Annual Report 2013 PwC
A. Forum Charter

Utility CEO Forum on
Demand Side Management
Conceived & Supported by:
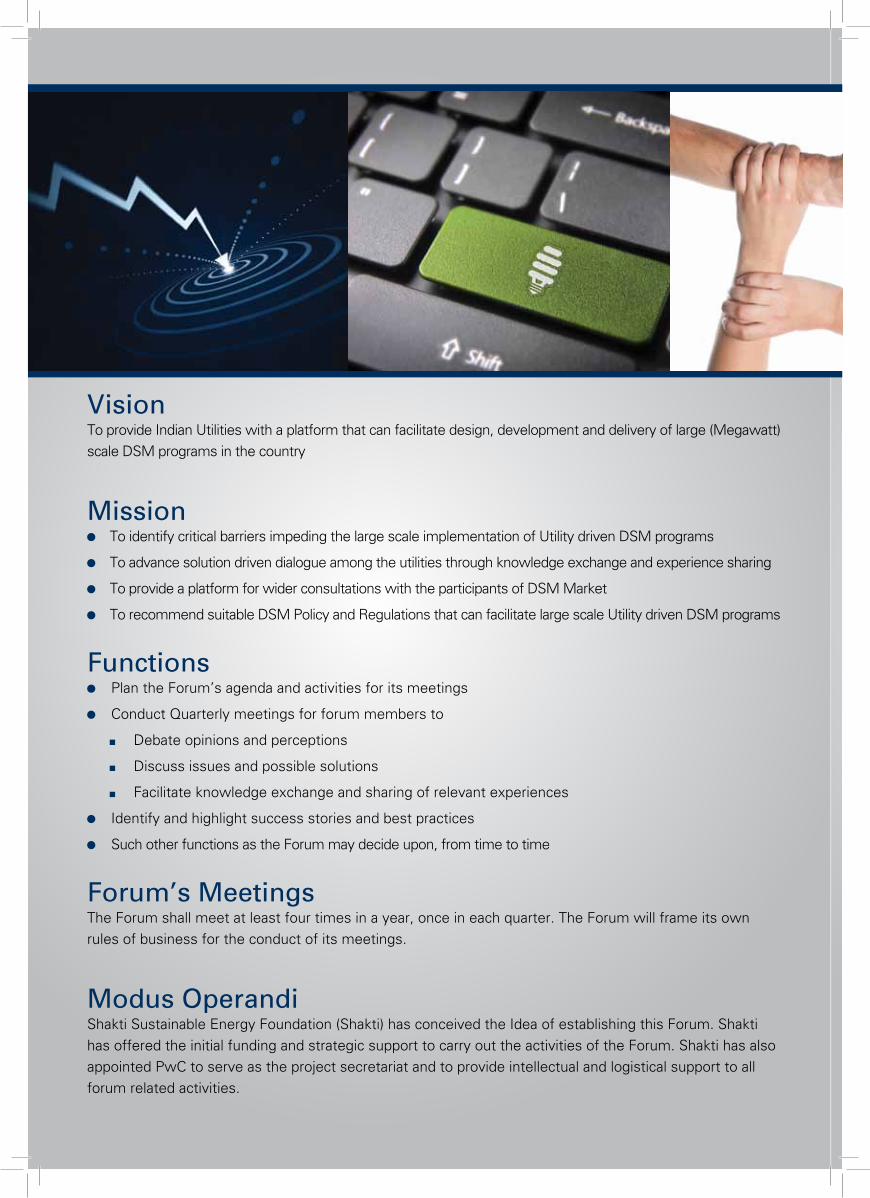
VisionTo provide Indian Utilities with a platform that can facilitate design, development and delivery of large (Megawatt) scale DSM programs in the country
Mission To identify critical barriers impeding the large scale implementation of Utility driven DSM programs
To advance solution driven dialogue among the utilities through knowledge exchange and experience sharing
To provide a platform for wider consultations with the participants of DSM Market
To recommend suitable DSM Policy and Regulations that can facilitate large scale Utility driven DSM programs
Functions Plan the Forum’s agenda and activities for its meetings
Conduct Quarterly meetings for forum members to
Debate opinions and perceptions
Discuss issues and possible solutions
Facilitate knowledge exchange and sharing of relevant experiences
Identify and highlight success stories and best practices
Such other functions as the Forum may decide upon, from time to time
Forum’s MeetingsThe Forum shall meet at least four times in a year, once in each quarter. The Forum will frame its own rules of business for the conduct of its meetings.
Modus OperandiShakti Sustainable Energy Foundation (Shakti) has conceived the Idea of establishing this Forum. Shakti has offered the initial funding and strategic support to carry out the activities of the Forum. Shakti has also appointed PwC to serve as the project secretariat and to provide intellectual and logistical support to all forum related activities.
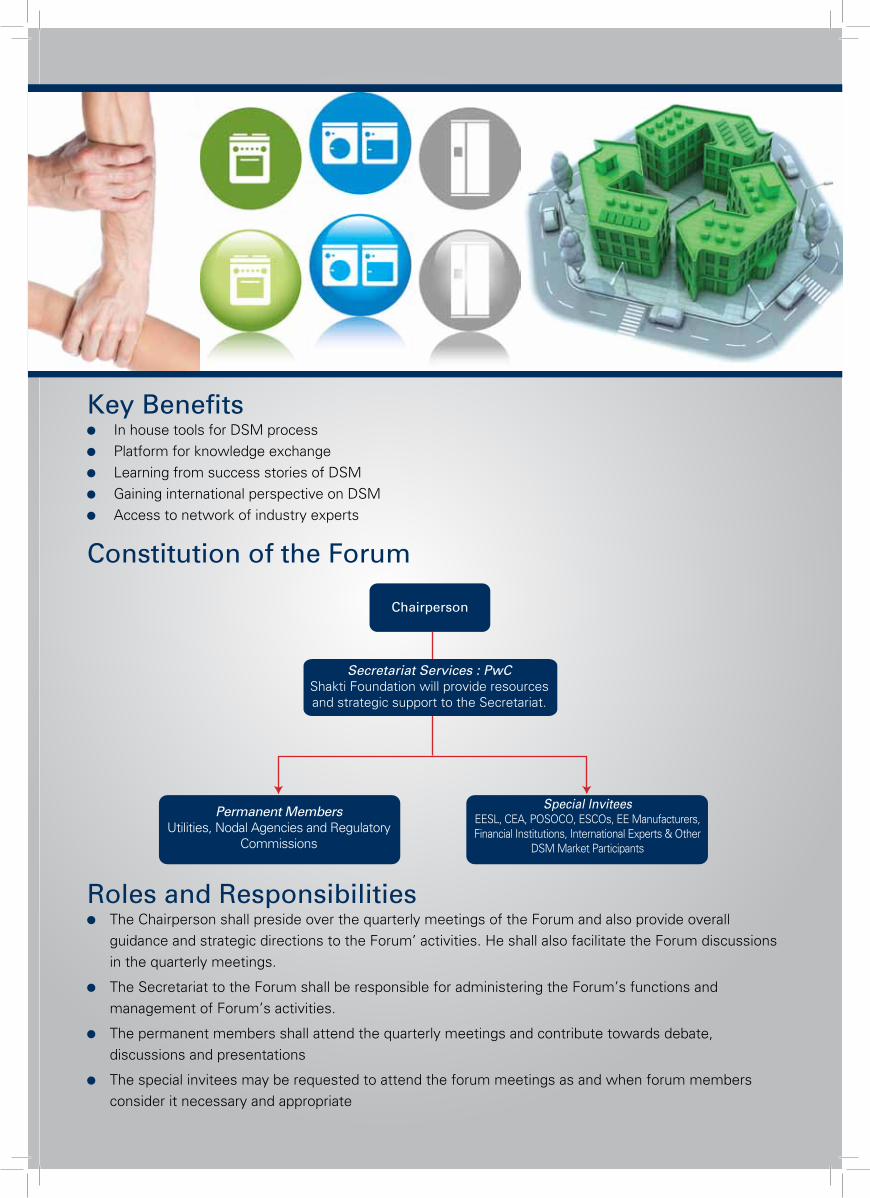
Key Benefits In house tools for DSM process Platform for knowledge exchange Learning from success stories of DSM Gaining international perspective on DSM Access to network of industry experts
Constitution of the Forum
Roles and Responsibilities The Chairperson shall preside over the quarterly meetings of the Forum and also provide overall
guidance and strategic directions to the Forum’ activities. He shall also facilitate the Forum discussions in the quarterly meetings.
The Secretariat to the Forum shall be responsible for administering the Forum’s functions and management of Forum’s activities.
The permanent members shall attend the quarterly meetings and contribute towards debate, discussions and presentations
The special invitees may be requested to attend the forum meetings as and when forum members consider it necessary and appropriate
Chairperson
Secretariat Services : PwCShakti Foundation will provide resources and strategic support to the Secretariat.
Permanent Members Utilities, Nodal Agencies and Regulatory
Commissions
Special InviteesEESL, CEA, POSOCO, ESCOs, EE Manufacturers, Financial Institutions, International Experts & Other
DSM Market Participants
Contact:Kulbhushan Kumar
PricewaterhouseCoopers Private limited 17th Floor, Building No. 10, Tower C, DLF Cyber City, Gurgaon 122002 | India
Email: [email protected] | Direct: +91 (124) 3306000 | Mobile: +91 (0) 97 1109 1007
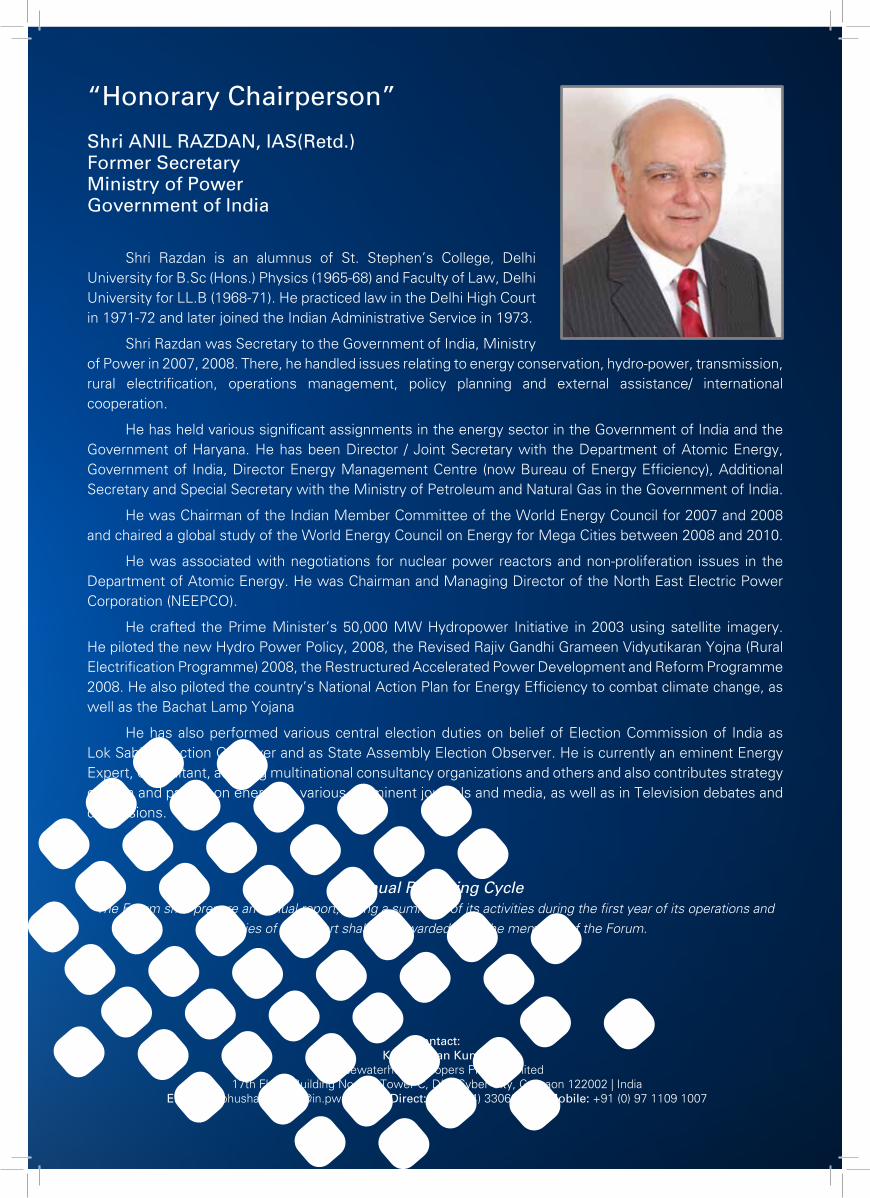
“Honorary Chairperson”
Shri ANIL RAZDAN, IAS(Retd.)Former SecretaryMinistry of PowerGovernment of India
Shri Razdan is an alumnus of St. Stephen’s College, Delhi University for B.Sc (Hons.) Physics (1965-68) and Faculty of Law, Delhi University for LL.B (1968-71). He practiced law in the Delhi High Court in 1971-72 and later joined the Indian Administrative Service in 1973.
Shri Razdan was Secretary to the Government of India, Ministry of Power in 2007, 2008. There, he handled issues relating to energy conservation, hydro-power, transmission, rural electrification, operations management, policy planning and external assistance/ international cooperation.
He has held various significant assignments in the energy sector in the Government of India and the Government of Haryana. He has been Director / Joint Secretary with the Department of Atomic Energy, Government of India, Director Energy Management Centre (now Bureau of Energy Efficiency), Additional Secretary and Special Secretary with the Ministry of Petroleum and Natural Gas in the Government of India.
He was Chairman of the Indian Member Committee of the World Energy Council for 2007 and 2008 and chaired a global study of the World Energy Council on Energy for Mega Cities between 2008 and 2010.
He was associated with negotiations for nuclear power reactors and non-proliferation issues in the Department of Atomic Energy. He was Chairman and Managing Director of the North East Electric Power Corporation (NEEPCO).
He crafted the Prime Minister’s 50,000 MW Hydropower Initiative in 2003 using satellite imagery. He piloted the new Hydro Power Policy, 2008, the Revised Rajiv Gandhi Grameen Vidyutikaran Yojna (Rural Electrification Programme) 2008, the Restructured Accelerated Power Development and Reform Programme 2008. He also piloted the country’s National Action Plan for Energy Efficiency to combat climate change, as well as the Bachat Lamp Yojana
He has also performed various central election duties on belief of Election Commission of India as Lok Sabha Election Observer and as State Assembly Election Observer. He is currently an eminent Energy Expert, Consultant, advising multinational consultancy organizations and others and also contributes strategy opinion and papers on energy to various prominent journals and media, as well as in Television debates and discussions.
Annual Reporting CycleThe Forum shall prepare an annual report, giving a summary of its activities during the first year of its operations and
copies of the report shall be forwarded to all the members of the Forum.
This report is solely for the use and benefit of Shakti Sustainable Energy Foundation and should not be relied upon by any other part. Utility CEO Forum on Demand Side Management - Annual Report 2013 PwC
B. Theme Paper: Barriers and Enabling Mechanisms for Advancing Megawatt scale DSM Programs in India

www.pwc.com/navigation
Utility CEO Forum on DSM Barriers and Enabling Mechanisms for Advancing Megawatt scale DSM Programs in India
February, 2013

White Paper
Utility CEO Forum on DSM Page 2 of 23
Utility CEO Forum on DSM
PwC Page 3 of 23
Abstract
This paper is prepared for the members of Utility CEO Forum with the objective of identifying critical barriers towards advancing mega-watt scale Utility sponsored DSM programs in the country. The Paper also aims to discuss the mechanisms to overcome these barriers. In the context of energy efficiency and DSM, the barriers have been extensively discussed by experts (both national and international) in the industry, but mostly from the perspective of market transformation. However, this paper attempts to identify challenges within the context of DSM resource acquisition by Utilities.
Another contributing section in this paper provides examples of best of practices (both local and international) that have been adopted by DSM market participants to demonstrate the enabling mechanisms that can successfully promote Utility DSM in the country. The paper also presents a detailed account of the history and evolution of DSM in India. This account is provided in the context of the evolution of 'Energy Conservation' and the emergence of relevant institutions to administer such activities in the country. Apart from this, the paper also presents an in depth assessment of the current status of Utility DSM programs in the country. This assessment is based on the survey of 73 utility DSM programs spread across 20 major Utilities.
Utility CEO Forum on DSM
PwC Page 4 of 23
Contents
Abstract ......................................................................................................................................................................... 3
Background - Supply Demand scenario in Indian Power Sector ............................................................................... 5
Demand Side Management (DSM) - Rationale and Meaning ................................................................................... 6
DSM Planning, Process and key Strategies ................................................................................................................. 6
History and Evolution of DSM in India ...................................................................................................................... 8
Current status of DSM programs in India..................................................................................................................10
Barriers for Advancing Megawatt scale DSM programs in India ............................................................................. 13
Examples of Best Practices in advancing Utility sponsored DSM Investments ...................................................... 15
Conclusion ................................................................................................................................................................... 19
Annexure - 1: Load management strategies and DSM programs ............................................................................ 20
Utility CEO Forum on DSM
PwC Page 5 of 23
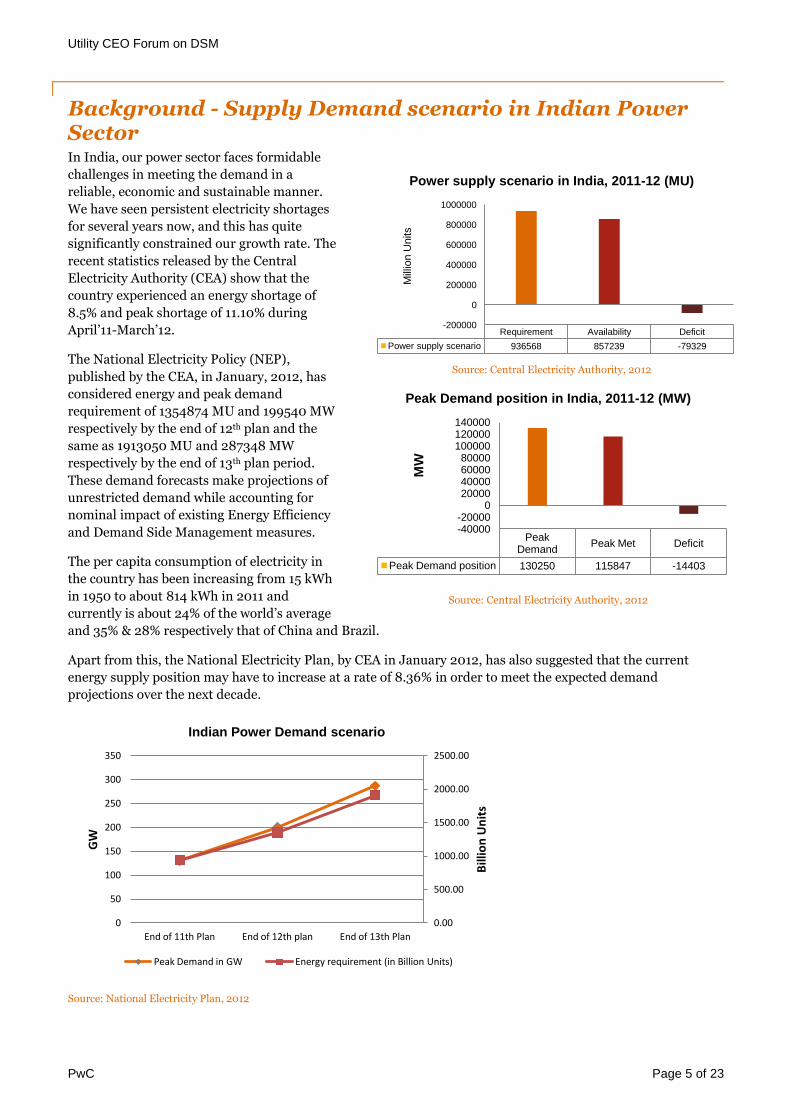
Background - Supply Demand scenario in Indian Power Sector In India, our power sector faces formidable
challenges in meeting the demand in a
reliable, economic and sustainable manner.
We have seen persistent electricity shortages
for several years now, and this has quite
significantly constrained our growth rate. The
recent statistics released by the Central
Electricity Authority (CEA) show that the
country experienced an energy shortage of
8.5% and peak shortage of 11.10% during
April’11-March’12.
The National Electricity Policy (NEP),
published by the CEA, in January, 2012, has
considered energy and peak demand
requirement of 1354874 MU and 199540 MW
respectively by the end of 12th plan and the
same as 1913050 MU and 287348 MW
respectively by the end of 13th plan period.
These demand forecasts make projections of
unrestricted demand while accounting for
nominal impact of existing Energy Efficiency
and Demand Side Management measures.
The per capita consumption of electricity in
the country has been increasing from 15 kWh
in 1950 to about 814 kWh in 2011 and
currently is about 24% of the world’s average
and 35% & 28% respectively that of China and Brazil.
Apart from this, the National Electricity Plan, by CEA in January 2012, has also suggested that the current
energy supply position may have to increase at a rate of 8.36% in order to meet the expected demand
projections over the next decade.
Source: National Electricity Plan, 2012
0.00
500.00
1000.00
1500.00
2000.00
2500.00
0
50
100
150
200
250
300
350
End of 11th Plan End of 12th plan End of 13th Plan
Bill
ion
Un
its
GW
Indian Power Demand scenario
Peak Demand in GW Energy requirement (in Billion Units)
Requirement Availability Deficit
Power supply scenario 936568 857239 -79329
-200000
0
200000
400000
600000
800000
1000000
Mill
ion
Uni
ts
Power supply scenario in India, 2011-12 (MU)
Peak Demand Peak Met Deficit
Peak Demand position 130250 115847 -14403
-40000 -20000
0 20000 40000 60000 80000
100000 120000 140000
MW
Peak Demand position in India, 2011-12 (MW)
Source: Central Electricity Authority, 2012
Source: Central Electricity Authority, 2012
Utility CEO Forum on DSM
PwC Page 6 of 23
Demand Side Management (DSM) - Rationale and Meaning Given such accelerated growth in the expected electricity demand over the next decade, supply side measures
alone cannot help India meet the expected demand. In recent times, we have also witnessed increasing
difficulties in ensuring among other things, adequate fuel linkages for new generation facilities, and so the
supply side has its own set of problems. Therefore energy efficiency measures on the demand side are a crucial
requirement. Such complementary efforts will help us narrow significantly the power demand supply gaps in a
relatively shorter time frame. Transformation of the electricity sector in India with strong and sustained
commitments to energy efficiency would improve the energy security of this nation. One tool that has proven
effective in many countries for delivering energy efficiency is demand-side management, or DSM.
The Ministry of Power, Government of India has defined DSM as 'actions of a utility, beyond the customer's meter, to alter the end-use of electricity - whether it be to increase demand, decrease it, shift it between high and low peak periods, or manage it when there are intermittent load demands - in the overall interests of reducing utility costs'.
Another definition of DSM, widely accepted by Indian industry, is that the 'DSM refers to cooperative activities between the utility and its customers (sometimes with the assistance of third parties such as energy services companies and various trade allies) to implement options for increasing the efficiency of energy utilization, with resulting benefits to the customer, utility, and society as a whole'.
Often the terms energy efficiency and DSM are used interchangeably. However, it is important to point out that DSM explicitly refers to all those activities that involve deliberate intervention by the utility in the marketplace so as to alter the consumer's load profile. Energy efficiency is used in an all encompassing sense and can be defined any activity that would directly or indirectly lead to 'using less energy to provide the same service'. To make this distinction precise, a program that encourages customers to install energy efficient lighting systems through a rebate program would fall under DSM. On the other hand, customer purchasing energy efficient lighting as a reaction to the perceived need for conservation is not DSM but energy efficiency gains. Thus DSM cannot be undertaken in the absence of Utility participation and leadership.
The benefits of DSM are manifold and are discussed extensively in the literature. Primarily the DSM programs can reduce energy costs for both the utility, and its customers, and in the long term, it can limit the requirement for further generation capacity augmentation. It also offers co benefits such as improvement in system reliability and efficient end use electricity by Utility customers. In summary well designed DSM measures can improve the service quality of the utility and enhance customer satisfaction. Apart from the direct benefits to Utilities and their customers, there are environmental benefits derived from DSM programs. DSM programs substitute for power plants and result in lower green house gas emissions and also help the country improve its energy intensity.
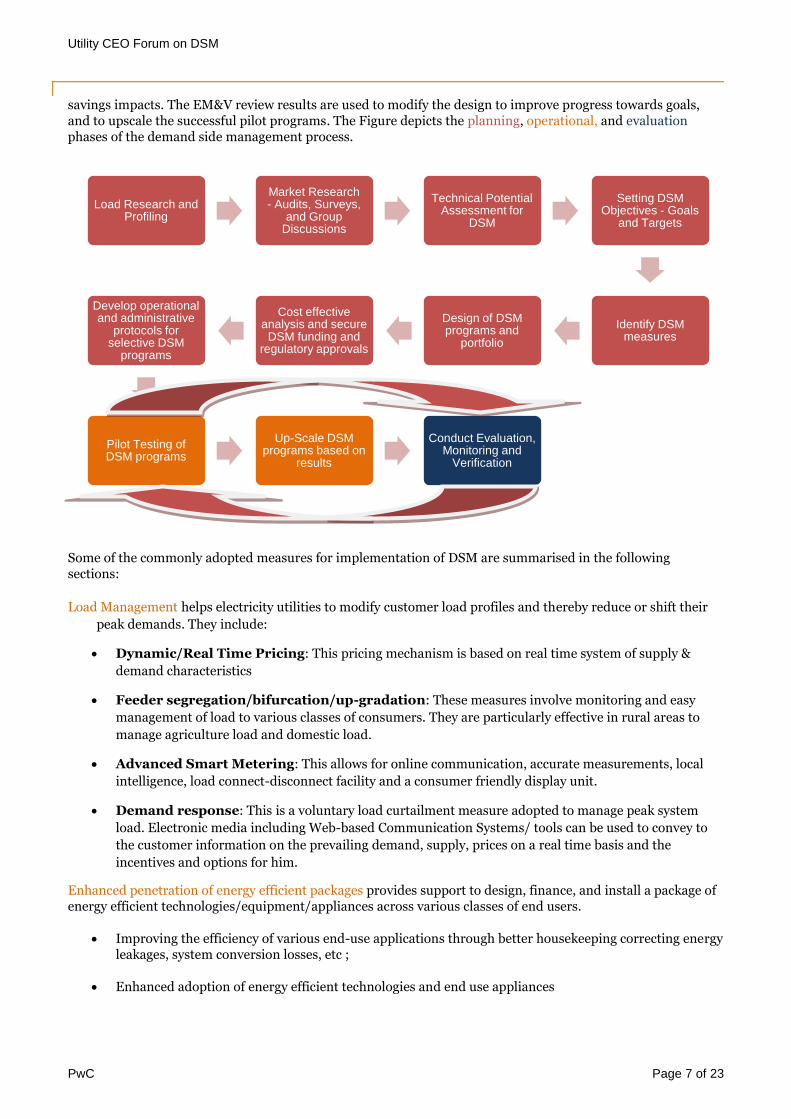
DSM Planning, Process and key Strategies In the DSM planning process, load research and profiling marks the beginning of strategising DSM interventions. Load research also guides the policy makers to set DSM objectives, goals and targets over a defined period of time. Broadly the DSM strategies can be categorised as Utility driven load management measures and energy efficient (EE) technology penetration. For EE technology penetration, the estimates of available demand side resources are obtained by conducting market research studies in potential end use segments to quantify the scale of achievable efficiency and demand savings under different economic and programmatic scenarios. If the decision is made to pursue any of the resources identified in a market potential study, the Utility in charge would design a pilot program, or more likely a portfolio consisting of multiple pilot programs, to reach the target customers and motivate them, usually with incentive payments and information campaigns, to install efficient and demand controlling equipment and strategies. In this phase, the Utilities would also complete all the regulatory approval processes by carrying out a comprehensive cost effectiveness assessment of the targeted pilot programs. Subsequent to the regulatory approvals, the Utilities develop operational and administrative protocols to guide the market participants to participate in these programs. After the pilot DSM initiative begins operations, a separate evaluation, measurement and verification (EM&V) review is launched to objectively assess how well it is meeting its stated goals, and to quantify the resulting
Utility CEO Forum on DSM
PwC Page 7 of 23
savings impacts. The EM&V review results are used to modify the design to improve progress towards goals, and to upscale the successful pilot programs. The Figure depicts the planning, operational, and evaluation phases of the demand side management process.
Some of the commonly adopted measures for implementation of DSM are summarised in the following sections:
Load Management helps electricity utilities to modify customer load profiles and thereby reduce or shift their
peak demands. They include:
Dynamic/Real Time Pricing: This pricing mechanism is based on real time system of supply &
demand characteristics
Feeder segregation/bifurcation/up-gradation: These measures involve monitoring and easy
management of load to various classes of consumers. They are particularly effective in rural areas to
manage agriculture load and domestic load.
Advanced Smart Metering: This allows for online communication, accurate measurements, local
intelligence, load connect-disconnect facility and a consumer friendly display unit.
Demand response: This is a voluntary load curtailment measure adopted to manage peak system
load. Electronic media including Web-based Communication Systems/ tools can be used to convey to
the customer information on the prevailing demand, supply, prices on a real time basis and the
incentives and options for him.
Enhanced penetration of energy efficient packages provides support to design, finance, and install a package of energy efficient technologies/equipment/appliances across various classes of end users.
Improving the efficiency of various end-use applications through better housekeeping correcting energy leakages, system conversion losses, etc ;
Enhanced adoption of energy efficient technologies and end use appliances
Load Research and Profiling
Market Research - Audits, Surveys,
and Group Discussions
Technical Potential Assessment for
DSM
Setting DSM Objectives - Goals
and Targets
Identify DSM measures
Design of DSM programs and
portfolio
Cost effective analysis and secure
DSM funding and regulatory approvals
Develop operational and administrative
protocols for selective DSM
programs
Pilot Testing of DSM programs
Up-Scale DSM programs based on
results
Conduct Evaluation, Monitoring and
Verification
Utility CEO Forum on DSM
PwC Page 8 of 23
Enhanced adoption of renewable energy systems, combined heat and power systems, independent power purchase, etc, that can bridge the demand-supply gap at the lowest possible cost.
Annexure -1 provides a snapshot of the widely recognised load management options and other DSM programs that adopt end use energy efficient appliances/equipments across various customer segments.
History and Evolution of DSM in India Globally, the DSM programs began modestly in the U.S. in 1970s, as a response to the growing concerns about dependence on foreign sources of oil and environmental consequences of electricity generation, especially nuclear power. The DSM programs grew rapidly during the late 1980s as state regulators in the U.S. provided incentives for utilities to pursue least-cost or integrated resource planning principles. Electric utility DSM programs reached their largest size in 1993, accounting for $2.7 billion of utility spending or about one percent of U.S. utility revenues1. After 1993, the peak year of utility spending on DSM according to the Energy Information Administration (EIA), electric utility spending on energy conservation and DSM started to decline as electricity markets were being restructured to introduce more competition, and expenditures on efficiency programs were reduced or eliminated as utilities sought to reduce costs. However the expenditure picked up in the last decade owing to rising energy prices and maturity of electricity markets.
In India it is very difficult to isolate the evolution of Utility DSM programs from that of the energy conservation and efficiency industry. Therefore the following sections provide a detailed account of the history of DSM in the context of the evolution of energy conservation in the country.
The Indian power distribution sector has been the bane of the Indian energy sector ever since the time of Independence, with demand exceeding supply and consequently resulting in severe peak demand deficits and energy shortages constantly in the economy. During the late 1980s, the all-India power deficit was about 7.9%2. However the benefits of energy conservation were recognised in the early 1980s, and the initial thrust to overcome the crippling energy scenario resulted from the strategy to promote energy conservation in energy intensive sectors by assessing the efficiency of energy use through energy audits, fixing specific energy consumption targets and evolving action plans for reducing the level of energy consumption per unit of production. In the mid 1980s, the government formed an energy conservation cell within the Department of Power, with the responsibilities for carrying out energy conservation activities3. The Department of Power was made the nodal point for facilitating the implementation of co-ordinated strategy on energy conservation. The strategy promoted energy-savings measures and technologies through demonstration projects, fiscal incentives and setting performance standards for electrical equipment. For example in 1983/84 a policy initiative allowed 100% depreciation for energy conservation devices in the first year of their installation. Apart from this some energy efficient technologies and equipment were exempted from customs and excise duty and soft loans were provided by financial institution for technology up-gradation. The other important elements of this strategy were undertaking studies to evaluate specific technical and policy options, training professionals to create a cadre of energy managers and auditors, and educating consumers through publicity campaigns to create mass awareness on the need and benefits of energy conservation (Nadel, Gopinath and Kothari, 1991).
One of the most recognised efforts towards institutionalisation of energy conservation came in 1989, with the Department of Power establishing the 'Energy Management Centre', an autonomous organisation, to assist in energy conservation programmes along with bilateral and multilateral assistance from ACEEE, World Bank, UNDP, EEC etc (Joshi and Chaturvedi, 1995).
The first major initiative, recorded and highlighted in the literature, by an Indian Utility towards energy conservation was in 1982, with the formation of an Energy Conservation Cell by the erstwhile Gujarat Electricity Board. The cell supported preliminary walk-through audits in over 150 industrial units (Lele and
1 Joseph Eto, "The Past, Present, and Future of U.S. Utility Demand-Side Management Programs", EETD, LBNL, University of California, 1996 2 Steven Nadel, S Gopinath, Virendra Kothari, "Opportunities for Improving End-Use Electricity Efficiency in India", A report of the Office of Energy and Infrastructure Bureau of Research and Development, United States Agency for International Development, 1991 3 Pradeep Chaturvedi, Shalini Joshi, "Strategy for energy Conservation in India", Rajeev Gandhi Institute for Contemporary studies and Institution of Engineers (India), 1995
Utility CEO Forum on DSM
PwC Page 9 of 23
Raval, 1990; Lele, 1991). This step kick started Utility driven DSM activities in India. Following this, many State Electricity Boards with funding from the Department of Power and the Rural Electrification Corporation promoted Rectification of electric pump sets in the late 1980s (Bhatnagar, 1991). The Rural Electrification Corporation (REC) provided financing to State Electricity Boards for rectification of electric pump sets in REC project areas under its Energy Conservation Program. During 1989/90, about 22,000 pump sets were rectified under this program (Nadel, Gopinath and Kothari, 1991). The Department of Power also funded REC to provide training and guidance regarding energy conservation in agricultural pump sets to officers and field level functionaries of State Electricity Boards, Agricultural Departments of State Governments, and banks (Nadel, Gopinath and Kothari, 1991). Information dissemination in the form of publications, brochures, posters, stickers and other publicity to create mass awareness or the need for and benefits of energy conservation were carried out by many government departments and organizations such as the Department of Power, Energy Management Centre, Petroleum Conservation Research Association, Department of Coal, State Electricity Boards, industry associations, and private organizations (Nadel, Gopinath and Kothari, 1991).
In the 1990s, there were three major attempts at utility DSM programs in India, and only one of them was fully operational. The first and largest of these programs, at Ahmadabad Electric Company (AEC), had produced many surprises, and lessons applicable for private, profit-making utilities anywhere in the globe4. This was also the first Utility driven DSM program in India established at the nation’s largest private electric utility company–Ahmadabad Electric Company (AEC) in Ahmadabad, India (population 3 million). The evolution of this DSM program at AEC was comprised of four phases—(1) feasibility research, (2) initial testing and program design, (3) pilot programs and (4) full-scale program roll-out. Each of these phases was characterized by a significant learning process and surprises for both the American consultants involved in the program and Indian administrators (Glen Weisbrod, Mark Tribble and Vijay Deshpande, 1998).
Beyond the AEC program, there have been only three other DSM programs in India in the 1990s, one by the Orissa SEB, one by the Haryana SEB and another by the GRIDCO, which was a Private-owned utility responsible for electricity transmission throughout the state of Orissa. As per the literature, until 1998, both Orissa and Haryana SEB programs involved World Bank funding and were still in the planning stages (Glen Weisbrod, Mark Tribble and Vijay Deshpande, 1998). Whereas, the DSM program by GRIDCO was active during 1997-98 and resulted in significant savings. However, the involvement of GRIDCO in this initiative was only limited to a negotiated stand-by charge5.
The beginning of 21st century marked a phenomenal step towards establishing a legislative framework for energy conservation in India with the introduction of energy conservation act in 2001. This act also led to the inception of Bureau of Energy Efficiency (BEE) as a principal nodal agency for energy conservation in the country. The erstwhile Energy Management Centre was merged with BEE subsequently. This was followed by notification of state level nodal agencies for energy conservation that further strengthened the institutional framework for energy conservation in the country. In this scenario of unprecedented governance, the bilateral and multilateral assistance accelerated into the country that kick started many innovative models of energy efficiency including the Utility driven DSM programs.
During the Tenth Five year plan (2002-07), with the help of foreign assistance and guidance under BEE, several pilot DSM programs were undertaken by state owned and private sector Utilities. Some of the prominent ones included BESCOM (The Bangalore electricity supply company) of Karnataka, Reliance Mumbai (a private Utility in Mumbai circle), and MSEDCL (a state owned utility of Maharashtra). The primary areas of these pilot programs were lighting, rural load management, Smart Metering, DSM awareness, and agriculture pumping. During this period, the BEE promoted Utility sponsored DSM by reforming the electricity tariff policy with the help of Forum of Regulators (FOR). Following this several Utilities under the directions of state regulatory commissions introduced Time of day tariffs, power factor improvement incentives and load factor incentives in their tariff structures. This marked the beginning of Utility sponsored DSM programs in India at a wider scale. Many of these incentives are active even today. Another prominent Utility sponsored DSM program initiated during the Tenth plan is the Rural feeder segregation. This program was supported by soft loans and incentives
4 Glen Weisbrod, Mark Tribble and Vijay Deshpande, "Learning from India - Defining Profitable DSM and ESCO Programs for a Utility", National Energy Services Conference in 1998 and Electricity Journal 1998.
5 "DSM Best practices Guidebook", ECO II, IIEC, 2006-07
Utility CEO Forum on DSM
PwC Page 10 of 23
under the APDRP scheme of the Ministry of Power, targeted to strengthen the electricity distribution infrastructure in the country. Utilities have gained significant savings via cost effective load management by virtue of rural feeder segregation. This program has continued into the eleventh plan also under the restructured APRDRP scheme.
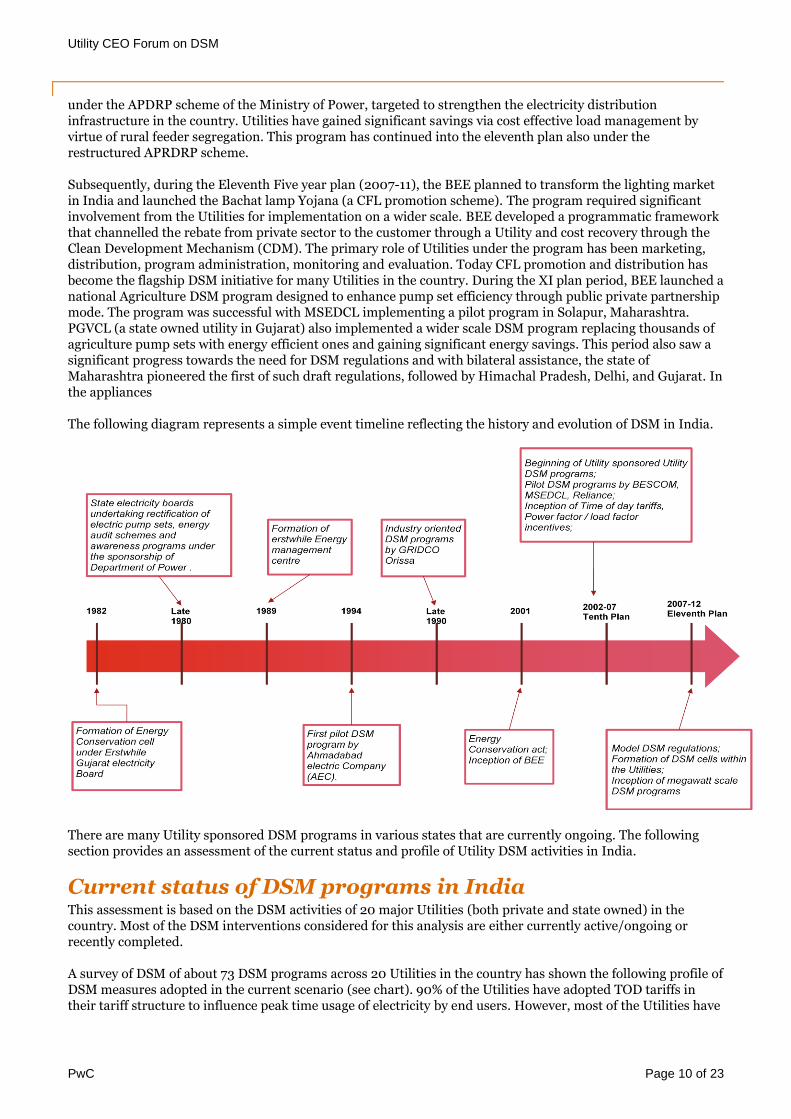
Subsequently, during the Eleventh Five year plan (2007-11), the BEE planned to transform the lighting market in India and launched the Bachat lamp Yojana (a CFL promotion scheme). The program required significant involvement from the Utilities for implementation on a wider scale. BEE developed a programmatic framework that channelled the rebate from private sector to the customer through a Utility and cost recovery through the Clean Development Mechanism (CDM). The primary role of Utilities under the program has been marketing, distribution, program administration, monitoring and evaluation. Today CFL promotion and distribution has become the flagship DSM initiative for many Utilities in the country. During the XI plan period, BEE launched a national Agriculture DSM program designed to enhance pump set efficiency through public private partnership mode. The program was successful with MSEDCL implementing a pilot program in Solapur, Maharashtra. PGVCL (a state owned utility in Gujarat) also implemented a wider scale DSM program replacing thousands of agriculture pump sets with energy efficient ones and gaining significant energy savings. This period also saw a significant progress towards the need for DSM regulations and with bilateral assistance, the state of Maharashtra pioneered the first of such draft regulations, followed by Himachal Pradesh, Delhi, and Gujarat. In the appliances
The following diagram represents a simple event timeline reflecting the history and evolution of DSM in India.
There are many Utility sponsored DSM programs in various states that are currently ongoing. The following section provides an assessment of the current status and profile of Utility DSM activities in India.
Current status of DSM programs in India This assessment is based on the DSM activities of 20 major Utilities (both private and state owned) in the country. Most of the DSM interventions considered for this analysis are either currently active/ongoing or recently completed.
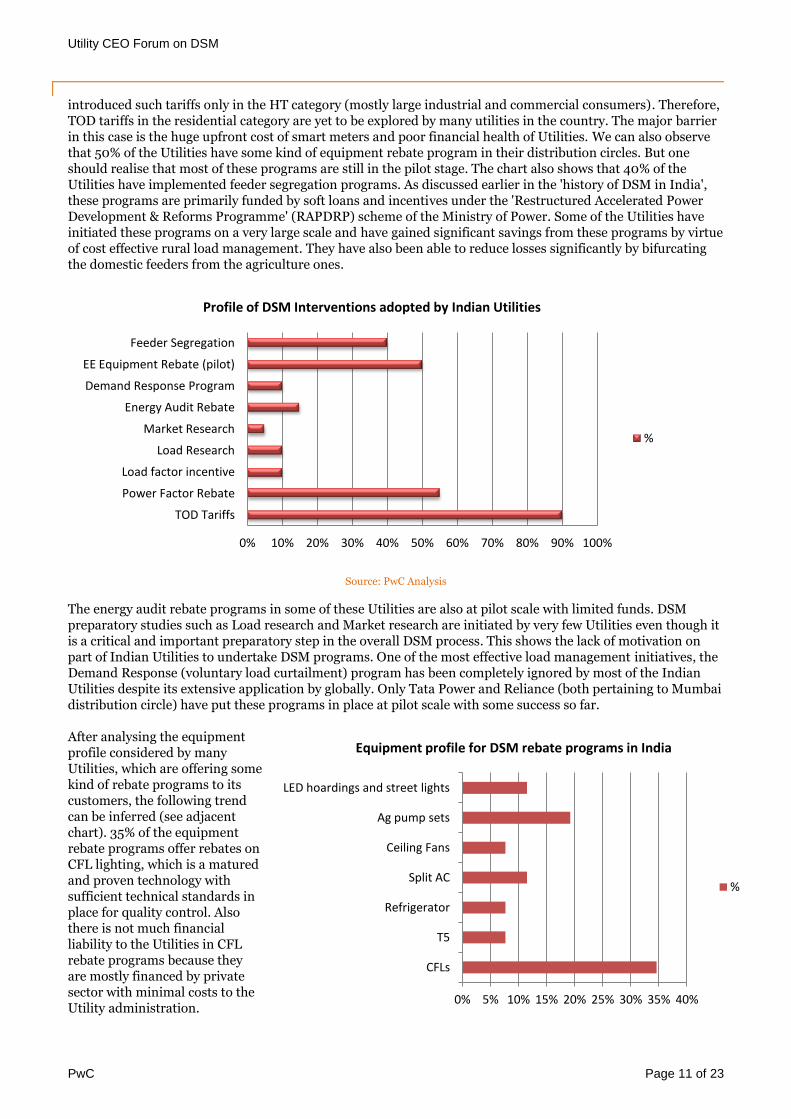
A survey of DSM of about 73 DSM programs across 20 Utilities in the country has shown the following profile of DSM measures adopted in the current scenario (see chart). 90% of the Utilities have adopted TOD tariffs in their tariff structure to influence peak time usage of electricity by end users. However, most of the Utilities have
Utility CEO Forum on DSM
PwC Page 11 of 23
introduced such tariffs only in the HT category (mostly large industrial and commercial consumers). Therefore, TOD tariffs in the residential category are yet to be explored by many utilities in the country. The major barrier in this case is the huge upfront cost of smart meters and poor financial health of Utilities. We can also observe that 50% of the Utilities have some kind of equipment rebate program in their distribution circles. But one should realise that most of these programs are still in the pilot stage. The chart also shows that 40% of the Utilities have implemented feeder segregation programs. As discussed earlier in the 'history of DSM in India', these programs are primarily funded by soft loans and incentives under the 'Restructured Accelerated Power Development & Reforms Programme' (RAPDRP) scheme of the Ministry of Power. Some of the Utilities have initiated these programs on a very large scale and have gained significant savings from these programs by virtue of cost effective rural load management. They have also been able to reduce losses significantly by bifurcating the domestic feeders from the agriculture ones.
Source: PwC Analysis
The energy audit rebate programs in some of these Utilities are also at pilot scale with limited funds. DSM preparatory studies such as Load research and Market research are initiated by very few Utilities even though it is a critical and important preparatory step in the overall DSM process. This shows the lack of motivation on part of Indian Utilities to undertake DSM programs. One of the most effective load management initiatives, the Demand Response (voluntary load curtailment) program has been completely ignored by most of the Indian Utilities despite its extensive application by globally. Only Tata Power and Reliance (both pertaining to Mumbai distribution circle) have put these programs in place at pilot scale with some success so far.
After analysing the equipment profile considered by many Utilities, which are offering some kind of rebate programs to its customers, the following trend can be inferred (see adjacent chart). 35% of the equipment rebate programs offer rebates on CFL lighting, which is a matured and proven technology with sufficient technical standards in place for quality control. Also there is not much financial liability to the Utilities in CFL rebate programs because they are mostly financed by private sector with minimal costs to the Utility administration.
0% 10% 20% 30% 40% 50% 60% 70% 80% 90% 100%
TOD Tariffs
Power Factor Rebate
Load factor incentive
Load Research
Market Research
Energy Audit Rebate
Demand Response Program
EE Equipment Rebate (pilot)
Feeder Segregation
Profile of DSM Interventions adopted by Indian Utilities
%
Source: PwC Analysis 0% 5% 10% 15% 20% 25% 30% 35% 40%
CFLs
T5
Refrigerator
Split AC
Ceiling Fans
Ag pump sets
LED hoardings and street lights
Equipment profile for DSM rebate programs in India
%
Utility CEO Forum on DSM
PwC Page 12 of 23
Agriculture pump sets are the Major equipment targeted by Indian Utilities since the 1980s. Power distribution to agriculture pumping sector is crippled with huge losses and poor quality in most parts of the country. Enhanced end use efficiency in this segment results in direct benefits to the Utility finances and the state exchequer. However only few Utilities (Eg: PGVCL, BESCOM and MSEDCL) in the country have made visible strides in this segment. MSEDCL, the state owned Utility in Maharashtra, has successfully replaced about 2000 pump sets by leveraging private sector financing through the use of ESCO model (or commonly called performance contracting). However, there is enormous potential in this segment yet to be tapped by the Indian Utilities.
Beyond CFLs and Ag pump sets, few Utilities have sponsored rebate programs for other potential appliances/equipment in the household, commercial & Industrial sectors. Only Tata Power and Reliance (in Mumbai and Delhi circles) have some kind of pilot rebate programs in place for equipment like T5 lamps, Ceiling fans, refrigerators, and split ACs. One utility has experimented with LED street lights and hoardings in West Bengal. One can clearly infer that many Utilities have failed to tap the enormous potential existing in the residential appliances segment, which can directly impact the Utilities' peak power problems. There is also significant potential for rebate programs for standardised Industrial equipment.
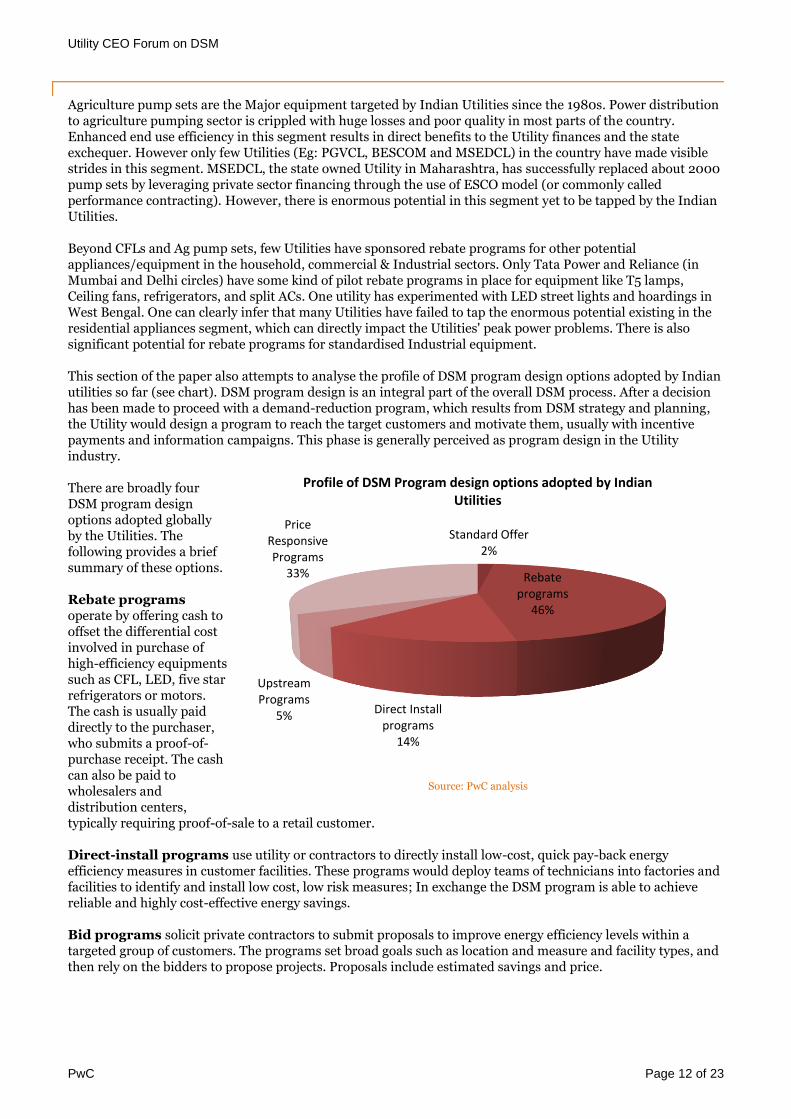
This section of the paper also attempts to analyse the profile of DSM program design options adopted by Indian utilities so far (see chart). DSM program design is an integral part of the overall DSM process. After a decision has been made to proceed with a demand-reduction program, which results from DSM strategy and planning, the Utility would design a program to reach the target customers and motivate them, usually with incentive payments and information campaigns. This phase is generally perceived as program design in the Utility industry.
There are broadly four DSM program design options adopted globally by the Utilities. The following provides a brief summary of these options.
Rebate programs operate by offering cash to offset the differential cost involved in purchase of high-efficiency equipments such as CFL, LED, five star refrigerators or motors. The cash is usually paid directly to the purchaser, who submits a proof-of-purchase receipt. The cash can also be paid to wholesalers and distribution centers, typically requiring proof-of-sale to a retail customer.
Direct-install programs use utility or contractors to directly install low-cost, quick pay-back energy efficiency measures in customer facilities. These programs would deploy teams of technicians into factories and facilities to identify and install low cost, low risk measures; In exchange the DSM program is able to achieve reliable and highly cost-effective energy savings.
Bid programs solicit private contractors to submit proposals to improve energy efficiency levels within a targeted group of customers. The programs set broad goals such as location and measure and facility types, and then rely on the bidders to propose projects. Proposals include estimated savings and price.
Standard Offer 2%
Rebate programs
46%
Direct Install programs
14%
Upstream Programs
5%
Price Responsive Programs
33%
Profile of DSM Program design options adopted by Indian Utilities
Source: PwC analysis
Utility CEO Forum on DSM
PwC Page 13 of 23
Standard offer programs offer to purchase energy savings from a list of pre-approved measures at a fixed price for each avoided kWh or thermal energy. Contractors and facility owners can develop projects that conform to any program requirements that are itemized in the offer. The offer price can vary by measure type, region, size of project, or any other parameter that helps to improve the program’s potential to succeed. Standard offer programs can also accept custom measures not on the pre-approved list; project developers submit a description of the measure with estimated savings and costs, and the program manager calculates an offer price unique to the proposal.
Price responsive Programs are Programs involving demand response to price signals. They fall into one of two categories:
Load curtailment programs that pay the customer for reducing peak load during critical times
Dynamic pricing programs that give customers an incentive to lower peak loads in order to reduce their electricity bills.
Upstream Programs are DSM preparatory studies that involve load research, market research and DSM potential assessment.
One can observe that about 46% of the DSM programs are rebate programs. This is primarily because of the equipment rebate programs adopted by the utilities. Standard offer programs comprise only 2% as it requires an initial investment by private sector or the end user. The rural feeder segregation is the only direct install program implemented by the Utilities. The price responsive programs comprise 33% because many utilities have some kind of TOD tariffs/incentives for the HT consumers. The Upstream programs are only 5% as very few Utilities have carried out the load/market research studies to understand the overall load profile.
Barriers for Advancing Megawatt scale DSM programs in India From the assessment of the current status of Utility DSM programs in India (previous section) it is observed that most of the programs existing till date (negating TOD, and power factor incentives) have remained largely in form of pilot projects and are not scaled up for larger masses. Moreover, these schemes have been largely limited to the lighting segment and the experience has not been utilised to develop programmes for other segments or sectors. Review of these programmes has also revealed that most of the programs are not derived from proper load research and post evaluation of these programmes is largely missing.
The barriers to energy efficiency have been extensively discussed from the market transformation perspective by experts (both national and international) in the industry. However, this paper attempts to identify barriers within the context of resource acquisition through Utility sponsored DSM programs. Therefore the barriers identified in this paper pertain to factors internal or external to Indian Utilities affecting their operations and survival. The following sections highlight some of the key barriers to megawatt scale DSM programs.
Uncertainty pertaining to the benefits of Utility DSM programs
Recently a private Utility based in India presented the 'Emerging trends in DSM' during the national conference on DSM held in January, 2012. This Utility clearly stated that the return on investment (ROI) against any DSM program is possible if and only if there is peak load reduction. This utility also stated that there are many schemes where consumer will have attractive ROI but DISCOM will be in loss, a scenario reflecting a Reduction of load during non peak hours. Another challenging scenario presented was the 'surplus energy'. It was stated that in such scenarios the ROI for DSM is very uncertain.
All these apprehensions may belong to a single private Utility and may not reflect the views and opinions of other Utilities in the country. However it is important to discuss these factors in the context of a transforming power distribution business in India. The important question to be addressed in this regard is 'whether only DSM programs that focus on peak power reduction fetch benefits or can other programs also do the same?' The key parameters that determine the net benefits of DSM are the marginal cost of power and the tariff realisation
Utility CEO Forum on DSM
PwC Page 14 of 23
from sale of power. Lack of comprehensive load research studies is another critical barrier contributing to this uncertainty.
Many state commissions and the Utilities are still uncertain about the benefits of DSM. The Utilities may fail to establish that the reduction in marginal power purchase expenses (during the true up of ARR) is derived from DSM activities. This is due to the uncertainty and volatility in demand, fuel costs, load shedding schedules etc. In this scenario of uncertainty it becomes very difficult for the Utilities and the state commissions to monitor and verify the savings resulting from the DSM programs.
Lack of adequate regulations on load shedding
Extensive Load shedding has become an acceptable standard in today's scenario of power supply in India. Several states (especially in the southern region) are experiencing load shedding up to 5000 MW during certain months of the year6. Load shedding is also the least cost alternative in the country to bridge supply demand gaps in the system. The willingness to shed load in the events of challenging supply scenarios may be perceived as the biggest barrier for DSM in India.
Lack of regulations on DSM implementation and cost recovery mechanisms
The Indian electricity sector has transitioned from a vertically-integrated, public-owned, and unregulated business to an unbundled, public- and private-owned, and regulated business. The shift in the decision-making structure, the increasing transparency, and consequently, public accountability in a period of chronic power shortages is hampering both state commissions and utilities to focus on DSM in a systematic manner. The Model DSM regulations, 2010, by FOR provides an implementation framework for Utility DSM programs, and also allows the Utilities to recover DSM expenses either through tariffs or any other recovery mechanisms. However, they are not effective unless the state commissions adopt those guidelines and notify appropriate regulations at the state level. Till date, very few states in the country (Maharashtra, Delhi, Gujarat and Himachal Pradesh) have notified DSM regulations, detailing the DSM implementation framework and cost recovery mechanisms.
Lack of skilled manpower and institutionalisation
Almost all utilities across India are facing several other serious issues such as shortages of supply, transmission and distribution losses, theft, and others that carry a higher priority for the utility management than DSM. Although the model DSM regulations of FOR in 2010 has clearly stated the requirement of separate DSM cells within the Utilities with essential authority, these regulations are not binding unless the state commissions adopts them with necessary provisions. Today, even the Utilities that have already established 'DSM cell' have them significantly understaffed. Therefore many Utilities in the state do not have essential capacity to plan, design and implement megawatt scale DSM programs. Without separate DSM cells, this situation will only worsen.
Also there is a lack of understanding and expertise regarding DSM among the Utility staff and a serious lack of high quality manpower in the Utilities, who can understand the intricacies in DSM measures and investments. This can be overcome by capacity building exercises and training of relevant Utility staff within the DSM cell. Another critical barrier normally ignored at this stage is the sustenance of the built capacity of the DSM cell staff. There should also be some mechanisms to retain or transfer the built capacity to new employees, joining the cell or replacing the cell staff. The transfer policies within the utility must incorporate such provisions for retaining the built capacity.
Lack of DSM policy framework
There are no specific provisions related to Utility driven DSM program implementation in either the Energy Conservation Act of 2001 or the Electricity Act of 2003 pertaining to the electricity sector. Also, the National Electricity Policy, a statutory policy under the EA does not provide any clear guidance on any institutional
6 CEA Monthly reports on Power cuts, 2012
Utility CEO Forum on DSM
PwC Page 15 of 23
framework for implementing Utility sponsored DSM. This can create a challenging scenario to the state commissions to interpret the relevant laws and create strong binding regulations on DSM.
Generally, the utilities are not opposed to DSM, but they tend to be risk averse. Therefore, they are often reluctant to propose and design DSM programs on their own that could fail and force the utility to shoulder the financial consequences. However, utilities appear to be quite willing to implement DSM programs that have been already been designed, approved by some higher authority/agency or policy maker, and in which they have no or minimal perceived risk.
Poor Financial health of Utilities
Ever since the Independence, the Indian Electric Utilities have undergone a deteriorating financial health and have been unable to finance any capital intensive programs including DSM. The situation in today's scenarios is also the same except for a few private ones operating in Maharashtra, Gujarat and Delhi. As per the report published by Power Finance Corporation (PFC), during the year 2009-10, the utilities incurred combined losses of Rs.635 billion (without accounting for subsidy) (PFC, 2011).
Deteriorating financial condition and resources is another major reason that inhibits utilities to experiment with DSM and instead focus on only improving supply system and augmentation of new capacities. In such conditions, the financial institutions in the country may also perceive greater risk in lending commercial loans to large scale DSM programs, which are relatively risky and posed with regulatory hurdles.
Apart from this, in many states there is only one distribution utility and that is public-owned while in other states the largest distribution utility is also, usually, public owned. Unlike private utilities that today serve only a few urban areas, the public utilities serve large masses and are less likely to be proactive in addressing their deficits as they are essentially operating in a not-for-profit mode.
Factors overcoming mega watt scale DSM barriers Given the magnitude of barriers for advancing DSM in the country, a coordinated effort should be put in place to monitor and quantify the parameters, driving the benefits of DSM, via regulatory framework. This would help the utilities to assess the benefits of DSM programs in a more transparent manner. Technical assistance for conducting detailed load research studies should be made available to all the Utilities in the country. This will allow the utilities to strategically plan for the right interventions and achieve the desired objectives. With regard to the poor financial health of the Utilities, the government has recently restructured the SEB loans bailing out a portion of senior debt with the public sector banks in the country. This may open up opportunities for commercial loans for funding DSM resource acquisition. The utilities must also be provided with specific regulations for overall implementation framework of DSM programs and cost recovery to safeguard themselves from the regulatory risks. There have to be strict regulations and laws that require Utilities to improve reliability by avoiding load shedding.DSM should be proposed as a suitable alternative to achieve this. The regulations must define the ―loading order‖, which should be binding upon the Utilities, to specify/prioritise the order of resource alternatives to meet its energy needs under conditions of demand supply mismatch. The 'Loading Order' should specify that the Utilities may first invest in energy efficiency and demand-side resources before considering other alternatives during the periods of demand supply mismatch. Finally the DSM cells within the Utilities must be empowered with adequate resources and authority to plan and implement megawatt scale DSM programs.
Examples of Best Practices in advancing Utility sponsored DSM Investments
California Energy Efficiency Policy Energy Efficiency and Demand Response have been the first priority in California's 'loading order' for energy resources since 2003. The California Public Utilities Commission (CPUC) and the California Energy Commission (CEC), in 2003, came together to develop one high-level, coherent approach to meeting California’s electricity and natural gas needs. As an outcome of this unprecedented approach, the 'Energy Action Plan, 2003' was published that defined California state's broad energy policy. In this policy document, the ―loading order‖ established that the state, in meeting its energy needs, would invest first in energy efficiency
Utility CEO Forum on DSM
PwC Page 16 of 23
and demand-side resources, followed by renewable resources, and only then in clean conventional electricity supply. As a result of this unambiguous policy, the California Public Utilities Code, which is the California state law for operation of utilities, had amended Section 454.5(b)(9)(C), that required all Utilities in California to first meet their ―unmet resource needs through all available energy efficiency and demand reduction resources that are cost effective, reliable, and feasible.7‖
Subsequently, in 2005, the CPUC, which regulates the Investor owned Utilities' (IOUs') energy efficiency programs in California, approved 2 billion$ ratepayer funded energy efficiency investments by the Utilities for 2006-08 cycle8. For the 2009 bridge funding period another 786 million$ investments were approved9. Further in 2010-12 cycle, the CPUC approved another 3.1 billion$ investment portfolio. These energy efficiency programs have reported savings of 1069 MW and 5736 GWh for 2010-12 cycle and 6000GWh and 1175 MW savings for 2006-08 cycle10. These programs and related energy savings are a key component of California's broader energy policies and CPUC's coordinated efforts with the IOUs.
Regulatory Framework for DSM by MERC In 2010, Maharashtra Electricity Regulatory Commission had successfully interpreted the EA to allow for promotion of utility-implemented and rate-payer-funded DSM activities. MERC was the first state regulator to notify regulations on 'DSM implementation framework' and 'Cost effectiveness of DSM measures and Programs' in India. Many other states like Himachal Pradesh, Delhi, and Gujarat have followed only recently.
The basic principles of MERC regulations on DSM Implementation framework enables every Distribution Licensee in its Jurisdiction, to make DSM an integral part of day-to-day operations, and undertake planning, designing and implementation of appropriate DSM programmes on a sustained basis. It also allows Distribution Licensees to recover all justifiable costs incurred by them in any DSM related activity, including planning, designing, implementing, monitoring and evaluating DSM programmes, by adding these costs to their Annual Revenue Requirement to enable their funding through tariff or by implementing programmes at the Consumers’ premises that would attract appropriate Return on Investment.
The regulations on DSM Implementation framework primarily guide Utilities in the following aspects of the overall DSM process:
DSM Programmes Eligibility Criteria
Development and Submission of DSM Portfolio and Plans
Role of DSM Consultation Committee (DSM-CC)
Responsibilities of the Distribution Licensees Related to DSM Planning and Implementation
DSM Funding
DSM Programme, Portfolio and Annual Work plan and its approval Process
Evaluation, Measurement & Verification (EM&V)
Monitoring & Reporting
Methodology for Selection of DSM Programmes to be Included in the DSM Plan
Selection Criteria for other Programmes to be included in the Plan The regulations on Cost Effectiveness provide guidance to the utilities in Maharashtra for assessing the cost effectiveness of the DSM programmes and to reduce the uncertainty faced by utilities in regulatory approval, as well as to reduce the regulatory burden while scrutinising DSM programme proposal from the utilities. They provide a consistent set of methods for cost-benefit assessment of DSM measures and programme to be followed by the licensees in the State and thereby provide transparency to the regulatory process of DSM programme appraisal and approval. Cost effective tests are proposed from four different perspectives i.e. Utility’s perspective, Participants/consumers perspective, Total resource cost perspective, and the Societal perspective.
7 2008 Update, Energy action Plan, State of California 8 'Aligning Utility Incentives with Investment in Energy Efficiency', US EPA, November, 2007 9 'Energy Efficiency Evaluation Report for the 2009 Bridge Funding Period', CPUC, 2011 10 '2010 – 2011 Energy Efficiency Annual Progress Evaluation Report', CPUC, 2012
Utility CEO Forum on DSM
PwC Page 17 of 23
DSM Action Plan for Tamil Nadu In order to realize the energy efficiency potential, and upscale the implementation of DSM programmes by utility, load research should be the starting point. One of the key objectives of load research is to understand and analyse the utility’s load profile. In this regard, a study was carried out by TERI for the state of Tamil Nadu with financial support from the Shakti Sustainable Energy Foundation. TANGEDCO, the state owned distribution Utility, was a key stakeholder in this study.
TANGEDCO adopted ―top-down‖ approach to understand its load profile by starting from the total system load shape and breaking it down to customer end-use. The demand pattern for the entire state over the day and during different seasons was captured from the hourly load data recorded by the state load dispatch centre (SLDC). Further to understand consumer category-wise load behaviour, detailed analysis of load data for the predominant consumer feeders was undertaken. A sampling approach was adopted to select the predominant feeders from the entire state. Both the overall state load curve and consumer category wise load curves were analysed to identify potential strategies for DSM Based on the findings of the load research study the following key elements were proposed as part of the DSM action plan:
Promotion of energy efficient appliances
Promotion of energy efficiency in new commercial buildings
State-wide education and awareness campaign for energy conservation
Improvement in process and operational efficiency in the industrial sector
Public procurement of energy efficient appliances
Feeder segregation
Strategic utilization of energy conservation fund and DSM fund approved by the regulator
Regulatory measures for promoting DSM
Strengthening of SDA Finally a roadmap was provided for initiating each of the above mentioned DSM strategies. The recommendations expected that implementation of this action plan would accelerate DSM activities in the state and also provide market signals to private investors and encourage Energy Service Companies (ESCOs) to support the energy efficiency market.
DSM Funding through Eskom IDM program in South Africa Eskom is a state owned Utility with a mandate to generate and supply electricity in South Africa. The state of the electricity system in South Africa in itself is one of the major drivers for energy efficiency services. In 2002, Eskom had formally established a DSM fund approved by the country's regulator. The DSM funding is now more commonly known as Integrated Demand Management (IDM). Eskom has established an IDM division, which is dedicated to ensuring short-term security of electricity supply through coordinating and consolidating the various initiatives aimed at optimising energy use and bridging the demand supply gap. A key aspect of this IDM programme is the promotion and implementation of energy-efficient technologies, processes and behaviours amongst all consumers. IDM’s role is to ensure single ownership of demand side management strategies, objectives and operations throughout Eskom. Eskom adopted a market-driven approach to understanding and meeting consumer requirements and provided a platform from which Eskom can collaborate with government, external stakeholders and consumers.
Eskom is the largest funder for energy efficiency initiatives through its IDM funding initiatives and programs. In an effort to enable industrial customers to reduce their energy consumption, Eskom has designed six funding models.
The rebate model is structured around paying consumers an incentive for converting their inefficient technologies to energy saving solutions, provided the suppliers are registered on the programme.
The Standard Product is for customers with a potential load saving of between 1kW to 250kW.
The Standard Offer is for customers with a potential load saving of 50kW to 5MW. This model was developed to streamline the project approval process and time frame and to facilitate a quicker payment process.
The ESCO funding process is for Energy Services Companies (ESCO) which are specialists in energy efficiency, and who submit projects with a potential load saving of 100kW or more.
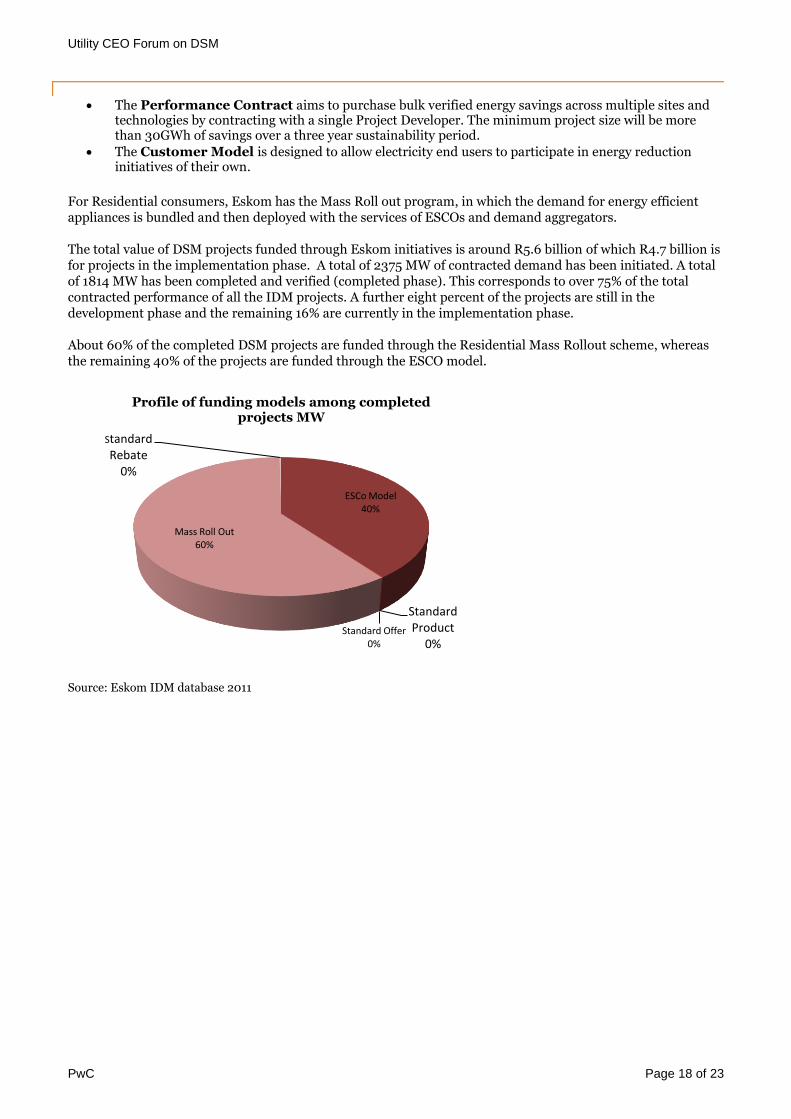
Utility CEO Forum on DSM
PwC Page 18 of 23
The Performance Contract aims to purchase bulk verified energy savings across multiple sites and technologies by contracting with a single Project Developer. The minimum project size will be more than 30GWh of savings over a three year sustainability period.
The Customer Model is designed to allow electricity end users to participate in energy reduction initiatives of their own.
For Residential consumers, Eskom has the Mass Roll out program, in which the demand for energy efficient appliances is bundled and then deployed with the services of ESCOs and demand aggregators.
The total value of DSM projects funded through Eskom initiatives is around R5.6 billion of which R4.7 billion is for projects in the implementation phase. A total of 2375 MW of contracted demand has been initiated. A total of 1814 MW has been completed and verified (completed phase). This corresponds to over 75% of the total contracted performance of all the IDM projects. A further eight percent of the projects are still in the development phase and the remaining 16% are currently in the implementation phase.
About 60% of the completed DSM projects are funded through the Residential Mass Rollout scheme, whereas the remaining 40% of the projects are funded through the ESCO model.
Source: Eskom IDM database 2011
ESCo Model 40%
Standard Product
0% Standard Offer
0%
Mass Roll Out 60%
Standard Rebate
0%
Profile of funding models among completed projects MW
Utility CEO Forum on DSM
PwC Page 19 of 23
Conclusion In spite of several efforts towards promoting DSM in India, there is very little application of this innovative concept in the light of the enormous untapped potential that exists. The Indian Utilities have failed to take off DSM measures on a large (megawatt) scale. Clearly the barriers are manifold. The Ministry of Power recently restructured the SEB loans providing opportunities for fresh investments focused towards bridging the supply demand gap and improved operational efficiency. This is a positive step towards adopting DSM resources for meeting the growing demand. However there are several other barriers derailing the progress of DSM resource acquisition by Indian Utilities.
This situation demands for increased interaction among the Chief Executive Officers (CEOs) and Senior Management of distribution utilities in India in order to identify and advance solutions driven dialogue among the stakeholders. Many Utilities in India especially in the state of Maharashtra, Gujarat, Delhi and Karnataka have performed relatively better as compared to other states. In this regard knowledge and experience sharing could generate fresh program ideas and thoughts. This will eventually pave the way for accelerated implementation of megawatt scale DSM activities in the country.
The interaction among the CEOs of Utilities could focus on the following topics:
Factors contributing to the success of megawatt scale DSM programs by overcoming/circumventing the existing barriers
Role of DSM cells in the overall process of DSM - Essential Authority and Resources
DSM policy and regulations required to facilitate megawatt scale DSM programs
Tools and Resources for administering megawatt scale DSM programs over specified time frame
The CEO interactions on above mentioned topics would be converted to appropriate Tools and Resources that could assist all the Utilities in the country towards administering mega watt scale DSM programs. This could also be a blueprint for administering DSM programs in India. The interactions could also provide significant inputs to provide appropriate policy recommendations to the senior policy makers in the country.
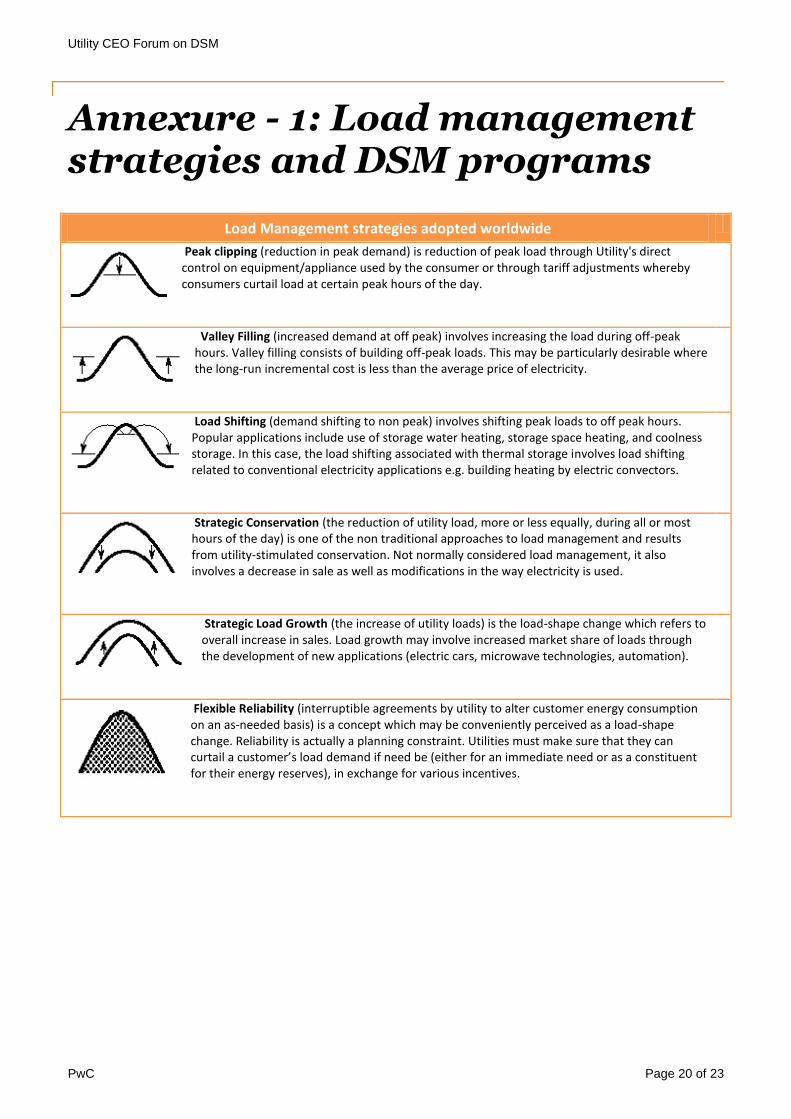
Utility CEO Forum on DSM
PwC Page 20 of 23
Annexure - 1: Load management strategies and DSM programs
Load Management strategies adopted worldwide
Peak clipping (reduction in peak demand) is reduction of peak load through Utility's direct control on equipment/appliance used by the consumer or through tariff adjustments whereby consumers curtail load at certain peak hours of the day.
Valley Filling (increased demand at off peak) involves increasing the load during off-peak hours. Valley filling consists of building off-peak loads. This may be particularly desirable where the long-run incremental cost is less than the average price of electricity.
Load Shifting (demand shifting to non peak) involves shifting peak loads to off peak hours. Popular applications include use of storage water heating, storage space heating, and coolness storage. In this case, the load shifting associated with thermal storage involves load shifting related to conventional electricity applications e.g. building heating by electric convectors.
Strategic Conservation (the reduction of utility load, more or less equally, during all or most hours of the day) is one of the non traditional approaches to load management and results from utility-stimulated conservation. Not normally considered load management, it also involves a decrease in sale as well as modifications in the way electricity is used.
Strategic Load Growth (the increase of utility loads) is the load-shape change which refers to overall increase in sales. Load growth may involve increased market share of loads through the development of new applications (electric cars, microwave technologies, automation).
Flexible Reliability (interruptible agreements by utility to alter customer energy consumption on an as-needed basis) is a concept which may be conveniently perceived as a load-shape change. Reliability is actually a planning constraint. Utilities must make sure that they can curtail a customer’s load demand if need be (either for an immediate need or as a constituent for their energy reserves), in exchange for various incentives.

Utility CEO Forum on DSM
PwC Page 21 of 23
Description of DSM Programs
Residential Programs
Refrigeration Provide incentives (rebates) for the purchase of a higher than standard efficiency refrigerator or provide services for the removal, disposal & recycling of an operating second refrigerator or freezer
Air Conditioning/ Space Heating
Designed to increase the likelihood of purchasing more efficient air conditioners, increasing the market penetration of heat pumps, providing incentives for installing direct load control devices on air conditioners, or providing incentives to improve home insulation
Lighting Offer incentives (rebates) to purchase compact fluorescent lights and replace standard incandescent bulbs and fixtures
Water Heating Programs
Designed to offer:
Rebates/Incentives to install Solar water heaters
Rebates to install jackets and low-flow, shower heads or high efficiency water heaters
Direct load control of water heaters
Water heating storage for load shifting
Comprehensive Building
Offer technical and financial assistance to builders and architects to incorporate energy efficient technologies into new building construction, energy audits to customers and incentives to incorporate energy saving technologies recommended
Time of Day Rates Offer time of day pricing to encourage residential customers to shift usage to off-peak periods
Commercial Programs
Refrigeration Provide an incentive to replace existing compressors and motors with high efficiency models
Commercial Heat/ Vent/ AC
Offer incentives:
To replace existing fan and pump motors with high efficiency units
For installing commercial office building and retail building cool storage systems
To install office building economiser controls
Lighting Offer incentives (rebates) to upgrade existing fluorescent bulbs and fixtures with high efficiency lights and electronic ballast
Comprehensive Building
Offer:
Time of day rates
Technical and financial assistance to builders and architects to incorporate energy efficient technologies into new building construction
Energy audits to customers and incentives to incorporate energy saving technologies recommended
Stand-by Generator
Provide an incentive to customers to use stand by generation during peak demand periods
Water Heater Rebates/Incentives to install Solar water heaters
Provide a water heater wrap and installation through an independent contractor
Time of Day Rates Offer time of day pricing to encourage commercial customers to shift usage to off-peak periods
Industrial Programs
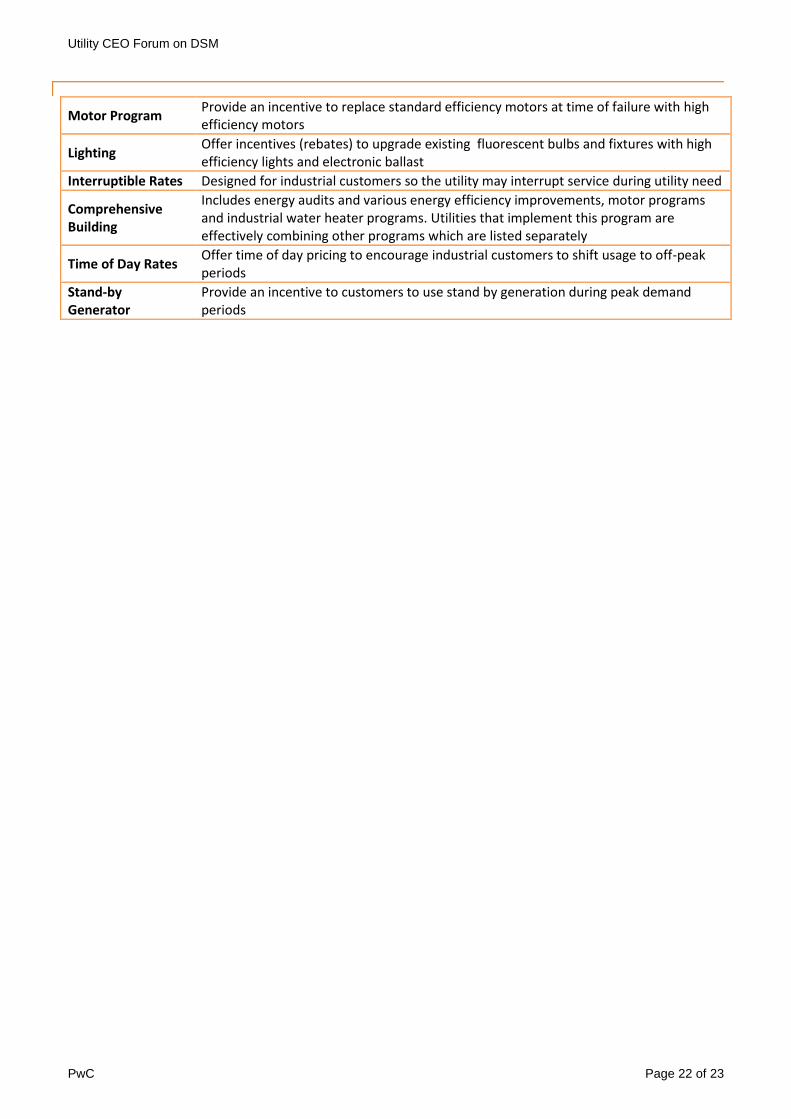
Utility CEO Forum on DSM
PwC Page 22 of 23
Motor Program Provide an incentive to replace standard efficiency motors at time of failure with high efficiency motors
Lighting Offer incentives (rebates) to upgrade existing fluorescent bulbs and fixtures with high efficiency lights and electronic ballast
Interruptible Rates Designed for industrial customers so the utility may interrupt service during utility need
Comprehensive Building
Includes energy audits and various energy efficiency improvements, motor programs and industrial water heater programs. Utilities that implement this program are effectively combining other programs which are listed separately
Time of Day Rates Offer time of day pricing to encourage industrial customers to shift usage to off-peak periods
Stand-by Generator
Provide an incentive to customers to use stand by generation during peak demand periods
Utility CEO Forum on DSM
Disclaimer
This publication has been prepared for general guidance on matters of interest only, and does not constitute professional advice. You should not act upon the information contained in this publication without obtaining specific professional advice. No representation or warranty (express or implied) is given as to the accuracy or completeness of the information contained in this report, and, to the extent permitted by law, PricewaterhouseCoopers Private Limited, its members, employees and agents do not accept or assume any liability, responsibility or duty of care for any consequences of you or anyone else acting, or refraining to act, in reliance on the information contained in this report or for any decision based on it.
Copyright
© 2013 PricewaterhouseCoopers Private Limited. All rights reserved. In this document, ―PwC‖ refers to PricewaterhouseCoopers Private Limited (a limited liability company in India), which is a member firm of PricewaterhouseCoopers International Limited (PwCIL), each member firm of which is a separate legal entity.


This report is solely for the use and benefit of Shakti Sustainable Energy Foundation and should not be relied upon by any other part. Utility CEO Forum on Demand Side Management - Annual Report 2013 PwC
C. Proceedings: Launch of the Forum

Proceedings of the 'Launch of Utility CEO Forum on Demand Side Management'
March 2013

Utility CEO Forum on DSM - Launch Meeting Proceedings
Page 3 of 10
Table of Contents Introduction .................................................................................................................................................................. 4
Welcome Address by the Honorary Chairperson ....................................................................................................... 5
Presentation by Shakti Sustainable Energy Foundation ............................................................................................ 5
Vision, Mission and Functions of the Forum ........................................................................................................ 5
Presentation by PwC..................................................................................................................................................... 6
Barriers and Enabling Mechanisms for advancing megawatt scale DSM programs .......................................... 6
Remarks and observations by CERC ........................................................................................................................... 6
Presentations by Tata Power (Mumbai Distribution) and BESCOM ......................................................................... 7
Proceedings of the Round Table Discussion ................................................................................................................ 7
Agenda for Next Meeting ............................................................................................................................................. 8
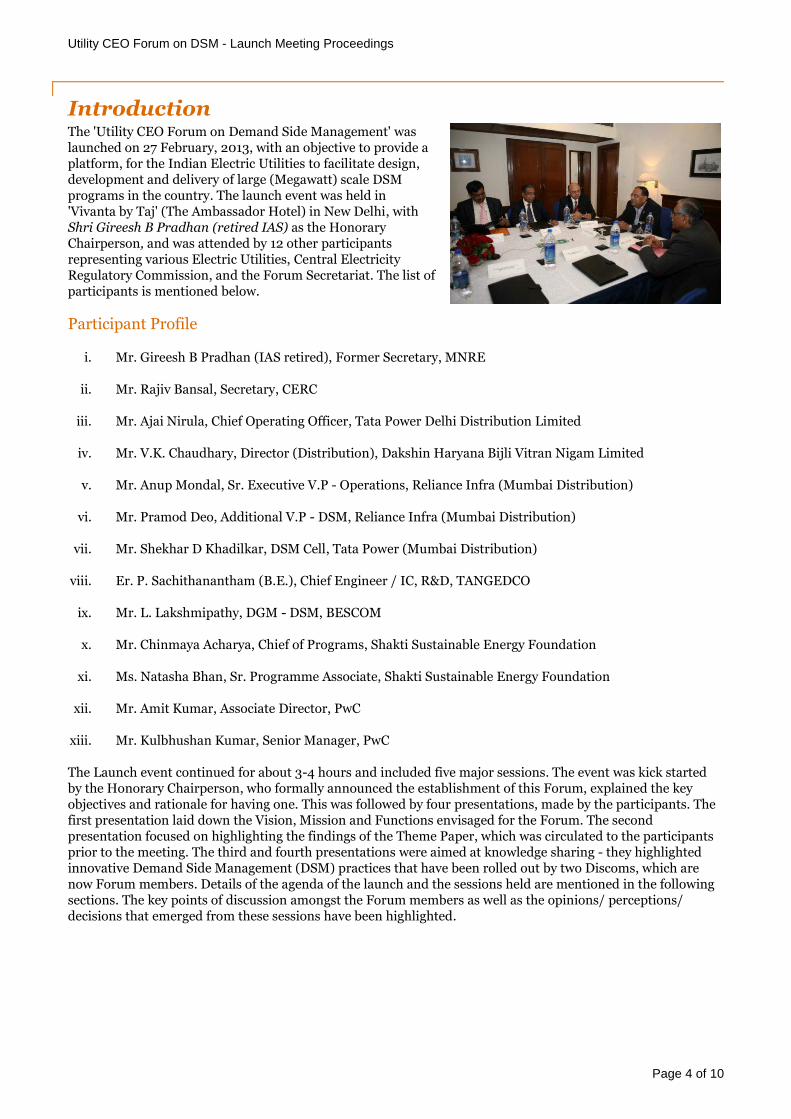
Utility CEO Forum on DSM - Launch Meeting Proceedings
Page 4 of 10
Introduction The 'Utility CEO Forum on Demand Side Management' was launched on 27 February, 2013, with an objective to provide a platform, for the Indian Electric Utilities to facilitate design, development and delivery of large (Megawatt) scale DSM programs in the country. The launch event was held in 'Vivanta by Taj' (The Ambassador Hotel) in New Delhi, with Shri Gireesh B Pradhan (retired IAS) as the Honorary Chairperson, and was attended by 12 other participants representing various Electric Utilities, Central Electricity Regulatory Commission, and the Forum Secretariat. The list of participants is mentioned below.
Participant Profile
i. Mr. Gireesh B Pradhan (IAS retired), Former Secretary, MNRE
ii. Mr. Rajiv Bansal, Secretary, CERC
iii. Mr. Ajai Nirula, Chief Operating Officer, Tata Power Delhi Distribution Limited
iv. Mr. V.K. Chaudhary, Director (Distribution), Dakshin Haryana Bijli Vitran Nigam Limited
v. Mr. Anup Mondal, Sr. Executive V.P - Operations, Reliance Infra (Mumbai Distribution)
vi. Mr. Pramod Deo, Additional V.P - DSM, Reliance Infra (Mumbai Distribution)
vii. Mr. Shekhar D Khadilkar, DSM Cell, Tata Power (Mumbai Distribution)
viii. Er. P. Sachithanantham (B.E.), Chief Engineer / IC, R&D, TANGEDCO
ix. Mr. L. Lakshmipathy, DGM - DSM, BESCOM
x. Mr. Chinmaya Acharya, Chief of Programs, Shakti Sustainable Energy Foundation
xi. Ms. Natasha Bhan, Sr. Programme Associate, Shakti Sustainable Energy Foundation
xii. Mr. Amit Kumar, Associate Director, PwC
xiii. Mr. Kulbhushan Kumar, Senior Manager, PwC
The Launch event continued for about 3-4 hours and included five major sessions. The event was kick started by the Honorary Chairperson, who formally announced the establishment of this Forum, explained the key objectives and rationale for having one. This was followed by four presentations, made by the participants. The first presentation laid down the Vision, Mission and Functions envisaged for the Forum. The second presentation focused on highlighting the findings of the Theme Paper, which was circulated to the participants prior to the meeting. The third and fourth presentations were aimed at knowledge sharing - they highlighted innovative Demand Side Management (DSM) practices that have been rolled out by two Discoms, which are now Forum members. Details of the agenda of the launch and the sessions held are mentioned in the following sections. The key points of discussion amongst the Forum members as well as the opinions/ perceptions/ decisions that emerged from these sessions have been highlighted.

Utility CEO Forum on DSM - Launch Meeting Proceedings
Page 5 of 10
Welcome Address by the Honorary Chairperson
The Honorary Chairperson kick started the launch event by formally announcing the establishment of 'Utility CEO Forum on DSM. He started off by introducing Shakti Sustainable Energy Foundation (Shakti) as the organization behind the conception of this Forum followed by an introduction of PwC as the knowledge and logistic partner for the Forum's activities. He mentioned that the Forum will act as a facilitation platform to encourage deliberations that can translate knowledge into actions for accelerating deployment of megawatt scale DSM programs in the country. He highlighted that energy shortage in the country is one of the key drivers for DSM. He commented that the DSM initiatives undertaken in other parts of the world have witnessed tremendous success in meeting energy shortages, and therefore the megawatt scale DSM investments by Utilities can substantially ease the supply side pressures faced by the Indian Government while attempting to meet the rising demand. He envisioned that this Forum should be able to advocate a policy instrument towards enabling Utilities across the country to undertake megawatt scale investments in DSM. He mentioned that the Forum should meet at least once in each quarter to meet the desired objectives. He clarified that the Forum is not pushing any specific agenda in these meetings, except the overall objective, and the Forum should discuss and decide the future agenda in order to take up ideas that emerge as critical and appropriate in keeping with the overall objectives. He also mentioned that this Forum would invite regulatory commissions and other special invitees as and when appropriate to hear their views and opinions. He also mentioned that all the discussions among the Forum members and proceedings of the meetings would be documented and shared with the Forum participants.
He concluded his welcome address by thanking the efforts of Shakti Foundation and PwC for bringing many Utilities together to become part of this Forum.
Presentation by Shakti Sustainable Energy Foundation Vision, Mission and Functions of the Forum This presentation was delivered by Mr. Chinmaya Acharya, Chief of Programs, Shakti Sustainable Energy Foundation. In his presentation, he presented the vision, mission and key functions envisaged for the Forum. He reiterated that the Forum will operate by deciding its own agenda to identify focus areas. He mentioned that the Forum's activities will be guided by the Honorary Chairperson and the Forum's participants. He also mentioned that PwC would play the role of Knowledge partner for undertaking any research on identified issues and supporting the Forum's thought process in the discussions. He also mentioned that at the end of one year of Forum operations, a comprehensive annual report would be documented that captures all activities and their impact. He cited that another critical objective of the forum is to disseminate the ideas and activities of the Forum to a larger audience outside the Forum. He stated that Shakti Foundation has committed to provide resource support for the Forum's activities for the first year of its operations.
Mr. Chinmaya Acharya, Shakti Foundation
Shri Gireesh B Pradhan, IAS (Retd.)
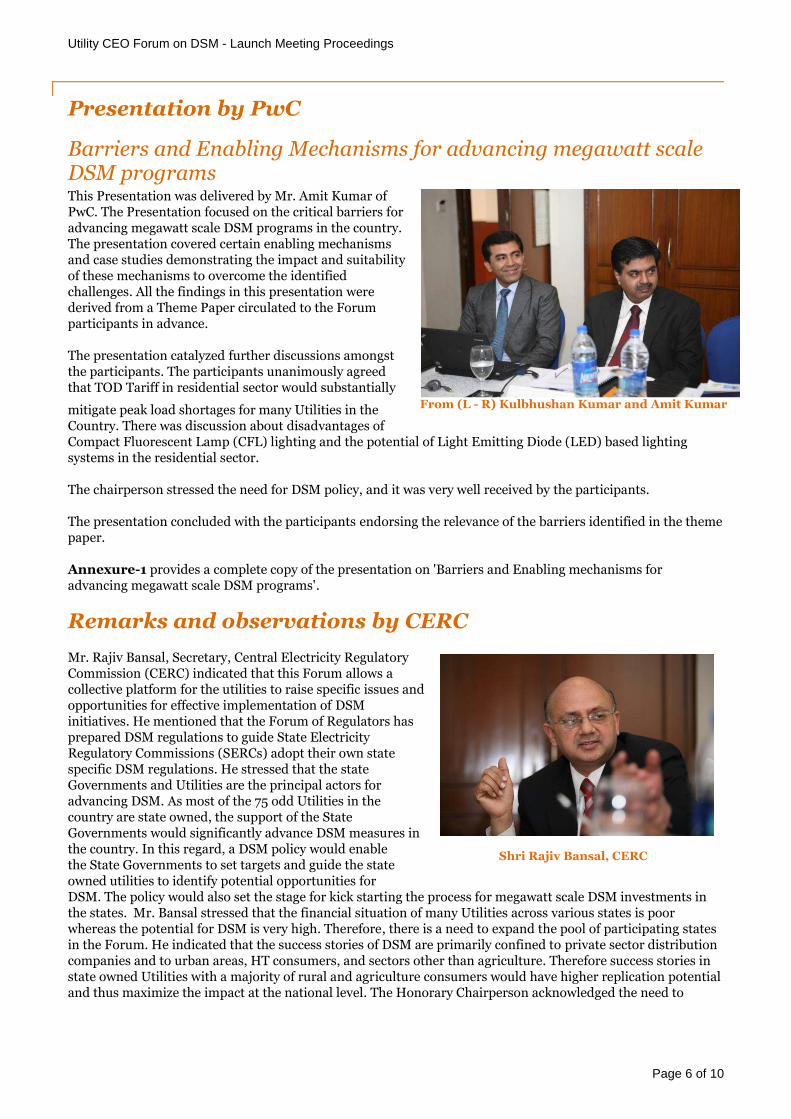
Utility CEO Forum on DSM - Launch Meeting Proceedings
Page 6 of 10
Presentation by PwC
Barriers and Enabling Mechanisms for advancing megawatt scale DSM programs This Presentation was delivered by Mr. Amit Kumar of PwC. The Presentation focused on the critical barriers for advancing megawatt scale DSM programs in the country. The presentation covered certain enabling mechanisms and case studies demonstrating the impact and suitability of these mechanisms to overcome the identified challenges. All the findings in this presentation were derived from a Theme Paper circulated to the Forum participants in advance.
The presentation catalyzed further discussions amongst the participants. The participants unanimously agreed that TOD Tariff in residential sector would substantially
mitigate peak load shortages for many Utilities in the Country. There was discussion about disadvantages of Compact Fluorescent Lamp (CFL) lighting and the potential of Light Emitting Diode (LED) based lighting systems in the residential sector.
The chairperson stressed the need for DSM policy, and it was very well received by the participants.
The presentation concluded with the participants endorsing the relevance of the barriers identified in the theme paper.
Annexure-1 provides a complete copy of the presentation on 'Barriers and Enabling mechanisms for advancing megawatt scale DSM programs'.
Remarks and observations by CERC
Mr. Rajiv Bansal, Secretary, Central Electricity Regulatory Commission (CERC) indicated that this Forum allows a collective platform for the utilities to raise specific issues and opportunities for effective implementation of DSM initiatives. He mentioned that the Forum of Regulators has prepared DSM regulations to guide State Electricity Regulatory Commissions (SERCs) adopt their own state specific DSM regulations. He stressed that the state Governments and Utilities are the principal actors for advancing DSM. As most of the 75 odd Utilities in the country are state owned, the support of the State Governments would significantly advance DSM measures in the country. In this regard, a DSM policy would enable the State Governments to set targets and guide the state owned utilities to identify potential opportunities for DSM. The policy would also set the stage for kick starting the process for megawatt scale DSM investments in the states. Mr. Bansal stressed that the financial situation of many Utilities across various states is poor whereas the potential for DSM is very high. Therefore, there is a need to expand the pool of participating states in the Forum. He indicated that the success stories of DSM are primarily confined to private sector distribution companies and to urban areas, HT consumers, and sectors other than agriculture. Therefore success stories in state owned Utilities with a majority of rural and agriculture consumers would have higher replication potential and thus maximize the impact at the national level. The Honorary Chairperson acknowledged the need to
From (L - R) Kulbhushan Kumar and Amit Kumar
Shri Rajiv Bansal, CERC
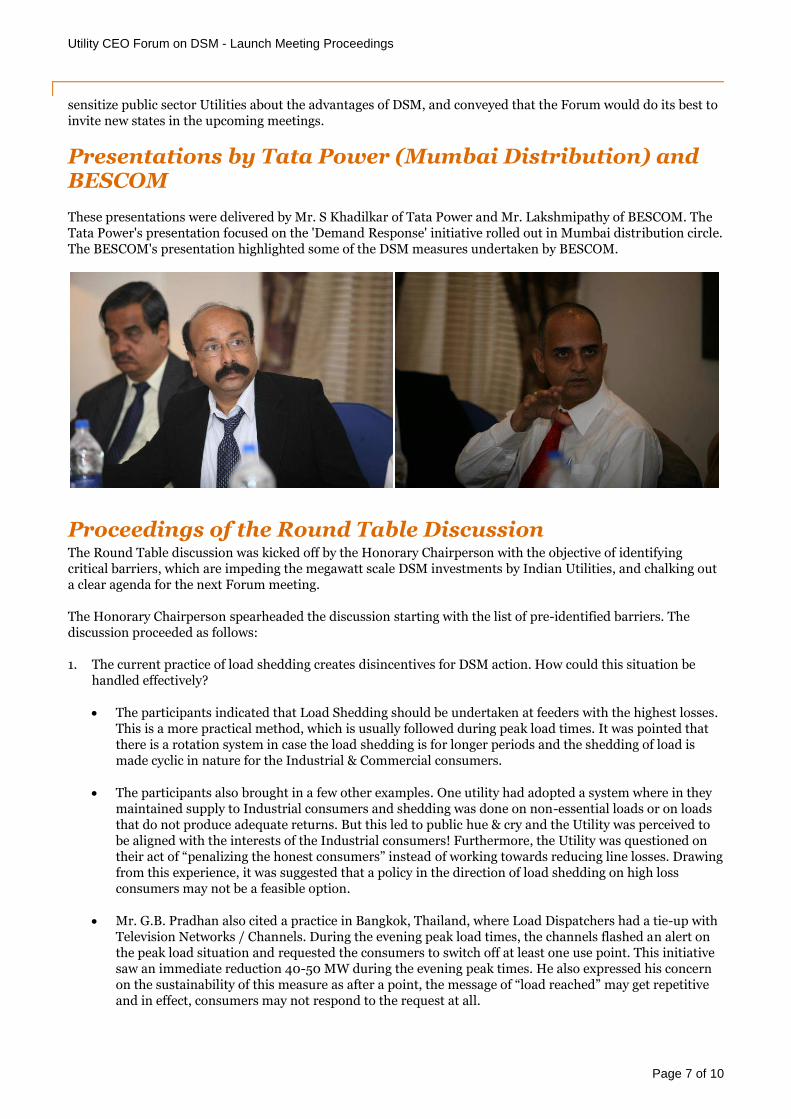
Utility CEO Forum on DSM - Launch Meeting Proceedings
Page 7 of 10
sensitize public sector Utilities about the advantages of DSM, and conveyed that the Forum would do its best to invite new states in the upcoming meetings.
Presentations by Tata Power (Mumbai Distribution) and BESCOM
These presentations were delivered by Mr. S Khadilkar of Tata Power and Mr. Lakshmipathy of BESCOM. The Tata Power's presentation focused on the 'Demand Response' initiative rolled out in Mumbai distribution circle. The BESCOM's presentation highlighted some of the DSM measures undertaken by BESCOM.
Proceedings of the Round Table Discussion The Round Table discussion was kicked off by the Honorary Chairperson with the objective of identifying critical barriers, which are impeding the megawatt scale DSM investments by Indian Utilities, and chalking out a clear agenda for the next Forum meeting.
The Honorary Chairperson spearheaded the discussion starting with the list of pre-identified barriers. The discussion proceeded as follows:
1. The current practice of load shedding creates disincentives for DSM action. How could this situation be handled effectively?
The participants indicated that Load Shedding should be undertaken at feeders with the highest losses. This is a more practical method, which is usually followed during peak load times. It was pointed that there is a rotation system in case the load shedding is for longer periods and the shedding of load is made cyclic in nature for the Industrial & Commercial consumers.
The participants also brought in a few other examples. One utility had adopted a system where in they maintained supply to Industrial consumers and shedding was done on non-essential loads or on loads that do not produce adequate returns. But this led to public hue & cry and the Utility was perceived to be aligned with the interests of the Industrial consumers! Furthermore, the Utility was questioned on their act of “penalizing the honest consumers” instead of working towards reducing line losses. Drawing from this experience, it was suggested that a policy in the direction of load shedding on high loss consumers may not be a feasible option.
Mr. G.B. Pradhan also cited a practice in Bangkok, Thailand, where Load Dispatchers had a tie-up with Television Networks / Channels. During the evening peak load times, the channels flashed an alert on the peak load situation and requested the consumers to switch off at least one use point. This initiative saw an immediate reduction 40-50 MW during the evening peak times. He also expressed his concern on the sustainability of this measure as after a point, the message of “load reached” may get repetitive and in effect, consumers may not respond to the request at all.
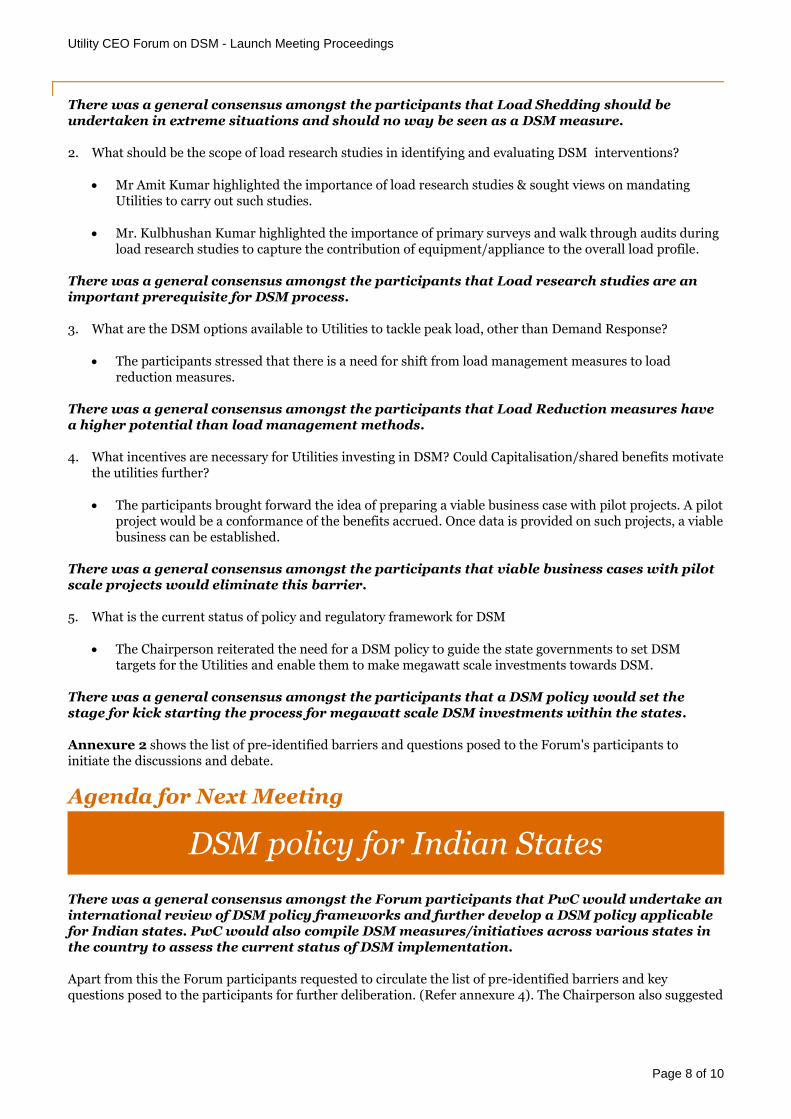
Utility CEO Forum on DSM - Launch Meeting Proceedings
Page 8 of 10
There was a general consensus amongst the participants that Load Shedding should be undertaken in extreme situations and should no way be seen as a DSM measure.
2. What should be the scope of load research studies in identifying and evaluating DSM interventions?
Mr Amit Kumar highlighted the importance of load research studies & sought views on mandating Utilities to carry out such studies.
Mr. Kulbhushan Kumar highlighted the importance of primary surveys and walk through audits during load research studies to capture the contribution of equipment/appliance to the overall load profile.
There was a general consensus amongst the participants that Load research studies are an important prerequisite for DSM process.
3. What are the DSM options available to Utilities to tackle peak load, other than Demand Response?
The participants stressed that there is a need for shift from load management measures to load reduction measures.
There was a general consensus amongst the participants that Load Reduction measures have a higher potential than load management methods.
4. What incentives are necessary for Utilities investing in DSM? Could Capitalisation/shared benefits motivate the utilities further?
The participants brought forward the idea of preparing a viable business case with pilot projects. A pilot project would be a conformance of the benefits accrued. Once data is provided on such projects, a viable business can be established.
There was a general consensus amongst the participants that viable business cases with pilot scale projects would eliminate this barrier.
5. What is the current status of policy and regulatory framework for DSM
The Chairperson reiterated the need for a DSM policy to guide the state governments to set DSM targets for the Utilities and enable them to make megawatt scale investments towards DSM.
There was a general consensus amongst the participants that a DSM policy would set the stage for kick starting the process for megawatt scale DSM investments within the states.
Annexure 2 shows the list of pre-identified barriers and questions posed to the Forum's participants to initiate the discussions and debate.
Agenda for Next Meeting
DSM policy for Indian States
There was a general consensus amongst the Forum participants that PwC would undertake an international review of DSM policy frameworks and further develop a DSM policy applicable for Indian states. PwC would also compile DSM measures/initiatives across various states in the country to assess the current status of DSM implementation.
Apart from this the Forum participants requested to circulate the list of pre-identified barriers and key questions posed to the participants for further deliberation. (Refer annexure 4). The Chairperson also suggested

Utility CEO Forum on DSM - Launch Meeting Proceedings
Page 9 of 10
that interim meetings could be arranged on as needed basis to address any specific matter that requires immediate attention.
Utility CEO Forum on DSM - Launch Meeting Proceedings
Disclaimer
This publication has been prepared for general guidance on matters of interest only, and does not constitute professional advice. You should not act upon the information contained in this publication without obtaining specific professional advice. No representation or warranty (express or implied) is given as to the accuracy or completeness of the information contained in this report, and, to the extent permitted by law, PricewaterhouseCoopers Private Limited, its members, employees and agents do not accept or assume any liability, responsibility or duty of care for any consequences of you or anyone else acting, or refraining to act, in reliance on the information contained in this report or for any decision based on it.
Copyright
© 2013 PricewaterhouseCoopers Private Limited. All rights reserved. In this document, “PwC” refers to PricewaterhouseCoopers Private Limited (a limited liability company in India), which is a member firm of PricewaterhouseCoopers International Limited (PwCIL), each member firm of which is a separate legal entity.
This report is solely for the use and benefit of Shakti Sustainable Energy Foundation and should not be relied upon by any other part. Utility CEO Forum on Demand Side Management - Annual Report 2013 PwC
D. Theme Paper: Model State DSM Policy

Utility CEO Forum on Demand Side Management
Model Demand Side Management policy for state governments in India
May 2013
Utility CEO Forum on DSM Model DSM Policy
2
Table of Contents
Introduction .................................................................................................................................................. 3
Review of legal and policy framework for Utility driven DSM in India .................................................... 3
Need for state intervention to strengthen the DSM policy framework ..................................................... 8
Utility driven Demand Side Management policy for Indian states ........................................................... 9
Preamble ....................................................................................................................................................... 9
Definitions and scope .................................................................................................................................. 10
DSM policy objectives ................................................................................................................................. 12
Vision of the state government ................................................................................................................... 12
Policy title and enforcement ....................................................................................................................... 12
Target for promotion of utility driven DSM at the state level ................................................................... 12
DSM obligation / state's loading order ...................................................................................................... 12
Financing of DSM Programs ....................................................................................................................... 13
Incentive to the state's distribution licensees ............................................................................................ 13
Nodal agency ................................................................................................................................................ 13
Formation of empowered committee ......................................................................................................... 13
Roadmap for DSM process and programme implementation .................................................................. 13
DSM regulations ..................................................................................................................................... 13
Constitution of DSM cell ........................................................................................................................ 14
DSM potential in the state ..................................................................................................................... 14
Goal and target setting ........................................................................................................................... 14
Multi -year DSM planning ..................................................................................................................... 14
Approval of multi -year DSM plan ........................................................................................................ 15
DSM plan implementation .................................................................................................................... 15
Monitoring and reporting of DSM programmes .................................................................................. 15
Verification and evaluation of DSM plan implementation .................................................................. 15
Review and assessment of DSM targets ................................................................................................ 15
Funding the activities of nodal agency ....................................................................................................... 15
Annexure 1 ................................................................................................................................................... 16
Closing statement ........................................................................................................................................ 18
Utility CEO Forum on DSM Model DSM Policy
3
Introduction
Utility driven electricity demand side management (DSM) programmes in India have remained largely in the form of pilot projects and have not been scaled up for the mass of consumers. There is also no clarity around the obligation or targets on electricity distribution licensees (Utility) to acquire cost-effective DSM resources for meeting electricity demand in the short- or medium term. In the absence of an overall target or goal, DSM programmes are undertaken on a piecemeal basis and are often neglected in the annual multi-year planning process of Utilities.
Since the business of electricity distribution is licensed and regulated in India, the presence of an enabling legal and policy framework is fundamental to the up-scaling of Utility driven DSM investments in the country. Utility sponsored DSM efforts in India driven by legislation, policy and regulation started only about a decade ago.
The following sections identify the critical gaps in some of the major policy instruments in the Indian Electricity Industry and further propose necessary amendments for creating a conducive policy environment for Utility driven DSM investments in the country.
Review of legal and policy framework for Utility driven DSM in India
Energy Conservation Act, 2001 The Energy Conservation Act, enacted in 2011, created the Bureau of Energy Efficiency (BEE), under the Ministry of Power, as the designated nodal agency to promote energy efficiency and conservation in various sectors of the Indian economy. The act was primarily aimed at improving the energy efficiency norms in certain energy-intensive consumer segments and creating a mandatory framework for standards and labelling of appliances and buildings in India.
The Energy Conservation Act did not provide explicit provisions for the promotion and implementation of utility driven DSM in India.
Electricity Act (EA), 2003 The Electricity Act was enacted in 2003 to transform the power sector in India and has repealed three previously enacted laws namely the Indian Electricity Act, 1910, the Electricity (Supply) Act, 1948, and the Electricity Regulatory Commission Act, 1998, that were guiding the electricity supply and pricing mechanisms in the country. The EA has created a consolidated policy framework for generation, transmission, distribution, trading and consumption of electricity adhering to market-based mechanisms. The EA also aimed to promote efficient and environmentally benign policies across the value chain of electricity in India.
Section 42 (1) of the EA 2003 states that “it shall be the duty of a distribution licensee to develop and maintain an efficient, coordinated and economical distribution system in his area of supply and to supply electricity in accordance with the provisions contained in this Act”, section 62 (D) has empowered the State Electricity Regulatory Commission (SERC) to determine tariffs for retail sale of electricity, section 61 (C) allowed the SERC to regulate tariffs by considering “the factors which would encourage competition, efficiency, economical use of resources, good performance and optimum investments”, section 61(D) allowed the commissions to 'reward utilities based on the principles of efficiency in performance', section 86 (2.1) allowed the regulatory commission to advise the state governments on matters of 'promotion of competition, efficiency and economy in activities of the electricity industry', and section 86 (4) of EA 2003 provided that 'in discharging its functions, the SERCs shall be guided by the National Electricity Policy and the National Electricity Plan'.
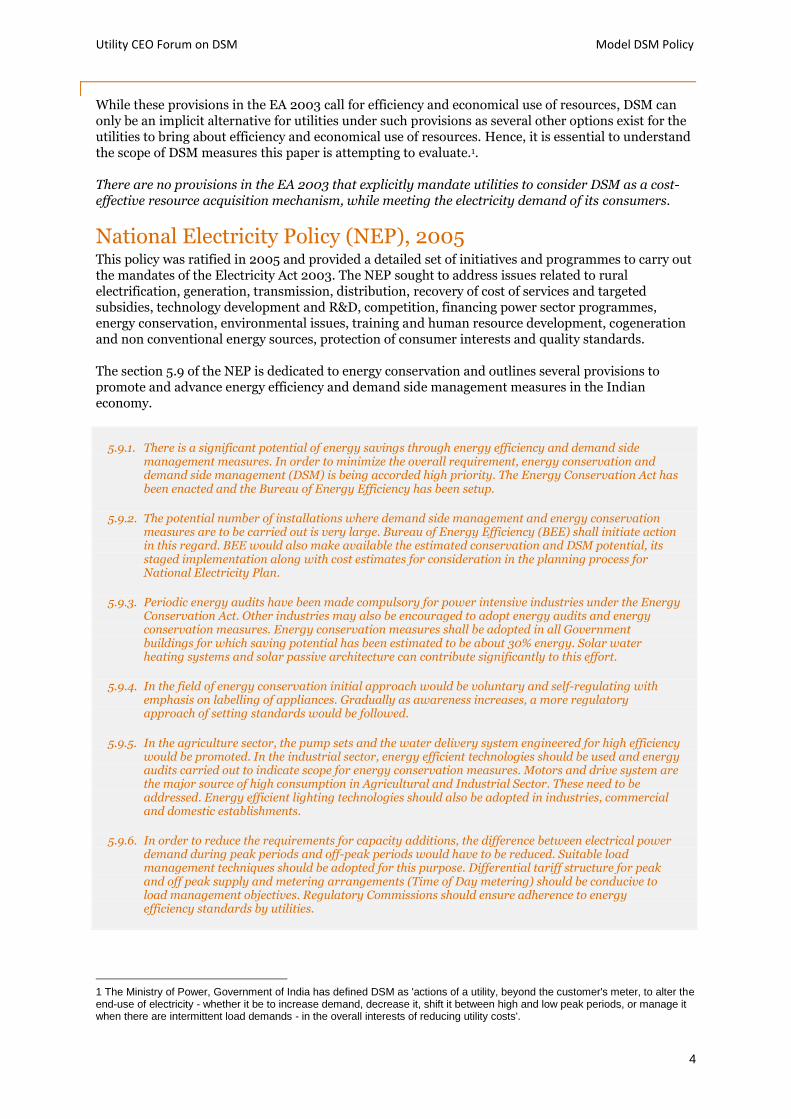
Utility CEO Forum on DSM Model DSM Policy
4
While these provisions in the EA 2003 call for efficiency and economical use of resources, DSM can only be an implicit alternative for utilities under such provisions as several other options exist for the utilities to bring about efficiency and economical use of resources. Hence, it is essential to understand the scope of DSM measures this paper is attempting to evaluate.1.
There are no provisions in the EA 2003 that explicitly mandate utilities to consider DSM as a cost-effective resource acquisition mechanism, while meeting the electricity demand of its consumers.
National Electricity Policy (NEP), 2005 This policy was ratified in 2005 and provided a detailed set of initiatives and programmes to carry out the mandates of the Electricity Act 2003. The NEP sought to address issues related to rural electrification, generation, transmission, distribution, recovery of cost of services and targeted subsidies, technology development and R&D, competition, financing power sector programmes, energy conservation, environmental issues, training and human resource development, cogeneration and non conventional energy sources, protection of consumer interests and quality standards.
The section 5.9 of the NEP is dedicated to energy conservation and outlines several provisions to promote and advance energy efficiency and demand side management measures in the Indian economy.
5.9.1. There is a significant potential of energy savings through energy efficiency and demand side management measures. In order to minimize the overall requirement, energy conservation and demand side management (DSM) is being accorded high priority. The Energy Conservation Act has been enacted and the Bureau of Energy Efficiency has been setup.
5.9.2. The potential number of installations where demand side management and energy conservation measures are to be carried out is very large. Bureau of Energy Efficiency (BEE) shall initiate action in this regard. BEE would also make available the estimated conservation and DSM potential, its staged implementation along with cost estimates for consideration in the planning process for National Electricity Plan.
5.9.3. Periodic energy audits have been made compulsory for power intensive industries under the Energy Conservation Act. Other industries may also be encouraged to adopt energy audits and energy conservation measures. Energy conservation measures shall be adopted in all Government buildings for which saving potential has been estimated to be about 30% energy. Solar water heating systems and solar passive architecture can contribute significantly to this effort.
5.9.4. In the field of energy conservation initial approach would be voluntary and self-regulating with emphasis on labelling of appliances. Gradually as awareness increases, a more regulatory approach of setting standards would be followed.
5.9.5. In the agriculture sector, the pump sets and the water delivery system engineered for high efficiency would be promoted. In the industrial sector, energy efficient technologies should be used and energy audits carried out to indicate scope for energy conservation measures. Motors and drive system are the major source of high consumption in Agricultural and Industrial Sector. These need to be addressed. Energy efficient lighting technologies should also be adopted in industries, commercial and domestic establishments.
5.9.6. In order to reduce the requirements for capacity additions, the difference between electrical power demand during peak periods and off-peak periods would have to be reduced. Suitable load management techniques should be adopted for this purpose. Differential tariff structure for peak and off peak supply and metering arrangements (Time of Day metering) should be conducive to load management objectives. Regulatory Commissions should ensure adherence to energy efficiency standards by utilities.
1 The Ministry of Power, Government of India has defined DSM as 'actions of a utility, beyond the customer's meter, to alter the end-use of electricity - whether it be to increase demand, decrease it, shift it between high and low peak periods, or manage it when there are intermittent load demands - in the overall interests of reducing utility costs'.
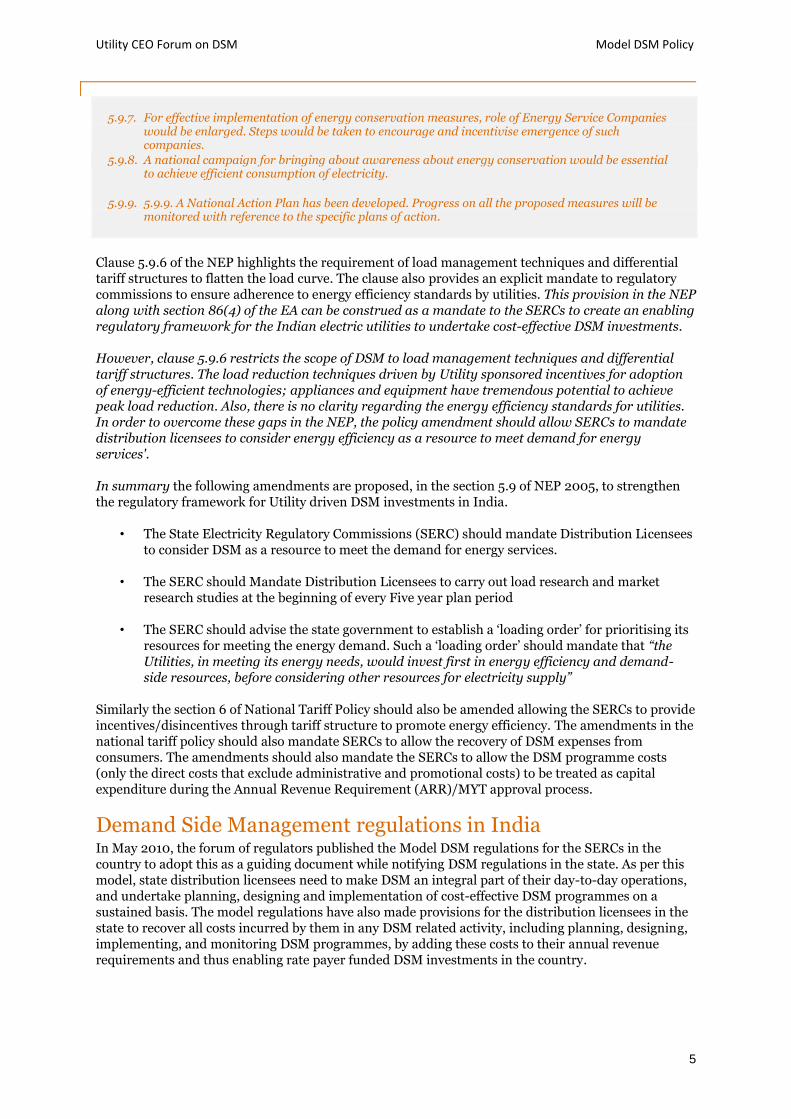
Utility CEO Forum on DSM Model DSM Policy
5
5.9.7. For effective implementation of energy conservation measures, role of Energy Service Companies would be enlarged. Steps would be taken to encourage and incentivise emergence of such companies.
5.9.8. A national campaign for bringing about awareness about energy conservation would be essential to achieve efficient consumption of electricity.
5.9.9. 5.9.9. A National Action Plan has been developed. Progress on all the proposed measures will be monitored with reference to the specific plans of action.
Clause 5.9.6 of the NEP highlights the requirement of load management techniques and differential tariff structures to flatten the load curve. The clause also provides an explicit mandate to regulatory commissions to ensure adherence to energy efficiency standards by utilities. This provision in the NEP along with section 86(4) of the EA can be construed as a mandate to the SERCs to create an enabling regulatory framework for the Indian electric utilities to undertake cost-effective DSM investments.
However, clause 5.9.6 restricts the scope of DSM to load management techniques and differential tariff structures. The load reduction techniques driven by Utility sponsored incentives for adoption of energy-efficient technologies; appliances and equipment have tremendous potential to achieve peak load reduction. Also, there is no clarity regarding the energy efficiency standards for utilities. In order to overcome these gaps in the NEP, the policy amendment should allow SERCs to mandate distribution licensees to consider energy efficiency as a resource to meet demand for energy services'.
In summary the following amendments are proposed, in the section 5.9 of NEP 2005, to strengthen the regulatory framework for Utility driven DSM investments in India.
• The State Electricity Regulatory Commissions (SERC) should mandate Distribution Licensees to consider DSM as a resource to meet the demand for energy services.
• The SERC should Mandate Distribution Licensees to carry out load research and market research studies at the beginning of every Five year plan period
• The SERC should advise the state government to establish a ‘loading order’ for prioritising its resources for meeting the energy demand. Such a ‘loading order’ should mandate that “the Utilities, in meeting its energy needs, would invest first in energy efficiency and demand-side resources, before considering other resources for electricity supply”
Similarly the section 6 of National Tariff Policy should also be amended allowing the SERCs to provide incentives/disincentives through tariff structure to promote energy efficiency. The amendments in the national tariff policy should also mandate SERCs to allow the recovery of DSM expenses from consumers. The amendments should also mandate the SERCs to allow the DSM programme costs (only the direct costs that exclude administrative and promotional costs) to be treated as capital expenditure during the Annual Revenue Requirement (ARR)/MYT approval process.
Demand Side Management regulations in India In May 2010, the forum of regulators published the Model DSM regulations for the SERCs in the country to adopt this as a guiding document while notifying DSM regulations in the state. As per this model, state distribution licensees need to make DSM an integral part of their day-to-day operations, and undertake planning, designing and implementation of cost-effective DSM programmes on a sustained basis. The model regulations have also made provisions for the distribution licensees in the state to recover all costs incurred by them in any DSM related activity, including planning, designing, implementing, and monitoring DSM programmes, by adding these costs to their annual revenue requirements and thus enabling rate payer funded DSM investments in the country.
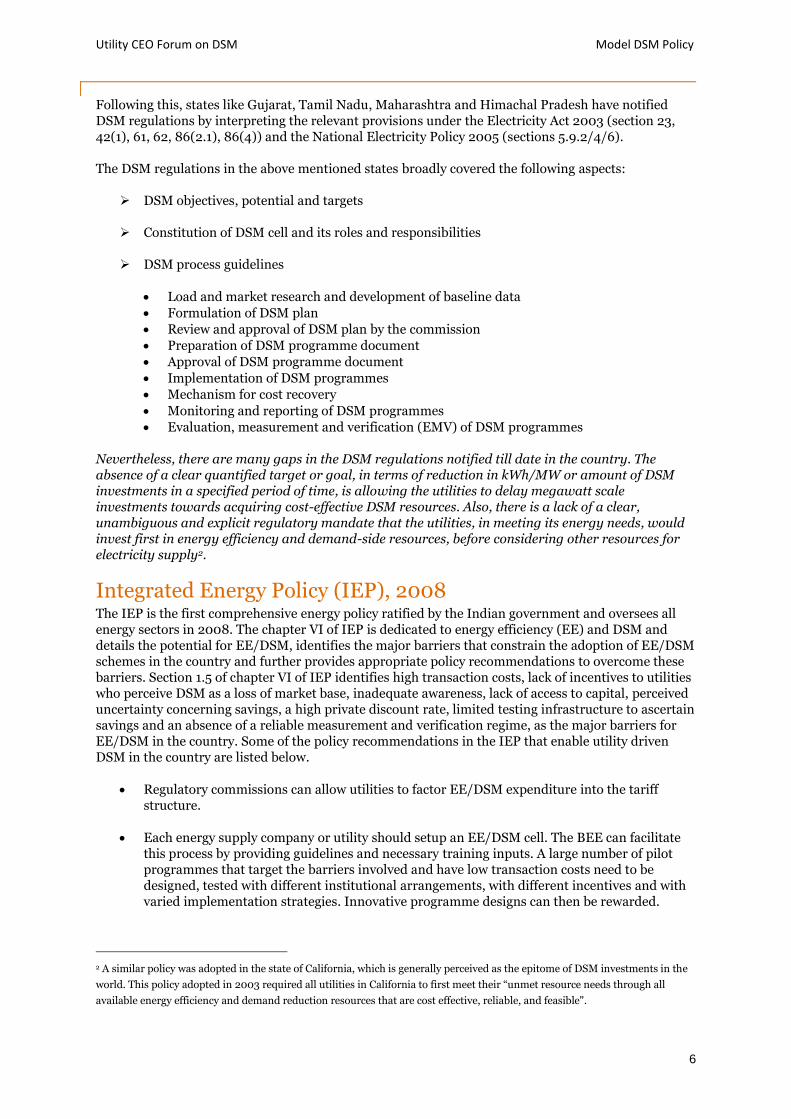
Utility CEO Forum on DSM Model DSM Policy
6
Following this, states like Gujarat, Tamil Nadu, Maharashtra and Himachal Pradesh have notified DSM regulations by interpreting the relevant provisions under the Electricity Act 2003 (section 23, 42(1), 61, 62, 86(2.1), 86(4)) and the National Electricity Policy 2005 (sections 5.9.2/4/6).
The DSM regulations in the above mentioned states broadly covered the following aspects:
DSM objectives, potential and targets
Constitution of DSM cell and its roles and responsibilities
DSM process guidelines
Load and market research and development of baseline data
Formulation of DSM plan
Review and approval of DSM plan by the commission
Preparation of DSM programme document
Approval of DSM programme document
Implementation of DSM programmes
Mechanism for cost recovery
Monitoring and reporting of DSM programmes
Evaluation, measurement and verification (EMV) of DSM programmes
Nevertheless, there are many gaps in the DSM regulations notified till date in the country. The absence of a clear quantified target or goal, in terms of reduction in kWh/MW or amount of DSM investments in a specified period of time, is allowing the utilities to delay megawatt scale investments towards acquiring cost-effective DSM resources. Also, there is a lack of a clear, unambiguous and explicit regulatory mandate that the utilities, in meeting its energy needs, would invest first in energy efficiency and demand-side resources, before considering other resources for electricity supply2.
Integrated Energy Policy (IEP), 2008 The IEP is the first comprehensive energy policy ratified by the Indian government and oversees all energy sectors in 2008. The chapter VI of IEP is dedicated to energy efficiency (EE) and DSM and details the potential for EE/DSM, identifies the major barriers that constrain the adoption of EE/DSM schemes in the country and further provides appropriate policy recommendations to overcome these barriers. Section 1.5 of chapter VI of IEP identifies high transaction costs, lack of incentives to utilities who perceive DSM as a loss of market base, inadequate awareness, lack of access to capital, perceived uncertainty concerning savings, a high private discount rate, limited testing infrastructure to ascertain savings and an absence of a reliable measurement and verification regime, as the major barriers for EE/DSM in the country. Some of the policy recommendations in the IEP that enable utility driven DSM in the country are listed below.
Regulatory commissions can allow utilities to factor EE/DSM expenditure into the tariff structure.
Each energy supply company or utility should setup an EE/DSM cell. The BEE can facilitate this process by providing guidelines and necessary training inputs. A large number of pilot programmes that target the barriers involved and have low transaction costs need to be designed, tested with different institutional arrangements, with different incentives and with varied implementation strategies. Innovative programme designs can then be rewarded.
2 A similar policy was adopted in the state of California, which is generally perceived as the epitome of DSM investments in the
world. This policy adopted in 2003 required all utilities in California to first meet their “unmet resource needs through all
available energy efficiency and demand reduction resources that are cost effective, reliable, and feasible".
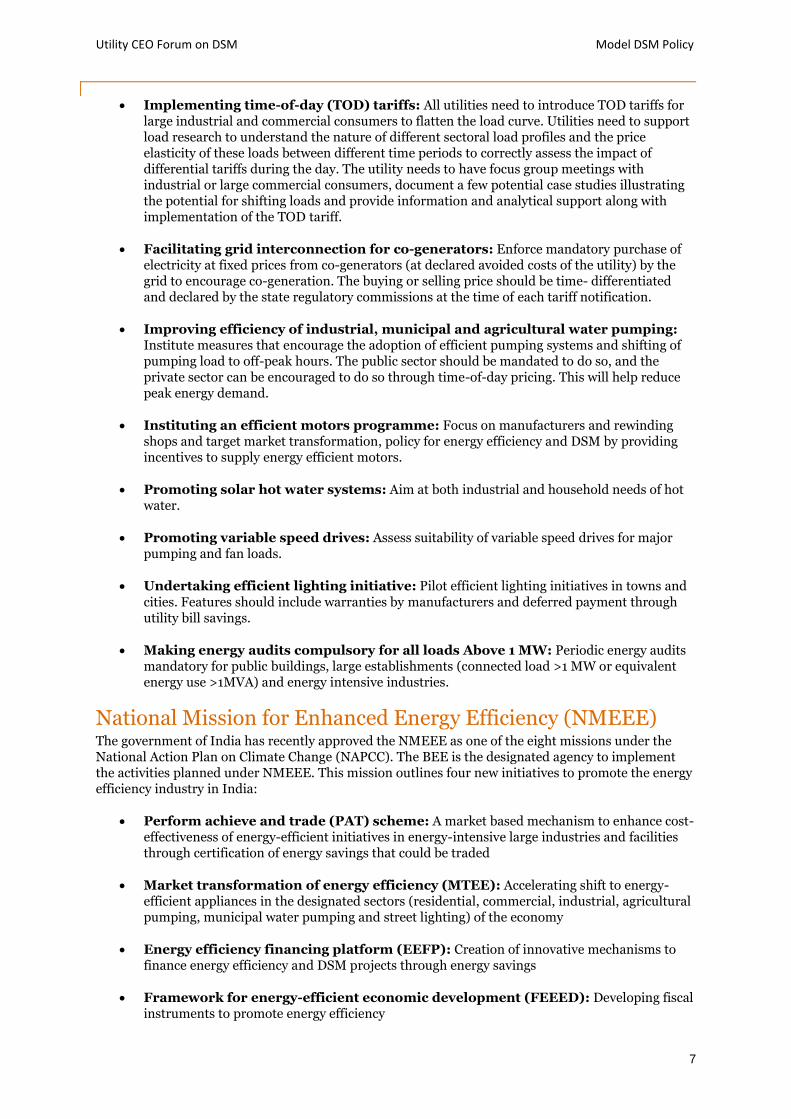
Utility CEO Forum on DSM Model DSM Policy
7
Implementing time-of-day (TOD) tariffs: All utilities need to introduce TOD tariffs for large industrial and commercial consumers to flatten the load curve. Utilities need to support load research to understand the nature of different sectoral load profiles and the price elasticity of these loads between different time periods to correctly assess the impact of differential tariffs during the day. The utility needs to have focus group meetings with industrial or large commercial consumers, document a few potential case studies illustrating the potential for shifting loads and provide information and analytical support along with implementation of the TOD tariff.
Facilitating grid interconnection for co-generators: Enforce mandatory purchase of electricity at fixed prices from co-generators (at declared avoided costs of the utility) by the grid to encourage co-generation. The buying or selling price should be time- differentiated and declared by the state regulatory commissions at the time of each tariff notification.
Improving efficiency of industrial, municipal and agricultural water pumping: Institute measures that encourage the adoption of efficient pumping systems and shifting of pumping load to off-peak hours. The public sector should be mandated to do so, and the private sector can be encouraged to do so through time-of-day pricing. This will help reduce peak energy demand.
Instituting an efficient motors programme: Focus on manufacturers and rewinding shops and target market transformation, policy for energy efficiency and DSM by providing incentives to supply energy efficient motors.
Promoting solar hot water systems: Aim at both industrial and household needs of hot water.
Promoting variable speed drives: Assess suitability of variable speed drives for major pumping and fan loads.
Undertaking efficient lighting initiative: Pilot efficient lighting initiatives in towns and
cities. Features should include warranties by manufacturers and deferred payment through utility bill savings.
Making energy audits compulsory for all loads Above 1 MW: Periodic energy audits mandatory for public buildings, large establishments (connected load >1 MW or equivalent energy use >1MVA) and energy intensive industries.
National Mission for Enhanced Energy Efficiency (NMEEE) The government of India has recently approved the NMEEE as one of the eight missions under the National Action Plan on Climate Change (NAPCC). The BEE is the designated agency to implement the activities planned under NMEEE. This mission outlines four new initiatives to promote the energy efficiency industry in India:
Perform achieve and trade (PAT) scheme: A market based mechanism to enhance cost-effectiveness of energy-efficient initiatives in energy-intensive large industries and facilities through certification of energy savings that could be traded
Market transformation of energy efficiency (MTEE): Accelerating shift to energy-efficient appliances in the designated sectors (residential, commercial, industrial, agricultural pumping, municipal water pumping and street lighting) of the economy
Energy efficiency financing platform (EEFP): Creation of innovative mechanisms to finance energy efficiency and DSM projects through energy savings
Framework for energy-efficient economic development (FEEED): Developing fiscal instruments to promote energy efficiency
Utility CEO Forum on DSM Model DSM Policy
8
BEE has achieved considerable progress in the development and implementation of the PAT scheme, the super efficient equipment programme (SEEP) and the partial risk guarantee fund (PRGF) to facilitate MTEE and EEFP. These initiatives designed by BEE may contribute to significant electrical energy and demand savings across the country. However, there is no framework to promote utility driven DSM among the abovementioned initiatives3.
Need for state intervention to strengthen the DSM policy framework In summary, utility driven DSM in India has been recognised and accorded priority with several actions initiated to facilitate and ensure its implementation. However, the electricity industry, being regulated, needs a clear, unambiguous and explicit mandate that the state, in meeting its energy needs, would invest first in energy efficiency and demand-side resources, before considering other resources for electricity supply.
Apart from this, as discussed before, the absence of a clear quantified target or goal, in terms of reduction in kWh/MW, is allowing Indian utilities to delay investments towards megawatt scale DSM programmes. There is also a lack of mechanism for coordination between various stakeholders such as state designated agencies (SDAs), state distribution licensees, BEE and SERCs to undertake DSM activities.
The state governments can play a crucial role in overcoming these gaps. This paper aims to provide a guiding document to the Indian states while assessing the potential for DSM practices, establishing a stringent policy framework, and setting reasonable targets to undertake DSM investments. The paper also aims to present a model DSM process, programme implementation, and institutional framework for the administering of related activities at the state level.
The structure of this paper resembles that of a typical policy notification by Indian states. The state governments while taking cognisance of the slow progress of DSM investments can use this paper to develop a 'state DSM policy' that can guide its stakeholders for scaling up the DSM investments.
3 The incentives proposed under the SEEP programme could be directed to consumers and channelled through the electric
utilities to promote DSM. Another widely acknowledged financing instrument for promoting DSM is the 'On-bill financing
(OBF)', which is successfully adopted across the world. OBF generally refers to a financial instrument that is serviced by or in
partnership with a utility company for energy efficiency improvements and repaid by the customer on its monthly utility bill.
Integrating loan payments with energy bills and allowing utilities to cut off energy supply to defaulting customers has the
potential to both lower collection costs and enhance credit quality of the financing scheme, thereby lowering financing costs.
Payment via the utility bill reduces the risk of credit default and lowers collection risk. OBF instruments can leverage a utility’s
unique relationship with energy customers to provide convenient access to funding for energy efficiency investments.
Utility CEO Forum on DSM Model DSM Policy
9
Utility driven Demand Side Management policy for Indian states
In exercise of powers conferred by Section 108 of the Electricity Act, 2003, the state government hereby notifies the following policy for promoting the Utility driven Demand Side Management in the state.
Preamble This section should adequately address the need for DSM investments in the state. The section should be reflective of the current scenario of the state's power sector, issues with rising power demand, financial health of the utilities and other driving factors for adopting DSM in the state. Modifications may be required to incorporate state specific conditions and attributes. Trends relating to electricity consumption, peak demand and per-capita consumption of electricity can be provided to substantiate the claims made in this section.
Various factors such as increasing economic activity and population growth are resulting in additional pressure on ever-increasing power demand when the state is already facing acute power shortages. Bridging demand supply gaps through cost-effective resource acquisition has been one of the biggest challenges for state governments.
International experience suggests that DSM can be successful in acquiring cost-effective resources for bridging demand-supply gaps. DSM explicitly refers to all those activities that involve deliberate intervention by the utility in the marketplace so as to alter the consumer's load profile. DSM programmes can help utilities meet peak power requirements in a cost-effective manner, flatten the overall load curve, reduce energy costs for both the utility, and its customers, and in the long term, limit or delay the requirement for further generation capacity augmentation. In summary, well designed DSM measures can improve the service quality of the utility through enhanced system reliability, promote efficient end use of electricity by utility customers and enhance customer satisfaction. Apart from the direct benefits to utilities and their customers, there are environmental benefits derived from DSM programmes. DSM programmes can substitute for power plants and result in fewer green house gas emissions and also help the country improve its energy intensity. Therefore DSM has never been more important than it is now.
Utility driven DSM in the state has been recognised and accorded priority with several actions initiated to facilitate and ensure its implementation. However, the electricity industry, being a regulated industry, needs a clear, unambiguous and explicit mandate to invest in cost-effective DSM resources. The absence of a clear quantified target or goal, in terms of reduction in kWh/MW, is also allowing the state's utilities to delay investments towards megawatt scale DSM programmes. There is also a lack of mechanism for coordination between various stakeholders such as state designated agency (SDA), state distribution licensee (Utility), bureau of energy efficiency (BEE) and state electricity regulatory commission (SERC) to undertake DSM activities.
In this regard, the state government, while taking cognisance of the slow progress of DSM investments in the state, intends to notify the 'state DSM policy', focussed to provide a clear vision, target, obligatory functions, incentives and a roadmap that can guide its stakeholders for scaling up the acquisition of cost-effective DSM resources in meeting the state's electricity demand.
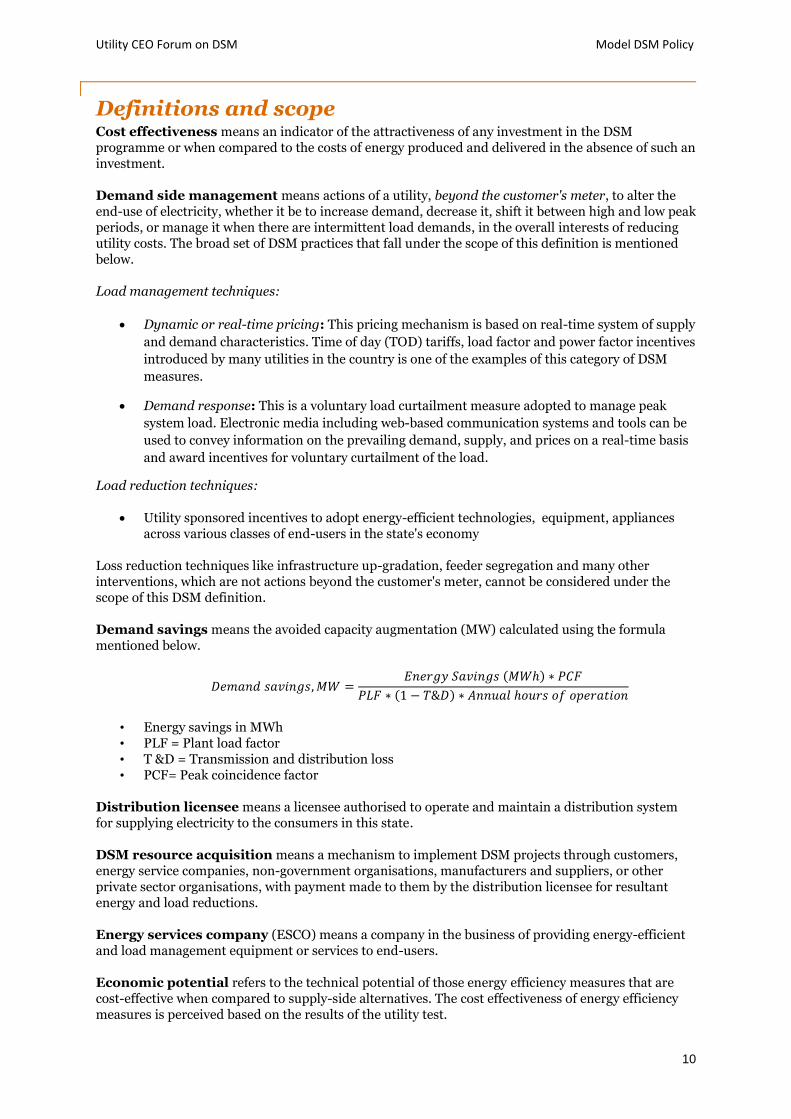
Utility CEO Forum on DSM Model DSM Policy
10
Definitions and scope Cost effectiveness means an indicator of the attractiveness of any investment in the DSM programme or when compared to the costs of energy produced and delivered in the absence of such an investment.
Demand side management means actions of a utility, beyond the customer's meter, to alter the end-use of electricity, whether it be to increase demand, decrease it, shift it between high and low peak periods, or manage it when there are intermittent load demands, in the overall interests of reducing utility costs. The broad set of DSM practices that fall under the scope of this definition is mentioned below.
Load management techniques:
Dynamic or real-time pricing: This pricing mechanism is based on real-time system of supply
and demand characteristics. Time of day (TOD) tariffs, load factor and power factor incentives
introduced by many utilities in the country is one of the examples of this category of DSM
measures.
Demand response: This is a voluntary load curtailment measure adopted to manage peak
system load. Electronic media including web-based communication systems and tools can be
used to convey information on the prevailing demand, supply, and prices on a real-time basis
and award incentives for voluntary curtailment of the load.
Load reduction techniques:
Utility sponsored incentives to adopt energy-efficient technologies, equipment, appliances across various classes of end-users in the state's economy
Loss reduction techniques like infrastructure up-gradation, feeder segregation and many other interventions, which are not actions beyond the customer's meter, cannot be considered under the scope of this DSM definition.
Demand savings means the avoided capacity augmentation (MW) calculated using the formula mentioned below.
• Energy savings in MWh • PLF = Plant load factor • T &D = Transmission and distribution loss • PCF= Peak coincidence factor
Distribution licensee means a licensee authorised to operate and maintain a distribution system for supplying electricity to the consumers in this state.
DSM resource acquisition means a mechanism to implement DSM projects through customers, energy service companies, non-government organisations, manufacturers and suppliers, or other private sector organisations, with payment made to them by the distribution licensee for resultant energy and load reductions.
Energy services company (ESCO) means a company in the business of providing energy-efficient and load management equipment or services to end-users.
Economic potential refers to the technical potential of those energy efficiency measures that are cost-effective when compared to supply-side alternatives. The cost effectiveness of energy efficiency measures is perceived based on the results of the utility test.
Utility CEO Forum on DSM Model DSM Policy
11
Bi = Binary factor representing the result of utility cost effectiveness test of individual energy efficiency measures
Cost elements for the utility test shall be determined considering the following.
Incentive shared by the utility
Programme administration, monitoring and evaluation costs
Programme marketing costs
The benefits of the utility test should be equal to the marginal cost of energy sold by the utility minus the loss of revenue resulting from the energy savings.
The benefits have to be valued over the period which the assessment is to be carried out. While calculating energy and demand savings as benefits, year-on-year escalation rate of 5% should be considered. Tests should consider a discount rate of 10.5%. Both benefits and costs shall be calculated over the ’life’ of the technology being deployed. The ’life’ should be the ’warranted’ life of the retrofit by the technology provider as it is important to ensure that the savings considered are realised over the life-span of the equipment or appliances.
Monitoring and reporting means activities which monitor and evaluate the progress of DSM/energy efficiency programmes of the distribution licensee.
Notification means notification published in the official gazette and the consequent expression ’notify’ shall be construed accordingly.
Technical potential is a theoretical construct of the technical upper bound of energy efficiency and conservation potential with complete market penetration of energy-efficiency practices, deemed technically feasible from an engineering perspective. Technical potential does not consider cost or acceptability factors of the customer. It does not reflect a level of potential that is achievable through voluntary energy efficiency programmes. Technical feasibility limits installation to situations where installation is physically practical (e.g., available space, noise considerations, and lighting level requirements are considered, among other things). This potential can be estimated using a bottom-up approach by evaluating the entire umbrella of energy efficiency measures. Annexure-1 provides a broad set of energy efficiency practices, technologies, appliances and equipment for different end-use applications, categorised under various sectors of Indian economy.
The market size is an estimate of the overall connected load of the specific end-use appliance or technology in a definite geographical region. The penetration factor is an estimate of the current market penetration of energy efficiency technology in the overall market size. The penetration factor and the market size can be estimated through primary surveys using questionnaires.
State designated agency (SDA) means the agency designated, under clause (d) of section 15 of the Energy Conservation Act 2001, to coordinate, regulate and enforce provisions of this act within the state.
State electricity regulatory commission (SERC) means the agency constituted under sub-section (1) of section 82 of the Electricity Act 2003.
Utility means the distribution licensee.
Utility CEO Forum on DSM Model DSM Policy
12
DSM policy objectives4 The objectives defined here should focus on achieving the key drivers for DSM investments, discussed in the preamble.
To control, reduce and influence electricity demand by implementation of suitable energy efficiency and load management measures
To encourage consumers to amend their electricity consumption pattern both with respect to timing and level of electricity demand for efficient use of energy
To complement supply side strategies to help licensees avoid or postpone costly capacity (generation, transmission and distribution network) additions by slowing demand growth
To lower overall cost of electricity to consumers by economical and efficient use of resources
To reduce environmental damage by reducing emission of greenhouse gases
To supplement national level efforts for implementation of various DSM schemes set out by the Ministry of Power, Govt. of India
Strategic efforts to induce lasting structural or behavioural changes in the market that result in increased adoption of energy-efficient technologies, services and practices
Vision of the state government The DSM vision should be guided by the economic potential for energy and demand savings in the state.
The state is committed to eradicate power shortages and become a leader in providing reliable electric power to its people. Therefore, the state has a vision of saving _ _ _ _ GWh of electricity consumption and _ _ MW of peak electric demand by Year.
This vision of the state is also committed to provide clean environment to its people by translating the envisaged savings to delay _ _MW of generation capacity augmentation through fossil fuels and avoid _ _ thousand tonnes of CO2 emissions into the atmosphere.
Policy title and enforcement This policy will be known as the state demand side management policy Year' and will be enforced from the date of its notification in the official gazette of the state government. The state government will undertake a review of this policy as and when required in view of any technological breakthrough or any changes taking place in the policy at the national level.
Target for promotion of utility driven DSM at the state level
5% reduction in electricity consumption by Year
1% reduction in peak electric demand by Year
The baseline for the above mentioned targets shall be the overall electricity sales and average peak electric demand recorded in the last financial year.
DSM obligation / state's loading order Through this policy, the state establishes its 'loading order' for prioritising resource acquisition options while meeting the state's energy needs. The 'loading order' envisaged in this policy requires that the state, in meeting its energy needs for every MYT control period, will invest first in DSM resources, which are cost-effective, reliable, and feasible, before considering other resources for electricity supply. However, the investment towards DSM resources may be limited to the available capacity, which shall be guided by the targets notified by the SERC.
4 GERC DSM Objectives, August, 2012
Utility CEO Forum on DSM Model DSM Policy
13
Financing of DSM Programs The distribution licensees shall budget the DSM programme costs (inclusive of the administrative, promotional/marketing and outreach costs) every year in the annual revenue requirement (ARR) and seek SERC approval to recover the same through consumer tariffs.
Incentive to the state's distribution licensees The SERC shall allow the DSM programme costs (only the direct costs that exclude administrative and promotional costs) to be treated as capital expenditure during the Annual Revenue Requirement (ARR)/MYT approval process. This capitalisation is intended to compensate the perceived loss of return on equity investments of distribution infrastructure, which would have been necessary to accommodate the rising power demand, in the absence of large-scale DSM investments.
For all the DSM investments that materialise beyond the achievement of the target notified in this policy, within the same control period, the SERC shall allow a higher return on equity investments (five basis points more than the existing norm) made by the distribution licensees.
Apart from this, the SERC shall evaluate, at the end of every control period, the impact of DSM investments made by the Distribution Licensees in the state and a consolidated rating shall be published, rewarding top performing utilities for their performance in implementing utility driven DSM programs.
Nodal agency The state designated agency (SDA) for energy efficiency and conservation will be the nodal agency for facilitating and implementing this policy. The nodal agency shall advise the state electricity regulatory commission (SERC) to notify relevant regulations, in alignment with this policy, and enable the state's distribution licensees to invest in DSM resources. The nodal agency shall undertake a comprehensive load and market research in order to estimate the technical and economic potential for utility driven DSM practices in the state. The nodal agency shall facilitate the capacity building of DSM cells within the state owned distribution licensees and ensure that these DSM cells are provided with essential resources to plan, design and implement the megawatt scale DSM programmes. The nodal agency shall also promote capacity building of energy service companies that play a vital role in the value chain of DSM programmes.
Formation of empowered committee An empowered committee, under the chairmanship of the Principal Secretary, Energy Department, will review and monitor the progress of the state's DSM policy at the end of every MYT control period and take appropriate actions to achieve the policy objectives. The committee may also undertake a review of this policy as and when required in view of any technological breakthrough or any changes taking place in the policy at the national level. The empowered committee will comprise the following members.
Principal Secretary, Energy Department Chairperson, SERC
MD, State Designate Agency for Energy Efficiency and Conservation CMDs of state's distribution licensees
Roadmap for DSM process and programme implementation
DSM regulations The SERC shall notify DSM regulations within three months of the date of announcement of this policy in the official gazette of the state government. The DSM regulations shall be in alignment with the state's DSM policy, specify the envisaged loading order, provide the DSM resource acquisition
Utility CEO Forum on DSM Model DSM Policy
14
framework and also specify a mechanism that allows the distribution licensees in the state to recover DSM resource costs from the rate payers/consumers.
Constitution of DSM cell Every distribution licensee in the state shall constitute a DSM cell within one month of adoption of these regulations. The distribution licensee is required to constitute a dedicated team of officials with necessary authority and resources to undertake the functions assigned to it under these regulations.
DSM potential in the state The nodal agency shall, within one year of the notification of this policy, undertake a comprehensive load and market research in order to estimate the technical and economic potential (indicated in this section) for utility driven DSM practices in the state. The nodal agency may adopt questionnaire based primary surveys to collect relevant information, from various sectors of the economy, in order to understand the load profiles of different consumer categories and capture end-use appliance contribution in the overall load profile. The primary surveys should also capture information required to estimate the market size and penetration factors of proven energy efficiency technologies, appliances, equipment across various end-use applications. Annexure 1 provides a comprehensive list of these proven energy efficiency practices categorised under major sectors of the economy. The nodal agency should also adopt a bottom-up approach and study the load profile, market size and penetration factors separately for various distribution licensees in the state.
The nodal agency shall submit the assessment of technical and economic potential of DSM, studied through load/market research, to the empowered committee within one year of the notification of this policy.
Goal and target setting The empowered committee shall review the DSM potential within 3 months of submission of the same by the nodal agency. This review may recommend suitable target enhancements, which should be guided by the economic potential for energy/demand savings in the state and also the impact of DSM investments on consumer tariffs. The empowered committee shall make suitable amendments in the state DSM policy to reflect the target enhancements.
Based on the policy amendments published by the empowered committee, the SERC shall make suitable amendments in the DSM regulations for allowing the revision of annual or multi-year DSM targets. The SERC shall be guided by the state's DSM policy targets while setting up such annual or multi-year DSM targets for distribution licensees. The SERC shall also advise the state government in periodic review of targets and suggest revisions if required.
Multi -year DSM planning The distribution licensee shall formulate and submit to the SERC, a perspective Multi-year DSM plan corresponding to the MYT control period, within six months of notification/revision of DSM goals and target by the SERC.
The plan shall include the following:
An overall goal for DSM plan guided by the target set by SERC
Description of DSM programmes, measures, baseline, programme design, incentives, target consumer segment, technology, appliance, marketing strategy
Implementation mechanism and schedule of each programme in the plan as a whole
Monitoring and reporting plan of DSM programmes
Detailed cost effectiveness assessment of programmes
Utility CEO Forum on DSM Model DSM Policy
15
While formulating the Multi-year DSM plan, the Distribution licensee shall be guided by the following guidelines, issued by the SERC. Such guidelines shall be accompanied along with the regulations notified by SERC.
Guidelines for preparing a Multi-year DSM Plan document - should specify the key elements of the DSM plan and DSM Programme documents to be developed by Utilities
Guidelines for DSM programme design and implementation mechanisms
Guidelines for monitoring and reporting of DSM programmes
Guidelines for evaluation, measurement and verification of the impact of DSM programme implementation
Guidelines for establishing cost effectiveness of DSM programmes
Approval of multi -year DSM plan The SERC shall review the multi-year DSM plan submitted by the state's distribution licensees and adopt procedures as specified in the conduct of business regulations for according approval to the DSM plan. While approving the DSM plan, the SERC shall ensure that it is aligned with the state's DSM policy and may direct modifications if required.
DSM plan implementation The distribution licensees in the state shall implement the DSM programmes in the manner of the DSM plan as approved by the SERC.
Monitoring and reporting of DSM programmes The distribution licensees in the state shall implement the monitoring and reporting of DSM programmes in the manner of the DSM plan as approved by the SERC.
Verification and evaluation of DSM plan implementation The SERC shall verify and evaluate the impact of the DSM plan implementation at the end of every MYT control period. The SERC can engage an independent third party for undertaking this task. The distribution licensee shall make available necessary information or data to the SERC or third parties assigned by the commission to measure and verify the savings from DSM programmes.
Review and assessment of DSM targets Before the beginning of every new MYT control period, the SERC may revise the DSM targets and goals set for the state's distribution licensees if deemed necessary and should ensure the alignment of targets with the state's DSM policy.
Funding the activities of nodal agency Option 1: The SERC shall introduce a DSM surcharge for the selected consumers in the state and the revenue collected shall form a revolving fund which shall be managed by the nodal agency to implement this policy.
Option 2: The state government shall fund the activities of nodal agency from its annual budget.
The nodal agency shall use this fund for undertaking load/market research to study the DSM potential in the state after every control period. The nodal agency shall also use this fund to undertake capacity building activities and reward distribution licensees for achieving the targets.
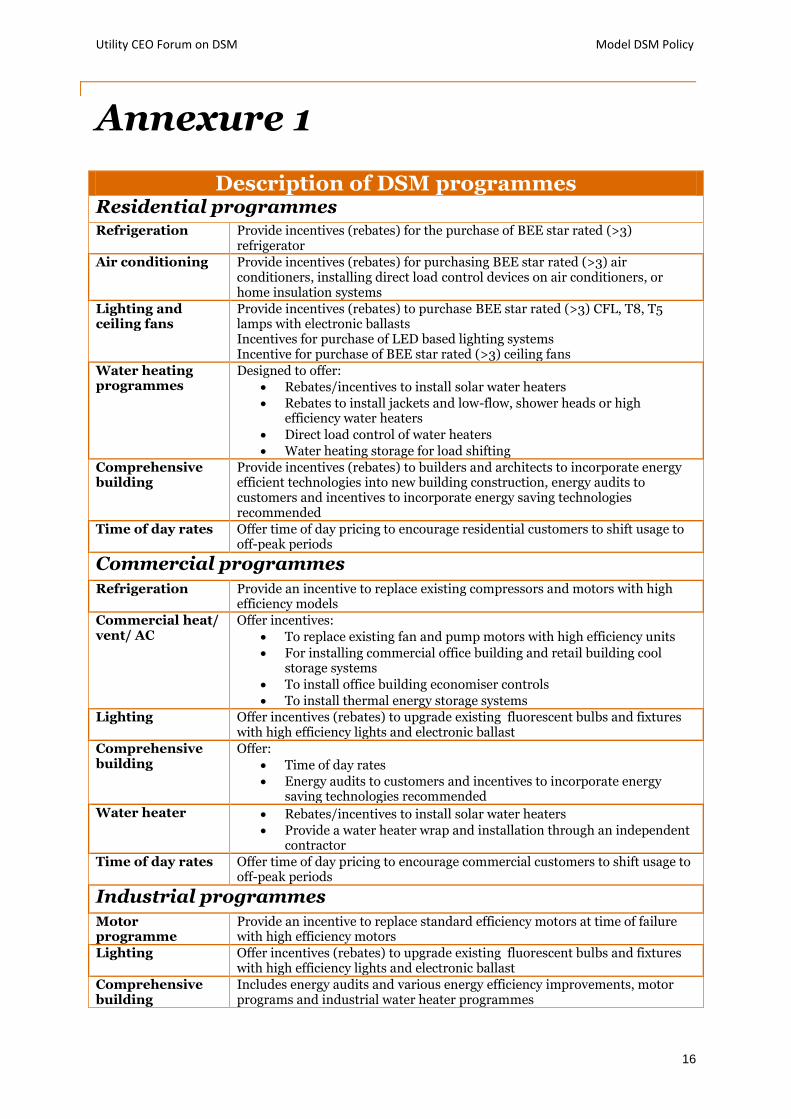
Utility CEO Forum on DSM Model DSM Policy
16
Annexure 1
Description of DSM programmes
Residential programmes
Refrigeration Provide incentives (rebates) for the purchase of BEE star rated (>3) refrigerator
Air conditioning Provide incentives (rebates) for purchasing BEE star rated (>3) air conditioners, installing direct load control devices on air conditioners, or home insulation systems
Lighting and ceiling fans
Provide incentives (rebates) to purchase BEE star rated (>3) CFL, T8, T5 lamps with electronic ballasts Incentives for purchase of LED based lighting systems Incentive for purchase of BEE star rated (>3) ceiling fans
Water heating programmes
Designed to offer:
Rebates/incentives to install solar water heaters
Rebates to install jackets and low-flow, shower heads or high efficiency water heaters
Direct load control of water heaters
Water heating storage for load shifting
Comprehensive building
Provide incentives (rebates) to builders and architects to incorporate energy efficient technologies into new building construction, energy audits to customers and incentives to incorporate energy saving technologies recommended
Time of day rates Offer time of day pricing to encourage residential customers to shift usage to off-peak periods
Commercial programmes
Refrigeration Provide an incentive to replace existing compressors and motors with high efficiency models
Commercial heat/ vent/ AC
Offer incentives:
To replace existing fan and pump motors with high efficiency units
For installing commercial office building and retail building cool storage systems
To install office building economiser controls
To install thermal energy storage systems
Lighting Offer incentives (rebates) to upgrade existing fluorescent bulbs and fixtures with high efficiency lights and electronic ballast
Comprehensive building
Offer:
Time of day rates
Energy audits to customers and incentives to incorporate energy saving technologies recommended
Water heater Rebates/incentives to install solar water heaters
Provide a water heater wrap and installation through an independent contractor
Time of day rates Offer time of day pricing to encourage commercial customers to shift usage to off-peak periods
Industrial programmes
Motor programme
Provide an incentive to replace standard efficiency motors at time of failure with high efficiency motors
Lighting Offer incentives (rebates) to upgrade existing fluorescent bulbs and fixtures with high efficiency lights and electronic ballast
Comprehensive building
Includes energy audits and various energy efficiency improvements, motor programs and industrial water heater programmes
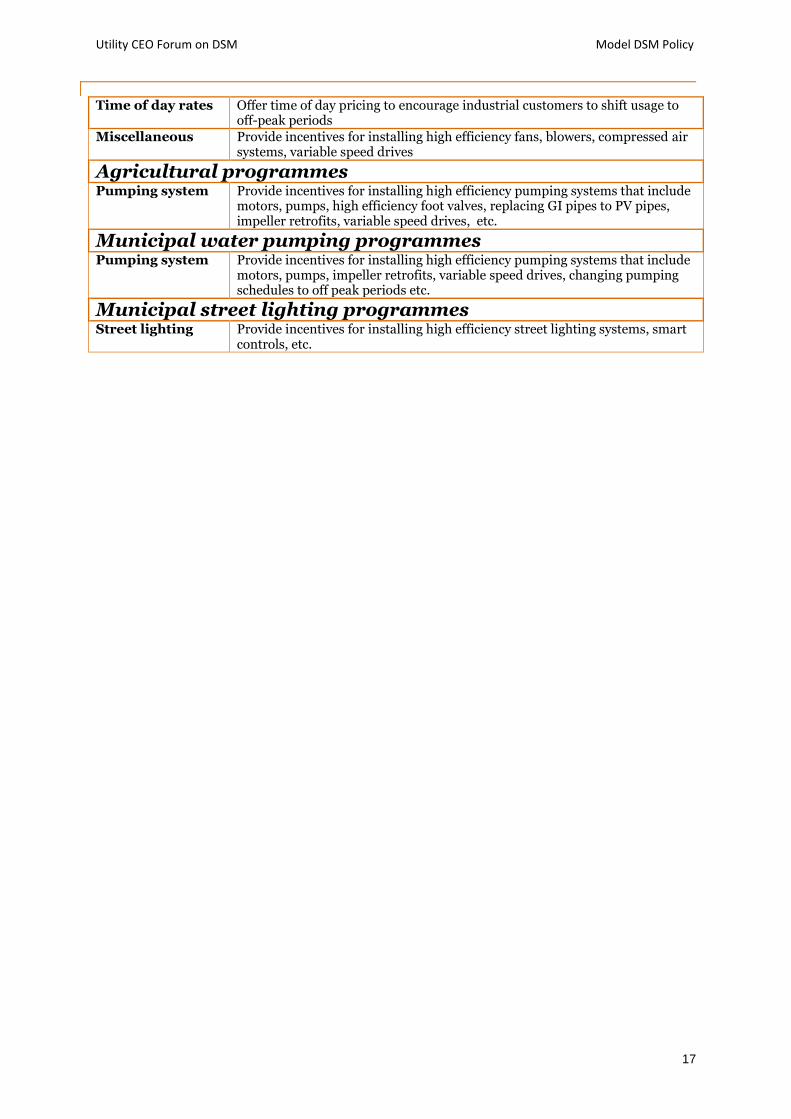
Utility CEO Forum on DSM Model DSM Policy
17
Time of day rates Offer time of day pricing to encourage industrial customers to shift usage to off-peak periods
Miscellaneous Provide incentives for installing high efficiency fans, blowers, compressed air systems, variable speed drives
Agricultural programmes
Pumping system Provide incentives for installing high efficiency pumping systems that include motors, pumps, high efficiency foot valves, replacing GI pipes to PV pipes, impeller retrofits, variable speed drives, etc.
Municipal water pumping programmes
Pumping system Provide incentives for installing high efficiency pumping systems that include motors, pumps, impeller retrofits, variable speed drives, changing pumping schedules to off peak periods etc.
Municipal street lighting programmes
Street lighting Provide incentives for installing high efficiency street lighting systems, smart controls, etc.
Utility CEO Forum on DSM Model DSM Policy
18
Closing statement
Disclaimer
This document is for general information purposes only, and should not be used as a substitute for consultation with professional advisors. No representation or warranty (express or implied) is given as to the accuracy or completeness of the information contained in this primer, and, to the extent permitted by law, PricewaterhouseCoopers Private Ltd, its members, employees and agents do not accept or assume any liability, responsibility or duty of care for any consequences of you or anyone else acting, or refraining to act, in reliance on the information contained in this primer or for any decision based on it.

This report is solely for the use and benefit of Shakti Sustainable Energy Foundation and should not be relied upon by any other part. Utility CEO Forum on Demand Side Management - Annual Report 2013 PwC
E. Proceedings: Second Meeting

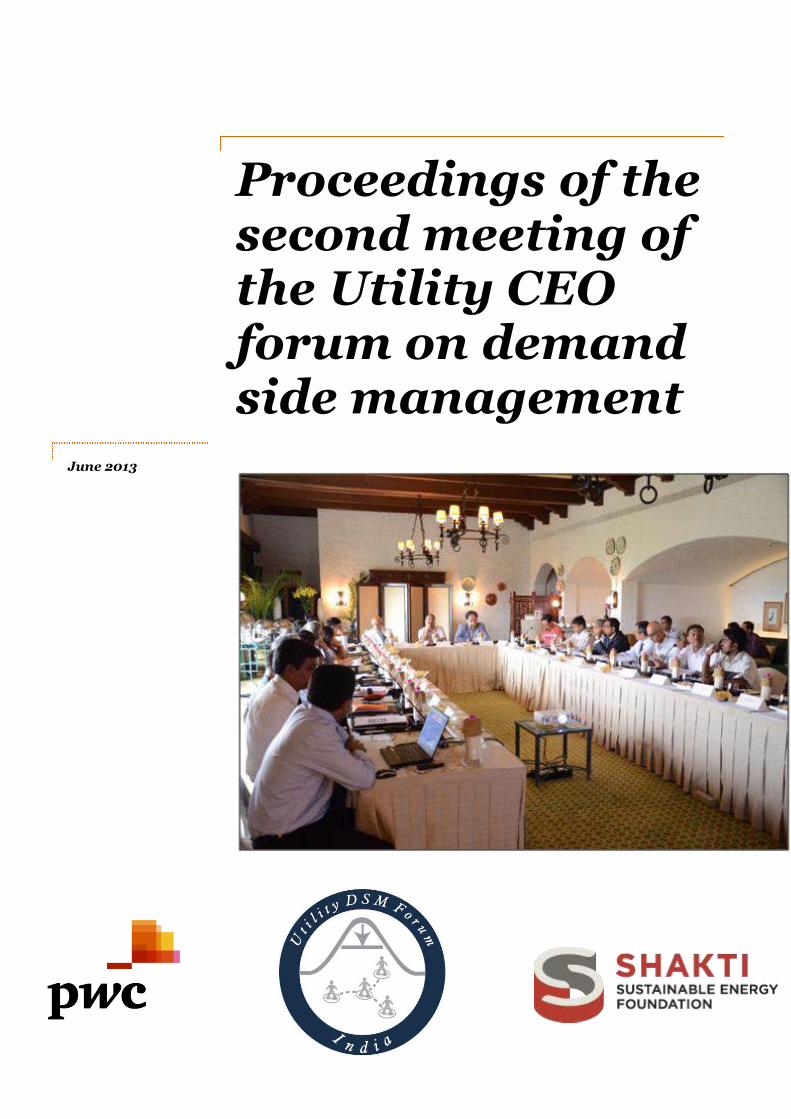
Proceedings of the second meeting of the Utility CEO forum on demand side management
June 2013

Utility CEO forum on DSM Proceedings of the Second Meeting
PwC Page 3 of 10
Table of contents Introduction .................................................................................................................................................................. 4
Welcome address .......................................................................................................................................................... 5
Setting the context ........................................................................................................................................................ 5
Presentation on the model state policy for utility- driven demand side management' ............................................ 6
The round table discussion facilitated by the Chairperson ..................................................................... 6
Presentation on renewable energy based demand side management in Tamil Nadu .............................................. 8
Presentation by EESL ................................................................................................................................................... 8
Way forward and agenda for the next meeting ........................................................................................................... 9
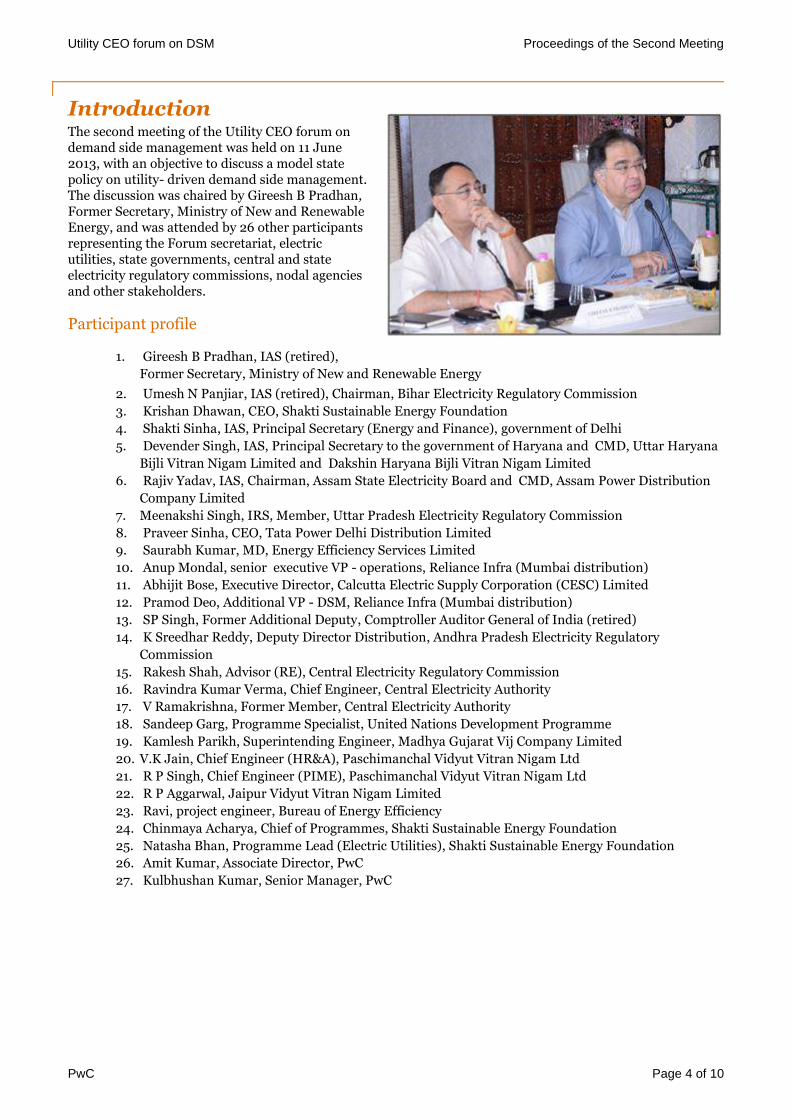
Utility CEO forum on DSM Proceedings of the Second Meeting
PwC Page 4 of 10
Introduction The second meeting of the Utility CEO forum on demand side management was held on 11 June 2013, with an objective to discuss a model state policy on utility- driven demand side management. The discussion was chaired by Gireesh B Pradhan, Former Secretary, Ministry of New and Renewable Energy, and was attended by 26 other participants representing the Forum secretariat, electric utilities, state governments, central and state electricity regulatory commissions, nodal agencies and other stakeholders.
Participant profile
1. Gireesh B Pradhan, IAS (retired),
Former Secretary, Ministry of New and Renewable Energy
2. Umesh N Panjiar, IAS (retired), Chairman, Bihar Electricity Regulatory Commission
3. Krishan Dhawan, CEO, Shakti Sustainable Energy Foundation
4. Shakti Sinha, IAS, Principal Secretary (Energy and Finance), government of Delhi
5. Devender Singh, IAS, Principal Secretary to the government of Haryana and CMD, Uttar Haryana
Bijli Vitran Nigam Limited and Dakshin Haryana Bijli Vitran Nigam Limited
6. Rajiv Yadav, IAS, Chairman, Assam State Electricity Board and CMD, Assam Power Distribution
Company Limited
7. Meenakshi Singh, IRS, Member, Uttar Pradesh Electricity Regulatory Commission
8. Praveer Sinha, CEO, Tata Power Delhi Distribution Limited
9. Saurabh Kumar, MD, Energy Efficiency Services Limited
10. Anup Mondal, senior executive VP - operations, Reliance Infra (Mumbai distribution)
11. Abhijit Bose, Executive Director, Calcutta Electric Supply Corporation (CESC) Limited
12. Pramod Deo, Additional VP - DSM, Reliance Infra (Mumbai distribution)
13. SP Singh, Former Additional Deputy, Comptroller Auditor General of India (retired)
14. K Sreedhar Reddy, Deputy Director Distribution, Andhra Pradesh Electricity Regulatory
Commission
15. Rakesh Shah, Advisor (RE), Central Electricity Regulatory Commission
16. Ravindra Kumar Verma, Chief Engineer, Central Electricity Authority
17. V Ramakrishna, Former Member, Central Electricity Authority
18. Sandeep Garg, Programme Specialist, United Nations Development Programme
19. Kamlesh Parikh, Superintending Engineer, Madhya Gujarat Vij Company Limited
20. V.K Jain, Chief Engineer (HR&A), Paschimanchal Vidyut Vitran Nigam Ltd
21. R P Singh, Chief Engineer (PIME), Paschimanchal Vidyut Vitran Nigam Ltd
22. R P Aggarwal, Jaipur Vidyut Vitran Nigam Limited
23. Ravi, project engineer, Bureau of Energy Efficiency
24. Chinmaya Acharya, Chief of Programmes, Shakti Sustainable Energy Foundation
25. Natasha Bhan, Programme Lead (Electric Utilities), Shakti Sustainable Energy Foundation
26. Amit Kumar, Associate Director, PwC
27. Kulbhushan Kumar, Senior Manager, PwC
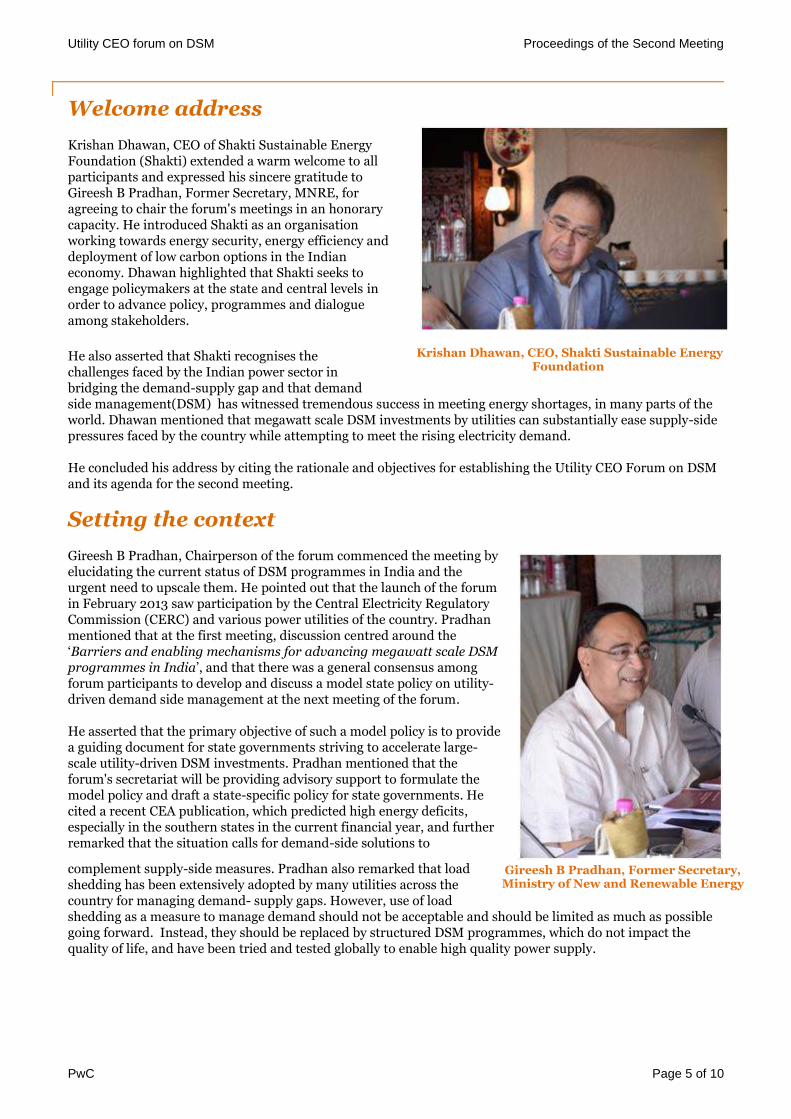
Utility CEO forum on DSM Proceedings of the Second Meeting
PwC Page 5 of 10
Welcome address
Krishan Dhawan, CEO of Shakti Sustainable Energy Foundation (Shakti) extended a warm welcome to all participants and expressed his sincere gratitude to Gireesh B Pradhan, Former Secretary, MNRE, for agreeing to chair the forum's meetings in an honorary capacity. He introduced Shakti as an organisation working towards energy security, energy efficiency and deployment of low carbon options in the Indian economy. Dhawan highlighted that Shakti seeks to engage policymakers at the state and central levels in order to advance policy, programmes and dialogue among stakeholders.
He also asserted that Shakti recognises the challenges faced by the Indian power sector in bridging the demand-supply gap and that demand side management(DSM) has witnessed tremendous success in meeting energy shortages, in many parts of the world. Dhawan mentioned that megawatt scale DSM investments by utilities can substantially ease supply-side pressures faced by the country while attempting to meet the rising electricity demand.
He concluded his address by citing the rationale and objectives for establishing the Utility CEO Forum on DSM and its agenda for the second meeting.
Setting the context
Gireesh B Pradhan, Chairperson of the forum commenced the meeting by elucidating the current status of DSM programmes in India and the urgent need to upscale them. He pointed out that the launch of the forum in February 2013 saw participation by the Central Electricity Regulatory Commission (CERC) and various power utilities of the country. Pradhan mentioned that at the first meeting, discussion centred around the ‘Barriers and enabling mechanisms for advancing megawatt scale DSM programmes in India’, and that there was a general consensus among forum participants to develop and discuss a model state policy on utility-driven demand side management at the next meeting of the forum.
He asserted that the primary objective of such a model policy is to provide a guiding document for state governments striving to accelerate large-scale utility-driven DSM investments. Pradhan mentioned that the forum's secretariat will be providing advisory support to formulate the model policy and draft a state-specific policy for state governments. He cited a recent CEA publication, which predicted high energy deficits, especially in the southern states in the current financial year, and further remarked that the situation calls for demand-side solutions to
complement supply-side measures. Pradhan also remarked that load shedding has been extensively adopted by many utilities across the country for managing demand- supply gaps. However, use of load shedding as a measure to manage demand should not be acceptable and should be limited as much as possible going forward. Instead, they should be replaced by structured DSM programmes, which do not impact the quality of life, and have been tried and tested globally to enable high quality power supply.
Krishan Dhawan, CEO, Shakti Sustainable Energy Foundation
Gireesh B Pradhan, Former Secretary, Ministry of New and Renewable Energy
Utility CEO forum on DSM Proceedings of the Second Meeting
PwC Page 6 of 10
Presentation on the model state policy for utility- driven demand side management' This presentation was delivered by Amit Kumar, Associate Director at PwC. It focused on the need for a state DSM policy, the current legal and policy framework, and the key elements of the proposed model policy. The presentation also covered the international best practice for creating an enabling policy framework for prioritizing DSM investments.
The presentation was followed by an enriching discussion and debate amongst the participants, facilitated by the Chairperson of the meeting.
The following sections briefly describe the comments and suggestions made by the participants on various elements of the model policy.
The round table discussion facilitated by the Chairperson
Definition of DSM: Shakti Sinha, the Principal Secretary from the Delhi government, remarked that the definition of DSM adopted in the model policy considers only the interest of the utilities and that the interests of the consumers have been neglected. The forum unanimously agreed that the definition of DSM must consider both utility and consumers interests.
From left to right: Shakti Sinha, the Principal Secretary, Delhi government and Umesh N Panjiar, the Chairperson of Bihar state electricity regulatory commission
DSM targets: V Ramakrishna, the former member of CEA, remarked that the DSM targets in the model policy need to be derived from a detailed load research study and through the assessment of the technical and economic potential of DSM. To this point, the Chairperson of the meeting opined that a detailed study may delay the whole process while Umesh N Panjiar, the chairperson of Bihar State Electricity Regulatory Commission, further explained that targets can be assessed quickly based on well- known established benchmarks of energy saving potential in various sectors of the economy. Saurabh Kumar of Energy Efficiency Services Limited cited that the Bureau of Energy Efficiency, in 2009, sponsored a study to assess energy saving potential in several states and across different electricity end-use sectors. He further explained that the findings of this study can be used to derive the overall potential for energy and peak demand savings, and subsequently establish targets under the State DSM Policies. Sandeep Garg, Program Specialist of UNDP cited that many BEE studies in the past have attempted to estimate the energy saving potential in various sectors of the economy. Ravindra Kumar Verma, Chief Engineer of CEA cited the findings of a recent
From left to right: Kulbhushan Kumar, Senior Manager, PwC and Amit Kumar, Associate Director, PwC
From (L - R) Kulbhushan Kumar and Amit Kumar
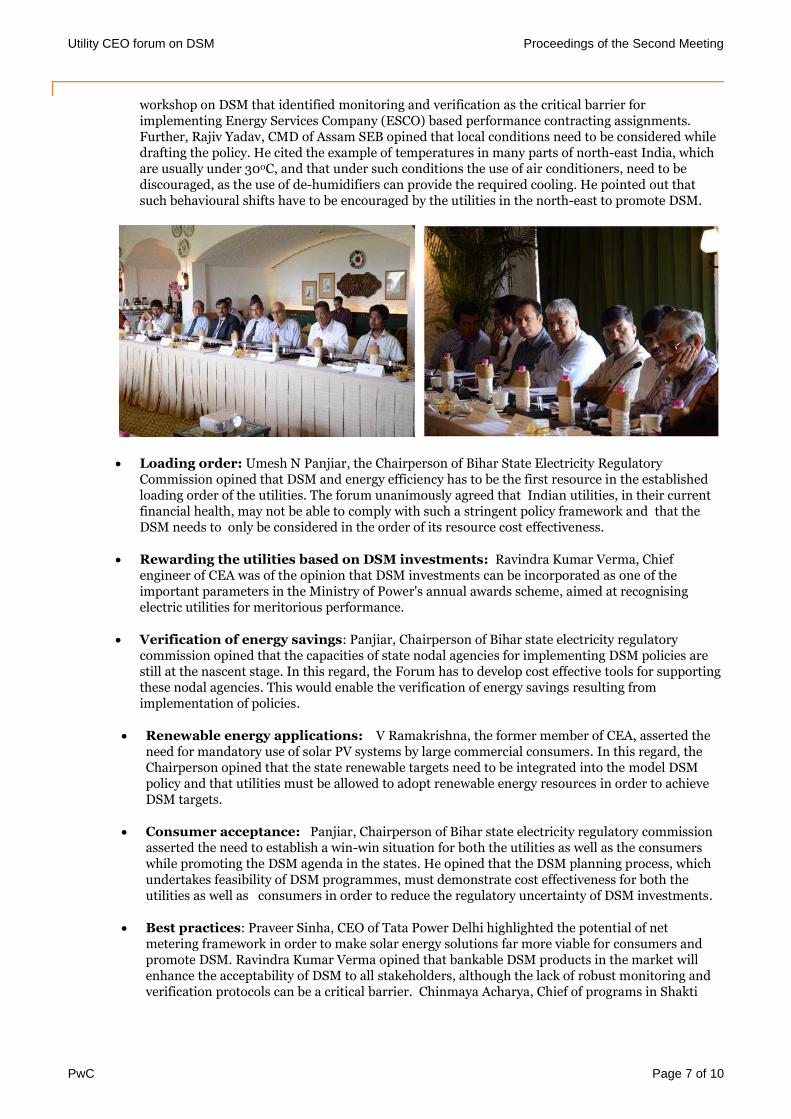
Utility CEO forum on DSM Proceedings of the Second Meeting
PwC Page 7 of 10
workshop on DSM that identified monitoring and verification as the critical barrier for implementing Energy Services Company (ESCO) based performance contracting assignments. Further, Rajiv Yadav, CMD of Assam SEB opined that local conditions need to be considered while drafting the policy. He cited the example of temperatures in many parts of north-east India, which are usually under 300C, and that under such conditions the use of air conditioners, need to be discouraged, as the use of de-humidifiers can provide the required cooling. He pointed out that such behavioural shifts have to be encouraged by the utilities in the north-east to promote DSM.
Loading order: Umesh N Panjiar, the Chairperson of Bihar State Electricity Regulatory Commission opined that DSM and energy efficiency has to be the first resource in the established loading order of the utilities. The forum unanimously agreed that Indian utilities, in their current financial health, may not be able to comply with such a stringent policy framework and that the DSM needs to only be considered in the order of its resource cost effectiveness.
Rewarding the utilities based on DSM investments: Ravindra Kumar Verma, Chief engineer of CEA was of the opinion that DSM investments can be incorporated as one of the important parameters in the Ministry of Power's annual awards scheme, aimed at recognising electric utilities for meritorious performance.
Verification of energy savings: Panjiar, Chairperson of Bihar state electricity regulatory commission opined that the capacities of state nodal agencies for implementing DSM policies are still at the nascent stage. In this regard, the Forum has to develop cost effective tools for supporting these nodal agencies. This would enable the verification of energy savings resulting from implementation of policies.
Renewable energy applications: V Ramakrishna, the former member of CEA, asserted the need for mandatory use of solar PV systems by large commercial consumers. In this regard, the Chairperson opined that the state renewable targets need to be integrated into the model DSM policy and that utilities must be allowed to adopt renewable energy resources in order to achieve DSM targets.
Consumer acceptance: Panjiar, Chairperson of Bihar state electricity regulatory commission asserted the need to establish a win-win situation for both the utilities as well as the consumers while promoting the DSM agenda in the states. He opined that the DSM planning process, which undertakes feasibility of DSM programmes, must demonstrate cost effectiveness for both the utilities as well as consumers in order to reduce the regulatory uncertainty of DSM investments.
Best practices: Praveer Sinha, CEO of Tata Power Delhi highlighted the potential of net metering framework in order to make solar energy solutions far more viable for consumers and promote DSM. Ravindra Kumar Verma opined that bankable DSM products in the market will enhance the acceptability of DSM to all stakeholders, although the lack of robust monitoring and verification protocols can be a critical barrier. Chinmaya Acharya, Chief of programs in Shakti
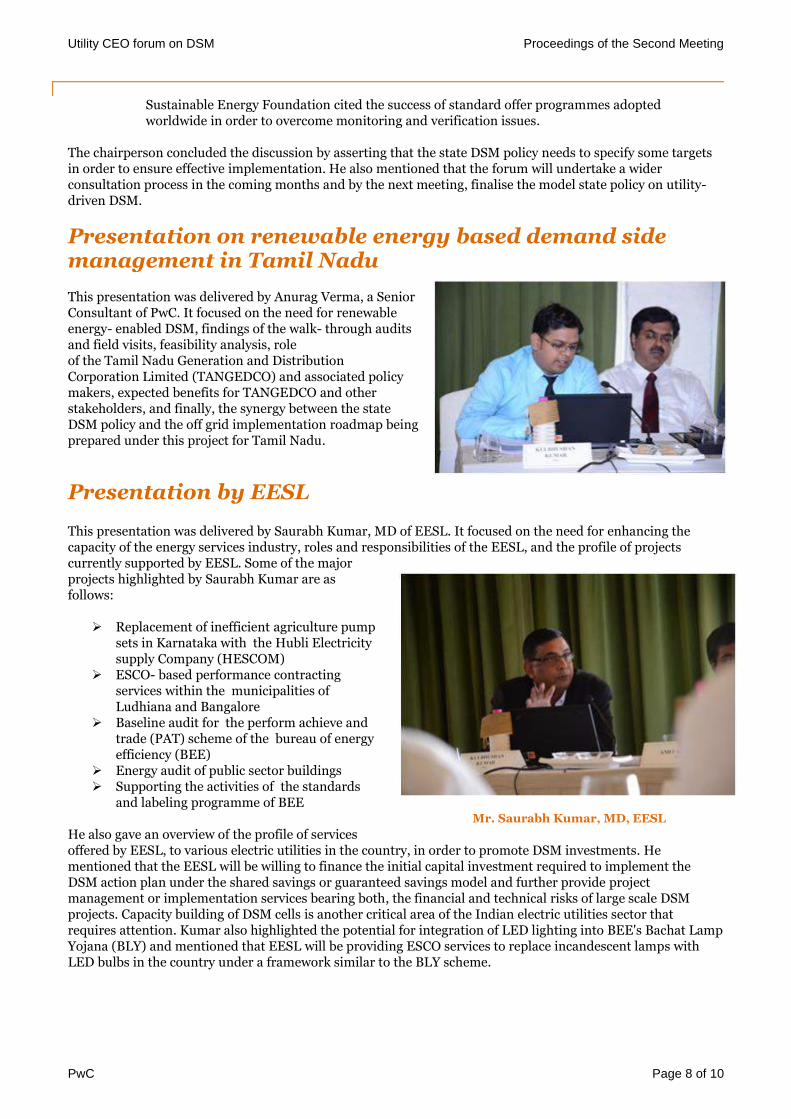
Utility CEO forum on DSM Proceedings of the Second Meeting
PwC Page 8 of 10
Sustainable Energy Foundation cited the success of standard offer programmes adopted worldwide in order to overcome monitoring and verification issues.
The chairperson concluded the discussion by asserting that the state DSM policy needs to specify some targets in order to ensure effective implementation. He also mentioned that the forum will undertake a wider consultation process in the coming months and by the next meeting, finalise the model state policy on utility-driven DSM.
Presentation on renewable energy based demand side management in Tamil Nadu This presentation was delivered by Anurag Verma, a Senior Consultant of PwC. It focused on the need for renewable energy- enabled DSM, findings of the walk- through audits and field visits, feasibility analysis, role of the Tamil Nadu Generation and Distribution Corporation Limited (TANGEDCO) and associated policy makers, expected benefits for TANGEDCO and other stakeholders, and finally, the synergy between the state DSM policy and the off grid implementation roadmap being prepared under this project for Tamil Nadu.
Presentation by EESL This presentation was delivered by Saurabh Kumar, MD of EESL. It focused on the need for enhancing the capacity of the energy services industry, roles and responsibilities of the EESL, and the profile of projects currently supported by EESL. Some of the major projects highlighted by Saurabh Kumar are as follows:
Replacement of inefficient agriculture pump sets in Karnataka with the Hubli Electricity supply Company (HESCOM)
ESCO- based performance contracting services within the municipalities of Ludhiana and Bangalore
Baseline audit for the perform achieve and trade (PAT) scheme of the bureau of energy efficiency (BEE)
Energy audit of public sector buildings Supporting the activities of the standards
and labeling programme of BEE
He also gave an overview of the profile of services offered by EESL, to various electric utilities in the country, in order to promote DSM investments. He mentioned that the EESL will be willing to finance the initial capital investment required to implement the DSM action plan under the shared savings or guaranteed savings model and further provide project management or implementation services bearing both, the financial and technical risks of large scale DSM projects. Capacity building of DSM cells is another critical area of the Indian electric utilities sector that requires attention. Kumar also highlighted the potential for integration of LED lighting into BEE's Bachat Lamp Yojana (BLY) and mentioned that EESL will be providing ESCO services to replace incandescent lamps with LED bulbs in the country under a framework similar to the BLY scheme.
Mr. Saurabh Kumar, MD, EESL
Utility CEO forum on DSM Proceedings of the Second Meeting
PwC Page 9 of 10
Way forward and agenda for the next meeting
The Chairperson of the meeting mentioned that the model DSM policy is currently in the draft stage and that the forum will aim to finalise the draft model DSM policy before the next meeting. In order to accomplish this, the forum will undertake a wider consultation process in the next few months, by seeking comments and suggestions from stakeholders across the country. Apart from this, the forum also debated other themes for discussion for the next meeting. Innovative DSM programme designs and monitoring and verification were the two broad areas of choice of the forum.
Praveer Sinha, CEO of Tata Power Delhi and Mr. Anup Mondal, Senior executive VP of Reliance Infra sought to make separate presentations on DSM pilot programmes, initiated by their respective organisations for the next meeting. The Chairperson welcomed these requests and indicated that the forum will be incorporating their presentations in the agenda of next meeting.
Shakti Sinha from the Delhi government sought the forum's support for formulating the DSM policy and for the state of Delhi. The Chairperson welcomed the request and indicated that Shakti Sustainable Energy Foundation and PwC will provide the required support to the Delhi government in its quest for notifying the state policy on utility-driven DSM.
Utility CEO forum on DSM Proceedings of the Second Meeting
Disclaimer
This publication has been prepared for general guidance on matters of interest only, and does not constitute professional advice. You should not act upon the information contained in this publication without obtaining specific professional advice. No representation or warranty (express or implied) is given as to the accuracy or completeness of the information contained in this report, and, to the extent permitted by law, PricewaterhouseCoopers Private Limited, its members, employees and agents do not accept or assume any liability, responsibility or duty of care for any consequences of you or anyone else acting, or refraining to act, in reliance on the information contained in this report or for any decision based on it.
Copyright
© 2013 PricewaterhouseCoopers Private Limited. All rights reserved. In this document, “PwC” refers to PricewaterhouseCoopers Private Limited (a limited liability company in India), which is a member firm of PricewaterhouseCoopers International Limited (PwCIL), each member firm of which is a separate legal entity.
This report is solely for the use and benefit of Shakti Sustainable Energy Foundation and should not be relied upon by any other part. Utility CEO Forum on Demand Side Management - Annual Report 2013 PwC
F. Theme Paper: Electric utility load research and DSM programme design

Draft for discussion purposes only
Electric utility load research and DSM programme design Utility CEO Forum on Demand Side Management
August 2013
Abstract Draft for discussion purposes only
PwC 2
Abstract
This paper is the third among the series of background papers developed for the participants of meetings held
by the Utility CEO Forum on Demand Side Management.
Load research marks the beginning of the process of acquiring cost-effective demand side resources by electric
utilities. Demand side resources constitute energy and demand savings resulting from the actions of a utility,
beyond the customer's meter. Load research helps electric utilities to identify strategic demand side
management (DSM) measures and also quantify the resource potential for those measures. In the recent past,
many state electricity regulatory commissions have directed electric utilities to undertake load research in order
to estimate the potential of demand side resources available with the utilities. The Bureau of Energy Efficiency
also recognizes load research as a critical component in the overall DSM process cycle driven by utilities. This is
evident as BEE seeks to provide technical assistance for the DSM cells, established within the electric utilities,
to undertake load research studies during the 12th Five Year Plan (FYP).
Similarly, DSM programme design is an integral part of the overall DSM resource acquisition process. After a
decision has been made to proceed with a DSM measure, the utility should design a programme in order to
reach the target customers, at a reasonable scale, and motivate them through incentive payments and
information campaigns. The program design phase constitutes assessment of incentives, program goals,
program budget, selection of appropriate delivery mechanisms, marketing platforms, monitoring and
verification protocols.
Many State-owned electric utilities within the country are still unaware of the commonly adopted methods for
load research and successful programme designs for rolling out DSM measures. Therefore, this paper provides
an illustration of conducting load research through a case study in one of the states (Himachal Pradesh) of
India. The paper also describes some of the most successful DSM program designs, summarizes their key
features and provides examples of adoption in India as well as in other parts of the world.
Table of Contents Draft for discussion purposes only
Table of contents
1. Introduction to load research 4
1.1. Load research activities 5
1.2. Sampling methodology for load research activities 7
2. Case study: Load research in Himachal Pradesh 9
2.1. Sampling process 9
2.2. Load research activities in Himachal Pradesh 11
2.3. Findings of the load research study in Himachal Pradesh 11
3. Introduction to the DSM programme designs 16
Rebate programmes 16
Direct install programmes 18
Bid programmes 18
Standard offer programme 20
Appendix 1 A - Sample questionnaires for load and market survey 23
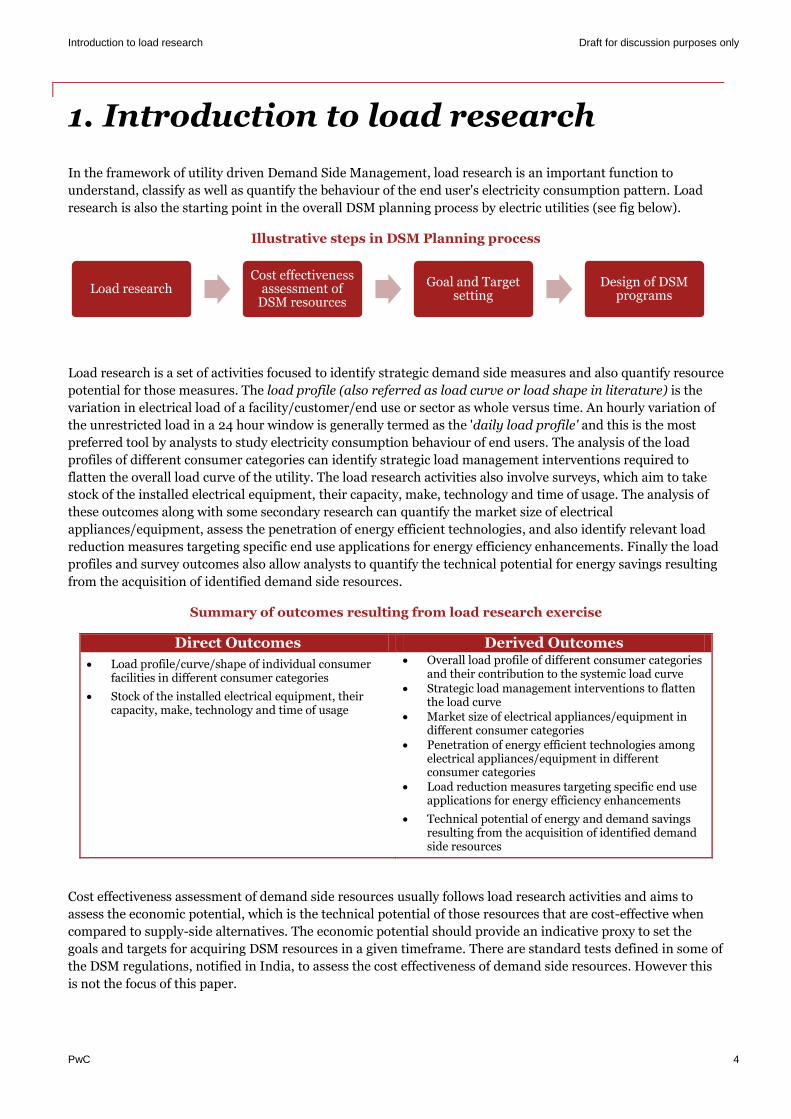
Introduction to load research Draft for discussion purposes only
PwC 4
1. Introduction to load research
In the framework of utility driven Demand Side Management, load research is an important function to
understand, classify as well as quantify the behaviour of the end user's electricity consumption pattern. Load
research is also the starting point in the overall DSM planning process by electric utilities (see fig below).
Illustrative steps in DSM Planning process
Load research is a set of activities focused to identify strategic demand side measures and also quantify resource
potential for those measures. The load profile (also referred as load curve or load shape in literature) is the
variation in electrical load of a facility/customer/end use or sector as whole versus time. An hourly variation of
the unrestricted load in a 24 hour window is generally termed as the 'daily load profile' and this is the most
preferred tool by analysts to study electricity consumption behaviour of end users. The analysis of the load
profiles of different consumer categories can identify strategic load management interventions required to
flatten the overall load curve of the utility. The load research activities also involve surveys, which aim to take
stock of the installed electrical equipment, their capacity, make, technology and time of usage. The analysis of
these outcomes along with some secondary research can quantify the market size of electrical
appliances/equipment, assess the penetration of energy efficient technologies, and also identify relevant load
reduction measures targeting specific end use applications for energy efficiency enhancements. Finally the load
profiles and survey outcomes also allow analysts to quantify the technical potential for energy savings resulting
from the acquisition of identified demand side resources.
Summary of outcomes resulting from load research exercise
Direct Outcomes Derived Outcomes
Load profile/curve/shape of individual consumer facilities in different consumer categories
Stock of the installed electrical equipment, their capacity, make, technology and time of usage
Overall load profile of different consumer categories and their contribution to the systemic load curve
Strategic load management interventions to flatten the load curve
Market size of electrical appliances/equipment in different consumer categories
Penetration of energy efficient technologies among electrical appliances/equipment in different consumer categories
Load reduction measures targeting specific end use applications for energy efficiency enhancements
Technical potential of energy and demand savings resulting from the acquisition of identified demand side resources
Cost effectiveness assessment of demand side resources usually follows load research activities and aims to
assess the economic potential, which is the technical potential of those resources that are cost-effective when
compared to supply-side alternatives. The economic potential should provide an indicative proxy to set the
goals and targets for acquiring DSM resources in a given timeframe. There are standard tests defined in some of
the DSM regulations, notified in India, to assess the cost effectiveness of demand side resources. However this
is not the focus of this paper.
Load research Cost effectiveness
assessment of DSM resources
Goal and Target setting
Design of DSM programs
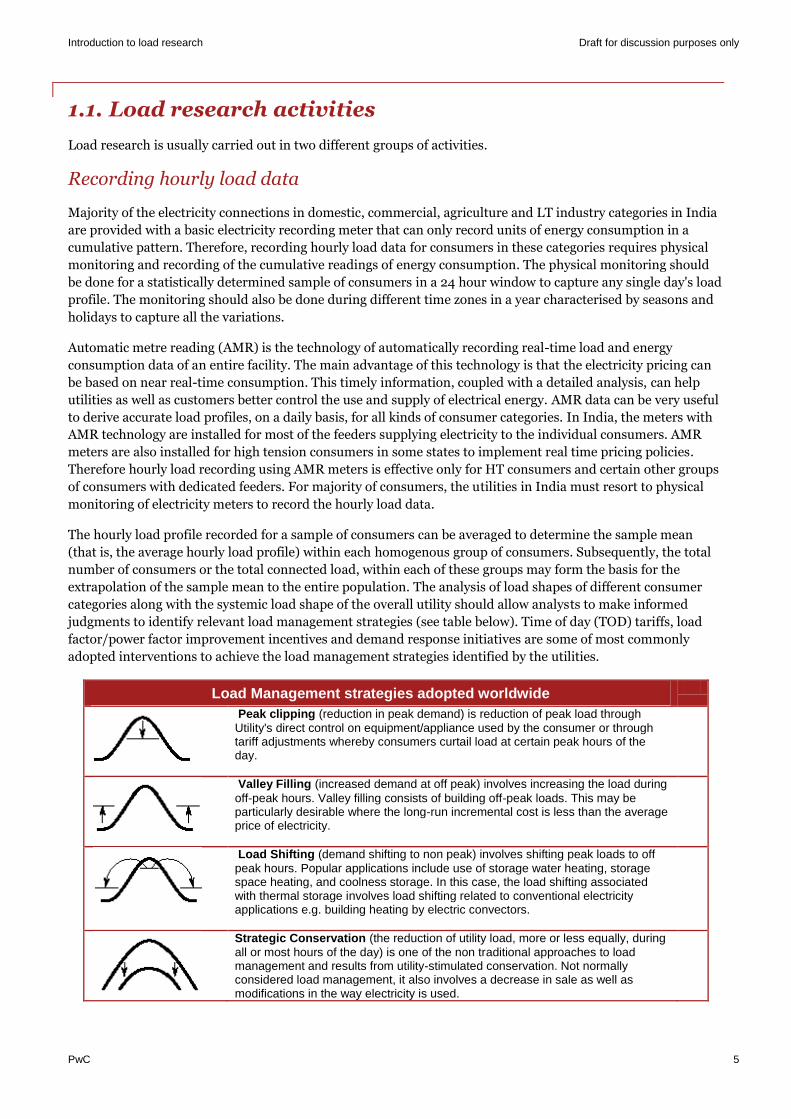
Introduction to load research Draft for discussion purposes only
PwC 5
1.1. Load research activities
Load research is usually carried out in two different groups of activities.
Recording hourly load data
Majority of the electricity connections in domestic, commercial, agriculture and LT industry categories in India
are provided with a basic electricity recording meter that can only record units of energy consumption in a
cumulative pattern. Therefore, recording hourly load data for consumers in these categories requires physical
monitoring and recording of the cumulative readings of energy consumption. The physical monitoring should
be done for a statistically determined sample of consumers in a 24 hour window to capture any single day's load
profile. The monitoring should also be done during different time zones in a year characterised by seasons and
holidays to capture all the variations.
Automatic metre reading (AMR) is the technology of automatically recording real-time load and energy
consumption data of an entire facility. The main advantage of this technology is that the electricity pricing can
be based on near real-time consumption. This timely information, coupled with a detailed analysis, can help
utilities as well as customers better control the use and supply of electrical energy. AMR data can be very useful
to derive accurate load profiles, on a daily basis, for all kinds of consumer categories. In India, the meters with
AMR technology are installed for most of the feeders supplying electricity to the individual consumers. AMR
meters are also installed for high tension consumers in some states to implement real time pricing policies.
Therefore hourly load recording using AMR meters is effective only for HT consumers and certain other groups
of consumers with dedicated feeders. For majority of consumers, the utilities in India must resort to physical
monitoring of electricity meters to record the hourly load data.
The hourly load profile recorded for a sample of consumers can be averaged to determine the sample mean
(that is, the average hourly load profile) within each homogenous group of consumers. Subsequently, the total
number of consumers or the total connected load, within each of these groups may form the basis for the
extrapolation of the sample mean to the entire population. The analysis of load shapes of different consumer
categories along with the systemic load shape of the overall utility should allow analysts to make informed
judgments to identify relevant load management strategies (see table below). Time of day (TOD) tariffs, load
factor/power factor improvement incentives and demand response initiatives are some of most commonly
adopted interventions to achieve the load management strategies identified by the utilities.
Load Management strategies adopted worldwide
Peak clipping (reduction in peak demand) is reduction of peak load through Utility's direct control on equipment/appliance used by the consumer or through tariff adjustments whereby consumers curtail load at certain peak hours of the day.
Valley Filling (increased demand at off peak) involves increasing the load during off-peak hours. Valley filling consists of building off-peak loads. This may be particularly desirable where the long-run incremental cost is less than the average price of electricity.
Load Shifting (demand shifting to non peak) involves shifting peak loads to off peak hours. Popular applications include use of storage water heating, storage space heating, and coolness storage. In this case, the load shifting associated with thermal storage involves load shifting related to conventional electricity applications e.g. building heating by electric convectors.
Strategic Conservation (the reduction of utility load, more or less equally, during all or most hours of the day) is one of the non traditional approaches to load management and results from utility-stimulated conservation. Not normally considered load management, it also involves a decrease in sale as well as modifications in the way electricity is used.
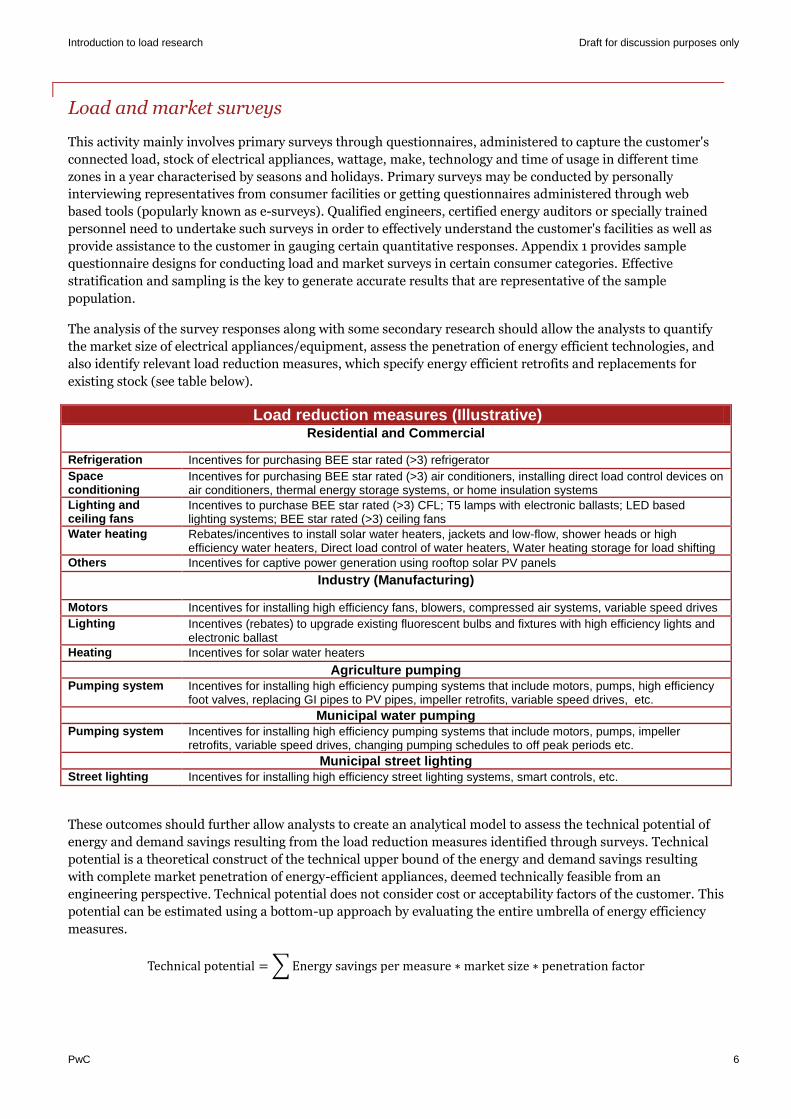
Introduction to load research Draft for discussion purposes only
PwC 6
Load and market surveys
This activity mainly involves primary surveys through questionnaires, administered to capture the customer's
connected load, stock of electrical appliances, wattage, make, technology and time of usage in different time
zones in a year characterised by seasons and holidays. Primary surveys may be conducted by personally
interviewing representatives from consumer facilities or getting questionnaires administered through web
based tools (popularly known as e-surveys). Qualified engineers, certified energy auditors or specially trained
personnel need to undertake such surveys in order to effectively understand the customer's facilities as well as
provide assistance to the customer in gauging certain quantitative responses. Appendix 1 provides sample
questionnaire designs for conducting load and market surveys in certain consumer categories. Effective
stratification and sampling is the key to generate accurate results that are representative of the sample
population.
The analysis of the survey responses along with some secondary research should allow the analysts to quantify
the market size of electrical appliances/equipment, assess the penetration of energy efficient technologies, and
also identify relevant load reduction measures, which specify energy efficient retrofits and replacements for
existing stock (see table below).
Load reduction measures (Illustrative) Residential and Commercial
Refrigeration Incentives for purchasing BEE star rated (>3) refrigerator Space conditioning
Incentives for purchasing BEE star rated (>3) air conditioners, installing direct load control devices on air conditioners, thermal energy storage systems, or home insulation systems
Lighting and ceiling fans
Incentives to purchase BEE star rated (>3) CFL; T5 lamps with electronic ballasts; LED based lighting systems; BEE star rated (>3) ceiling fans
Water heating Rebates/incentives to install solar water heaters, jackets and low-flow, shower heads or high efficiency water heaters, Direct load control of water heaters, Water heating storage for load shifting
Others Incentives for captive power generation using rooftop solar PV panels
Industry (Manufacturing)
Motors Incentives for installing high efficiency fans, blowers, compressed air systems, variable speed drives Lighting Incentives (rebates) to upgrade existing fluorescent bulbs and fixtures with high efficiency lights and
electronic ballast Heating Incentives for solar water heaters
Agriculture pumping Pumping system Incentives for installing high efficiency pumping systems that include motors, pumps, high efficiency
foot valves, replacing GI pipes to PV pipes, impeller retrofits, variable speed drives, etc. Municipal water pumping
Pumping system Incentives for installing high efficiency pumping systems that include motors, pumps, impeller retrofits, variable speed drives, changing pumping schedules to off peak periods etc.
Municipal street lighting Street lighting Incentives for installing high efficiency street lighting systems, smart controls, etc.
These outcomes should further allow analysts to create an analytical model to assess the technical potential of
energy and demand savings resulting from the load reduction measures identified through surveys. Technical
potential is a theoretical construct of the technical upper bound of the energy and demand savings resulting
with complete market penetration of energy-efficient appliances, deemed technically feasible from an
engineering perspective. Technical potential does not consider cost or acceptability factors of the customer. This
potential can be estimated using a bottom-up approach by evaluating the entire umbrella of energy efficiency
measures.
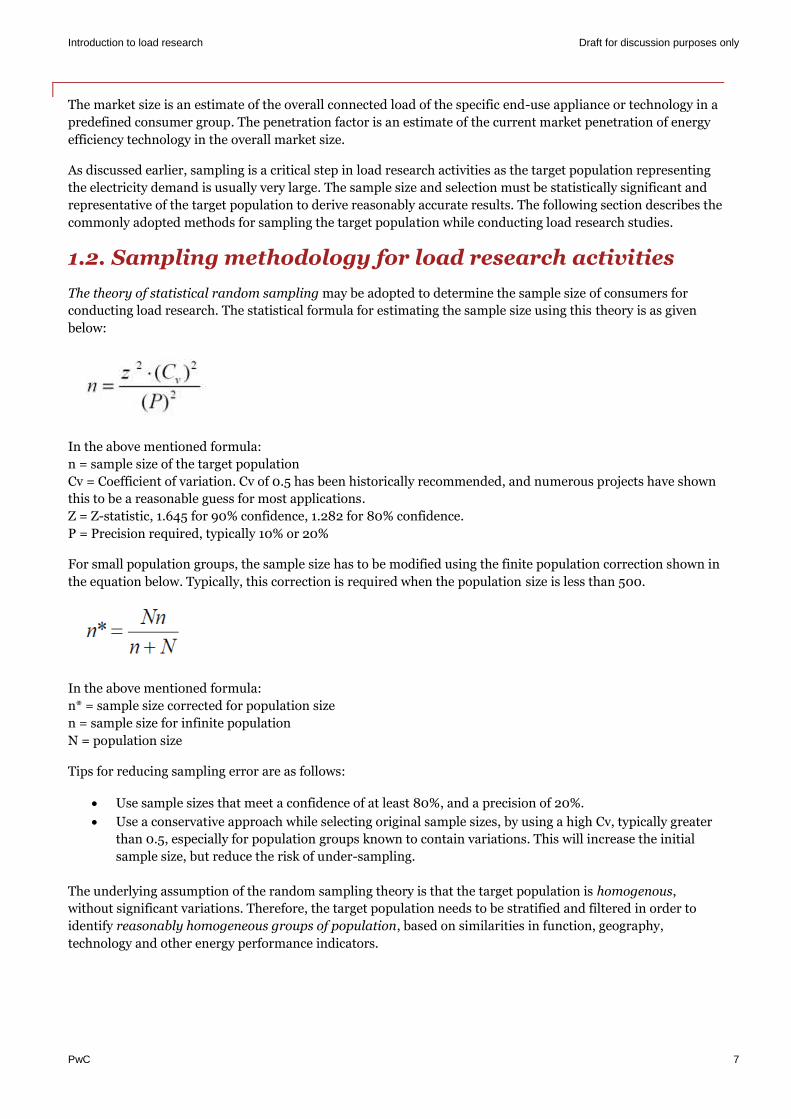
Introduction to load research Draft for discussion purposes only
PwC 7
The market size is an estimate of the overall connected load of the specific end-use appliance or technology in a
predefined consumer group. The penetration factor is an estimate of the current market penetration of energy
efficiency technology in the overall market size.
As discussed earlier, sampling is a critical step in load research activities as the target population representing
the electricity demand is usually very large. The sample size and selection must be statistically significant and
representative of the target population to derive reasonably accurate results. The following section describes the
commonly adopted methods for sampling the target population while conducting load research studies.
1.2. Sampling methodology for load research activities
The theory of statistical random sampling may be adopted to determine the sample size of consumers for
conducting load research. The statistical formula for estimating the sample size using this theory is as given
below:
In the above mentioned formula:
n = sample size of the target population
Cv = Coefficient of variation. Cv of 0.5 has been historically recommended, and numerous projects have shown
this to be a reasonable guess for most applications.
Z = Z-statistic, 1.645 for 90% confidence, 1.282 for 80% confidence.
P = Precision required, typically 10% or 20%
For small population groups, the sample size has to be modified using the finite population correction shown in
the equation below. Typically, this correction is required when the population size is less than 500.
In the above mentioned formula:
n* = sample size corrected for population size
n = sample size for infinite population
N = population size
Tips for reducing sampling error are as follows:
Use sample sizes that meet a confidence of at least 80%, and a precision of 20%.
Use a conservative approach while selecting original sample sizes, by using a high Cv, typically greater
than 0.5, especially for population groups known to contain variations. This will increase the initial
sample size, but reduce the risk of under-sampling.
The underlying assumption of the random sampling theory is that the target population is homogenous,
without significant variations. Therefore, the target population needs to be stratified and filtered in order to
identify reasonably homogeneous groups of population, based on similarities in function, geography,
technology and other energy performance indicators.
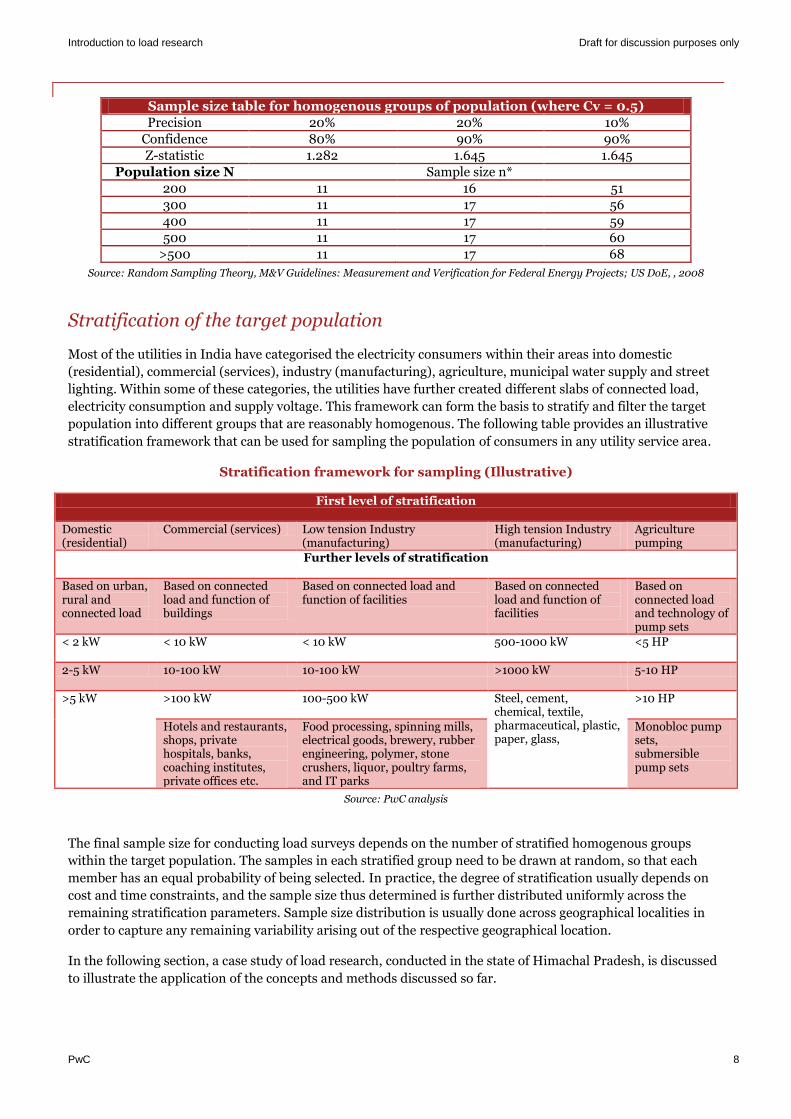
Introduction to load research Draft for discussion purposes only
PwC 8
Sample size table for homogenous groups of population (where Cv = 0.5)
Precision 20% 20% 10%
Confidence 80% 90% 90%
Z-statistic 1.282 1.645 1.645
Population size N Sample size n*
200 11 16 51
300 11 17 56
400 11 17 59
500 11 17 60
>500 11 17 68
Source: Random Sampling Theory, M&V Guidelines: Measurement and Verification for Federal Energy Projects; US DoE, , 2008
Stratification of the target population
Most of the utilities in India have categorised the electricity consumers within their areas into domestic
(residential), commercial (services), industry (manufacturing), agriculture, municipal water supply and street
lighting. Within some of these categories, the utilities have further created different slabs of connected load,
electricity consumption and supply voltage. This framework can form the basis to stratify and filter the target
population into different groups that are reasonably homogenous. The following table provides an illustrative
stratification framework that can be used for sampling the population of consumers in any utility service area.
Stratification framework for sampling (Illustrative)
First level of stratification
Domestic (residential)
Commercial (services) Low tension Industry (manufacturing)
High tension Industry (manufacturing)
Agriculture pumping
Further levels of stratification
Based on urban, rural and connected load
Based on connected load and function of buildings
Based on connected load and function of facilities
Based on connected load and function of facilities
Based on connected load and technology of pump sets
< 2 kW < 10 kW < 10 kW 500-1000 kW <5 HP
2-5 kW 10-100 kW 10-100 kW >1000 kW 5-10 HP
>5 kW >100 kW 100-500 kW Steel, cement, chemical, textile, pharmaceutical, plastic, paper, glass,
>10 HP
Hotels and restaurants, shops, private hospitals, banks, coaching institutes, private offices etc.
Food processing, spinning mills, electrical goods, brewery, rubber engineering, polymer, stone crushers, liquor, poultry farms, and IT parks
Monobloc pump sets, submersible pump sets
Source: PwC analysis
The final sample size for conducting load surveys depends on the number of stratified homogenous groups
within the target population. The samples in each stratified group need to be drawn at random, so that each
member has an equal probability of being selected. In practice, the degree of stratification usually depends on
cost and time constraints, and the sample size thus determined is further distributed uniformly across the
remaining stratification parameters. Sample size distribution is usually done across geographical localities in
order to capture any remaining variability arising out of the respective geographical location.
In the following section, a case study of load research, conducted in the state of Himachal Pradesh, is discussed
to illustrate the application of the concepts and methods discussed so far.
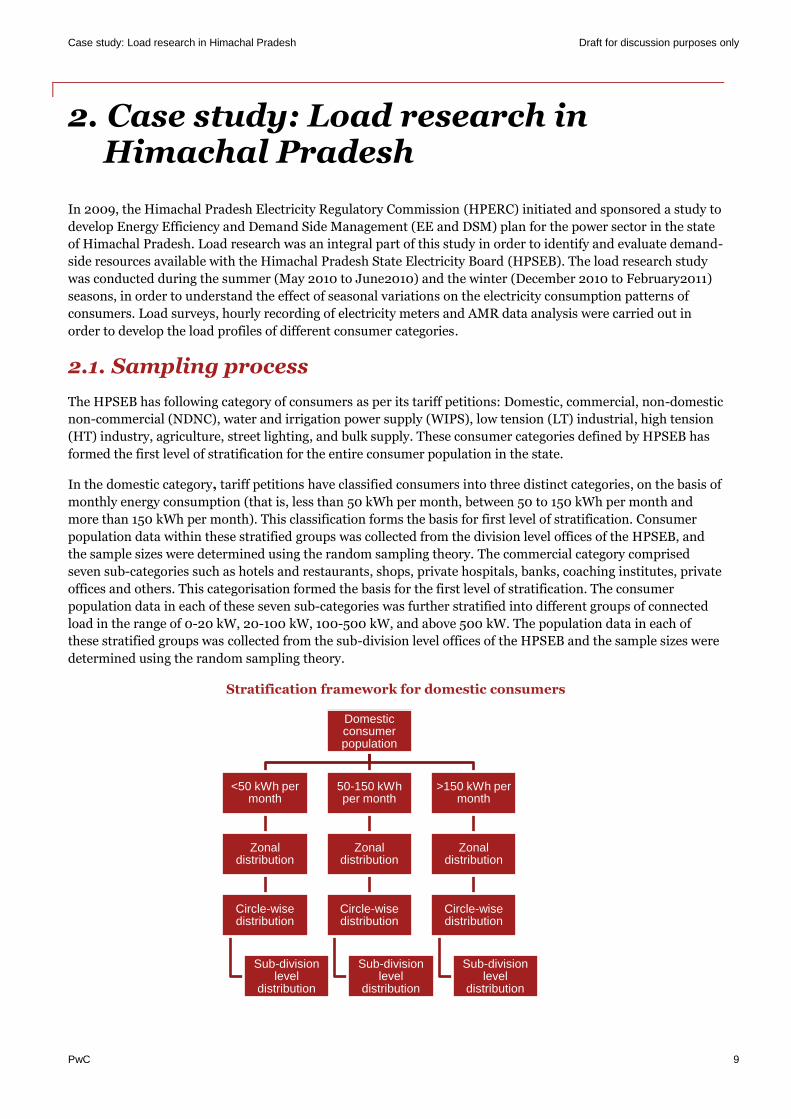
Case study: Load research in Himachal Pradesh Draft for discussion purposes only
PwC 9
2. Case study: Load research in Himachal Pradesh
In 2009, the Himachal Pradesh Electricity Regulatory Commission (HPERC) initiated and sponsored a study to
develop Energy Efficiency and Demand Side Management (EE and DSM) plan for the power sector in the state
of Himachal Pradesh. Load research was an integral part of this study in order to identify and evaluate demand-
side resources available with the Himachal Pradesh State Electricity Board (HPSEB). The load research study
was conducted during the summer (May 2010 to June2010) and the winter (December 2010 to February2011)
seasons, in order to understand the effect of seasonal variations on the electricity consumption patterns of
consumers. Load surveys, hourly recording of electricity meters and AMR data analysis were carried out in
order to develop the load profiles of different consumer categories.
2.1. Sampling process
The HPSEB has following category of consumers as per its tariff petitions: Domestic, commercial, non-domestic
non-commercial (NDNC), water and irrigation power supply (WIPS), low tension (LT) industrial, high tension
(HT) industry, agriculture, street lighting, and bulk supply. These consumer categories defined by HPSEB has
formed the first level of stratification for the entire consumer population in the state.
In the domestic category, tariff petitions have classified consumers into three distinct categories, on the basis of
monthly energy consumption (that is, less than 50 kWh per month, between 50 to 150 kWh per month and
more than 150 kWh per month). This classification forms the basis for first level of stratification. Consumer
population data within these stratified groups was collected from the division level offices of the HPSEB, and
the sample sizes were determined using the random sampling theory. The commercial category comprised
seven sub-categories such as hotels and restaurants, shops, private hospitals, banks, coaching institutes, private
offices and others. This categorisation formed the basis for the first level of stratification. The consumer
population data in each of these seven sub-categories was further stratified into different groups of connected
load in the range of 0-20 kW, 20-100 kW, 100-500 kW, and above 500 kW. The population data in each of
these stratified groups was collected from the sub-division level offices of the HPSEB and the sample sizes were
determined using the random sampling theory.
Stratification framework for domestic consumers
Domestic consumer population
<50 kWh per month
Zonal distribution
Circle-wise distribution
Sub-division level
distribution
50-150 kWh per month
Zonal distribution
Circle-wise distribution
Sub-division level
distribution
>150 kWh per month
Zonal distribution
Circle-wise distribution
Sub-division level
distribution
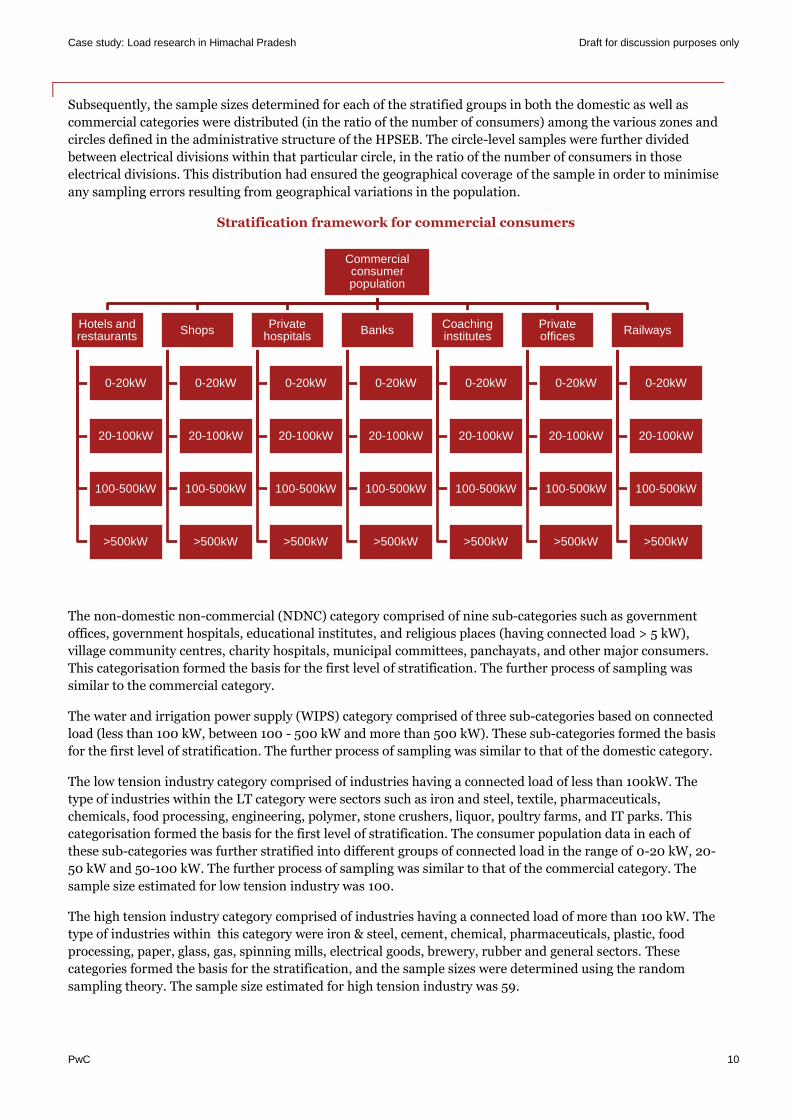
Case study: Load research in Himachal Pradesh Draft for discussion purposes only
PwC 10
Subsequently, the sample sizes determined for each of the stratified groups in both the domestic as well as
commercial categories were distributed (in the ratio of the number of consumers) among the various zones and
circles defined in the administrative structure of the HPSEB. The circle-level samples were further divided
between electrical divisions within that particular circle, in the ratio of the number of consumers in those
electrical divisions. This distribution had ensured the geographical coverage of the sample in order to minimise
any sampling errors resulting from geographical variations in the population.
Stratification framework for commercial consumers
The non-domestic non-commercial (NDNC) category comprised of nine sub-categories such as government
offices, government hospitals, educational institutes, and religious places (having connected load > 5 kW),
village community centres, charity hospitals, municipal committees, panchayats, and other major consumers.
This categorisation formed the basis for the first level of stratification. The further process of sampling was
similar to the commercial category.
The water and irrigation power supply (WIPS) category comprised of three sub-categories based on connected
load (less than 100 kW, between 100 - 500 kW and more than 500 kW). These sub-categories formed the basis
for the first level of stratification. The further process of sampling was similar to that of the domestic category.
The low tension industry category comprised of industries having a connected load of less than 100kW. The
type of industries within the LT category were sectors such as iron and steel, textile, pharmaceuticals,
chemicals, food processing, engineering, polymer, stone crushers, liquor, poultry farms, and IT parks. This
categorisation formed the basis for the first level of stratification. The consumer population data in each of
these sub-categories was further stratified into different groups of connected load in the range of 0-20 kW, 20-
50 kW and 50-100 kW. The further process of sampling was similar to that of the commercial category. The
sample size estimated for low tension industry was 100.
The high tension industry category comprised of industries having a connected load of more than 100 kW. The
type of industries within this category were iron & steel, cement, chemical, pharmaceuticals, plastic, food
processing, paper, glass, gas, spinning mills, electrical goods, brewery, rubber and general sectors. These
categories formed the basis for the stratification, and the sample sizes were determined using the random
sampling theory. The sample size estimated for high tension industry was 59.
Commercial consumer population
Hotels and restaurants
0-20kW
20-100kW
100-500kW
>500kW
Shops
0-20kW
20-100kW
100-500kW
>500kW
Private hospitals
0-20kW
20-100kW
100-500kW
>500kW
Banks
0-20kW
20-100kW
100-500kW
>500kW
Coaching institutes
0-20kW
20-100kW
100-500kW
>500kW
Private offices
0-20kW
20-100kW
100-500kW
>500kW
Railways
0-20kW
20-100kW
100-500kW
>500kW
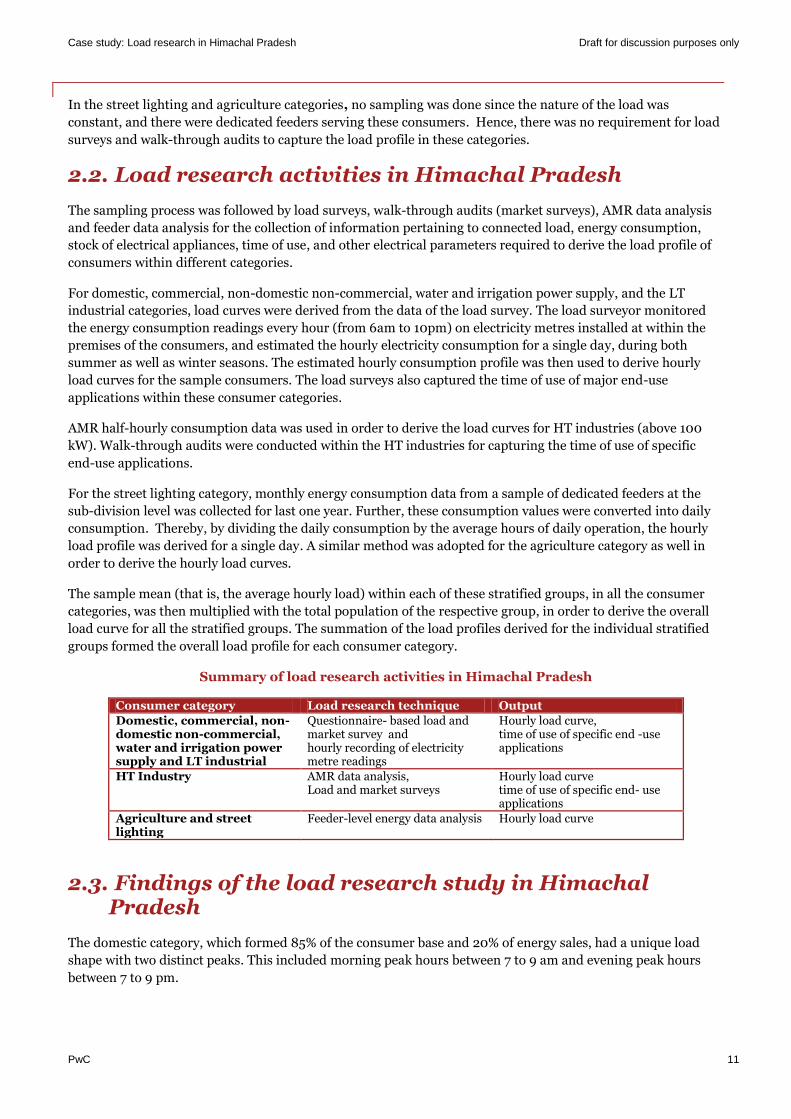
Case study: Load research in Himachal Pradesh Draft for discussion purposes only
PwC 11
In the street lighting and agriculture categories, no sampling was done since the nature of the load was
constant, and there were dedicated feeders serving these consumers. Hence, there was no requirement for load
surveys and walk-through audits to capture the load profile in these categories.
2.2. Load research activities in Himachal Pradesh
The sampling process was followed by load surveys, walk-through audits (market surveys), AMR data analysis
and feeder data analysis for the collection of information pertaining to connected load, energy consumption,
stock of electrical appliances, time of use, and other electrical parameters required to derive the load profile of
consumers within different categories.
For domestic, commercial, non-domestic non-commercial, water and irrigation power supply, and the LT
industrial categories, load curves were derived from the data of the load survey. The load surveyor monitored
the energy consumption readings every hour (from 6am to 10pm) on electricity metres installed at within the
premises of the consumers, and estimated the hourly electricity consumption for a single day, during both
summer as well as winter seasons. The estimated hourly consumption profile was then used to derive hourly
load curves for the sample consumers. The load surveys also captured the time of use of major end-use
applications within these consumer categories.
AMR half-hourly consumption data was used in order to derive the load curves for HT industries (above 100
kW). Walk-through audits were conducted within the HT industries for capturing the time of use of specific
end-use applications.
For the street lighting category, monthly energy consumption data from a sample of dedicated feeders at the
sub-division level was collected for last one year. Further, these consumption values were converted into daily
consumption. Thereby, by dividing the daily consumption by the average hours of daily operation, the hourly
load profile was derived for a single day. A similar method was adopted for the agriculture category as well in
order to derive the hourly load curves.
The sample mean (that is, the average hourly load) within each of these stratified groups, in all the consumer
categories, was then multiplied with the total population of the respective group, in order to derive the overall
load curve for all the stratified groups. The summation of the load profiles derived for the individual stratified
groups formed the overall load profile for each consumer category.
Summary of load research activities in Himachal Pradesh
Consumer category Load research technique Output
Domestic, commercial, non-domestic non-commercial, water and irrigation power supply and LT industrial
Questionnaire- based load and market survey and hourly recording of electricity metre readings
Hourly load curve, time of use of specific end -use applications
HT Industry AMR data analysis, Load and market surveys
Hourly load curve time of use of specific end- use applications
Agriculture and street lighting
Feeder-level energy data analysis Hourly load curve
2.3. Findings of the load research study in Himachal Pradesh
The domestic category, which formed 85% of the consumer base and 20% of energy sales, had a unique load
shape with two distinct peaks. This included morning peak hours between 7 to 9 am and evening peak hours
between 7 to 9 pm.
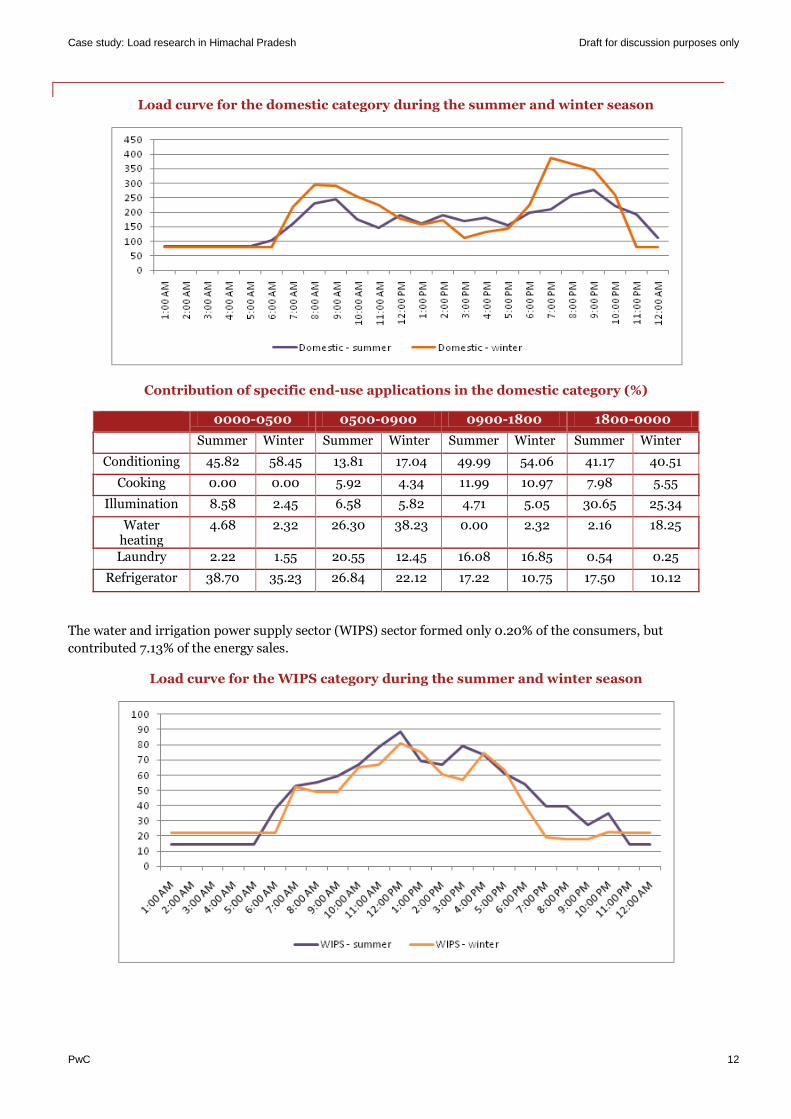
Case study: Load research in Himachal Pradesh Draft for discussion purposes only
PwC 12
Load curve for the domestic category during the summer and winter season
Contribution of specific end-use applications in the domestic category (%)
0000-0500 0500-0900 0900-1800 1800-0000
Summer Winter Summer Winter Summer Winter Summer Winter
Conditioning 45.82 58.45 13.81 17.04 49.99 54.06 41.17 40.51
Cooking 0.00 0.00 5.92 4.34 11.99 10.97 7.98 5.55
Illumination 8.58 2.45 6.58 5.82 4.71 5.05 30.65 25.34
Water heating
4.68 2.32 26.30 38.23 0.00 2.32 2.16 18.25
Laundry 2.22 1.55 20.55 12.45 16.08 16.85 0.54 0.25
Refrigerator 38.70 35.23 26.84 22.12 17.22 10.75 17.50 10.12
The water and irrigation power supply sector (WIPS) sector formed only 0.20% of the consumers, but
contributed 7.13% of the energy sales.
Load curve for the WIPS category during the summer and winter season
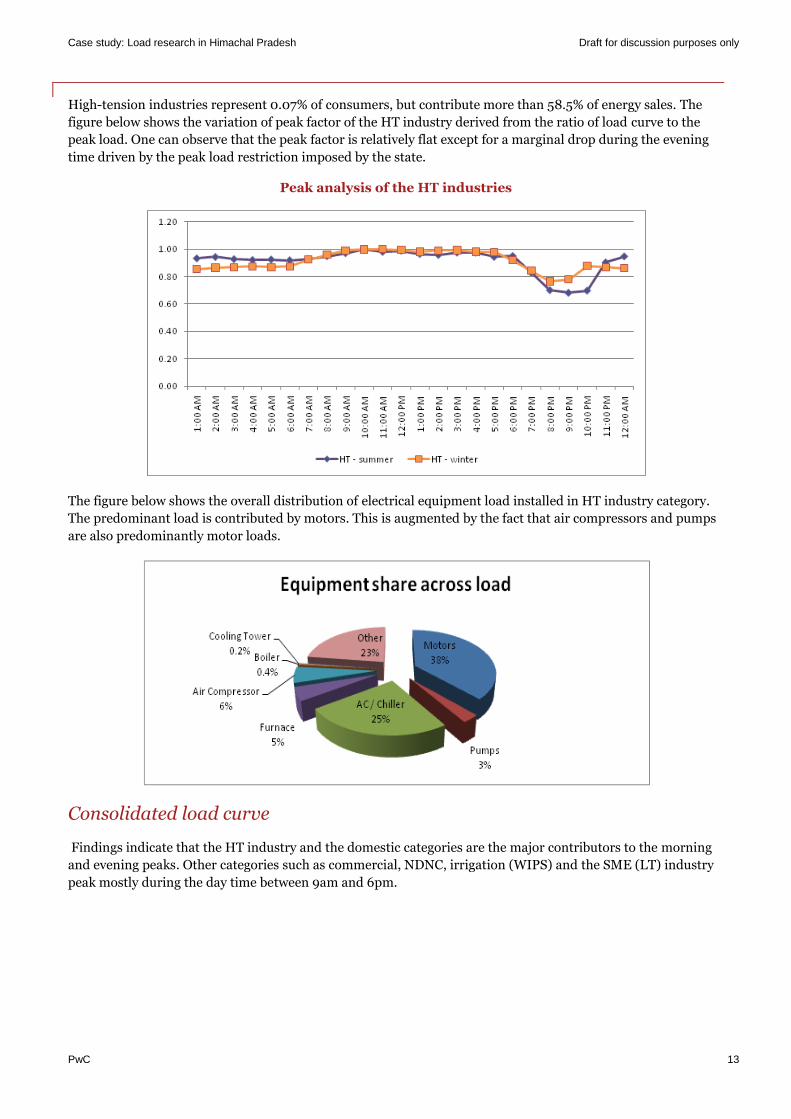
Case study: Load research in Himachal Pradesh Draft for discussion purposes only
PwC 13
High-tension industries represent 0.07% of consumers, but contribute more than 58.5% of energy sales. The
figure below shows the variation of peak factor of the HT industry derived from the ratio of load curve to the
peak load. One can observe that the peak factor is relatively flat except for a marginal drop during the evening
time driven by the peak load restriction imposed by the state.
Peak analysis of the HT industries
The figure below shows the overall distribution of electrical equipment load installed in HT industry category.
The predominant load is contributed by motors. This is augmented by the fact that air compressors and pumps
are also predominantly motor loads.
Consolidated load curve
Findings indicate that the HT industry and the domestic categories are the major contributors to the morning
and evening peaks. Other categories such as commercial, NDNC, irrigation (WIPS) and the SME (LT) industry
peak mostly during the day time between 9am and 6pm.
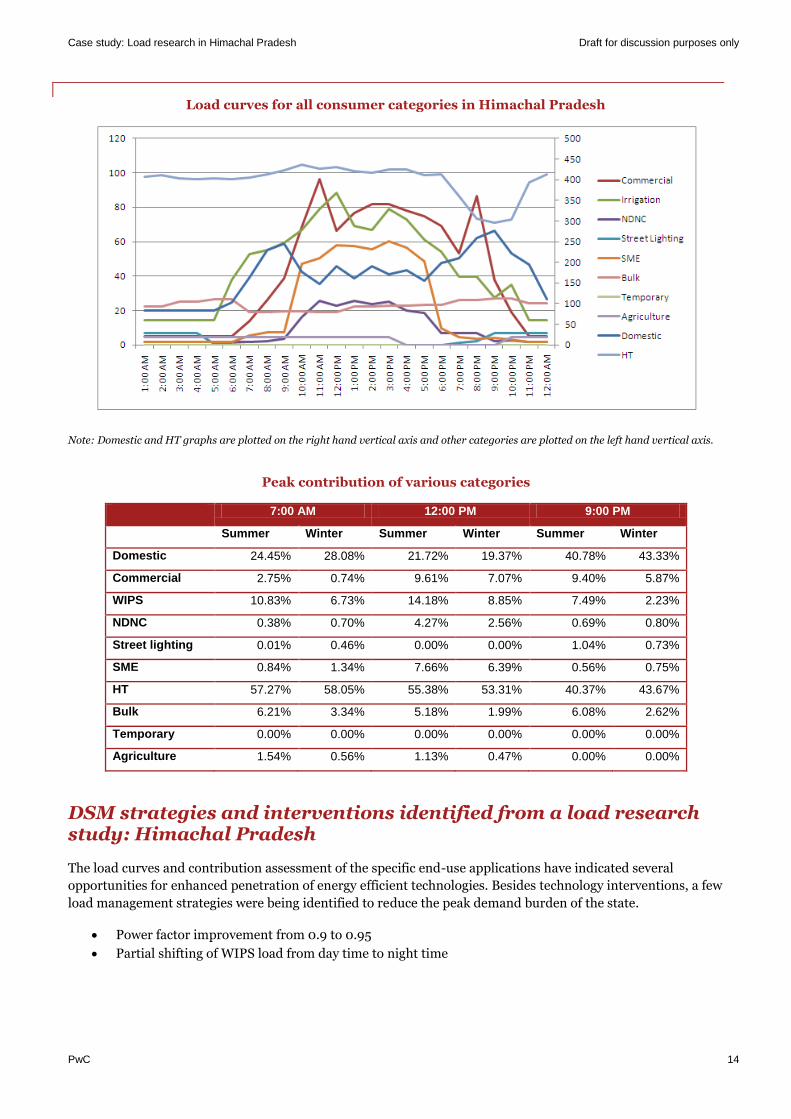
Case study: Load research in Himachal Pradesh Draft for discussion purposes only
PwC 14
Load curves for all consumer categories in Himachal Pradesh
Note: Domestic and HT graphs are plotted on the right hand vertical axis and other categories are plotted on the left hand vertical axis.
Peak contribution of various categories
7:00 AM 12:00 PM 9:00 PM
Summer Winter Summer Winter Summer Winter
Domestic 24.45% 28.08% 21.72% 19.37% 40.78% 43.33%
Commercial 2.75% 0.74% 9.61% 7.07% 9.40% 5.87%
WIPS 10.83% 6.73% 14.18% 8.85% 7.49% 2.23%
NDNC 0.38% 0.70% 4.27% 2.56% 0.69% 0.80%
Street lighting 0.01% 0.46% 0.00% 0.00% 1.04% 0.73%
SME 0.84% 1.34% 7.66% 6.39% 0.56% 0.75%
HT 57.27% 58.05% 55.38% 53.31% 40.37% 43.67%
Bulk 6.21% 3.34% 5.18% 1.99% 6.08% 2.62%
Temporary 0.00% 0.00% 0.00% 0.00% 0.00% 0.00%
Agriculture 1.54% 0.56% 1.13% 0.47% 0.00% 0.00%
DSM strategies and interventions identified from a load research study: Himachal Pradesh
The load curves and contribution assessment of the specific end-use applications have indicated several
opportunities for enhanced penetration of energy efficient technologies. Besides technology interventions, a few
load management strategies were being identified to reduce the peak demand burden of the state.
Power factor improvement from 0.9 to 0.95
Partial shifting of WIPS load from day time to night time
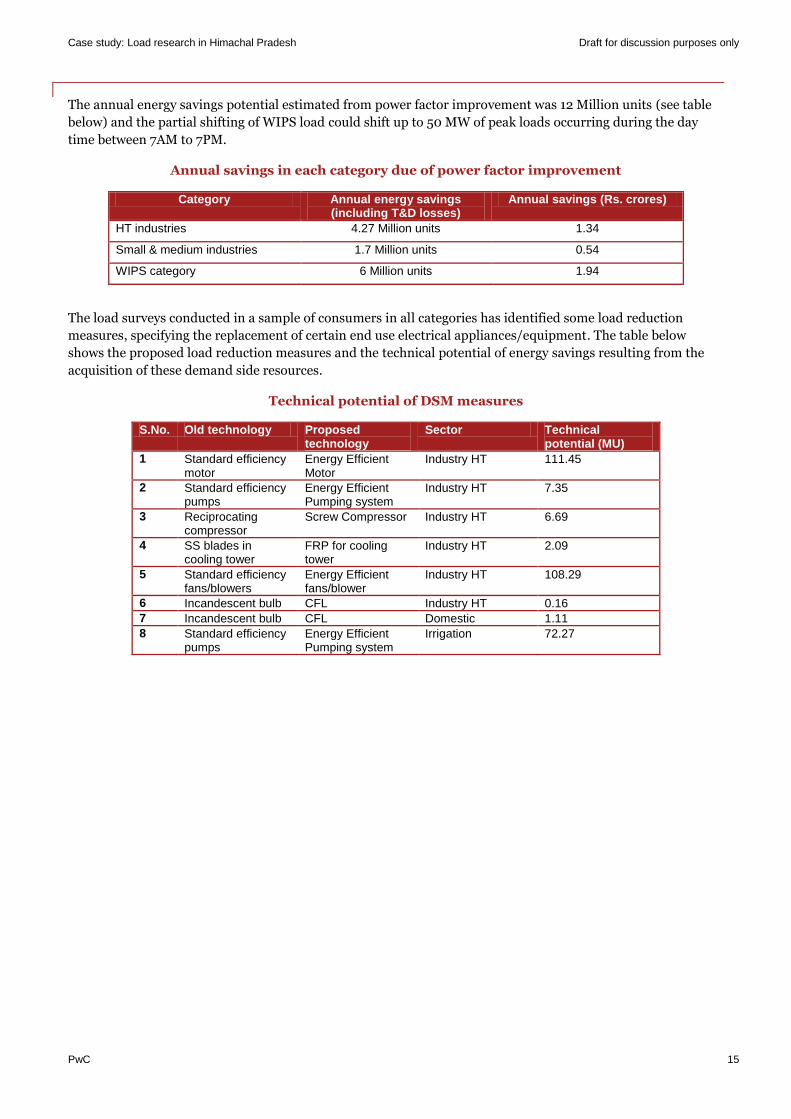
Case study: Load research in Himachal Pradesh Draft for discussion purposes only
PwC 15
The annual energy savings potential estimated from power factor improvement was 12 Million units (see table
below) and the partial shifting of WIPS load could shift up to 50 MW of peak loads occurring during the day
time between 7AM to 7PM.
Annual savings in each category due of power factor improvement
Category Annual energy savings (including T&D losses)
Annual savings (Rs. crores)
HT industries 4.27 Million units 1.34
Small & medium industries 1.7 Million units 0.54
WIPS category 6 Million units 1.94
The load surveys conducted in a sample of consumers in all categories has identified some load reduction
measures, specifying the replacement of certain end use electrical appliances/equipment. The table below
shows the proposed load reduction measures and the technical potential of energy savings resulting from the
acquisition of these demand side resources.
Technical potential of DSM measures
S.No. Old technology Proposed technology
Sector Technical potential (MU)
1 Standard efficiency motor
Energy Efficient Motor
Industry HT 111.45
2 Standard efficiency pumps
Energy Efficient Pumping system
Industry HT 7.35
3 Reciprocating compressor
Screw Compressor Industry HT 6.69
4 SS blades in cooling tower
FRP for cooling tower
Industry HT 2.09
5 Standard efficiency fans/blowers
Energy Efficient fans/blower
Industry HT 108.29
6 Incandescent bulb CFL Industry HT 0.16 7 Incandescent bulb CFL Domestic 1.11 8 Standard efficiency
pumps Energy Efficient Pumping system
Irrigation 72.27
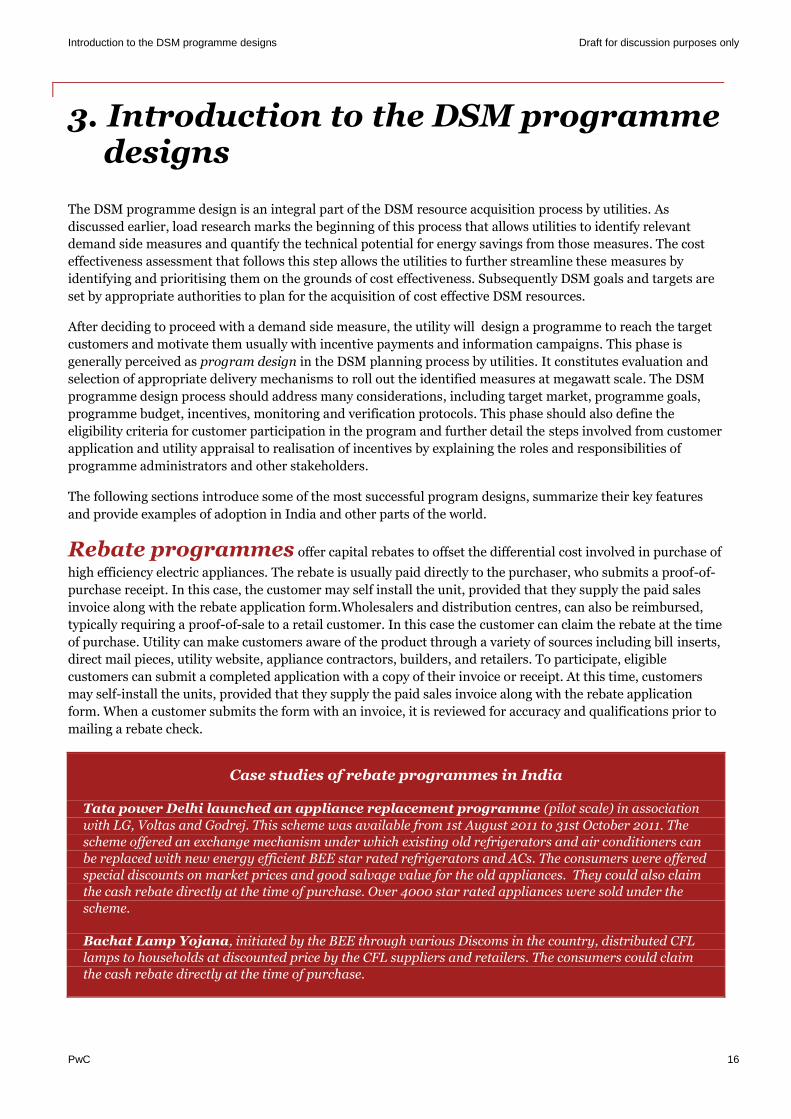
Introduction to the DSM programme designs Draft for discussion purposes only
PwC 16
3. Introduction to the DSM programme designs
The DSM programme design is an integral part of the DSM resource acquisition process by utilities. As
discussed earlier, load research marks the beginning of this process that allows utilities to identify relevant
demand side measures and quantify the technical potential for energy savings from those measures. The cost
effectiveness assessment that follows this step allows the utilities to further streamline these measures by
identifying and prioritising them on the grounds of cost effectiveness. Subsequently DSM goals and targets are
set by appropriate authorities to plan for the acquisition of cost effective DSM resources.
After deciding to proceed with a demand side measure, the utility will design a programme to reach the target
customers and motivate them usually with incentive payments and information campaigns. This phase is
generally perceived as program design in the DSM planning process by utilities. It constitutes evaluation and
selection of appropriate delivery mechanisms to roll out the identified measures at megawatt scale. The DSM
programme design process should address many considerations, including target market, programme goals,
programme budget, incentives, monitoring and verification protocols. This phase should also define the
eligibility criteria for customer participation in the program and further detail the steps involved from customer
application and utility appraisal to realisation of incentives by explaining the roles and responsibilities of
programme administrators and other stakeholders.
The following sections introduce some of the most successful program designs, summarize their key features
and provide examples of adoption in India and other parts of the world.
Rebate programmes offer capital rebates to offset the differential cost involved in purchase of
high efficiency electric appliances. The rebate is usually paid directly to the purchaser, who submits a proof-of-
purchase receipt. In this case, the customer may self install the unit, provided that they supply the paid sales
invoice along with the rebate application form.Wholesalers and distribution centres, can also be reimbursed,
typically requiring a proof-of-sale to a retail customer. In this case the customer can claim the rebate at the time
of purchase. Utility can make customers aware of the product through a variety of sources including bill inserts,
direct mail pieces, utility website, appliance contractors, builders, and retailers. To participate, eligible
customers can submit a completed application with a copy of their invoice or receipt. At this time, customers
may self-install the units, provided that they supply the paid sales invoice along with the rebate application
form. When a customer submits the form with an invoice, it is reviewed for accuracy and qualifications prior to
mailing a rebate check.
Case studies of rebate programmes in India
Tata power Delhi launched an appliance replacement programme (pilot scale) in association
with LG, Voltas and Godrej. This scheme was available from 1st August 2011 to 31st October 2011. The
scheme offered an exchange mechanism under which existing old refrigerators and air conditioners can
be replaced with new energy efficient BEE star rated refrigerators and ACs. The consumers were offered
special discounts on market prices and good salvage value for the old appliances. They could also claim
the cash rebate directly at the time of purchase. Over 4000 star rated appliances were sold under the
scheme.
Bachat Lamp Yojana, initiated by the BEE through various Discoms in the country, distributed CFL
lamps to households at discounted price by the CFL suppliers and retailers. The consumers could claim
the cash rebate directly at the time of purchase.
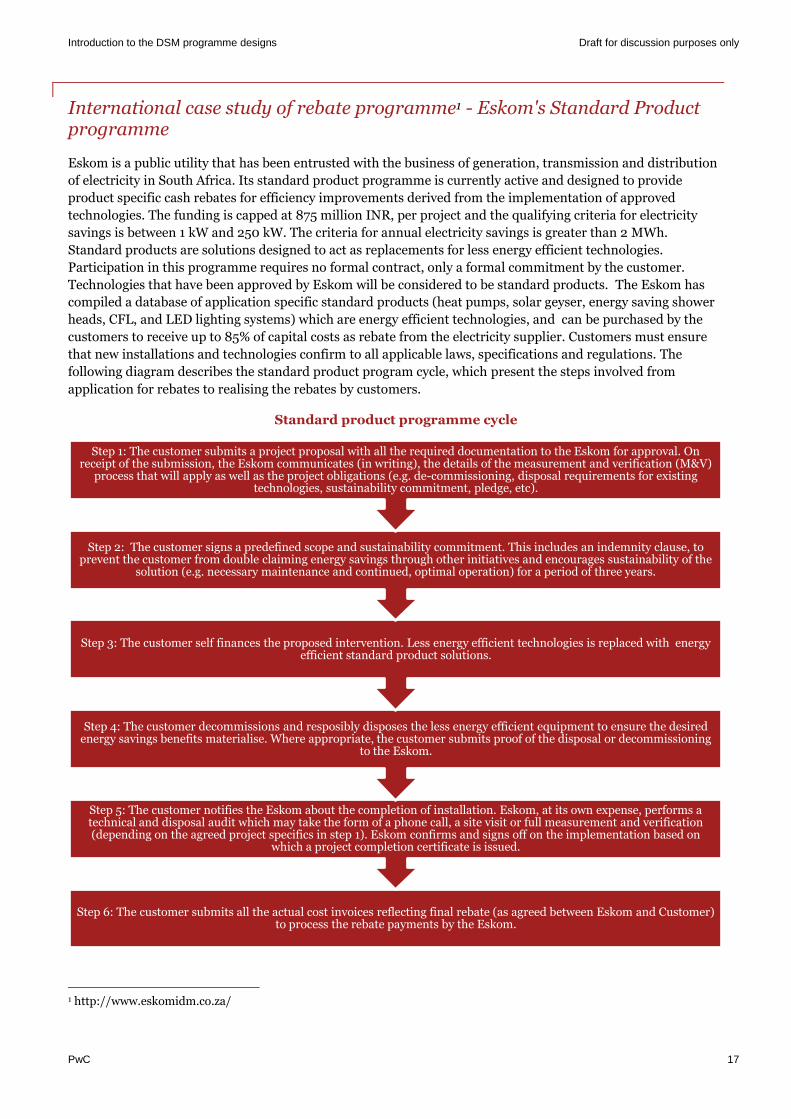
Introduction to the DSM programme designs Draft for discussion purposes only
PwC 17
International case study of rebate programme1 - Eskom's Standard Product programme
Eskom is a public utility that has been entrusted with the business of generation, transmission and distribution
of electricity in South Africa. Its standard product programme is currently active and designed to provide
product specific cash rebates for efficiency improvements derived from the implementation of approved
technologies. The funding is capped at 875 million INR, per project and the qualifying criteria for electricity
savings is between 1 kW and 250 kW. The criteria for annual electricity savings is greater than 2 MWh.
Standard products are solutions designed to act as replacements for less energy efficient technologies.
Participation in this programme requires no formal contract, only a formal commitment by the customer.
Technologies that have been approved by Eskom will be considered to be standard products. The Eskom has
compiled a database of application specific standard products (heat pumps, solar geyser, energy saving shower
heads, CFL, and LED lighting systems) which are energy efficient technologies, and can be purchased by the
customers to receive up to 85% of capital costs as rebate from the electricity supplier. Customers must ensure
that new installations and technologies confirm to all applicable laws, specifications and regulations. The
following diagram describes the standard product program cycle, which present the steps involved from
application for rebates to realising the rebates by customers.
Standard product programme cycle
1 http://www.eskomidm.co.za/
Step 6: The customer submits all the actual cost invoices reflecting final rebate (as agreed between Eskom and Customer) to process the rebate payments by the Eskom.
Step 5: The customer notifies the Eskom about the completion of installation. Eskom, at its own expense, performs a technical and disposal audit which may take the form of a phone call, a site visit or full measurement and verification (depending on the agreed project specifics in step 1). Eskom confirms and signs off on the implementation based on
which a project completion certificate is issued.
Step 4: The customer decommissions and resposibly disposes the less energy efficient equipment to ensure the desired energy savings benefits materialise. Where appropriate, the customer submits proof of the disposal or decommissioning
to the Eskom.
Step 3: The customer self finances the proposed intervention. Less energy efficient technologies is replaced with energy efficient standard product solutions.
Step 2: The customer signs a predefined scope and sustainability commitment. This includes an indemnity clause, to prevent the customer from double claiming energy savings through other initiatives and encourages sustainability of the
solution (e.g. necessary maintenance and continued, optimal operation) for a period of three years.
Step 1: The customer submits a project proposal with all the required documentation to the Eskom for approval. On receipt of the submission, the Eskom communicates (in writing), the details of the measurement and verification (M&V)
process that will apply as well as the project obligations (e.g. de-commissioning, disposal requirements for existing technologies, sustainability commitment, pledge, etc).
Introduction to the DSM programme designs Draft for discussion purposes only
PwC 18
Direct install programmes use utility or contractors to directly install low-cost, quick
pay-back energy efficiency measures in customer facilities. These programmes will deploy teams of technicians
in factories and facilities to identify and install low-cost, low risk measures. In exchange the DSM programme is
able to achieve reliable and highly cost-effective energy savings. This type programme is not yet tested in India
and is mostly prevalent in developed countries.
International case study on the direct-install programme2
San Diego Gas and Electric Company (SDG&E) is a regulated public utility that provides energy services
to about 3.4 million people in San Diego, USA. The direct install programme of SDG&E, which is
currently active, provides a number of free energy- and money-saving services for qualifying small- and
medium-sized businesses. Qualifying businesses include commercial rate customers who do not have
monthly electrical demand over 100kW for three consecutive months during a twelve month period.
After the initial screening process, one of the approved contractors evaluates the customer's facility,
identifies energy-saving opportunities and subsequently installs energy-efficient upgrades and retrofits
at no cost to the customer. Free upgrades include fluorescent lighting, occupancy sensors and vending
misers.
Bid programmes solicit private contractors to submit proposals and improve energy efficiency
levels within a targeted group of customers. These set broad goals such as location and measure and facility
types, relying on bidders to propose projects. Such proposals include a thorough cost benefit analysis. .
International case study on the bid programme34
Eskom registered Energy Services Companies (ESCO) are experts who identify energy efficiency opportunities,
scope and execute projects in specific target markets to. ESCOs utilise their in house knowledge of efficient
technologies and specialise in determining the best and most suitable way of obtaining electricity savings at a
business. Eskom's ESCO funding process offers funding for projects with potential electricity savings of 1MW or
more that enables the switch to energy-efficient technologies and processes. These funding programmes usually
involve a four-way partnership via legal contracts between Eskom, the customer, the ESCO, and an
independent, measurement and verification expert. To participate in the funding programme, the ESCO
submits a proposal on energy savings ideally more than 200kW which Eskom reviews on its technical and
financial merits. Once a contract has been signed, the ESCO is given the go-ahead to implement the project.
Eskom supports ESCO projects by funding up to 100% of the financial benchmark value (predefined and see
table below) for viable energy efficiency projects.
Eskom funding levels for ESCO projects
Programmes technologies Benchmark values Lighting & HVAC Up to 5.2m/MW Hot Water Up to 6.3m/MW Demand Response Up to 3.5m/MW Compressed Air Up to 4.4m/MW Process Optimisation Up to 5.2m/MW
In order to ensure that ESCO projects deliver the promised savings, there are penalty clauses in place which
ensure that when ESCO scopes the project, they do so accurately to ensure that projected savings are realistic in
nature. The complete process cycle of the Eskom's ESCO funding model is described in the following section.
2 http://www.sdge.com/direct-savings-direct-install 3 http://www.eskomidm.co.za/
Introduction to the DSM programme designs Draft for discussion purposes only
PwC 19
Eskom's ESCO funding process cycle
Step 1: The customer signs a letter of intent with the Eskom registered ESCO stating the customer’s intent to
partner with the ESCO, starting with conducting an energy audit to identify possible energy efficient
interventions.
Step 2: The ESCO conducts a detailed energy audit, which informs the development of a project proposal. The
project proposal details the possible and recommended interventions for electricity demand reduction and
optimization of electricity consumption.
Step 3: The ESCO presents the project proposal to the customer for review and acceptance.
Step 4: The customer signs off on the project proposal and signs the Eskom project application form.
Step 5: The ESCO submits the project proposal to Eskom for consideration. Subsequently the project is
registered on the Eskom database, after which undergoes an evaluation phase. The first level of evaluation
revolves around the technical aspects of the project, as well as its overall feasibility. This is followed by a
financial evaluation, which takes into consideration the savings that will be made and therefore the funding
contribution that Eskom can contribute towards the proposed project. Following the evaluation procedures,
Eskom makes a commitment to the customer in respect of the funding contribution they can expect. In order to
ensure that the anticipated savings can be accurately measured, measurement and verification (M&V) site visits
and audit processes performed at Eskom’s cost. The goal of this process is to establish a baseline from which to
measure future savings.
Step 6: The customer and the ESCO agree with and sign off on the M&V baseline established by Eskom.
Step 7: The customer signs the Eskom agreement that takes into account the savings as measured against the
signed off baseline, as well as highlighting the penalties imposed for the non-achievement of expected savings.
The standard duration for these agreements is five years.
Step 8: The ESCO and Eskom negotiate and sign a New Engineering Contract (NEC) around the
implementation of the new technologies. This part of the process, from submission of customer application to
the signing of the NEC agreement and the procurement of the necessary technologies can be expected to take
somewhere between three and six months.
Step 9: The customer facilitates the project implementation by providing access to facilities. This marks the
beginning of project implementation. At this point, the ESCO will be expected to implement the project in a
timely and professional manner. Project implementation may take up to 12 months, depending on the customer
and the technologies being installed. A series of progress payments is made to the ESCO during this period.
Step 10: Upon completion of the project installation, an immediate post-implementation M&V is undertaken,
to ensure the project meets all requirements laid out in the signed contracts.
Step 11: Further M&V is undertaken for a period of three months, during the project’s acceptance period, at
the end of which a completion certificate is signed by the ESCO.
Step 12: The customer and the ESCO jointly sign the Measurement Acceptance Date (MAD) certificate to mark
the official hand over of the newly created asset to the customer. At this time the full funding contribution has
been received by the ESCO.
Over the following five years, Eskom undertakes regular M&V monitoring to ensure the project continues to go
according to plan and meets the accepted baselines, while the customer sustains the project over this period
and also facilitates and/or submits, as applicable, regular M&V reports.
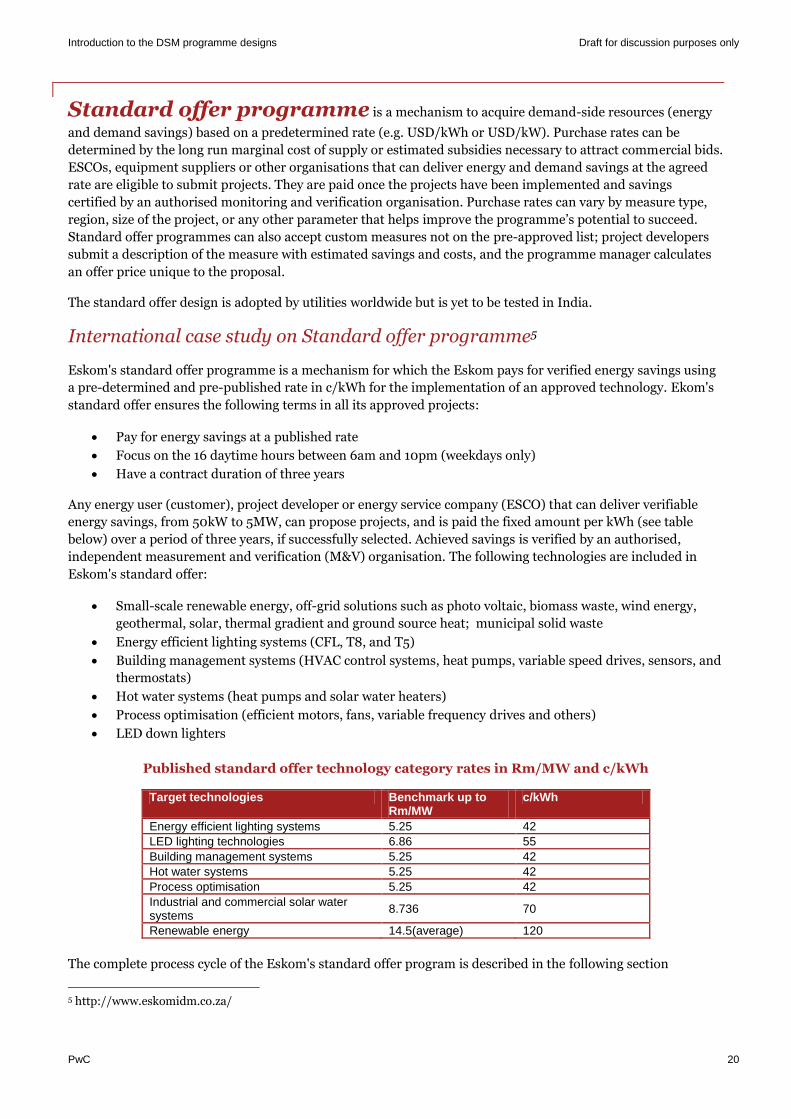
Introduction to the DSM programme designs Draft for discussion purposes only
PwC 20
Standard offer programme is a mechanism to acquire demand-side resources (energy
and demand savings) based on a predetermined rate (e.g. USD/kWh or USD/kW). Purchase rates can be
determined by the long run marginal cost of supply or estimated subsidies necessary to attract commercial bids.
ESCOs, equipment suppliers or other organisations that can deliver energy and demand savings at the agreed
rate are eligible to submit projects. They are paid once the projects have been implemented and savings
certified by an authorised monitoring and verification organisation. Purchase rates can vary by measure type,
region, size of the project, or any other parameter that helps improve the programme’s potential to succeed.
Standard offer programmes can also accept custom measures not on the pre-approved list; project developers
submit a description of the measure with estimated savings and costs, and the programme manager calculates
an offer price unique to the proposal.
The standard offer design is adopted by utilities worldwide but is yet to be tested in India.
International case study on Standard offer programme5
Eskom's standard offer programme is a mechanism for which the Eskom pays for verified energy savings using
a pre-determined and pre-published rate in c/kWh for the implementation of an approved technology. Ekom's
standard offer ensures the following terms in all its approved projects:
Pay for energy savings at a published rate
Focus on the 16 daytime hours between 6am and 10pm (weekdays only)
Have a contract duration of three years
Any energy user (customer), project developer or energy service company (ESCO) that can deliver verifiable
energy savings, from 50kW to 5MW, can propose projects, and is paid the fixed amount per kWh (see table
below) over a period of three years, if successfully selected. Achieved savings is verified by an authorised,
independent measurement and verification (M&V) organisation. The following technologies are included in
Eskom's standard offer:
Small-scale renewable energy, off-grid solutions such as photo voltaic, biomass waste, wind energy,
geothermal, solar, thermal gradient and ground source heat; municipal solid waste
Energy efficient lighting systems (CFL, T8, and T5)
Building management systems (HVAC control systems, heat pumps, variable speed drives, sensors, and
thermostats)
Hot water systems (heat pumps and solar water heaters)
Process optimisation (efficient motors, fans, variable frequency drives and others)
LED down lighters
Published standard offer technology category rates in Rm/MW and c/kWh
Target technologies Benchmark up to Rm/MW
c/kWh
Energy efficient lighting systems 5.25 42 LED lighting technologies 6.86 55 Building management systems 5.25 42 Hot water systems 5.25 42 Process optimisation 5.25 42 Industrial and commercial solar water systems 8.736 70
Renewable energy 14.5(average) 120
The complete process cycle of the Eskom's standard offer program is described in the following section
5 http://www.eskomidm.co.za/
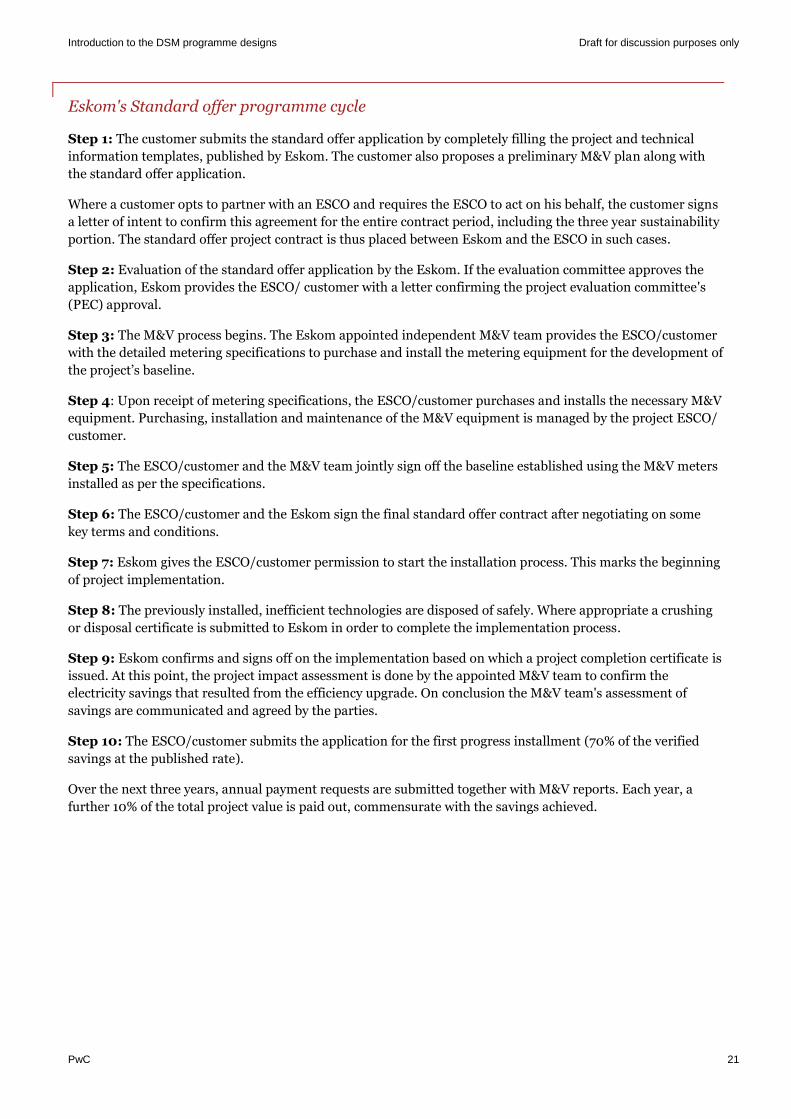
Introduction to the DSM programme designs Draft for discussion purposes only
PwC 21
Eskom's Standard offer programme cycle
Step 1: The customer submits the standard offer application by completely filling the project and technical
information templates, published by Eskom. The customer also proposes a preliminary M&V plan along with
the standard offer application.
Where a customer opts to partner with an ESCO and requires the ESCO to act on his behalf, the customer signs
a letter of intent to confirm this agreement for the entire contract period, including the three year sustainability
portion. The standard offer project contract is thus placed between Eskom and the ESCO in such cases.
Step 2: Evaluation of the standard offer application by the Eskom. If the evaluation committee approves the
application, Eskom provides the ESCO/ customer with a letter confirming the project evaluation committee's
(PEC) approval.
Step 3: The M&V process begins. The Eskom appointed independent M&V team provides the ESCO/customer
with the detailed metering specifications to purchase and install the metering equipment for the development of
the project’s baseline.
Step 4: Upon receipt of metering specifications, the ESCO/customer purchases and installs the necessary M&V
equipment. Purchasing, installation and maintenance of the M&V equipment is managed by the project ESCO/
customer.
Step 5: The ESCO/customer and the M&V team jointly sign off the baseline established using the M&V meters
installed as per the specifications.
Step 6: The ESCO/customer and the Eskom sign the final standard offer contract after negotiating on some
key terms and conditions.
Step 7: Eskom gives the ESCO/customer permission to start the installation process. This marks the beginning
of project implementation.
Step 8: The previously installed, inefficient technologies are disposed of safely. Where appropriate a crushing
or disposal certificate is submitted to Eskom in order to complete the implementation process.
Step 9: Eskom confirms and signs off on the implementation based on which a project completion certificate is
issued. At this point, the project impact assessment is done by the appointed M&V team to confirm the
electricity savings that resulted from the efficiency upgrade. On conclusion the M&V team's assessment of
savings are communicated and agreed by the parties.
Step 10: The ESCO/customer submits the application for the first progress installment (70% of the verified
savings at the published rate).
Over the next three years, annual payment requests are submitted together with M&V reports. Each year, a
further 10% of the total project value is paid out, commensurate with the savings achieved.
Introduction to the DSM programme designs Draft for discussion purposes only
PwC 22
References
1. Report of the Working Group on Power for XII Plan Period, Ministry of Power, Government of India,
January 2012
2. DSM and Energy Efficiency Plan for the state of Himachal Pradesh, PwC, July, 2010
3. M&V Guidelines: Measurement and Verification for Federal Energy Projects; US Department of Energy,
2008
4. DSM Program Procedures Manual Volume I – Industrial Energy Efficiency Program; Natural Resources
Defence Council; China-US Energy Efficiency Alliance; State Grid National DSM Instruction Centre
(China); April 2011
5. http://www.ndpl.com:84/DSM/dsm_initiatives.jsp
6. http://www.sdge.com/direct-savings-direct-install
7. http://www.eskomidm.co.za/
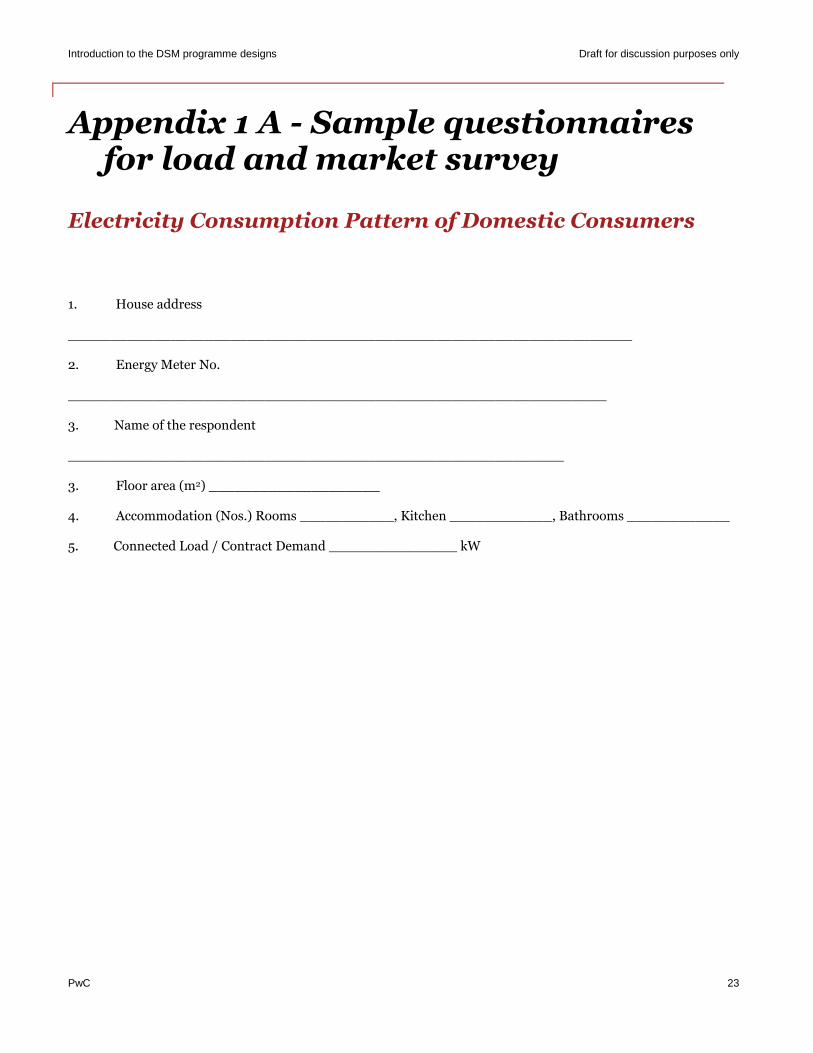
Introduction to the DSM programme designs Draft for discussion purposes only
PwC 23
Appendix 1 A - Sample questionnaires for load and market survey
Electricity Consumption Pattern of Domestic Consumers
1. House address
__________________________________________________________________
2. Energy Meter No.
_______________________________________________________________
3. Name of the respondent
__________________________________________________________
3. Floor area (m2) ____________________
4. Accommodation (Nos.) Rooms ___________, Kitchen ____________, Bathrooms ____________
5. Connected Load / Contract Demand _______________ kW
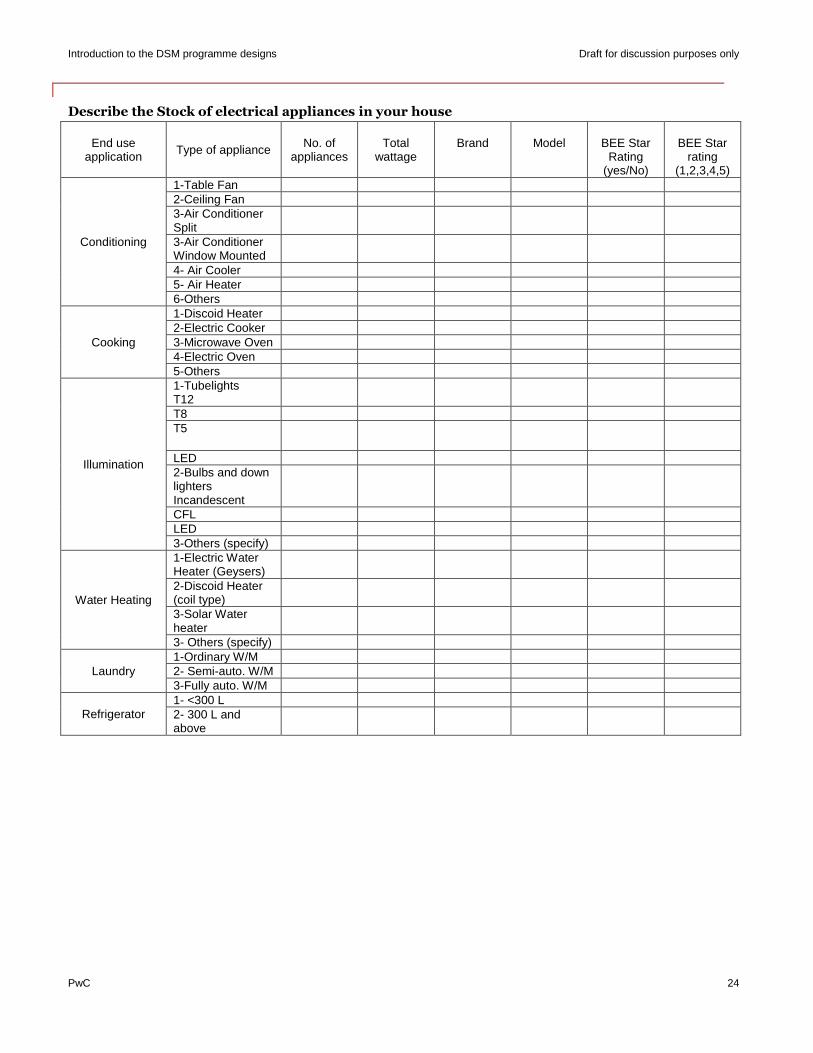
Introduction to the DSM programme designs Draft for discussion purposes only
PwC 24
Describe the Stock of electrical appliances in your house
End use application Type of appliance
No. of
appliances
Total
wattage
Brand
Model
BEE Star
Rating (yes/No)
BEE Star
rating (1,2,3,4,5)
Conditioning
1-Table Fan 2-Ceiling Fan 3-Air Conditioner Split
3-Air Conditioner Window Mounted
4- Air Cooler 5- Air Heater 6-Others
Cooking
1-Discoid Heater 2-Electric Cooker 3-Microwave Oven 4-Electric Oven 5-Others
Illumination
1-Tubelights T12
T8 T5
LED 2-Bulbs and down lighters Incandescent
CFL LED 3-Others (specify)
Water Heating
1-Electric Water Heater (Geysers)
2-Discoid Heater (coil type)
3-Solar Water heater
3- Others (specify)
Laundry 1-Ordinary W/M 2- Semi-auto. W/M 3-Fully auto. W/M
Refrigerator 1- <300 L 2- 300 L and above
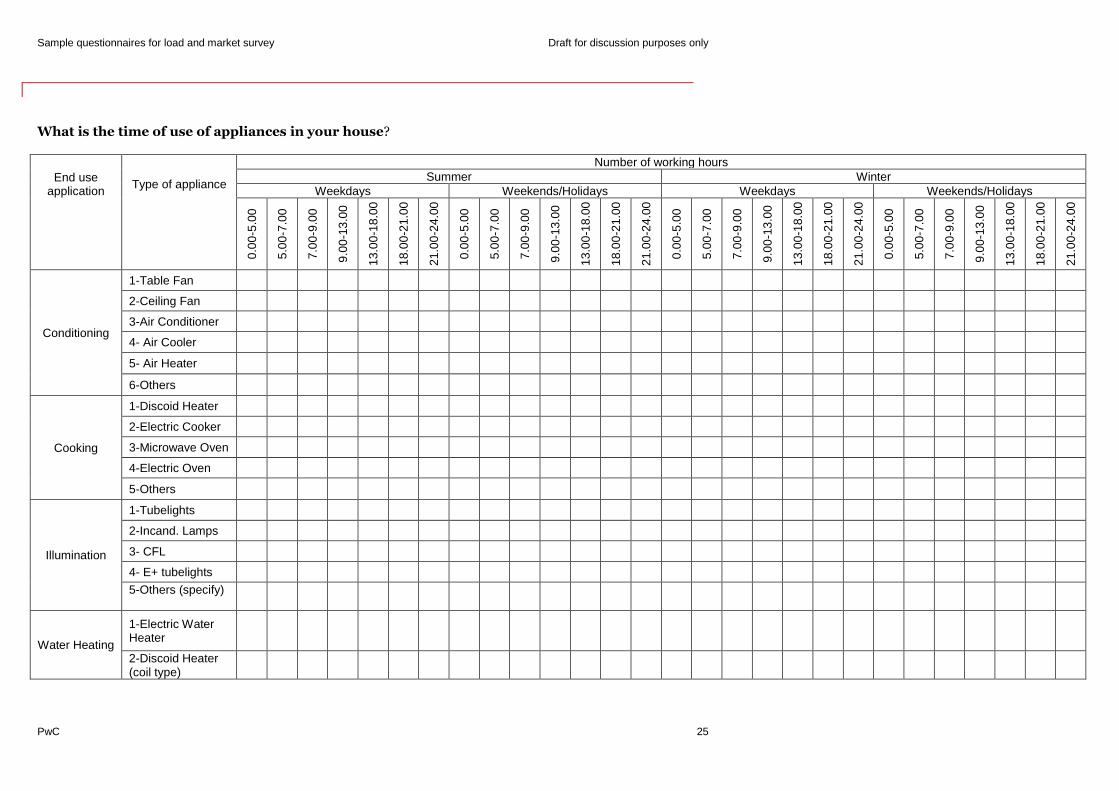
Sample questionnaires for load and market survey Draft for discussion purposes only
PwC 25
What is the time of use of appliances in your house?
End use application
Type of appliance
Number of working hours Summer Winter
Weekdays Weekends/Holidays Weekdays Weekends/Holidays
0.00
-5.0
0
5.00
-7.0
0
7.00
-9.0
0
9.00
-13.
00
13.0
0-18
.00
18.0
0-21
.00
21.0
0-24
.00
0.00
-5.0
0
5.00
-7.0
0
7.00
-9.0
0
9.00
-13.
00
13.0
0-18
.00
18.0
0-21
.00
21.0
0-24
.00
0.00
-5.0
0
5.00
-7.0
0
7.00
-9.0
0
9.00
-13.
00
13.0
0-18
.00
18.0
0-21
.00
21.0
0-24
.00
0.00
-5.0
0
5.00
-7.0
0
7.00
-9.0
0
9.00
-13.
00
13.0
0-18
.00
18.0
0-21
.00
21.0
0-24
.00
Conditioning
1-Table Fan
2-Ceiling Fan
3-Air Conditioner
4- Air Cooler
5- Air Heater
6-Others
Cooking
1-Discoid Heater
2-Electric Cooker
3-Microwave Oven
4-Electric Oven
5-Others
Illumination
1-Tubelights
2-Incand. Lamps
3- CFL
4- E+ tubelights
5-Others (specify)
Water Heating
1-Electric Water Heater
2-Discoid Heater (coil type)
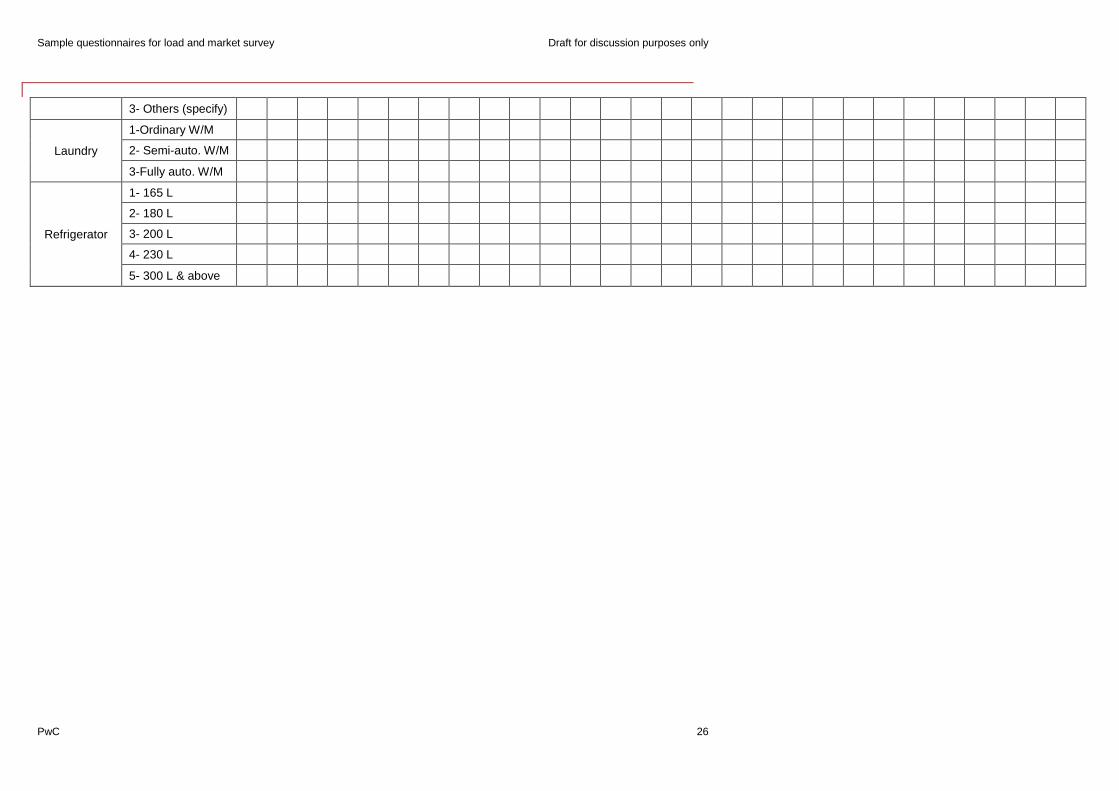
Sample questionnaires for load and market survey Draft for discussion purposes only
PwC 26
3- Others (specify)
Laundry
1-Ordinary W/M
2- Semi-auto. W/M
3-Fully auto. W/M
Refrigerator
1- 165 L
2- 180 L
3- 200 L
4- 230 L
5- 300 L & above
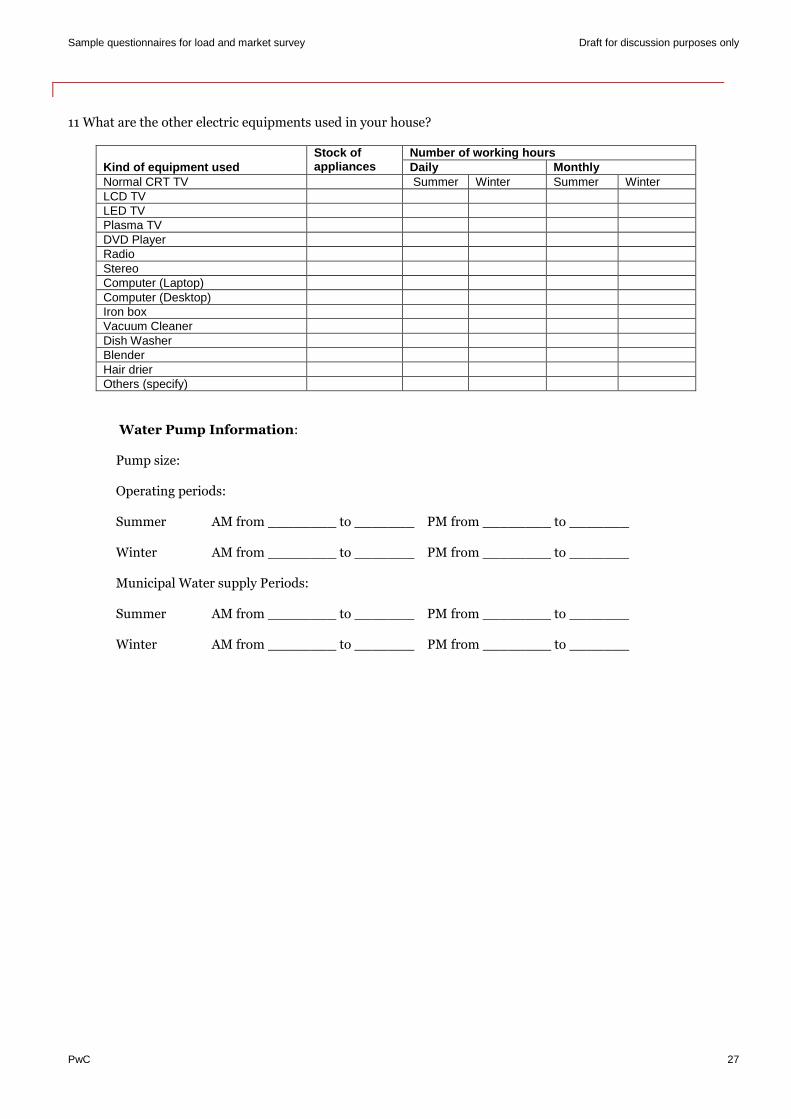
Sample questionnaires for load and market survey Draft for discussion purposes only
PwC 27
11 What are the other electric equipments used in your house?
Kind of equipment used Stock of appliances
Number of working hours Daily Monthly
Normal CRT TV Summer Winter Summer Winter LCD TV LED TV
Plasma TV DVD Player
Radio Stereo Computer (Laptop) Computer (Desktop) Iron box Vacuum Cleaner Dish Washer Blender Hair drier Others (specify)
Water Pump Information:
Pump size:
Operating periods:
Summer AM from ________ to _______ PM from ________ to _______
Winter AM from ________ to _______ PM from ________ to _______
Municipal Water supply Periods:
Summer AM from ________ to _______ PM from ________ to _______
Winter AM from ________ to _______ PM from ________ to _______

Sample questionnaires for load and market survey Draft for discussion purposes only
PwC 28
HOURLY LOAD DATA
(Readings in kW)
Hour Date: Day:
Hours Meter No. M.F.:
AM. 6.00
7.00
8.00
9.00
10.00
11.00
12.00
PM. 1.00
2.00
3.00
4.00
5.00
6.00
7.00
8.00
9.00
10.00
11.00 12.00 AM 01.00 02.00 03.00 04.00 05.00 06.00
Date: (Signature of Respondent)

Sample questionnaires for load and market survey Draft for discussion purposes only
PwC 29
Electricity Consumption Pattern of Commercial Consumers
1. Name of Establishment _________________________________________________
2. Name of the respondent
__________________________________________________________
3. Address of the facility
___________________________________________________________
____________________________________________________________________
4. Which of the following types of organizations best describes your organization?
Hotel & Restaurant Shop Private Hospital
Bank Coaching Institutes Private Offices
Railways Others (specify) _____________________
5. How many employees work at your facility? ___________
6. Hours of business (hrs./day) ________________
7. How many square meters is your facility buildup area approximately? ___________ m2
Of which: Conditioned/heated area __________ m2
8. Connected Load / Contract Demand _______________ kW
9. Fill in the following table related to energy consumption for last year:
S.No. Energy Source Quantity Unit Cost/unit (Rs.) 1 Electricity
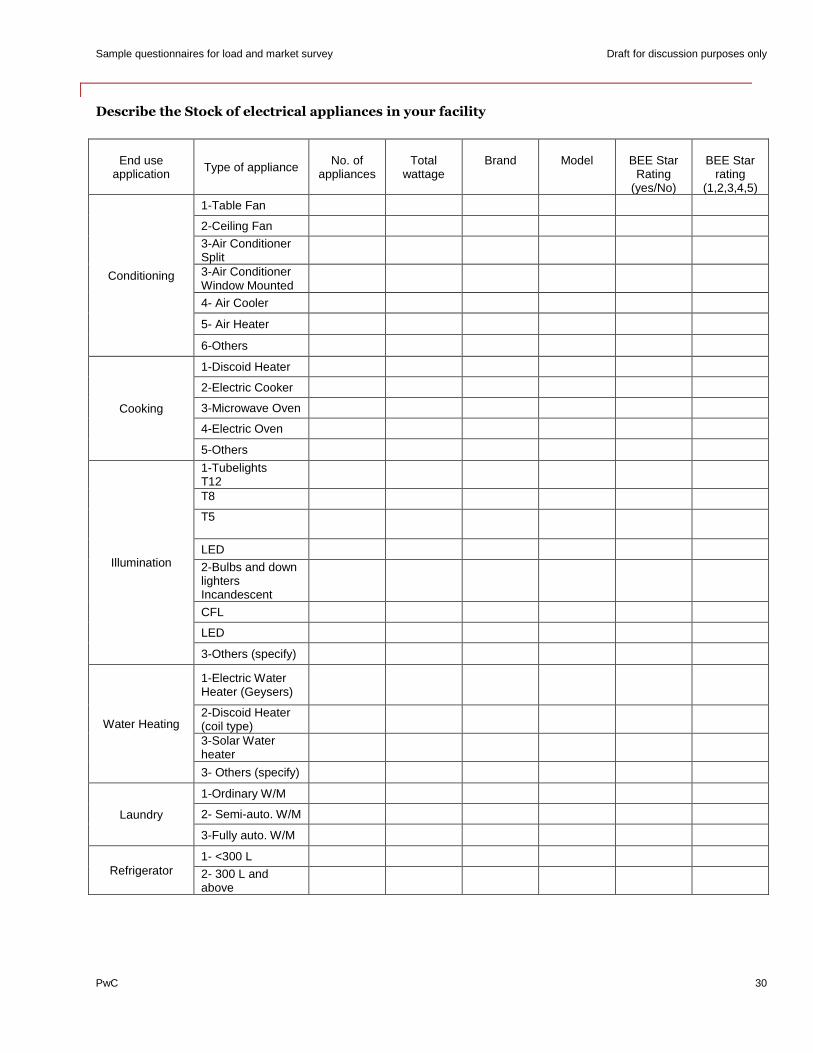
Sample questionnaires for load and market survey Draft for discussion purposes only
PwC 30
Describe the Stock of electrical appliances in your facility
End use application Type of appliance
No. of
appliances
Total
wattage
Brand
Model
BEE Star
Rating (yes/No)
BEE Star
rating (1,2,3,4,5)
Conditioning
1-Table Fan
2-Ceiling Fan
3-Air Conditioner Split
3-Air Conditioner Window Mounted
4- Air Cooler
5- Air Heater
6-Others
Cooking
1-Discoid Heater
2-Electric Cooker
3-Microwave Oven
4-Electric Oven
5-Others
Illumination
1-Tubelights T12
T8
T5
LED
2-Bulbs and down lighters Incandescent
CFL
LED
3-Others (specify)
Water Heating
1-Electric Water Heater (Geysers)
2-Discoid Heater (coil type)
3-Solar Water heater
3- Others (specify)
Laundry
1-Ordinary W/M
2- Semi-auto. W/M
3-Fully auto. W/M
Refrigerator 1- <300 L
2- 300 L and above
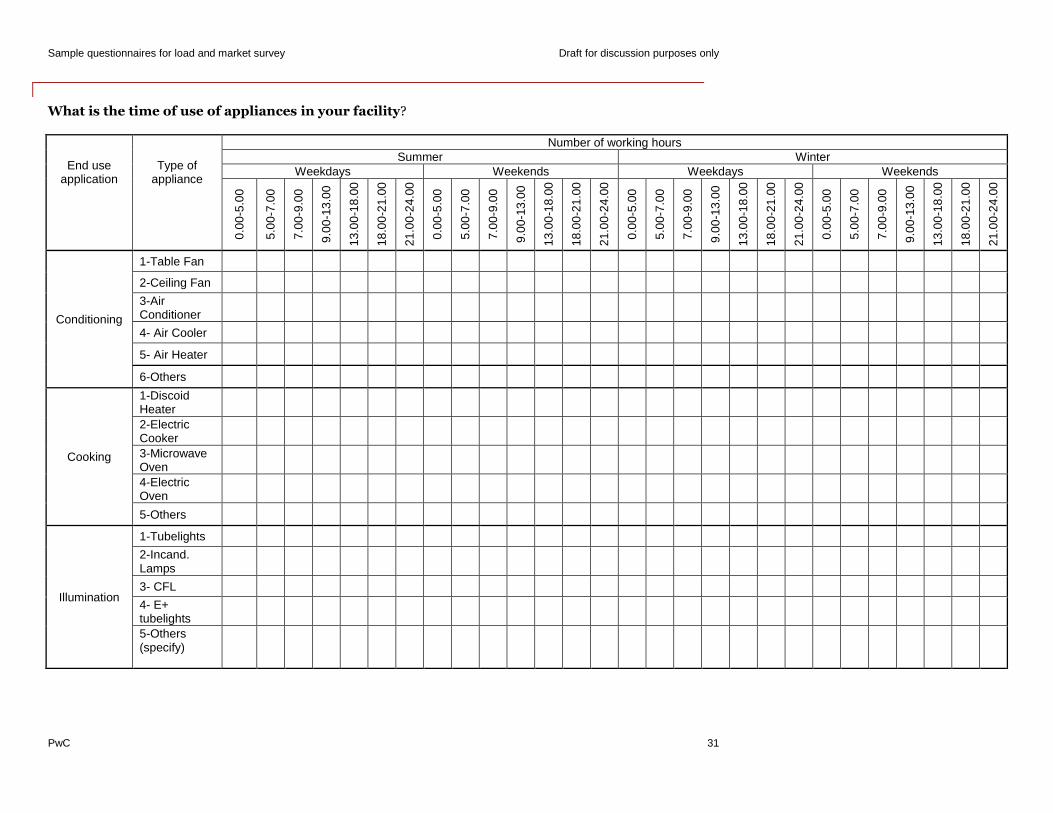
Sample questionnaires for load and market survey Draft for discussion purposes only
PwC 31
What is the time of use of appliances in your facility?
End use application
Type of appliance
Number of working hours Summer Winter
Weekdays Weekends Weekdays Weekends
0.00
-5.0
0
5.00
-7.0
0
7.00
-9.0
0
9.00
-13.
00
13.0
0-18
.00
18.0
0-21
.00
21.0
0-24
.00
0.00
-5.0
0
5.00
-7.0
0
7.00
-9.0
0
9.00
-13.
00
13.0
0-18
.00
18.0
0-21
.00
21.0
0-24
.00
0.00
-5.0
0
5.00
-7.0
0
7.00
-9.0
0
9.00
-13.
00
13.0
0-18
.00
18.0
0-21
.00
21.0
0-24
.00
0.00
-5.0
0
5.00
-7.0
0
7.00
-9.0
0
9.00
-13.
00
13.0
0-18
.00
18.0
0-21
.00
21.0
0-24
.00
Conditioning
1-Table Fan
2-Ceiling Fan
3-Air Conditioner
4- Air Cooler
5- Air Heater 6-Others
Cooking
1-Discoid Heater
2-Electric Cooker
3-Microwave Oven
4-Electric Oven
5-Others
Illumination
1-Tubelights
2-Incand. Lamps
3- CFL
4- E+ tubelights
5-Others (specify)
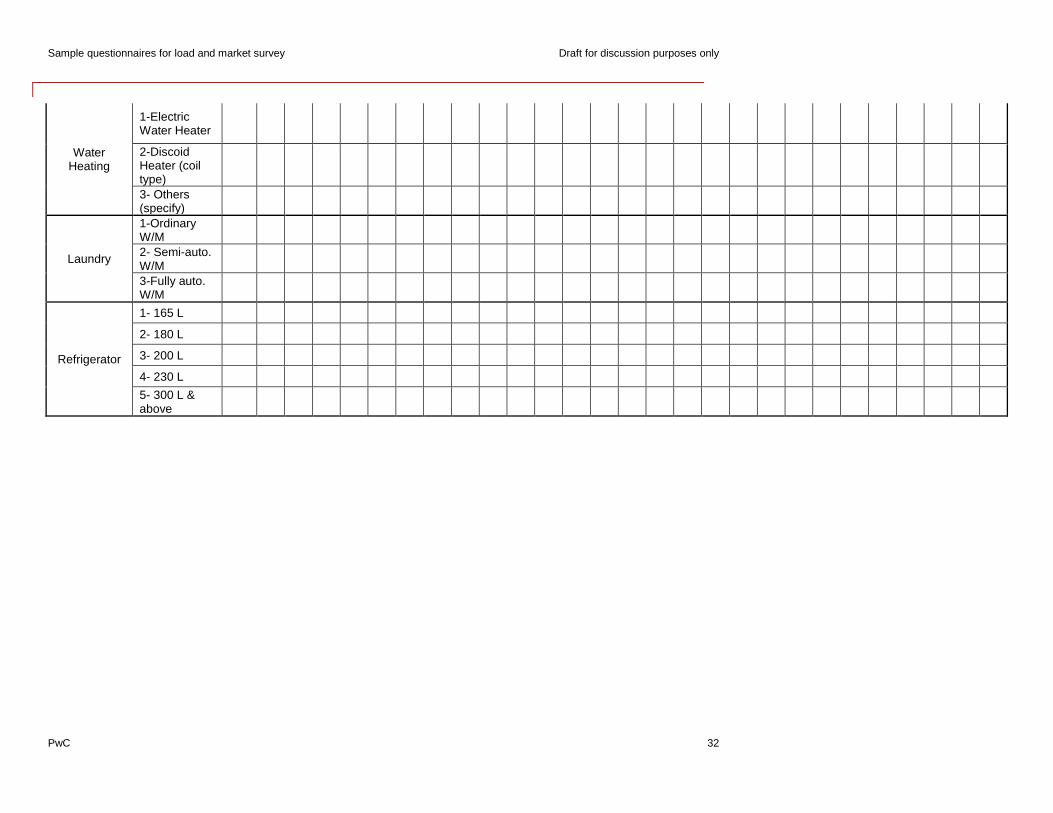
Sample questionnaires for load and market survey Draft for discussion purposes only
PwC 32
Water Heating
1-Electric Water Heater
2-Discoid Heater (coil type)
3- Others (specify)
Laundry
1-Ordinary W/M
2- Semi-auto. W/M
3-Fully auto. W/M
Refrigerator
1- 165 L
2- 180 L
3- 200 L
4- 230 L
5- 300 L & above
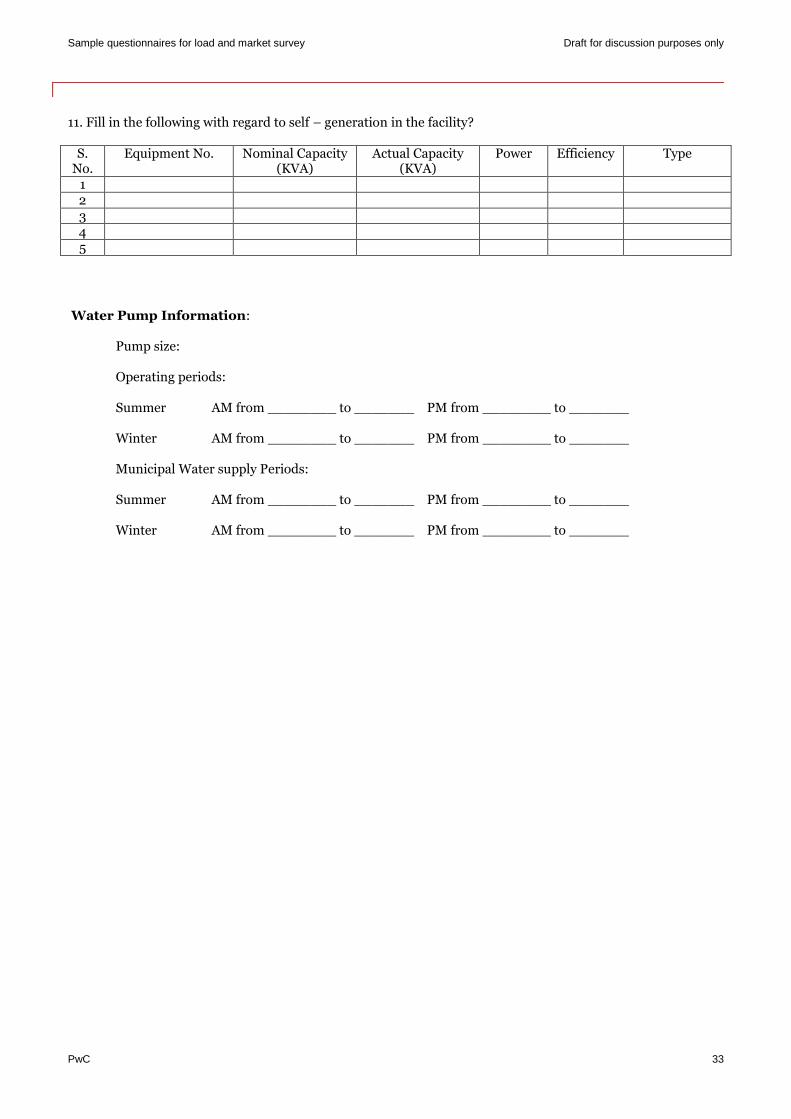
Sample questionnaires for load and market survey Draft for discussion purposes only
PwC 33
11. Fill in the following with regard to self – generation in the facility?
S. No.
Equipment No. Nominal Capacity (KVA)
Actual Capacity (KVA)
Power Efficiency Type
1 2 3 4 5
Water Pump Information:
Pump size:
Operating periods:
Summer AM from ________ to _______ PM from ________ to _______
Winter AM from ________ to _______ PM from ________ to _______
Municipal Water supply Periods:
Summer AM from ________ to _______ PM from ________ to _______
Winter AM from ________ to _______ PM from ________ to _______
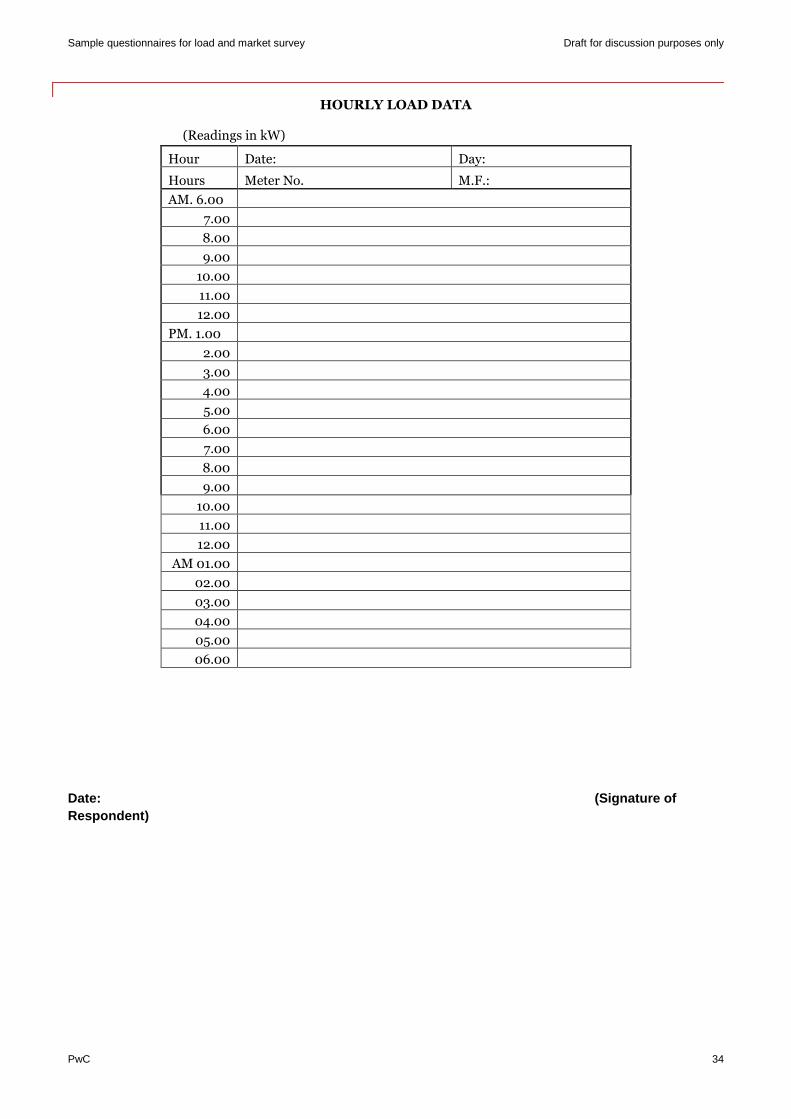
Sample questionnaires for load and market survey Draft for discussion purposes only
PwC 34
HOURLY LOAD DATA
(Readings in kW)
Hour Date: Day:
Hours Meter No. M.F.:
AM. 6.00
7.00
8.00
9.00
10.00
11.00
12.00
PM. 1.00
2.00
3.00
4.00
5.00
6.00
7.00
8.00
9.00
10.00
11.00 12.00 AM 01.00 02.00 03.00 04.00 05.00 06.00
Date: (Signature of Respondent)

Sample questionnaires for load and market survey Draft for discussion purposes only
PwC 35
Electricity Consumption Pattern of Industrial Consumers
1. Name and address of the unit
2. Telephone/Fax No.
3. Co-ordinating officers: (Name and Email ID)
4. Year of commissioning
5. Annual Turnover for 2007-2008 (Rs crores):
6. Type of operation (Continuous/Batch)
7.
No. of Shifts/ day
Shift Timing Shift 1
From ..................... to .....................
Shift 2 From ..................... to .....................
Shift 3 From ..................... to .....................
Working days/year 8. Brief description of process
9. Is there a scope to change one of the shift timing to night shift (if working for 2 shift in a day)?
10. Which of the following products does your industry manufacture?
Steel Cement Pharma
Brewery Plastic General
Chemical Electrical Goods Food Processing
Gases Glass Paper
Spinning Mills Rubber Others
11. Utility Account Number:
12. Connected Load (kW)
Total Connected Load: …………….
Lighting load: …………………
Non-lighting load: ………………….
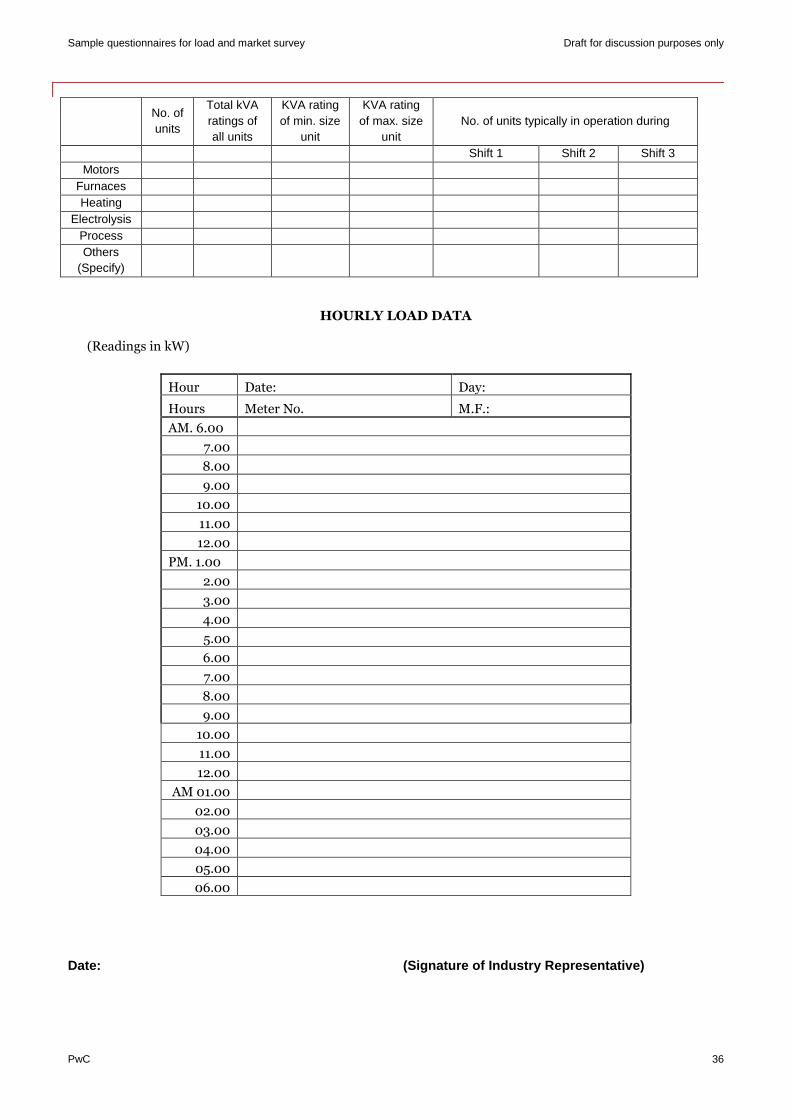
Sample questionnaires for load and market survey Draft for discussion purposes only
PwC 36
No. of units
Total kVA ratings of all units
KVA rating of min. size
unit
KVA rating of max. size
unit No. of units typically in operation during
Shift 1 Shift 2 Shift 3 Motors
Furnaces Heating
Electrolysis Process Others
(Specify)
HOURLY LOAD DATA
(Readings in kW)
Hour Date: Day:
Hours Meter No. M.F.:
AM. 6.00
7.00
8.00
9.00
10.00
11.00
12.00
PM. 1.00
2.00
3.00
4.00
5.00
6.00
7.00
8.00
9.00
10.00
11.00 12.00 AM 01.00 02.00 03.00 04.00 05.00 06.00
Date: (Signature of Industry Representative)
Sample questionnaires for load and market survey Draft for discussion purposes only
Disclaimer
This document is for general information purposes only, and should not be used as a substitute for
consultation with professional advisors. No representation or warranty (express or implied) is given as to the
accuracy or completeness of the information contained in this primer, and, to the extent permitted by law,
PricewaterhouseCoopers Private Ltd, its members, employees and agents do not accept or assume any
liability, responsibility or duty of care for any consequences of you or anyone else acting, or refraining to act,
in reliance on the information contained in this primer or for any decision based on it.
37


This report is solely for the use and benefit of Shakti Sustainable Energy Foundation and should not be relied upon by any other part. Utility CEO Forum on Demand Side Management - Annual Report 2013 PwC
G. Proceedings: Third Meeting

Proceedings Third meeting of Utility CEO Forum on Demand Side Management
September 2013

Utility CEO forum on DSM Third meeting proceedings
PwC Page 3 of 11
Table of contents Introduction .................................................................................................................................................................. 4
Welcome note ............................................................................................................................................................... 5
Setting the context ........................................................................................................................................................ 5
Review of the outcomes of second meeting: Model DSM Policy ............................................................................... 6
Theme presentation and discussion ............................................................................................................................ 6
Industry speak: Tata Power .......................................................................................................................................... 7
Industry speak: Reliance Infra..................................................................................................................................... 8
Industry speak: MP Ensystems ................................................................................................................................... 8
Industry speak: Philips Electronics ............................................................................................................................. 9
Closing comments ........................................................................................................................................................ 9
Way forward .................................................................................................................................................................. 9
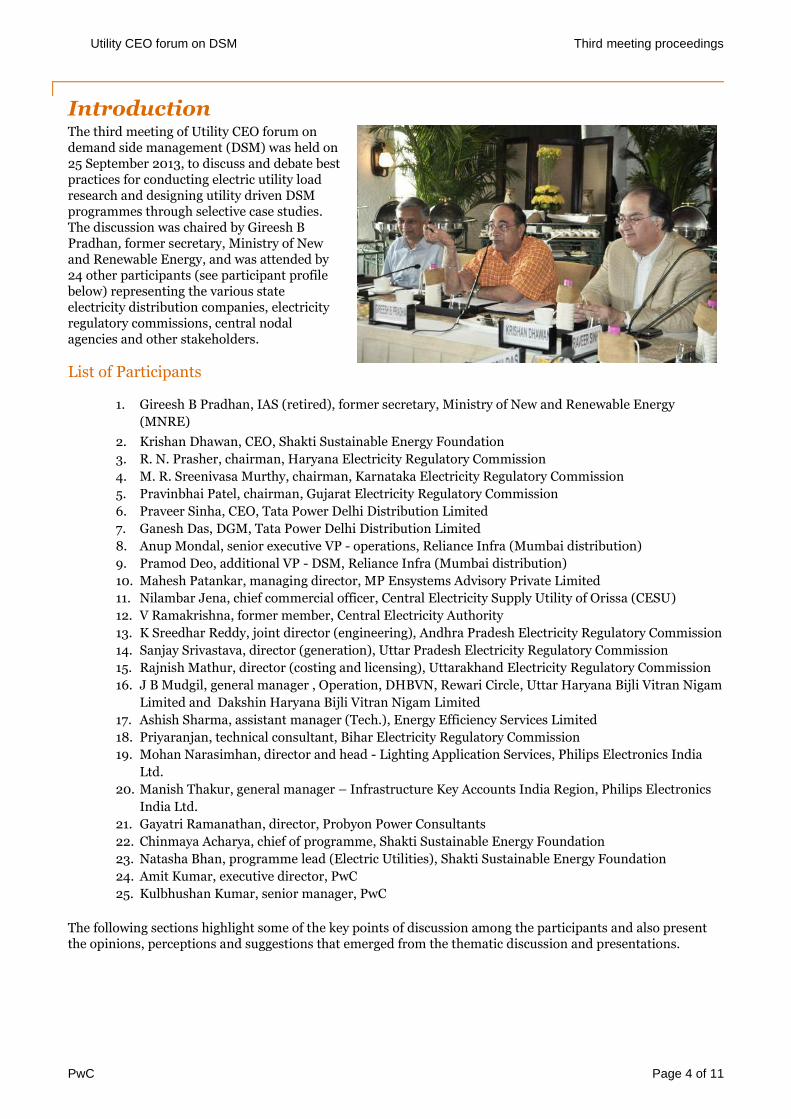
Utility CEO forum on DSM Third meeting proceedings
PwC Page 4 of 11
Introduction The third meeting of Utility CEO forum on demand side management (DSM) was held on 25 September 2013, to discuss and debate best practices for conducting electric utility load research and designing utility driven DSM programmes through selective case studies. The discussion was chaired by Gireesh B Pradhan, former secretary, Ministry of New and Renewable Energy, and was attended by 24 other participants (see participant profile below) representing the various state electricity distribution companies, electricity regulatory commissions, central nodal agencies and other stakeholders.
List of Participants
1. Gireesh B Pradhan, IAS (retired), former secretary, Ministry of New and Renewable Energy
(MNRE)
2. Krishan Dhawan, CEO, Shakti Sustainable Energy Foundation
3. R. N. Prasher, chairman, Haryana Electricity Regulatory Commission
4. M. R. Sreenivasa Murthy, chairman, Karnataka Electricity Regulatory Commission
5. Pravinbhai Patel, chairman, Gujarat Electricity Regulatory Commission
6. Praveer Sinha, CEO, Tata Power Delhi Distribution Limited
7. Ganesh Das, DGM, Tata Power Delhi Distribution Limited
8. Anup Mondal, senior executive VP - operations, Reliance Infra (Mumbai distribution)
9. Pramod Deo, additional VP - DSM, Reliance Infra (Mumbai distribution)
10. Mahesh Patankar, managing director, MP Ensystems Advisory Private Limited
11. Nilambar Jena, chief commercial officer, Central Electricity Supply Utility of Orissa (CESU)
12. V Ramakrishna, former member, Central Electricity Authority
13. K Sreedhar Reddy, joint director (engineering), Andhra Pradesh Electricity Regulatory Commission
14. Sanjay Srivastava, director (generation), Uttar Pradesh Electricity Regulatory Commission
15. Rajnish Mathur, director (costing and licensing), Uttarakhand Electricity Regulatory Commission
16. J B Mudgil, general manager , Operation, DHBVN, Rewari Circle, Uttar Haryana Bijli Vitran Nigam
Limited and Dakshin Haryana Bijli Vitran Nigam Limited
17. Ashish Sharma, assistant manager (Tech.), Energy Efficiency Services Limited
18. Priyaranjan, technical consultant, Bihar Electricity Regulatory Commission
19. Mohan Narasimhan, director and head - Lighting Application Services, Philips Electronics India
Ltd.
20. Manish Thakur, general manager – Infrastructure Key Accounts India Region, Philips Electronics
India Ltd.
21. Gayatri Ramanathan, director, Probyon Power Consultants
22. Chinmaya Acharya, chief of programme, Shakti Sustainable Energy Foundation
23. Natasha Bhan, programme lead (Electric Utilities), Shakti Sustainable Energy Foundation
24. Amit Kumar, executive director, PwC
25. Kulbhushan Kumar, senior manager, PwC
The following sections highlight some of the key points of discussion among the participants and also present the opinions, perceptions and suggestions that emerged from the thematic discussion and presentations.
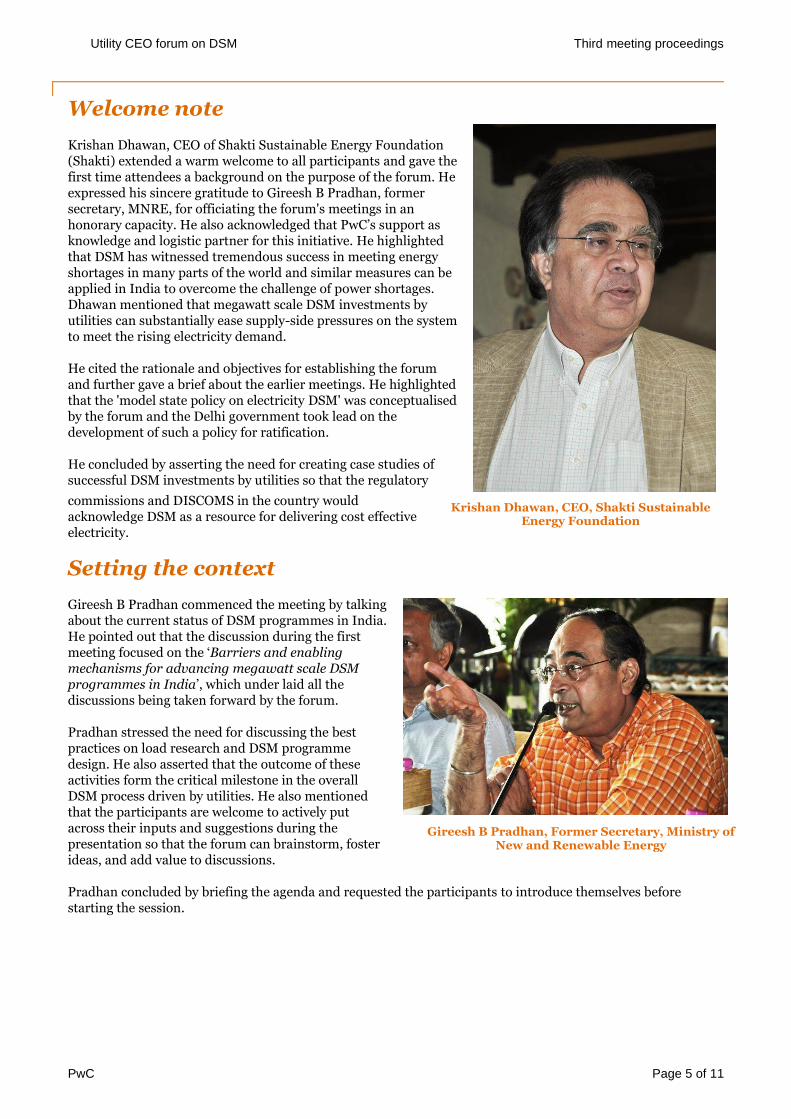
Utility CEO forum on DSM Third meeting proceedings
PwC Page 5 of 11
Welcome note
Krishan Dhawan, CEO of Shakti Sustainable Energy Foundation (Shakti) extended a warm welcome to all participants and gave the first time attendees a background on the purpose of the forum. He expressed his sincere gratitude to Gireesh B Pradhan, former secretary, MNRE, for officiating the forum's meetings in an honorary capacity. He also acknowledged that PwC’s support as knowledge and logistic partner for this initiative. He highlighted that DSM has witnessed tremendous success in meeting energy shortages in many parts of the world and similar measures can be applied in India to overcome the challenge of power shortages. Dhawan mentioned that megawatt scale DSM investments by utilities can substantially ease supply-side pressures on the system to meet the rising electricity demand.
He cited the rationale and objectives for establishing the forum and further gave a brief about the earlier meetings. He highlighted that the 'model state policy on electricity DSM' was conceptualised by the forum and the Delhi government took lead on the development of such a policy for ratification.
He concluded by asserting the need for creating case studies of successful DSM investments by utilities so that the regulatory
commissions and DISCOMS in the country would acknowledge DSM as a resource for delivering cost effective electricity.
Setting the context
Gireesh B Pradhan commenced the meeting by talking about the current status of DSM programmes in India. He pointed out that the discussion during the first meeting focused on the ‘Barriers and enabling mechanisms for advancing megawatt scale DSM programmes in India’, which under laid all the discussions being taken forward by the forum.
Pradhan stressed the need for discussing the best practices on load research and DSM programme design. He also asserted that the outcome of these activities form the critical milestone in the overall DSM process driven by utilities. He also mentioned that the participants are welcome to actively put across their inputs and suggestions during the presentation so that the forum can brainstorm, foster ideas, and add value to discussions.
Pradhan concluded by briefing the agenda and requested the participants to introduce themselves before starting the session.
Krishan Dhawan, CEO, Shakti Sustainable Energy Foundation
Gireesh B Pradhan, Former Secretary, Ministry of New and Renewable Energy

Utility CEO forum on DSM Third meeting proceedings
PwC Page 6 of 11
Review of the outcomes of second meeting: Model DSM Policy This presentation was delivered by Amit Kumar, executive director at PwC. The presentation focused on the draft model DSM policy, which was discussion theme at forum's second meeting. Kumar explained the need for a state policy on electricity DSM and further outlined the key revisions made in the draft model policy based on the comments and suggestions received from the stakeholders.
The presentation was followed by an enriching discussion and debate amongst the participants.
Key points of discussion Ramakrishna, former member of CEA, asserted that the monitoring of energy savings is a critical component in the DSM programme cycle and is very essential to evaluate the impact of DSM programmes.
Prasher, chairman of HERC, supported this view by stating that the lack of effective M&V systems during the silent revolution of CFL’s and other energy efficient devices in North India has left the industry unaware of the exact impact in terms of energy savings.
Kumar mentioned that the model policy has addressed the need for a well defined M&V framework and the states should actively adopt such a policy to accelerate megawatt scale DSM investments.
Pradhan highlighted that the model DSM policy in its current shape is only a guiding framework for the state governments, which can further formulate/modify/reject any element of the policy to suit the priorities and interests of stakeholders.
Kumar informed the participants that the final version of the model DSM policy will be available on the website of SSEF1 and the participants can reach out to the SSEF/PwC for any clarifications in the model policy or for any assistance in the drafting of state specific DSM policy by formulating the model policy.
Theme presentation and discussion This presentation was delivered by Kulbhushan Kumar, senior manager at PwC. The presentation focused on a case study, which illustrated the methods of load research study conducted in Himachal Pradesh in the year 2010-11. The presentation also summarized the key features of several successful DSM programme designs adopted in South Africa, US and their pilot prototypes in India.
During the presentation, while Kumar was highlighting the load restriction initiatives in Himachal Pradesh, the discussion among the participants echoed the sentiment that 'load Shedding
1 http://www.shaktifoundation.in/cms/UploadedImages/model_dsm_policy%20-%20post%20second%20meeting%20final.pdf
Amit Kumar, Executive Director, PwC
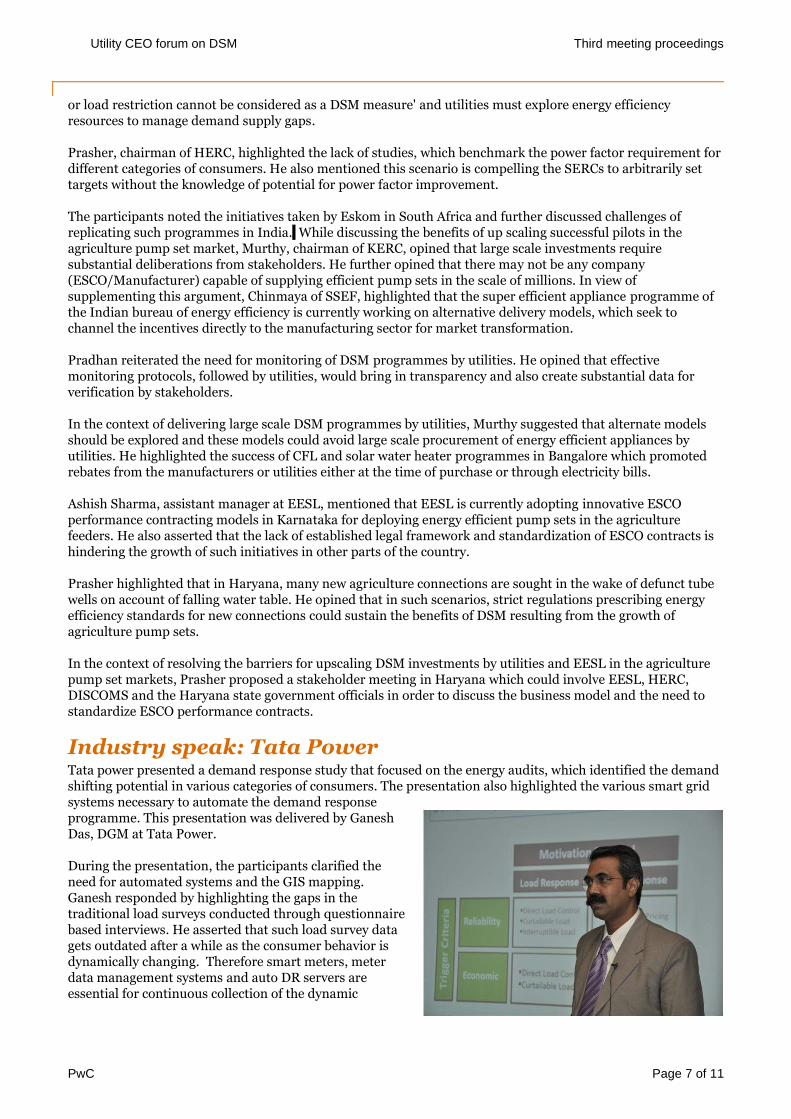
Utility CEO forum on DSM Third meeting proceedings
PwC Page 7 of 11
or load restriction cannot be considered as a DSM measure' and utilities must explore energy efficiency resources to manage demand supply gaps.
Prasher, chairman of HERC, highlighted the lack of studies, which benchmark the power factor requirement for different categories of consumers. He also mentioned this scenario is compelling the SERCs to arbitrarily set targets without the knowledge of potential for power factor improvement.
The participants noted the initiatives taken by Eskom in South Africa and further discussed challenges of replicating such programmes in India. While discussing the benefits of up scaling successful pilots in the agriculture pump set market, Murthy, chairman of KERC, opined that large scale investments require substantial deliberations from stakeholders. He further opined that there may not be any company (ESCO/Manufacturer) capable of supplying efficient pump sets in the scale of millions. In view of supplementing this argument, Chinmaya of SSEF, highlighted that the super efficient appliance programme of the Indian bureau of energy efficiency is currently working on alternative delivery models, which seek to channel the incentives directly to the manufacturing sector for market transformation.
Pradhan reiterated the need for monitoring of DSM programmes by utilities. He opined that effective monitoring protocols, followed by utilities, would bring in transparency and also create substantial data for verification by stakeholders.
In the context of delivering large scale DSM programmes by utilities, Murthy suggested that alternate models should be explored and these models could avoid large scale procurement of energy efficient appliances by utilities. He highlighted the success of CFL and solar water heater programmes in Bangalore which promoted rebates from the manufacturers or utilities either at the time of purchase or through electricity bills.
Ashish Sharma, assistant manager at EESL, mentioned that EESL is currently adopting innovative ESCO performance contracting models in Karnataka for deploying energy efficient pump sets in the agriculture feeders. He also asserted that the lack of established legal framework and standardization of ESCO contracts is hindering the growth of such initiatives in other parts of the country.
Prasher highlighted that in Haryana, many new agriculture connections are sought in the wake of defunct tube wells on account of falling water table. He opined that in such scenarios, strict regulations prescribing energy efficiency standards for new connections could sustain the benefits of DSM resulting from the growth of agriculture pump sets.
In the context of resolving the barriers for upscaling DSM investments by utilities and EESL in the agriculture pump set markets, Prasher proposed a stakeholder meeting in Haryana which could involve EESL, HERC, DISCOMS and the Haryana state government officials in order to discuss the business model and the need to standardize ESCO performance contracts.
Industry speak: Tata Power Tata power presented a demand response study that focused on the energy audits, which identified the demand shifting potential in various categories of consumers. The presentation also highlighted the various smart grid systems necessary to automate the demand response programme. This presentation was delivered by Ganesh Das, DGM at Tata Power.
During the presentation, the participants clarified the need for automated systems and the GIS mapping. Ganesh responded by highlighting the gaps in the traditional load surveys conducted through questionnaire based interviews. He asserted that such load survey data gets outdated after a while as the consumer behavior is dynamically changing. Therefore smart meters, meter data management systems and auto DR servers are essential for continuous collection of the dynamic
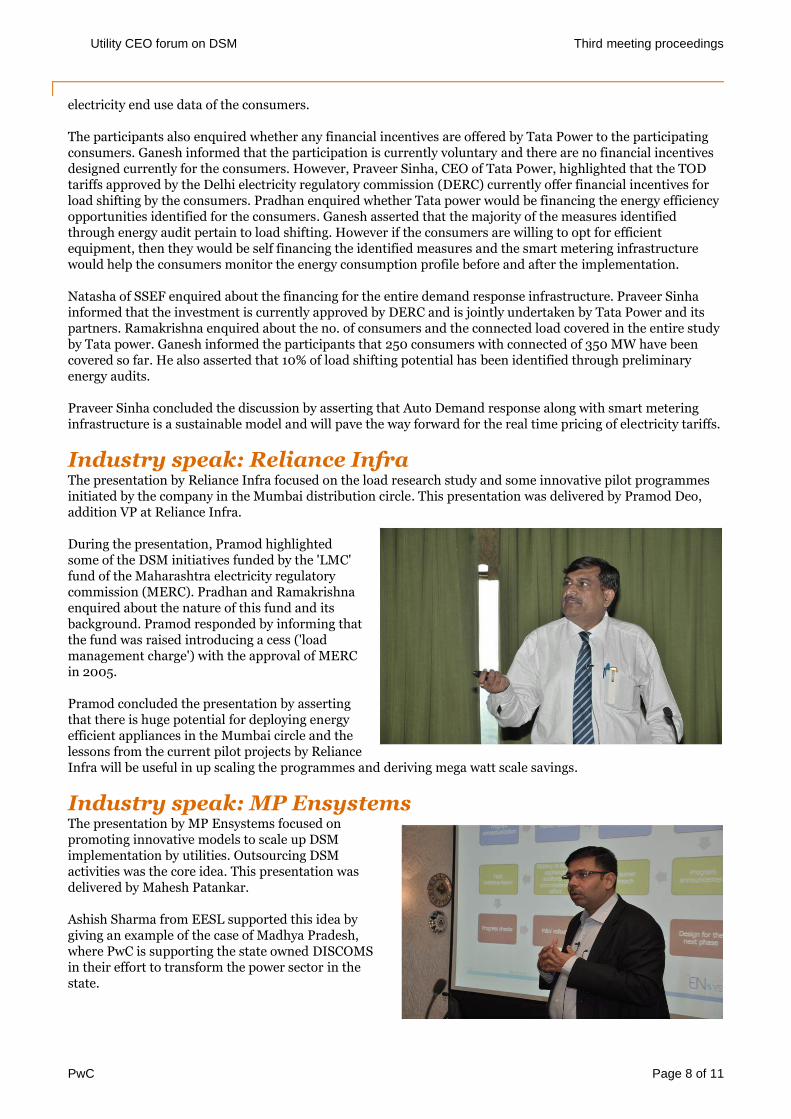
Utility CEO forum on DSM Third meeting proceedings
PwC Page 8 of 11
electricity end use data of the consumers.
The participants also enquired whether any financial incentives are offered by Tata Power to the participating consumers. Ganesh informed that the participation is currently voluntary and there are no financial incentives designed currently for the consumers. However, Praveer Sinha, CEO of Tata Power, highlighted that the TOD tariffs approved by the Delhi electricity regulatory commission (DERC) currently offer financial incentives for load shifting by the consumers. Pradhan enquired whether Tata power would be financing the energy efficiency opportunities identified for the consumers. Ganesh asserted that the majority of the measures identified through energy audit pertain to load shifting. However if the consumers are willing to opt for efficient equipment, then they would be self financing the identified measures and the smart metering infrastructure would help the consumers monitor the energy consumption profile before and after the implementation.
Natasha of SSEF enquired about the financing for the entire demand response infrastructure. Praveer Sinha informed that the investment is currently approved by DERC and is jointly undertaken by Tata Power and its partners. Ramakrishna enquired about the no. of consumers and the connected load covered in the entire study by Tata power. Ganesh informed the participants that 250 consumers with connected of 350 MW have been covered so far. He also asserted that 10% of load shifting potential has been identified through preliminary energy audits.
Praveer Sinha concluded the discussion by asserting that Auto Demand response along with smart metering infrastructure is a sustainable model and will pave the way forward for the real time pricing of electricity tariffs.
Industry speak: Reliance Infra The presentation by Reliance Infra focused on the load research study and some innovative pilot programmes initiated by the company in the Mumbai distribution circle. This presentation was delivered by Pramod Deo, addition VP at Reliance Infra.
During the presentation, Pramod highlighted some of the DSM initiatives funded by the 'LMC' fund of the Maharashtra electricity regulatory commission (MERC). Pradhan and Ramakrishna enquired about the nature of this fund and its background. Pramod responded by informing that the fund was raised introducing a cess ('load management charge') with the approval of MERC in 2005.
Pramod concluded the presentation by asserting that there is huge potential for deploying energy efficient appliances in the Mumbai circle and the lessons from the current pilot projects by Reliance Infra will be useful in up scaling the programmes and deriving mega watt scale savings.
Industry speak: MP Ensystems The presentation by MP Ensystems focused on promoting innovative models to scale up DSM implementation by utilities. Outsourcing DSM activities was the core idea. This presentation was delivered by Mahesh Patankar.
Ashish Sharma from EESL supported this idea by giving an example of the case of Madhya Pradesh, where PwC is supporting the state owned DISCOMS in their effort to transform the power sector in the state.
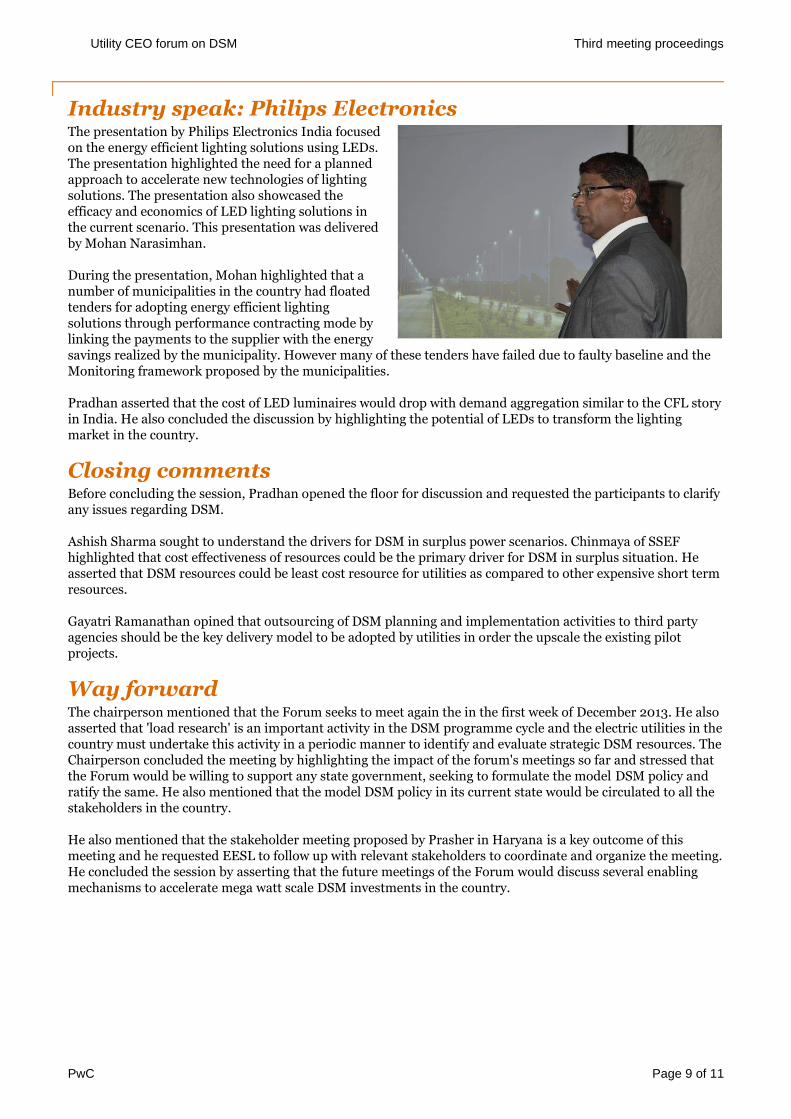
Utility CEO forum on DSM Third meeting proceedings
PwC Page 9 of 11
Industry speak: Philips Electronics The presentation by Philips Electronics India focused on the energy efficient lighting solutions using LEDs. The presentation highlighted the need for a planned approach to accelerate new technologies of lighting solutions. The presentation also showcased the efficacy and economics of LED lighting solutions in the current scenario. This presentation was delivered by Mohan Narasimhan.
During the presentation, Mohan highlighted that a number of municipalities in the country had floated tenders for adopting energy efficient lighting solutions through performance contracting mode by linking the payments to the supplier with the energy savings realized by the municipality. However many of these tenders have failed due to faulty baseline and the Monitoring framework proposed by the municipalities.
Pradhan asserted that the cost of LED luminaires would drop with demand aggregation similar to the CFL story in India. He also concluded the discussion by highlighting the potential of LEDs to transform the lighting market in the country.
Closing comments Before concluding the session, Pradhan opened the floor for discussion and requested the participants to clarify any issues regarding DSM.
Ashish Sharma sought to understand the drivers for DSM in surplus power scenarios. Chinmaya of SSEF highlighted that cost effectiveness of resources could be the primary driver for DSM in surplus situation. He asserted that DSM resources could be least cost resource for utilities as compared to other expensive short term resources.
Gayatri Ramanathan opined that outsourcing of DSM planning and implementation activities to third party agencies should be the key delivery model to be adopted by utilities in order the upscale the existing pilot projects.
Way forward The chairperson mentioned that the Forum seeks to meet again the in the first week of December 2013. He also asserted that 'load research' is an important activity in the DSM programme cycle and the electric utilities in the country must undertake this activity in a periodic manner to identify and evaluate strategic DSM resources. The Chairperson concluded the meeting by highlighting the impact of the forum's meetings so far and stressed that the Forum would be willing to support any state government, seeking to formulate the model DSM policy and ratify the same. He also mentioned that the model DSM policy in its current state would be circulated to all the stakeholders in the country.
He also mentioned that the stakeholder meeting proposed by Prasher in Haryana is a key outcome of this meeting and he requested EESL to follow up with relevant stakeholders to coordinate and organize the meeting. He concluded the session by asserting that the future meetings of the Forum would discuss several enabling mechanisms to accelerate mega watt scale DSM investments in the country.
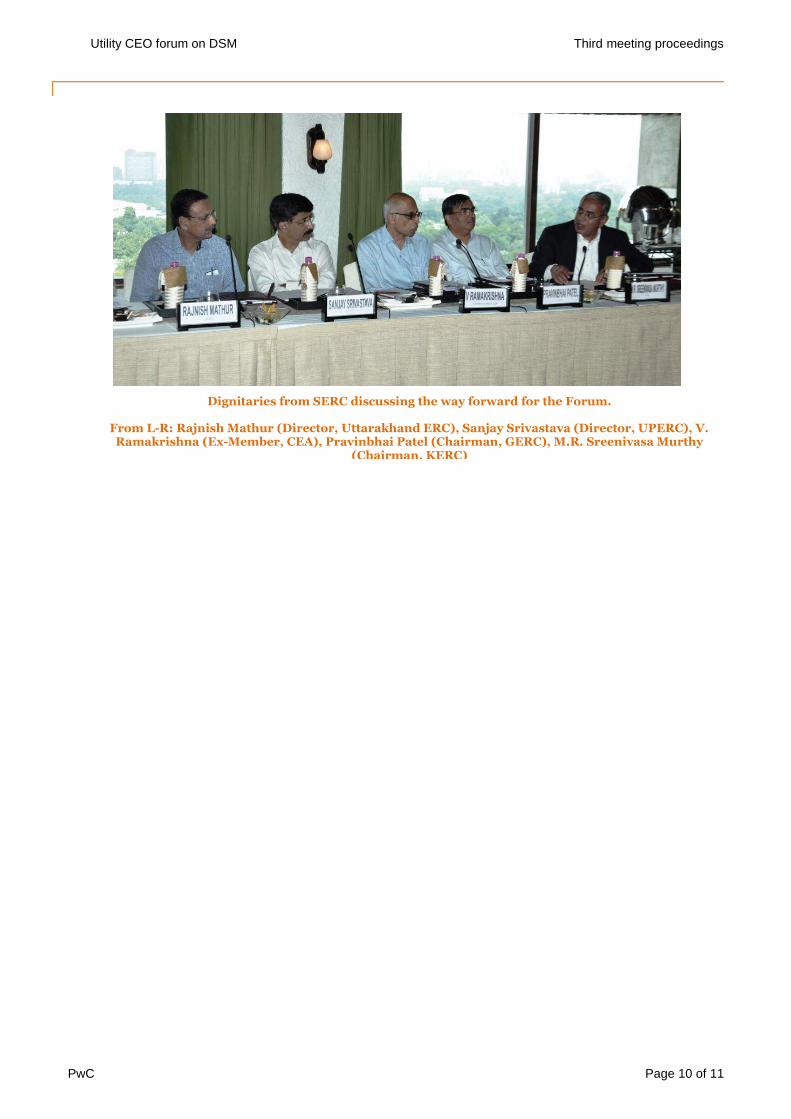
Utility CEO forum on DSM Third meeting proceedings
PwC Page 10 of 11
Dignitaries from SERC discussing the way forward for the Forum.
From L-R: Rajnish Mathur (Director, Uttarakhand ERC), Sanjay Srivastava (Director, UPERC), V. Ramakrishna (Ex-Member, CEA), Pravinbhai Patel (Chairman, GERC), M.R. Sreenivasa Murthy
(Chairman, KERC)
Utility CEO forum on DSM Third meeting proceedings
Disclaimer
This publication has been prepared for general guidance on matters of interest only, and does not constitute professional advice. You should not act upon the information contained in this publication without obtaining specific professional advice. No representation or warranty (express or implied) is given as to the accuracy or completeness of the information contained in this report, and, to the extent permitted by law, PricewaterhouseCoopers Private Limited, its members, employees and agents do not accept or assume any liability, responsibility or duty of care for any consequences of you or anyone else acting, or refraining to act, in reliance on the information contained in this report or for any decision based on it.
Copyright
© 2013 PricewaterhouseCoopers Private Limited. All rights reserved. In this document, “PwC” refers to PricewaterhouseCoopers Private Limited (a limited liability company in India), which is a member firm of PricewaterhouseCoopers International Limited (PwCIL), each member firm of which is a separate legal entity.

This report is solely for the use and benefit of Shakti Sustainable Energy Foundation and should not be relied upon by any other part. Utility CEO Forum on Demand Side Management - Annual Report 2013 PwC
H. Theme Paper: Measurement and verification of utility driven DSM programmes: Best practices and case studies

Measurement andverification of utilitydriven DSMprogrammes:Best practices andcase studiesUtility CEO Forum onDemand Side Management
Measurement andverification of utilitydriven DSMprogrammes:Best practices andcase studiesUtility CEO Forum onDemand Side Management
December 2013
verification of utility
programmes:
Demand Side Management

PwC 2
Abstract
PwC 3
Abstract
This paper is the fourth in the series of background papers developed for the participants of the Utility CEO
Forum on Demand Side Management (DSM).
Demand side resources constitute energy and demand savings resulting from the actions of a utility, beyond the
customer's meter. The function of measurement and verification (M&V) is to independently and objectively
protect the interest of all stakeholders by quantifying the DSM project impacts and their sustainability over the
agreed contractual life of the DSM interventions. M&V provides the certainty that the reported savings are real
and verifiable.
In India, as elsewhere, large scale investments in DSM resources have been hampered due to the inability of the
project partners (electric utilities and energy service companies) to agree upon a method to measure and verify
energy savings. Additionally, the concurrence of established protocols for M&V of savings, by the regulatory
commissions is also significant to the sustainability of large scale DSM investments.
This document provides a review of the current M&V framework adopted in India and abroad. It further
provides some of the best international practices and relevant case studies to illustrate successful M&V
approaches and methods, which can guide Indian electric utilities in planning and acquiring megawatt scale
DSM resources.

Table of contents
1. Introduction 7
1.1. M&V: Meaning and purpose 7
1.2. General approach to M&V 7
1.3. M&V options 8
1.4. Managing risks through M&V 9
1.5. M&V issues and challenges in India 11
2. International experience with M&V 13
3. Best practices 15
3.1. Agriculture DSM Pilot Project in Solapur, Maharashtra 15
3.2. Bachat Lamp Yojana 16
3.3. M&V for demand response programmes 18
4. References 21

PwC 6
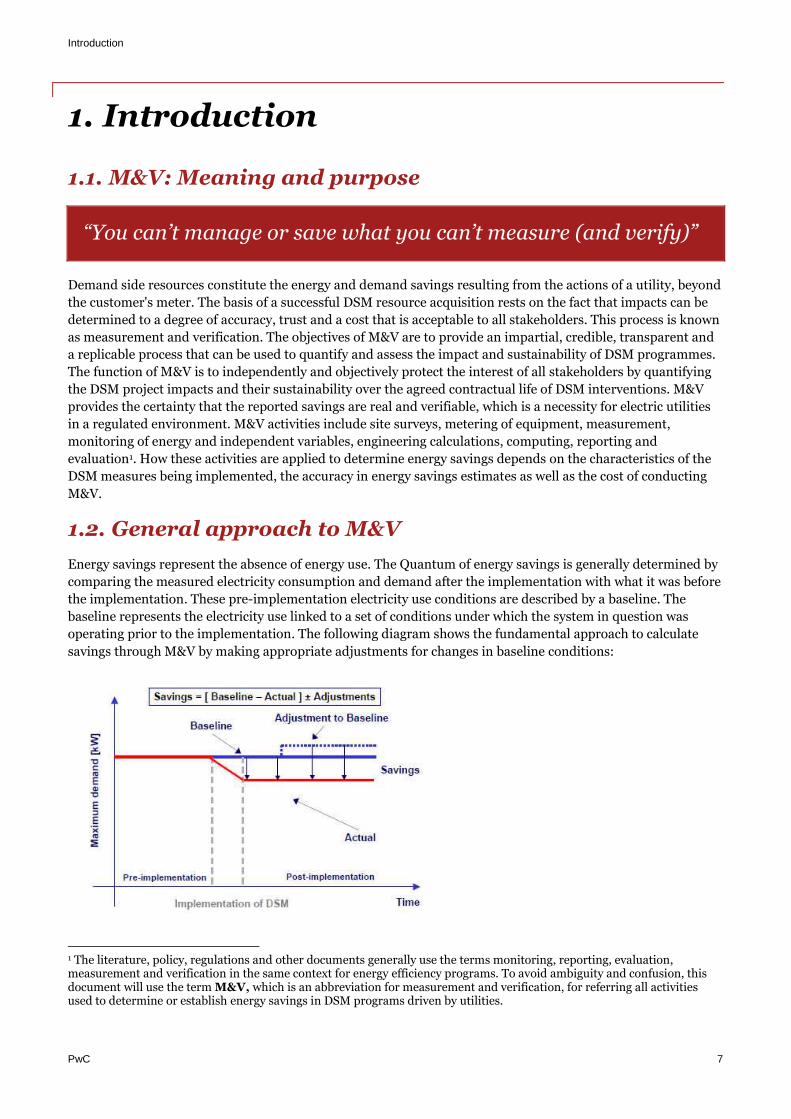
Introduction
PwC 7
1. Introduction
1.1. M&V: Meaning and purpose
“You can’t manage or save what you can’t measure (and verify)”
Demand side resources constitute the energy and demand savings resulting from the actions of a utility, beyond
the customer's meter. The basis of a successful DSM resource acquisition rests on the fact that impacts can be
determined to a degree of accuracy, trust and a cost that is acceptable to all stakeholders. This process is known
as measurement and verification. The objectives of M&V are to provide an impartial, credible, transparent and
a replicable process that can be used to quantify and assess the impact and sustainability of DSM programmes.
The function of M&V is to independently and objectively protect the interest of all stakeholders by quantifying
the DSM project impacts and their sustainability over the agreed contractual life of DSM interventions. M&V
provides the certainty that the reported savings are real and verifiable, which is a necessity for electric utilities
in a regulated environment. M&V activities include site surveys, metering of equipment, measurement,
monitoring of energy and independent variables, engineering calculations, computing, reporting and
evaluation1. How these activities are applied to determine energy savings depends on the characteristics of the
DSM measures being implemented, the accuracy in energy savings estimates as well as the cost of conducting
M&V.
1.2. General approach to M&V
Energy savings represent the absence of energy use. The Quantum of energy savings is generally determined by
comparing the measured electricity consumption and demand after the implementation with what it was before
the implementation. These pre-implementation electricity use conditions are described by a baseline. The
baseline represents the electricity use linked to a set of conditions under which the system in question was
operating prior to the implementation. The following diagram shows the fundamental approach to calculate
savings through M&V by making appropriate adjustments for changes in baseline conditions:
1 The literature, policy, regulations and other documents generally use the terms monitoring, reporting, evaluation,measurement and verification in the same context for energy efficiency programs. To avoid ambiguity and confusion, thisdocument will use the term M&V, which is an abbreviation for measurement and verification, for referring all activitiesused to determine or establish energy savings in DSM programs driven by utilities.
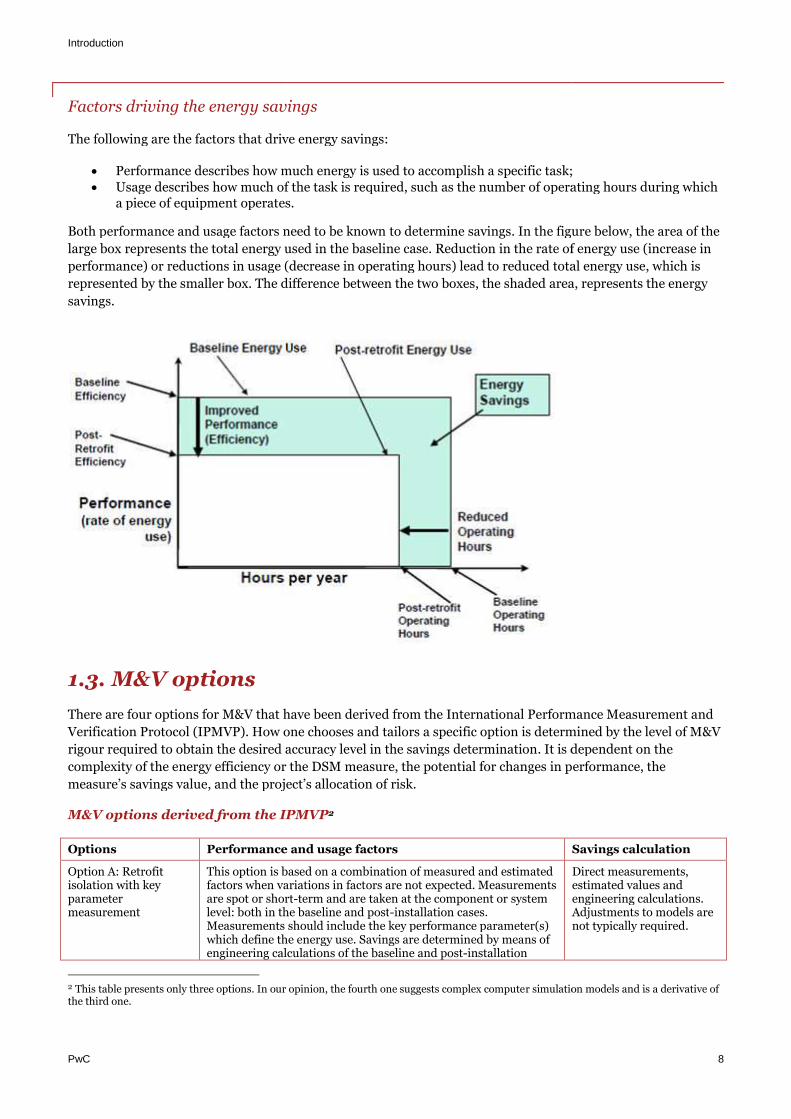
Introduction
PwC
Factors driving the energy savings
The following are the factors that drive energy savings:
Performance describes how much energy is used to accomplish a specific task; Usage describes how much of the task is required, such as the number of operating hours during which
a piece of equipment operates.
Both performance and usage factors need to be known to determine
large box represents the total energy used in the baseline case. Reduction in the rate of energy use (increase in
performance) or reductions in usage (decrease in operating hours) lead to reduced total energy use, which is
represented by the smaller box. The difference
savings.
1.3. M&V options
There are four options for M&V that have been derived
Verification Protocol (IPMVP). How one chooses and tailors a specific option is determined by the level of M&V
rigour required to obtain the desired accuracy level in the savings determination
complexity of the energy efficiency or the
measure’s savings value, and the project’s allocation of risk.
M&V options derived from the IPMVP
Options Performance and usage factors
Option A: Retrofitisolation with keyparametermeasurement
This option is based on a combination of measured and estimatedfactors when variations in factors are not expected. Measurementsare spot or shortlevel: both in the baseline and postMeasurements should include the key performance parameter(s)which define the energy use. Savings are determined by means ofengineering calculations of
2 This table presents only three options. In our opinion, the fourth one suggests complex computethe third one.
avings
The following are the factors that drive energy savings:
Performance describes how much energy is used to accomplish a specific task;sage describes how much of the task is required, such as the number of operating hours during which
a piece of equipment operates.
Both performance and usage factors need to be known to determine savings. In the figure below,
resents the total energy used in the baseline case. Reduction in the rate of energy use (increase in
performance) or reductions in usage (decrease in operating hours) lead to reduced total energy use, which is
represented by the smaller box. The difference between the two boxes, the shaded area
that have been derived from the International Performance Measurement and
Verification Protocol (IPMVP). How one chooses and tailors a specific option is determined by the level of M&V
r required to obtain the desired accuracy level in the savings determination. It is depe
or the DSM measure, the potential for changes in performance, the
measure’s savings value, and the project’s allocation of risk.
IPMVP2
Performance and usage factors Savings calculation
This option is based on a combination of measured and estimatedfactors when variations in factors are not expected. Measurementsare spot or short-term and are taken at the component or system
both in the baseline and post-installation cases.Measurements should include the key performance parameter(s)which define the energy use. Savings are determined by means ofengineering calculations of the baseline and post-installation
Direct measurementsestimated valuesengineering calculations.Adjustments to models arenot typically required.
This table presents only three options. In our opinion, the fourth one suggests complex computer simulation models and is
8
Performance describes how much energy is used to accomplish a specific task;sage describes how much of the task is required, such as the number of operating hours during which
In the figure below, the area of the
resents the total energy used in the baseline case. Reduction in the rate of energy use (increase in
performance) or reductions in usage (decrease in operating hours) lead to reduced total energy use, which is
the shaded area, represents the energy
from the International Performance Measurement and
Verification Protocol (IPMVP). How one chooses and tailors a specific option is determined by the level of M&V
is dependent on the
measure, the potential for changes in performance, the
Savings calculation
Direct measurements,estimated values andengineering calculations.Adjustments to models arenot typically required.
r simulation models and is a derivative of
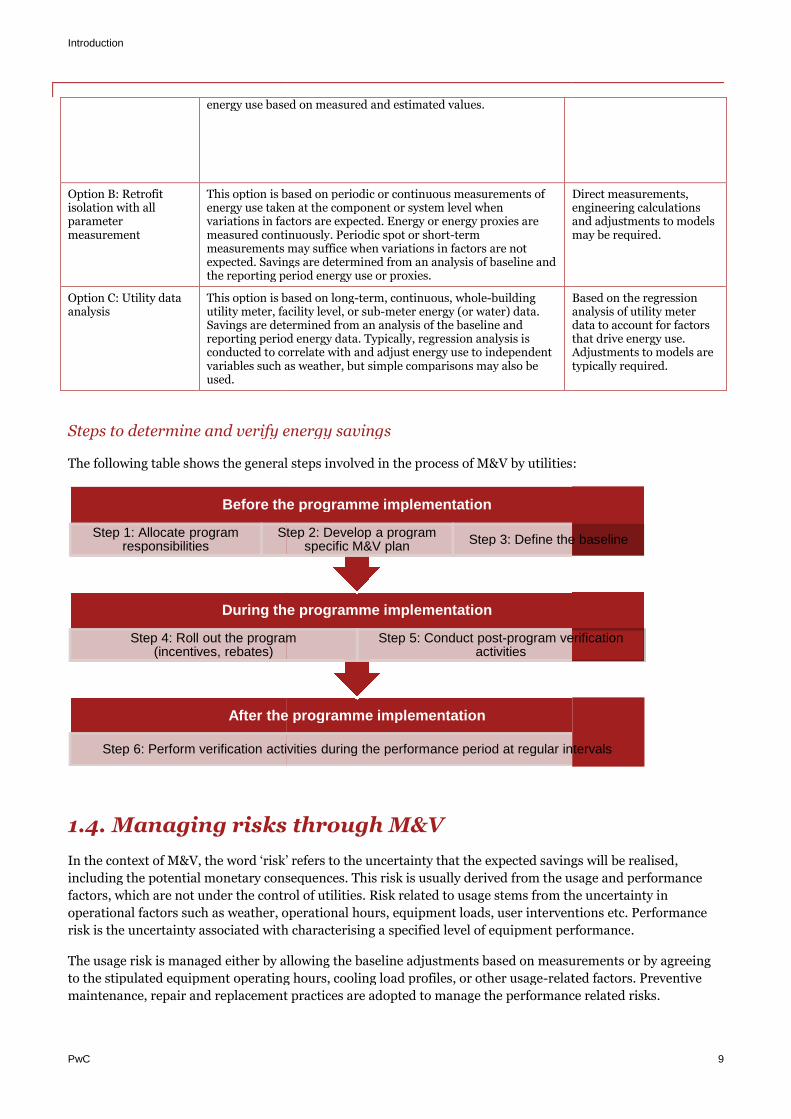
Introduction
PwC
energy use based on measured and estimated values.
Option B: Retrofitisolation with allparametermeasurement
This option is based on periodic or continuous measurements ofenergy use taken at the component or system level whenvariations in factors are expected. Energy ormeasured continuously. Periodic spot or shortmeasurements mexpected. Savings are determined fromthe reporting period energy use or proxies
Option C: Utility dataanalysis
This option is based on longutility meter, facility level, or subSavings are determined fromreporting period energy data. Typically,conducted to correlate with and adjust energy use to independentvariables such as weather, but simple comparisons may also beused.
Steps to determine and verify energy savings
The following table shows the general steps involved in the process of M&V by utilities
1.4. Managing risks through M&V
In the context of M&V, the word ‘risk’
including the potential monetary consequences.
factors, which are not under the control of utilities.
operational factors such as weather, operational hours, equipment loads, user interventions etc.
risk is the uncertainty associated with
The usage risk is managed either by allowing
to the stipulated equipment operating hours, cooling load profiles, or other usage
maintenance, repair and replacement practices are adopted
After the programme implementation
Step 6: Perform verification activities during the performance period at regular intervals
During the programme implementation
Step 4: Roll out the program(incentives, rebates)
Before the programme implementation
Step 1: Allocate programresponsibilities
Step 2: Develop a program
energy use based on measured and estimated values.
This option is based on periodic or continuous measurements ofenergy use taken at the component or system level whenvariations in factors are expected. Energy or energy proxies aremeasured continuously. Periodic spot or short-termmeasurements may suffice when variations in factors are notexpected. Savings are determined from an analysis of baseline and
reporting period energy use or proxies.
Direct measurements,engineering calculationsandmay be required.
This option is based on long-term, continuous, whole-buildingutility meter, facility level, or sub-meter energy (or water) data.Savings are determined from an analysis of the baseline andreporting period energy data. Typically, regression analysis isconducted to correlate with and adjust energy use to independentvariables such as weather, but simple comparisons may also be
Based onanalysis of utility meterdata to account for factorsthat drive energy useAdjustments to models aretypically required.
verify energy savings
The following table shows the general steps involved in the process of M&V by utilities
Managing risks through M&V
’ refers to the uncertainty that the expected savings will be
including the potential monetary consequences. This risk is usually derived from the usage and performance
factors, which are not under the control of utilities. Risk related to usage stems from the
such as weather, operational hours, equipment loads, user interventions etc.
risk is the uncertainty associated with characterising a specified level of equipment performance
allowing the baseline adjustments based on measurements or by agreeing
stipulated equipment operating hours, cooling load profiles, or other usage-related factors
replacement practices are adopted to manage the performance related risks.
After the programme implementation
Step 6: Perform verification activities during the performance period at regular intervals
During the programme implementation
Step 4: Roll out the program Step 5: Conduct post-program verificationactivities
Before the programme implementation
Step 2: Develop a programspecific M&V plan Step 3: Define the baseline
9
Direct measurements,engineering calculationsand adjustments to modelsmay be required.
Based on the regressionanalysis of utility meterdata to account for factorsthat drive energy use.Adjustments to models aretypically required.
The following table shows the general steps involved in the process of M&V by utilities:
expected savings will be realised,
This risk is usually derived from the usage and performance
the uncertainty in
such as weather, operational hours, equipment loads, user interventions etc. Performance
a specified level of equipment performance.
baseline adjustments based on measurements or by agreeing
related factors. Preventive
performance related risks.
Step 6: Perform verification activities during the performance period at regular intervals
program verification
Step 3: Define the baseline
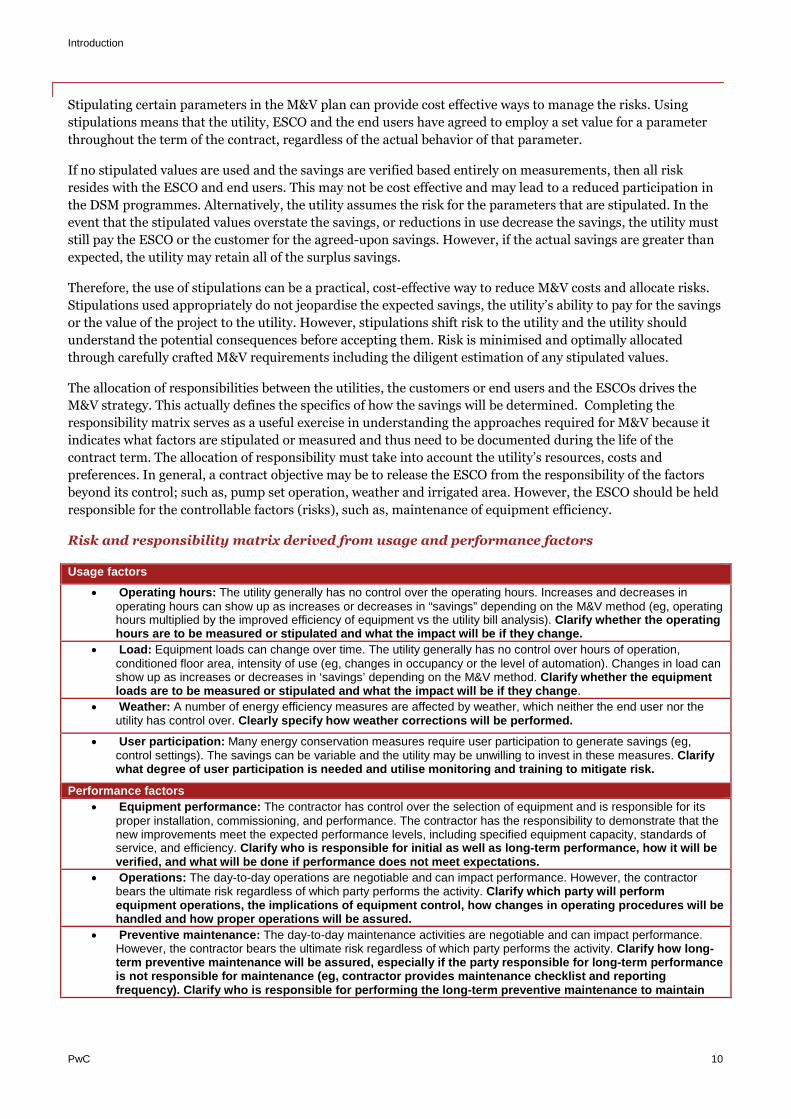
Introduction
PwC 10
Stipulating certain parameters in the M&V plan can provide cost effective ways to manage the risks. Using
stipulations means that the utility, ESCO and the end users have agreed to employ a set value for a parameter
throughout the term of the contract, regardless of the actual behavior of that parameter.
If no stipulated values are used and the savings are verified based entirely on measurements, then all risk
resides with the ESCO and end users. This may not be cost effective and may lead to a reduced participation in
the DSM programmes. Alternatively, the utility assumes the risk for the parameters that are stipulated. In the
event that the stipulated values overstate the savings, or reductions in use decrease the savings, the utility must
still pay the ESCO or the customer for the agreed-upon savings. However, if the actual savings are greater than
expected, the utility may retain all of the surplus savings.
Therefore, the use of stipulations can be a practical, cost-effective way to reduce M&V costs and allocate risks.
Stipulations used appropriately do not jeopardise the expected savings, the utility’s ability to pay for the savings
or the value of the project to the utility. However, stipulations shift risk to the utility and the utility should
understand the potential consequences before accepting them. Risk is minimised and optimally allocated
through carefully crafted M&V requirements including the diligent estimation of any stipulated values.
The allocation of responsibilities between the utilities, the customers or end users and the ESCOs drives the
M&V strategy. This actually defines the specifics of how the savings will be determined. Completing the
responsibility matrix serves as a useful exercise in understanding the approaches required for M&V because it
indicates what factors are stipulated or measured and thus need to be documented during the life of the
contract term. The allocation of responsibility must take into account the utility’s resources, costs and
preferences. In general, a contract objective may be to release the ESCO from the responsibility of the factors
beyond its control; such as, pump set operation, weather and irrigated area. However, the ESCO should be held
responsible for the controllable factors (risks), such as, maintenance of equipment efficiency.
Risk and responsibility matrix derived from usage and performance factors
Usage factors
Operating hours: The utility generally has no control over the operating hours. Increases and decreases inoperating hours can show up as increases or decreases in “savings” depending on the M&V method (eg, operatinghours multiplied by the improved efficiency of equipment vs the utility bill analysis). Clarify whether the operatinghours are to be measured or stipulated and what the impact will be if they change.
Load: Equipment loads can change over time. The utility generally has no control over hours of operation,conditioned floor area, intensity of use (eg, changes in occupancy or the level of automation). Changes in load canshow up as increases or decreases in ‘savings’ depending on the M&V method. Clarify whether the equipmentloads are to be measured or stipulated and what the impact will be if they change.
Weather: A number of energy efficiency measures are affected by weather, which neither the end user nor theutility has control over. Clearly specify how weather corrections will be performed.
User participation: Many energy conservation measures require user participation to generate savings (eg,control settings). The savings can be variable and the utility may be unwilling to invest in these measures. Clarifywhat degree of user participation is needed and utilise monitoring and training to mitigate risk.
Performance factors Equipment performance: The contractor has control over the selection of equipment and is responsible for its
proper installation, commissioning, and performance. The contractor has the responsibility to demonstrate that thenew improvements meet the expected performance levels, including specified equipment capacity, standards ofservice, and efficiency. Clarify who is responsible for initial as well as long-term performance, how it will beverified, and what will be done if performance does not meet expectations.
Operations: The day-to-day operations are negotiable and can impact performance. However, the contractorbears the ultimate risk regardless of which party performs the activity. Clarify which party will performequipment operations, the implications of equipment control, how changes in operating procedures will behandled and how proper operations will be assured.
Preventive maintenance: The day-to-day maintenance activities are negotiable and can impact performance.However, the contractor bears the ultimate risk regardless of which party performs the activity. Clarify how long-term preventive maintenance will be assured, especially if the party responsible for long-term performanceis not responsible for maintenance (eg, contractor provides maintenance checklist and reportingfrequency). Clarify who is responsible for performing the long-term preventive maintenance to maintain
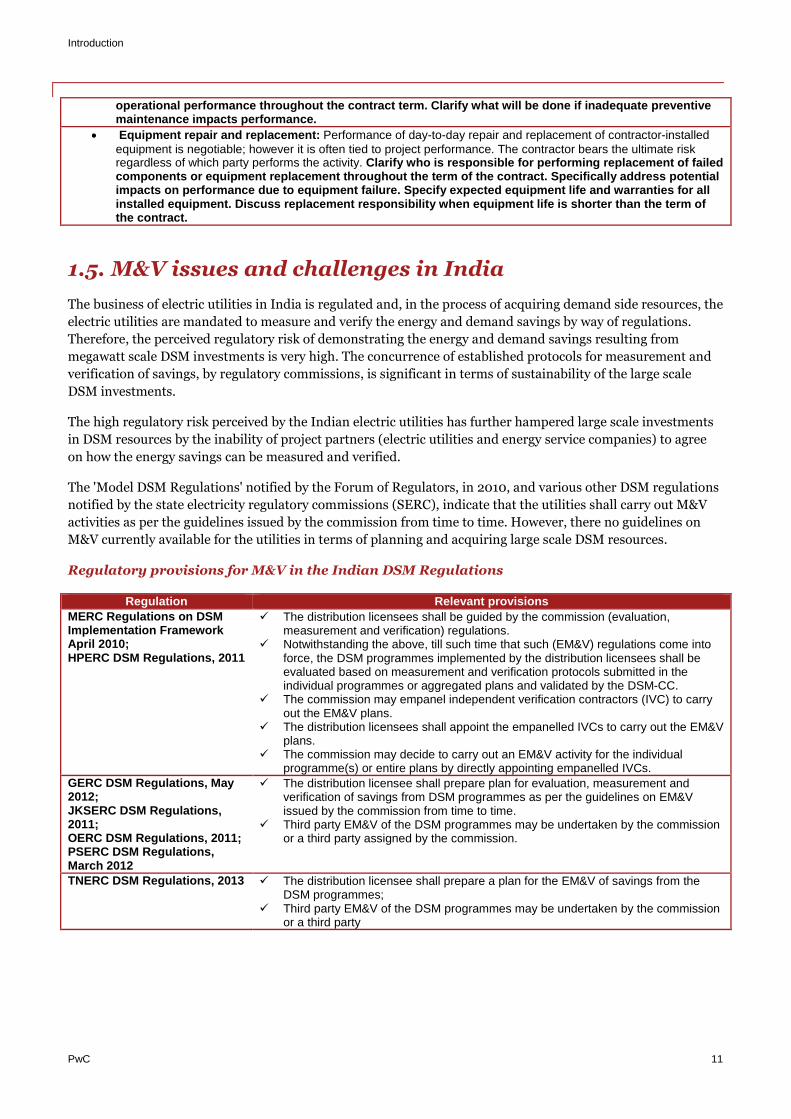
Introduction
PwC 11
operational performance throughout the contract term. Clarify what will be done if inadequate preventivemaintenance impacts performance.
Equipment repair and replacement: Performance of day-to-day repair and replacement of contractor-installedequipment is negotiable; however it is often tied to project performance. The contractor bears the ultimate riskregardless of which party performs the activity. Clarify who is responsible for performing replacement of failedcomponents or equipment replacement throughout the term of the contract. Specifically address potentialimpacts on performance due to equipment failure. Specify expected equipment life and warranties for allinstalled equipment. Discuss replacement responsibility when equipment life is shorter than the term ofthe contract.
1.5. M&V issues and challenges in India
The business of electric utilities in India is regulated and, in the process of acquiring demand side resources, the
electric utilities are mandated to measure and verify the energy and demand savings by way of regulations.
Therefore, the perceived regulatory risk of demonstrating the energy and demand savings resulting from
megawatt scale DSM investments is very high. The concurrence of established protocols for measurement and
verification of savings, by regulatory commissions, is significant in terms of sustainability of the large scale
DSM investments.
The high regulatory risk perceived by the Indian electric utilities has further hampered large scale investments
in DSM resources by the inability of project partners (electric utilities and energy service companies) to agree
on how the energy savings can be measured and verified.
The 'Model DSM Regulations' notified by the Forum of Regulators, in 2010, and various other DSM regulations
notified by the state electricity regulatory commissions (SERC), indicate that the utilities shall carry out M&V
activities as per the guidelines issued by the commission from time to time. However, there no guidelines on
M&V currently available for the utilities in terms of planning and acquiring large scale DSM resources.
Regulatory provisions for M&V in the Indian DSM Regulations
Regulation Relevant provisionsMERC Regulations on DSMImplementation FrameworkApril 2010;HPERC DSM Regulations, 2011
The distribution licensees shall be guided by the commission (evaluation,measurement and verification) regulations.
Notwithstanding the above, till such time that such (EM&V) regulations come intoforce, the DSM programmes implemented by the distribution licensees shall beevaluated based on measurement and verification protocols submitted in theindividual programmes or aggregated plans and validated by the DSM-CC.
The commission may empanel independent verification contractors (IVC) to carryout the EM&V plans.
The distribution licensees shall appoint the empanelled IVCs to carry out the EM&Vplans.
The commission may decide to carry out an EM&V activity for the individualprogramme(s) or entire plans by directly appointing empanelled IVCs.
GERC DSM Regulations, May2012;JKSERC DSM Regulations,2011;OERC DSM Regulations, 2011;PSERC DSM Regulations,March 2012
The distribution licensee shall prepare plan for evaluation, measurement andverification of savings from DSM programmes as per the guidelines on EM&Vissued by the commission from time to time.
Third party EM&V of the DSM programmes may be undertaken by the commissionor a third party assigned by the commission.
TNERC DSM Regulations, 2013 The distribution licensee shall prepare a plan for the EM&V of savings from theDSM programmes;
Third party EM&V of the DSM programmes may be undertaken by the commissionor a third party
Introduction
PwC 12
It is clear from the review of the various DSM regulations that the SERCsin India have committed to provide guidelines for the M&V activities ofutilities while planning for the DSM programmes. However, the absence ofsuch M&V guidelines in the current scenario can be construed as one of
major barriers for up-scaling utility driven DSM investments in India.
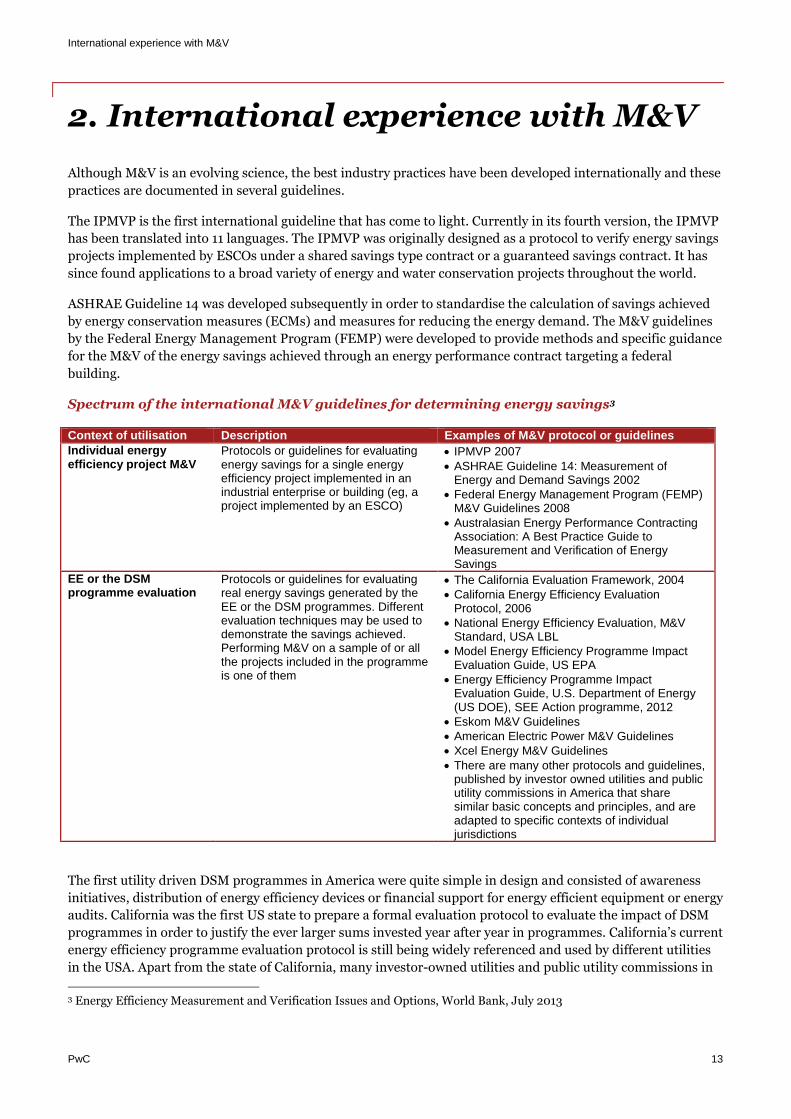
International experience with M&V
PwC 13
2. International experience with M&V
Although M&V is an evolving science, the best industry practices have been developed internationally and these
practices are documented in several guidelines.
The IPMVP is the first international guideline that has come to light. Currently in its fourth version, the IPMVP
has been translated into 11 languages. The IPMVP was originally designed as a protocol to verify energy savings
projects implemented by ESCOs under a shared savings type contract or a guaranteed savings contract. It has
since found applications to a broad variety of energy and water conservation projects throughout the world.
ASHRAE Guideline 14 was developed subsequently in order to standardise the calculation of savings achieved
by energy conservation measures (ECMs) and measures for reducing the energy demand. The M&V guidelines
by the Federal Energy Management Program (FEMP) were developed to provide methods and specific guidance
for the M&V of the energy savings achieved through an energy performance contract targeting a federal
building.
Spectrum of the international M&V guidelines for determining energy savings3
Context of utilisation Description Examples of M&V protocol or guidelinesIndividual energyefficiency project M&V
Protocols or guidelines for evaluatingenergy savings for a single energyefficiency project implemented in anindustrial enterprise or building (eg, aproject implemented by an ESCO)
IPMVP 2007 ASHRAE Guideline 14: Measurement of
Energy and Demand Savings 2002 Federal Energy Management Program (FEMP)
M&V Guidelines 2008 Australasian Energy Performance Contracting
Association: A Best Practice Guide toMeasurement and Verification of EnergySavings
EE or the DSMprogramme evaluation
Protocols or guidelines for evaluatingreal energy savings generated by theEE or the DSM programmes. Differentevaluation techniques may be used todemonstrate the savings achieved.Performing M&V on a sample of or allthe projects included in the programmeis one of them
The California Evaluation Framework, 2004 California Energy Efficiency Evaluation
Protocol, 2006 National Energy Efficiency Evaluation, M&V
Standard, USA LBL Model Energy Efficiency Programme Impact
Evaluation Guide, US EPA Energy Efficiency Programme Impact
Evaluation Guide, U.S. Department of Energy(US DOE), SEE Action programme, 2012
Eskom M&V Guidelines American Electric Power M&V Guidelines Xcel Energy M&V Guidelines There are many other protocols and guidelines,
published by investor owned utilities and publicutility commissions in America that sharesimilar basic concepts and principles, and areadapted to specific contexts of individualjurisdictions
The first utility driven DSM programmes in America were quite simple in design and consisted of awareness
initiatives, distribution of energy efficiency devices or financial support for energy efficient equipment or energy
audits. California was the first US state to prepare a formal evaluation protocol to evaluate the impact of DSM
programmes in order to justify the ever larger sums invested year after year in programmes. California’s current
energy efficiency programme evaluation protocol is still being widely referenced and used by different utilities
in the USA. Apart from the state of California, many investor-owned utilities and public utility commissions in
3 Energy Efficiency Measurement and Verification Issues and Options, World Bank, July 2013
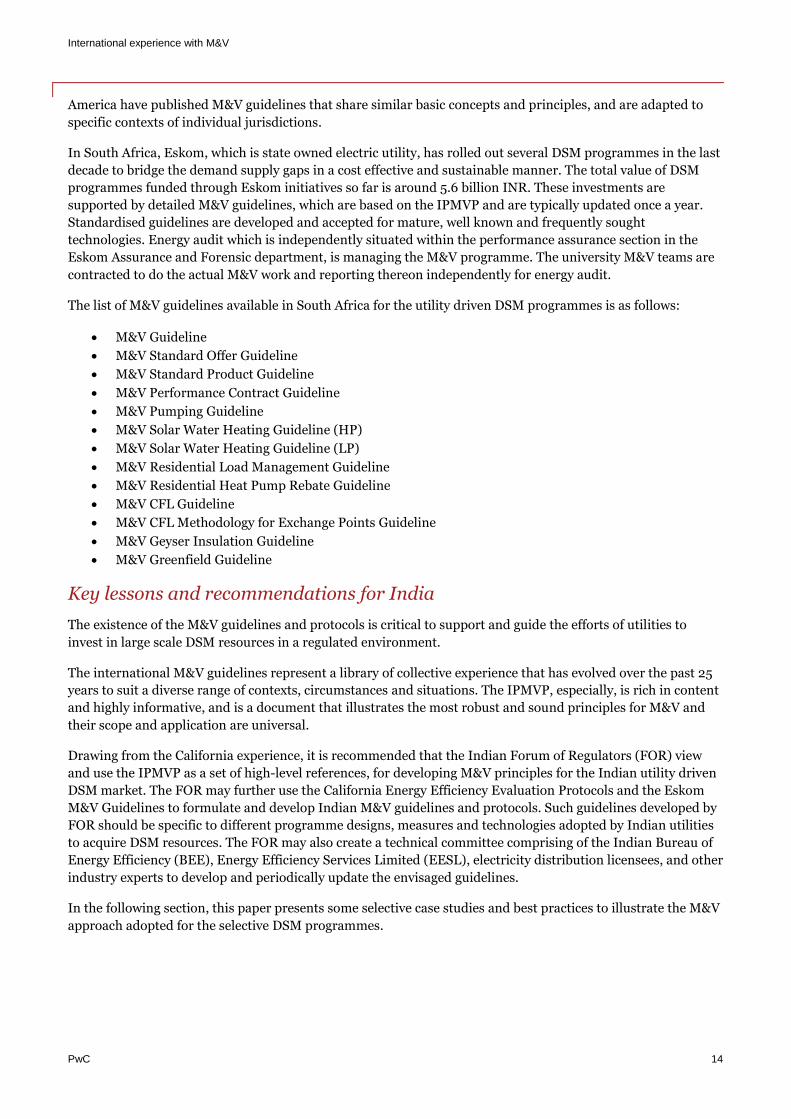
International experience with M&V
PwC 14
America have published M&V guidelines that share similar basic concepts and principles, and are adapted to
specific contexts of individual jurisdictions.
In South Africa, Eskom, which is state owned electric utility, has rolled out several DSM programmes in the last
decade to bridge the demand supply gaps in a cost effective and sustainable manner. The total value of DSM
programmes funded through Eskom initiatives so far is around 5.6 billion INR. These investments are
supported by detailed M&V guidelines, which are based on the IPMVP and are typically updated once a year.
Standardised guidelines are developed and accepted for mature, well known and frequently sought
technologies. Energy audit which is independently situated within the performance assurance section in the
Eskom Assurance and Forensic department, is managing the M&V programme. The university M&V teams are
contracted to do the actual M&V work and reporting thereon independently for energy audit.
The list of M&V guidelines available in South Africa for the utility driven DSM programmes is as follows:
M&V Guideline
M&V Standard Offer Guideline
M&V Standard Product Guideline
M&V Performance Contract Guideline
M&V Pumping Guideline
M&V Solar Water Heating Guideline (HP)
M&V Solar Water Heating Guideline (LP)
M&V Residential Load Management Guideline
M&V Residential Heat Pump Rebate Guideline
M&V CFL Guideline
M&V CFL Methodology for Exchange Points Guideline
M&V Geyser Insulation Guideline
M&V Greenfield Guideline
Key lessons and recommendations for India
The existence of the M&V guidelines and protocols is critical to support and guide the efforts of utilities to
invest in large scale DSM resources in a regulated environment.
The international M&V guidelines represent a library of collective experience that has evolved over the past 25
years to suit a diverse range of contexts, circumstances and situations. The IPMVP, especially, is rich in content
and highly informative, and is a document that illustrates the most robust and sound principles for M&V and
their scope and application are universal.
Drawing from the California experience, it is recommended that the Indian Forum of Regulators (FOR) view
and use the IPMVP as a set of high-level references, for developing M&V principles for the Indian utility driven
DSM market. The FOR may further use the California Energy Efficiency Evaluation Protocols and the Eskom
M&V Guidelines to formulate and develop Indian M&V guidelines and protocols. Such guidelines developed by
FOR should be specific to different programme designs, measures and technologies adopted by Indian utilities
to acquire DSM resources. The FOR may also create a technical committee comprising of the Indian Bureau of
Energy Efficiency (BEE), Energy Efficiency Services Limited (EESL), electricity distribution licensees, and other
industry experts to develop and periodically update the envisaged guidelines.
In the following section, this paper presents some selective case studies and best practices to illustrate the M&V
approach adopted for the selective DSM programmes.
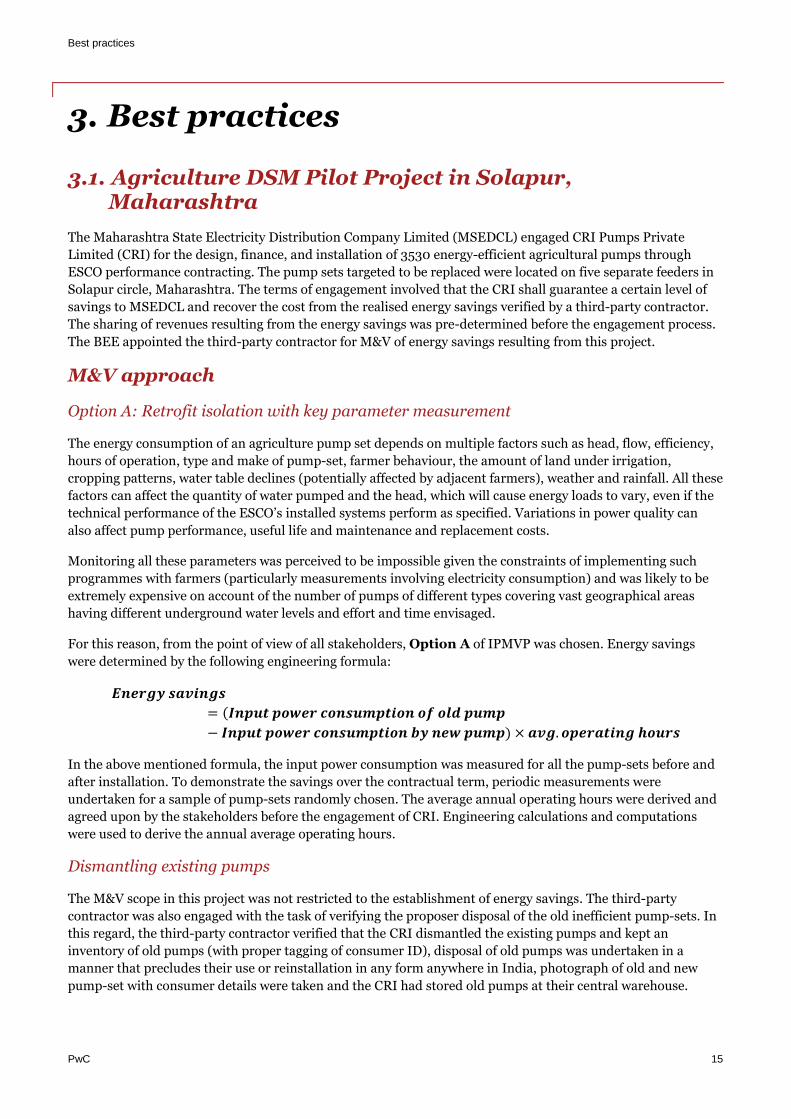
Best practices
PwC 15
3. Best practices
3.1. Agriculture DSM Pilot Project in Solapur,Maharashtra
The Maharashtra State Electricity Distribution Company Limited (MSEDCL) engaged CRI Pumps Private
Limited (CRI) for the design, finance, and installation of 3530 energy-efficient agricultural pumps through
ESCO performance contracting. The pump sets targeted to be replaced were located on five separate feeders in
Solapur circle, Maharashtra. The terms of engagement involved that the CRI shall guarantee a certain level of
savings to MSEDCL and recover the cost from the realised energy savings verified by a third-party contractor.
The sharing of revenues resulting from the energy savings was pre-determined before the engagement process.
The BEE appointed the third-party contractor for M&V of energy savings resulting from this project.
M&V approach
Option A: Retrofit isolation with key parameter measurement
The energy consumption of an agriculture pump set depends on multiple factors such as head, flow, efficiency,
hours of operation, type and make of pump-set, farmer behaviour, the amount of land under irrigation,
cropping patterns, water table declines (potentially affected by adjacent farmers), weather and rainfall. All these
factors can affect the quantity of water pumped and the head, which will cause energy loads to vary, even if the
technical performance of the ESCO’s installed systems perform as specified. Variations in power quality can
also affect pump performance, useful life and maintenance and replacement costs.
Monitoring all these parameters was perceived to be impossible given the constraints of implementing such
programmes with farmers (particularly measurements involving electricity consumption) and was likely to be
extremely expensive on account of the number of pumps of different types covering vast geographical areas
having different underground water levels and effort and time envisaged.
For this reason, from the point of view of all stakeholders, Option A of IPMVP was chosen. Energy savings
were determined by the following engineering formula:
���
= ��) ���
− �� ��� ( × �.
In the above mentioned formula, the input power consumption was measured for all the pump-sets before and
after installation. To demonstrate the savings over the contractual term, periodic measurements were
undertaken for a sample of pump-sets randomly chosen. The average annual operating hours were derived and
agreed upon by the stakeholders before the engagement of CRI. Engineering calculations and computations
were used to derive the annual average operating hours.
Dismantling existing pumps
The M&V scope in this project was not restricted to the establishment of energy savings. The third-party
contractor was also engaged with the task of verifying the proposer disposal of the old inefficient pump-sets. In
this regard, the third-party contractor verified that the CRI dismantled the existing pumps and kept an
inventory of old pumps (with proper tagging of consumer ID), disposal of old pumps was undertaken in a
manner that precludes their use or reinstallation in any form anywhere in India, photograph of old and new
pump-set with consumer details were taken and the CRI had stored old pumps at their central warehouse.
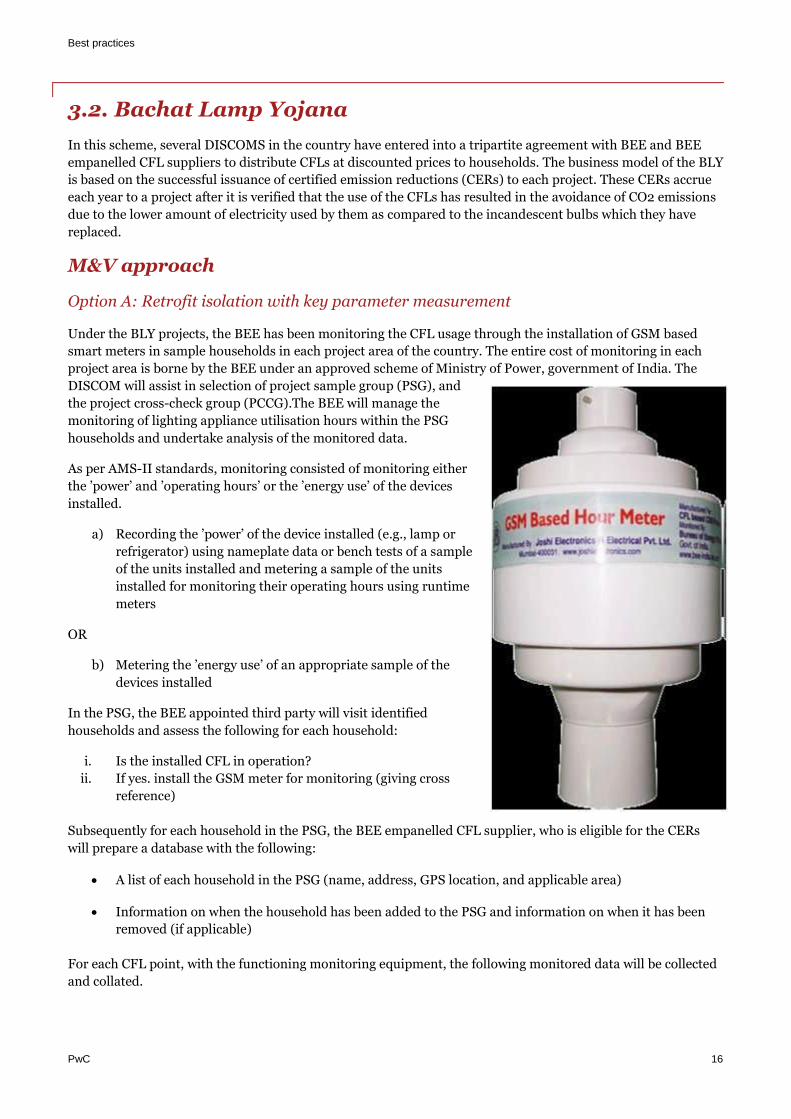
Best practices
PwC 16
3.2. Bachat Lamp Yojana
In this scheme, several DISCOMS in the country have entered into a tripartite agreement with BEE and BEE
empanelled CFL suppliers to distribute CFLs at discounted prices to households. The business model of the BLY
is based on the successful issuance of certified emission reductions (CERs) to each project. These CERs accrue
each year to a project after it is verified that the use of the CFLs has resulted in the avoidance of CO2 emissions
due to the lower amount of electricity used by them as compared to the incandescent bulbs which they have
replaced.
M&V approach
Option A: Retrofit isolation with key parameter measurement
Under the BLY projects, the BEE has been monitoring the CFL usage through the installation of GSM based
smart meters in sample households in each project area of the country. The entire cost of monitoring in each
project area is borne by the BEE under an approved scheme of Ministry of Power, government of India. The
DISCOM will assist in selection of project sample group (PSG), and
the project cross-check group (PCCG).The BEE will manage the
monitoring of lighting appliance utilisation hours within the PSG
households and undertake analysis of the monitored data.
As per AMS-II standards, monitoring consisted of monitoring either
the ’power’ and ’operating hours’ or the ’energy use’ of the devices
installed.
a) Recording the ’power’ of the device installed (e.g., lamp or
refrigerator) using nameplate data or bench tests of a sample
of the units installed and metering a sample of the units
installed for monitoring their operating hours using runtime
meters
OR
b) Metering the ’energy use’ of an appropriate sample of the
devices installed
In the PSG, the BEE appointed third party will visit identified
households and assess the following for each household:
i. Is the installed CFL in operation?
ii. If yes. install the GSM meter for monitoring (giving cross
reference)
Subsequently for each household in the PSG, the BEE empanelled CFL supplier, who is eligible for the CERs
will prepare a database with the following:
A list of each household in the PSG (name, address, GPS location, and applicable area)
Information on when the household has been added to the PSG and information on when it has been
removed (if applicable)
For each CFL point, with the functioning monitoring equipment, the following monitored data will be collected
and collated.
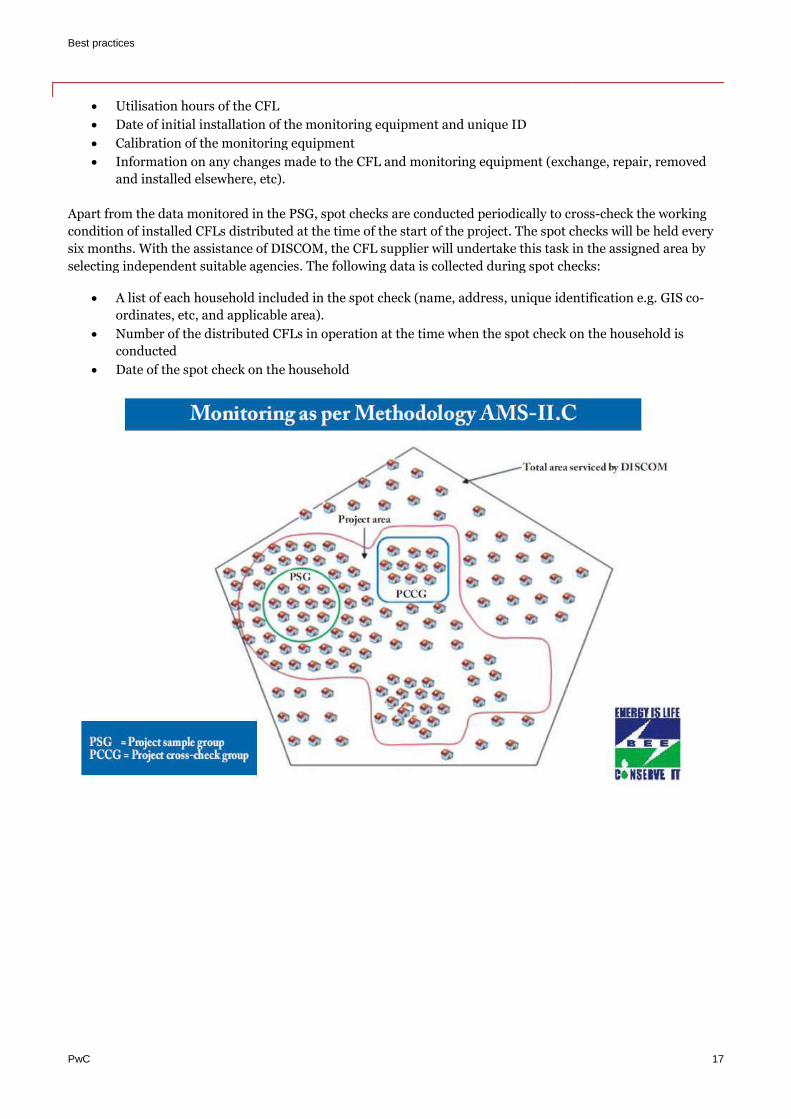
Best practices
PwC
Utilisation hours of the CFL
Date of initial installation of the
Calibration of the monitoring
Information on any changes made to
and installed elsewhere, etc).
Apart from the data monitored in the PSG, s
condition of installed CFLs distributed at the time
six months. With the assistance of DISCOM,
selecting independent suitable agencies.
A list of each household included in the
ordinates, etc, and applicable area).
Number of the distributed CFLs in operation
conducted
Date of the spot check on the household
installation of the monitoring equipment and unique ID
onitoring equipment
Information on any changes made to the CFL and monitoring equipment (exchange, repair, removed
he PSG, spot checks are conducted periodically to cross
condition of installed CFLs distributed at the time of the start of the project. The spot checks will be
With the assistance of DISCOM, the CFL supplier will undertake this task in the
selecting independent suitable agencies. The following data is collected during spot checks:
A list of each household included in the spot check (name, address, unique identification
etc, and applicable area).
Number of the distributed CFLs in operation at the time when the spot check on the
Date of the spot check on the household
17
(exchange, repair, removed
to cross-check the working
The spot checks will be held every
ndertake this task in the assigned area by
The following data is collected during spot checks:
heck (name, address, unique identification e.g. GIS co-
at the time when the spot check on the household is
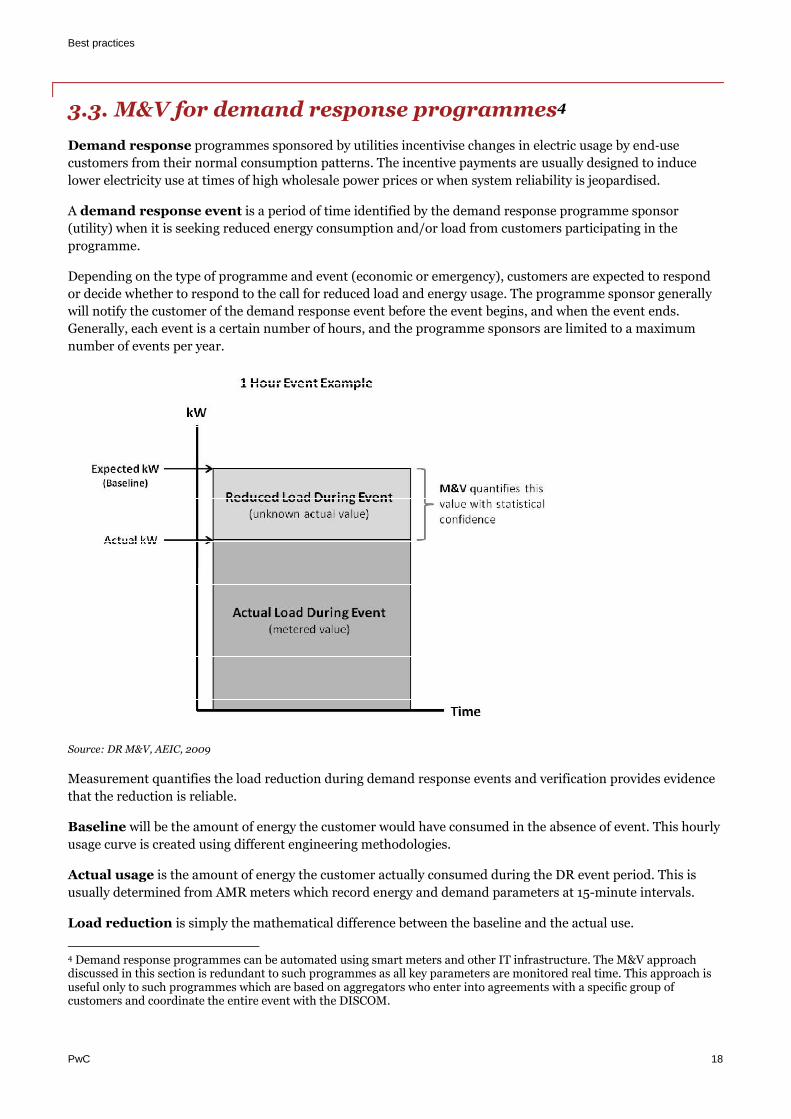
Best practices
PwC 18
3.3. M&V for demand response programmes4
Demand response programmes sponsored by utilities incentivise changes in electric usage by end‐use
customers from their normal consumption patterns. The incentive payments are usually designed to induce
lower electricity use at times of high wholesale power prices or when system reliability is jeopardised.
A demand response event is a period of time identified by the demand response programme sponsor
(utility) when it is seeking reduced energy consumption and/or load from customers participating in the
programme.
Depending on the type of programme and event (economic or emergency), customers are expected to respond
or decide whether to respond to the call for reduced load and energy usage. The programme sponsor generally
will notify the customer of the demand response event before the event begins, and when the event ends.
Generally, each event is a certain number of hours, and the programme sponsors are limited to a maximum
number of events per year.
Source: DR M&V, AEIC, 2009
Measurement quantifies the load reduction during demand response events and verification provides evidence
that the reduction is reliable.
Baseline will be the amount of energy the customer would have consumed in the absence of event. This hourly
usage curve is created using different engineering methodologies.
Actual usage is the amount of energy the customer actually consumed during the DR event period. This is
usually determined from AMR meters which record energy and demand parameters at 15-minute intervals.
Load reduction is simply the mathematical difference between the baseline and the actual use.
4 Demand response programmes can be automated using smart meters and other IT infrastructure. The M&V approachdiscussed in this section is redundant to such programmes as all key parameters are monitored real time. This approach isuseful only to such programmes which are based on aggregators who enter into agreements with a specific group ofcustomers and coordinate the entire event with the DISCOM.
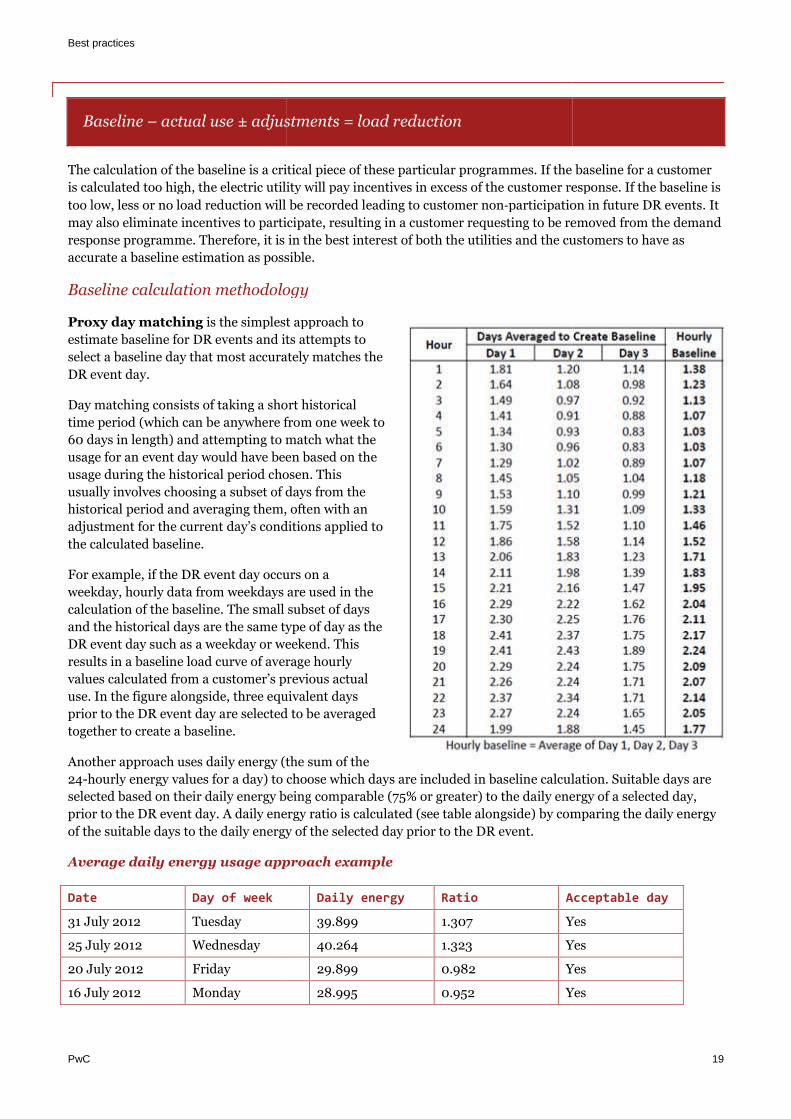
Best practices
PwC
Baseline – actual use ± adjustments =
The calculation of the baseline is a critical piece of these particular program
is calculated too high, the electric utility will pay incentives in excess of the
too low, less or no load reduction will be recorded lead
may also eliminate incentives to partici
response programme. Therefore, it is
accurate a baseline estimation as possible.
Baseline calculation methodology
Proxy day matching is the simplest approach to
estimate baseline for DR events and its
select a baseline day that most accurately matches the
DR event day.
Day matching consists of taking a short historical
time period (which can be anywhere from one week to
60 days in length) and attempting to match what the
usage for an event day would have been based
usage during the historical period chosen. This
usually involves choosing a subset of days from
historical period and averaging them, often with an
adjustment for the current day’s conditions
the calculated baseline.
For example, if the DR event day occurs on a
weekday, hourly data from weekdays are used in the
calculation of the baseline. The small subset of days
and the historical days are the same type of day
DR event day such as a weekday or weekend. This
results in a baseline load curve of average
values calculated from a customer’s previous actual
use. In the figure alongside, three equivalent
prior to the DR event day are selected to be averaged
together to create a baseline.
Another approach uses daily energy (the sum of the
24-hourly energy values for a day) to choose which days
selected based on their daily energy being
prior to the DR event day. A daily energy ratio is calculated
of the suitable days to the daily energy of
Average daily energy usage approach
Date Day of week
31 July 2012 Tuesday
25 July 2012 Wednesday
20 July 2012 Friday
16 July 2012 Monday
adjustments = load reduction
The calculation of the baseline is a critical piece of these particular programmes. If the baseline for a customer
high, the electric utility will pay incentives in excess of the customer response. If the baseline is
too low, less or no load reduction will be recorded leading to customer non‐participation in future DR events. It
may also eliminate incentives to participate, resulting in a customer requesting to be removed from the
in the best interest of both the utilities and the customers to have as
possible.
Baseline calculation methodology
is the simplest approach to
estimate baseline for DR events and its attempts to
select a baseline day that most accurately matches the
Day matching consists of taking a short historical
from one week to
days in length) and attempting to match what the
usage for an event day would have been based on the
usage during the historical period chosen. This
usually involves choosing a subset of days from the
m, often with an
adjustment for the current day’s conditions applied to
For example, if the DR event day occurs on a
from weekdays are used in the
The small subset of days
historical days are the same type of day as the
DR event day such as a weekday or weekend. This
in a baseline load curve of average hourly
values calculated from a customer’s previous actual
, three equivalent days
to the DR event day are selected to be averaged
daily energy (the sum of the
hourly energy values for a day) to choose which days are included in baseline calculation. Suitable days are
d on their daily energy being comparable (75% or greater) to the daily energy of a selected day,
daily energy ratio is calculated (see table alongside) by comparing the daily energy
of the suitable days to the daily energy of the selected day prior to the DR event.
pproach example
Daily energy Ratio Acceptable day
39.899 1.307 Yes
40.264 1.323 Yes
29.899 0.982 Yes
28.995 0.952 Yes
19
the baseline for a customer
customer response. If the baseline is
participation in future DR events. It
resulting in a customer requesting to be removed from the demand
in the best interest of both the utilities and the customers to have as
are included in baseline calculation. Suitable days are
comparable (75% or greater) to the daily energy of a selected day,
by comparing the daily energy
Acceptable day
Yes
Yes
Yes
Yes

Best practices
PwC 20
Baseline adjustment
An adjustment to the calculated baseline might be needed to factor in the weather effects on a customer’s load
on the DR event day. This adjustment consists of determining the difference between the calculated baseline
and the actual customer load during the DR event hours. The adjustment value is mathematically determined
and applied to the calculated baseline during the hours of the deployment period of the DR event.
References
PwC 21
4. References
1. http://mnv.lbl.gov/
2. M&V Guidelines: Measurement and Verification for Federal Energy Projects, Version 3, Office of EERE,
U.S. Department of Energy, Federal Energy Management Programme, 2008
3. A Best Practice Guide to Measurement and Verification of Energy Savings, The Australasian Energy
Performance Contracting Association, 2004
4. Energy Efficiency Measurement and Verification Issues and Options: An Overview of International
Measurement and Verification Experience; World Bank 2013
5. http://www.eskom.co.za/IDM/MeasurementVerification/Pages/Measurement_Verification.aspx
6. http://www.beeindia.in/
7. Demand Response Measurement and Verification, AEIC Load Research Committee, 2009
References
Disclaimer
This document is for general information purposes only, and should not be used as a substitute for
consultation with professional advisors. No representation or warranty (express or implied) is given as to the
accuracy or completeness of the information contained in this primer, and, to the extent permitted by law,
PricewaterhouseCoopers Private Ltd, its members, employees and agents do not accept or assume any
liability, responsibility or duty of care for any consequences of you or anyone else acting, or refraining to act,
in reliance on the information contained in this primer or for any decision based on it.
22

This report is solely for the use and benefit of Shakti Sustainable Energy Foundation and should not be relied upon by any other part. Utility CEO Forum on Demand Side Management - Annual Report 2013 PwC
I. Proceedings: Fourth Meeting

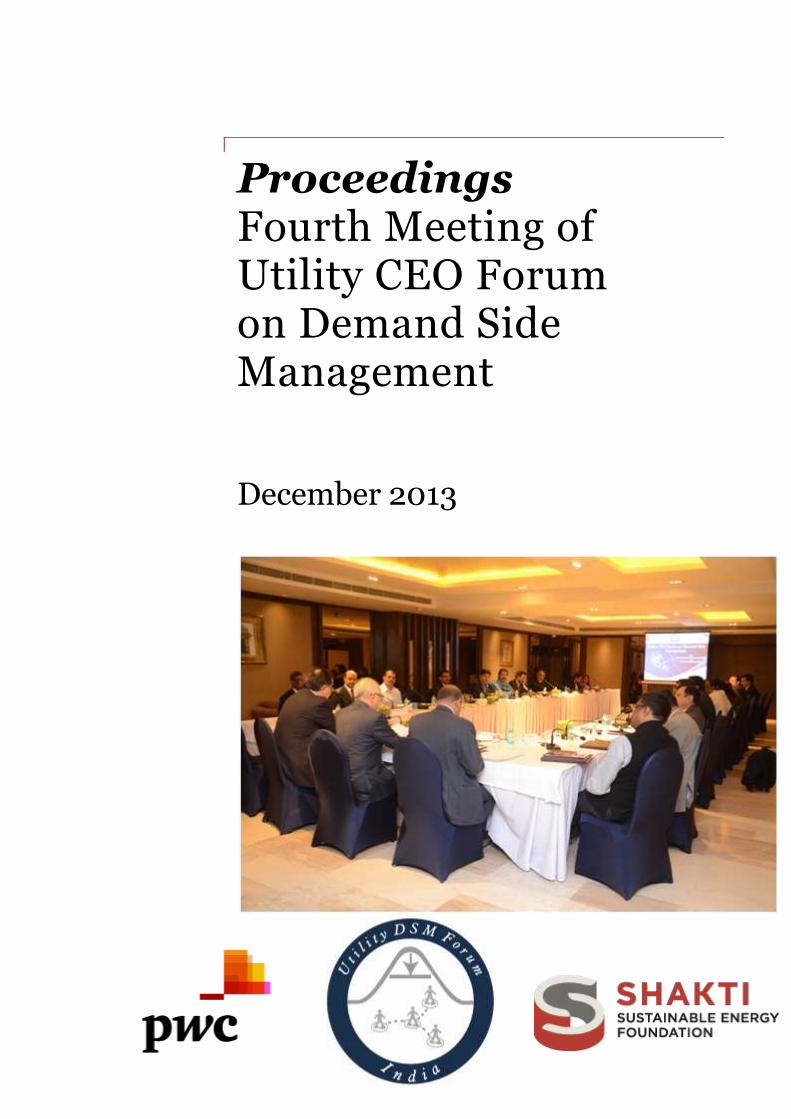
Proceedings Fourth Meeting of Utility CEO Forum on Demand Side Management
December 2013

Table of Contents Proceedings
Table of contents
2. Inaugural session 6
2.1. Welcome note 6
2.2. Setting the context 6
3. Thematic presentation and round table discussion 7
3.1. Key points of discussion 7
4. Industry speak on DSM 11
4.1. BSES Yamuna Power Limited: DSM initiatives and experience 11
4.2. Energy Efficiency Services Limited: ESCO-based investment models for DSM projects 11
4.3. Customised Energy Solutions: Demand response programmes 12
4.4. Alliance for Energy Efficient Economy: M&V ecosystem in India 13
5. Concluding session 14
Proceedings
1. Introduction
The fourth meeting of Utility CEO Forum on demand side management (DSM) was held on 13 December, 2013,
in New Delhi, to discuss issues and challenges in the Measurement and Verification (M&V) of utility-driven
DSM programmes. The meeting was chaired by Anil Razdan, Former Secretary, Ministry of Power, and was
attended by 24 other participants representing various state electricity distribution companies, electricity
regulatory commissions, central nodal agencies and other stakeholders.
Participant profile
Chairperson
and Forum secretariat
List of participants
Chairperson: Anil Razdan, IAS (retired), Former Secretary, Ministry of Power
Forum secretariat
1. Krishan Dhawan, CEO,
Shakti Sustainable Energy
Foundation
2. Chinmaya Acharya, Chief of
Programmes, Shakti
Sustainable Energy
Foundation
3. Natasha Bhan, Senior
Programme Associate
(Electric Utilities), Shakti
Sustainable Energy
Foundation
4. Vrinda Sarda, Programme
Assistant, (Electric Utilities),
Shakti Sustainable Energy
Foundation
5. Amit Kumar, Executive
Director, (Energy &
Utilities), PwC India
6. Kulbhushan Kumar, Senior
Manager, (Energy &
Utilities), PwC India
7. Shuboday Ganta, Senior
Consultant, (Energy &
Utilities), PwC India
1. Umesh N Panjiar, Chairman, Bihar Electricity
Regulatory Commission
2. M R Karmakar, Chairman, Tripura Electricity
Regulatory Commission
3. Dr Ajay Mathur, Director General, Bureau of Energy
Efficiency
4. M Sivasankar, IAS, Chairman, Kerala State
Electricity Board
5. IM Bhavsar, Chairman, Gujarat Energy
Development Agency
6. Saurabh Kumar, Managing Director, Energy
Efficiency Services Limited
7. Ashwani Kumar, IAS, Principal Secretary,
Maharashtra Electricity Regulatory Commission
8. Arvind Gujral, CEO, BSES Yamuna Power Limited
9. Jayanta Chatterjee, Additional General Manager,
Tata Power Delhi Distribution Limited
10. Rajeev Amit, Director, Joint Electricity Regulatory
Commission
11. Anish Garg, Director, Joint Electricity Regulatory
Commission
12. Pramod Deo, Additional Vice President, Reliance
Infrastructure Limited
13. Anant Sant, Deputy Director, Maharashtra
Electricity Regulatory Commission
14. Dr Rahul Walawalkar, Vice President, Customised
Energy Solutions
15. Parag Kulkarni, Senior Energy Consultant,
Customised Energy Solutions
16. Koshy Cherail, President, Alliance for Energy
Efficient Economy
17. Ramesh Bhatia, Advisor, Alliance for Energy
Efficient Economy
18. Ashok M Shah, System Engineer DSM Cell, UGVCL
19. Kamlesh N Parikh, System Engineer, MGVCL
20. V Ramakrishna, ex-member, CEA
21. H M Sujatha, Executive Engineer, CESCOM,
Karnataka
22. Mridula Saripalli, Programme Associate, Alliance
for Energy Efficient Economy
23. Aseem Goyal, Greentree Building (P) Ltd

Proceedings
24. Pravatanalini Samal, Asst. Energy Economist,
Bureau of Energy Efficiency
25. Ashish Sharma, Assistant Manager (Tech), Energy
Efficiency Services Limited
26. Neelima Jain, Programme Coordinator, Energy
Efficiency Services Limited
This document highlights some of the key points of discussion held amongst the participants and also presents
the opinions, perceptions and suggestions that emerged from the thematic discussion and presentations.
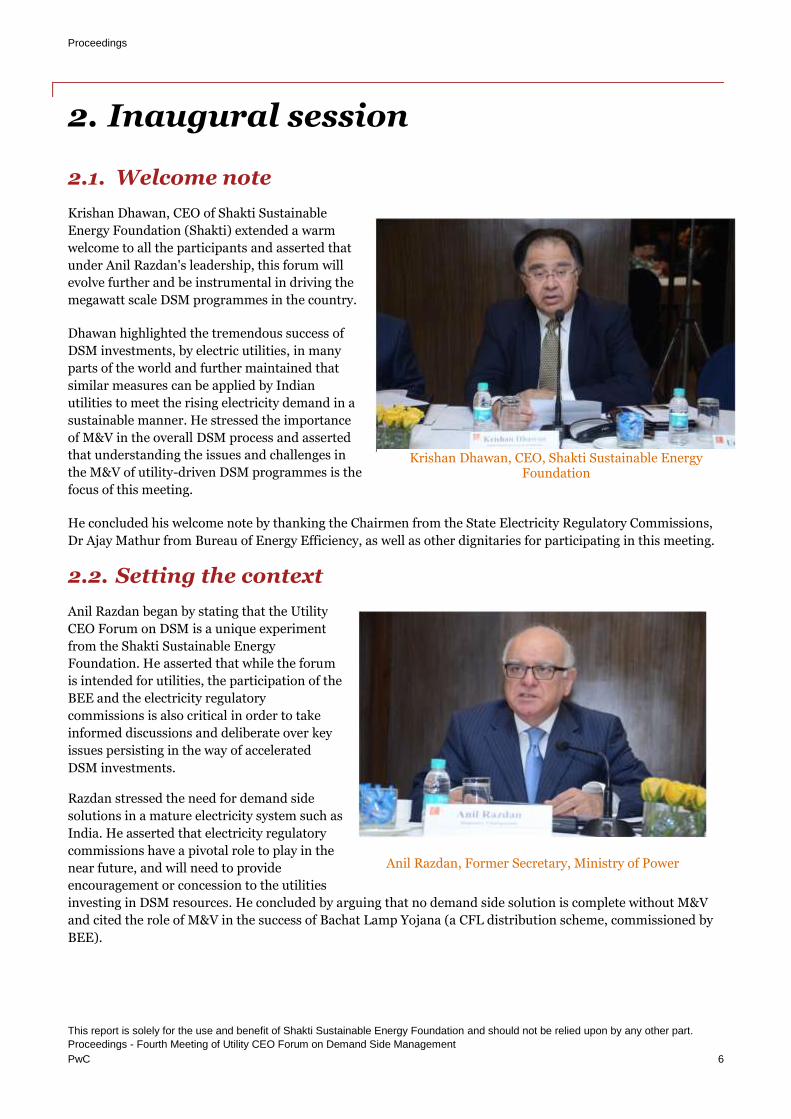
Proceedings
This report is solely for the use and benefit of Shakti Sustainable Energy Foundation and should not be relied upon by any other part. Proceedings - Fourth Meeting of Utility CEO Forum on Demand Side Management PwC 6
2. Inaugural session
2.1. Welcome note
Krishan Dhawan, CEO of Shakti Sustainable
Energy Foundation (Shakti) extended a warm
welcome to all the participants and asserted that
under Anil Razdan's leadership, this forum will
evolve further and be instrumental in driving the
megawatt scale DSM programmes in the country.
Dhawan highlighted the tremendous success of
DSM investments, by electric utilities, in many
parts of the world and further maintained that
similar measures can be applied by Indian
utilities to meet the rising electricity demand in a
sustainable manner. He stressed the importance
of M&V in the overall DSM process and asserted
that understanding the issues and challenges in
the M&V of utility-driven DSM programmes is the
focus of this meeting.
He concluded his welcome note by thanking the Chairmen from the State Electricity Regulatory Commissions,
Dr Ajay Mathur from Bureau of Energy Efficiency, as well as other dignitaries for participating in this meeting.
2.2. Setting the context
Anil Razdan began by stating that the Utility
CEO Forum on DSM is a unique experiment
from the Shakti Sustainable Energy
Foundation. He asserted that while the forum
is intended for utilities, the participation of the
BEE and the electricity regulatory
commissions is also critical in order to take
informed discussions and deliberate over key
issues persisting in the way of accelerated
DSM investments.
Razdan stressed the need for demand side
solutions in a mature electricity system such as
India. He asserted that electricity regulatory
commissions have a pivotal role to play in the
near future, and will need to provide
encouragement or concession to the utilities
investing in DSM resources. He concluded by arguing that no demand side solution is complete without M&V
and cited the role of M&V in the success of Bachat Lamp Yojana (a CFL distribution scheme, commissioned by
BEE).
Krishan Dhawan, CEO, Shakti Sustainable Energy Foundation
Anil Razdan, Former Secretary, Ministry of Power
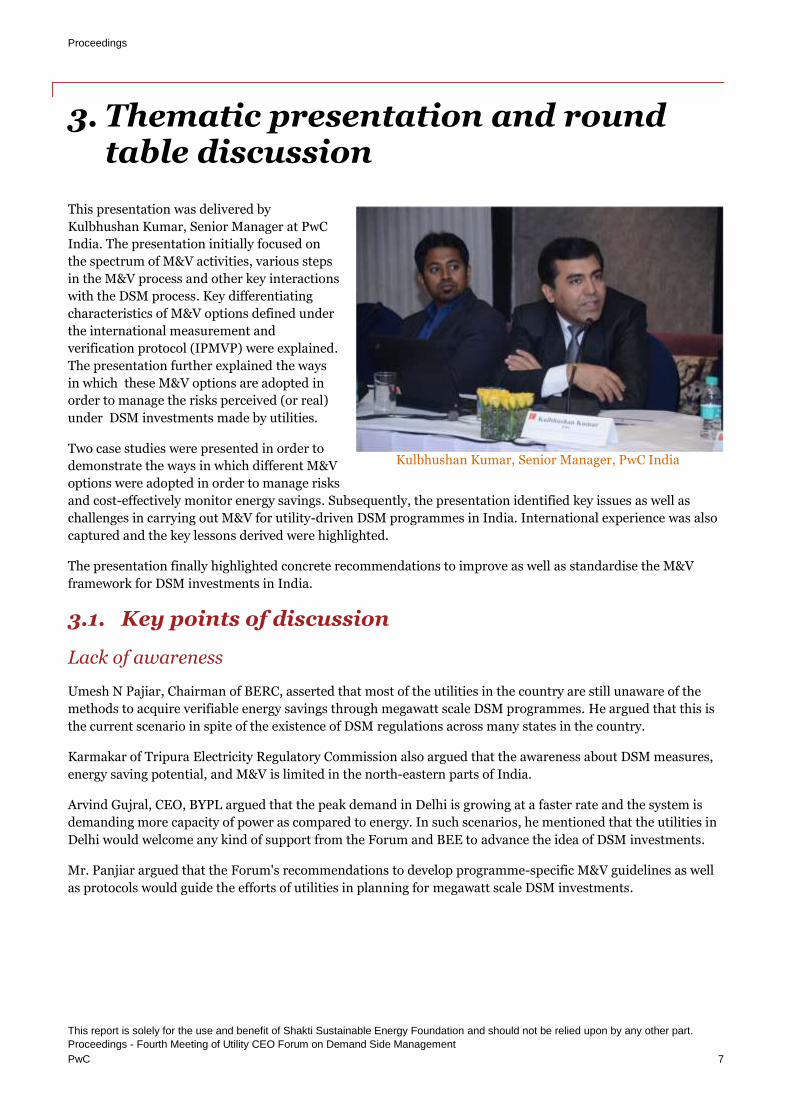
Proceedings
This report is solely for the use and benefit of Shakti Sustainable Energy Foundation and should not be relied upon by any other part. Proceedings - Fourth Meeting of Utility CEO Forum on Demand Side Management PwC 7
3. Thematic presentation and round table discussion
This presentation was delivered by
Kulbhushan Kumar, Senior Manager at PwC
India. The presentation initially focused on
the spectrum of M&V activities, various steps
in the M&V process and other key interactions
with the DSM process. Key differentiating
characteristics of M&V options defined under
the international measurement and
verification protocol (IPMVP) were explained.
The presentation further explained the ways
in which these M&V options are adopted in
order to manage the risks perceived (or real)
under DSM investments made by utilities.
Two case studies were presented in order to
demonstrate the ways in which different M&V
options were adopted in order to manage risks
and cost-effectively monitor energy savings. Subsequently, the presentation identified key issues as well as
challenges in carrying out M&V for utility-driven DSM programmes in India. International experience was also
captured and the key lessons derived were highlighted.
The presentation finally highlighted concrete recommendations to improve as well as standardise the M&V
framework for DSM investments in India.
3.1. Key points of discussion
Lack of awareness
Umesh N Pajiar, Chairman of BERC, asserted that most of the utilities in the country are still unaware of the
methods to acquire verifiable energy savings through megawatt scale DSM programmes. He argued that this is
the current scenario in spite of the existence of DSM regulations across many states in the country.
Karmakar of Tripura Electricity Regulatory Commission also argued that the awareness about DSM measures,
energy saving potential, and M&V is limited in the north-eastern parts of India.
Arvind Gujral, CEO, BYPL argued that the peak demand in Delhi is growing at a faster rate and the system is
demanding more capacity of power as compared to energy. In such scenarios, he mentioned that the utilities in
Delhi would welcome any kind of support from the Forum and BEE to advance the idea of DSM investments.
Mr. Panjiar argued that the Forum's recommendations to develop programme-specific M&V guidelines as well
as protocols would guide the efforts of utilities in planning for megawatt scale DSM investments.
Kulbhushan Kumar, Senior Manager, PwC India
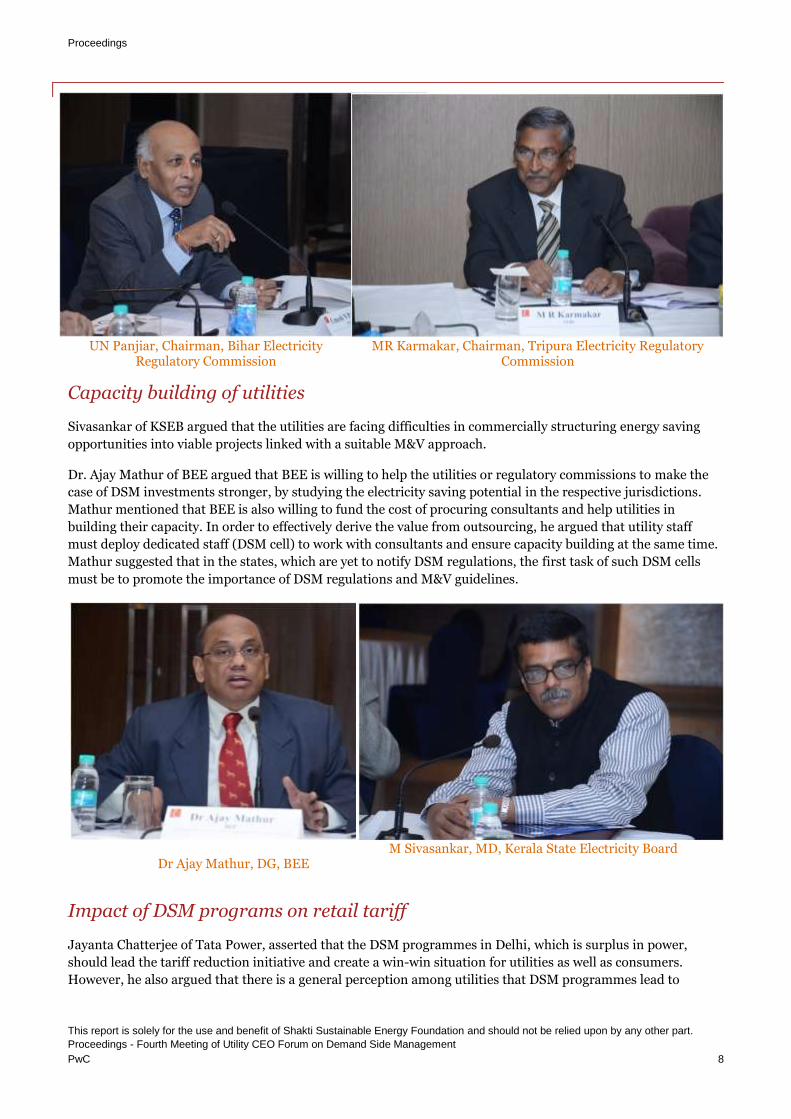
Proceedings
This report is solely for the use and benefit of Shakti Sustainable Energy Foundation and should not be relied upon by any other part. Proceedings - Fourth Meeting of Utility CEO Forum on Demand Side Management PwC 8
Capacity building of utilities
Sivasankar of KSEB argued that the utilities are facing difficulties in commercially structuring energy saving
opportunities into viable projects linked with a suitable M&V approach.
Dr. Ajay Mathur of BEE argued that BEE is willing to help the utilities or regulatory commissions to make the
case of DSM investments stronger, by studying the electricity saving potential in the respective jurisdictions.
Mathur mentioned that BEE is also willing to fund the cost of procuring consultants and help utilities in
building their capacity. In order to effectively derive the value from outsourcing, he argued that utility staff
must deploy dedicated staff (DSM cell) to work with consultants and ensure capacity building at the same time.
Mathur suggested that in the states, which are yet to notify DSM regulations, the first task of such DSM cells
must be to promote the importance of DSM regulations and M&V guidelines.
Impact of DSM programs on retail tariff
Jayanta Chatterjee of Tata Power, asserted that the DSM programmes in Delhi, which is surplus in power,
should lead the tariff reduction initiative and create a win-win situation for utilities as well as consumers.
However, he also argued that there is a general perception among utilities that DSM programmes lead to
Dr Ajay Mathur, DG, BEE M Sivasankar, MD, Kerala State Electricity Board
MR Karmakar, Chairman, Tripura Electricity Regulatory Commission
UN Panjiar, Chairman, Bihar Electricity Regulatory Commission
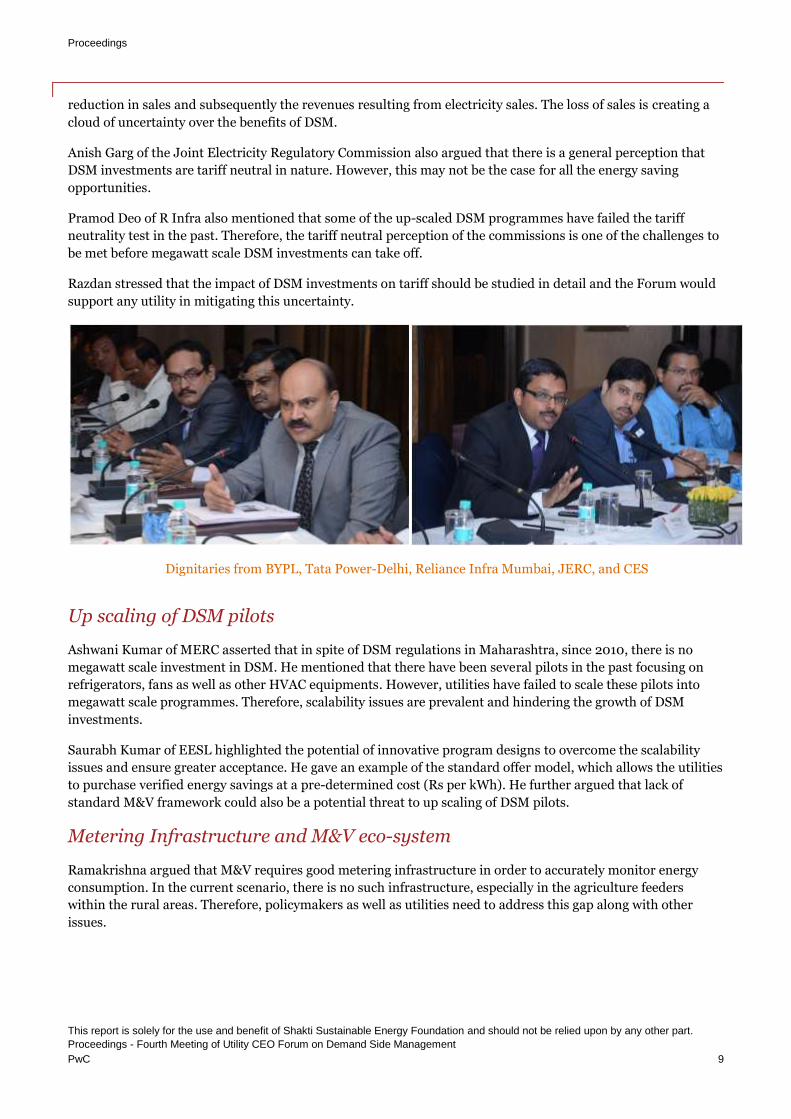
Proceedings
This report is solely for the use and benefit of Shakti Sustainable Energy Foundation and should not be relied upon by any other part. Proceedings - Fourth Meeting of Utility CEO Forum on Demand Side Management PwC 9
reduction in sales and subsequently the revenues resulting from electricity sales. The loss of sales is creating a
cloud of uncertainty over the benefits of DSM.
Anish Garg of the Joint Electricity Regulatory Commission also argued that there is a general perception that
DSM investments are tariff neutral in nature. However, this may not be the case for all the energy saving
opportunities.
Pramod Deo of R Infra also mentioned that some of the up-scaled DSM programmes have failed the tariff
neutrality test in the past. Therefore, the tariff neutral perception of the commissions is one of the challenges to
be met before megawatt scale DSM investments can take off.
Razdan stressed that the impact of DSM investments on tariff should be studied in detail and the Forum would
support any utility in mitigating this uncertainty.
Up scaling of DSM pilots
Ashwani Kumar of MERC asserted that in spite of DSM regulations in Maharashtra, since 2010, there is no
megawatt scale investment in DSM. He mentioned that there have been several pilots in the past focusing on
refrigerators, fans as well as other HVAC equipments. However, utilities have failed to scale these pilots into
megawatt scale programmes. Therefore, scalability issues are prevalent and hindering the growth of DSM
investments.
Saurabh Kumar of EESL highlighted the potential of innovative program designs to overcome the scalability
issues and ensure greater acceptance. He gave an example of the standard offer model, which allows the utilities
to purchase verified energy savings at a pre-determined cost (Rs per kWh). He further argued that lack of
standard M&V framework could also be a potential threat to up scaling of DSM pilots.
Metering Infrastructure and M&V eco-system
Ramakrishna argued that M&V requires good metering infrastructure in order to accurately monitor energy
consumption. In the current scenario, there is no such infrastructure, especially in the agriculture feeders
within the rural areas. Therefore, policymakers as well as utilities need to address this gap along with other
issues.
Dignitaries from BYPL, Tata Power-Delhi, Reliance Infra Mumbai, JERC, and CES
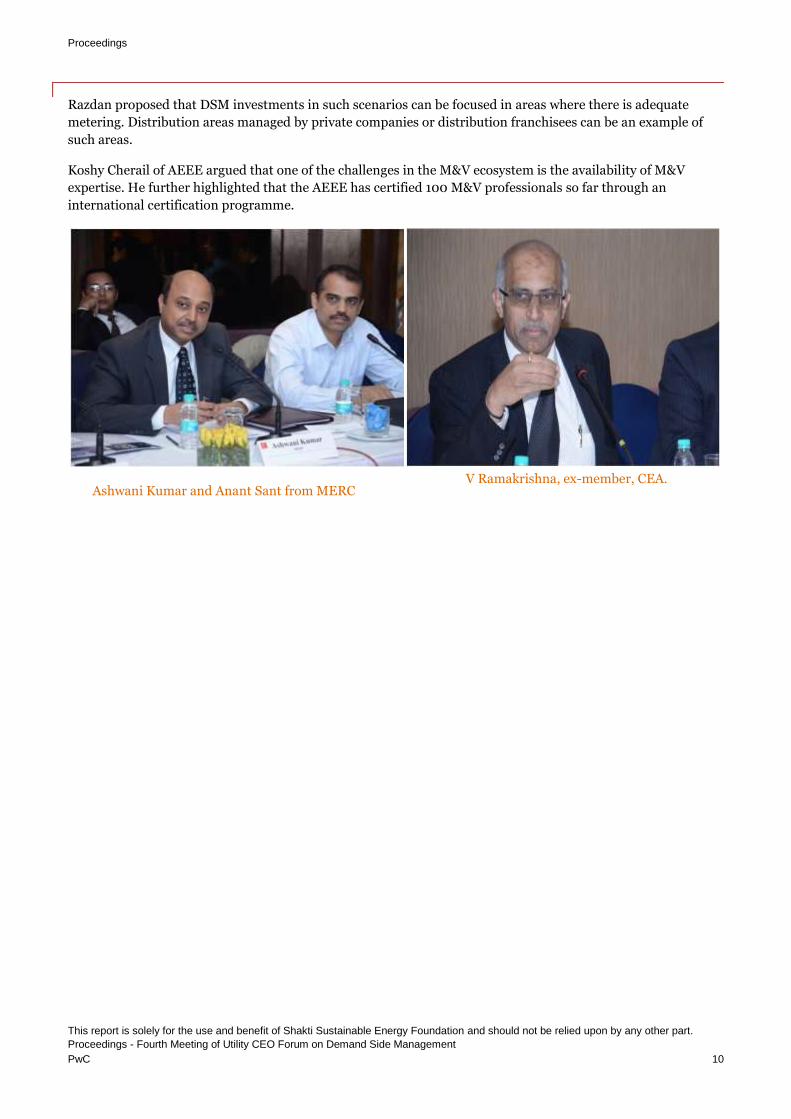
Proceedings
This report is solely for the use and benefit of Shakti Sustainable Energy Foundation and should not be relied upon by any other part. Proceedings - Fourth Meeting of Utility CEO Forum on Demand Side Management PwC 10
Razdan proposed that DSM investments in such scenarios can be focused in areas where there is adequate
metering. Distribution areas managed by private companies or distribution franchisees can be an example of
such areas.
Koshy Cherail of AEEE argued that one of the challenges in the M&V ecosystem is the availability of M&V
expertise. He further highlighted that the AEEE has certified 100 M&V professionals so far through an
international certification programme.
Ashwani Kumar and Anant Sant from MERC V Ramakrishna, ex-member, CEA.
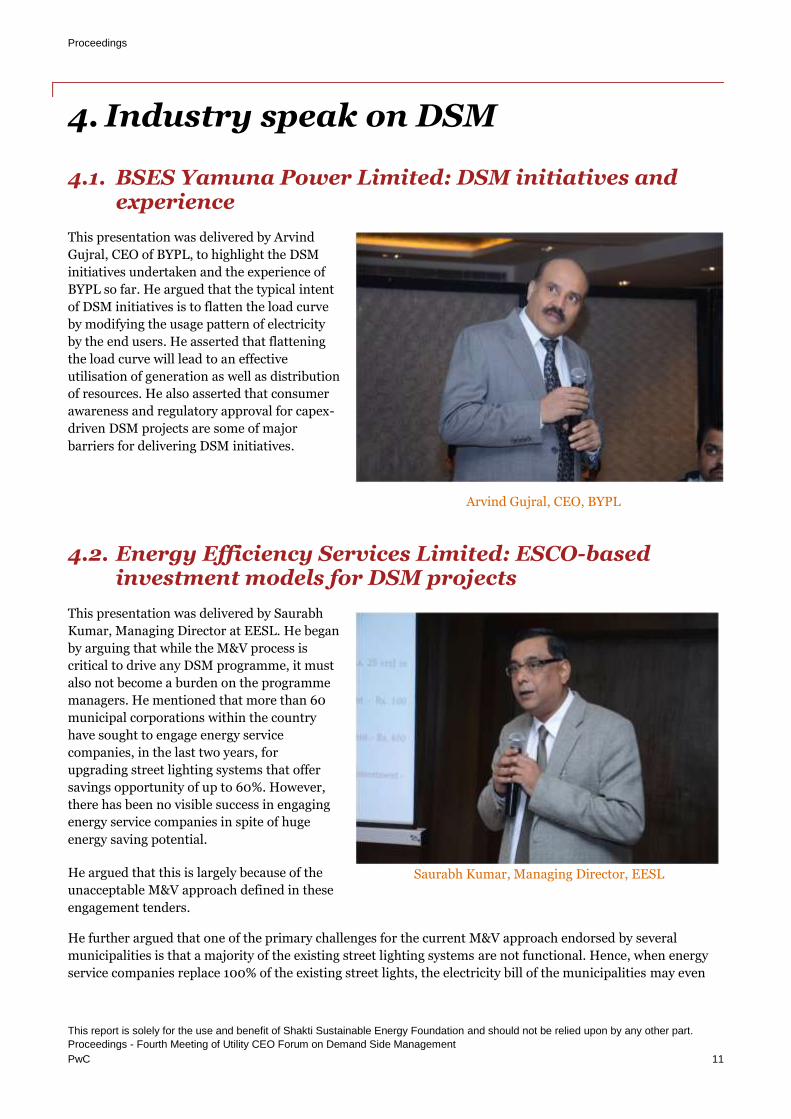
Proceedings
This report is solely for the use and benefit of Shakti Sustainable Energy Foundation and should not be relied upon by any other part. Proceedings - Fourth Meeting of Utility CEO Forum on Demand Side Management PwC 11
4. Industry speak on DSM
4.1. BSES Yamuna Power Limited: DSM initiatives and experience
This presentation was delivered by Arvind
Gujral, CEO of BYPL, to highlight the DSM
initiatives undertaken and the experience of
BYPL so far. He argued that the typical intent
of DSM initiatives is to flatten the load curve
by modifying the usage pattern of electricity
by the end users. He asserted that flattening
the load curve will lead to an effective
utilisation of generation as well as distribution
of resources. He also asserted that consumer
awareness and regulatory approval for capex-
driven DSM projects are some of major
barriers for delivering DSM initiatives.
4.2. Energy Efficiency Services Limited: ESCO-based investment models for DSM projects
This presentation was delivered by Saurabh
Kumar, Managing Director at EESL. He began
by arguing that while the M&V process is
critical to drive any DSM programme, it must
also not become a burden on the programme
managers. He mentioned that more than 60
municipal corporations within the country
have sought to engage energy service
companies, in the last two years, for
upgrading street lighting systems that offer
savings opportunity of up to 60%. However,
there has been no visible success in engaging
energy service companies in spite of huge
energy saving potential.
He argued that this is largely because of the
unacceptable M&V approach defined in these
engagement tenders.
He further argued that one of the primary challenges for the current M&V approach endorsed by several
municipalities is that a majority of the existing street lighting systems are not functional. Hence, when energy
service companies replace 100% of the existing street lights, the electricity bill of the municipalities may even
Saurabh Kumar, Managing Director, EESL
Arvind Gujral, CEO, BYPL
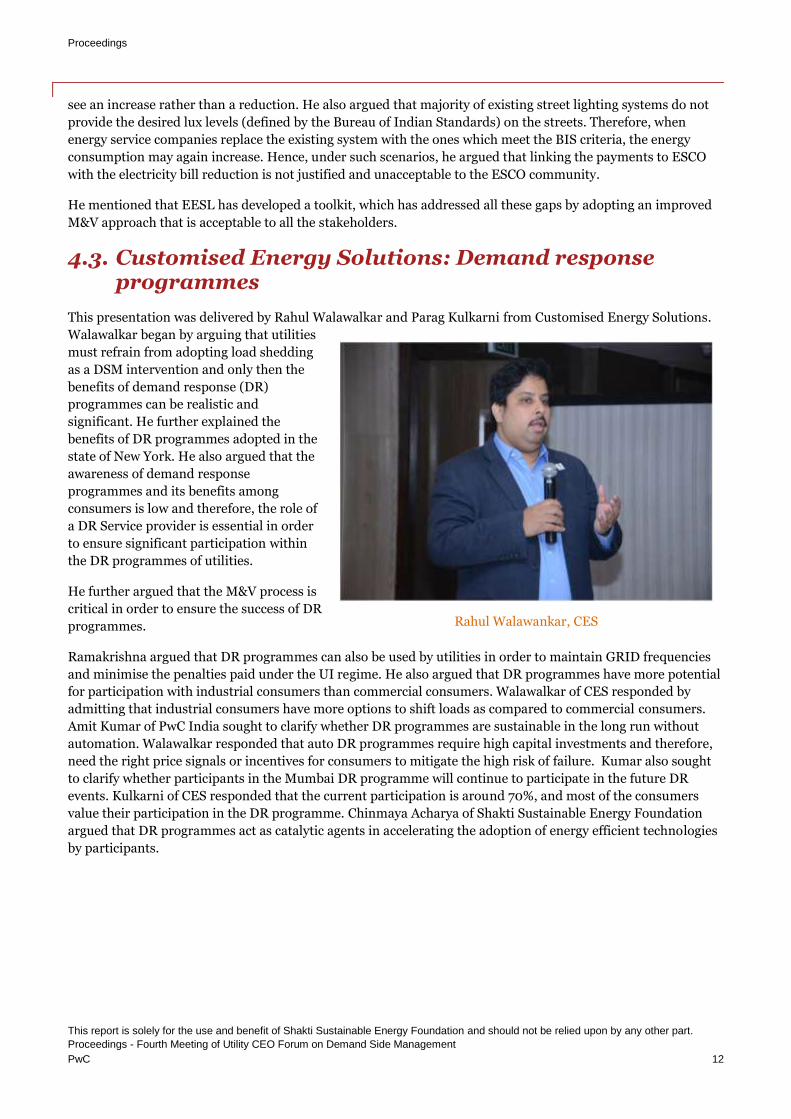
Proceedings
This report is solely for the use and benefit of Shakti Sustainable Energy Foundation and should not be relied upon by any other part. Proceedings - Fourth Meeting of Utility CEO Forum on Demand Side Management PwC 12
see an increase rather than a reduction. He also argued that majority of existing street lighting systems do not
provide the desired lux levels (defined by the Bureau of Indian Standards) on the streets. Therefore, when
energy service companies replace the existing system with the ones which meet the BIS criteria, the energy
consumption may again increase. Hence, under such scenarios, he argued that linking the payments to ESCO
with the electricity bill reduction is not justified and unacceptable to the ESCO community.
He mentioned that EESL has developed a toolkit, which has addressed all these gaps by adopting an improved
M&V approach that is acceptable to all the stakeholders.
4.3. Customised Energy Solutions: Demand response programmes
This presentation was delivered by Rahul Walawalkar and Parag Kulkarni from Customised Energy Solutions.
Walawalkar began by arguing that utilities
must refrain from adopting load shedding
as a DSM intervention and only then the
benefits of demand response (DR)
programmes can be realistic and
significant. He further explained the
benefits of DR programmes adopted in the
state of New York. He also argued that the
awareness of demand response
programmes and its benefits among
consumers is low and therefore, the role of
a DR Service provider is essential in order
to ensure significant participation within
the DR programmes of utilities.
He further argued that the M&V process is
critical in order to ensure the success of DR
programmes.
Ramakrishna argued that DR programmes can also be used by utilities in order to maintain GRID frequencies
and minimise the penalties paid under the UI regime. He also argued that DR programmes have more potential
for participation with industrial consumers than commercial consumers. Walawalkar of CES responded by
admitting that industrial consumers have more options to shift loads as compared to commercial consumers.
Amit Kumar of PwC India sought to clarify whether DR programmes are sustainable in the long run without
automation. Walawalkar responded that auto DR programmes require high capital investments and therefore,
need the right price signals or incentives for consumers to mitigate the high risk of failure. Kumar also sought
to clarify whether participants in the Mumbai DR programme will continue to participate in the future DR
events. Kulkarni of CES responded that the current participation is around 70%, and most of the consumers
value their participation in the DR programme. Chinmaya Acharya of Shakti Sustainable Energy Foundation
argued that DR programmes act as catalytic agents in accelerating the adoption of energy efficient technologies
by participants.
Rahul Walawankar, CES
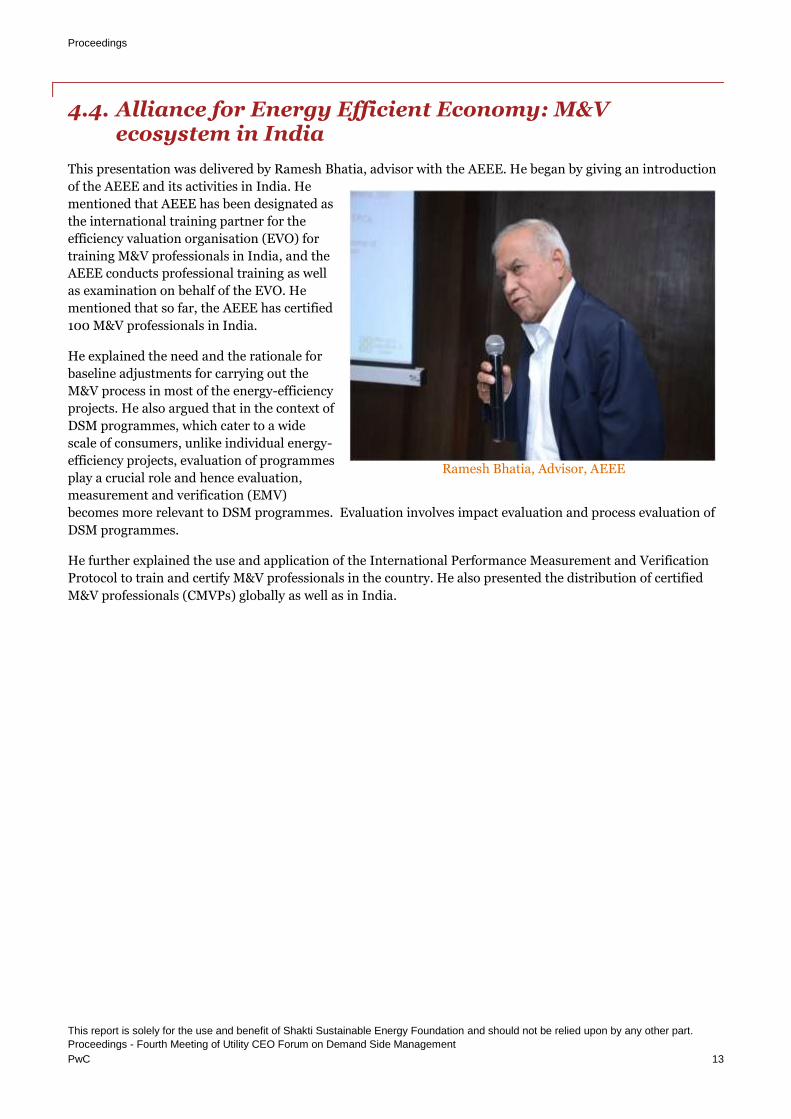
Proceedings
This report is solely for the use and benefit of Shakti Sustainable Energy Foundation and should not be relied upon by any other part. Proceedings - Fourth Meeting of Utility CEO Forum on Demand Side Management PwC 13
4.4. Alliance for Energy Efficient Economy: M&V ecosystem in India
This presentation was delivered by Ramesh Bhatia, advisor with the AEEE. He began by giving an introduction
of the AEEE and its activities in India. He
mentioned that AEEE has been designated as
the international training partner for the
efficiency valuation organisation (EVO) for
training M&V professionals in India, and the
AEEE conducts professional training as well
as examination on behalf of the EVO. He
mentioned that so far, the AEEE has certified
100 M&V professionals in India.
He explained the need and the rationale for
baseline adjustments for carrying out the
M&V process in most of the energy-efficiency
projects. He also argued that in the context of
DSM programmes, which cater to a wide
scale of consumers, unlike individual energy-
efficiency projects, evaluation of programmes
play a crucial role and hence evaluation,
measurement and verification (EMV)
becomes more relevant to DSM programmes. Evaluation involves impact evaluation and process evaluation of
DSM programmes.
He further explained the use and application of the International Performance Measurement and Verification
Protocol to train and certify M&V professionals in the country. He also presented the distribution of certified
M&V professionals (CMVPs) globally as well as in India.
Ramesh Bhatia, Advisor, AEEE
Proceedings
This report is solely for the use and benefit of Shakti Sustainable Energy Foundation and should not be relied upon by any other part. Proceedings - Fourth Meeting of Utility CEO Forum on Demand Side Management PwC 14
5. Concluding session
In this session, Dhawan of Shakti Sustainable Energy Foundation requested the participants to further
deliberate on the following questions and make conclusive recommendations.
1. The inability of utilities and ESCOs to agree on how the energy savings can be measured and verified is
impeding the megawatt scale DSM investments by utilities in India. True or False?
2. What are the challenges and issues that arise, in the context of M&V, while scaling up the pilot DSM
programs to megawatt scale programs?
3. Does the existence of M&V guidelines and protocols play a crucial role in supporting large scale DSM
investments by utilities?
4. Which institution/s in India should lead the development of M&V guidelines?
5. How can we improve the M&V eco-system in India?
Saurabh Kumar of EESL acknowledged the applicability of IPMVP for developing M&V guidelines. However, he
indicated that the guidelines must suit the current baseline challenges and be as simple as possible. Dhawan
mentioned that Shakti is currently working on simplifying the energy performance contracts and these models
must help the industry to apply M&V concepts in a more robust manner. I M Bhavsar of GEDA highlighted the
impact of DSM programmes in the agriculture pumping sector. He requested that the forum should initially
focus on developing M&V protocols for agriculture pumping before any other application. Ramakrishna
highlighted the need to involve financial managers of Discoms in the development of M&V guidelines relating
to DSM programmes. He asserted that the final payments in DSM programmes are approved by the financial
managers and their concurrence or understanding of the M&V procedures is essential for the smooth
functioning of DSM programmes. Mathur of BEE asserted the importance of M&V for DSM programmes in the
agriculture pumping sector. He further explained the experience of M&V in the Solapur pilot project developed
by the BEE, and highlighted some of the key lessons derived from the issues faced in this project. He indicated
that engineering formulas for water table adjustments must be a part of the M&V plan, and agreed upon at the
contractual stage. He also asserted that the complexity of DSM measures must define the scope of M&V and,
therefore stressed the need for separate M&V guidelines for commonly sought DSM measures in India.
Key takeaways
The lack of M&V guidelines and protocols is a key barrier impeding the megawatt scale DSM investments
by utilities.
The Forum of Regulators could lead the development of M&V guidelines and protocols in India. The M&V
guidelines and protocols should provide a standardized framework for establishing energy savings resulting
from the Utility driven DSM measures.
There are only a handful of DSM programs commonly adopted by Indian electric utilities to acquire cost
effective energy savings. The M&V guidelines and protocols should be specific to these programs and the
M&V approach should consider the prevailing challenges in baseline and metering infrastructure.
M&V protocols for utility driven Agriculture DSM programs should be given top priority while developing
M&V guidelines.
The finance and accounting staff in utilities should be educated about the M&V guidelines and protocols.
Way forward
The Forum seeks to meet every quarter in the year 2014, with a thematic discussion, to understand and resolve
the most pressing challenges impeding DSM investments by Indian electric utilities.


Shri Anil Razdan, IAS (Retd.)
Former Secretary, Ministry of Power
Government of India
KULBHUSHAN KUMAR | PricewaterhouseCoopers Private Limited
17th floor, Building No. 10, Tower C | DLF Cyber City | Gurgaon-122002 | India
E: [email protected] | Direct: +91(124) 3306256
M: +91 (0) 9711091007
NATASHA BHAN | Shakti Sustainable Energy Foundation
The Capital Court (4th Floor) | Munirka Phase III | New Delhi-110067 | India
E: [email protected] | Direct: +91 11 47474020
Contact: