uva-dare (digital academic repository) a developmental ... · tessa j. p. van schijndel graag nodig...
TRANSCRIPT

UvA-DARE is a service provided by the library of the University of Amsterdam (http://dare.uva.nl)
UvA-DARE (Digital Academic Repository)
A developmental psychology perspective on preschool science learning: Children'sexploratory play, naïve theories, and causal learning
van Schijndel, T.J.P.
Link to publication
Citation for published version (APA):van Schijndel, T. J. P. (2012). A developmental psychology perspective on preschool science learning:Children's exploratory play, naïve theories, and causal learning.
General rightsIt is not permitted to download or to forward/distribute the text or part of it without the consent of the author(s) and/or copyright holder(s),other than for strictly personal, individual use, unless the work is under an open content license (like Creative Commons).
Disclaimer/Complaints regulationsIf you believe that digital publication of certain material infringes any of your rights or (privacy) interests, please let the Library know, statingyour reasons. In case of a legitimate complaint, the Library will make the material inaccessible and/or remove it from the website. Please Askthe Library: https://uba.uva.nl/en/contact, or a letter to: Library of the University of Amsterdam, Secretariat, Singel 425, 1012 WP Amsterdam,The Netherlands. You will be contacted as soon as possible.
Download date: 07 Jan 2020

Tessa J. P. van Schijndel
Graag nodig ik u uit voor het bijwonen van de openbare
verdediging van mijn proefschrift
A developmentAl psycholoGy perspective
on preschool science leArninG:children’s explorAtory plAy,
nAïve theories, And cAusAl leArninG
de verdediging vindt plaats op vrijdag 27 april 2012
om 12:00 uur in de Agnietenkapel van de universiteit van Amsterdam
oudezijds voorburgwal 231
Na afloop bent u van harte welkom op de receptie in het Compagniecafé
Kloveniersburgwal 50
tessa van schijndel [email protected]
paranimfen:
Guido smeets [email protected]
michiel van schijndel [email protected]
A developmental psychology perspective on preschool science learning: Children’s exploratory play, naïve theories, and causal learning
tessA J. p. vAn schiJndel
A developmentAl psycholoGy perspective on preschool science leArninG:
children’s explorAtory plAy,nAïve theories, And cAusAl leArninG
uitnodiGinG

A developmental psychology perspective on preschool science learning:Children’s exploratory play, naïve theories, and causal learning

The research in this thesis was funded by the Curious Minds program, which is supported by the Dutch Ministry of Education, Culture and Science and the National Platform Science & Technology, the Dutch Organization for Scientific Research (NWO; Aspasia grant), and travel awards from the Prins Bernhard Cultuurfonds, the Jacobs Foundation, and the Society for Research in Child Development.
Layout, cover design & print by Ipskamp Drukkers B.V., Enschede, The Netherlands
ISBN: 978-94-6191-232-9
Copyright © 2012 Tessa J. P. Van Schijndel, Amsterdam, The NetherlandsAll rights reserved

A developmental psychology perspective on preschool science learning:Children’s exploratory play, naïve theories, and causal learning
ACADEMISCH PROEFSCHRIFT
ter verkrijging van de graad van doctoraan de Universiteit van Amsterdamop gezag van de Rector Magnificus
prof. dr. D. C. van den Boomten overstaan van een door het college voor promoties
ingestelde commissie,in het openbaar te verdedigen in de Agnietenkapel
op vrijdag 27 april, te 12:00 uur
door
Tessa Jacoba Petronella van Schijndelgeboren te Nijmegen
Promotiecommissie
Promotor: Prof. Dr. M. E. J. RaijmakersCo-promotor: Prof. Dr. H. L. J. van der Maas
Overige leden: Prof. Dr. C. Dolan Prof. Dr. P. L. C. van Geert Dr. B. R. J. Jansen Prof. Dr. P. P. M. Leseman Prof. Dr. M. W. van der Molen Dr. L. E. Schulz Dr. E. Singer
Faculteit der Maatschappij- en Gedragswetenschappen

contents
chapter 1 General introduction 7
chapter 2 A sciencing program and young children’s exploratory play in the sandpit
17
chapter 3 The Exploratory Behavior Scale: Assessing young visitors’ hands-on behavior in science museums
33
chapter 4 Children’s mental models of prenatal development 53
chapter 5 Development of causal learning in 2- to 5-year-olds: Multiple age-related types of causal inference
79
chapter 6 Young children perform better experiments after observing evidence conflicting with their prior knowledge
97
chapter 7 Parent explanation and preschoolers’ exploratory behavior and learning in a shadow exhibition
121
chapter 8 Summary and general discussion 147
References 155
Samenvatting (Summary in Dutch) 169
Dankwoord (Acknowledgements) 175

chaPter 1
General introduction
8 | Chapter 1
Preschool science education & curious mindsYoung children’s readiness for science becomes clear when looking at their curiosity and potential. They have an intrinsic motivation to explore the world around them, which has also been described as an ‘inborn sense of wonder’ (Carson, 1984; Eshach & Fried, 2005). In addition, they have strong cognitive competencies in a number of areas and can, to a certain extent, reason scientifically (Eshach & Fried, 2005; Gelman & Brenneman, 2004). Results of numerous studies contradict the Piagetian idea that young children are incapable of abstract logical thought (e.g. Gopnik, Sobel, Schulz & Glymour, 2001; Siegel, McCabe, Brand & Matthews, 1978; Sobel, Tenenbaum & Gopnik, 2004). For example, Gopnik et al. (2001) have shown that preschoolers are capable of making causal inferences on the basis of patterns of variation and covariation. With respect to future achievement, is often argued that engaging in science activities at a young age could lead to the development of positive attitudes towards science, and improved self-confidence and performance in science (Arnold, Fisher, Doctoroff & Dobbs, 2002; Clements & Sarama, 2007; Eshach & Fried, 2005; French, 2004; Neuman, 1971).
In line with these observations, the US National Academy of Science (Duschl, Schweingruber & Shouse, 2007) and National Science Board (2009) have stressed the importance of preschool science education. The last decade both formal and informal science activities for preschoolers have been developed in the US. In the field of formal learning, preschool science programs, such as ‘Preschool Pathways to Science’ (Gelman, Brenneman, MacDonald & Roman, 2010), ‘ScienceStart!’ (French, 2004), and ‘Head Start on Science’ (Van Egeren, 2007), were developed.1 In the field of informal learning, preschool areas have been set up in science museums, such as the Preschool Place at the New York Hall of Science (Stevenson, 2010). In both these formal and informal settings the child is seen as an active learner who constructs her own learning experiences and hands-on activities comprise the main part of the activities (French, 2004; Gelman & Brenneman, 2004; Neuman, 1971; Ramsey & Fowler, 2004). Adult guidance of the activities is considered necessary, and a main task of the adult is to structure children’s exploratory process by the teaching of process skills, such as predicting, observing, and comparing (Eshach & Fried, 2005; French, 2004; Gelman & Brenneman, 2004; Greenes, Ginsburg & Balfanz, 2004; Ginsburg & Golbeck, 2004; Neuman, 1971).
In Europe, the goal of developing a knowledge-based economy (Lisbon European Council, 2000) has renewed the interest in science education at primary and secondary levels (e.g. Rocard et al., 2007). In 2001, the Dutch government launched the ‘Broadening Technical Education in Primary Education’ program (VTB, www.vtbprogramma.nl). But in spite of these developments, until some years ago few science activities for preschoolers had been developed in The Netherlands. In the field of formal learning, programs aimed at supporting cognitive and social-emotional development, such as Kaleidoscoop and Piramide (e.g. Veen, Roeleveld, Leseman, 2000), had been implemented in preschools, but these programs did

General introduction | 9
not focus specifically on science.2 In the field of informal learning, science museums, such as science center NEMO (Amsterdam) and Naturalis (Leiden), had gained expertise in developing exhibitions for children, but had not developed a specific approach for creating exhibitions or activities for the preschool age group. These observations motivated Jan de Lange, Johan van Benthem, and Robert Dijkgraaf in 2006 to initiate Curious Minds (TalentenKracht, www.talentenkracht.nl), a program as part of VTB focused on the preschool age group. Since its start, Curious Minds has been a program on the intersection of research and practice. Currently, the program supports seven research groups, based at different Dutch and Belgian universities. These groups investigate young children’s skills and knowledge in the science, technology, engineering and mathematics (STEM) disciplines, and study ways in which these abilities can be advanced in an optimal manner. In addition, the research groups collaborate with different parties in the field of science education to apply their research outcomes in practice. The studies in this thesis were performed within the framework of Curious Minds at the UvA research group, which is based at the section Developmental Psychology of the University of Amsterdam.3
research frameworkIn line with the goal of Curious Minds to bridge research and practice, for this thesis three kinds of research-related activities were performed. First, scientific studies on young children’s science learning were executed in controlled lab settings. Second, scientific studies on young children’s science learning were executed in natural settings, such as daycare centers and science museums. In the science museum context, such studies are often referred to as visitor studies, and are related to work evaluating exhibits and exhibitions. However, in contrast to evaluation studies, the studies in this thesis were not solely motivated by the practice of science education, but also by the current state of research. For example, a study could be initiated by a question that an exhibition developer encountered in her interactions with children, but at the same time contribute to advancing methodologies in the field of developmental psychology. The third type of activity was the application of research outcomes in the practice of science education. To this end, the UvA research group has established a long-term collaboration with science center NEMO. The fourth paragraph in this General introduction, “Collaboration UvA and NEMO: Young explorers in NEMO”, gives a brief description of the collaboration, and describes some of the resulting educational products.
This thesis investigates young children’s science learning in controlled and natural settings from a developmental psychological point of view: we study the relation of specific skills and knowledge with age. In doing this, we bring together research from the fields of science education, visitor studies, and cognitive developmental psychology. A constructivist perspective is adopted (e.g. Inhelder & Piaget, 1964, Gopnik & Meltzoff, 1997; Wellman & Gelman 1992), implying that the child is taken as unit of analysis, and that learning is

10 | Chapter 1
considered to be happening within the child’s mind (Callanan & Valle, 2008). Although we consider Piaget’s theory to underestimate young children’s abilities, we do take his description of the “active, self-directed nature of children’s cognition” (Gelman, 2009, p. 116) as a point of departure for our studies. In taking this perspective, we agree with Gelman (2009) that children not only learn from their own exploration, but that their interactions with others shape an important part of their learning experiences. Work on primary school-aged children’s science learning demonstrated that self-directed discovery learning can be ineffective (e.g. Dunbar & Klahr, 1989; Schauble, 1990), and even inferior to direct instruction (Klahr & Nigam, 2004). Even though these results cannot be translated directly to the preschool age group (see Chapter 7), the importance of adult guidance in preschoolers’ science learning is evident. Therefore, this thesis also examines the effects of a teacher-led sciencing program, and different adult coaching styles on young children’s science learning.
This thesis has a focus on measurement, or quantification of children’s knowledge and behavior. For example, this focus is reflected by the use and development of nonverbal measures for assessing children’s skills and knowledge in the field of science. In many studies children’s reasoning on science subjects is assessed verbally, often by interviewing (e.g. Bernstein & Cowan, 1975; Havu-Nuutinen, 2005; Tuckey, 1992; Vosniadou & Brewer, 1992). However, as young children’s verbal capacities are still developing, their verbal utterances cannot be considered an accurate reflection of their level of reasoning; that is, measures relying on verbal utterances could be confounded by children’s language skills. Therefore, the use of nonverbal measures yields more information about young children’s capacities than the use of verbal measures (e.g. Brainerd & Hooper, 1975). The focus on measurement is also reflected by the individual differences approach that is applied in this thesis. In many studies development of science skills and knowledge is described based on average behavior of children within age groups (e.g. Flobbe, Verbrugge, Hendriks & Krämer, 2008; Sobel & Kirkham, 2006; Sobel et al., 2004). However, as preschoolers have received little formal science education, sizable differences in skills and knowledge exist within age groups. Instead of averaging over age groups, this thesis describes the development of children’s skills and knowledge by taking into account individual differences; that is, by distinguishing different types of skills and knowledge and relating these to children’s age. To this end, a combination of Siegler’s (1981) Rule Assessment Methodology and a latent variable technique (e.g. McCutcheon, 1987; Rindskopf, 1987) were applied (Jansen & Van der Maas 1997, 2001, 2002; Raijmakers, Jansen & Van der Maas, 2004).
PresChoolers’ exPlorAtory PlAy, nAïve theories & causal learningFirst and foremost, the studies in this thesis investigate young children’s exploratory play.4 Exploration is considered to be at the core of young children’s science learning: preschool science programs emphasize the learning of skills that comprise exploration (e.g. French,
General introduction | 11
2004; Gelman & Brenneman, 2004), and science museums see meaningful, “minds-on” interactive behavior as indispensable to visitors’ experience (Allen, 2002, 2004). Children’s exploratory play is often referred to as their reasoning-in-action (Gifford, 2004; Inhelder & Piaget, 1964; Singer, 2002). To investigate preschoolers’ exploratory play in natural settings, we developed the Exploratory Behavior Scale (EBS).5 This scale fills a gap in existing measures for visitor behavior in museum settings. Compared to frequently used global measures of behavior (e.g. Boisvert & Slez, 1994, 1995; McManus, 1987) the EBS adds information about the quality of the hands-on behavior. Compared to more detailed measures of behavior (e.g. Crowley et al., 2001; Meisner et al., 2007), the EBS has the advantage of being domain-general, and applicable in different settings.
Children’s exploration is affected by domain-specific knowledge (e.g. Bonawitz, Van Schijndel, Friel & Schulz, 2012; Legare, 2012), but also yields domain-specific knowledge (e.g. Gweon & Schulz, 2008; Schulz, Gopnik & Glymour, 2007). This thesis examines these processes in young children. First, we study children’s naïve theories in several areas of science: in the area of biology we study theories on prenatal development, and in the area of physics we study theories on shadow size.6 It is investigated whether children’s knowledge in these ecologically valid domains is coherent, theory like, or fragmented (see DiSessa, Gillespie & Esterly, 2004 for a review). Second, we investigate how children’s domain-specific knowledge affects their exploration by examining the effect of evidence conflicting with children’s naïve theory on the quality of their exploratory play. Third, we study a prerequisite for learning from exploration: children’s ability to make causal inferences. Last, we investigate how children’s exploration yields knowledge by looking at the relations between children’s exploratory play and domain-specific learning in both controlled and natural settings.
CollAborAtion UvA & neMo: yoUng exPlorers in neMoSince the start of Curious Minds, the UvA research group has been working together with the Science Learning Center of science center NEMO. The collaboration is called Young explorers in NEMO (Kleuters aan zet in NEMO, http://www.e-nemo.nl/kleutersaanzet). Besides scientific studies in the museum setting, the collaboration has yielded several products for the practices of formal and informal science education. For example, for formal educational purposes teacher workshops were developed and implemented. These workshops focused on the importance of taking into account individual children’s prior knowledge on science subjects, their (naïve) theories, in classroom education. For informal educational purposes, a guide was written with recommendations for developing science activities for preschoolers (Franse, Van Schijndel & Raijmakers, 2010). For writing the guide, NEMO and the UvA consulted the developmental psychological literature, held expert meetings with researchers from Curious Minds, and interviewed developers of preschool exhibitions from different European science museums. The resulting guide was used a point of departure for
12 | Chapter 1
the development of NEMO’s first exhibition exclusively for the preschool age group: Young explorers in NEMO.
Young explorers in NEMO ran at the science center on weekends and holidays from January 2010 until December 2011. The exhibition was developed based on the expertise of NEMO’s in-house exhibition developers and the guide’s recommendations, but also on the basis of outcomes of studies of the UvA research group. First, in the exhibition preschoolers were explicitly offered science content. The theme of shadows was chosen: a theater show and an exhibition space were developed to illustrate a number of physical principles related to shadows. For example, one principle concerned the relation between object size, the distance of an object to the light source, and shadow size. The level of difficulty in illustrating this principle was based on UvA group studies investigating preschoolers’ naïve theories on shadow size. A second choice in developing the exhibition was to encourage meaningful exploration. The emphasis was laid on children’s acquisition of process skills: the exhibition space contained interactive exhibits, some of which, for example, were explicitly designed for prediction to precede testing. In the development of exhibits, the finding of the UvA group that preschoolers’ exploration is positively affected by evidence conflicting with their naïve theory was applied. A last choice in developing the exhibition was to stimulate parents to guide their children’s learning process. Child and parent could only enter the exhibition together, they were addressed as a team by the explainer and exhibit labels, and some of the exhibits were explicitly designed for child and parent to engage with together. The emphasis on parent guidance was motivated in part by UvA group studies demonstrating positive effects of parent guidance on preschoolers’ exploratory play.
thesis outlineThis thesis describes six empirical studies. The first two studies (Chapter 2 & 3) primarily focus on preschoolers’ exploratory play. The third study (Chapter 4) concerns children’s naïve theories in the field of science. The fourth study (Chapter 5) concerns a crucial skill in learning from exploration: the ability to make causal inferences. The fifth and sixth study (Chapter 6 & 7) bring together these topics by researching preschoolers’ naïve theories, exploratory play, and causal learning. The first, second, and sixth study (Chapter 2, 3 & 7) were performed in natural settings, while the third, fourth, and fifth (Chapter, 4, 5 & 6) study were performed in controlled settings.
In the first two studies (Chapter 2 & 3) we investigated effects of adult guidance on preschoolers’ exploratory play. The first study (Chapter 2) focuses on the effect of a sciencing program on 2- to 3-year-olds’ exploration in the sandpit area of a daycare center. The second study (Chapter 3) focuses on the effects of adult guidance on 4- to 6-year-olds’ exploration at exhibits in a science museum. The first experiment was performed during closing hours of the museum and examined which adult coaching-style resulted in the highest level of exploration. The second experiment was performed during opening hours of the museum and

General introduction | 13
examined the effect of informing parents about an effective way of coaching on preschoolers’ exploration. In both the study in the daycare center setting, and the study in the science museum setting, the Exploratory Behavior Scale was used to quantify children’s exploration.5
In the third study (Chapter 4) we investigated 6- to 12-year-olds’ naïve theories on prenatal development. We distinguished two sub-domains of prenatal development, the shape of the body and bodily functions, and examined whether children’s knowledge in these sub-domains is coherent or fragmented. In addition, we studied whether doing a generative task, such as drawing, increases the coherence of children’s theories.
In the fourth study (Chapter 5) we investigated a prerequisite for learning from exploration: children’s ability to make causal inferences. We described the development of this ability by investigating individual differences in the type of inferences 2- to 5-year-olds use.
In the fifth and sixth study (Chapter 6 & 7) we investigated 4- to 6-year-olds’ naïve theories, exploratory play, and causal learning. Both studies focus on preschoolers’ naïve theories in the domain of shadow size. In the fifth study (Chapter 6) we examined the effect of evidence conflicting with children’s naïve theory on the quality of their exploratory play. In addition, it was investigated how children’s naïve theories and quality of play are related to their learning. In the sixth study (Chapter 7) we examined relations between different types of parent explanation, and preschoolers’ exploratory play and learning in a science museum. In this study, the Exploratory Behavior Scale was used to quantify children’s exploration.
At the moment of publication of this thesis all empirical chapters are in revision, published in, or submitted to international peer-reviewed journals. To acknowledge the important contributions of the co-authors a list of references is presented below:
• Chapter 2: Van Schijndel, T. J. P., Singer, E., Van der Maas, H. L. J., & Raijmakers, M. E. J. (2010). A sciencing programme and young children’s exploratory play in the sandpit. European Journal of Developmental Psychology, 7(5), 603-617.
• Chapter 3: Van Schijndel, T. J. P., Franse, R. K., & Raijmakers, M. E. J. (2010). The Exploratory Behavior Scale: Assessing young visitors’ hands-on behavior in science museums. Science Education, 94, 794–809.
• Chapter 4: Van Es, S. E., Van Schijndel, T. J. P., Franse, R. K., & Raijmakers, M. E. J. Children’s mental models of prenatal development. Manuscript submitted for publication.
• Chapter 5: Van Schijndel, T. J. P., Huijpen, K., & Raijmakers, M. E. J. Development of causal learning in 2- to 5-year-olds: Multiple age-related types of causal inference. Manuscript in revision.
• Chapter 6: Van Schijndel, T. J. P., Visser, I., Van Bers, B. M. C. W., & Raijmakers, M. E. J. Preschoolers perform more unconfounded experiments after observing evidence conflicting with their naïve theory. Manuscript in revision.

14 | Chapter 1
• Chapter 7: Van Schijndel, T. J. P., & Raijmakers, M. E. J. Parent explanation and preschoolers’ exploratory behavior and learning in a shadow exhibition. Manuscript submitted for publication.
Other papers related to this thesis:• Bonawitz, E. B., Van Schijndel, T. J. P., Friel, D., & Schulz, L. E. (2012). Children
balance theories and evidence in exploration, explanation, and learning. Cognitive Psychology 64, 215–234.
• Van Es, S. E., Van Schijndel, T. J. P., Franse, R. K., & Raijmakers, M. E. J. (2009). Children’s thoughts on unborn babies, Representational redescription in preconceptions of children on fetal development. In N. A. Taatgen & H. van Rijn (Eds.), Proceedings of the 31st Annual Conference of the Cognitive Science Society (pp. 112-117). Austin, TX: Cognitive Science Society.
General introduction | 15
notes1. This thesis brings together different fields of
research, such as the field of developmental
psychology and the field of visitor studies,
and chapters are written for international
journals in different fields. Therefore, the
term “learning” is used in different manners.
This footnote clarifies the use of the term in
the different chapters. First, we talk about
“science learning”, “formal/ informal learning”,
and “learning in the field of science” to refer
to a broad range of cognitive, affective, social,
and behavioral learning outcomes (e.g. Brody,
Bangert & Dillon, 2008; Mainly Chapter 1
& 8). As this thesis focuses on investigating
cognitive learning outcomes, the terms
“learning”, “domain-specific learning”, and
“causal learning” are used to refer to children’s
knowledge acquisition in specific domains of
science (Mainly Chapter 1, 6, 7 & 8). Last, in
Chapter 4, the term “causal learning” does not
refer to children’s knowledge acquisition in a
specific domain, but to a prerequisite for this
process to take place: children’s capacity to
make causal inferences.
2. No general science programs for preschoolers
had been developed, but the Freudenthal
Institute for Science and Mathematics Education
had developed “SamenRekenen”, a preschool
program focused on math development (Van
Eerde, Peltenburg, Van den Boer & Nelissen,
2009).
3. Prof. Dr. Maartje Raijmakers is the primary
investigator of the UvA research group.
4. In this thesis, the terms “exploratory play”,
“exploratory behavior”, and “exploration” are
used interchangeably.
5. The Exploratory Behavior Scale (EBS) is used
for assessing preschoolers’ exploration in the
studies described in Chapter 3 and 7. The EBS
consists of three levels: passive contact, active
manipulation, and exploratory behavior. In
the study described in Chapter 2, an extended
version of the EBS, the Exploratory Play Scale
(EPS) is used. The EPS consists of four levels:
in this scale the third level is extended with
construction behaviors, and the fourth level
contains object replacement behaviors.
6. In this thesis, the terms “(naïve) theory”, “rule”
and “mental model” are used interchangeably
to refer to children’s coherent knowledge or
ideas in specific domains in the field of science.
The use of the term “naïve theories” in this
thesis should not be confused with Wellman
& Gelman’s (1992) description of foundational
theories of core domains, as the latter theories
call on more elaborate and integrated sets of
beliefs.


chaPter 2
A sciencing program and young children’s exploratory play in the sandpit
Van Schijndel, T. J. P., Singer, E., Van der Maas, H. L. J., & Raijmakers, M. E. J. (2010). A sciencing programme and young children’s exploratory play in the sandpit. European Journal of Developmental Psychology, 7(5), 603-617.
18 | Chapter 2
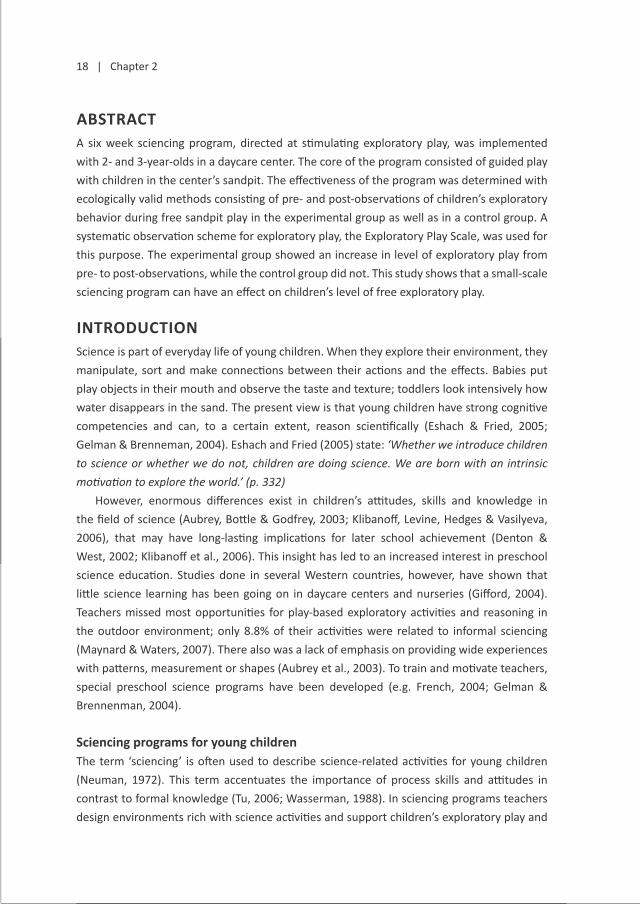
abstractA six week sciencing program, directed at stimulating exploratory play, was implemented with 2- and 3-year-olds in a daycare center. The core of the program consisted of guided play with children in the center’s sandpit. The effectiveness of the program was determined with ecologically valid methods consisting of pre- and post-observations of children’s exploratory behavior during free sandpit play in the experimental group as well as in a control group. A systematic observation scheme for exploratory play, the Exploratory Play Scale, was used for this purpose. The experimental group showed an increase in level of exploratory play from pre- to post-observations, while the control group did not. This study shows that a small-scale sciencing program can have an effect on children’s level of free exploratory play.
introductionScience is part of everyday life of young children. When they explore their environment, they manipulate, sort and make connections between their actions and the effects. Babies put play objects in their mouth and observe the taste and texture; toddlers look intensively how water disappears in the sand. The present view is that young children have strong cognitive competencies and can, to a certain extent, reason scientifically (Eshach & Fried, 2005; Gelman & Brenneman, 2004). Eshach and Fried (2005) state: ‘Whether we introduce children to science or whether we do not, children are doing science. We are born with an intrinsic motivation to explore the world.’ (p. 332)
However, enormous differences exist in children’s attitudes, skills and knowledge in the field of science (Aubrey, Bottle & Godfrey, 2003; Klibanoff, Levine, Hedges & Vasilyeva, 2006), that may have long-lasting implications for later school achievement (Denton & West, 2002; Klibanoff et al., 2006). This insight has led to an increased interest in preschool science education. Studies done in several Western countries, however, have shown that little science learning has been going on in daycare centers and nurseries (Gifford, 2004). Teachers missed most opportunities for play-based exploratory activities and reasoning in the outdoor environment; only 8.8% of their activities were related to informal sciencing (Maynard & Waters, 2007). There also was a lack of emphasis on providing wide experiences with patterns, measurement or shapes (Aubrey et al., 2003). To train and motivate teachers, special preschool science programs have been developed (e.g. French, 2004; Gelman & Brennenman, 2004).
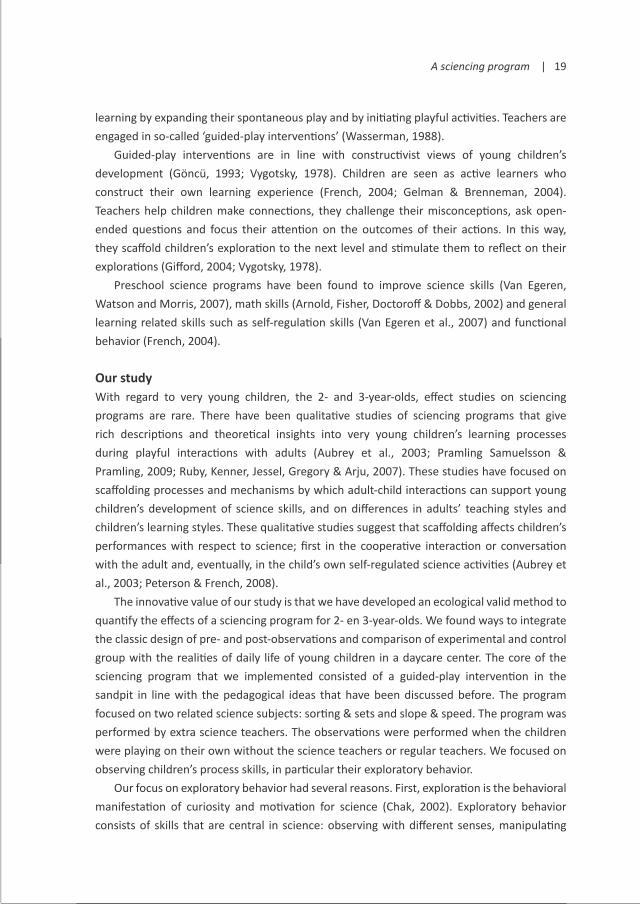
sciencing programs for young childrenThe term ‘sciencing’ is often used to describe science-related activities for young children (Neuman, 1972). This term accentuates the importance of process skills and attitudes in contrast to formal knowledge (Tu, 2006; Wasserman, 1988). In sciencing programs teachers design environments rich with science activities and support children’s exploratory play and
A sciencing program | 19
learning by expanding their spontaneous play and by initiating playful activities. Teachers are engaged in so-called ‘guided-play interventions’ (Wasserman, 1988).
Guided-play interventions are in line with constructivist views of young children’s development (Göncü, 1993; Vygotsky, 1978). Children are seen as active learners who construct their own learning experience (French, 2004; Gelman & Brenneman, 2004). Teachers help children make connections, they challenge their misconceptions, ask open-ended questions and focus their attention on the outcomes of their actions. In this way, they scaffold children’s exploration to the next level and stimulate them to reflect on their explorations (Gifford, 2004; Vygotsky, 1978).
Preschool science programs have been found to improve science skills (Van Egeren, Watson and Morris, 2007), math skills (Arnold, Fisher, Doctoroff & Dobbs, 2002) and general learning related skills such as self-regulation skills (Van Egeren et al., 2007) and functional behavior (French, 2004).
our studyWith regard to very young children, the 2- and 3-year-olds, effect studies on sciencing programs are rare. There have been qualitative studies of sciencing programs that give rich descriptions and theoretical insights into very young children’s learning processes during playful interactions with adults (Aubrey et al., 2003; Pramling Samuelsson & Pramling, 2009; Ruby, Kenner, Jessel, Gregory & Arju, 2007). These studies have focused on scaffolding processes and mechanisms by which adult-child interactions can support young children’s development of science skills, and on differences in adults’ teaching styles and children’s learning styles. These qualitative studies suggest that scaffolding affects children’s performances with respect to science; first in the cooperative interaction or conversation with the adult and, eventually, in the child’s own self-regulated science activities (Aubrey et al., 2003; Peterson & French, 2008).
The innovative value of our study is that we have developed an ecological valid method to quantify the effects of a sciencing program for 2- en 3-year-olds. We found ways to integrate the classic design of pre- and post-observations and comparison of experimental and control group with the realities of daily life of young children in a daycare center. The core of the sciencing program that we implemented consisted of a guided-play intervention in the sandpit in line with the pedagogical ideas that have been discussed before. The program focused on two related science subjects: sorting & sets and slope & speed. The program was performed by extra science teachers. The observations were performed when the children were playing on their own without the science teachers or regular teachers. We focused on observing children’s process skills, in particular their exploratory behavior.
Our focus on exploratory behavior had several reasons. First, exploration is the behavioral manifestation of curiosity and motivation for science (Chak, 2002). Exploratory behavior consists of skills that are central in science: observing with different senses, manipulating

20 | Chapter 2
and looking for effects and investigating relationships. Second, young children’s knowledge levels are very hard to access using a measure that relies on children’s language skills. Third, based on earlier studies we were able to construct a systematic observation scheme to distinguish simple from more complex levels of exploratory behavior (Dunn, Kontos & Potter, 1996; Rubenstein & Howes, 1979; Smilansky, 1968). The so called Exploratory Play Scale (EPS) enabled us to measure differences in level of exploratory behavior between the experimental and control group. At the lowest levels of exploration children only make passive contact with their environment (EPS level 1, passive contact) or attentively manipulate an object (EPS level 2, active manipulation). At the higher levels of exploration children are involved in applying repetition and variation to their manipulations (EPS level 3, exploratory play), making constructions (EPS level 3, construction) and using objects to represent other objects that are necessary for symbolic play (EPS level 4, object replacement).1
methodParticipantsTwo licensed daycare centers in Amsterdam that belonged to the same organization and had the same pedagogical policy participated in the study. Center A provided the experimental group, center B the control group. The centers were associated with the University of Amsterdam until recently and the mean educational level of parents was high. In line with the Dutch regulations, the teacher-child ratio was 2 teachers and 12 children in the mixed age groups (0- to 4-year-olds); and 2 teachers and 14 children in the toddler groups (2- and 3-year-olds). All teachers were qualified and their education varied from junior to higher vocational training. For the sciencing program specially trained extra teachers were recruited and trained.
The experimental group consisted of 35 children (14 girls, 21 boys) averaging 35.51 months of age at the first observation day in center A (range=25 to 44, SD=6.10). The control group consisted of 12 children (5 girls, 7 boys) averaging 34.50 months of age at the first observation day in center B (range=26 to 45, SD=6.91). The selection of the children was based on age (2- and 3-year-olds), parental permission, presence on observation days and willingness to play in the sandpit.
A first line of analyses included all 47 preschoolers. Not all of these children happened to be videotaped during pre- and during post observations (see Procedure). Therefore, considering all participants did not allow us to perform a repeated measurement analysis. For the second line of analysis, we included the 28 children that had been videotaped during both observational periods in the so-called Repeated Measurements (RM) groups. The 19 children in the experimental-RM group (7 girls, 12 boys) averaged 36.56 months of age at the first observation day in center A (range=27 to 44, SD=6.47). The 9 children in the control-RM group (3 girls, 6 boys) averaged 33.69 months of age at the first observation day in center B (range=26 to 42, SD=6.47).

A sciencing program | 21
ProcedureBefore the beginning of the study, toys from both daycare centers’ sandpits were replaced with new play objects matching subjects of the upcoming sciencing program in center A. For sorting & sets, different types of natural and non-natural materials of different colors and sizes were provided, together with buckets and sieves in which the objects could be collected. For slope & speed, PVC tubes with different diameters were provided, together with balls and other small objects that could be thrown through the tubes.2 The new play objects stayed in the sandpits of both daycare centers until the end of the study.
sciencing program The sciencing program in center A was performed in six successive weeks in 2006. The guided play took place in small groups (1 to 5 children) during regular morning outdoor playtime. The children were encouraged to participate at least once a week in the games, but they were free to join the science teacher and their peers in the sandpit as often as they wanted. Two science subjects were alternated week by week: sorting & sets and slope & speed. In order to connect the sciencing program to other parts of the preschool curriculum, the science subjects were matched with themes that were elaborated on in the classrooms. The regular teachers read theme related books to the children and the classrooms were provided with posters and dressing clothes aimed at encouraging conversation about the science subjects and themes.
Sorting & sets was matched with the theme “Baking cakes”. During sandpit play objects were sorted according to color, size or function and attention was given to the distinction between natural and non-natural materials. For example, cakes could be made with red or blue objects or with natural or non-natural items. The next passage gives an impression of the sorting & sets games:
Jody has her bucket full of sand and repeatedly pats with a plastic spoon on top of it. Simon is watching her. Both have a low level of exploratory behavior (EPS level 2 and 1). Then the science teacher points at a bucket filled with sand with yellow, blue and green play materials on top and asks: “Shall we make a cake?” Jody and Simon look at the bucket and take some of the objects. The teacher continues: “If we want to make this one into a green cake, which ones do we have to take away?” She clarifies her question by asking the children to name the colors of the objects and then repeats her initial question. Simon responds by removing the yellow and blue materials. Next, she asks the children to look for other green materials to put on the cake. Jody and Simon start to search the sandpit for green objects and place them on the cake (EPS level 3).
During the guided play, the children actively manipulated the objects, repeatedly sorted the objects, they varied the sets, and they observed the effect of their manipulations, which are

22 | Chapter 2
the four criteria that we use for classifying the behavior as exploratory play (EPS level 3). Slope & speed was matched with the theme “On the top of the mountain”. In the sandpit,
balls were rolled of piles of sand and through PVC tubes. The slope of the piles and the position of the tubes was varied, while the speed of the balls was monitored. The next passage gives an impression of the sloop & speed games:
Rose, Michel and Jan are exploring PVC tubes. They hold them and watch attentively (EPS level 2).The science teacher is sitting at the lower end of one of the tubes. She places a ball in this end of the tube and says to Jan who is standing at the higher end of the tube: “I’ll give this one to you” She gently pushes the ball into the PVC tube. The ball comes out of the tube on her side. She keeps placing the ball in the tube and it keeps coming out on her side. She then asks Jan: “Why don’t you have it yet? Isn’t it coming out?” Jan then responds by lifting the teacher’s side of the tube to make it the higher end (EPS level 3). The ball rolls out and the teacher responds enthusiastically.
During this interaction the teacher and children explored the effect of the slope of the tube on the side where the ball exited the tube. They actively manipulated the tube and the balls, they repeatedly threw the balls through the tube, they varied the slope of the tube, and they observed the effect of their manipulations, which are the four criteria that we use for classifying the behavior as exploratory play (EPS level 3).
observationsIn both centers, pre-observations were performed during the five weeks before the start of the sciencing program in center A and post-observations were performed in the five weeks after the program had terminated. On four different days during regular outdoor playtime, one hour video recordings were made of children’s free sandpit play, i.e. without science teacher.
To keep the play situation ecologically valid, the regular outdoor play routines were followed as closely as possible. The children were encouraged to play in the sandpits, but they were not obliged to do so and could leave the sandpit whenever they wanted. This procedure resulted in a different number of video recordings of different lengths for each child. In order to be able to study the effects of the sciencing program on children’s free exploratory behavior without scaffolding teachers, we asked the teachers to interfere as little as possible with children’s play during observation hours. As Dutch daycare teachers have relatively low frequency of interactive play with children (De Kruif et al., 2009), this request was easily met.
A sciencing program | 23
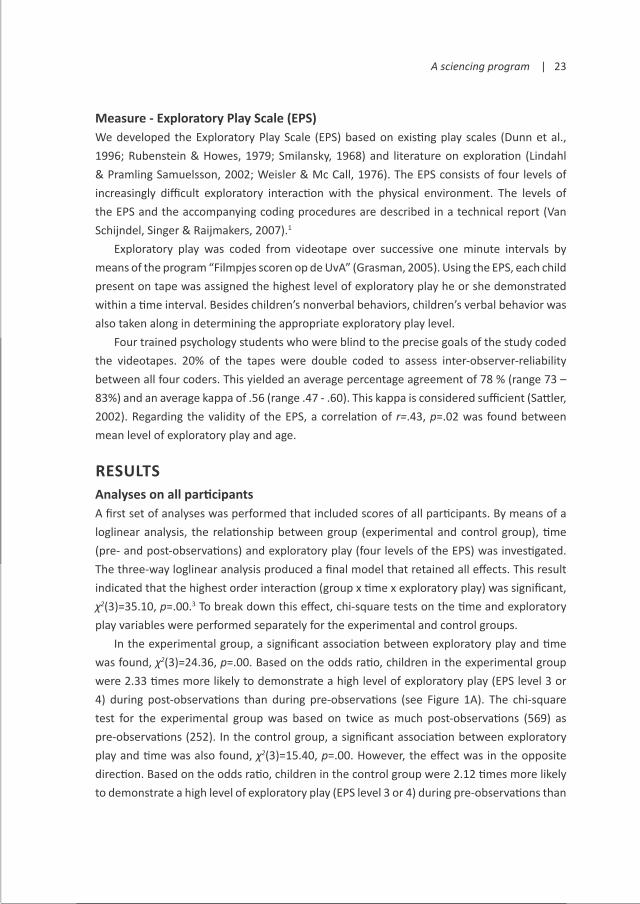
Measure - exploratory Play scale (ePs)We developed the Exploratory Play Scale (EPS) based on existing play scales (Dunn et al., 1996; Rubenstein & Howes, 1979; Smilansky, 1968) and literature on exploration (Lindahl & Pramling Samuelsson, 2002; Weisler & Mc Call, 1976). The EPS consists of four levels of increasingly difficult exploratory interaction with the physical environment. The levels of the EPS and the accompanying coding procedures are described in a technical report (Van Schijndel, Singer & Raijmakers, 2007).1
Exploratory play was coded from videotape over successive one minute intervals by means of the program “Filmpjes scoren op de UvA” (Grasman, 2005). Using the EPS, each child present on tape was assigned the highest level of exploratory play he or she demonstrated within a time interval. Besides children’s nonverbal behaviors, children’s verbal behavior was also taken along in determining the appropriate exploratory play level.
Four trained psychology students who were blind to the precise goals of the study coded the videotapes. 20% of the tapes were double coded to assess inter-observer-reliability between all four coders. This yielded an average percentage agreement of 78 % (range 73 – 83%) and an average kappa of .56 (range .47 - .60). This kappa is considered sufficient (Sattler, 2002). Regarding the validity of the EPS, a correlation of r=.43, p=.02 was found between mean level of exploratory play and age.
resultsAnalyses on all participantsA first set of analyses was performed that included scores of all participants. By means of a loglinear analysis, the relationship between group (experimental and control group), time (pre- and post-observations) and exploratory play (four levels of the EPS) was investigated. The three-way loglinear analysis produced a final model that retained all effects. This result indicated that the highest order interaction (group x time x exploratory play) was significant, χ2(3)=35.10, p=.00.3 To break down this effect, chi-square tests on the time and exploratory play variables were performed separately for the experimental and control groups.
In the experimental group, a significant association between exploratory play and time was found, χ2(3)=24.36, p=.00. Based on the odds ratio, children in the experimental group were 2.33 times more likely to demonstrate a high level of exploratory play (EPS level 3 or 4) during post-observations than during pre-observations (see Figure 1A). The chi-square test for the experimental group was based on twice as much post-observations (569) as pre-observations (252). In the control group, a significant association between exploratory play and time was also found, χ2(3)=15.40, p=.00. However, the effect was in the opposite direction. Based on the odds ratio, children in the control group were 2.12 times more likely to demonstrate a high level of exploratory play (EPS level 3 or 4) during pre-observations than

24 | Chapter 2
during post-observations (see Figure 1B).4 In the control group, the chi-square test was based on roughly the same amount of pre-observations (182) as post-observations (211).
On the basis of the analyses on all participants, the conclusion can be drawn that the sciencing program made the experimental group demonstrate a higher proportion of high-level exploratory play. In Table 1 we included several examples of high-level exploratory play that were observed throughout the study.
figure 1. Distributions of levels of exploratory play during pre- and post-observations for the experimental (A) and control group (B). Error bars indicate 95% confidence intervals.
Analyses on the repeated Measurements (rM) groupsOnly a subgroup of participants was observed during both pre- and post-observations: the Repeated Measurements (RM) group. The following analyses are based on the scores of this group that can be subdivided in the RM experimental and RM control group.
A factorial repeated measures analysis was conducted with time (pre- and post-observations) as within-subjects factor and group (experimental and control group) as between-subjects factor on mean exploratory play level.5 No main effects were found. There was a significant interaction between time and group, F(1, 26)=6.53, p=.02. The experimental group showed an improvement in mean exploratory play level from pre-observations (M=2.15, SD=.26) to post-observations (M=2.52, SD=.42). The control group on the other hand, did not show a significant change in mean exploratory play level from pre-observations
Exploratory play level Exploratory play level
Perc
enta
ge o
f obs
erva
tions
Perc
enta
ge o
f obs
erva
tions
A Experimental group
B Control group Time
Pre observationsPost observations
TimePre observationsPost observations
A sciencing program | 25
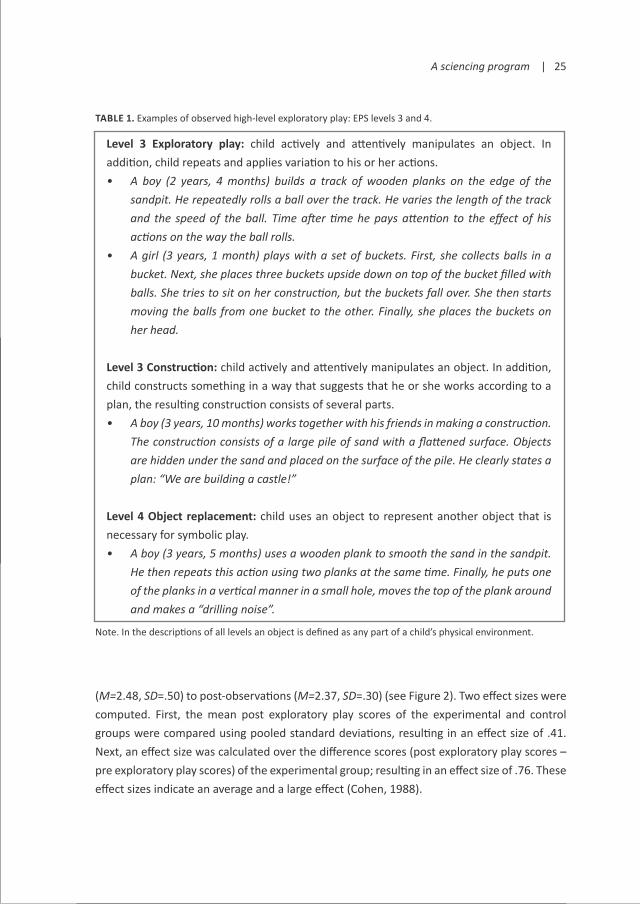
table 1. Examples of observed high-level exploratory play: EPS levels 3 and 4.
level 3 exploratory play: child actively and attentively manipulates an object. In addition, child repeats and applies variation to his or her actions.• A boy (2 years, 4 months) builds a track of wooden planks on the edge of the
sandpit. He repeatedly rolls a ball over the track. He varies the length of the track and the speed of the ball. Time after time he pays attention to the effect of his actions on the way the ball rolls.
• A girl (3 years, 1 month) plays with a set of buckets. First, she collects balls in a bucket. Next, she places three buckets upside down on top of the bucket filled with balls. She tries to sit on her construction, but the buckets fall over. She then starts moving the balls from one bucket to the other. Finally, she places the buckets on her head.
level 3 Construction: child actively and attentively manipulates an object. In addition, child constructs something in a way that suggests that he or she works according to a plan, the resulting construction consists of several parts.• A boy (3 years, 10 months) works together with his friends in making a construction.
The construction consists of a large pile of sand with a flattened surface. Objects are hidden under the sand and placed on the surface of the pile. He clearly states a plan: “We are building a castle!”
level 4 object replacement: child uses an object to represent another object that is necessary for symbolic play. • A boy (3 years, 5 months) uses a wooden plank to smooth the sand in the sandpit.
He then repeats this action using two planks at the same time. Finally, he puts one of the planks in a vertical manner in a small hole, moves the top of the plank around and makes a “drilling noise”.
Note. In the descriptions of all levels an object is defined as any part of a child’s physical environment.
(M=2.48, SD=.50) to post-observations (M=2.37, SD=.30) (see Figure 2). Two effect sizes were computed. First, the mean post exploratory play scores of the experimental and control groups were compared using pooled standard deviations, resulting in an effect size of .41. Next, an effect size was calculated over the difference scores (post exploratory play scores –pre exploratory play scores) of the experimental group; resulting in an effect size of .76. These effect sizes indicate an average and a large effect (Cohen, 1988).

26 | Chapter 2
figure 2. Mean exploratory play levels during pre- and post-observations for the experimental and control groups for non-matched and matched samples. Error bars indicate standard errors.
As shown in Figure 2, mean exploratory play levels during pre-observations were higher for the control group than for the experimental group, t(26)=-2.31, p=.03. One could argue that the difference in mean initial exploratory play level between the experimental and control groups caused the difference in improvement in exploratory play level from pre- to post-observations between both groups (regression to the mean). To address this issue we matched the experimental group with the control group on initial exploratory play level and number of subjects (experimental group: M=2.34, SD=.33, n=7; control group: M=2.31, SD=.41, n=7). A two-sided t-test showed that the mean exploratory play level differed between the two matched groups on the post-observations, t(12)=2.9, p=.013 (see Figure 2).6 These results suggest that regression to the mean cannot explain the difference in improvement between the experimental and control group completely.
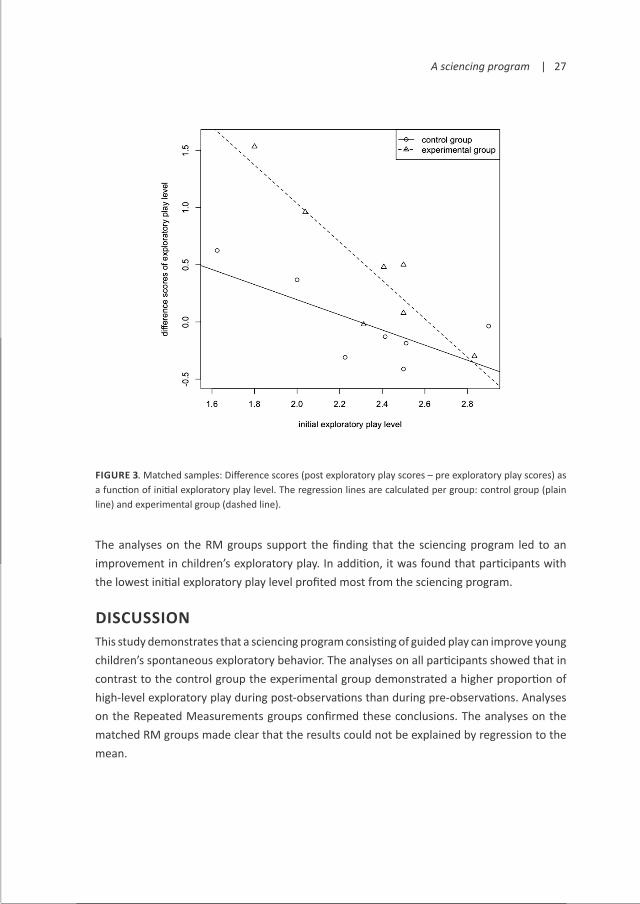
Next, we investigated the effect of initial exploratory play level on the increase in exploratory play level as a result of the sciencing program in the matched samples. We performed an ANOVA with initial exploratory play level and group (control group, experimental group) as between-subjects factors on the difference scores (post exploratory play scores – pre exploratory play scores). As expected, main effects of group (F(1, 10)=7.24, p=0.02) and initial exploratory play level (F(1, 10)=26.55, p=0.00) were found.7 The interaction effect, group x initial exploratory play level, indicates that the participants with the lowest initial exploratory play level profited most from the program (F(1, 10)=5.02, p < 0.05) (see Figure 3).
A sciencing program | 27
figure 3. Matched samples: Difference scores (post exploratory play scores – pre exploratory play scores) as a function of initial exploratory play level. The regression lines are calculated per group: control group (plain line) and experimental group (dashed line).
The analyses on the RM groups support the finding that the sciencing program led to an improvement in children’s exploratory play. In addition, it was found that participants with the lowest initial exploratory play level profited most from the sciencing program.
discussionThis study demonstrates that a sciencing program consisting of guided play can improve young children’s spontaneous exploratory behavior. The analyses on all participants showed that in contrast to the control group the experimental group demonstrated a higher proportion of high-level exploratory play during post-observations than during pre-observations. Analyses on the Repeated Measurements groups confirmed these conclusions. The analyses on the matched RM groups made clear that the results could not be explained by regression to the mean.

28 | Chapter 2
These quantitative findings are in line with constructivist theories and earlier qualitative studies that showed that guided play leads to exploratory behavior at a higher level. (Aubrey et al., 2003; Peterson & French, 2008). This is especially the case for children with low initial exploratory play levels, because it was found that they profited most from the sciencing program. This finding is consistent with work concerning social influences on young children’s exploratory behavior (Henderson, 1984).
An unexpected finding in the analyses on all participants was the decline in exploratory behavior in the control group. This finding may be due to the fact that the sandpit toys were relatively novel to the children at pre-observations compared to at post-observations. This explanation is in line with observations in qualitative studies that young children easily loose interest in play objects when they don’t get attention from an adult (Peterson & French, 2008; Pramling Samuelsson & Pramling, 2009).
In this study we did not focus on the effectiveness of specific characteristics of the program, such as the specific science subjects or the specific aspects of the scaffolding behavior of the teacher (Kontos, 1999; Sylva et al., 2007). To say something about the relative effectiveness of these factors, new studies are needed. In line with that choice, we did not measure children’s behavior related to the specific science subjects, but focused on behavior at a more general level: children’s exploratory behavior, including non-anticipated behavior. A related point is that this study does not answer the question whether the effects of the sciencing program were directly caused by the guided-play, or indirectly by the effects of the program on the regular teachers. The regular teachers of the experimental group saw the science teachers at work and were encouraged to incorporate the science themes in their daily routines while the regular teachers of the control group were not stimulated in these ways. However, if this alternative explanation is correct, this can be considered a success of the program: influencing the behavior of adult teachers might be at least as difficult as influencing the behavior of young children. Note that the pre- and post-observations have been performed without any scaffolding teacher being present; the effects of the program and possibly of the altered behavior of the regular teachers, were visible in children’s spontaneous exploratory play.
Finally we would like to point at the relevance of this study for practitioners. As we showed that at a sciencing program can be a valuable addition to young children’s curriculum, we plea for more attention in the initial and in-service training of teachers for science related subjects. Our study shows that the curiosity of young children in natural phenomena and in how things work, needs to be supported by playful and scaffolding teachers. Probably, this is especially true for children with a low level of exploratory behavior.

A sciencing program | 29
acknowledgementsThis study was funded by the Curious Minds program, which is supported by the Dutch Ministry of Education, Culture and Science, and the Platform Bèta Techniek. The research of Maartje Raijmakers was partly funded by a VIDI grant (016.075.336) from the Dutch Organization for Scientific Research (NWO). We would like to thank the children, parents, daycare teachers and Anna Jonkman from the Stek daycare centers. In addition, we would like to thank Arjan Berkeljon, Vincy Driest, Valerie Fictorie, Lieske Kraaijeveld, Margje Lettinga, Raimer Rodrigues Rezende, Jet Vleeming, Cathelijne Vomberg and Petra de Waard for their help in performing the science program, collecting the data and coding the videotapes. We would like to express appreciation to Nico Notebaart, René van de Belt and Coos Hakvoort for their audiovisual advice and technical support. Finally, we would like to thank Hilde Huizenga for statistical advice, and Han van der Maas and Dorothy Mandell for their comments on an earlier draft of the paper.
30 | Chapter 2
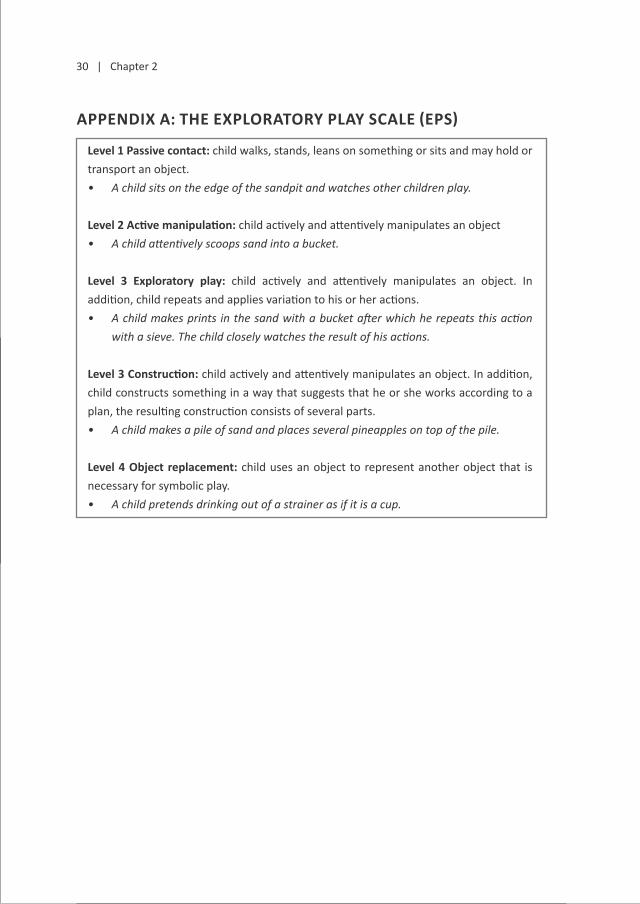
APPendix A: the exPlorAtory PlAy sCAle (ePs)
level 1 Passive contact: child walks, stands, leans on something or sits and may hold or transport an object.• A child sits on the edge of the sandpit and watches other children play.
level 2 Active manipulation: child actively and attentively manipulates an object• A child attentively scoops sand into a bucket.
level 3 exploratory play: child actively and attentively manipulates an object. In addition, child repeats and applies variation to his or her actions.• A child makes prints in the sand with a bucket after which he repeats this action
with a sieve. The child closely watches the result of his actions.
level 3 Construction: child actively and attentively manipulates an object. In addition, child constructs something in a way that suggests that he or she works according to a plan, the resulting construction consists of several parts.• A child makes a pile of sand and places several pineapples on top of the pile.
level 4 object replacement: child uses an object to represent another object that is necessary for symbolic play. • A child pretends drinking out of a strainer as if it is a cup.

A sciencing program | 31
APPendix b: PlAy objeCts Provided to the PArtiCiPAting dAyCAre CentersPlastic materials in primary colors
• Buckets• Scoops• Sieves in different sizes• Stack and nest cups in different sizes• Letter-like building elements that can be attached to each other, in different sizes• Balls in different sizes• Balls with holes
Natural materials• Pineapples in different sizes• Seashells in different sizes• Twigs in different sizes• Feathers
Other materials• PVC tubes in different sizes (different diameters, same length)• Wooden planks that could serve as holders to place PVC tubes in (semi-) horizontal
positions in the sand• Wooden rings that could serve as bucket lids through which objects could be thrown

32 | Chapter 2
notes1. Appendix A gives short descriptions and
examples of all EPS levels. Table 1 in the results
section gives short descriptions and examples
of observed high-level exploratory play (EPS
level 3 and 4).
2. Appendix B gives a complete list of the provided
play objects.
3. An alpha level of .05 was used for all statistical
tests.
4. One could argue that in an exploratory play scale,
level 4 (object replacement) is not per se higher
than level 3 (exploratory play/construction).
Therefore we repeated the analysis of the data
with recoding level 4 to level 3. The results are
comparable with the original scoring: In the
experimental and control groups, significant
associations between exploratory play and time
were found, χ2(2)=22.06, p=.00 (experimental
group), χ2(2)=14.79, p=.00 (control group) and
these associations were in opposite directions.
5. In the analyses in this study we did not model
dependencies between participants. This type
of modeling would only have been possible
with a bigger sample of daycare centers.
6. These analyses were also repeated with
recoded data (See footnote 4). The results
for the same matched sample remain equal:
experimental and control group are equal on
pre-observations (experimental group: M=2.20,
SD=.08, n=7; control group: M=2.21, SD=.11,
n=7). Scores for the post-observations differ
between experimental and control group,
t(12)=2.9, p=.01 (two-sided).
7. The main effect of initial exploratory play level
is expected on the basis of regression to the
mean.

chaPter 3
The Exploratory Behavior Scale: Assessing young visitors’ hands-on behavior in science museums
Van Schijndel, T. J. P., Franse, R. K., & Raijmakers, M. E. J. (2010). The Exploratory Behavior Scale: Assessing young visitors’ hands-on behavior in science museums. Science Education, 94, 794–809.

34 | Chapter 3
abstractIn this paper we introduce the Exploratory Behavior Scale (EBS), a quantitative measure of young children’s interactivity. More specifically, the EBS is developed from the psychological literature on exploration and play and measures the extent to which preschoolers explore their physical environment. A practical application of the EBS in a science museum is given. The described study was directed at optimizing parent guidance in order to improve preschoolers’ exploration of exhibits in science center NEMO. In experiment 1 we investigated which adult coaching-style resulted in the highest level of exploratory behavior at two exhibits. In experiment 2 we investigated if informing parents about an effective way of coaching influenced preschoolers’ exploratory behavior at two exhibits. The results of the study demonstrate the added value of the EBS in visitor behavior research: compared to existing global measures of visitor interactivity, the EBS adds information about the quality of the hands-on behavior. Compared to existing detailed measures of visitor interactivity, the EBS has the advantage of being applicable in different museum settings and enabling comparisons between exhibits or exhibitions. In addition, the EBS allows for quantification of unanticipated behavior.
introductionInteractivity is seen as a vital characteristic of science museums (Allen, 2004). Visitors spend more time at interactive exhibits than at non-interactive exhibits (Richards & Menninger, 2003 in Allen, 2004; Sandifer, 2003) and interactivity is associated with better learning and recall of information (Borun & Dritsas, 1997 in Allen, 2004; Madden, 1985 in Ramey-Gassert, Walberg & Walberg, 1994; Schneider & Cheslock, 2003 in Allen, 2004). The effects of different aspects of interactivity on visitor behavior and learning have been studied (e.g. Afonso & Gilbert, 2007; Sandifer, 2003). For example, Sandifer (2003) found that open-endedness and technological novelty influence the amount of time visitors spend at exhibits. Interactivity is an important ingredient in adult visitors’ science museum experience, but it is an indispensable part of young children’s visit. Hands-on experiences are considered crucial for this group’s science learning (French, 2004; Gelman & Brenneman, 2004; Neuman, 1971). The emphasis on interactivity with respect to young children, calls for a strong need to investigate this age group’s on-exhibit behavior. The aim of this paper is to introduce the Exploratory Behavior Scale (EBS), a quantitative measure of preschoolers’ hands-on behavior that allows for assessing the quality of children’s exploration in different museum settings. Before introducing the EBS, we will present a brief overview of frequently used measures for visitor behavior in science museums.
Research with regard to visitor behavior in science museums is also described as research into visitors’ learning-related behaviors (McManus, 1987), visitors’ learning-associated behaviors (Boisvert & Slez, 1994) or visitors’ learning agenda’s (Dierking & Falk, 1994).
The Exploratory Behavior Scale | 35
Global time-based measures of visitor behavior have been used in the majority of studies that concern visitor behavior at the exhibit level (e.g. Boisvert, 1994, 1995; Edu, Inc., 2004, in Brody, Bangert & Dillon, 2008; McManus, 1987; Randi Korn & Associates, Inc., 2002 in Brody et al., 2008; Sandifer 1997, 2003). Frequently used measures in these studies are the average time visitors spend at an exhibit (holding time) and the percentage of visitors that stop at a certain exhibit (attraction power). Other well-known measures concern the time visitors talk to each other at exhibits, the time they interact or play with exhibits and the time they spend reading at exhibits. These measures have been used to compare different science museums, exhibitions and exhibits (e.g. Boisvert, 1995; Sandifer, 2003) and the behavior of different visitor groups (e.g. Boisvert, 1994; McManus, 1987; Sandifer, 1997). In most of these studies, descriptive or correlational research methodologies have been used and data has been gathered by means of observations or tracking software (see Brody et al. (2008) for an overview of research methodologies and data acquisition methods in the field of informal science learning). It can be concluded that these time-based measures have the advantage of being non exhibit-specific, enabling quantitative comparisons between museum settings. These measures, however, provide little information about the quality of visitor behavior.
In other studies, more detailed measures of visitor behavior have been used. Instead of solely recording the time visitors’ talk to each other at exhibits, the content of visitors’ conversations has been analyzed. These analyses have been used to investigate the use of specific exhibits (e.g. Meisner et al., 2007; Tunnicliffe, 2000) and to investigate how parents guide their children’s science learning (e.g. Ash, 2003; Fender & Crowley, 2007; Siegel, Esterly, Callanan, Wright & Navarro, 2007). More detailed measures for physical interactivity have also been applied. Instead of solely recording the time visitors interact with exhibits, the patterns of interaction individuals have with exhibits have been analyzed. This technique has been done in ethnographical studies (e.g. Meisner et al., 2007), but also in a more quantitative manner (e.g. Crowley et al., 2001; Fender & Crowley, 2007). Crowley et al. (2001) investigated the effect of parent and peer presence on four- to eight-year-olds exploration of the zoetrope exhibit at the Children’s Discovery Museum in San Jose, California.1 To make a detailed analysis of children’s exploratory behavior, two main operators of the zoetrope exhibit were defined: spinning the cylinder or not spinning the cylinder (rotation state) and looking through the slots or looking over the top (observational vantage point). An evidence space of the exhibit consisting of four categories was defined by the factorial combination of rotation state and observational vantage point. By means of observations, it was determined if children viewed each category of evidence and if they viewed combinations of categories of evidence. In a follow-up study, Fender and Crowley (2007) used the same measure to investigate the effect of parent explanation on three- to eight-year-olds’ exploration of the zoetrope exhibit at the Children’s Museum of Pittsburgh. In most of the studies in which detailed measures of visitor behavior have been used, descriptive, correlational or ethnographical research

36 | Chapter 3
methodologies have been applied and data has been gathered by means of observations (Brody et al., 2008). The detailed measures provide valuable information about the quality of visitors’ behavior; visitors’ exploration of exhibits, understanding of exhibits, inquiry skills, and patterns of social interaction. The majority of these measures, however, do not allow for comparison across museum settings because of their exhibit-specific nature (Crowley et al., 2001; Fender & Crowley, 2007; Tunnicliffe, 2000).
Based on this review, it can be concluded that a tradeoff has to be made between being able to measure visitor behavior in different museum settings and being able to describe visitor behavior on a more detailed level. With regard to measuring interactivity, holding times or interaction times allow quantitative comparisons between exhibits and exhibitions, but do not provide information on how and on which level visitors interact with exhibits. The measure Crowley et al. (2001) used for interactivity, on the other hand, gives insight in how visitors manipulate the zoetrope exhibit and what kind of evidence they encounter, but the use of this measure is restricted to this one exhibit and does not include behavior that was not anticipated. The tradeoff between global and detailed measures is more difficult when focusing on young visitors’ behavior because the assumptions about the informative values of both types of measures are less straightforward for this age group. With regard to the global measures, it is often assumed that longer holding times correspond to more opportunities to learn or even to more learning taking place (Serrell, 1998; Smith, 1990 in Ramey-Gassert, Walberg & Walberg, 1994). However, especially for the preschool age group, this assumption is not necessarily the case. Children are known to be inefficient in the exploration of evidence (e.g. Schauble, 1996). Preschoolers tend to manipulate materials in the same manner for relatively long periods of time. Therefore, a more detailed analysis of children’s hands-on behavior will yield more information about preschoolers’ opportunities to learn than the time-based measures. With regard to the detailed measures of visitor behavior, measures relying on visitors’ language use have less informative value for the young visitor group than for older visitor groups. Preschoolers’ verbal utterances cannot be considered an accurate reflection of their level of reasoning as logic-in-action precedes verbal reasoning in young children’s development (Gifford, 2004; Inhelder & Piaget, 1964; Singer, 2002). Large individual differences in language skills exist in the preschool age range and a measure of children’s reasoning relying on verbal utterances could easily be confounded with children’s language skills. Therefore, focusing on preschoolers’ actions will yield more information about this age group’s reasoning than focusing on their verbalizations.
In this paper we introduce the Exploratory Behavior Scale (EBS), a quantitative measure of preschoolers’ hands-on behavior that allows for assessing the quality of children’s exploration in different museum settings. The EBS is focused on measuring preschoolers’ exploration of their physical environment, as from a psychological point of view exploration is a key concept in the description of young children’s behavior. In the next part of this paper, we will describe the EBS and its psychometrical characteristics. Next, we will give an example of a study in

The Exploratory Behavior Scale | 37
which the EBS is used. Finally, we will discuss the added value of the EBS compared to existing measures of interactivity on the basis of the results of the described study.
the exPlorAtory behAvior sCAleThe Exploratory Behavior Scale (EBS) is developed from the psychological literature on exploration and play. Exploration is considered an important factor in children’s cognitive and social development (e.g. Rusher, Cross & Ware, 1995; Weisler & Mc Call, 1976) and a universal activity in play from infancy into childhood (Sutton-Smith, 1975). The exploration process has been described as changing with age; exploration becomes increasingly sophisticated with age and certain phases of the exploration process are reduced or eliminated with maturation (e.g. Zaporozhets, 1970 in Forman & Kuschner, 2005; Weisler & McCall, 1976). For the preschool age group that we developed the EBS for, we are interested in the quality of their exploratory behavior, i.e. the quality of their interaction with the physical environment. For infants, the quality of exploratory behavior has been found to correlate with measures of cognitive ability (Jennings, Harmon, Morgan, Gaiter & Yarrow, 1979). Additionally, infant exploratory competence has been found to correlate with caregiver stimulation and responsiveness (Belsky, Goode, & Most, 1980; Fortner-Wood & Henderson, 1997). To define the EBS levels, process descriptions of exploration as well as existing measures of exploration and play were examined in order to distinguish aspects of behavior that could be included in the scale. Two behaviors were found to be prominent in exploration measures as well as in play measures: manipulation of the physical environment and sustained attention (Dunn, Kontos & Potter, 1996; Rubenstein & Howes, 1979; Smilansky, 1968; Weisler & McCall, 1976). The time spent manually or visually investigating new objects or environments is often taken as a measure of exploration (Weisler & McCall, 1976). Furthermore, in play scales manipulation of the physical environment can be performed in the presence of sustained attention (active use of objects) or in the absence of sustained attention (passive use of objects) (e.g. Dunn, Kontos & Potter, 1996).
However, manipulation and sustained attention only give a limited specification of how children explore the environment. Therefore, to distinguish high-level exploratory behavior, another aspect of behavior that is part of the exploration process was employed: repetition with variation (Forman & Kuschner, 2005; Lindahl & Pramling Samuelsson, 2002). For instance, Forman and Kuschner (2005) refer to this kind of behavior when mentioning 4- and 5-year-olds who transform objects, for example they rotate or remove the mirrors of a periscope, in order to discover the workings of an object. This compound of behaviors, manipulation, sustained attention and repetition with variation, comprises high-level exploratory behavior and could be compared to scientific-reasoning-in-action. An example of high-level exploratory behavior is a young visitor of a science museum who actively manipulates the exhibit “Rolling, Rolling, Rolling” (see Figure 1A) by rolling a cylinder down different tracks and who attentively observes the effect of the different surface materials of the tracks on the

38 | Chapter 3
speed of the cylinder. With this high-level exploratory behavior, the child creates exemplars of exhibit-specific phenomena; in this case that a cylinder rolls faster over a smooth surface than over a rough surface. The sequence of behaviors that Crowley et al. (2001) refer to as combinations of categories of evidence at the zoetrope exhibit, would also be considered high-level exploratory behavior. For instance, a child could spin the cylinder and look over the top and then spin the cylinder again and look through the slots. It is important to note that high-level exploratory behavior is not necessarily related to the purposes of the exhibit. If a child applies variation by rolling cylinders up and down the ramp or by investigating how and if a square object can also roll down the ramp, this behavior would be seen as high-level exploration (see also Discussion).
The EBS was designed to have three levels of increasingly extensive exploration of the physical environment: 1) passive contact, 2) active manipulation, and 3) exploratory behavior.2 Table 1 gives a short description of the EBS levels and examples of children’s behavior. The complete EBS and accompanying coding procedures are described in a technical report (Van Schijndel, Singer & Raijmakers, 2007).
Psychometrical characteristics of the exploratory behavior scaleFor an observational instrument to be a useful measure of behavior, different observers need to be able to apply the instrument in the same manner and rate behavior in similar ways. To assess the consistency of scoring between multiple observers, inter-observer reliabilities and Kappas are calculated. For the Exploratory Behavior Scale (EBS), this has been done in different settings. Studies in science museum settings yielded percentage agreements of 81% (Dreef & Eriksson, 2007) and 92% (Van Beek, 2008). Matching Kappas were respectively 0.63 and 0.81. According to Sattler (2002), Kappa values of 0.40 to 0.69 indicate fair to good agreement. Studies in childcare and development settings, in which an extended version of the EBS was used, yielded average percentage agreements of 78% (Van Schijndel, Singer, Van der Maas & Raijmakers, 2010 / Chapter 2) and 82% (Tiemersma & Van den Berg van Saparoea, 2007).2 Matching Kappas were 0.56 and 0.64. The test-retest reliability of the extended version of the EBS was established in a childcare and development setting: correlations between two administrations of r=0.53, p<0.10 and r=0.74, p<0.01 have been found (Tiemersma & Van den Berg van Saparoea, 2007). It is typically expected that on average, older children show a higher level of exploratory behavior than younger children (Zaporozhets, 1970 in Forman & Kuschner, 2005). Therefore, a significant positive relation between EBS level and age can be considered evidence for the validity of the EBS. In a childcare and development setting, a correlation of r=0.43, p<0.05 has been found between mean EBS level (extended version) and age (Van Schijndel et al., 2010 / Chapter 2).

The Exploratory Behavior Scale | 39
A: the exhibit “rolling, rolling, rolling” in science center nemo
The exhibit consists of a wooden ramp with three descending tracks: one covered with artificial grass, one covered with carpet and one without covering. Six cylinders are provided: three made out of PVC and three made out of wood. The PVC cylinders are heavier than the wooden ones. The exhibit is designed for children to investigate the effect of track covering (friction resistance) and cylinder weight (gravity) on the speed of the cylinder when it rolls down the ramp (note that the former has an effect and the latter has not).
figure 1. The exhibits “Rolling, Rolling, Rolling” (A) and “Spinning forces” (B) at science center NEMO, Amsterdam.
b: the exhibit “spinning Forces” in science center neMo
The exhibit consists of a chair that can be spun around and two blocks with handles, adapted to children‟s size. The exhibit is designed to investigate how the position of the blocks influences the speed with which a person sitting on the chair spins around. One goes faster when holding the weights close to the body (rotation axis) than when holding the weights far away from the body. A screen next to the exhibit shows a video clip in which a young ice-skater demonstrates the principle to be investigated with blocks similar to those provided at the exhibit.

40 | Chapter 3
A PrACtiCAl APPliCAtion oF the exPlorAtory behAvior sCAle: the eFFeCt oF PArentAl CoAChing on PresChoolers’ hAnds-on behAvior in A sCienCe CenterExhibits in science center NEMO are designed for children from six years and older. However, many families with children in the preschool age group visit NEMO. For this age group, adult guidance is crucial to a successful visit. In several studies, the effects of parent presence on children’s hands-on behavior have been demonstrated (Crowley et al., 2001; Fender & Crowley, 2007). Crowley et al. (2001), for instance, found that four- to eight-year-olds that engaged with an exhibit with their parents explored longer, broader, and on a deeper level than children exploring with peers or by themselves. The researchers concluded that the
table 1. The Exploratory Behavior Scale (EBS): levels of exploratory behavior and examples of children’s behavior at each of these levels at the exhibit “Rolling, rolling, rolling” (see Figure 1).
level 1 Passive contact: child walks, stands, sits or leans on something and may hold or trans-port an object. However, the child does not manipulate the object in an active and attentive manner. • A girl stands on the side of the exhibit and watches other children play.• A girl leans against the exhibit. She holds a cylinder, but does not manipulate it. • A boy walks around the exhibit with his father. They discuss different parts of the
exhibit.
level 2 Active manipulation: child manipulates an object in an active and attentive manner. This implies that the child pays attention to his or her action(s) and the outcome(s) of the action(s). • A boy rolls a cylinder down the ramp and follows the cylinder with his eyes.• A boy attentively hits two cylinders against each other and laughs.• A girl rolls two PVC cylinders down a track and then says: “They are fast!”
level 3 exploratory behavior: child manipulates an object in an active and attentive manner (as Active manipulation). In addition, the child applies repetition and variation to his or her actions. “Repetition” implies that the child repeats an action (several times). “Variation” implies that the child performs different actions with one object or performs the same action with different objects. Actions that clearly differ in degree are also considered different actions. • A girl rolls a wooden cylinder down the track covered with carpet twice after which she
rolls the same cylinder down the track covered with artificial grass.• For instance, a boy rolls a PVC cylinder up and down the ramp several times and varies
the force he exerts on the cylinder.• A boy rolls a wooden cylinder down the wooden track twice after which he rolls a PVC
cylinder down the same track. Note. In the descriptions of all levels of the EBS an object is defined as any part of a child’s physical environment.

The Exploratory Behavior Scale | 41
parent-guided group had more opportunity to learn than the other groups of children. Parents are known to take on qualitatively different roles in interacting with their children in science museums (Brown, 1995; Siegel et al., 2007). Therefore, an important question is what characteristics of parent guidance contribute to children’s optimal exploration of exhibits. Fender and Crowley (2007) investigated the effect of one of those characteristics, parent explanation, on three- to eight-year-olds’ hands-on behavior at an exhibit. Explanation was defined as talk that highlighted causal relations or talk that connected the exhibit to the child’s prior knowledge. In line with their hypothesis that parent explanation does not provide children with procedural assistance, the researchers did not find differences in exploratory behavior between children whose parents did explain and children whose parents did not explain. In the present study, the question which aspects of parent guidance influence preschoolers’ exploration of exhibits has been further investigated.
The aim of the study was to optimize parent guidance in order to improve preschoolers’ exploration of exhibits in science center NEMO. Hence, in experiment 1 we investigated which coaching style resulted in the highest level of exploratory behavior at two exhibits. As observational studies are informative, but not conclusive, the parental roles were performed by trained test leaders and children were randomly assigned to a test leader and coaching style. On the basis of the results of experiment 1, an instructional video was made to inform parents about effective ways of coaching preschoolers in a science museum. Experiment 2 was performed with parents who visited NEMO with their preschoolers. Half of the adults were shown the instructional video and the effect of informing parents on their children’s exploratory behavior was determined. In both experiments the exhibits “Rolling, Rolling, Rolling” (see Figure 1A) and “Spinning Forces” (see Figure 1B) were used. These exhibits were chosen because unlike most exhibits in science center NEMO, they were suitable for the age range of the children that participated in the study. “Rolling, Rolling, Rolling” and “Spinning Forces provided ample opportunities for hands-on behavior, exploratory behavior and adult guidance of the child’s behavior. In addition, a pilot study demonstrated that preschoolers were attracted to the exhibits and physically capable of operating them.
experiment 1: the effect of different coaching styles on preschoolers’ exploratory behaviorParticipants and procedure. Seventy-one four- to six-year-olds (38 girls, 33 boys, M=61 months, SD=7) participated in the experiment. They visited science center NEMO during closing hours with their preschool class. Each child was assigned to one of three test leaders and one of three coaching styles in a random manner, counterbalancing age and gender between the test leaders and coaching styles. The test leader accompanied the individual child to two exhibits, “Rolling, Rolling, Rolling” and “Spinning Forces”, and the child was asked to play at the exhibits by oneself.3 The test leader coached the child in one of the three styles
42 | Chapter 3
she was trained in: the scaffolding, explaining, or minimal style. When using the scaffolding coaching style, the test leader tried to take the child’s investigations to the next level by asking open questions, by acting like she did not understand what was going on and by directing the child’s attention to specific parts of the exhibit. In addition, she challenged the child to verbalize his or her thoughts. For example, at the exhibit “Rolling, rolling, rolling” she could ask: “Does the one on this track go as fast as the one on that track? How is that possible?” When using the explaining coaching style, the test leader gave the child explanation about the exhibit; she named causal connections, explained physical principles underlying the exhibit and connected the experience to the existing knowledge of the child. In addition, she demonstrated the workings of the exhibit. For example, at the exhibit “Rolling, rolling, rolling”, she could say: “The one on this track goes faster, because this track is smoother than the other track.” The minimal coaching style served as the control condition in this experiment. Nothing was explained or demonstrated and no scaffolding took place. When necessary, the test leader encouraged the child to continue playing by making remarks such as “This is a nice game, isn’t it?” Independent of the coaching style, the child was encouraged to keep playing at each exhibit for five minutes. Two observers were trained to score children’s behavior by means of the EBS. The training consisted of observing and describing preschoolers’ behavior at “Rolling, rolling, rolling” and “Spinning forces” and discussing which EBS levels should be assigned to specific behaviors. The observers assessed one child at the time. Per time interval the highest level of exploratory behavior that a child demonstrated within the interval was noted. For “Rolling, rolling, rolling” the used time-interval was 30 seconds and for “Spinning forces” this was 15 seconds.4 In order to determine the inter-observer reliability, 20 percent of time intervals was double-scored. The inter-observer reliability proved to be good: a percentage agreement of 93%, K=0.79 was found.
Statistical approach. In order to compare children’s exploratory behavior at the two exhibits a multivariate repeated measures analysis of variance was conducted with exhibit (“Rolling, rolling, rolling” and ”Spinning forces”) as within-subjects factor on the following three outcome measures: number of seconds a child showed EBS level 1 behavior, EBS level 2 behavior and EBS level 3 behavior.5 To investigate the effects of the different coaching styles, for each exhibit separately a factorial multivariate analysis of variance was performed with coaching style (scaffolding, explaining and minimal style), gender (boy, girl) and test leader (test leader 1, test leader 2 and test leader 3) as between-subjects factors on the same three outcome measures. The between-subjects factor test leader was included in the analyses as a control factor to check if possible effects of coaching style were not explained by differences between test leaders. Post hoc tests with Borferroni corrections were used to further explore found effects.

The Exploratory Behavior Scale | 43
Results. It was found that children’s behavior at the two exhibits differed: the exhibit “Rolling, rolling, rolling” elicited more active manipulation (EBS level 2; F(1,70)=5.10, p<0.05), while the exhibit “Spinning forces” elicited more passive contact (EBS level 1; F(1,70)=25.68 p<0.001; see Figure 2).6 Due to the differences between the exhibits, at each exhibit a different coaching style resulted in the longest period of high-level exploratory behavior. At “Rolling, rolling, rolling” children showed more exploratory behavior (EBS level 3) when they were coached with the minimal style, compared to the explaining style (F(2,53)=7.66, p<0.01; t(23.32)=4.14, p<0.001; see Figure 3A). Apparently children immediately start playing at the exhibit and reached high levels of exploratory behavior by themselves. The adult’s explanation only seemed to interfere with their investigations. At “Spinning forces” children showed more active manipulation (EBS level 2) when they were coached with the scaffolding style compared to the explaining style (F(2,53)=3.84, p<0.05); t(46)=3.73, p<0.01) and more exploratory behavior (EBS level 3) when they were coached with the explaining style compared to the other two coaching styles (F(2,53)=8.73, p<0.01; scaffolding t(24.96)=3.25, p<0.01; minimal t(24.10)=3.35, p<0.01; see Figure 3B). Apparently children did not immediately start playing at the exhibit. They relied on the adult’s explanation and demonstration to figure out what could be investigated at the exhibit and how to do that.
At “Rolling, rolling, rolling” no differences between boys and girls were found. At “Spinning forces” girls were found to show more exploratory behavior (EBS level 3) than boys when coached with the explaining style, but this was a marginal difference (F(2,53)=3.61, p<0.05).
At “Rolling, rolling, rolling” it was found that test leader 2 observed more passive contact (EBS level 1) than test leader 1 (F(2,53)=3.96, p<0.05; t(34.47)=-2.65, p<0.05). However, no interaction between test leader and coaching style was found. Hence, this effect was not expected to influence the results with regard to coaching style as each test leader had performed each coaching style equally often. At “Spinning forces” no differences between the test leaders were found.
Experiment 1 was performed in a relatively controlled situation; children were observed during closing hours of NEMO and parental rolls were played by trained test leaders. Experiment 2 was designed to investigate the possibility of optimizing parent guidance in a natural setting. Therefore, this experiment was performed during opening hours of NEMO and children were coached by their parents.
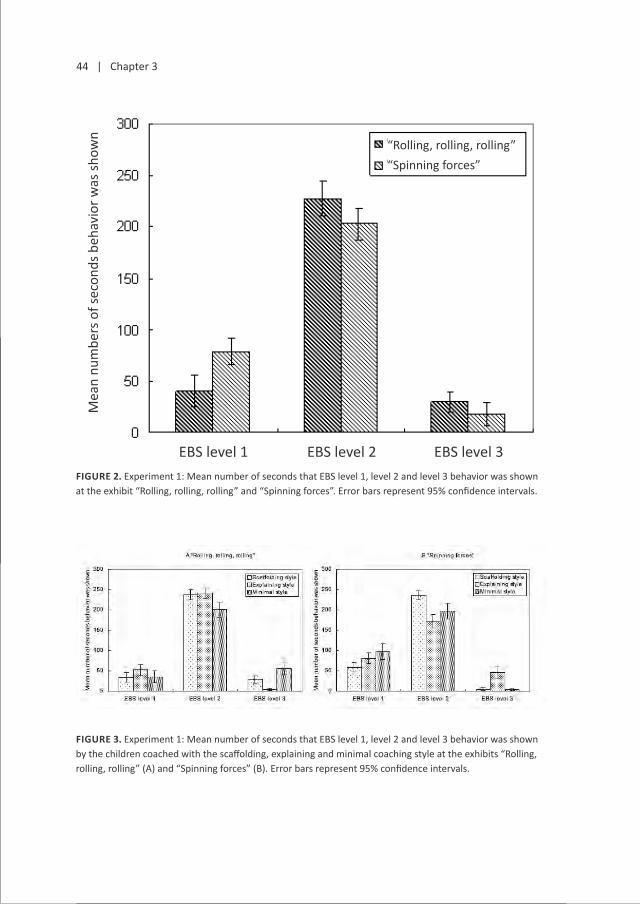
44 | Chapter 3
figure 2. Experiment 1: Mean number of seconds that EBS level 1, level 2 and level 3 behavior was shown at the exhibit “Rolling, rolling, rolling” and “Spinning forces”. Error bars represent 95% confidence intervals.
figure 3. Experiment 1: Mean number of seconds that EBS level 1, level 2 and level 3 behavior was shown by the children coached with the scaffolding, explaining and minimal coaching style at the exhibits “Rolling, rolling, rolling” (A) and “Spinning forces” (B). Error bars represent 95% confidence intervals.
EBS level 1 EBS level 2 EBS level 3
Mea
n nu
mbe
rs o
f sec
onds
beh
avio
r was
show
n
“Rolling, rolling, rolling”“Spinning forces”

The Exploratory Behavior Scale | 45
experiment 2: the effect of informing parents about effective coaching on preschoolers’ exploratory behaviorParticipants and procedure. Seventy-five four- to six-year-olds (31 girls, 44 boys, M=67 months, SD=9) participated in this experiment together with a parent (49 female, 26 male). The sample was representative of the museum population, which is predominantly Caucasian and middle- to upper-class. Parental education was high: 5 parents had low, 19 had middle and 49 had a high educational level (educational levels were available for 73 parents). The parent-child pairs visited science center NEMO during opening hours. Parent-child pairs were assigned to the informed or uninformed condition in a random manner, counterbalancing age and gender of the child over the two conditions. Parents in the informed condition were shown the seven minute video: “How to stimulate your preschooler to exploratory behavior in NEMO”. This video was made on the basis of the results of experiment 1. The film started with a short introduction about science center NEMO, after which an explanation of the exhibits “Rolling, rolling, rolling” and “Spinning Forces” followed. Next, parents were advised how to stimulate their preschooler to engage in exploratory behavior on the basis of three steps: getting to know the material, investigating and drawing conclusions. The advice in the video contained elements of all three coaching styles that had been used in experiment 1, the scaffolding, explaining and minimal style, and was demonstrated through carefully selected video-fragments of parent-child pairs playing at “Rolling, rolling, rolling” and “Spinning forces”. Parents in both conditions (informed and uninformed) were asked to visit the exhibits “Rolling, rolling, rolling” and “Spinning Forces” with their child. Trained observers (who also participated in experiment 1) recognized participants by badges on their shirts and children’s hands-on behavior was scored with the EBS. As in experiment 1, the observers assessed one child at the time. Per time interval the highest level of exploratory behavior that a child demonstrated within the interval was noted. For “Spinning forces” the used time-interval was 15 seconds and for “Rolling, rolling, rolling” this was 40 seconds.4 The inter-observer reliability proved to be good: a percentage agreement of 91%, K=0.83 was found.
Statistical approach. In order to compare children’s exploratory behavior at the two exhibits a multivariate repeated measures analysis of variance was conducted with exhibit (“Rolling, rolling, rolling” and “Spinning forces”) as within-subjects factor on the following three outcome measures: number of seconds a child showed EBS level 1 behavior, EBS level 2 behavior and EBS level 3 behavior.5 To investigate the effects of informing parents about an effective coaching-style, for each exhibit separately a multivariate analysis of variance was performed with condition (informed, uninformed) and gender (boy, girl) as between-subjects factors on the three same outcome measures.
Results. With regard to the differences between exhibits, the results of experiment 1 were replicated: the exhibit “Rolling, rolling, rolling” elicited more active manipulation (EBS level 2; F(1,74)=69.10, p<0.001), while the exhibit “Spinning forces” elicited more passive

46 | Chapter 3
contact (EBS level 1; F(1,74)=13.09 p<0.01; see Figure 4).6 At both exhibits an effect of informing parents about effective coaching was found. At “Rolling, rolling, rolling” children whose parents had seen the instruction video showed more active manipulation (EBS level 2; F(1,71)=8.96, p<0.01) and exploratory behavior (EBS level 3; F(1,71)=5.02, p<0.05) than children whose parents had not seen the video (see Figure 5A). At “Spinning forces” children whose parents had seen the instruction video showed more active manipulation (EBS level 2) than children whose parents had not seen the video (F(1,71)=5.39, p<0.05; see Figure 5B). These results show that informing parents about an effective coaching-style by means of a short instruction-video has a positive effect on children’s exploratory behavior; at both exhibits children of informed parents showed more high-level exploratory behavior. No differences between boys and girls were found at both exhibits.
discussionIn this paper we introduced the Exploratory Behavior Scale (EBS), a quantitative measure of young children’s hands-on behavior. The EBS consists of three levels of increasingly extensive exploration of the physical environment. The EBS has been developed for the preschool age group. Preschoolers are a relatively new visitor group in science museums. However, teaching science to preschoolers is in accordance with young children’s intrinsic motivation to explore the world around them and preschoolers can, to a certain extent, reason scientifically (Eshach & Fried, 2005; French, 2004; Gelman & Brenneman, 2004; Greenes, Ginsburg & Balfanz, 2004). As science museums increasingly emphasize their educational role (Ramey-Gassert et al., 1994; St. John & Perry, 1993 in Dierking & Falk, 1994), there is a great demand for research concerning visitor behavior and learning. Few studies have been published that focus specifically on the preschool age group’s science museum experiences. As the EBS enables quantification of preschoolers’ exploratory behavior at exhibits, it can serve as a useful instrument for generating knowledge about young children’s behavior at science museums. The study that was reported in this paper stressed the importance of parent guidance of preschoolers’ exploration of exhibits. Another important result for science museums is that fact that parent guidance can be influenced in a positive way with little time-investment. Children that were guided by parents who had watched a seven minute instruction-video showed more high-level exploratory behavior that children whose parents had not watched the video. In this study we offered parents advice with regard to structuring the exploration process of their child by dividing it into three steps. At each step in the exploration process they were shown examples on how to stimulate their preschooler’s exploratory behavior. For example, at the second step, investigating, they were encouraged ask open questions to direct the child’s attention to another part of the exhibit and at the third step, drawing conclusions, they were encouraged to let their child summarize what he or she had discovered.

The Exploratory Behavior Scale | 47
figure 4. Experiment 2: Mean number of seconds that EBS level 1, level 2 and level 3 behavior was shown at the exhibits “Rolling, rolling, rolling” and “Spinning forces”. Error bars represent 95% confidence intervals.
figure 5. Experiment 2: Mean number of seconds that EBS level 1, level 2 and level 3 behavior was shown by the informed and uninformed group at the exhibits “Rolling, rolling, rolling” (A) and “Spinning forces” (B). Error bars represent 95% confidence intervals.
EBS level 1 EBS level 2 EBS level 3
Mea
n nu
mbe
rs o
f sec
onds
beh
avio
r was
show
n
“Rolling, rolling, rolling”“Spinning forces”

48 | Chapter 3
The Exploratory Behavior Scale has several advantages compared to other measures of interactivity that have been used to measure visitor behavior in science museums. Regarding its level of detail, the EBS stands between existing global measures of interactivity and more detailed measures. Existing global measures of interactivity, such as holding times or interaction times, do not distinguish between exploratory behaviors of different quality. The EBS on the other hand, gives information about the relative level on which the hands-on behavior takes place. For instance, in the study described in this paper, it was found that the two exhibits differed in the amount of passive contact and active manipulation they elicited while the effects of adult guidance were visible in the amount of active manipulation and exploratory behavior the children demonstrated. In comparison to existing detailed measures of interactivity, such as the measure applied by Crowley et al. (2001) and Fender and Crowley (2007), the EBS has the advantage of being applicable in different museum settings and therefore enabling comparisons between different exhibits or exhibitions. In addition, the EBS not only allows for anticipated behavior to be coded, but also unanticipated behavior can be quantified. For instance, the exhibit “Rolling, rolling, rolling” in NEMO is developed to investigate if the weight of a cylinder (gravity) and the covering of a track (friction resistance) have an effect on the speed of a cylinder when it rolls down the ramp. We expected children to vary their actions by using cylinders of different weights and tracks with different coverings. Children did show the expected behavior, but, in addition, they demonstrated unanticipated behavior that seemed related to their own research questions. For instance, several children not only rolled cylinders down the ramp, but also tried rolling cylinders up the ramp. They varied the force they exerted on the cylinders and used cylinders of different weights. By using the EBS, this unanticipated high-level exploratory behavior was taken into account in the description of the exhibit.
The EBS is an observational measure. The use of observations as a method for studying visitor behavior has apparent advantages. Observations are considered unobtrusive (Falk, 1982 in Sandifer, 1997; Serrel, 1998) and as young children are easily influenced by more obtrusive methods, such as think aloud-protocols, tests of surveys (Bronson, 1994; Ginsburg & Golbeck, 2004), observations can be considered a suitable method for assessing the young age group. A second advantage of observations is that they do not rely on visitors’ language use. This is especially important when studying preschoolers, as their verbal utterances cannot be considered an accurate reflection of their level of reasoning. However, the choice for using observations does also bring about certain methodological challenges. One of the challenges is balancing the amount of detail in the observation scale with the practicality of the scale. For a measure to be applicable in different settings, it is necessary to maintain a certain amount of freedom to interpret visitor behavior. However, this freedom must not affect inter-observer reliability. For the EBS, sufficient inter-observer reliabilities were obtained with observer trainings of reasonable lengths. Another challenge when using observational measures in science museums is dealing with the physical dissimilarities

The Exploratory Behavior Scale | 49
between exhibits. Observational measures making use of interval scoring require decisions on the length of the time intervals; intervals must be long enough to allow for the behavior of interest to take place within the interval, but short enough to allow for a reasonable amount of observations. When comparing exhibits, an important question is whether intervals of different lengths should be used. With regard to the use of the EBS, the amount of time that is necessary to execute EBS level 3 behavior depends on the specific exhibit. In the study that was described in this paper, for this reason time intervals of different lengths were used for the exhibits “Rolling, rolling, rolling” and “Spinning forces”. The question whether to take into account physical dissimilarities between exhibits not only applies to measures making use of interval scoring, but to all quantitative observational measures. For instance, holding times and interaction times are also influenced by the physical characteristics of exhibits. It is important to be aware of this issue when comparing exhibits with quantitative observational measures.
The Exploratory Behavior Scale has many possible uses in the field of visitor research. As was shown in this paper, the EBS enables answering questions with regard to the level of exploratory behavior different exhibits elicit. In addition, it was shown that the EBS can be used to assess effects of different factors on preschoolers’ interaction with exhibits. In this paper the effects of adult guidance were investigated, but other possible factors are the presence of other visitors or the manner in which information about exhibits is conveyed. Besides these topics, another important issue that could be investigated by using the EBS is the relationship between preschoolers’ interactivity and learning.7 Behavioral measures have often been associated with learning. For instance, holding times have been suggested to equal the amount of learning taking place (Serrell, 1998; Smith, 1990 in Ramey-Gassert, Walberg & Walberg, 1994). Few studies, however, have provided evidence for this claim (Sandifer, 1997) and, in spite of the emphasis on hand-on experiences in preschoolers’ science learning (French, 2004; Gelman & Brenneman, 2004; Neuman, 1971), none of those studies has been directed at the preschool visitor group. As children are inefficient in their exploration of evidence (e.g. Schauble, 1996), the relationship between interactivity and learning is less straightforward for the preschool visitor group than for older visitor groups. Therefore, a behavioral measure that takes into account the quality of the interaction, such as the EBS, is more suitable for investigating the relationship between interactivity and learning than measures that do not take into account the quality of the interaction, such as holding times or interaction times. When a child plays on a high EBS level, he or she generates exemplars of exhibit-specific phenomena. If the child will learn about the underlying principles of the exhibit from these phenomena, is a question open for investigation. Playing on a high EBS level does imply practicing process skills, such as observation and systematic manipulation, which are considered crucial in preschool science learning (Ginsburg & Golbeck, 2004, Wasserman, 1988).
50 | Chapter 3
Quantification of behavior, as is done by means of the EBS, enables comparison between situations, but does lead to a loss of information. Ethnographical studies on visitors’ hands-on behavior, such as Meisner et al.’s (2007) study, generate richer and more detailed descriptions of behavior than studies in which quantitative approaches are adopted. Therefore, we recommend the EBS be used in combination with other measures. This recommendation is in line with Brody et al.’s (2008) advice for the use of a variety in research methodologies and data acquisition methods in assessing informal science learning. In terms of the overview of methodologies and methods Brody et al. (2008) propose, the EBS is typically used when adopting descriptive, correlational or experimental research methodologies. These methodologies could complement ethnographical or case study methodologies. The data acquisition method of the EBS, observation, could also be paired with other data acquisition methods, such as interviews or surveys. This combining of methodologies and methods could result in a better view of children’s interactivity in science museums.
acknowledgementsThis work was funded by the Dutch Organization for Scientific Research (NWO) and the Dutch Curious Minds program, which is supported by the Ministry of Education, Culture and Science and Platform Bèta Techniek. We would like to thank children and parents for their enthusiasm in participating in the studies. Special thanks to the children and parents who were featured in the instructional video. We thank students and student-assistants Lineke van Beek, Karin den Hartog, Linda Heuft, Mirjam Provoost, and Marian Trap for their help in collecting the data. We thank Joris Smaling, Ruben Bulsink en Jomme Keller for their assistance in making the instructional video. We would like to express appreciation to Nico Notebaart and René van de Belt for their audiovisual advice and technical support. We thank Dorothy Mandell and Bianca van Bers for comments on an earlier draft of the paper. Finally, we would like to thank Wouter Weeda for statistical advice.

The Exploratory Behavior Scale | 51
notes1. The zoetrope is an animation device that
produces the illusion of motion through a
stroboscopic effect involving persistence of
vision and the Phi phenomenon (Crowley et al.,
2001).
2. The EBS consists of three levels. The Exploratory
Play Scale, that has been used in childcare and
development settings, is an extended version
of the EBS. The Exploratory Play Scale consists
of four levels; construction and pretense play
are incorporated into this scale (Van Schijndel,
Singer, Van der Maas & Raijmakers, 2010).
3. The order in which the child and test leader
visited the exhibits was not counterbalanced.
4. Time-intervals of different lengths have been
used at the two exhibits. The length of the
intervals was determined on the basis of the
time it took to execute EBS level 3 behavior
at the exhibits. As (non-systematic) pilot
observations showed that children needed
more time to demonstrate EBS level 3 behavior
at “Rolling, rolling, rolling” than at “Spinning
forces”, it was decided to use larger time
intervals at the former exhibit than at the latter
exhibit.
5. The dependent variables in the reported
analyses of both experiments are based on
the number of seconds instead of the number
of intervals that behavior of a particular EBS
level was shown at the exhibits. The number
of seconds was obtained by multiplication of
the number of intervals with the number of
seconds within a time interval. The number
of seconds informs the reader about the
respective holding times at each level of
exploratory behavior for the different groups at
6. “Rolling, rolling, rolling” and “Spinning forces”.
Note, however, that as a result of the interval
scoring, one cannot assume that when in the
paper mentioning is made of a (mean) number
of seconds that behavior on a particular EBS
level was shown, the child demonstrated this
behavior each and every second.
7. The choice to use dependent measures based
on seconds enabled comparison of the two
exhibits with regard to the level of exploratory
behavior that they elicit. However, differences
in exploratory behavior between exhibits have
to be interpreted with care; it has to be kept
in mind that the dependent measures used at
“Rolling, rolling, rolling” were based on longer
time intervals than the dependent measures
used at “Spinning forces”. Nevertheless, we
do not expect the differences between the
exhibits that were found in both experiments
to be a result of the use of intervals of different
lengths. Differences were found in the amount
of EBS level 1 and EBS level 2 behavior the
exhibits elicited. Because of the short period
of time that is needed to execute EBS level 2
behavior, it is unlikely that the relatively short
time interval that was used at “Spinning forces”
caused less EBS level 2 behavior to be scored
at the exhibit than when a longer time interval
would have been used.
8. In this discussion we focus on cognitive learning
outcomes (Brody et al., 2008) as a result of a
visit to a science museum. Although we do
acknowledge the importance of affective
learning outcomes (Brody et al., 2008), such as
the development of curiosity, interest, positive
feelings and attitudes, discussing those would
go beyond the scope of this paper.


chaPter 4
Children’s mental models of prenatal development
Van Es, S. E., Van Schijndel, T. J. P., Franse, R. K., & Raijmakers, M. E. J. Children’s mental models of prenatal development. Manuscript submitted for publication.
54 | Chapter 4
abstractChildren’s thinking about prenatal development requires reasoning about change that cannot be observed directly. How do children gain knowledge about this topic? Do children have mental models or is their knowledge fragmented? In Experiment 1, results of a forced-choice questionnaire about prenatal development filled in by 6-13 year olds’ (N=317) indicated that children do have coherent, grade-related, theories about early shape of the fetus, but not about bodily functions. Coherence of the mental models was enhanced by a preceding generative task. Children’s mental models were in agreement with reasoning about natural transformations (Rosengren et al., 1991) and constraints in representational flexibility (Karmiloff-Smith, 1992). In Experiment 2, an open-question interview was administered to 6-12 year old children (N=37). The interview resulted in incoherent responses that were not grade related. This study contributes to a deeper understanding of the effects of different methodologies being used in the area of mental models.
introductionChildren gain a great deal of knowledge about the world around them during childhood (Carey, 1985). For example, children experience gravity with their body, they observe objects falling down, they may be told about gravity as a force, and they may see movies about weightless astronauts in space. To integrate some of this knowledge into a coherent, not necessarily scientifically correct, concept of gravity is known to be an extremely difficult task. The possible sources of this knowledge vary between topics (such as gravity, floating and sinking, the shape of the earth) and between children, depending on age and culture (e.g., Springer, 1999; Harris & Koenig, 2006; Gelman, 2009). A fundamental question regarding each topic is whether children do form coherent ideas, i.e. mental models, or whether their knowledge about the topic remains fragmented until they learn about a scientific concept. To gain a better understanding of knowledge development in general, it is important to gain a better understanding of how the development of knowledge takes place for specific topics.
The aim of the present study is to examine the development of children’s knowledge about prenatal development. Children may have multiple sources of knowledge about prenatal development, such as facts about prenatal development that are being told, pictures or movies from a fetus in a pregnancy book, or knowledge about the development of other living things including themselves. In naïve biology, most researchers state that children develop some coherent ideas, although they may disagree about the origin of these ideas. Some researchers link innate predispositions to the early formation of biological theories (Gelman & Hirschfeld, 1990; Keil, 1992; Keleman, 1998; Mandler & McDonough, 1993). Other researchers emphasize the importance of experience (Au & Romo, 1999; Carey 1985; Hatano & Inagaki, 1994; Inagaki, 1997; Springer, 1999) and state that the main principle for theory formation is the acquisition of some factual knowledge combined with some key inferences from this knowledge.

Mental models of prenatal development | 55
The literature on children’s naïve ideas about prenatal development is scarce. Most studies focus on either conception (e.g. Bernstein & Cowan, 1975) or birth models (e.g. Nagy, 1953; Kreitler & Kreitler, 1966). Discussing the creation of babies, Kreitler and Kreitler (1966) argued that children’s (aged 4;0 to 5;6) views are based on three theories: (1) the baby is created in the mother’s belly from the food she eats; (2) the baby has always existed in the mother’s belly; or (3) the baby is swallowed by the mother. The more specific topic of prenatal development has rarely been focused on, however. Zoldosova and Prokop (2007) presented a study with a small population that included a qualitative analysis of drawings and structured interviews. They concluded that four broad categories existed in children’s drawings about prenatal development: 1) drawings of a fetus without development, 2) drawings of a pregnant woman with a fetus in her belly, but without development, 3) drawings of a pregnant woman with a developing fetus and 4) drawings of pregnancy development (without further specifying what development means). Furthermore, children showed large variation in the body parts that they drew. For example, 70% (N=20) of the children drew an umbilical cord, equally distributed over age (1st – 4th grade). From the interviews only qualitative observations were reported, e.g. that children had very limited knowledge about the fetus’ insides although the older children mentioned the umbilical cord in the context of food uptake.
Two additional topics in naïve biology are of particular interest for the present study: children’s understanding of biological growth and transformations, and children’s understanding of bodily functions. Preschool-age children already have naïve ideas about biological growth (Carey, 1985; Inagaki & Hatano, 2004; Gottfried, 2005). Using a forced-choice experimental paradigm, Rosengren, Gelman, Kalish, and McCormick (1991) showed that preschoolers’ (starting at the age of 3) ideas about natural transformations are coherent. They understand that animals get larger and not smaller with age, but only older children and adults accept rather dramatic changes of color and shape. Reasoning about human insides is an established and larger area of research (e.g., Gellert, 1962; Carey, 1985), which concerns the type of explanations children give for bodily phenomena, for example: intentional, vitalistic, or mechanical causality (Inagaki & Hatano, 2004; Hatano & Inagaki, 1999). In order to reason about the changes in bodily functions during prenatal development, children should understand that some bodily functions are important for staying alive. Several studies (Gellert, 1962; Jaakola, 1997) show, by using interviews, that preschoolers (4-6 years) know that humans need to breath air, to eat, and to drink to stay alive. However, these studies also show that children have very little knowledge about human insides, such as the lungs and the digestive system. Large part of the development of knowledge about the mechanistic causality of people’s insides takes place in later childhood until adulthood (Morris, Taplin & Gelman, 2000).
One important way of reasoning about unknown aspects of prenatal development might be by projecting known properties from other living things, that is, from postnatal humans,

56 | Chapter 4
animals, or plants. Inagaki and Hatano (1996; Hatano & Inagaki, 1994; Inagaki & Hatano, 2004) conclude that at the age of five most children have an integrated category for living things, that is, for animals and plants together. Five-year old children report that growing, taking food/water, and aging/dying are similar phenomena for animals and plants.
The literature shows that children have some factual knowledge about a newborn, about the shape of its body and about the importance of its bodily functions, such as eating, drinking, and breathing. Hence, if a child predicts some properties of prenatal bodily shape and bodily functions the child accepts the transformations of these fetal properties into the properties of a newborn. However, the ability of children to modify their concepts, such as their concept of a newborn, is believed to be dependent on the flexibility of their internal representations. In her representational redescription (RR) theory Karmiloff-Smith (1990) describes the acquisition of knowledge through sequential phases, starting with a representation of knowledge in a procedural, implicit way, followed by re-representations at different levels of abstraction. According to RR theory, the representational flexibility is dependent on the level of representation. This theory has found support in several areas of cognitive development, such as language, mathematics, and physics (Karmiloff-Smith, 1992, Critten, Pine & Steffler, 2007; Hollis & Low, 2005). The sequence of phases is found to be domain general. However, the individual level of representational flexibility is believed to differ between specific topics (i.e., micro domains).
Karmiloff-Smith (1990; Spensley & Taylor, 1999) used children’s drawings to explore representational flexibility. She focused on the constraints children have in their representational flexibility by looking at what changes children make in their representation of a concept (e.g., a house or a human being), when asked to draw a non-existing concept (e.g. a fake house or a fake human being). Karmiloff-Smith’s results of the ‘non-existing human being’ task, show that changes introduced by the younger children (aged 4-6) mainly involved deletions and changes in size and shape, whereas older children (aged 8-10) often changed position and orientation of elements and added elements from other conceptual categories. Recent discussions on the RR theory have mainly focused on whether the scores on the drawing task are directly related to procedural rigidity of drawing skills and/or due to inflexibility of mental representations (Barlow, Jolley, White & Galbraith, 2003; Picard & Vinter, 2007).
Based on former research in naïve biology and taking into consideration RR theory (Karmiloff-Smith, 1990), we predict children to have the following mental models of prenatal development. I) A null model of prenatal development would be no change, that is, a fetus has the same shape as a newborn and has equivalent bodily functions. II) A growth model could be growth of the bodily shape and gradual increase of bodily functions. However, what children observe in postnatal development is that the shape grows and that bodily functions stay equal. Both constant and increasing bodily functions would agree with children having

Mental models of prenatal development | 57
limited representational flexibility but have the understanding of growth. III) An alternative naïve idea about prenatal development could be the outgrowth of body elements and the emergence of functions, analogous to a growing plant with outgrowing branches. Some children might have directly observed how a seed grows into a plant and take that as an analogy for how an egg grows into a newborn. A transformation that consists of the addition of elements agrees with a higher level of the RR theory. IV) A child in an even later representational stage of its concept of a newborn would allow for more dramatic changes. It would accept that the shape of a hand of a fetus looks different from the hand of a newborn and that some bodily functions are implemented differently.
Mental models versus fragmental knowledgeMost authors claim that children have coherent ideas about biological topics, but only in a few cases is this claim tested experimentally (e.g., Rosengren et al., 1991). The question of whether children’s knowledge about specific topics is coherent and represented in mental models or whether such knowledge is fragmented has been a topic of heated debate in the literature. Theorists on the coherence side of this debate maintain that children’s naïve ideas are organized into coherent and consistent theories, which structure everyday thinking and are more or less resistant to change (Wellman & Gelman, 1998; Johnson-Laird, 1983). Several different domains of knowledge have been studied within this approach: children’s mental models of the shape of the earth (Vosniadou & Brewer, 1992); the motions of the earth, sun, and moon; the relative location of the earth, sun, and moon in space and the day-night cycle (Samarapungavan, Vosniadou, & Brewer, 1996); and, children’s frameworks on evolution and speciation (Samarapungavan & Wiers, 1997). A more specific issue that is central in the debate is whether children form mental models ‘on the spot’. According to Vosniadou, Skopeliti, and Ikospentaki (2004) children form on-the-spot dynamic situation-specific representations for the specific purpose of answering questions that are being posed to them. They argue that tasks like drawing, making clay models or responding to open-ended questions encourage children to make generative use of the scientific information that they have at their disposal, which encourage on-the-spot formation of mental models, thereby increasing the coherence of these models.
In contrast to the coherence theorists, researchers on the other side of the debate claim that children’s naïve knowledge is fragmented. DiSessa (1988), for instance, claims that intuitive physics stems from fragmented knowledge, represented like a set of loosely connected ideas. In line with this view, some researchers have concluded that children’s knowledge of the earth is fragmented (Straatemeier, Van der Maas & Jansen, 2008; Nobes et al., 2003).
A complicated aspect of this discussion is that differences in conclusions are related to the used experimental methodologies. Vosniadou et al. (2004) argued that the best way to

58 | Chapter 4
investigate children’s knowledge is by making use of generative methods, such as drawing. Several points of criticism exist concerning the use of drawings in the study of mental models. Firstly, the constraints on the planning of drawings may hamper children in divulging mental models (Nobes, Martin & Panagiotaki, 2005). A second criticism on the use of drawings lies in the difficulty of establishing objective scoring methods (Brainerd, 1973, in Straatemeier et al., 2008). However, results of drawings can be valuable when acceptable levels of inter-rater reliability are maintained. Thirdly, the consequence of assigning one score from a predefined range of models is that no unexpected mental models can be observed from the data. Finally, when aiming to test the existence of mental models, a measure of coherence is needed. Coherence can only be measured when different comparable elements or items are used, such as in a questionnaire or in an interview, but not in one drawing.
Forced-choice questionnaires have been one of the methods of choice within the area of mental models of the earth (Nobes et al., 2003; Straatemeier et al., 2008; Frède et al., 2011;), leading to the conclusion that children do not have mental models of the shape of the earth. Vosniadou et al. (2004) criticized this method for several reasons. Firstly, responses to the forced-choice questionnaire may be biased because the choice of response options is limited. This problem can be overcome if the construction of the test is based on extensive piloting on possible alternative models. Secondly, because children only need to recognize correct information, they might perform better on forced-choice questionnaires. A solution to this problem could be the use of an additional open-ended interview.
The use of open-ended interviews is not without problems, either. In order to arrive at a full understanding of the underlying conceptual structures, similar questions addressing the same issues are asked, resulting in a prolonged method of repeated questioning. This unnatural situation may confuse children, because everyday conversational rules do not apply (Siegal, 1997). In order to circumvent this problem, the structure of the interview should be designed in such a way that sufficient responses can be collected, but a normal communication situation can exist. Reducing the amount of follow-up questions is a way of doing this. Another criticism Siegal emphasizes in the use of interviews, which is applicable to all verbal methods, is that children might not be familiar with the words used in the interview. This bias can be reduced by using a model of the topic at hand to facilitate the understanding of the child.
To conclude, the most favorable methodology to examine the existence of mental models of prenatal development is either a forced-choice questionnaire in which all perceptible mental models are represented or an interview set up in such a way that conversational rules apply and a model (a doll of a newborn) is used to facilitate the child’s understanding of the question. With the former method coherence can be measured best because we can apply a larger number of comparable items and we can study a larger number of children. In the current study, both methodologies were used. Furthermore, these methodologies were compared to each other. In experiment 1 a questionnaire was designed in which pictures

Mental models of prenatal development | 59
were used instead of written response categories, to avoid problems related to verbal methodologies. In experiment 2, in addition to the forced-choice questionnaire, an interview was administered. We examined whether children revealed the same mental models in an interview as in the questionnaire. In the questionnaire and the interview we asked similar questions. In addition, a drawing task on prenatal development was included in the design of both experiments. First, we examined the effect of a preceding generative task on the coherence of mental models with a drawing task. Moreover, by assigning the drawings to a mental model according to well-described scoring rules, we studied the relation between the results of the three assessments methodologies.
exPeriMent 1methodParticipants We tested 317 children (age: M=9.35, SD=1.84) from three different primary schools in different parts of the Netherlands, all providing regular education. An opt-out consent procedure was used, parents being required to sign and return a form if they did not want their child to participate in the study. The sample consisted of children between 6 and 12 years old: participants included 43 children from Grade 1, age 6-7 (M=6.56, SD=0.59); 50 children from Grade 2, age 7-8 (M=7.74, SD=0.60); 68 children from Grade 3, age 8-9 (M=8.75, SD=0.63); 47 children from Grade 4, age 9-10 (M=9.91, SD=0.67); 51 children from Grade 5, age 10-11 (M=10.84, SD=0.51); and 58 children from Grade 6, age 11-12 (M=11.76, SD=0.60).
Materials Questionnaire. The questionnaire was designed for children aged six and older. In the process of designing the questionnaire, Siegler’s (1981) rule assessment methodology (RAM) was used. Rules in Siegler’s RAM framework are equivalent to mental models in this study. It was expected that a child with a specific mental model would generate a specific response pattern for a set of items. Items were constructed such that maximum differentiation was possible between the expected mental models: 1) the no-change model, 2) the growth model, 3) the outgrowth model, and 4) the different model. The themes of the questions used in the questionnaire were based on children’s misconceptions of prenatal development reported in earlier studies (Zoldosova & Prokop, 2007; Gellert, 1962; Jaakola, 1997) in group discussions and children’s drawings at an early science education workshop.1
The questionnaire started with a trivial example item, followed by fifteen questions on prenatal development. These questions were divided to cover an early stage and a late stage of prenatal development. In turn, the items within this division concerned either shape of the body or the bodily functions of the fetus. Topics covered in the shape-related items were the hand, the leg, the ear, the foot, the arm, and the eye. There were 6 early-shape items (ES) and 3 late-shape items (LS: hand, leg, ear). Topics covered in the function-related items were

60 | Chapter 4
breathing, drinking and maintaining body temperature. There were 3 early-function items (EF) and 3 late-function items (LF). In the booklet the response options of the shape-related items were depicted with adapted photographs. The response options of the function-related items were given in a few short, easy to read words. The order of the response options was randomized. A translated example of 2 items, an ES and a LF item, are depicted in Fig. 1. The experimenter said the following while presenting the ES item in front of the classroom:
This is what the hand of a baby looks like, when it has just been born. Which picture resembles the hand of a baby most, when the baby still has to stay in the belly of the mother for a long, long time?
a) A hand looking exactly the same (no-change response)b) A hand looking exactly the same, but a bit smaller (growth response)c) A hand looking like the hand of a newborn, but it does not have all the fingers yet (outgrowth response)d) A hand that looks different from the hand of a newborn with a different shape (different response)
The experimenter said the following while presenting the LF item in front of the classroom:
When a baby has just been born it needs to breath air to stay alive. How does the baby get air just before it is born?
a) The baby breaths air just like a newborn (no-change response/ growth response)b) The baby does not need anything from the air (absence response)c) The baby gets something from the air through the blood of the mother (different response)
Drawing task. Participants were asked to make two drawings of a fetus: one in an early stage of development and one in a late stage of development. The assignment for the first drawing was ‘draw a baby in the belly of the mother, for the case when the baby has to stay in the belly of the mother for a long, long time’. The assignment for the second drawing was ‘draw a baby in the belly of the mother, right before it is born’. On A3 sized paper children received a format depicting three pictures of a mother, the first two with an empty square on the belly of the mother where the baby had to be drawn. The third picture showed a mother together with her newborn.
The drawings were scored based on the types of changes that appeared between the first and the second drawing. The main elements of change were scored, presented by growth from early to late stage of fetal development, deletion in the early stage as compared to the late stage, and changes in shape from early to late stage. Drawings were sorted into four

Mental models of prenatal development | 61
categories related to the predicted mental models; 1) no-change, 2) growth, 3) outgrowth, and 4) different. The change between the drawings representing the highest level of conceptual change was the criterion for deciding to which category the drawing belonged. For example, if both growth and a different shape were apparent in a drawing, the child was classified in category 4.
figure 1. a) Shape item about the hand used in the questionnaire. b) Function item about breathing. Of each item the upper figure depict the shape (function) of a newborn; the lower figures are the four response options for shape items (no-change, growth, outgrowth, and different) or three response options for function items (different, no-change, absence). In the questionnaire the response options were presented in random order. Figure b) is a translation of the original Dutch item.
a)
b)

62 | Chapter 4
design and procedureThe experimental procedure consisted of two parts: completing the questionnaire and the drawing task. These two tasks were administered group wise in a classroom setting. The children were tested under two conditions: either they first filled out the questionnaire followed by the drawing of the fetus (151 participants), or they first drew the fetus then completed the questionnaire (166 participants). The instructions of all tasks were read out loud by the test leader, as well as the questions of the questionnaire. Additionally, an enlarged version of all questions was projected on a screen. The subtests took about twenty minutes each, so the total procedure lasted for an hour after which children were given the opportunity to ask questions.
statistical analysesTo detect mental models from responses of forced-choice questionnaires a widely used methodology is Siegler’s rule-assessment methodology (Siegler, 1981). For detection of strategies from series of responses, Siegler matched patterns of observed responses to theoretically expected response patterns. Subjects were assigned to a mental model (i.e., rules for solving the balance scale task in Siegler 1981) according to the best matching expected pattern, provided that the match exceeded a predefined threshold (and possibly additional criteria). The number of successfully classified subjects is taken as an index of the fit of the rule system.
However, the use of pattern matching in the analysis of mental models has several shortcomings (Van der Maas & Straatemeier, 2008). A considerable problem is that the assignment of subjects to mental models takes place by an arbitrary criterion of correspondence between observed and expected responses. Moreover, only mental models that are a priori defined can be detected, meaning that the detection of alternative, unexpected, models is not possible. Finally, pattern matching does not provide statistically motivated criteria for the selection of the most parsimonious, best fitting model (e.g., to decide whether additional mental models should be included into the descriptive model of the data).
Latent class analysis (LCA; McCutcheon, 1987; Visser, 2011) provides a statistically more reliable method to detect rules (Jansen & Van der Maas, 1997) or mental models (i.e., coherent ideas; Straatemeier et al., 2008) from nonverbal responses. LCA is a standard statistical technique for models with categorical manifest variables and categorical latent variable. Latent class models define categorically different response patterns (latent classes). In our study a latent class can be interpreted as a response pattern related to a specific mental model. A latent class model is defined by unconditional probabilities and conditional probabilities, which are estimated from the data. Unconditional parameters define the probability of belonging to a latent class, i.e. the size of the class. Conditional probabilities are defined for each class and represent the probability of each answer option, given that the

Mental models of prenatal development | 63
subject belongs to the class. To calculate maximum likelihood estimates of the parameters, we used the DepmixS4 package (Visser & Speekenbrink, 2010) for the R program for statistical computing (R Development Core Team, 2010). Model selection criteria, especially the Bayesian Information Criterion (BIC; Schwartz, 1978), were used to choose the optimal, most parsimonious model, i.e. the optimal number of classes that described the data. If children have a mental model of prenatal development, we should find a limited number of latent classes with a pattern of conditional probabilities that can be interpreted as mental models. Because response patterns of classes do not need to be formulated beforehand, it is possible to detect alternative mental models. Obviously, the design of the questionnaire restricted the models we could find, but this is inherent in all closed form assessment tools.
resultsgeneralThe internal consistency of the entire questionnaire as expressed by Cronbach’s Alpha was .82 with the response options taken as an ordinal variable (no-change, growth, outgrowth, different). Nonparametric (Spearman’s rho) correlations between items varied between .49 and .79 for the early-shape items (ES), between .05 and .18 for the early-function (EF) items, were between .90 and .94 for the late-shape (LS) items, and were .01 and .20 for the late-function (LF). The reason for the low correlations between functions items will be explained through the latent class analyses in the next section. Table 1 shows the distributions of responses. For the ES items, the response frequency of the no-change response was very low. Hence, in further analysis the no-change response was combined with the growth response for the ES items. We model the three LS items separately.
The function items (EF and LF) showed little variance in responses and there was no striking difference in frequencies between EF and LF. Correlations between items on EF and LF were between .67 and -.14. We modeled these six function items together in a separate latent class analysis, because we wanted to observe whether children responded coherently between the early and late stage. For the latent class analyses, the data of the two conditions, that is the two task sequences, were taken together.

64 | Chapter 4
table 1. Distributions of responses for the questionnaire items in Experiment 1.
Item No-change Growth Outgrowth Different
Early Shape
Hand 2.5 36.6 2.8 58.0
Leg 1.9 39.6 13.0 45.6
Ear 0.3 46.4 26.8 26.5
Foot 0.3 49.5 2.8 47.3
Arm 0 37.9 11.0 51.1
Eye 0.9 36.0 14.5 48.6
Early Function
Drinking 2.2 1.6 96.2
Keeping Warm 0.3 3.2 96.5
Breathing 15.5 11.0 73.5
Late Shape
Hand 52.1 46.7 .9 .3
Leg 51.4 47.6 .6 .3
Ear 51.3 48.1 0 .6
Late Function
Drinking 6.3 1.9 91.8
Keeping Warm 1.3 1.9 96.8
Breathing 15.5 9.5 75.1
Note. Frequencies are given as percentages of children (N=317).
Mental models of bodily shape To examine whether children showed mental models about bodily shape in the early stage, latent class analysis was first performed on the responses of the six ES items. If children had mental models, a limited number of latent classes should be found with conditional probabilities consistent with mental models, such as those described in the introduction. Table 2 (upper section) shows the fit statistics of the explorative latent class models with increasing number of classes. Based on the BIC, a four-class model yielded the most parsimonious best-fitting model. The response patterns for each class are graphically depicted in Figure 2. 30% of the children consistently chose the growth response, implying a growth-only mental model of prenatal development. 42% of the children chose the different responses consistently for most items, implying a mental model that includes important changes of shape. 6% of the children chose the outgrowth response option for most items, although less so for the hand and the foot, implying a mental model that allows for outgrowth of body parts. Although the responses of only a small subgroup of children was best described by this class, it does contribute to the most parsimonious best-fitting description of the data. Finally, 22% of the

Mental models of prenatal development | 65
children chose a mixed set of responses, growth and different response in an unsystematic combination.
A second series of models were fit to the responses of the late shape items. Table 2 (second section) shows the fit statistics. Based on the BIC, we selected the two-class model as the best, most parsimonious model. 51% of the children chose the no-change response with high probability for all 3 items (estimated conditional parameters are .99, .99, .98 for the hand, leg ear items, respectively). 49% of the children were consistent in choosing the growth response (estimated conditional parameters are .95, .96, .95 for the hand, leg ear items respectively).
table 2. Fit Statistics for Latent Class Models.
Model # classes LogL df BIC
Early 2 class -1300.8 25 2745.5
Shape 3 class -1242.1 38 2703,0
4 class* -1201.7 51 2697,0
5 class -1184.9 61 2738.1
Late 1 class -704.8 8 1455.6
Shape 2 class -357.6 17 813.1
3 class -343.9 26 837.4
Function 1 class -735.4 12 1539.9
6 items 2 class -648.2 25 1440.2
3 class* -609.0 38 1436.7
4 class -592.4 51 1478.4
Function 1 class* -265.2 8 576.5
4 items 2 class -247.6 17 593.0
Note. *Indicates the most parsimonious, best fitting model; LogL, Loglikelihood; df, degrees of freedom; BIC, Bayesian Information Criterion; no restrictions were added. N=316.
Mental models of bodily functionsTo examine whether children showed mental models about bodily functions, latent class analysis was performed on the responses of the six function items: 3 EF items and 3 LF items. Table 2 (third section) shows the fit statistics of the explorative latent-class models with increasing number of classes. Based on the BIC the three-class model was selected as the best-fitting, most parsimonious model. The response patterns for each class are graphically depicted in Figure 2, lower panels. 23% of the children chose a no-change response for the breathing items, combined with a different response for the other items. 11% of the children chose the absence response for the breathing items, again combined with a different
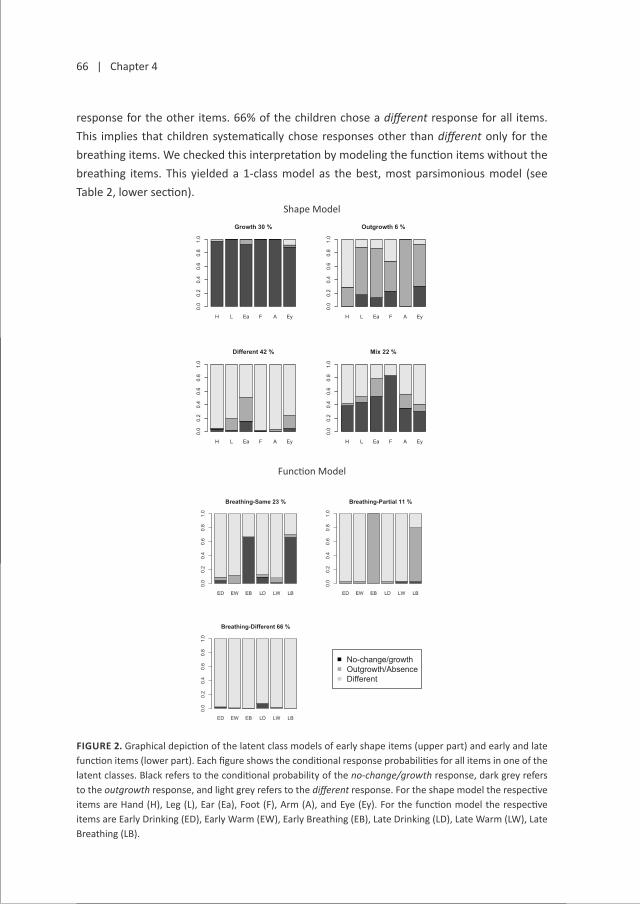
66 | Chapter 4
64
Shape Model
Function Model
Figure 2. Graphical depiction of the latent class models of early shape items (upper part) and early and
late function items (lower part). Each figure shows the conditional response probabilities for all items in
one of the latent classes. Black refers to the conditional probability of the no-change/growth response,
dark grey refers to the outgrowth response, and light grey refers to the different response. For the shape
model the respective items are Hand (H), Leg (L), Ear (Ea), Foot (F), Arm (A), and Eye (Ey). For the
function model the respective items are Early Drinking (ED), Early Warm (EW), Early Breathing (EB), Late
Drinking (LD), Late Warm (LW), Late Breathing (LB).
H L Ea F A Ey
Growth 30 %
0.0
0.2
0.4
0.6
0.8
1.0
H L Ea F A Ey
Outgrowth 6 %
0.0
0.2
0.4
0.6
0.8
1.0
H L Ea F A Ey
Different 42 %
0.0
0.2
0.4
0.6
0.8
1.0
H L Ea F A Ey
Mix 22 %
0.0
0.2
0.4
0.6
0.8
1.0
ED EW EB LD LW LB
Breathing-Same 23 %
0.0
0.2
0.4
0.6
0.8
1.0
ED EW EB LD LW LB
Breathing-Partial 11 %
0.0
0.2
0.4
0.6
0.8
1.0
ED EW EB LD LW LB
Breathing-Different 66 %
0.0
0.2
0.4
0.6
0.8
1.0
No-change/growthOutgrowth/AbsenceDifferent
response for the other items. 66% of the children chose a different response for all items. This implies that children systematically chose responses other than different only for the breathing items. We checked this interpretation by modeling the function items without the breathing items. This yielded a 1-class model as the best, most parsimonious model (see Table 2, lower section).
figure 2. Graphical depiction of the latent class models of early shape items (upper part) and early and late function items (lower part). Each figure shows the conditional response probabilities for all items in one of the latent classes. Black refers to the conditional probability of the no-change/growth response, dark grey refers to the outgrowth response, and light grey refers to the different response. For the shape model the respective items are Hand (H), Leg (L), Ear (Ea), Foot (F), Arm (A), and Eye (Ey). For the function model the respective items are Early Drinking (ED), Early Warm (EW), Early Breathing (EB), Late Drinking (LD), Late Warm (LW), Late Breathing (LB).
Shape Model
Function Model
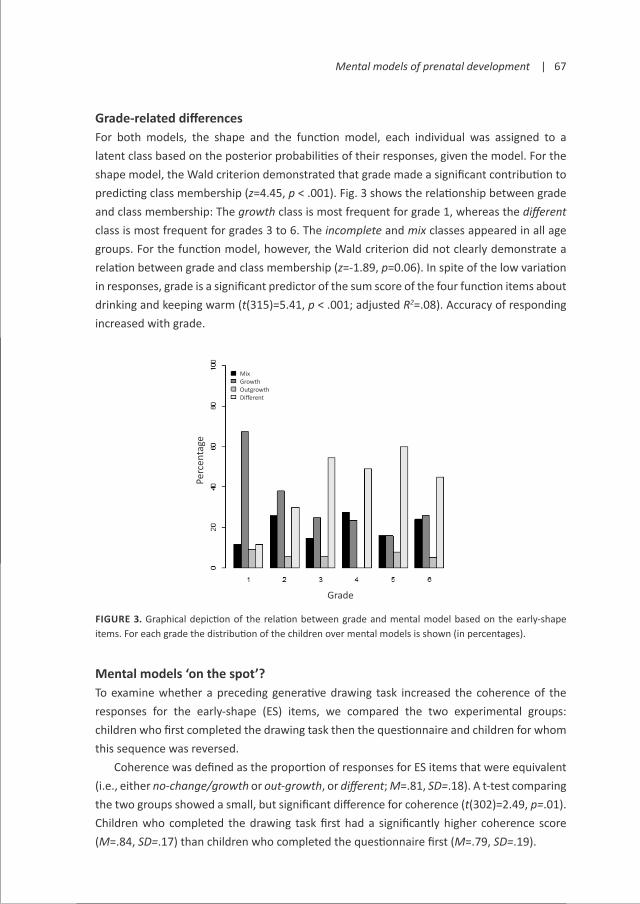
Mental models of prenatal development | 67
grade-related differencesFor both models, the shape and the function model, each individual was assigned to a latent class based on the posterior probabilities of their responses, given the model. For the shape model, the Wald criterion demonstrated that grade made a significant contribution to predicting class membership (z=4.45, p < .001). Fig. 3 shows the relationship between grade and class membership: The growth class is most frequent for grade 1, whereas the different class is most frequent for grades 3 to 6. The incomplete and mix classes appeared in all age groups. For the function model, however, the Wald criterion did not clearly demonstrate a relation between grade and class membership (z=-1.89, p=0.06). In spite of the low variation in responses, grade is a significant predictor of the sum score of the four function items about drinking and keeping warm (t(315)=5.41, p < .001; adjusted R2=.08). Accuracy of responding increased with grade.
figure 3. Graphical depiction of the relation between grade and mental model based on the early-shape items. For each grade the distribution of the children over mental models is shown (in percentages).
Mental models ‘on the spot’?To examine whether a preceding generative drawing task increased the coherence of the responses for the early-shape (ES) items, we compared the two experimental groups: children who first completed the drawing task then the questionnaire and children for whom this sequence was reversed.
Coherence was defined as the proportion of responses for ES items that were equivalent (i.e., either no-change/growth or out-growth, or different; M=.81, SD=.18). A t-test comparing the two groups showed a small, but significant difference for coherence (t(302)=2.49, p=.01). Children who completed the drawing task first had a significantly higher coherence score (M=.84, SD=.17) than children who completed the questionnaire first (M=.79, SD=.19).
Grade
Perc
enta
ge
MixGrowthOutgrowthDifferent

68 | Chapter 4
The same effect was present when analyzing whether the sequence of tasks affected the model children adhered to (the Wald statistic in a logistic regression: z=2.41, p=.02). If the drawing was made before the questionnaire was filled out, children were assigned to a class with greater coherency. That is, a growth model was more frequent (37% versus 25%) and a mixed model was less frequent (16% versus 24%).
drawing task & comparison of methodologiesWe classified the drawings into three categories. The no-change and the growth category were merged, because in the analysis of ES items of the questionnaire the four response options were analogously reduced to three response options. Moreover, scoring growth in the sometimes miniature drawings was difficult. Inter-rater reliability of classifications based on the three categories (1- no change or growth, 2- outgrowth, and 3- different) of the drawing task ranged from 92% to 96%. Cohen´s Kappa ranged from .84 to .89.
There was no significant relation between grade and the classification of the drawings. To see whether agreement existed between the different tasks, we compared the classification of the drawings with the classification based on the questionnaire. We did not find a significant relation.
ConclusionLatent class analysis of forced-choice questionnaire responses, revealed mental models for children’s ideas about early fetal shape: Three subgroups of children showed coherent responses, which can be interpreted as mental models. One model, the growth model, which was most frequently found in the early grades, assumes that the early fetus is only smaller than a newborn baby. The second model, the outgrowth model, which was present in all age groups in small percentages, assumes that body parts are only partially present during early fetal development. The third model, the different model, assumes that the early fetus looks very different from a newborn baby. This model was dominant in the highest grades. A fourth group of children gave mixed responses, which were not correlated. In contrast, the LCA of early and late-function items did not reveal multiple coherent naïve ideas. Most children responded that the functions are different from post-natal functions in both early and late fetal development. Only in concern to breathing did we find multiple ideas, which implies that there were no mental models about bodily functions in general, other than the accurate idea that functions are different during fetal development. Moreover, the accuracy of responding increased somewhat with grade. This developmental pattern is consistent with the theoretical stance of fragmented knowledge.
The hypothesis that the coherence of ideas increases by doing a generative task, such as drawing, was confirmed for the shape items. Straatemeier et al. (2008) did not find an effect of a generative task on the coherency of questionnaire responses. However, they did
Mental models of prenatal development | 69
not find mental models as we do for the early shape items. Coherence of responses for the questionnaire was larger for the children who first drew two stages of fetal development. 8% more children yielded a mental model in that case, mostly a growth model. We did not find a clear correspondence between the models resulting from the different measurement methods. The result of drawing method also did not relate to age suggesting that this method is less useful in detecting mental models.
exPeriMent 2In Experiment 2 we compare the forced-choice questionnaire with structured interviews, which is another popular method in mental model studies. In contrast to forced-choice questions, open-ended interviews allow for generating responses that were not anticipated during the design of the task. The main research question is whether the mental models about early shape that we found with the questionnaire, can be replicated when using the interview. The same procedure was used as in Experiment 1 (questionnaire and drawings), but interviews were added to the design. Asking open-ended questions is argued to have a generative effect on mental models (Vosniadou et al., 2004). Hence, Experiment 2 also examines the effect of open-ended questions on the questionnaire.
methodParticipants Thirty-seven children were tested (age: M=8.84, SD=1.75) from a primary school providing regular education. An active consent procedure was used with parents being required to sign and return a form if they agreed to let their child participate. The sample consisted of children between 6 and 12 years old: participants included 6 children from Grade 1, age 6-7 (M=6.33, SD=.52); 6 children from Grade 2, age 7-8 (M=7.33, SD=.60); 8 children from Grade 3, age 8-9 (M=8.50, SD=.63); 8 children from Grade 4, age 9-10 (M=9.38, SD=.67); 7 children from Grade 5, age 10-11 (M=11.00, SD=.51); and 3 children from Grade 6, age 11-12 (M=11.33, SD=.58).
Materials In Experiment 2, the same materials were used as in Experiment 1: the forced-choice questionnaire and the drawing task on prenatal development. Additionally an interview was conducted individually. The structure of the interview was similar to the structure of the questionnaire, with children being asked questions about the early and late stages of prenatal development. Six of the questions concerned shape (3 ES and 3LS items) and four concerned bodily functions of the fetus (2 EF and 2 LF items). In addition, two questions about the fetus as a whole were added, so children were asked 12 questions. Questions were formulated to be open-ended, follow-up questions were defined for anticipated responses. A maximum of two follow-up questions was used to avoid repeated questioning and to enhance rules of

70 | Chapter 4
normal communication. A doll was used as a model to represent the newborn, to facilitate the child’s understanding of the question. A translated example of an early stage item on shape is: ‘Look [interviewer points at the hand of the doll], this is what the hand of a baby looks like, when it has just been born. Does the baby have hands yet when the baby still has to stay in the belly of the mother for a long, long time?’ A confirming answer would lead to the question: ‘What does the hand look like when the baby still has to stay in the belly of the mother for a long, long time?’ If the child answered that the fetus does not have hands yet, the interviewer would ask: ‘So what does the baby have?’ The interview took about ten minutes.
All interviews were audio-visually recorded and scored afterwards. All questions were scored separately and independently. It was assumed that children’s responses would be consistent with one of 4 expected models. A list of responses was specified for each question, representing the core characteristics of the models. Next, shape responses children gave were scored as 1) no-change response, 2) growth response, 3) outgrowth response, and 4) different response. For the function items we scored again in three categories: 1) no-change response, 2) absence response, and 3) different response.
design and procedure We tested children in Experiment 2 with two sequences of the tasks. There was a fixed sequence for the tests administered in a classroom setting; all children first completed the drawing of the baby and then filled out the questionnaire. Children were either interviewed individually before the classroom tests (18 participants) or after the classroom tests (20 participants). The procedure of the classroom tests was the same as in Experiment 1.
resultsgeneralChildren’s interview responses were scored in three categories for each item. The inter-rater reliability of these ten items was 84% agreement on average (63% to 100%), which resulted in a Kappa of .73 (range .54 to 1.0). The internal consistency of the Shape and Function items in the interview with the response options taken as an ordinal variable (no-change, growth, incomplete, different) was .71, as expressed by Cronbach’s Alpha. Nonparametric (Spearman’s rho) correlations between items varied between .35 and .61 for the early-shape (ES) items, was .51 for the early-function (EF) items, were between .44 and .53 for the late-shape (LS) items, and was .48 for the late-function (LF) items. Table 3 shows the distributions of responses.
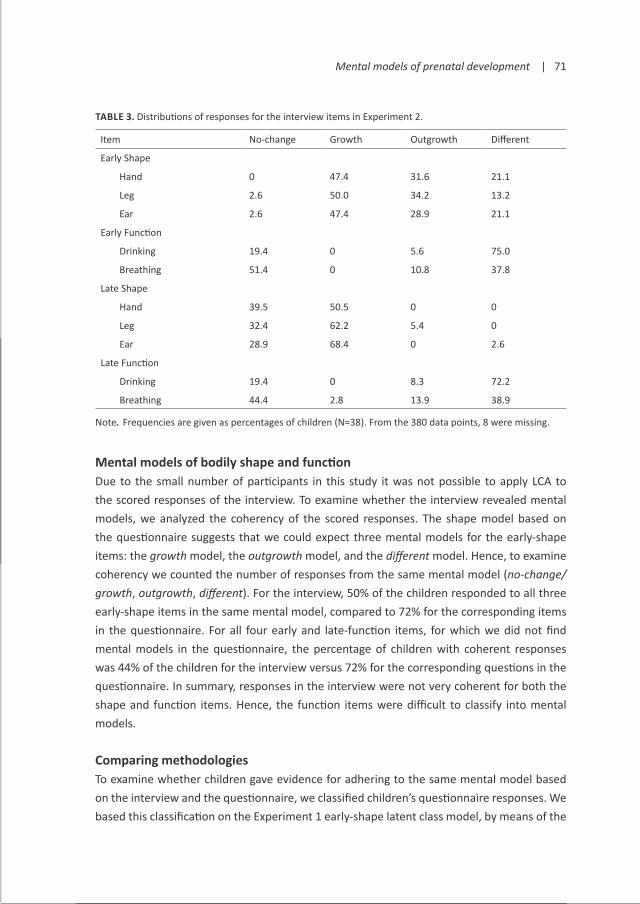
Mental models of prenatal development | 71
table 3. Distributions of responses for the interview items in Experiment 2.
Item No-change Growth Outgrowth Different
Early Shape
Hand 0 47.4 31.6 21.1
Leg 2.6 50.0 34.2 13.2
Ear 2.6 47.4 28.9 21.1
Early Function
Drinking 19.4 0 5.6 75.0
Breathing 51.4 0 10.8 37.8
Late Shape
Hand 39.5 50.5 0 0
Leg 32.4 62.2 5.4 0
Ear 28.9 68.4 0 2.6
Late Function
Drinking 19.4 0 8.3 72.2
Breathing 44.4 2.8 13.9 38.9
Note. Frequencies are given as percentages of children (N=38). From the 380 data points, 8 were missing.
Mental models of bodily shape and functionDue to the small number of participants in this study it was not possible to apply LCA to the scored responses of the interview. To examine whether the interview revealed mental models, we analyzed the coherency of the scored responses. The shape model based on the questionnaire suggests that we could expect three mental models for the early-shape items: the growth model, the outgrowth model, and the different model. Hence, to examine coherency we counted the number of responses from the same mental model (no-change/growth, outgrowth, different). For the interview, 50% of the children responded to all three early-shape items in the same mental model, compared to 72% for the corresponding items in the questionnaire. For all four early and late-function items, for which we did not find mental models in the questionnaire, the percentage of children with coherent responses was 44% of the children for the interview versus 72% for the corresponding questions in the questionnaire. In summary, responses in the interview were not very coherent for both the shape and function items. Hence, the function items were difficult to classify into mental models.
Comparing methodologies To examine whether children gave evidence for adhering to the same mental model based on the interview and the questionnaire, we classified children’s questionnaire responses. We based this classification on the Experiment 1 early-shape latent class model, by means of the

72 | Chapter 4
posterior probabilities of the responses given the four classes of this model.2 There was no significant effect of grade on the model classification of questionnaire responses.
Based on the three ES items of the interview children were also classified to one of the four classes. We used the Experiment 1 early-shape latent class model to classify responses instead of pattern matching to include the possibility that a response pattern was assigned to the mixed class. There was no significant effect of grade on the model classification of interview scores.
Comparing the classifications of children based on the questionnaire and based on the interview, a significant dependency was found (χ2(2)=20.68, bootstrapped p < .01; see Table 4). However, the dependency between the two classifications resulted from the large growth class only. For the other cells in the cross-table we do not see overlap.
As in experiment 1, children’s drawings were classified as agreeing with one of three models. The classification based on the drawings was not related to the questionnaire classification or to the interview classification.
table 4. Cross-table of the classification of children’s questionnaire and interview responses.
Questionnaire Interview
Growth Outgrowth Different Mix N
Growth 14 2 1 5 22 (61%)
Outgrowth 0 0 0 0 0 (0%)
Different 0 4 1 0 5 (14%)
Mix 1 4 3 1 9 (25%)
N 15 (42%) 10 (28%) 5 (14%) 6 (17%) 36
Mental models ‘on the spot’?For each child, the coherence of the questionnaire responses was expressed as the proportion of early-shape responses that were from the same category (M=.83, SD=.19). There was no effect of the sequence of tasks (interview before or after the drawing and questionnaire) on the coherence score. There was also no effect of sequence of tasks on the mental models (based on the questionnaire) to which the children adhered.
ConclusionInterview responses were less coherent than questionnaire responses. Considering the difficulty found in categorizing the response patterns to the expected models, it is concluded that the responses in the interview did not support the existence of the expected mental models. Age related differences were not found in the questionnaire classifications and also not in the interview classifications, due to the high percentage of children in the growth class. A significant dependency was found between the classification based on the interview and
Mental models of prenatal development | 73
the classification based on the questionnaire. The correspondence, however, was only due to the large growth class. No dependency was found between the other classifications.
Vosniadou et al. (2004) stated that asking open-ended questions would have a generative effect on the construction of mental models, just as drawings do. In Experiment 2 the questionnaire was always preceded by the drawings, which was shown to have a generative effect on the questionnaire in Experiment 1. Coherency of the early-shape items of the questionnaire in Experiment 2 (M=.83, SD=.19) was indeed comparable to the coherency of these items in Experiment 1 for the case when it was preceded by drawing (M=.84, SD=.17). Administering the interview did not have an additional generative effect on the coherence of children’s questionnaire responses for the early-shape items.
discussionMental models of prenatal developmentOne of the main questions in the literature about children’s naïve ideas about the world is whether children form coherent ideas about a specific topic, that is, mental models. We studied this issue for the case of mental models about prenatal development. The position that we took in this study is a methodological one: the measurement method needs to allow for testing the coherence between responses in order to decide on this issue. In this respect, the forced-choice questionnaire is the most appropriate, especially when combined with a statistical analysis technique that tests the existence of coherent response patterns in the data, such as latent-class analysis. Experiment 1 shows that children’s naïve ideas about changes in the shape of a fetus’ body were coherent for most children (78%). These children believed for all body parts that they only grow between early and late stage of prenatal development (30%), that most body parts grow out of the body (6%), or that the shape of all body parts undergo important changes (42%). Note that the outgrowth model was not found in Experiment 2, but given that this group was small in Experiment 1, this is not completely unexpected. 22% of the children showed an unsystematic mix of two types of responses: body parts grow or undergo important changes. The reasons for this incoherence can be various: some pictures of the test seemed implausible to them; their ideas were instable; or they guessed between the two most plausible response options. The finding of mental models of prenatal body shapes is consistent with what was found by Rosengren et al. (1991) about the natural transformations that children accept. According to Rosengren et al., young children know that animals get larger with age, but only older children and adults accept rather dramatic changes in shape.
For bodily functions the results were different. Most children believed that fetal bodily functions were different from the functions of a newborn. For breathing only, some children (23%) believed that this function is the same in the fetus and the newborn and some children (11%) believed that the fetus does not need something from the air at all. Hence, children
74 | Chapter 4
did not have general ideas about changes of bodily functions during prenatal development other than that they are different from the functions of newborns. Although in reality, bodily functions are different in a fetus compared to a newborn, the different responses do not necessarily indicate that most children had a scientifically acceptable idea of this difference. In the questionnaire we did not test children’s ideas about bodily functions in more detail because a coherent detailed idea about multiple functions is not very likely (or thinkable). Hence, we conclude that children do not have mental models about change of bodily functions (drinking, breathing, keeping warm) other than that these functions are different in the fetus.
Whether the interviews gave us more insight in children’s naïve ideas is questionable. Firstly, the coherence of the responses in the interviews was considerably less than for the questionnaires. Secondly, the relation that was found between the classifications based on the questionnaire and on the interview was mainly due to a large number of children adhering to a growth model. Hence, the reliability of the interview responses as reflections of children’s mental models is questionable. It is very likely that children hardly thought about bodily functions of a fetus before (Zoldosova & Prokop, 2007; Morris et al., 2000) and that their sometimes-detailed responses were constructed on the spot. It almost never occurred that children responded with “I don’t know” (a maximum of 2% of the responses were omitted), which is remarkable given that young children appear to know very little details about human insides (Morris et al., 2000). If children were constructing the responses on the spot instead of basing them on their mental model, the interview did not test children’s knowledge about prenatal development, but children’s abilities to construct narratives from fragmented knowledge (DiSessa, 2008).
Although we conclude that interviews and drawings are not very reliable methods for testing the presence of mental models, these formative assessment methodologies might be interesting from an educational perspective. In Experiment 1 we see that children’s responses on the questionnaire were more coherent after drawing different phases of prenatal development. Hence, these methods seem to stimulate children’s thinking about prenatal development, creating good opportunities for teachers to present new knowledge about the topic (Schwartz & Sadler, 2007).
representational flexibilityThe mental models that we found for early shape development are consistent with Karmiloff-Smith’s (1992) ideas about representational flexibility. Representational flexibility is assumed to occur within specific topics (i.e., micro-domains) throughout development, but the overall sequence of introduced modifications is believed to be domain general. Indeed, the grade-related results on the questionnaires are in agreement with this specific sequence of phases in representational flexibility. Karmiloff-Smith’s original ideas about representational

Mental models of prenatal development | 75
redescription were based on drawings of human beings. Remarkably, our results based on children’s drawings did not reveal a significant relation between representational flexibility and grade.
Whether representational flexibility is dependent on procedural constraints or is more dependent on conceptual rigidity is a debated issue in literature with both positive (Picard & Vinter, 2007) and negative evidence (Spensley & Taylor, 1999, Barlow et al., 2003, Hollis & Low, 2005). According to Karmiloff-Smith (1990) the procedural constraint in the first phase of representational redescription is that young children’s internal representations are dependent on a sequentially fixed list. Representational flexibility increases in subsequent phases because the constraints are relaxed. Results of the study by Picard and Vinter (2007) are in line with Karmiloff-Smith’s theory. They find that rigidity in routine development constitutes a sequential constraint that limits inter-representational change. When this sequential constraint is relaxed, it is likely to be one of the factors leading to inter-representational flexibility. In the present study we found evidence that the representational redescription was more dependent on conceptual rigidity, and we could not reveal it was dependent on procedural constraints, i.e. drawing skills.
Methodological issuesThe reason for the use of a forced-choice questionnaire was that this methodology makes it possible to measure coherence in responses, which is a criterion for mental models. A point of criticism of this methodology could be that due to the limited response options children are more likely to respond according to a specific model, increasing the chance of the researcher finding a coherent model. However, it appears that the use of forced-choice questionnaires in investigating children’s mental models does not necessarily lead to finding coherent models (Straatemeier et al., 2008). Moreover, unlike the shape related items, responses on the function items did not reveal multiple coherent models. A second point of criticism could be that the questionnaire was composed of adapted photographs. This could have lead to a response bias; children might have just picked the most unusual picture. The lack of variation in the responses to the late-shape items provides evidence against the existence of such a bias. Here, children consistently chose the no-change and growth response, which photographs look like the newborn.
This study shows that more specific conclusions can be drawn using LCA as compared to pattern matching. The use of LCA made it possible to detect a subgroup of children with mixed, incoherent responses. Moreover, LCA provides a measure of how many mental models are present in the data. For the early-shape items only a few children showed a more or less coherent pattern of outgrowth responses. Nevertheless, identifying this subclass of children contributes to the best describing, most parsimonious model.

76 | Chapter 4
Conclusion
Taking into account the scarcity of previous experimental work on mental models of prenatal development, our study adds substantial insights on the topic. Children have a mental model of prenatal shape development, which is grade related. Knowledge about bodily functions appears to be more fragmented. That is, dependent on the specific topic, children reason from separate facts or from general principles. About bodily functions, children reason form separate facts (cf., Zoldosova & Prokop, 2007). About bodily shape, children reason from general principles, i.e. transformations that are acceptable for shapes or animals (Rosengren et al., 1991). More systematic studies on the relation between available sources of knowledge and the type of knowledge that children construct from these sources could provide more general insight in the development of knowledge.
The findings of this study are of interest to both developmental psychology and education. Teachers in primary schools will derive from this study a better understanding of the development of children’s mental models of prenatal development, in particular and of knowledge development, in general. Indeed, it can be difficult for children to acquire scientific theories because these theories are often inconsistent with their naïve ideas (Karmiloff-Smith & Inhelder, 1975; Samarapungavan et al., 1996). Restructuring a mental model is even more complex considering the fact that adults, such as teachers, have different models than children and are usually unaware of children’s initial models. When teachers take into account children’s initial assumptions, they can guide children’s restructuring of mental models in an optimal manner (Schwartz & Sadler, 2007).
Our study contributes to a deeper understanding of the effects of different methodologies being used in investigating mental models. A statistically valid check for coherence as opposed to the assumption of coherence should be part of each methodology.
acknowledgementsThis work was funded by the Dutch Organization for Scientific Research (NWO; VIDI and ASPASIA grants from M.E.J. Raijmakers) and the Dutch Curious Minds program, which is supported by the Ministry of Education, Culture and Science and Platform Bèta Techniek. The authors thank the teachers and pupils who participated in this research. Also, we thank Jolande Klijn for assisting in this study. We thank A. Karmiloff-Smith for her valuable comments on an earlier version of this paper.

Mental models of prenatal development | 77
notes1. The workshop was LOOL, which stands for
‘leren onderzoekend en ontwerpend leren’,
Dutch for ‘enquiry based learning and learning
by design’. The project was lead by Marja van
Graft and executed by Rooske Franse in 2005
and 2006.
2. The classification of individuals depends both
on conditional and unconditional parameters
of the model. We assume that the estimates
of conditional parameters are the same for
Experiment 1 and Experiment 2 children.
However, the unconditional parameters
depend on the distribution of age within the
group, which we do not assume to be equal
across experiments. Therefore, we estimated
the latent class model again with grade added
as a covariate on the posterior probabilities.
Grade was significantly related to the model
classification of the questionnaire (likelihood
difference between models is: χ2(2)=7.07,
p < .03). Almost the same classification of
Experiment 2 children was found on basis of
this model. Only one subject was classified as
having a growth model instead of mixed ideas.
For reasons of simplicity, we worked with the
simple model that was explained in the text.

chaPter 5
Development of causal learning in 2- to 5-year-olds: Multiple age-related types of causal inference
Van Schijndel, T. J. P., Huijpen, K., & Raijmakers, M. E. J. Development of causal learning in 2- to 5-year-olds: Multiple age-related types of causal inference. Manuscript in revision.

80 | Chapter 5
abstractChildren’s capabilities for causal inference are usually studied on the basis of the average behavior of children within age groups. However, children within age groups show considerable variance in their responses to causal inference trials. The present study aimed to describe the development of young children’s causal inference by investigating individual differences in the type of inference they use. To this end, a series of carefully selected causal inference trials was administered to children of a relatively broad age range: 2- to 5-year-olds. Instead of analyzing the group’s responses on each trial separately, individuals’ response patterns over trials were analyzed with a categorical latent variable technique. Different sources of variance were distinguished: children using different types of causal inferences and children making errors in applying these types of inferences. The developmental pattern was described as the application of multiple types of causal inferences: an older group responding consistent with the Bayes net account (Gopnik et al., 2004), a group imitating the experimenter, and a younger group responding consistent with causal inference on the basis of associative models. The existence of this third group suggests a developmental progression from inferring associations to the construction of causal maps. The results demonstrate the importance of accounting for individual differences when studying the development of causal inference.
introductionYoung children have causal knowledge in a variety of domains (e.g. Bullock, Gelman & Baillargeon, 1982 in Gopnik et al., 2004; Gelman & Wellman, 1991; Wellman, 1990). The question that has dominated the literature on children’s causality for the last decade is how new causal relations are learned and represented (Gopnik et al., 2004; Sobel, Tenenbaum & Gopnik, 2004). Several studies have shown that children are capable of making causal inferences in an unfamiliar domain from a very young age (Gopnik, Sobel, Schulz & Glymour, 2001; Schulz & Gopnik, 2004; Sobel & Kirkham, 2006; Sobel et al., 2004). Many of these studies investigated whether young children’s inferences are in line with the Bayes net account, a computational theory of children’s causal learning (see Gopnik et al., 2004 for an outline of the account). Researchers in these studies presented children with interventions1 and correlations among events and then tested whether children’s responses were consistent with the construction of causal maps, which are abstract, coherent, learned representations of causal relations (Gopnik et al., 2004). Excitingly, very young children appeared to construct causal maps to represent observed evidence (e.g. Gopnik et al., 2001; Sobel & Kirkham, 2006).
A paradigm that has often been used in these studies is the blicket detector (Gopnik & Sobel, 2000; Nazzi & Gopnik, 2000). This is a machine that activates (lights up and plays music) when some objects (blickets), but not others, are placed on it. The paradigm allows for testing

Development of causal learning | 81
how new causal relations are learned, because one can largely control the evidence learners are presented with. Each blicket detector trial is designed to measure a learner’s capability to make a specific causal inference. In many studies, inferences and corresponding trials have been selected that enable researchers to distinguish between responses consistent with the Bayes net account and responses consistent with other types of causal inferences, such as causal inference on the basis of associative models (see Gopnik et al., 2004 and Sobel et al., 2004 for an overview of learning mechanisms; De Houwer & Beckers, 2002). Below we will briefly discuss a couple of trials that are relevant for the present study: screening-off, indirect screening-off and backwards blocking.
Several studies have demonstrated that the majority of 19-, 24- and 30-month-olds (Gopnik et al., 2001; Sobel & Kirkham, 2006) and 3- to 5-year-olds (Gopnik et al., 2001; Schulz & Gopnik, 2004) make inferences consistent with the Bayes net account on screening-off trials (Reichenbach, 1956). Children did not consider a target object that did not activate the machine by itself, but activated the machine in the presence of an established blicket, to be a blicket.
Other studies have investigated young children’s ability to make retrospective inferences (Sobel et al., 2004). It has been shown that the majority of 24-month-olds (Sobel & Kirkham, 2006) and 3- and 4-year-olds (Sobel et al., 2004), but not the majority of 19-month-olds (Sobel & Kirkham, 2006) make inferences consistent with the Bayes net account on indirect screening-off trials.2 When a target object activated the machine in the presence of a second object and the second object was subsequently shown not to activate the machine by itself, children considered the target object to be a blicket. A second retrospective inference is backwards blocking. It has been shown that the majority of 4-year-olds, but not the majority of 3-year-olds (Sobel et al., 2004) make inferences consistent with the Bayes net account on backwards blocking trials. When a target object activated the machine in the presence of a second object and the second object was subsequently shown to activate the machine by itself, children, most of the time, did not consider the target object to be a blicket. As the associative strength of the target object is the same in indirect screening-off and backwards blocking trials, the asymmetry in children’s classification of this object on the two retrospective trials has been used to rule out causal inference based on associative models (e.g. Dickinson, 2001; Rescorla & Wagner, 1972; Shanks & Dickinson, 1987) as a possible mechanism accounting for children’s causal learning (Sobel & Kirkham, 2006; Sobel et al., 2004).
development & individual differencesSome developmental differences have been uncovered in the studies described above (Sobel & Kirkham, 2006; Sobel et al., 2004). For example, 4-year-olds were found to give responses that were in line with the Bayes net account on backwards blocking trials, while 3-year-olds were not (Sobel et al., 2004). The conclusions with regard to these developmental differences
82 | Chapter 5
were based on the average behavior of children within age groups. However, these studies showed sizable variance within age groups. Within age groups with a majority of children responding consistent with the Bayes net account, percentages ranged from 72 to 100 for screening-off inferences (Gopnik et al., 2001; Schulz & Gopnik, 2004; Sobel & Kirkham, 2006) and from 76 to 100 for indirect screening-off and backwards blocking inferences (Sobel et al., 2004; Sobel & Kirkham, 2006). The aim of the present study was to further investigate the development of young children’s ability to use causal inference by studying these individual differences. In particular, it was investigated whether individual differences exist in the type of causal inferences children make and whether these differences are age-related. The study uniquely contributes to the literature by administering a series of carefully selected causal inference trials to children of a relatively broad age range and analyzing individuals’ response patterns over trials with a categorical latent variable technique.
Individual differences in children’s causal inference could be caused by different sources of variance. A first possible source is the existence of individual differences in the type of causal inferences children make, which could be related to age. Besides a group of children using Bayesian inference,3 a subgroup of children might use an alternative learning mechanism resulting in a different type of causal inference (see Gopnik et al., 2004 and Sobel et al., 2004 for an overview of learning mechanisms). Individual differences in type of causal inference could also result from a subgroup of children not making causal inferences, but applying a task related strategy, such as imitating the experimenter (e.g. Sobel & Kirkham, 2006). Another source of variance could result from children making errors in causal inference. For example, children may use a specific type of causal inference, but may make mistakes in applying this mechanism. Both abovementioned sources of variance could also hold simultaneously. Therefore, in this study we aimed to answer three questions: (1) Do children show different types of causal inferences? (2) Can these types of causal inferences be characterized in terms of learning mechanisms or task-related strategies? (3) Are these different types of causal inference age-related?
the present studyFor the purpose of answering the research questions, Siegler’s (1976, 1981) Rule-Assessment Methodology was applied in the present study. That is, a series of carefully selected causal inference trials was administered to participants from a broad age range: 2-to 5-year-olds. Instead of analyzing the group’s responses on each trial separately, individuals’ response patterns over trials were analyzed. Trials were selected because of their frequent use in previous work and because children had shown considerable variance in their responses on them. Another reason for selection was that these trials are suitable for distinguishing

Development of causal learning | 83
between different types of causal inferences. In the next paragraph the purpose of each of the trials will be discussed briefly, in the Method section the trials are described in detail.
The first two test trials were used to discriminate between children giving responses consistent with the Bayes net account and children giving responses consistent with a task-related strategy: imitation of the experimenter. The first trial was a screening-off trial (e.g. Gopnik et al., 2001) and the second trial was a variant of Schulz and Gopnik’s (2004) indirect screening-off trial in which children are not shown information about single candidate causes. On both of these trials, children responding consistent with the Bayes net account were expected to respond to the question “Can you make the machine go?” by putting the causally efficacious block on the detector, while children responding consistent with the imitation strategy were expected to imitate the action of the experimenter that most frequently led to the activation of the machine.4 The remaining three test trials were used to discriminate between children giving responses consistent with the Bayes net account and children giving responses consistent with causal inference based on associative models (e.g. Dickinson, 2001; Rescorla & Wagner, 1972; Shanks & Dickinson, 1987; Sobel et al., 2004). The third trial was an indirect screening-off trial and the fourth trial was a backwards blocking trial (e.g. Sobel et al., 2004). Work on adult reasoning showed that participants classified a target object that caused an effect in the presence of a second object differently, dependent on whether participants subsequently did or did not see the second object cause the effect by itself (Shanks, 1985 in Sobel et al., 2004; Shanks & Dickinson, 1987). This performance can be explained by the Bayes net account, but not by associative models (Sobel et al., 2004). Therefore, children responding consistent with the Bayes net account were expected to mimic adult behavior and show an asymmetry in the classification of the target object on both trials, while children responding consistent with causal inference based on associative models were expect to classify the target object equally often as a blicket on both trials (Sobel et al., 2004). The fifth trial was a variant of Gopnik and Sobel’s (2000) and Nazzi and Gopnik’s (2003) non-causal association trials. On this trial, children responding consistent with the Bayes net account were expected to respond to the question “Can you make the machine go?” by using the object that was in physical contact with the machine during activation, while children responding consistent with causal inference based on associative models were expect to use object(s) that were present during activation, but not in contact with the machine (see Method section).
By means of the statistical technique Latent Class Analysis (McCutcheon, 1987) categorical differences in response patterns were modeled (see Method section for an introduction to this technique). Finally, the resulting model (see Results section) was interpreted in the light of possible sources of variance in children’s causal inference (see Discussion section).
84 | Chapter 5
methodParticipantsThe final sample consisted of seventy-eight children (35 boys and 43 girls): 13 2-year-olds (M=29.38 months, SD=3.71), 21 3-year-olds (M=40.71 months, SD=3.52), 23 4-year-olds (M=54.39 months, SD=2.98) and 21 5-year-olds (M=67.33 months, SD=2.44) recruited from two daycare centers and a primary school. Sixteen other children were recruited but not included in the analyses: 2 refused to participate, 1 could not be tested due to failure of the blicket detector, 11 (8 2-year-olds and 3 3-year-olds) were excluded for failing the training trials (see Procedure section) and 2 (a 2-year-old and a 5-year-old) were excluded due to a missing value on one of the test trials. Although most children were from White, middle-class backgrounds, a range of ethnicities reflecting the diversity of the population was represented.
MaterialsThe blicket detector (Gopnik & Sobel, 2000; Nazzi & Gopnik, 2000) was used. The detector was made of grey plastic with an orange top and measured 7.4 x 4.3 x 2.8 in. (18.8 x 10.8 x 7 cm). A hand held remote control, hidden from the child’s view, was used to control whether objects activated the detector. When the remote control was pressed the detector activated (it lit up and played music) when an object with a minimum weight of 50 grams was placed on the orange top. When the remote control was pressed again the detector did not activate when objects were placed on the orange top.5 Objects that activated the detector did so as soon as they made contact with it and deactivation immediately followed the removal of the objects from the detector. Ten sets of unique objects, 22 in total, were used: 5 sets of weighted wooden blocks and 5 sets of weighted plastic toys of different shapes and colors (2 sets of fruits, 1 set of ducks and 2 sets of bowling pins). The distribution of the objects over the trials was counterbalanced (2 versions).6
ProcedureChildren were tested individually by one of three female experimenters in a private room at their daycare center or at their school. The child sat facing the experimenter at a table. The blicket detector was on the experimenter’s side of the table sitting on a grey tray. The experimenter introduced the blicket detector to the children by saying (in Dutch): “We are going to play with this machine. The machine goes on if some things are placed on top of it. If other things are placed on top of the machine it does not go on. You need to help me figure out which things make the machine go.” Children were then shown a fixed order of ten trials: three training trials (A, B, C), two test trials (1, 2), two more training trials (D, E) and three more test trials (3, 4, 5).7 The side of the detector where the causally efficacious object was placed on each of the trials was counterbalanced (2 versions with alternating sides).

Development of causal learning | 85
Training trials A, B and C. The training trials were used to familiarize participants with the two types of responses that were required for the different test trials: an intervention to make the machine go (test trial 1, 2 and 5) and a verbal response to the question “Does this one make the machine go?” (test trial 3 and 4). The training trials also served as control trials to ensure that children were on-task and understood the nature of the task.8 In order to be included in the analyses, participants had to answer a minimum of four out of five training trials correct. In trial A children were shown two new objects: X and Y. The experimenter placed object X on the machine by itself, the machine activated and she said: “See, it makes the machine go.” The experimenter then placed object Y on the machine by itself, the machine did not activate and she said: “See, it does not make the machine go.” Subsequently the experimenter slid the tray with the detector and two objects alongside it towards the child and asked: “Can you make the machine go?”9 The child was allowed to make one response after which the experimenter slid the tray back to her side of the table. If the child placed the causally efficacious object (A) on the machine, it activated. Training trial B and C were similar to trial A, except that in trial B the second object was the causally efficacious one and in trial C the experimenter did not state anymore that objects did or did not make the machine go.
Test trial 1. Trial 1 was a screening-off trial. Children were shown two new objects: X and Y. The experimenter placed object X on the machine and the machine activated. The experimenter placed object Y on the machine and the machine did not activate. She then placed both objects on the machine together and the machine activated. This action was repeated. Subsequently the experimenter followed the procedure of training trial A and asked the child to make the machine go. On this trial, the response consistent with the Bayes net account is to put the causally efficacious object on the machine (object X). Causal inference based on associative models generates the same response.10 However, the use of the imitation strategy predicts another response: imitation of the experimenter’s action that most frequently led to the activation of the machine (objects X & Y).
Test trial 2. Trial 2 was an indirect screening-off trial in which children were not shown information about single candidate causes. Children were shown three new objects: X, Y and Z. The experimenter placed object X and Z on the machine together and the machine activated. She placed object Y and Z on the machine together and the machine activated. She then placed object X and Y on the machine together and the machine did not activate. Subsequently the experimenter followed the procedure of training trial A and asked the child to make the machine go. On this trial, the response consistent with the Bayes net account is to put the causally efficacious object on the machine (object Z). Causal inference based on associative models generates the same response.9 However, the use of the imitation strategy predicts another response: imitation of the experimenter’s action that most frequently led to the activation of the machine (objects X & Z or Y & Z).

86 | Chapter 5
Training trials D and E. In trial D children were shown two new objects: X and Y. The experimenter placed each object on the machine by itself. Object X did not activate the machine, object Y did. Subsequently the experimenter showed the child object X and asked “Does this one make the machine go?” She then showed the child object Y and asked “Does this one make the machine go?” Trial E was similar to trial D, except that in this trial the first object was the causally efficacious one.
Test trials 3 and 4. Trial 3 was an indirect screening-off trial. Children were shown two new objects: X and Y. The experimenter placed both objects on the machine together and the machine activated. This was demonstrated twice. The experimenter then placed object X on the machine by itself and the machine did not activate. Subsequently the experimenter used the procedure of training trial D and asked the child if each object made the machine go. Trial 4 was a backwards blocking trial. It was similar to trial 3, except this time when object X was placed on the machine by itself, it did activate. On these trials, the Bayes nets account predicts that on the question of whether target object Y makes the machine go, the proportion of affirmative responses on trial 4, the backwards blocking trial, will be smaller than the proportion of affirmative responses on trial 3, the indirect screening-off trial. However, causal inference based on associative models predicts an equal proportion of affirmative responses on both trials: participants would indicate that target object Y makes the machine go twice. As participants were asked to answer a question on these trials, but not to make the machine go, no prediction could be formulated for the imitation strategy.
Test trial 5. Trial 5 was a non-causal association trial. Children were shown three new objects: X, Y and Z. Object X was held slightly above the machine, the experimenter pressed the top of the machine with her finger and the machine activated. The same was done for object Y. Then object Z was held slightly above the machine, the experimenter placed her finger near the machine but would not press it and the machine did not activate. Subsequently the experimenter followed the procedure of training trial A and asked the child to make the machine go. On this trial, the response consistent with the Bayes net account is to press the top of the machine with a finger. However, the response consistent with causal inference based on associative models is to use an object that was associated with the effect or both objects, as they have the same associative strength (object X, object Y or objects X & Y). 9 Last, the response consistent with the imitation strategy is to hold an associated object above the machine in combination with the use of a finger (object X & finger or object Y & finger).
statistical approachTo analyze the response patterns on the test trials Latent Class Analysis (LCA; McCutcheon, 1987) was used. It has been shown that LCA provides a statistically more reliable method to detect different types of response patterns than techniques based on matching observed
Development of causal learning | 87
response patterns with expected response patterns (Van der Maas & Straatemeier, 2008). LCA is a standard statistical technique for models with categorical, manifest variables and a categorical latent variable. Latent Class Models (LCM) describe categorically different response patterns in terms of latent classes. In the present study the classes can be interpreted as different types of causal inferences. In previous research in the field of child development LCA has been used to investigate children’s rule-use on the balance scale task (Boom, Hoijtink, & Kunnen, 2001; Jansen & Van der Maas 1997, 2001, 2002), children’s mental models of the earth (Straatemeier, Van der Maas & Jansen, 2008) and children’s free classification (Raijmakers, Jansen & Van der Maas, 2004). Because several introductions to LCA exist (e.g. McCutcheon, 1987; Rindskopf, 1987), in this paper only a brief description of the technique is given.
In this study exploratory LCA was used to determine the number of latent classes needed to model the data in the best and most parsimonious manner. The modeled data consisted of children’s response patterns to the test trials. To define an LCM one has to fix the number of latent classes, and subsequently estimate the unconditional probabilities and the conditional probabilities (the parameters). Unconditional probabilities define the class sizes (the frequency distribution of the different types of causal inferences). Conditional probabilities of a class indicate probabilities of responses to specific trials given membership of the class. To fit an LCM to the data, Log Likelihood estimates of the parameters are calculated with PANMARK (Van de Pol, Langeheine & De Jong, 1996). In LCA the optimal number of latent classes cannot be estimated or tested, yet model selection is based on the Bayesian Information Criterion (BIC, Schwartz, 1978); the model with the lowest BIC is considered to be the most parsimonious, best fitting model. Response patterns of classes do not need to be formulated beforehand, so the classes that are found can also represent unanticipated response patterns. Because this study’s data set was small compared to the number of possible response patterns, the parametric bootstrap method (Langeheine, Pannekoek & Van de Pol, 1995) was used to determine the absolute fit of the selected model. A large, nonsignificant, bootstrapped p-value indicates a good fit of the model to the data.
resultsgeneralIn order to analyze the same data for all test trials with all techniques (standard and latent variable techniques), responses were rescored in a binary way: responses consistent with and responses inconsistent with the Bayes net account. Test trial 5 was not included in the analyses, because there was not enough variation in children’s responses on his trial. Only two children (3%) had responses in line with the Bayes net account whereas the other 76 did

88 | Chapter 5
not.11 Preliminary χ2 tests showed that neither the distribution of the blocks over the trials, nor the side of the detector where the causally efficacious object was placed affected the proportion of responses consistent with the Bayes net account on each of the four remaining test trials.
Comparison results to previous studiesTest trial 1, the screening-off trial, test trial 3, the indirect screening-off trial and test trial 4, the backwards blocking trial, had been administered with the exact same procedures in previous studies. Hence, we could compare the responses of participants in this study to those of children of comparable ages in previous studies. For the screening-off trial, the proportion of responses consistent with the Bayes net account did not differ between the 2-year-olds in this study and the 2-year-olds in Sobel and Kirkham’s (2006) study. For the indirect screening-off trial and the backwards blocking trial, the proportion of responses consistent with the Bayes net account did not differ between the 3-year-olds in this study and the 3-year-olds in Sobel et al.’s (2004) study. For the indirect screening-off trial, this was also the case for the 4-year-olds in this study and the 4-year-olds in Sobel et al.’s first two experiments. For the backwards blocking trial, the proportion of responses consistent with the Bayes net account did not differ between the 4-year-olds in this study and the 4-year-olds in Sobel et al.’s (2004) first experiment, but did differ between the 4-year-olds in this study and the 4-year-olds in Sobel et al.’s (2004) second experiment (χ(1)=7.04, p=.01). Overall, our results were highly comparable to previous results (see Table 1 for an overview).
individual differences, latent Class AnalysesFirst, it was investigated whether children demonstrated different types of causal inferences. To this end, Latent Class Models (LCM; see Method section) with 1, 2, 3, and 4 classes were fit to the data: children’s binary response patterns on four causal inference trials. Table 2 shows the goodness-of-fit measures of these models. Based on the BIC values, it was found that a 3-class-model fit the data in the best and most parsimonious manner (good absolute fit: bootstrapped p-value of the difference between data and the model=.40), indicating that children demonstrated three different types of causal inferences. Table 3 shows the parameter estimates for the selected 3-class-model. The unconditional probabilities define one larger class (62%) and two smaller classes (21% and 17%).

Development of causal learning | 89
table 1. Comparison of children’s responses on causal inference trials in the present study with children’s responses on the same trials in previous studies; numbers and proportions of participants giving responses consistent (B) with and inconsistent (NB) with the Bayes net account.
Trial type Age Study B NB χ2
(mean age in months)
(experiment, year) (%) (%) (df, Fisher’s exact p-value)
Screening-off 2-year-olds (29.38) Present study test trial 1 8 (62) 5 (39)
2-year-olds (24.40) Sobel & Kirkham (1, 2006) 18 (72) 7 (28) 0.43 (1, .71)
Indirect screening-off
3-year-olds (40.71) Present study test trial 3 20 (95) 1 (5)
3-year-olds (44) Sobel et al. (1, 2004) 16 (100) 0 (0) 0.78 (1, 1)
4-year-olds (54.39) Present study test trial 3 22 (96) 1 (4)
4-year-olds (55) Sobel et al. (1, 2004) 16 (100) 0 (0) 0.71 (1, 1)
4-year-olds (58) Sobel et al. (2, 2004) 15 (94) 1 (6) 0.07 (1, 1)
Backwards blocking
3-year-olds (40.71) Present study test trial 4 14 (67) 7 (33)
3-year-olds (44) Sobel et al. (1, 2004) 8 (50) 8 (50) 1.05 (1, .34)
4-year-olds (54.39) Present study test trial 4 22 (96) 1 (4)
4-year-olds (55) Sobel et al. (1, 2004) 14 (88) 2 (13) 0.88 (1, .56)
4-year-olds (58) Sobel et al. (2, 2004) 10 (63) 6 (38) 7.04 (1, .01)
Note. See Method section for the description of the trials and the specific responses on each trial consistent with the Bayes net account. Note well: Sobel et al. (2004) administered both the indirect screening-off and the backwards blocking trials twice. They did not report the responses on the first and second administration separately, but did mention that these did not differ significantly. Therefore, in this Table we reported their results as if both administrations rendered exactly the same responses.
table 2. Goodness-of-fit measures for Latent Class Models of responses to four causal inference trials.
Number of classes L df BIC
1 -154.25 4 325.93
2 -140.48 8 311.46
3 -138.00 8 306.51
4 -137.36 4 322.65
Note. L=Log Likelihood, df=degrees of freedom, BIC=Bayesian Information Criterion. The degrees of freedom are calculated by the number of freely estimated parameters minus the number of parameters estimated at the boundary. The 4-class model is poorly identified (McCutcheon, 1987).
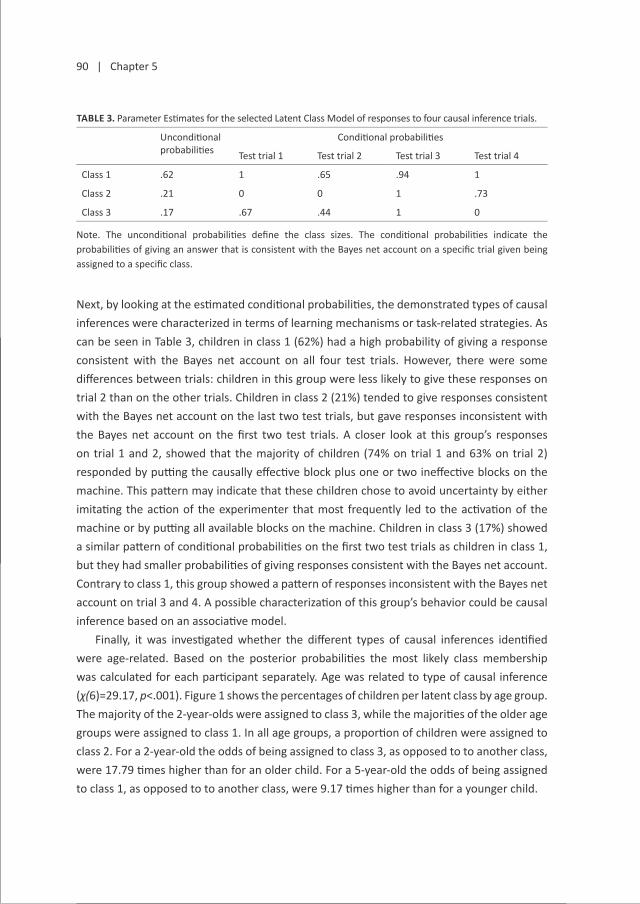
90 | Chapter 5
table 3. Parameter Estimates for the selected Latent Class Model of responses to four causal inference trials.
Unconditional probabilities
Conditional probabilities
Test trial 1 Test trial 2 Test trial 3 Test trial 4
Class 1 .62 1 .65 .94 1
Class 2 .21 0 0 1 .73
Class 3 .17 .67 .44 1 0
Note. The unconditional probabilities define the class sizes. The conditional probabilities indicate the probabilities of giving an answer that is consistent with the Bayes net account on a specific trial given being assigned to a specific class.
Next, by looking at the estimated conditional probabilities, the demonstrated types of causal inferences were characterized in terms of learning mechanisms or task-related strategies. As can be seen in Table 3, children in class 1 (62%) had a high probability of giving a response consistent with the Bayes net account on all four test trials. However, there were some differences between trials: children in this group were less likely to give these responses on trial 2 than on the other trials. Children in class 2 (21%) tended to give responses consistent with the Bayes net account on the last two test trials, but gave responses inconsistent with the Bayes net account on the first two test trials. A closer look at this group’s responses on trial 1 and 2, showed that the majority of children (74% on trial 1 and 63% on trial 2) responded by putting the causally effective block plus one or two ineffective blocks on the machine. This pattern may indicate that these children chose to avoid uncertainty by either imitating the action of the experimenter that most frequently led to the activation of the machine or by putting all available blocks on the machine. Children in class 3 (17%) showed a similar pattern of conditional probabilities on the first two test trials as children in class 1, but they had smaller probabilities of giving responses consistent with the Bayes net account. Contrary to class 1, this group showed a pattern of responses inconsistent with the Bayes net account on trial 3 and 4. A possible characterization of this group’s behavior could be causal inference based on an associative model.
Finally, it was investigated whether the different types of causal inferences identified were age-related. Based on the posterior probabilities the most likely class membership was calculated for each participant separately. Age was related to type of causal inference (χ(6)=29.17, p<.001). Figure 1 shows the percentages of children per latent class by age group. The majority of the 2-year-olds were assigned to class 3, while the majorities of the older age groups were assigned to class 1. In all age groups, a proportion of children were assigned to class 2. For a 2-year-old the odds of being assigned to class 3, as opposed to to another class, were 17.79 times higher than for an older child. For a 5-year-old the odds of being assigned to class 1, as opposed to to another class, were 9.17 times higher than for a younger child.

Development of causal learning | 91
figure 1. Percentages of children per latent class by age group.
discussionThe aim of the present study was to further investigate the development of children’s capability for causal inference by focusing on individual differences. In particular, it was investigated whether individual differences exist in the type of causal inferences children make and whether these differences are age-related. By administering a series of carefully selected causal inference trials to children of a relatively broad age range and analyzing individuals’ response patterns over trials with a categorical latent variable technique, this study has made a unique contribution to the literature. The results demonstrated the added value of the individual differences approach. Three types of causal inferences best described children’s response patterns and these types were age-related. Even though the setup of this study does not allow for definite conclusions with regards to the learning mechanisms children used, examination of the literature did yield plausible explanations of the results.
The first group tended to give responses consistent with the Bayes net account (see Gopnik et al., 2004 for the outline of the account). This was a relatively large group mostly consisting of children in the older age-range. Several learning mechanisms have been proposed that might account for these responses. Gopnik et al. (2004) described two computational approaches, Bayesian methods (e.g. Glymour, 2001; Gopnik & Glymour, 2002 in Sobel et al., 2004; Steyvers, Tenebaum, Wagenmakers & Blum, 2003) and constraint-based methods (e.g. Scheines, Spirtes, Glymour & Meek, 1994 in Gopnik et al., 2004), and two psychological
Age in years
Perc
enta
ge o
f chi
ldre
n pe
r age
gro
upClass 1
Class 2
Class 3
2 3 4 5
100
80
60
40
20
0

92 | Chapter 5
approaches, causal learning on the basis of associative models (e.g. Dickinson, 2001; Rescorla & Wagner, 1972; Shanks & Dickinson, 1987) and Cheng’s power PC method (Cheng, 1997). Based on their review they concluded that children’s learning mechanisms extended beyond the psychological methods in their current forms and were in line with the Bayesian method. Sobel et al. (2004) came to a similar conclusion. Based on children’s performance on backwards blocking trials, they excluded causal learning based on associative models. To distinguish between parameter estimation models, such as Cheng’s power PC method, and Bayesian methods, they designed a task in which the prior probability of an outcome had to be used to disambiguate observed data (Sobel et al., 2004). The authors considered 4-year-olds’ performance on this task to go beyond the predictions of parameter estimation models. They proposed a Bayesian method making use of substantive prior knowledge as a mechanism for children’s causal learning (Tenenbaum & Griffiths, 2003).
The second group’s responses deviated from the first group’s responses on the screening-off and indirect screening-off trials. This was a relatively small group consisting of children of all ages. The group’s responses point towards the use of a task-related strategy. As children were asked to make the machine go without being told to use only one block, children in this group might have chosen to avoid uncertainty and respond in a manner that they had observed to work.
The third group mainly deviated from the first group in their pattern of responses on the indirect screening-off and backwards blocking trials. This was a relatively small group consisting of children in the younger age-range. This group’s pattern of responses cannot be explained by a yes-bias, as the majority of this group (63.60 %) responded “no” when asked if block X made the machine go on trial 3. However, this group’s responses are consistent with causal inference based on associative models (e.g. Dickinson, 2001; Rescorla & Wagner, 1972; Shanks & Dickinson, 1987; Sobel et al., 2004). The existence of this third group, contradicts the exclusion of causal inference based on associative models as a mechanism used for causal inference (e.g. Gopnik et al., 2004; Sobel et al., 2004). It suggests that in the development of children’s causal inference, causal inference based on associative models might precede Bayesian inference. This developmental pattern is not unlikely as associative reasoning is a powerful learning mechanism in infancy (e.g. Kirkham, Slemmer & Johnson, 2002; Saffran, Aslin & Newport, 1996). Children using causal inference based on associative models either do not have a Bayesian inference system at their disposal or do not use it under certain task constraints (Sobel et al., 2004). The latter option could also be the case in the present study. As this study did not set out to investigate the minimum age at which a child is capable of using a specific mechanism for causal inference, children in the third group might be able to use Bayesian inference under different task constraints. This idea is consistent with Sobel and Kirkham’s (2006) finding that 8-month-old infants’ predictive inferences were consistent with the Bayes net account.

Development of causal learning | 93
The method that was used in this study allows for disentangling different sources of variance. As described above, part of the variance in children’s causal inference resulted from the different types of causal inference children applied. However, another part of the variance was caused by children making mistakes in applying these types of causal inferences. For example, this was shown by the first and third group’s performance on trial 2. On the basis of the proposed learning mechanisms, children in these groups would be expected to give a response consistent with the Bayes net account. However, compared to other trials, children in both groups were less likely to do so (see Table 3). A possible explanation for these mistakes is that trial 2 places relatively high demands on a child’s memory. In this trial no blocks were placed on the detector by itself, the causal structure had to be deduced from three consecutive pairings of blocks. A close look at the characteristics of the different groups also reveals a relatively high variance in the third group’s responses on the first two trials (see Table 3). This group consisted of children in the younger age-range and possibly they suffered from information processing limitations or a lack of substantial prior knowledge (cf. Sobel et al., 2004).
This study introduced a new approach for investigating the development of children’s causal inference: a focus on individual differences. Several recommendations for future research could be given. Trials could be chosen that enable distinguishing other possible mechanisms. For example, by using base rate trials, response patterns consistent with Bayesian inference could be distinguished from response patterns consistent with parameter estimation models (Sobel et al., 2004; Sobel & Munro, 2009). However, as argued by Steyvers et al. (2003), questions related to the mechanisms of causal inference are difficult to answer. Steyvers et al. (2003) designed a powerful paradigm to study adult causal inference processes and outcomes based observations and interventions. Taking into account psychologically reasonable representational assumptions and computationally reasonable processing constraints, they showed that adults can reason in line with the principles of optimal Bayesian decision-making (Steyvers et al., 2003). However, the individual differences within their group of adults were large. Despite the fact that their paradigm yielded a detailed insight in people’s reasoning, they concluded that it was still difficult to reveal the mechanism of causal inference. The inferences they observed in their study could also be explained by relatively simple heuristics. However, the individual differences approach described in this paper is not only suited for studying the mechanisms of causal inference. For example, the approach could also be used to investigate how children’s causal inference depends on the context, such as the task constraints (e.g. Lagnado & Sloman, 2004) or the domain (e.g. Schulz & Gopnik, 2004; Sobel & Munro, 2009). The approach could also be used to enable distinguishing groups that apply certain substantial prior knowledge from groups that do not apply this knowledge (e.g. Lagnado & Sloman, 2006). Moreover, children’s cognitive capabilities, such as short-term memory capacity, could be related to the type of causal inference they use (cf. Schmittmann,

94 | Chapter 5
Van der Maas & Raijmakers, in press). In short, the individual differences approach can be considered a valuable tool in future work investigating the development of causal inference.
acknowledgementsThe research of Tessa van Schijndel is sponsored by an NWO-Aspasia grant and the Dutch Curious Minds program, which is supported by the Dutch Ministry of Education, Culture and Science and the Platform Bèta Techniek. The research of Maartje Raijmakers is sponsored by a NWO-VIDI grant. We would like to thank the daycare centers and primary school for their cooperation in the data collection. We thank research assistant Heleen Drapers for her help in collecting the data. We would like to express appreciation to Coos Hakvoort for the technical support. We also thank Ingmar Visser and Dorothy Mandell for statistical advice and comments on earlier drafts on the paper.

Development of causal learning | 95
notes1. Interventions are defined as actions that
directly manipulate objects (Gopnik et al.,
2004).
2. In a second experiment, Sobel & Kirkham
(2006) used an eye-tracking paradigm to
investigate 8-months-old’s retrospective
inferences. The results of this experiment are
not discussed here, as they reflect, as indicated
by the authors, predictive relations and not
necessarily causal relations.
3. The term “Bayesian inference” was used here
to refer to any mechanism that could account
for responses consistent with the Bayes net
account. See the Discussion section for a brief
overview of the proposed mechanisms in the
literature (Gopnik et al., 2004; Sobel et al.,
2004).
4. In this study children using an imitation
strategy were expected to imitate the action
of the experimenter that most frequently led
to the activation of the machine when asked
to make the machine go. The results of this
study partially validated this choice: a group
was found that behaved relatively consistent
with the predicted pattern of behavior for
this imitation strategy (74% of the group on
trial 1 and 63% on trial 2). Note that the used
methodology for analyzing different types of
causal inference ensured that our expectations
about the characteristics of a possible imitation
group did not influence the results (cf. Van der
Maas & Straatemeier, 2008).
5. A small LED at the back of the detector hidden
from the child’s view indicated the state of the
detector: allowing or not allowing activation.
6. Because a relatively long series of trials was
administered in this study, a large number
of unique objects was needed. To make sure
objects were clearly distinguishable, different
types of objects (wooden blocks, plastic,
fruits, plastic ducks, etc.) were used. However,
only one type of object was used per trial. To
check for effects of specific object types, the
distribution of the objects over the trials was
counterbalanced.
7. In this study the trials were administered in a
fixed order. First, this was done to make sure
that training trials in which a response type
was introduced preceded test trials in which
this response type was required. For example,
training trials A, B and C in which the child was
asked to make the machine go preceded test
trials 1 and 2 in which the same response type
was required. Second, this was done to make
sure that test trial 5 was always administered
last. This way, the use of the finger at trial 5
could not influence children’s responses on the
other trials. In previous blicket detector studies
order effects were investigated, but none were
found (e.g. Sobel & Kirkham, 2006; Sobel et al.,
2004).
8. In this study the training trials also served as
control trials. A possible risk of this procedure
could be that children would not be included
in the analyses, based on their performance
on the first training trials. Paired sample t-tests
showed that this was not the case: children did
not make more mistakes on the first training
trial of every sort (A and D) than on the second
and third training trials of every sort (B, C and
E).
9. In trials A, B, C, 1 and 2 children were asked
the question “What makes the machine go?
Can you point to it?” before they were asked

96 | Chapter 5
to make the machine go. This was done to
check whether responses on the go-questions
were influenced by children’s limited motor
skills. If a child intended to respond to a go-
question by putting multiple objects on the
machine, but as a result of limited motor skills
put the objects on the machine one by one,
the experimenter could have slid the tray away
after the first object and the child’s reasoning
would not have been captured by the trial. The
pointing-questions served as a check whether
this was the case. However, as a considerable
part of the younger participants in this study
did not understand the pointing-questions, the
responses on this question were not used for
further analyses.
10. In this study, children using causal inference on
the basis of associative models were expected
to put the object that was most associated
with the effect on the machine when asked
to make the machine go. On trial 1, this group
was expected to use object X, as this object was
associated with the effect 3/3 times, while this
was 2/3 times for object Y. On trial 2, this group
was expected to use object Z, as this object was
associated with the effect 2/2 times, while this
was 1/2 times for object X and Y. On trial 5, this
group was expected to use object X and/ or Y,
as these objects were associated with the effect
1/1 times, while this was 0/1 times for object Z
and 2/3 times for the finger. The results of this
study partially validate this choice: a group was
found that behaved relatively consistent with
the predicted pattern of behavior for causal
inference on the basis of associative models
(See Table 3). Note that the used methodology
for analyzing different types of causal inference
ensured that our expectations about the
characteristics of a possible associative group
did not influence the results (cf. Van der Maas
& Straatemeier, 2008).
11. In this study, 2 (3%) children did and 76 (97%)
children did not respond consistent with
the Bayes nets account on the non causal
association trial (trial 5). Of the group who
did not respond consistent with the Bayes net
account, 37 (49%) used one or two associated
objects, 19 (25%) used the non-associated
object or a combination of non-associated
and associated objects, 11 (15%) used an
associated object and a finger, 7 (9%) used a
non-associated object and a finger and 2 (3%)
gave a response that could not be scored. When
administering a non causal association trial to
30-month-olds, Nazzi and Gopnik (2003) found
a larger proportion of responses consistent with
the Bayes net account (27%). These different
findings can be explained by differences in
procedures between both studies, such as the
number of times the trial was administered and
the number of objects children could choose
from to make the machine go.

chaPter 6
Young children perform better experiments after observing evidence conflicting with their prior knowledge
Van Schijndel, T. J. P., Visser, I., Van Bers, B. M. C. W., & Raijmakers, M. E. J. Preschoolers perform better experiments after observing evidence conflicting with their prior knowledge. Manuscript in revision.
98 | Chapter 6
abstractThis study investigates the role of young children’s prior knowledge in guiding their exploration and learning. In the preschooler age group, we examine the effect of evidence conflicting with children’s naïve theory on the quality of their exploratory play. In 4- to 9-year-olds, we study, in a more explorative manner, how children’s naïve theories and quality of play are related to their causal learning. Children’s naïve theories on shadow size are assessed by using a latent variable technique. Quality of play is determined by the number of unconfounded, informative experiments children perform during play. Results show an effect of conflicting evidence on the quality of play, and specific relationships between children’s prior knowledge, quality of play, and learning.
introduction“Young children construct knowledge by active exploration.” Though this Piagetian claim is widely accepted, there is little evidence demonstrating how this process takes place (Schulz & Bonawitz, 2007). The claim implies that young children are capable of integrating observed evidence with prior knowledge to formulate hypotheses, designing experiments, and drawing conclusions that enable learning. This process requires the use of substantive domain-specific knowledge, as well as formal knowledge: more general abilities that allow for translating hypotheses into effective experiments and drawing conclusions from those experiments (Gopnik, Sobel, Schulz & Glymour, 2001; Gopnik et al., 2004). Several studies on the primary school age group investigated how children’s prior knowledge (substantive knowledge) and exploration (formal knowledge) interact during discovery learning (e.g. Dunbar & Klahr, 1989; Schauble, 1990). However, few studies on the preschooler age group took into account both these types of knowledge in investigating children’s causal learning.
Studies on preschoolers’ exploration have focused on effects of characteristics of evidence on the duration and quality of children’s play. It was shown that children’s exploratory play is affected by the novelty of evidence (e.g. Berlyne, 1960; Henderson & Moore, 1980) and the ambiguity of evidence (Gweon & Schulz, 2008; Schulz & Bonawitz, 2007). The interaction between children’s prior knowledge and the evidence they observe has also been shown to influence their exploratory play (Bonawitz, Van Schijndel, Friel & Schulz, 2012; Cook, Goodman & Schulz, 2011; Legare, Gelman & Wellman, 2010; Legare, 2012). For example, Legare et al. (2010) and Legare (2012) demonstrated that evidence conflicting with 3- to 5-year-olds’ prior knowledge affects their explanatory reasoning, which in turn guides their exploration.
The majority of studies on causal learning in preschoolers, however, have not focused on children’s learning from their own play, but on children’s learning from evidence supplied by adults (Bonawitz et al., 2012). One line of work investigates children’s ability to draw causal inferences from patterns of evidence (e.g. Gopnik et al., 2001, 2004; Sobel & Kirkham, 2006;
Conflicting evidence and exploratory play | 99
Sobel, Tenenbaum & Gopnik, 2004), while another line of work investigates how children’s causal learning is affected by the interaction between their prior knowledge and the evidence they observe (Schulz, Bonawitz, & Griffiths, 2007; Sobel et al., 2004). For example, Schulz, Bonawitz and Griffiths (2007) demonstrated that 5-year-olds, in contrast to 3- and 4-year-olds, are capable of learning from evidence conflicting with their prior knowledge.
The few studies that have investigated preschoolers’ causal learning from exploratory play, demonstrated that this learning is possible, though not self-evident: learning only took place in a limited subset of children (Gweon & Schulz, 2008; Schulz, Gopnik & Glymour, 2007). Bonawitz et al. (2012) took into account children’s prior knowledge in investigating their learning from play. The study was performed with an age group that was slightly older than the preschool age group: 6- and 7-year-olds. Children’s prior knowledge in the domain of balance was assessed and children were classified as having a center theory (objects balance on their geometrical center), or a mass theory (objects balance on their center of mass). Children were then confronted with evidence that either confirmed or conflicted with their theory. Bonawitz et al. (2012) found that children who were confronted with evidence conflicting with their balancing theory played longer with the balancing toy than children who were confronted with evidence that confirmed their theory. After play children were asked a final question to see whether their beliefs had changed. The authors found that children who were confronted with conflicting evidence were more likely to change their beliefs than children who were confronted with confirming evidence. In addition, as in Gweon and Schulz’s (2008) study, children’s learning was dependent on the actions they performed during play. When an explanatory auxiliary variable (magnet) was present that could explain the evidence, the minority (44%) of children who initially believed that an object balances on its geometrical center learned that it actually balances on its center of mass after seeing conflicting evidence. This learning was related to generating evidence during play that could not be explained by the magnet. When no magnet was present, the majority (63%) of the center-theorists changed their beliefs after seeing conflicting evidence.
The present study further investigates the role of young children’s prior knowledge in guiding their exploratory play and learning. Previous work demonstrated that evidence conflicting with young children’s prior knowledge affects the duration of their exploratory play (Bonawitz et al., 2012). This study examines whether evidence conflicting with children’s prior knowledge also affects the quality of children’s play. Primarily, this is investigated in the preschooler age group. As some studies have demonstrated effects of prior knowledge (e.g. Schulz, Bonawitz & Griffiths, 2007; Sobel et al, 2004) and the quality of play (Bonawitz et al., 2012; Gweon and Schulz, 2008) on young children’s learning, a second goal of the present study is to examine in more detail the relationship between these factors and children’s learning. For example, we distinguish multiple types of prior knowledge and investigate, in an explorative manner,
100 | Chapter 6
how these types relate to children’s knowledge acquisition through play. To make sure there is sufficient variation in prior knowledge, we answer this research question by looking at a broad age group: 4- to 9-year-olds.
Some studies on young children’s exploration and causal learning have been carried out in ecologically valid contexts, in which children presumably already have some prior knowledge (e.g. Bonawitz et al., 2012; Schulz, Bonawitz & Griffiths, 2007). These studies rely on a large body of research on young children’s knowledge in a variety of areas, such as astronomy, biology, physics, and psychology (e.g. Flavell, Green & Flavell, 1995; Gelman & Wellman, 1991; Gopnik & Meltzoff, 1997; Hatano & Inagaki, 1994; Inagaki & Hatano, 1993; Jansen & Van der Maas, 2002; Kalish, 1996; Siegler, 1981; Straatemeier, Van der Maas & Jansen, 2008; Wellman & Gelman, 1992). Other studies have used an artificial novel context in order to experimentally control children’s prior knowledge (e.g. Cook et al., 2011; Legare, 2012; Legare et al., 2010; Sobel et al., 2004). However, as the representation of knowledge that children acquire in an artificial context over a brief time span is expected to differ from that of the knowledge children have acquired throughout their daily lives, in the current study we choose to investigate young children’s exploration and learning in an ecologically valid context: the domain of shadow size (e.g. Chen 2009; Ebersbach & Resing, 2007; Feher & Rice, 1988; Fleer, 1996; Howe, Tolmie, Duchak-Tanner & Rattray, 2000; Inhelder & Piaget, 1958; Segal & Cosgrove, 1993; Siegler, 1978, 1981). There is discussion of whether children’s knowledge in ecologically valid contexts is coherent, theory like, or fragmented (see DiSessa, Gillespie, & Esterly, 2004 for a review). We deal with this issue in a methodological way by using an advanced statistical technique to show that children’s knowledge on shadow size is coherent (see Van der Maas & Straatemeier, 2008). Therefore, in the remainder of this paper we will refer to this (prior) knowledge as children’s naïve theories, or rules.
The shadow task was developed to investigate children’s naïve theories on shadow size (Inhelder & Piaget, 1958; Siegler, 1978, 1981). The set up of the task, the shadow machine (see Figure 1), consists of two light sources, a screen placed at a fixed distance of these light sources, and objects of different sizes that can be placed at different locations in between the light sources and the screen. For each item the experimenter puts two objects in place and asks the child which of two shadows would be the biggest. Siegler (1981) assessed the naive theories, or rules, 3- to 12-year-olds use on this task. Besides a group of children, mostly 3- and 4-year-olds, that did not use a rule, Siegler distinguished four different rule groups. Children using Rule 1, mostly 4- and 5-year-olds, took into account the size dimension, but not the distance dimension in determining shadow size. Children using Rule 2, mostly 8-year-olds, based their judgments on the size dimension, but in addition considered the distance dimension if the object sizes were equal. Children using Rule 3 or 4, mostly 12-year-olds, always considered both dimensions in determining shadow size. When both dimensions
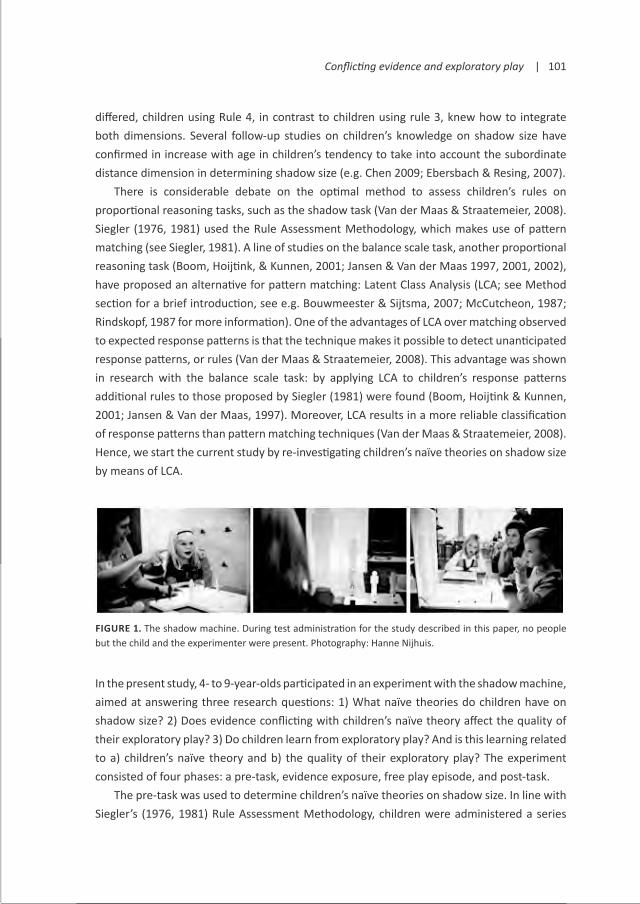
Conflicting evidence and exploratory play | 101
differed, children using Rule 4, in contrast to children using rule 3, knew how to integrate both dimensions. Several follow-up studies on children’s knowledge on shadow size have confirmed in increase with age in children’s tendency to take into account the subordinate distance dimension in determining shadow size (e.g. Chen 2009; Ebersbach & Resing, 2007).
There is considerable debate on the optimal method to assess children’s rules on proportional reasoning tasks, such as the shadow task (Van der Maas & Straatemeier, 2008). Siegler (1976, 1981) used the Rule Assessment Methodology, which makes use of pattern matching (see Siegler, 1981). A line of studies on the balance scale task, another proportional reasoning task (Boom, Hoijtink, & Kunnen, 2001; Jansen & Van der Maas 1997, 2001, 2002), have proposed an alternative for pattern matching: Latent Class Analysis (LCA; see Method section for a brief introduction, see e.g. Bouwmeester & Sijtsma, 2007; McCutcheon, 1987; Rindskopf, 1987 for more information). One of the advantages of LCA over matching observed to expected response patterns is that the technique makes it possible to detect unanticipated response patterns, or rules (Van der Maas & Straatemeier, 2008). This advantage was shown in research with the balance scale task: by applying LCA to children’s response patterns additional rules to those proposed by Siegler (1981) were found (Boom, Hoijtink & Kunnen, 2001; Jansen & Van der Maas, 1997). Moreover, LCA results in a more reliable classification of response patterns than pattern matching techniques (Van der Maas & Straatemeier, 2008). Hence, we start the current study by re-investigating children’s naïve theories on shadow size by means of LCA.
figure 1. The shadow machine. During test administration for the study described in this paper, no people but the child and the experimenter were present. Photography: Hanne Nijhuis.
In the present study, 4- to 9-year-olds participated in an experiment with the shadow machine, aimed at answering three research questions: 1) What naïve theories do children have on shadow size? 2) Does evidence conflicting with children’s naïve theory affect the quality of their exploratory play? 3) Do children learn from exploratory play? And is this learning related to a) children’s naïve theory and b) the quality of their exploratory play? The experiment consisted of four phases: a pre-task, evidence exposure, free play episode, and post-task.
The pre-task was used to determine children’s naïve theories on shadow size. In line with Siegler’s (1976, 1981) Rule Assessment Methodology, children were administered a series

102 | Chapter 6
of different item types: size items in which the size dimension is varied but the distance dimension is kept constant (see Figure 2A), and distance items in which the distance dimension is varied but the size dimension is kept constant (see Figure 2B). These items were selected to differentiate between a number of possible rules children could use. For example, children using Rule 1 were expected to answer the size items correctly, but to say “the same” on the distance items. Children using Rule 2 were expected to answer both the size- and distance items correctly. Latent Class Analysis was used to determine the different types of response patterns children demonstrated on the series. A priori we expected to find three groups: a group without systematic responses (Guess), a group only taking into account the size dimension (Rule 1), and a group taking into account both dimensions (Rule 2+).
The evidence exposure confronted children with evidence that was either conflicting with or confirming a specific naïve theory: Rule 1. In the conflicting condition children saw a small object having a bigger shadow than a large object. In the confirming condition children saw a small object having a smaller shadow than a large object. We decided to design the evidence for the Rule 1 group, because compared to the Rule 2+ group, which was expected to contain children using Rule 2 but also children using more advanced rules (see Siegler, 1981), we expected the Rule 1 group to be a relatively homogeneous group. This made it possible to construct evidence that would be conflicting with or confirming the predictions of the large majority of children classified as having Rule 1.
During the free play episode, children engaged in free exploratory play with the shadow machine. The quality of children’s play was determined by assessing how often during play they performed unconfounded experiments: experiments in which only one variable was varied. This type of experiments makes it possible to draw valid causal inferences. Previous work in an artificial context demonstrated that, in situations where information is to be gained, preschoolers selectively perform unconfounded actions (Cook et al., 2011). The current study was set up to investigate whether this is also the case in an ecologically valid context. Primarily, we investigated this in the Rule 1 group. Rule 1 children in the conflicting condition were expected to perform more unconfounded experiments during free play than Rule 1 children in the confirming condition. This prediction was driven by the fact that a child applying Rule 1 could logically explain conflicting evidence in one of two ways: 1) by assuming to be wrong about the direction of the effect of object size or 2) by assuming that, besides object size, there was another factor determining shadow size, distance being the most plausible one. Effectively testing either one of these hypotheses would imply the design of unconfounded experiments.
The post-task was used to assess children’s learning. Children’s naïve theories on shadow size were determined in a similar manner as with the pre-task. Learning was investigated on the individual level by inspecting whether children’s naïve theories on shadow size had changed over play, but also on the group level by testing whether the average proportions correct on the size- and distance items had improved over play.

Conflicting evidence and exploratory play | 103
methodParticipantsThe final sample consisted of 102 children: 43 4-year-olds (M=53.81 months, SD=5.06), 32 5-year-olds (M=64.84 months, SD=3.87) and 27 6- to 9-year-olds (M=87.04 months, SD=13.21) that were recruited from two primary schools.1 Twelve other children were recruited but not included in the analyses: 8 children were excluded because an error was made in administering the pre- or post-task (7 children pushed the light button during the pre- or post-task and got feedback) and 4 children were excluded because no complete video-recordings of the free play episode were available. Although most children were from White, middle-class backgrounds, a range of ethnicities reflecting the diversity of the population was represented.
MaterialsThe shadow machine, the set-up of the shadow task (Inhelder & Piaget, 1958; Siegler, 1978, 1981), was used for all four phases of the experiment. The machine consisted of two light sources, a screen placed 50 cm from the light sources, and puppets that could be placed between the light sources and screen (see Figure 1). When a button was pressed the lights were activated (they stayed lit as long as the button was held) and shadows of the puppets were portrayed on the screen. Puppets of two sizes were used: two small ones measuring 7.5 x 2.25 cm and two large ones measuring 10 x 3 cm. The puppets could be placed at three distances from the light sources: 10, 20 and 30 cm. Relative shadow size depended on both the size of the object and the distance from the object to the light source (the distance from the light sources to the screen was kept constant).
ProcedureChildren were tested individually by one of two experimenters in a private room at their school. The child and experimenter sat at the same side of a table facing the shadow machine. The child was first introduced to the machine. Subsequently the child participated in a pre-task, evidence exposure, free play episode, and post-task. The experiment took approximately 20 minutes per child.
Introduction to the shadow machine. The experimenter introduced the shadow machine by pointing out the light sources, the puppets of different sizes and by demonstrating how the puppets could be placed close to or further away from the light sources. She then demonstrated how to make the shadows. She placed two equally sized puppets at equal distances from the light sources, pushed the light button and said: “Do you see the shadows? This one (pointing to left shadow) is equally big as this one (pointing to right shadow). They are the same”.

104 | Chapter 6
Pre-task. The experimenter introduced the pre-task by saying: “Now we are going to play a game. Each time I will put puppets in place. You then say whether you think that the shadow on this side will be the biggest (pointing to left side of the screen), the shadow on this side will be the biggest (pointing to right side of the screen), or that they will be the same. She then administered 12 items to the child: six size items, in which the size of the puppets was varied, but the distance from the puppets to the light sources was kept constant (see Figure 2A) and six distance items, in which the distance from the puppets to the light sources was varied, but the size of the puppets was kept constant (see Figure 2B). The items were administered in one of two fixed semi-random orders. For each item the experimenter put two puppets in place and said: “I put this puppet here and this puppet here. When I make the shadows, which one will be the biggest? This one (pointing to the left side of the screen), this one (pointing to the right side of the screen) or will they be the same?” Importantly, during the pre-task the child did not see shadows and therefore did not get any feedback. Responses on the pre-task were scored trichotomously: correct, incorrect “the same”, or incorrect not “the same”.
To enable random assignment of children over the evidence conditions per rule group, the pre-task scores were used to temporarily classify each child as using a specific rule. The temporary classification was based on previous literature (Siegler, 1981) and a pilot study. For example, children were assigned to the Rule 1 group when they had answered more than 4 size items correctly and more than 4 distance items incorrectly with “the same”. To answer the research questions, a more advanced classification based on the results of the Latent Class Analysis was used.
Evidence exposure. Children per rule group were randomly assigned to the evidence conditions stratified on the basis of age and sex. In the conflicting condition children were shown evidence that conflicted with Rule 1, in the confirming condition children were shown evidence that confirmed Rule 1. It is important to notice that not only children using Rule 1, but all children that participated in the experiment were exposed to the evidence that was designed for the Rule 1 group, implying that the conflicting evidence was not necessarily conflicting and the confirming evidence was not necessarily confirming for children using |rules other than Rule 1. In the Results section we go further into this.
In the conflicting condition the experimenter placed a small puppet close to the light source (10 cm) and a large puppet further away from the light source (20 cm; see Figure 2C). As in the pre-task, she asked: “I put this puppet here and this puppet here. When I make the shadows, which one will be the biggest? This one (pointing to the left side of the screen), this one (pointing to the right side of the screen) or will they be the same?” (evidence-item prediction). A child using Rule 1 was expected to predict that the large puppet would have

Conflicting evidence and exploratory play | 105
the biggest shadow, which was not the case in this condition. Next, the experimenter showed the child the shadows by pushing the light button. To make sure the child paid attention she asked: ”Do you see the shadows? Which one is the biggest? This one (pointing to the left side of the screen), this one (pointing to the right side of the screen) or are they the same?” (evidence-item observation). The confirming condition was similar to the conflicting condition, except that the experimenter placed a small puppet further away from the light source (30 cm) and a large puppet close to the light source (20 cm; see Figure 2D). A child using Rule 1 was expected to predict that the large puppet would have the biggest shadow, which was also the case in this condition.
Free play episode. During the free play episode, the child was encouraged to engage in free play with the shadow machine for five minutes. The experimenter sat in a corner of the room out of the child’s sight so that she did not influence or disturb the child. Video-recordings were made of the child’s play and all experiments children performed were scored. An experiment was defined as putting one or more puppets in place and pushing the light button. Different types of experiments were distinguished: unconfounded experiments in which one dimension was varied (see Figure 2A-B), confounded experiments in which both dimensions were varied (see Figure 2C-D) and other experiments, in which either no dimensions were varied (see Figure 2E), or an irrelevant comparison was made (see Figure 2F). Irrelevant comparisons included putting one puppet in place, putting two puppets in place at the same side of the machine, or putting 3 or 4 puppets in place. Double coding of the experiments performed by 19 children (19%) rendered a percentage agreement of 96%, corresponding with a Kappa of .95.
Post-task. The post-task consisted of four items: two size items (see Figure 2A) and two distance items (see Figure 2B). As a maximum of six size items could be constructed with this version of the shadow task, the size items in the post-task were repetitions of items that had been administered in the pre-task. The distance items had not been used in the pre-task. The items were administered in a fixed semi-random order. As during the pre-task, the child did not see shadows and therefore did not get any feedback. The items were scored trichotomously: correct, incorrect “the same”, incorrect not “the same”.

106 | Chapter 6
figure 2. Examples of different types of items and experiments on the shadow machine. For the pre- and post-task size items (A) and distance items (B) were used (without feedback/ shadows). For the evidence exposure, a conflict item (C) was used for the conflicting condition and a confound item (D) for the confirming condition (with feedback/ shadows). For the free play episode, the experiments children performed were categorized in three categories (A-B, C-D, E-F, with feedback/ shadows). These figures present examples of the different types of experiments, though other variations are possible. Irrelevant experiments also included experiments with 1, 3 or 4 puppets.
statistical approachTo detect children’s naïve theories on shadow size, we used Latent Class Analysis (LCA): a statistical technique for models with categorical, manifest variables and a categorical latent variable. To this end, Latent Class Models were fit to the data. Latent Class Models describe categorically different response patterns in terms of latent classes. In this study these classes can be interpreted as children’s rules or naïve theories on shadow size.
LCA provides a statistically more reliable technique to detect different types of response patterns than pattern matching techniques, which are used in Siegler’s (1976, 1981) Rule Assessment Methodology (see Van der Maas & Straatemeier, 2008 for a more extended discussion). For example, in LCA no arbitrary criterion for correspondence between observed and expected responses is used to classify children, instead classification is based on the characteristics of the data. As mentioned before, LCA makes it possible to detect unanticipated response patterns, or classes. In addition, LCA uses model selection techniques that allow for an optimal decision between goodness-of-fit and parsimony of the model. Therefore, the technique can be used to test whether knowledge is coherent, theory-like, or fragmented. Previous studies on children’s naïve theories on science subjects have used LCA to investigate rule-use on the balance scale task (Boom, Hoijtink, & Kunnen, 2001; Jansen & Van der Maas 1997, 2001, 2002), children’s mental models of the earth (Straatemeier, Van der Maas & Jansen, 2008) and children’s mental models of fetal development (Van Es, Van Schijndel, Franse & Raijmakers, 2009). Several introductions to LCA exist (e.g. Bouwmeester & Sijtsma,

Conflicting evidence and exploratory play | 107
2007; McCutcheon, 1987; Rindskopf, 1987), so in this paper only a brief description of the technique is given.
In the present study, exploratory LCA was used to determine the number of latent classes needed to describe children’s response patterns to the pre- and post-task items (separately) in the best and most parsimonious manner. Latent Class Models were defined by fixing the number of latent classes and subsequently estimating the model parameters: the unconditional and conditional probabilities. Unconditional probabilities define the class sizes. Conditional probabilities of a class indicate probabilities of responses to specific items given membership of the class. Latent Class Models were fit to the data by calculating Log Likelihood estimates of the model parameters with the package depmixS4 (Visser & Speekenbrink, 2010) for the R statistical programming environment (R Development Core Team, 2011). In LCA the optimal number of latent classes cannot be estimated or tested, hence model selection was based on the Bayesian Information Criterion (BIC, Schwartz, 1978): the model with the lowest BIC was considered to be the most parsimonious, best fitting model. The best fitting model was then interpreted on the basis of previous work on children’s naïve theories on shadow size (Chen, 2009; Ebersbach & Resing, 2007; Siegler, 1978, 1981).
resultsnaïve theories on shadow sizeFirst, we investigated what naïve theories young children have about shadow size. To this end, Latent Class Models (LCM; see Method section) with 1, 2, 3, 4 and 5 classes were fit to the pre-task data: children’s trichotomous response patterns on 12 items. The pre-task items had been administered in one of two semi-random orders. As no differences in number of size items correct, number of distance items correct or total number of items correct were found between the orders, they were aggregated for further analyses. Table 1 shows the goodness-of-fit measures of the different Latent Class Models. Based on the BIC values, it was found that a 4-class-model fit the data in the best and most parsimonious manner, indicating four different theories on shadow size. We put equality constraints on the response probabilities of the six size items in all classes and the same was done for the response probabilities of the six distance items in all classes. There was no significant difference in goodness-of-fit between the constrained and the unconstrained model (Log likelihood ratio (82)=85.62, p=.37). Therefore, the more parsimonious, constrained model was selected for interpretation and further analyses.
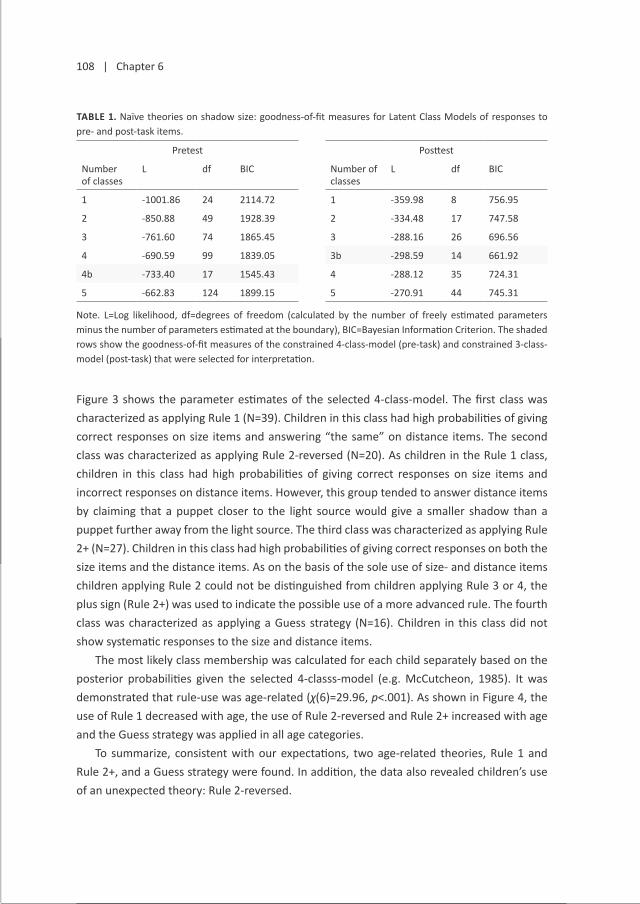
108 | Chapter 6
table 1. Naïve theories on shadow size: goodness-of-fit measures for Latent Class Models of responses to pre- and post-task items.
Pretest Posttest
Numberof classes
L df BIC Number of classes
L df BIC
1 -1001.86 24 2114.72 1 -359.98 8 756.95
2 -850.88 49 1928.39 2 -334.48 17 747.58
3 -761.60 74 1865.45 3 -288.16 26 696.56
4 -690.59 99 1839.05 3b -298.59 14 661.92
4b -733.40 17 1545.43 4 -288.12 35 724.31
5 -662.83 124 1899.15 5 -270.91 44 745.31
Note. L=Log likelihood, df=degrees of freedom (calculated by the number of freely estimated parameters minus the number of parameters estimated at the boundary), BIC=Bayesian Information Criterion. The shaded rows show the goodness-of-fit measures of the constrained 4-class-model (pre-task) and constrained 3-class-model (post-task) that were selected for interpretation.
Figure 3 shows the parameter estimates of the selected 4-class-model. The first class was characterized as applying Rule 1 (N=39). Children in this class had high probabilities of giving correct responses on size items and answering “the same” on distance items. The second class was characterized as applying Rule 2-reversed (N=20). As children in the Rule 1 class, children in this class had high probabilities of giving correct responses on size items and incorrect responses on distance items. However, this group tended to answer distance items by claiming that a puppet closer to the light source would give a smaller shadow than a puppet further away from the light source. The third class was characterized as applying Rule 2+ (N=27). Children in this class had high probabilities of giving correct responses on both the size items and the distance items. As on the basis of the sole use of size- and distance items children applying Rule 2 could not be distinguished from children applying Rule 3 or 4, the plus sign (Rule 2+) was used to indicate the possible use of a more advanced rule. The fourth class was characterized as applying a Guess strategy (N=16). Children in this class did not show systematic responses to the size and distance items.
The most likely class membership was calculated for each child separately based on the posterior probabilities given the selected 4-classs-model (e.g. McCutcheon, 1985). It was demonstrated that rule-use was age-related (χ(6)=29.96, p<.001). As shown in Figure 4, the use of Rule 1 decreased with age, the use of Rule 2-reversed and Rule 2+ increased with age and the Guess strategy was applied in all age categories.
To summarize, consistent with our expectations, two age-related theories, Rule 1 and Rule 2+, and a Guess strategy were found. In addition, the data also revealed children’s use of an unexpected theory: Rule 2-reversed.

Conflicting evidence and exploratory play | 109
figure 3. Naïve theories on shadow size: model parameters for selected pre- and post-models. Unconditional probabilities of the different classes are shown between brackets. These probabilities are not necessarily exact copies of percentages of children assigned to a class.
103
Figure 3. Naïve theories on shadow size: model parameters for selected pre- and post-models.
Unconditional probabilities of the different classes are shown between brackets. These probabilities are
not necessarily exact copies of percentages of children assigned to a class.

110 | Chapter 6
figure 4. Naïve theories on shadow size: percentages of children per age category using the different rules on the pre- and post-task.
Conflicting evidence and playSecond, we investigated whether the quality of children’s free play was affected by evidence conflicting with their naïve theory. As the evidence was designed for children using Rule 1, this question was first answered by focusing on this rule group’s play behavior. Out of the 39 children that applied Rule 1 during the pre-task, 16 were assigned to the conflicting condition (M=56.13 months, SD=7.42) and 23 to the confirming condition (M=57.30 months, SD=7.33).2 The evidence-item prediction (see Method section) was made correctly by 6% of the children in the conflicting condition, compared to 70% of the children in the confirming condition (χ(1)=15.38, p<.001). The evidence-item observation (see Method section) was done correctly by 93% of the children in the conflicting condition and 100% of the children in the confirming condition.
A multivariate analysis of variance was conducted with condition (conflicting, confirming) as between-subjects factor on the following four free-play outcome measures: number of unconfounded experiments, number of confounded experiments, number of other experiments, and total number of experiments (see Method section for a description of the experiments in each of these categories). Effects of condition were found on the number of unconfounded experiments (F(1,38)=5.70, p<.05) and the total number of experiments F(1,38)=4.33, p<.05). Children in the conflicting condition performed more unconfounded experiments, and demonstrated a higher total number of experiments during free play than children in the confirming condition (see Table 2).
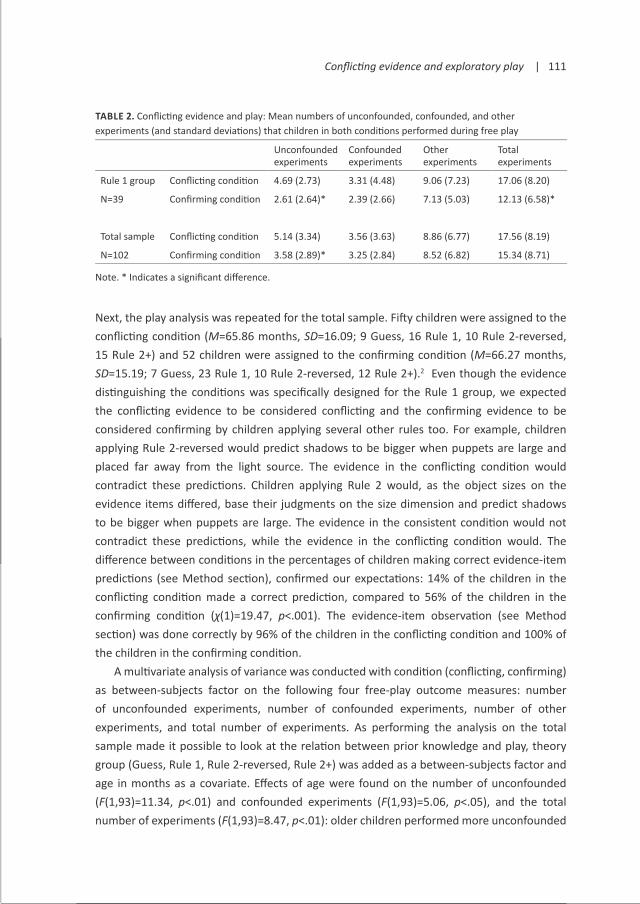
Conflicting evidence and exploratory play | 111
table 2. Conflicting evidence and play: Mean numbers of unconfounded, confounded, and other experiments (and standard deviations) that children in both conditions performed during free play
Unconfounded experiments
Confounded experiments
Other experiments
Total experiments
Rule 1 group Conflicting condition 4.69 (2.73) 3.31 (4.48) 9.06 (7.23) 17.06 (8.20)
N=39 Confirming condition 2.61 (2.64)* 2.39 (2.66) 7.13 (5.03) 12.13 (6.58)*
Total sample Conflicting condition 5.14 (3.34) 3.56 (3.63) 8.86 (6.77) 17.56 (8.19)
N=102 Confirming condition 3.58 (2.89)* 3.25 (2.84) 8.52 (6.82) 15.34 (8.71)
Note. * Indicates a significant difference.
Next, the play analysis was repeated for the total sample. Fifty children were assigned to the conflicting condition (M=65.86 months, SD=16.09; 9 Guess, 16 Rule 1, 10 Rule 2-reversed, 15 Rule 2+) and 52 children were assigned to the confirming condition (M=66.27 months, SD=15.19; 7 Guess, 23 Rule 1, 10 Rule 2-reversed, 12 Rule 2+).2 Even though the evidence distinguishing the conditions was specifically designed for the Rule 1 group, we expected the conflicting evidence to be considered conflicting and the confirming evidence to be considered confirming by children applying several other rules too. For example, children applying Rule 2-reversed would predict shadows to be bigger when puppets are large and placed far away from the light source. The evidence in the conflicting condition would contradict these predictions. Children applying Rule 2 would, as the object sizes on the evidence items differed, base their judgments on the size dimension and predict shadows to be bigger when puppets are large. The evidence in the consistent condition would not contradict these predictions, while the evidence in the conflicting condition would. The difference between conditions in the percentages of children making correct evidence-item predictions (see Method section), confirmed our expectations: 14% of the children in the conflicting condition made a correct prediction, compared to 56% of the children in the confirming condition (χ(1)=19.47, p<.001). The evidence-item observation (see Method section) was done correctly by 96% of the children in the conflicting condition and 100% of the children in the confirming condition.
A multivariate analysis of variance was conducted with condition (conflicting, confirming) as between-subjects factor on the following four free-play outcome measures: number of unconfounded experiments, number of confounded experiments, number of other experiments, and total number of experiments. As performing the analysis on the total sample made it possible to look at the relation between prior knowledge and play, theory group (Guess, Rule 1, Rule 2-reversed, Rule 2+) was added as a between-subjects factor and age in months as a covariate. Effects of age were found on the number of unconfounded (F(1,93)=11.34, p<.01) and confounded experiments (F(1,93)=5.06, p<.05), and the total number of experiments (F(1,93)=8.47, p<.01): older children performed more unconfounded
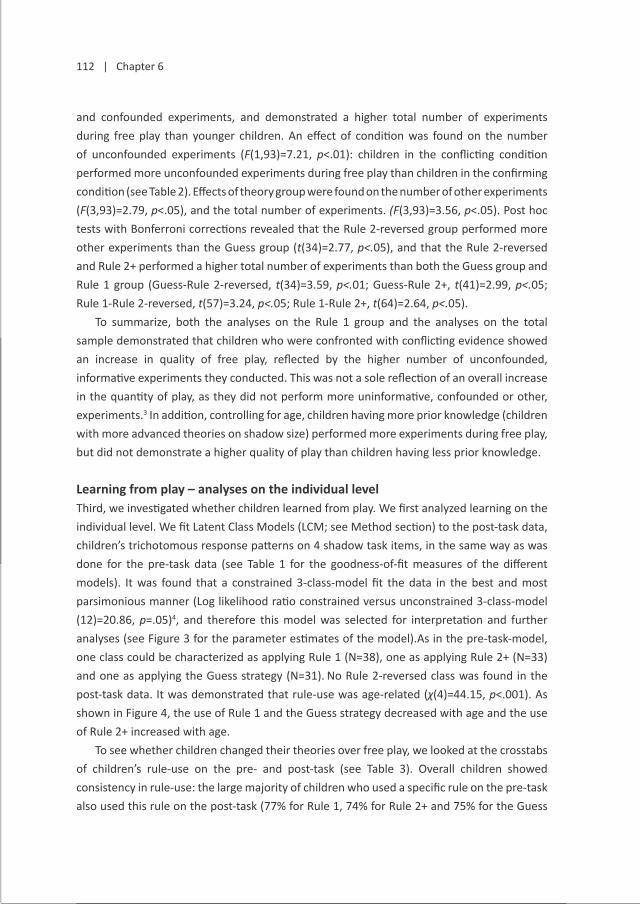
112 | Chapter 6
and confounded experiments, and demonstrated a higher total number of experiments during free play than younger children. An effect of condition was found on the number of unconfounded experiments (F(1,93)=7.21, p<.01): children in the conflicting condition performed more unconfounded experiments during free play than children in the confirming condition (see Table 2). Effects of theory group were found on the number of other experiments (F(3,93)=2.79, p<.05), and the total number of experiments. (F(3,93)=3.56, p<.05). Post hoc tests with Bonferroni corrections revealed that the Rule 2-reversed group performed more other experiments than the Guess group (t(34)=2.77, p<.05), and that the Rule 2-reversed and Rule 2+ performed a higher total number of experiments than both the Guess group and Rule 1 group (Guess-Rule 2-reversed, t(34)=3.59, p<.01; Guess-Rule 2+, t(41)=2.99, p<.05; Rule 1-Rule 2-reversed, t(57)=3.24, p<.05; Rule 1-Rule 2+, t(64)=2.64, p<.05).
To summarize, both the analyses on the Rule 1 group and the analyses on the total sample demonstrated that children who were confronted with conflicting evidence showed an increase in quality of free play, reflected by the higher number of unconfounded, informative experiments they conducted. This was not a sole reflection of an overall increase in the quantity of play, as they did not perform more uninformative, confounded or other, experiments.3 In addition, controlling for age, children having more prior knowledge (children with more advanced theories on shadow size) performed more experiments during free play, but did not demonstrate a higher quality of play than children having less prior knowledge.
learning from play – analyses on the individual levelThird, we investigated whether children learned from play. We first analyzed learning on the individual level. We fit Latent Class Models (LCM; see Method section) to the post-task data, children’s trichotomous response patterns on 4 shadow task items, in the same way as was done for the pre-task data (see Table 1 for the goodness-of-fit measures of the different models). It was found that a constrained 3-class-model fit the data in the best and most parsimonious manner (Log likelihood ratio constrained versus unconstrained 3-class-model (12)=20.86, p=.05)4, and therefore this model was selected for interpretation and further analyses (see Figure 3 for the parameter estimates of the model).As in the pre-task-model, one class could be characterized as applying Rule 1 (N=38), one as applying Rule 2+ (N=33) and one as applying the Guess strategy (N=31). No Rule 2-reversed class was found in the post-task data. It was demonstrated that rule-use was age-related (χ(4)=44.15, p<.001). As shown in Figure 4, the use of Rule 1 and the Guess strategy decreased with age and the use of Rule 2+ increased with age.
To see whether children changed their theories over free play, we looked at the crosstabs of children’s rule-use on the pre- and post-task (see Table 3). Overall children showed consistency in rule-use: the large majority of children who used a specific rule on the pre-task also used this rule on the post-task (77% for Rule 1, 74% for Rule 2+ and 75% for the Guess

Conflicting evidence and exploratory play | 113
strategy). However, as no Rule 2-reversed group was found in the post-task data, the children who had used this rule on the pre-task either used Rule 1 (15%), Rule 2+ (40%) or the Guess strategy (45%) on the post-task. A trend approaching significance demonstrated that few children (10%) applying Rule 1 learned from play, but about half of the children applying Rule 2-reversed did (McNemar χ(1)=7.22, p<.1).
table 3. Learning on the individual level: numbers (and percentages) of children using specific combinations of rules on the pre- and posttest.
Posttest
Rule 1 Rule 2+ Guess strategy Total
Pretest Rule 1 30 (77) 4 (10) 5 (13) 39 (100)
Rule 2-reversed 3 (15) 8 (40) 9 (45) 20 (100)
Rule 2+ 2 (7) 20 (74) 5 (19) 27 (100)
Guess strategy 3 (19) 1 (6) 12 (75) 16 (100)
Total 38 (37) 33 (32) 31 (31) 102 (100)
learning from play – analyses on the group levelNext, we analyzed learning on the group level. When investigating children’s learning on the individual level, we could not investigate learning for the different conditions separately as the number of participants per cell was too small. Therefore, the whole group was included for analysis. Two repeated measures analyses of variance were conducted: one on proportion size items correct and one on proportion distance items correct. In both analyses time (pre-task, post-task) was included as within-subjects factor, condition (conflicting, confirming) and theory on pre-task (Rule 1, Rule 2-reversed, Rule 2+, Guess strategy) as between-subjects factors, and age in months and play as covariates. Play was operationalized as the number of unconfounded size experiments (see Figure 2A) the child performed during free play in the analysis on proportion size items correct, and as the number of unconfounded distance experiments (see Figure 2B) the child performed during free play in the analysis on proportion distance items correct.
In the analysis on proportion size items correct, effects of condition (F(1,92)=10.59, p<.01), theory (F(1,92)=27.12, p<.001), and time (F(1,92)=4.10, p<.05) were found. An interaction between time and condition was found (F(1,92)=19.98, p<.001): over time the conflicting condition’s performance on size items deteriorated (t(49)=4.38, p<.001), while the confirming condition’s performance did not change (see Figure 5A). An interaction between time and theory was found (F(1,92)=6.93, p<.001): the difference scores (proportion size items correct on post-task - proportion size items correct on pre-task) of the Rule 2-reversed group differed from the difference scores of the other theory groups (Guess group t(33.92)=3.24,

114 | Chapter 6
p<.01, Rule 1 group t(32.23)=2.21, p<.05, Rule 2+ group t(25.03)=2.91, p<.01). Over time the Rule 2-reversed group’s performance on size items deteriorated (t(19)=3.47, p<.01), while performance in the other groups did not change (see Figure 5B).5
In the analysis on proportion distance items correct, effects of theory (F(1,92)=18.37, p<.001) and age in months (F(1,92)=10.93, p<.01) were found. An interaction between time and play was found (F(1,92)=4.49, p<.05): over time the performance on distance items of the group that conducted more distance experiments during free play improved (t(50)=5.65, p<.001), while the performance of the group that conducted less distance experiments during free play did not change (see Figure 6A). An interaction between time and theory was found (F(1,92)=6.66, p<.001): the difference scores (proportion distance items correct on post-task - proportion distance items correct on pre-task) of the Rule 2-reversed group differed from the difference scores of the other theory groups (Guess group t(34)=3.01, p<.01, Rule 1 group t(31.56)=3.63, p<.01, Rule 2+ group t(36.39)=3.67, p<.01). Over time the Rule 1 group’s (t(38)=2.53, p<.05) and Rule 2-reversed group’s (t(19)=5.60, p<.01) performance on distance items improved, while performance in the other groups did not change (see Figure 6B).6
To summarize, over time children’s performance on size items was negatively affected by evidence conflicting with their naïve theory. Over time children’s performance on distance items improved more for the group that conducted more distance experiments during free play than for the group that conducted less distance experiments during free play. In addition, children who had a Rule 2-reversed theory at the start of the experiment showed a larger negative change in performance on size items and a larger positive change in performance on the distance items over time than children in the other theory groups.
figure 5. Learning on the group level: average proportion correct on the size items on the pre- and post-task per condition (A) and per theory group (B). Error bars represent standard errors.

Conflicting evidence and exploratory play | 115
figure 6. Learning on the group level: average proportion correct on the distance items on the pre- and post-task per play group (A) and per theory group (B). Error bars represent standard errors. A) The play variable was taken along in the repeated measures analysis as a covariate. To explain and plot the interaction between time and play on proportion distance items correct, two groups were created by splitting the play variable at the median.
discussionThis study investigated the role of young children’s prior knowledge in guiding their exploratory play and learning. We first assessed 4- to 9-year-olds’ naïve theories on shadow size by using a categorical latent variable technique: Latent Class Analysis (LCA). In line with previous literature (Chen 2009; Ebersbach & Resing, 2007; Siegler, 1981), we found a group taking into account the size dimension (Rule 1), a group taking into account both dimensions (Rule 2+), and a Guess group. Children’s naïve theories were found to be age-related: the majority of the 4- and 5-year-olds used Rule 1, while the majority of older children used Rule 2+. In addition to the expected groups, a fourth group that took into account the size dimension in the right direction, but the distance dimension in the wrong direction, was distinguished (Rule 2-reversed). The existence of this Rule 2-reversed group is in line with Ebersbach and Resing’s (2007) results. The authors assessed implicit beliefs by asking participants to estimate shadow sizes of different objects closer to and further away from a light source. They found, depending on age, that participants estimated 63 to 93% of shadows of objects in the closest position to the light source as being longer than shadows of objects in the furthest position from the light source. The authors assessed explicit beliefs by asking participants whether a shadow would become longer, shorter or would stay the same when an object approaches the light. They found that approximately half of the 5-year-olds and the majority of older participants answered this question correctly. Interestingly, 20% of the adults gave an incorrect answer. However, even though Ebersbach and Resing’s (2007) results suggest the existence of a Rule 2-reversed theory, no systematic assessment of children’s naïve theories was presented in their paper. For example, for the implicit results, the authors looked at averages over participants compared to individual performance. For the explicit results, the authors did not distinguish between the incorrect answers “longer” and “the same”. Therefore, to the best of our knowledge, the present study is the first to systematically

116 | Chapter 6
demonstrate the existence of Rule 2-reversed group. This finding illustrates the advantage of using LCA over inspecting averages, but also over pattern matching, which is done in Siegler’s (1976, 1981) Rule Assessment Methodology. When matching observed to expected response patterns, other than by visual inspection of the data, no theories can be detected that are not defined beforehand. When using LCA, different models are fit to the data and only after selection of the best fitting model, the model’s classes are interpreted. Analyzing the data in this way, other than by selecting specific item types, the results are not influenced by prior hypotheses about existing theories, enabling the finding of unanticipated groups, such as the Rule 2-reversed group.
Second, we investigated the effect of evidence conflicting with young children’s naïve theories on the quality of their free play. Both in the preschooler age group (Rule 1 group) and the total sample, it was shown that children who were confronted with conflicting evidence conducted a higher number of unconfounded, informative experiments during free play than children who were confronted with consistent evidence. Importantly, this was not due to an overall increase in quantity of experiments, as children did not perform more uninformative experiments. The result complements previous work on the effects of different types of uncertainty on young children’s exploratory play. Bonawitz et al. (2012) demonstrated that uncertainty generated by conflicting information increases the duration of young children’s play. This study extends those results by showing that this type of uncertainty also affects the quality of play. Also, we show this effect in a younger age group: preschoolers. Cook et al. (2011) demonstrated that uncertainty generated by ambiguous evidence affects the quality of young children’s play in an artificial context (Cook et al., 2011). The current results extend this finding by showing that uncertainty can also affect the quality of play in ecologically valid contexts involving multiple causal factors (size & distance).
The finding that children in the preschool age-range, without any form of training, apply the principle of controlling variables, contrasts with research on older children’s science learning. In science education research, the skill of designing unconfounded experiments from which valid causal inferences can be drawn is called the Control of Variables Strategy (CVS; e.g. Chen & Klahr, 1999; Klahr, 2005; Klahr & Nigam, 2004; Kuhn & Dean, 2005). The acquisition of CVS is considered essential in development of scientific reasoning, but several studies demonstrated primary school-aged children’s difficulty with the use and transfer of the strategy (e.g. Chen & Klahr, 1999; Klahr & Nigam, 2004; Kuhn, Garcia-Mila, Zohar & Andersen, 1995; Schauble, 1996). For example, Chen and Klahr (1999) found that the 7- to 10-year-olds in their study, when asked to investigate the effect of a specific variable, only used CVS in 26 to 48% of the experiments they designed. Instruction improved the use of the strategy, but discovery learning did not. There are several explanations for the discrepancy between older children’s difficulty with acquiring CVS and preschoolers’ selective application of the strategy in uncertain situations (see Bonawitz et al., 2012 and Cook et al., 2011 for a more extended

Conflicting evidence and exploratory play | 117
discussion). One explanation is that the contexts used for older children’s inquiry learning are generally far more complex than the contexts used in research on preschoolers’ exploratory play. Additionally, the tasks administered to older children often ask for a meta-cognitive understanding of CVS, while the tasks administered to preschoolers do not.
Third, in a more explorative manner, we investigated children’s learning. In line with previous work on young children’s learning from play (Gweon & Schulz, 2008; Schulz, Gopnik & Glymour, 2007), only a small percentage (21%) of 4- to 9-year-olds that did not take into account both dimensions in the correct manner at the start of the experiment had a more advanced theory after free play than before free play. As predicted, children’s prior knowledge was found to affect learning: children applying Rule 2-reversed were affected differently by evidence and free play than children applying other rules. The data on the individual level revealed a trend showing a higher percentage Rule 2-reversed children learning from play than Rule 1 children. The analyses on the group level demonstrated that over time the Rule 2-reversed group showed a larger negative change in performance on size items and a larger positive change in performance on the distance items than children in the other theory groups. The fact that children having this quite advanced theory showed a negative change in performance on the size items contrasts with the developmental pattern outlined by Siegler (1981). A possible explanation for these findings is that children using Rule 2-reversed are a transitional group: they are aware of both the size and distance dimension having a role in determining shadow size, but are still unsure about the specific relations. This group might be more susceptible to evidence than children in non-transitional groups. Conflicting evidence shown by the experimenter or encountered during free play might have either led them to hypothesize that they were wrong about the direction of the size effect, or that they were wrong about the direction of the distance effect. The former option would lead them to give incorrect responses on both the size and distance items, leading them to end up in the Guess group (45%). The latter option would lead them to give correct responses on both item types, leading them to end up in the Rule 2+ group (40%). Partial support for this hypothesis comes from the analyses on the group level showing an effect of condition on children’s performance on size items over time: children in the conflicting condition showed a decrease, while children in the confirming condition did not.
Besides children’s prior knowledge, the quality of children’s free play was also predicted to be related to their learning. This prediction was confirmed with regards to the distance items: children who conducted more unconfounded distance experiments during free play, showed a larger increase in performance over time than children who conducted less of these experiments during free play. However, as children’s play was not experimentally controlled in this study, no causal conclusions can be drawn about the relation between play and learning on the basis of this result.
118 | Chapter 6
Future work could investigate the unique contributions of different factors affecting young children’s causal learning from play in this study’s knowledge domain. An important question is how prior knowledge affects learning. Descriptive work on older children’s and adults’ causal learning from experimentation suggests that this is through the ability to formulate hypotheses and draw valid conclusions from experiments (e.g. Dunbar & Klahr, 1989; Schauble, 1990). For example, Dunbar and Klahr (1989) compared 8- to 11-year-old’s performance to adults’ performance on a robot programming task. They found that children’s learning was limited (9%) compared to that of adults (95%). Both groups performed similar experiments, but children came up with different, less efficient, hypotheses than adults due to a lack of prior knowledge. Children also evaluated the evidence of experiments differently, often ignoring negative evidence, and only interpreting the results of their most recent experiment. Parallels could be drawn to the present study: for example, younger children applying Rule 1 might not have been able to formulate hypotheses including the distance factor, affecting their ability to learn from distance experiments (Jansen & Van der Maas, 2001). A second line of questions for future research is related to factors influencing the quality of children’s free play. As in Dunbar and Klahr’s (1989) study, in the present study participants with more prior knowledge did not demonstrate a higher quality of play than participants with less prior knowledge. Conflicting evidence shown by the experimenter, however, did affect the quality of children’s free play. An interesting question concerns how much of this effect was caused by the pedagogical context in which the conflicting evidence was shown (e.g. Bonawitz et al., 2011). In other words, does children’s quality of play also increase when they themselves encounter conflicting evidence during free play? Answering these questions will further unravel the mechanisms through which young children learn from experimentation.
acknowledgementsThe research of Tessa van Schijndel is sponsored by an NWO-Aspasia grant and the Dutch Curious Minds program, which is supported by the Dutch Ministry of Education, Culture and Science and the Platform Bèta Techniek. The research of Maartje Raijmakers is sponsored by a NWO-VIDI grant. We would like to thank the primary schools for their cooperation. We thank Marjolein Hof and Juri Peters for their help in collecting the data, Wouter Weeda and Han van der Maas for giving statistical advice, Coos Hakvoort for providing technical support and Elise Herrig performing a language check.

Conflicting evidence and exploratory play | 119
notes1. In this study children were not equally divided
over the different age groups: less 6- to9-year-
olds participated than 4- and 5-year-olds. This
difference was caused by the researchers
aiming at knowledge-homogeneous groups of
comparable sizes instead of age-homogeneous
groups of comparable sizes. This study
investigated the relationship between prior
knowledge and learning, and no added effect
of age on learning was expected. Therefore,
striving for knowledge groups of comparable
numbers of participants was considered
more important than striving for age groups
of comparable numbers of participants. Final
classification and therefore final sizes of the
different knowledge groups were based on the
results of the Latent Class Analysis.
2. The number of participants in both conditions
was not the same. During task administration
a shortcut was used to assign children to
theory groups (see method section). Half of the
children that was assigned to a specific theory
group during task administration was shown
conflicting evidence and the other half was
shown confirming evidence. However, the final
assignment to the theory groups was based on
the Latent Class Analysis. This final classification
differed from the temporary classification and
this caused the unequal number of participants
in both conditions.
3. On the basis of significant differences between
conditions in number of unconfounded
experiments and non-significant differences
between conditions in confounded or other
experiments, the conclusion was drawn that
the conflicting condition shows a higher quality
of play than the confirming condition. However,
the reported analyses did not test whether the
difference between the conditions in number
unconfounded experiments was larger than the
difference in confounded or other experiments.
To preempt this point we also performed
analyses on percentages of unconfounded
experiments. In the total sample (N=97, 5
participants did not perform experiments,
so no percentages could be calculated) a
significant difference between conditions
was found (t(95)=2.04, p<.05): children in the
conflicting condition demonstrated a higher
percentage of unconfounded comparisons
than children in the confirming condition. In
the Rule 1 group (N=37, 2 participants did
not perform experiments, so no percentages
could be calculated) the difference did not
reach significance due to the small number
of participants. However, the results on
percentages of unconfounded experiments
support the conclusion that children in the
conflicting condition demonstrated a higher
quality of play than children in the confirming
condition.
4. The item-heterogeneity was just sufficient
to reject the unconstrained model. This
might be caused by that fact that children
paid less attention at the first post-task item.
However, the interpretation of the classes in
the unconstrained model was the same as the
interpretation of the classes in the constrained
model, so the rejection of the unconstrained
model did not change the results.
5. The interaction between time and theory
group on proportion correct on the size items
was not solely caused by regression to the
mean. The mean proportion correct for the

120 | Chapter 6
Rule 2-reversed and Rule 2+ group differed on
the pre-task (t(26)=2.08, p<.05). However, this
difference was caused by the lack of variance
of the Rule 2-reversed group: all children
demonstrated a proportion correct of 1.
Therefore, we constructed matched samples by
removing the five participants from the Rule 2+
group that did not demonstrate a proportion
correct of 1, leaving a matched Rule 2+ group
of 22 participants. The Rule 2-reversed group
showed a larger decrease in performance from
pre- to post-task than the matched Rule 2+
group (t(26.85)=2.58, p<.05).
6. The interaction between time and theory group
on proportion correct on the distance items
was not solely caused by regression to the
mean: on the pre-task the mean proportion
correct did not differ for the Rule 2-reversed
and Rule 1group (t(57)=1.12, p=.27), but the
Rule 2-reversed group showed a larger increase
in performance from pre- to post-task than the
Rule 1 group (t(31.56)=3.63, p<.01).

chaPter 7
Parent explanation and preschoolers’ exploratory behavior and learning in a shadow exhibition
Van Schijndel, T. J. P., & Raijmakers, M. E. J. Parent explanation and preschoolers’ exploratory behavior and learning in a shadow exhibition. Manuscript submitted for publication.

122 | Chapter 7
abstractThis study focuses on preschoolers’ science learning in a shadow exhibition in science center NEMO, The Netherlands. It investigates, in an explorative manner, relations between parent explanation, children’s’ exploratory behavior, and learning. In addition, the effect of a theater show on parent and child variables is examined. Parent explanation is coded in a number of domain-general categories, such as causal explanations, evidence descriptions, and content-related directions (e.g. Crowley, Callanan, Jipson et al., 2001). Preschoolers’ behavior and learning are quantified by using nonverbal measures. The Exploratory Behavior Scale (e.g. Van Schijndel, Franse & Raijmakers, 2010 / Chapter 3) is used to assess the extent to which children explored their physical environment. Children’s learning is assessed in the knowledge domain of shadow size. Results show a positive relation between one type of parent explanation, evidence descriptions, and preschoolers’ exploratory behavior. No positive relations between children’s exploration and learning, or between parent explanation and children’s learning were found. Last, theater attendance was found to affect children’s learning on shadow size.
introductionThe last decade preschoolers have become a more visible group in science museums. Museums have started offering activities for preschoolers and many museums nowadays have areas or exhibitions that have been designed for the preschooler age group. In spite of this trend, the preschooler group is still underrepresented in visitor research. Few studies have been performed that specifically address preschoolers’ behavior and learning during museum visits, or parental guidance of preschoolers’ visits. Studies investigating family science learning have often adopted a sociocultural perspective (e.g. Callanan & Valle, 2008; Rogoff, 1995), taking the group as unit of analysis and therefore not distinguishing between adults and children, or older and younger children (e.g. Allen, 2002; Szechter & Carey, 2009; Zimmerman, Reeve & Bell, 2009). This research has yielded important insights into the processes of meaning making taking place in museum settings, but does not give a detailed view of young children’s informal science leaning. Preschoolers’ behavior and learning in museums differs from that of older children. As their verbal capacities are still in development, preschoolers’ talk may not reflect their reasoning or learning. This observation stands in contrast with the focus on conversations in many family learning studies (e.g. Ash, 2003; Allen, 2002; Zimmerman et al., 2009). Additionally, preschoolers’ informal science learning experiences differ from those of older children in terms of parental guidance. Young children’s experiences are generally guided very intensively by adults, and the division of roles is different in family groups with younger children than in groups with older children. Therefore, investigating this particular group’s informal science learning, more so than any other groups, asks for distinguishing between the child and parent role in order to examine the ways by which parents guide the learning process (Schauble et al., 2002). The present
Explanation, exploration and learning in a shadow exhibition | 123
study addresses these issues from a constructivist perspective (e.g. Gopnik & Meltzoff, 1997; Inhelder & Piaget, 1964; Wellman & Gelman, 1992). It focuses on preschoolers’ science learning experiences in a shadow exhibition in science center NEMO, The Netherlands. Children’s exploratory behavior and learning are assessed by quantitative measures that do not rely on their verbal capacities. Mainly, the study examines relation between children’s behavior, learning, and parental guidance.
Parent explanation & preschoolers’ exploratory behaviorExploratory behavior is at the core of young children’s science learning: preschool science programs emphasize the learning of skills that comprise exploration (e.g. French, 2004; Gelman & Brenneman, 2004), and science museums see meaningful, minds-on interactive behavior as indispensable to visitors’ experience (Allen, 2002, 2004). Visitors’ exploratory behavior in museum settings has been measured by using detailed, domain-specific measures (e.g. Crowley, Callanan, Jipson et al., 2001; Meisner et al., 2007), but more often by using global, domain-general measures (e.g. Boisvert & Slez, 1994, 1995; McManus, 1987). A limited set of studies have investigated the influence of adult presence, and adult interaction styles on preschoolers’ exploratory behavior at exhibits (Crowley, Callanan, Jipson et al., 2001; Van Schijndel, Franse & Raijmakers, 2010 / Chapter 3). For example, Crowley, Callanan, Jipson et al. (2001) found that young children who explored the zoetrope exhibit with their parents did this longer and on a deeper level than children who explored the exhibit by themselves. However, as parent interaction styles consist of a wide range of verbal and nonverbal behaviors, more detailed study is required to understand what specific aspects of parental guidance benefit children’s exploratory behavior in museum settings.
One way in which parents guide children’s visits is by giving explanations. It has been shown that parents differ in the amount and type of explaining they do in museum settings, and these differences have been related to child characteristics, such as gender and prior knowledge, and parent characteristics, such as attitude towards science, and educational level (Crowley, Callanan, Tenenbaum, Allen, 2001; Palmquist & Crowley, 2007; Siegel, Esterly, Callanan, Wright & Navarro, 2007; Szechter & Carey, 2009). Few studies have connected parent explanation to children’s exploratory behavior in museum settings. Fender and Crowley (2007) investigated the relation between one type of explanation, causal explanations, and young children’s exploratory behavior. Causal explanations were defined as establishing causal relations or making connections between the exhibit and prior knowledge. In line with their hypothesis that this type of explanation does not provide children with procedural assistance, they did not find differences in exploratory behavior between children whose parents did and children whose parents did not give this type of explanation. Besides causal explanations, several other domain-general types of explanation have been distinguished in visitor research, prominent types being: open and closed questions, evidence descriptions,
124 | Chapter 7
and content-related directions (Crowley, Callanan, Jipson et al., 2001; Crowley, Callanan, Tenenbaum et al., 2001; Fender & Crowley, 2007; Szechter & Carey, 2009; Zimmerman et al., 2009). To our knowledge, no studies have addressed relations between these types of explanation and preschoolers’ exploratory behavior in museum settings. As investigating these relations could contribute to uncovering the mechanisms through which adults can optimally guide children’s exploration, the first research question of the present study concerns these relations.
Preschoolers’ exploratory behavior, parent explanation, & preschoolers’ learningA not uncommon assumption in visitor research, which is related to the sociocultural perspective (e.g. Callanan & Valle, 2008; Rogoff, 1995), is that behaviors, such as children’s exploratory behavior and parents’ explanation, indicate the occurrence of learning (Schauble et al., 2002; Serrell, 1998). Schauble et al. (2002) argue that visitor research on learning should go beyond investigating domain-general behaviors, and focus more on domain-specific behaviors, and understanding. The authors consider examining children’s understanding and learning in specific knowledge domains a first step in improving adult guidance of children’s informal science learning (Schauble et al., 2002). In line with this recommendation, the present study investigates preschoolers’ informal learning in the domain of shadow size. Specifically, the second aim of this study is to examine the relations between preschoolers’ learning, and children’s exploratory behavior and parent explanation as assessed by domain-general measures.
Little research in museum settings has addressed the relation between young children’s exploratory behavior and learning, but a number of studies on children’s causal learning in more controlled settings have (Bonawitz, Van Schijndel, Friel & Schulz, 2012; Gweon & Schulz, 2008; Schulz, Gopnik & Glymour, 2007; Van Schijndel, Visser, Van Bers & Raijmakers, 2012 / Chapter 6). In these studies preschoolers’ exploratory behavior was quantified by determining whether children, during free play, generated specific instances of evidence that could support learning. For example, Schulz, et al. (2007) studied preschoolers’ learning of the causal structure of different gear toys. They found that half of the children working alone, but the large majority of children working in pairs generated evidence supporting learning. Depending on the complexity of the causal structure to be learned, 39 to 90% of the children that generated the evidence learned the correct structure. In a second study, Gweon and Schulz (2008) found that less than half of the preschoolers who were shown ambiguous evidence of a causal relation generated disambiguating evidence during exploration. 92% of the children who generated the evidence learned the correct causal relation, compared to 21% of the children who did not generate the evidence. These results suggest that preschoolers’ patterns of exploration are related to their learning in these controlled settings. This study will investigate whether this relation also holds in a museum setting.

Explanation, exploration and learning in a shadow exhibition | 125
Besides by their own exploration, children’s learning could also be affected by parent explanation (Gelman, 2009). Fender & Crowley (2007) investigated how one type of parent explanation, causal explanation, changes young children’s learning in a museum setting. They found causal explanation to affect children’s conceptual understanding: children whose parents gave causal explanations were more likely to encode experience with a zoetrope exhibit as being about animation than children whose parents did not give causal explanations (Fender & Crowley, 2007). However, no relation between parents’ causal explanations and children’s mechanistic or procedural understanding was found. This study will further examine the relation between parent explanation and young children’s learning in a museum setting. Besides causal explanations, the study will also look at other types of domain-general explanation: open and closed questions, causal explanations, evidence descriptions, and content-related directions.
Present studyThis study was performed in the Young explorers in NEMO exhibition (see Figure 1A): an exhibition specifically developed for the preschool age group. The exhibition consists of a theater show and an interactive exhibition space illustrating a number of physical principles related to shadows (see Method). In the study, child-parent teams participated in a pre-exhibition-, an exhibition-, and a post-exhibition phase.
In the pre-exhibition phase, the child’s knowledge was assessed in the domain of shadow size (pre-task). This domain was chosen because the relation between the size of an object (size dimension), the distance of an object to the light source (distance dimension), and the size of the shadow, was the physical principle that was most prominent in the exhibition.1 Further, several studies have investigated preschoolers’ naïve theories in this domain (e.g. Chen, 2009; Ebersbach & Resing, 2007; Siegler, 1981; Van Schijndel et al., 2012 / Chapter 6), and these studies have come up with methodologies for assessing children’s naïve theories in a reliable, nonverbal manner (see Method). These studies have uncovered several theories, or rules, that are common in the preschool age group: Rule 1, Rule 2-reversed and Rule 2 (Siegler, 1981, Van Schijndel et al., 2012 / Chapter 6). Children using Rule 1 understand that larger objects have larger shadows, but do not take into account the distance dimension in determining shadow size. Children using Rule 2-reversed understand that larger objects have larger shadows, and in addition consider the distance dimension if the object sizes are equal. However, they think that objects closer to the light source have smaller shadows than objects further away from the light source. Children using Rule 2 take into account both dimensions in the right direction. They understand that larger objects have larger shadows, and that objects closer to the light source have larger shadows. In this study, besides a group of children giving incoherent responses, we expected to find groups of children applying each one of these rules.

126 | Chapter 7
In the exhibition phase, child-parent teams visited the Young explorers in NEMO exhibition. As the use of a theater show as part of an exhibition was relatively new for the science center, this study had the sub-goal of investigating the effects of theater attendance on children and parents. We expected the theater show to affect parent explanation, and possibly children’s behavior and learning. This expectation was based on the finding that parents’ perceived lack of knowledge on science subjects affects their involvement in children’s exploration (Schauble et al., 2002), and that one of the aims of the theater show was to remove this barrier by refreshing parents’ knowledge on the shadow principles. To investigate this effect, half of the child-parent teams were assigned to the theater condition, and half the teams were assigned to the no-theater condition. Independent of their condition, all child-parent teams (subsequently) visited the exhibition space. During this visit, children’s exploratory behavior was measured by means of the Exploratory Behavior Scale (Van Schijndel, Franse et al., 2010 / Chapter 3; Van Schijndel, Singer, Van der Maas & Raijmakers, 2010 / Chapter 2). This scale has the advantage of being domain-general and applicable in different settings, while at the same time being a relatively detailed measure that can be used to assess the quality of preschoolers’ behavior (see Method). In addition, parent explanation was recorded. Due to time constraints one exhibit was selected for transcribing and coding of parent explanation: The Shadow Painting (see Figure 1B). The selection was based on the fact that the child-parent teams had interacted longest with this exhibit (see Results).
In the post-exhibition phase, the child’s knowledge on shadow size was measured for the second time (post-task). Learning was defined by the use of a more advanced rule, or theory after visiting the exhibition compared to before.
methodParticipantsThe final sample consisted of 89 teams. 97% of the children were accompanied by a parent so the teams are referred to as child-parent teams. Children were 31 4-year-olds (M=53.65 months, SD=4.19, 22 boys and 9 girls), 36 5-year-olds (M=65.56 months, SD=3.56, 18 boys and 18 girls) and 22 6-year-olds (M=75.73 months, SD=3.96, 11 boys and 11 girls). Adults had a mean age of 39.35 years (range=30-71, SD=5.46, 28 males and 61 females) and educational levels were relatively high: 79% had minimally a bachelor’s degree (41% bachelor’s degree, 38% master’s or postdoctoral degree), 20% had a vocational degree or high school diploma (18% intermediate vocational degree or higher level high school diploma, 2% lower level vocational degree or lower level high school diploma), and from one adult the educational level was missing. Although most child-parent teams were from White, middle-class backgrounds, a range of ethnicities reflecting the diversity of the population was represented. Besides the 89 child-parent teams in the final sample, six other teams were recruited, but not included in the analyses: three teams were excluded because an error was made in administering

Explanation, exploration and learning in a shadow exhibition | 127
A. young explorers in neMo: theater show (left picture) and exhibition space (middle and right pictures)
figure 1. Young explorers in NEMO exhibition. Photography: DigiDaan.
b. young explorers in neMo: shadow Painting exhibit
At the Shadow Painting exhibit child-parent teams are encouraged to create their own painting or to copy one of the paintings on the exhibit label. The teams have a collection of figures at their disposal, differing in shape (house, tree, rabbit, etc.), size, color, and transparency. The figures can be put in the exhibit at different distances from the light source. When a figure is put in the exhibit, the shadow appears on the two-sided screen. The exhibit is designed for child-parent teams to investigate two physical principles related to shadows. The first principle is that an object can have shadows of different sizes dependent on its distance to the light source. For example, the teams are encouraged to investigate this principle by a painting on the exhibit label containing two equally big rabbits, while the actual rabbit figures that they have at their disposal are of different sizes. The second principle is that a colored object can have a black or a colored “shadow” dependent on its transparency. For example, the teams are encouraged to investigate this principle by a painting on the exhibit label that contains a black house and a green tree, while the teams have both green transparent and green opaque tree figures and red transparent and red opaque house figures at their disposal.
the shadow task to the child, and three teams were excluded because no complete audio-recordings of parent explanation were available.
Child-parent teams were randomly assigned to one of two theater attendance conditions stratified on the basis of children’s age and children’s and parents’ gender. The resulting theater group (N=43 teams, children: M=64.00 months, SD=9.35, 22 boys and 21 girls, parents: M=38.84 years, SD=6.25, 13 males and 30 females) and no-theater group (N=46 teams, children: M=63.85 months, SD=9.50, 29 boys and 17 girls, parents: M=39.83 years, SD=4.61, 15 males and 31 females) did not differ in children’s or parents’ age, or distribution of children’s or parents’ gender.

128 | Chapter 7
MaterialsShadow task. To assess preschoolers’ learning the shadow task (Inhelder & Piaget, 1958;
Siegler, 1978, 1981) was used in a pre-test post-test design. The apparatus for the shadow task, the shadow machine, consists of two light sources, a screen placed on 50 cm from the light sources and puppets that can be placed in between the light sources and screen (see Figure 2). When a button is pressed the lights are activated and shadows of the puppets are portrayed on the screen. There are puppets of two sizes: two small ones measuring 5 x 2.25 cm and two large ones measuring 10 x 3 cm. The puppets could be placed at three distances from the light sources: 10, 20 and 30 cm. For each item the test leader puts two puppets in place and says: “I put this puppet here and this puppet here. When I make the shadows, which one will be the biggest? This one (pointing to the left side of the screen), this one (pointing to the right side of the screen) or will they be the same?” Different item types can be constructed, such as size items in which the size of the puppets is varied, but the distance from the puppets to the light sources is kept constant, and distance items in which the distance from the puppets to the light sources is varied, but the size of the puppets is kept constant (Siegler, 1981). In the task relative shadow size depends on both the size of the object and the distance from the object to the light source.1
For the pre-task the test leader introduced the task by demonstrating the shadow machine’s working: she put two equally sized puppets at equal distances from the light sources, made the shadows and labeled them as “the same”. She then administered the child 12 items, six size items and six distance items, in a fixed semi-random order. For the post-task the child was administered another six size items and six distance items in a fixed semi-random order. As a maximum of six size items could be constructed with the task, the size items were repetitions of items that had been administered during the pre-task. The distance items had not been used before. Importantly, during item administration children did not see shadows and therefore did not get any feedback. Responses were scored trichotomously: correct, incorrect, or incorrect “the same”. The analysis of children’s response patterns on the pre- and post-task is explained in the Statistical approach section.
figure 2. The shadow task. During test administration for the study described in this paper, no other children were present. Photography: Hanne Nijhuis.

Explanation, exploration and learning in a shadow exhibition | 129
Exploratory Behavior Scale. To assess preschoolers’ exploratory behavior the Exploratory Behavior Scale (EBS) was used (for an extended description of the scale see Van Schijndel, Franse et al., 2010 / Chapter 3; Van Schijndel, Singer et al., 2010 / Chapter 2). The EBS is a quantitative measure of young children’s interactivity. More specifically, the EBS is developed from the psychological literature on exploration and play (e.g. Dunn, Kontos & Potter, 1996; Forman & Kuschner, 2005; Lindahl & Pramling Samuelsson, 2002; Rubenstein & Howes, 1979; Smilansky, 1968; Weisler & McCall, 1976), and measures the extent to which preschoolers explore their physical environment. Compared to more global measures of visitor behavior, such as holding times or interaction times (e.g. Boisvert & Slez, 1994, 1995; McManus, 1987), the EBS adds information about the quality of the hands-on behavior. Compared to more detailed measures of visitor behavior (e.g. Crowley, Callanan, Jipson et al., 2001; Meisner et al., 2007) the EBS has the advantage of being applicable in different museum settings. In addition, the EBS allows for quantification of unanticipated behavior. The scale consists of three levels of increasingly extensive exploration: (1) passive contact, (2) active manipulation, and (3) exploratory behavior. At the third and highest level of exploratory behavior, the child demonstrates a compound of behaviors that can be compared to scientific reasoning in action: sustained attention, manipulation, and repetition with variation. Table 1 gives brief descriptions of the three EBS levels plus examples of children’s behavior at each of these levels at the Shadow Painting exhibit.
In this study, a trained test leader followed the child-parent team at a distance while they visited the exhibition space. She noted for each 30-second time interval the exhibit that the team interacted with, plus the highest EBS level that the child demonstrated within the interval. The Inter-observer reliability was determined by scoring the exploratory behavior of 18 children (20%) double. The reliability was shown to be sufficient: percentage agreement=83 and kappa=.69.
Explanation categories. To measure parent explanation, parents’ utterances at the Shadow Painting exhibit were transcribed and coded in line with previous work on this topic (Crowley, Callanan, Jipson et al., 2001; Crowley, Callanan, Tenenbaum, et al., 2001; Fender & Crowley, 2007; Szechter & Carey, 2009; Zimmerman et al., 2009). Each utterance was assigned to one of seven mutually exclusive explanation categories: open question, closed question, explanation, evidence description, content-related direction, navigation-related direction, and affective talk. Table 2 gives brief descriptions of the explanation categories plus examples of parents’ utterances in each of the categories at the Shadow Painting exhibit. Unclear utterances that could not be transcribed properly and unfinished utterances that could not be assigned to one of the seven categories were assigned to a rest category: other talk. The Inter-observer reliability was determined by scoring the explanation of 19 parents (21%) double. The reliability was shown to be sufficient: percentage agreement=82 and kappa=.77.
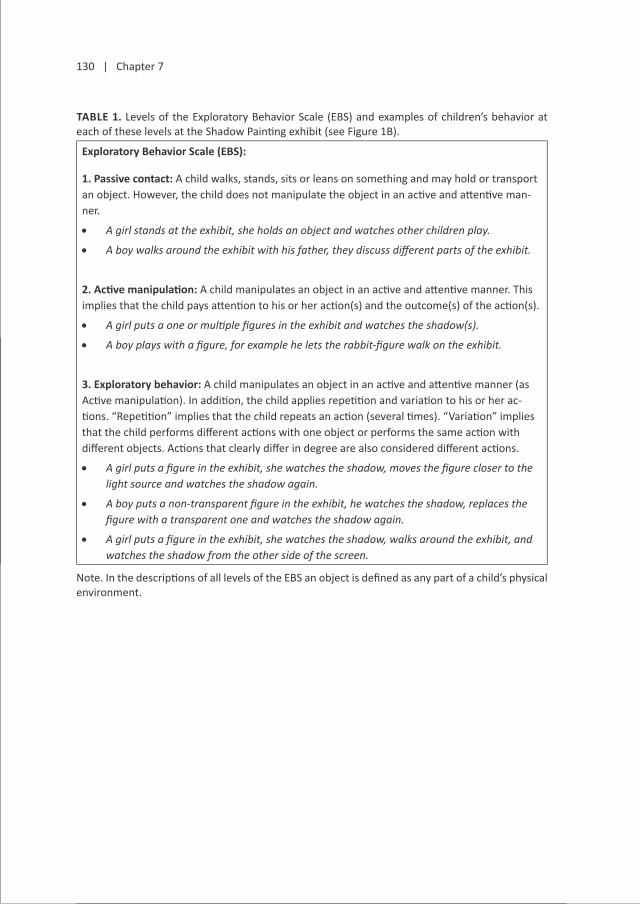
130 | Chapter 7
table 1. Levels of the Exploratory Behavior Scale (EBS) and examples of children’s behavior at each of these levels at the Shadow Painting exhibit (see Figure 1B).
exploratory behavior scale (ebs):
1. Passive contact: A child walks, stands, sits or leans on something and may hold or transport an object. However, the child does not manipulate the object in an active and attentive man-ner.
• A girl stands at the exhibit, she holds an object and watches other children play.
• A boy walks around the exhibit with his father, they discuss different parts of the exhibit.
2. Active manipulation: A child manipulates an object in an active and attentive manner. This implies that the child pays attention to his or her action(s) and the outcome(s) of the action(s).
• A girl puts a one or multiple figures in the exhibit and watches the shadow(s).
• A boy plays with a figure, for example he lets the rabbit-figure walk on the exhibit.
3. exploratory behavior: A child manipulates an object in an active and attentive manner (as Active manipulation). In addition, the child applies repetition and variation to his or her ac-tions. “Repetition” implies that the child repeats an action (several times). “Variation” implies that the child performs different actions with one object or performs the same action with different objects. Actions that clearly differ in degree are also considered different actions.
• A girl puts a figure in the exhibit, she watches the shadow, moves the figure closer to the light source and watches the shadow again.
• A boy puts a non-transparent figure in the exhibit, he watches the shadow, replaces the figure with a transparent one and watches the shadow again.
• A girl puts a figure in the exhibit, she watches the shadow, walks around the exhibit, and watches the shadow from the other side of the screen.
Note. In the descriptions of all levels of the EBS an object is defined as any part of a child’s physical environment.

Explanation, exploration and learning in a shadow exhibition | 131
table 2. Explanation categories and examples of parents’ utterances for each of these categories at the Shadow Painting exhibit (see Figure 1B).
explanation categories:
1. open question: Question which cannot be answered with “yes/ no”, often starting with “What/ Why/ How”.• What do you need to make this one [paining]?• Why isn’t that one [shadow] green?• How can we make the house bigger?
2. Closed question: Question which can be answered with “yes/ no”, or question with a limited number of answering options.• Do you have more of those [figures]?• Which shadow is bigger?• Which one [shadow] is light and which one [shadow] is dark?
3. Causal explanation: Talk establishing causal relations, or talk that makes a connection be-tween the exhibit and children‟s prior knowledge or experience.• If you put it [figure] closer to the light, it [shadow] gets really big.• If you can look through it [figure], you’ll see a color.• Did you ever see a rabbit that has the same size as a tree?
4. evidence description: Talk about exhibit features and observations.• This is the one [figure] with the colored glass.• That one [shadow] is smaller than the car [shadow].• They [shadows] are the same size now.
5. Content-related direction: Talk about exhibit use.• Go ahead and look for the figures.• Yes, put it [figure] over here.• Then put it [figure] a bit more to the back.
6. navigation-related direction: Talk about exhibition-navigation.• We can go to something else.• That girl is also playing.• We can do this later if these people are done.
7. Affective talk: Talk expressing emotions.• What a beautiful painting!
• That is silly.
• That is funny.
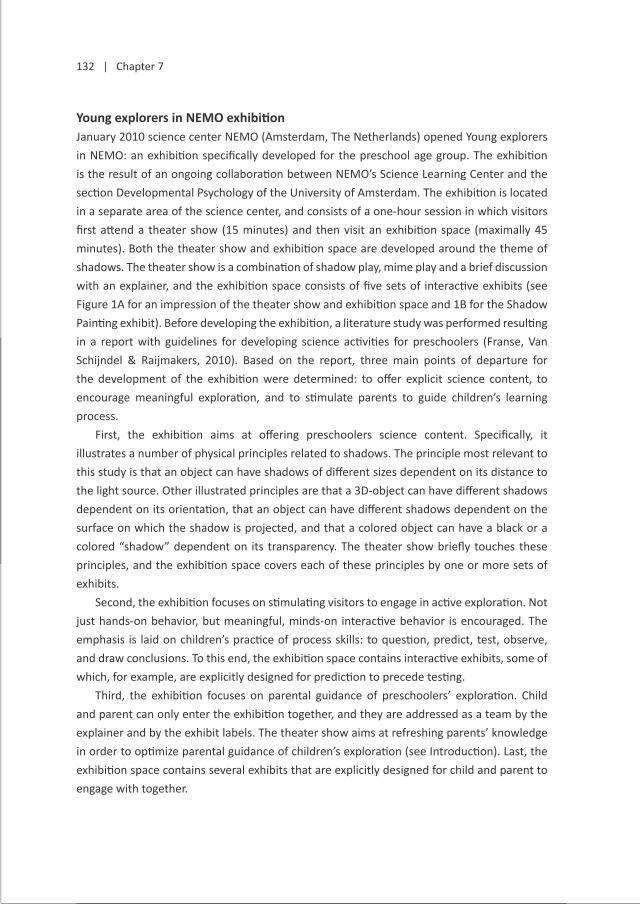
132 | Chapter 7
young explorers in neMo exhibitionJanuary 2010 science center NEMO (Amsterdam, The Netherlands) opened Young explorers in NEMO: an exhibition specifically developed for the preschool age group. The exhibition is the result of an ongoing collaboration between NEMO’s Science Learning Center and the section Developmental Psychology of the University of Amsterdam. The exhibition is located in a separate area of the science center, and consists of a one-hour session in which visitors first attend a theater show (15 minutes) and then visit an exhibition space (maximally 45 minutes). Both the theater show and exhibition space are developed around the theme of shadows. The theater show is a combination of shadow play, mime play and a brief discussion with an explainer, and the exhibition space consists of five sets of interactive exhibits (see Figure 1A for an impression of the theater show and exhibition space and 1B for the Shadow Painting exhibit). Before developing the exhibition, a literature study was performed resulting in a report with guidelines for developing science activities for preschoolers (Franse, Van Schijndel & Raijmakers, 2010). Based on the report, three main points of departure for the development of the exhibition were determined: to offer explicit science content, to encourage meaningful exploration, and to stimulate parents to guide children’s learning process.
First, the exhibition aims at offering preschoolers science content. Specifically, it illustrates a number of physical principles related to shadows. The principle most relevant to this study is that an object can have shadows of different sizes dependent on its distance to the light source. Other illustrated principles are that a 3D-object can have different shadows dependent on its orientation, that an object can have different shadows dependent on the surface on which the shadow is projected, and that a colored object can have a black or a colored “shadow” dependent on its transparency. The theater show briefly touches these principles, and the exhibition space covers each of these principles by one or more sets of exhibits.
Second, the exhibition focuses on stimulating visitors to engage in active exploration. Not just hands-on behavior, but meaningful, minds-on interactive behavior is encouraged. The emphasis is laid on children’s practice of process skills: to question, predict, test, observe, and draw conclusions. To this end, the exhibition space contains interactive exhibits, some of which, for example, are explicitly designed for prediction to precede testing.
Third, the exhibition focuses on parental guidance of preschoolers’ exploration. Child and parent can only enter the exhibition together, and they are addressed as a team by the explainer and by the exhibit labels. The theater show aims at refreshing parents’ knowledge in order to optimize parental guidance of children’s exploration (see Introduction). Last, the exhibition space contains several exhibits that are explicitly designed for child and parent to engage with together.

Explanation, exploration and learning in a shadow exhibition | 133
ProcedureThe study was performed in six consecutive weekends in the spring of 2010. That year science center NEMO offered eight Young explorers in NEMO sessions per weekend: two on Fridays and three on Saturdays and Sundays. Each session had a capacity of nine child-parent teams, and during the period of the study two of the nine spots were reserved for the study’s participants. Participants were recruited by flyers distributed on schools, by a mailing to parents who had previously participated with their children in infant research, and by the Young explorers in NEMO website. When parents signed up on the website, they were contacted to schedule a date and time for their participation. Participating child-parent teams received free entrance to the science center on the day of their participation.
Participation took one-and-a-half to two hours, and consisted of a pre-exhibition, exhibition, and post-exhibition phase. A team of trained test leaders guided child-parent teams through participation. Upon entry in the science center, the team was welcomed in an office space. The parent was talked through the features of the study, received a voice recorder, and was asked to sign a consent form and fill out a short background questionnaire. The child was administered the pre-task. The child-parent team then visited the exhibition, together with regular visitors who did not participate in the study. The teams in the theater condition attended the theater show, the teams in the no-theater condition did not. All teams (subsequently) visited the exhibition space. Before entering the space, the test leader activated the parent’s voice recorder in synchrony with her stopwatch. Next, children’s exploratory play was assessed and parent explanation was recorded (see Materials). The team’s visit ended when parents indicated that they were done, or when 45 minutes had passed and the exhibition space was closed for visitors. Last, the child-parent team was asked to take a seat in a secluded area of the (closed) exhibition space. In this phase the child was administered the post-task.
statistical approach for assessing learningSiegler (1976, 1981) developed the Rule Assessment Methodology (RAM) to detect the different naïve theories children demonstrate on the shadow task. Siegler first defined possible naïve theories, or rules, on shadow size (see Introduction). He then constructed different item types (see Materials), and defined expected responses for these item types for children having different rules. For example, children using Rule 1 are expected to answer size items correctly, but to say “the same” on distance items. Children using Rule 2-reversed are expected to answer size items correctly, but to give the incorrect answer on distance items. Children using Rule 2 are expected to answer both size- and distance items correctly. By matching observed to expected response patterns on a series of items, Siegler assigned children to the different rules. In this study we used Siegler’s Rule Assessment Methodology, but we replaced pattern matching by an advanced statistical technique: Latent Class Analysis

134 | Chapter 7
(LCA; for an introduction see e.g. McCutcheon, 1987; Rindskopf, 1987). LCA provides a statistically more reliable method to detect different types of response patterns than pattern matching (see Van der Maas & Straatemeier, 2008 for a more extended discussion). An important advantage of LCA is that the technique makes it possible to detect unanticipated response patterns, or rules. This advantage was shown in research on children’s naïve theories on balance and shadow size: by using LCA additional rules to those proposed by Siegler (1981) were found (Boom, Hoijtink & Kunnen, 2001; Jansen & Van der Maas, 1997; Van Schijndel et al., 2012 / Chapter 6).
For the pre- and post-task separately, exploratory LCA was used to determine which latent class model described the data, preschoolers’ trichotomous response patterns to the series of items, in the best and most parsimonious manner. Latent class models consist of a number of latent classes, which we in this study aim to interpret as naïve theories, or rules, on shadow size. Models with 1, 2, 3, 4, and 5 classes were fit to the data by calculating Log Likelihood estimates of the model parameters with the package depmixS4 (Visser & Speekenbrink, 2010) for the R statistical programming environment (R Development Core Team, 2011). Model parameters were estimated, including unconditional probabilities, which represent class sizes, and conditional probabilities, which represent probabilities of responses to items given membership of a specific class. In LCA the optimal number of latent classes cannot be estimated or tested, hence model selection was based on the Bayesian Information Criterion (BIC; Schwarz, 1978): the model with the lowest BIC was considered to be the most parsimonious, best fitting model. For the selected models, equality constraints were put on the conditional probabilities of the six size items in all classes and the same was done for the conditional probabilities of the six distance items in all classes. For both the pre- task model (Log likelihood ratio (80)=97.15, p=.09) and the post-task model (Log likelihood ratio (80)=82.59, p=.40) there was no significant difference in goodness-of-fit between the constrained and the unconstrained model, and therefore the more parsimonious, constrained models were used for interpretation. Interpretation was based on previous work on children’s naïve theories on shadow size (e.g. Chen, 2009; Ebersbach & Resing, 2007; Siegler, 1981; Van Schijndel et al., 2012 / Chapter 6).
resultsgeneralIn this study a wide range of child and parent behaviors was measured at several exhibits. As the research questions concerned relations between parent explanation and children’s exploratory behavior and learning, analyses were solely performed on behavior at the total exhibition and on behavior at the Shadow Painting (SP) exhibit (see Figure 1B). Behavior at the SP exhibit was analyzed separately, because this exhibit was selected for transcribing and coding of parent explanation.

Explanation, exploration and learning in a shadow exhibition | 135
holding timesChild-parent teams spent an average 31.50 minutes (62.89 30-second intervals, range 33-90, SD=16.00) at the total exhibition. The average holding time for the SP exhibit was 13.14 minutes (26.27 30-second intervals, range 5-59, SD=12.24). No relations between holding times (total exhibition and SP exhibit) and children’s or parents’ age or gender were found. No effect of theater attendance on holding time (total exhibition and SP exhibit) was found.
Preschoolers’ exploratory behaviorOn average children demonstrated a mean EBS level of 2.32 (range 1.69-2.59, SD=.15) in the total exhibition. For the SP exhibit this was 2.40 (range 1.55-2.89, SD=.23). Children’s exploratory behavior at the total exhibition (r=.51, p<.001) and at the SP exhibit (r=.40, p<.001) correlated significantly with their age in months: older children played at higher EBS levels than younger children. No relation between exploratory behavior (mean EBS levels total exhibition and SP exhibit) and children’s gender was found. No effect of theater attendance on exploratory behavior (mean EBS levels total exhibition and SP exhibit) was found.
Parent explanationParents made an average of 143.88 utterances (SD=76.03) at the SP exhibit: 31% of these utterances consisted of content-related directions, 26% of evidence descriptions, 14% of closed questions, 8% of open questions, 4% of affective talk, 3% of navigation-related directions, 2% of explanations, and 12% of the utterances could not be assigned to one of the above-mentioned categories (see Table 3A). The parent explanation variables that were included in the analyses were based on the mean number of utterances per 30-second time interval at the SP exhibit (see Table 3B). As in this study children’s exploratory behavior was expressed in mean EBS levels over intervals, using explanation variables based on means over intervals allowed for examining the relation between children’s exploratory behavior and parent explanation in a valid way.
The mean number of navigation-related directions per interval correlated significantly with children’s age in months (r=-.30, p<.01): parents gave less navigation-related directions to older children than to younger children. The mean number of closed questions per interval (r=.25, p<.05) and the mean number of evidence descriptions per interval (r=.22, p<.05) correlated significantly with parents’ age in years: older parents asked more closed questions and described more evidence than younger parents. No relations between explanation (mean number of utterances per interval for each of the seven categories) and children’s or parents’ gender were found. No effects of theater attendance on explanation (mean number of utterances per interval for each of the seven categories) were found.
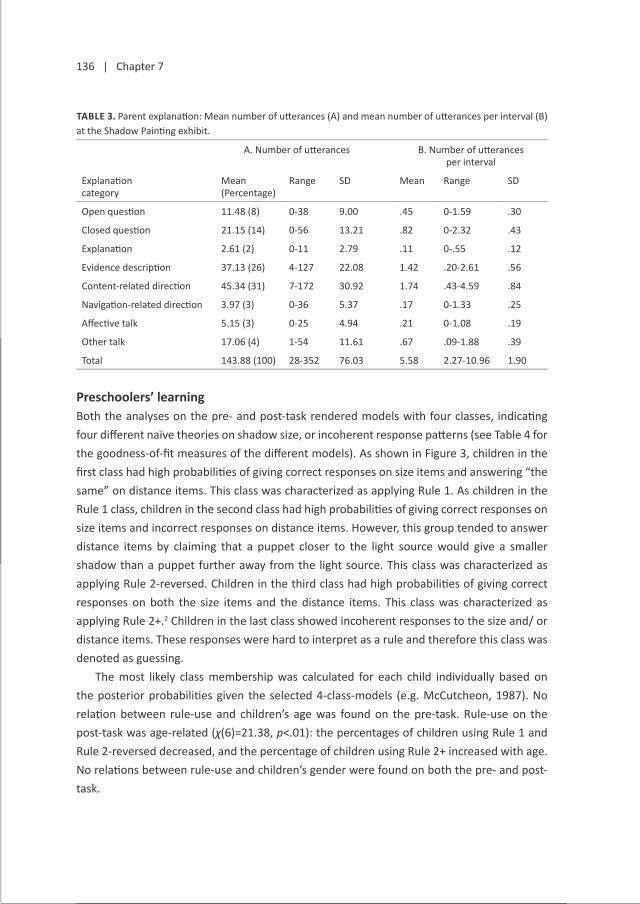
136 | Chapter 7
table 3. Parent explanation: Mean number of utterances (A) and mean number of utterances per interval (B) at the Shadow Painting exhibit.
A. Number of utterances B. Number of utterancesper interval
Explanation category
Mean(Percentage)
Range SD Mean Range SD
Open question 11.48 (8) 0-38 9.00 .45 0-1.59 .30
Closed question 21.15 (14) 0-56 13.21 .82 0-2.32 .43
Explanation 2.61 (2) 0-11 2.79 .11 0-.55 .12
Evidence description 37.13 (26) 4-127 22.08 1.42 .20-2.61 .56
Content-related direction 45.34 (31) 7-172 30.92 1.74 .43-4.59 .84
Navigation-related direction 3.97 (3) 0-36 5.37 .17 0-1.33 .25
Affective talk 5.15 (3) 0-25 4.94 .21 0-1.08 .19
Other talk 17.06 (4) 1-54 11.61 .67 .09-1.88 .39
Total 143.88 (100) 28-352 76.03 5.58 2.27-10.96 1.90
Preschoolers’ learning Both the analyses on the pre- and post-task rendered models with four classes, indicating four different naïve theories on shadow size, or incoherent response patterns (see Table 4 for the goodness-of-fit measures of the different models). As shown in Figure 3, children in the first class had high probabilities of giving correct responses on size items and answering “the same” on distance items. This class was characterized as applying Rule 1. As children in the Rule 1 class, children in the second class had high probabilities of giving correct responses on size items and incorrect responses on distance items. However, this group tended to answer distance items by claiming that a puppet closer to the light source would give a smaller shadow than a puppet further away from the light source. This class was characterized as applying Rule 2-reversed. Children in the third class had high probabilities of giving correct responses on both the size items and the distance items. This class was characterized as applying Rule 2+.2 Children in the last class showed incoherent responses to the size and/ or distance items. These responses were hard to interpret as a rule and therefore this class was denoted as guessing.
The most likely class membership was calculated for each child individually based on the posterior probabilities given the selected 4-class-models (e.g. McCutcheon, 1987). No relation between rule-use and children’s age was found on the pre-task. Rule-use on the post-task was age-related (χ(6)=21.38, p<.01): the percentages of children using Rule 1 and Rule 2-reversed decreased, and the percentage of children using Rule 2+ increased with age. No relations between rule-use and children’s gender were found on both the pre- and post-task.

Explanation, exploration and learning in a shadow exhibition | 137
table 4. Preschoolers’ learning: Goodness-of-fit measures for Latent Class Models of response patterns to pre- and post-task.
Pre-task Post-task
Numberof classes
L df BIC L df BIC
1 -873.61 24 1854.96 -898.17 24 1904.07
2 -757.63 49 1735.21 -735.08 49 1609.11
3 -672.79 74 1677.75 -608.55 74 1549.25
4 -597.59 99 1639.55 -520.53 99 1485.43
4e -646.17 19 1377.61 -561.83 19 1208.94
5 -559.92 124 1676.42 -484.82 124 1526.23
Note. L=Log likelihood, df=degrees of freedom (calculated by the number of freely estimated parameters minus the number of parameters estimated at the boundary), BIC=Bayesian Information Criterion. Row 4e shows the goodness-off-fit measures of the selected 4-class models with equality constraints (see Method).
To examine children’s learning, we inspected the crosstabs of children’s rule-use on the pre- and post-task (see Table 5). Of the 64 children that did not apply the most advanced rule (Rule 2+) on the pre-task, 21 children (33%) applied a more advanced rule on the post-task than on the pre-task, 40 children (62%) showed consistency in rule-use, and 3 children (5%) applied a less advanced rule on the post-task than on the pre-task. Analyses concerning children’s learning were performed on the total group of children that did not apply the most advanced rule on the pre-task (N=64). Within this group a learning group (N=21, children applying a more advanced rule) and no-learning group (N=43, children not applying a more advanced rule) were distinguished. No relations between learning (learning group vs. no-learning group) and children’s age or gender were found. An effect of theater attendance on learning was found: a larger proportion of children in the theater group (47%) compared to the no-theater group (21%) learned, meaning they applied a more advanced rule on the post-task than on the pre-task (χ(1)=4.92, p<.05).
table 5. Preschoolers’ learning: Crosstabs of rule use on the pre- versus the post-task.
Posttest
Guess Rule 1 Rule 2-reversed Rule 2+ Total
Pretest Guess 9 (60) 2 (13) 3 (20) 1 (7) 15 (100)
Rule 1 0 (0) 14 (70) 2 (10) 4 (20) 20 (100)
Rule 2-reversed 3 (10) 0 (0) 17 (59) 9 (31) 29 (100)
Rule 2+ 3 (12) 0 (0) 5 (20) 17 (68) 25 (100)
Total 15 (17) 16 (18) 27 (30) 31 (35) 89 (100)
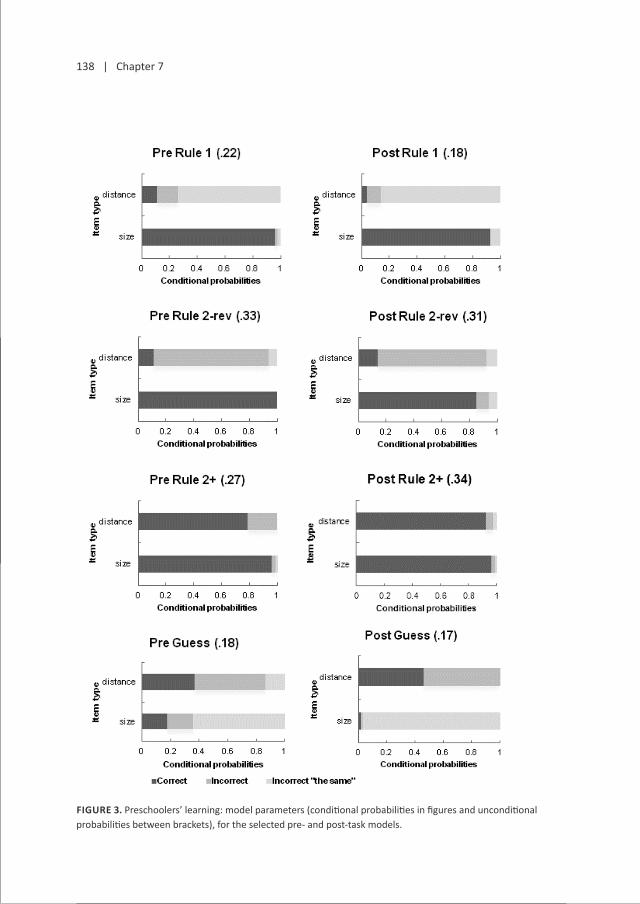
138 | Chapter 7
129
Figure 3. Preschoolers’ learning: model parameters (conditional probabilities in figures and unconditional probabilities between brackets), for the selected pre- and post-task models. figure 3. Preschoolers’ learning: model parameters (conditional probabilities in figures and unconditional probabilities between brackets), for the selected pre- and post-task models.

Explanation, exploration and learning in a shadow exhibition | 139
Parent explanation & preschoolers’ exploratory behaviorTo investigate whether parent explanation significantly predicted children’s exploratory behavior, a multiple regression analysis was performed with children’s mean EBS level at the SP exhibit as the dependent variable and five parent explanation variables (mean number of open questions, closed questions, explanations, evidence descriptions, and content-related directions per interval) as predictors.3 Theater attendance (theater group, no-theater group) and children’s age in months were also included as predictors to investigate whether parent explanation predicted exploratory behavior controlling for theater attendance and children’s age. Using the enter method,4 two predictors were found to make a significant contribution to the predictive power of the model: children’s age in months, and the mean number of evidence descriptions per interval (see Table 6 for the full model). The analysis was repeated with only these two predictors and it was demonstrated that together they explained 21% of the variance. With other variables held constant, children’s exploratory behavior was positively related to both predictors, increasing by .01 for every month of age and by .09 for every evidence description (see Table 6 for the full model).
table 6. Multiple regression models predicting preschoolers’ exploratory behavior (mean EBS level at the Shadow Painting exhibit).
B (SE) ß
Model 7 predictors:
Constant 1.66 (.17)
Theater attendance (T) .02 (.04) .04
Age in months (C) .01 (.00) .41 ***
Mean number of open questions per interval (P) .03 (.10) .03
Mean number of closed questions per interval (P) -.03 (.07) -.06
Mean number of explanations per interval (P) .30 (.19) .16
Mean number of evidence descriptions per interval (P) .10 (.05) .25 *
Mean number of directions per interval (P) -.03 (.03) -.11
Model 2 predictors:
Constant 1.67 (.16)
Age in months (C) .01 (.00) .39 ***
Mean number of evidence descriptions per interval (P) .09 (.04) .23 *
Note. B=un-standardized beta coefficient, SE=standard error, ß=standardized beta coefficient, T=team, C=child, P=parent, Model 7 predictors: R2=.24, R2adj=.18, F(7,81)=3.71**, Model 2 predictors: R2=.21, R2adj=.19, F(2,86)=11.44***, *p<.05, **p<.01, **p<.001
Preschoolers’ exploratory behavior, parent explanation & preschoolers’ learningTo investigate whether children’s exploratory behavior and parent explanation significantly predicted preschoolers’ learning, a logistic regression analysis was performed with children’s
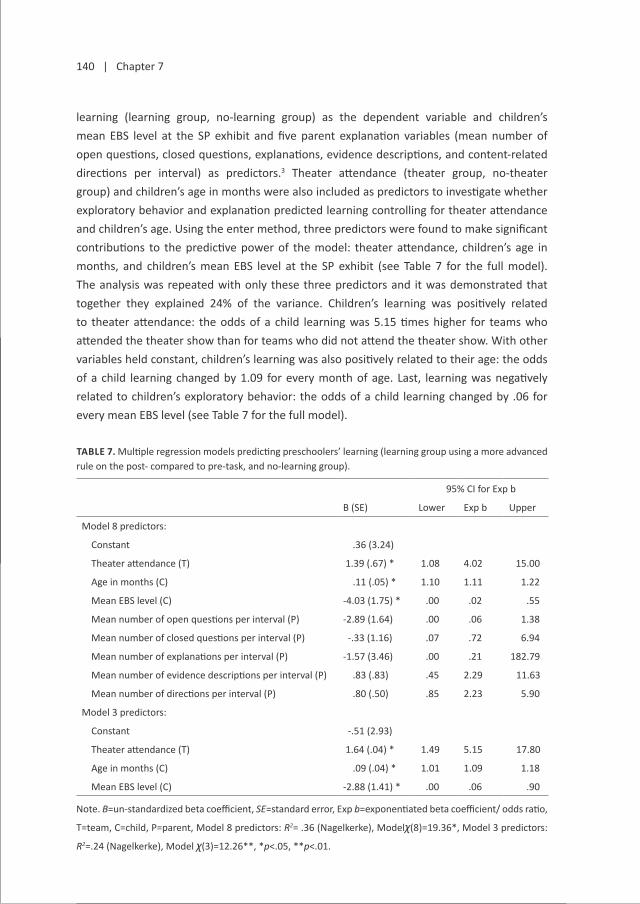
140 | Chapter 7
learning (learning group, no-learning group) as the dependent variable and children’s mean EBS level at the SP exhibit and five parent explanation variables (mean number of open questions, closed questions, explanations, evidence descriptions, and content-related directions per interval) as predictors.3 Theater attendance (theater group, no-theater group) and children’s age in months were also included as predictors to investigate whether exploratory behavior and explanation predicted learning controlling for theater attendance and children’s age. Using the enter method, three predictors were found to make significant contributions to the predictive power of the model: theater attendance, children’s age in months, and children’s mean EBS level at the SP exhibit (see Table 7 for the full model). The analysis was repeated with only these three predictors and it was demonstrated that together they explained 24% of the variance. Children’s learning was positively related to theater attendance: the odds of a child learning was 5.15 times higher for teams who attended the theater show than for teams who did not attend the theater show. With other variables held constant, children’s learning was also positively related to their age: the odds of a child learning changed by 1.09 for every month of age. Last, learning was negatively related to children’s exploratory behavior: the odds of a child learning changed by .06 for every mean EBS level (see Table 7 for the full model).
table 7. Multiple regression models predicting preschoolers’ learning (learning group using a more advanced rule on the post- compared to pre-task, and no-learning group).
95% CI for Exp b
B (SE) Lower Exp b Upper
Model 8 predictors:
Constant .36 (3.24)
Theater attendance (T) 1.39 (.67) * 1.08 4.02 15.00
Age in months (C) .11 (.05) * 1.10 1.11 1.22
Mean EBS level (C) -4.03 (1.75) * .00 .02 .55
Mean number of open questions per interval (P) -2.89 (1.64) .00 .06 1.38
Mean number of closed questions per interval (P) -.33 (1.16) .07 .72 6.94
Mean number of explanations per interval (P) -1.57 (3.46) .00 .21 182.79
Mean number of evidence descriptions per interval (P) .83 (.83) .45 2.29 11.63
Mean number of directions per interval (P) .80 (.50) .85 2.23 5.90
Model 3 predictors:
Constant -.51 (2.93)
Theater attendance (T) 1.64 (.04) * 1.49 5.15 17.80
Age in months (C) .09 (.04) * 1.01 1.09 1.18
Mean EBS level (C) -2.88 (1.41) * .00 .06 .90
Note. B=un-standardized beta coefficient, SE=standard error, Exp b=exponentiated beta coefficient/ odds ratio,
T=team, C=child, P=parent, Model 8 predictors: R2= .36 (Nagelkerke), Modelχ(8)=19.36*, Model 3 predictors:
R2=.24 (Nagelkerke), Model χ(3)=12.26**, *p<.05, **p<.01.
Explanation, exploration and learning in a shadow exhibition | 141
discussionThe present study fills a gap in existing visitor research by focusing on the preschool age group. Specifically, the study investigated, in an explorative manner, relations between parent explanation, children’s exploratory behavior, and learning in a shadow exhibition in science center NEMO, The Netherlands. Parent explanation was coded in a number of domain-general categories, such as causal explanations, evidence descriptions, and content-related directions (Crowley, Callanan, Jipson et al., 2001; Crowley, Callanan, Tenenbaum, et al., 2001; Fender & Crowley, 2007; Szechter & Carey, 2009; Zimmerman et al., 2009). Preschoolers’ exploratory behavior and learning were quantified by using nonverbal measures. The Exploratory Behavior Scale (EBS; Van Schijndel, Franse et al., 2010 / Chapter 3; Van Schijndel, Singer et al., 2010 / Chapter 2) was used to assess the level to which children explored their physical environment. Children’s learning was assessed in the knowledge domain of shadow size.
The first research question concerned the relation between parent explanation and preschoolers’ exploratory behavior. Fender and Crowley (2007) did not find a relation between parent explanation and young children’s exploration. However, they focused on one type of explanation: causal explanations. In this study the relations between multiple types of parent explanation and preschoolers’ exploration were investigated. We found a relation between one specific type of parent explanation, evidence descriptions, and preschoolers’ exploration: children whose parents described more evidence demonstrated higher mean levels of exploratory behavior than children whose parents described less evidence. Parents’ evidence descriptions might guide preschoolers’ exploration by directing or maintaining children’s attention to relevant task aspects or evidence resulting from their manipulations. Research on executive functions shows that the ability to attend to relevant evidence is still in development in childhood: older children are better at planning and executing effective information search strategies than younger children (e.g. Davidson, 1996; Miller & Weiss, 1981; Welsh, Pennington & Groisser, 1991). In addition, young children have difficulty shifting between tasks and have a relatively limited working memory capacity (e.g. Huizinga, Dolan & Van der Molen, 2006). Therefore, by describing evidence, parents might provide structure to children’s exploratory process. Exploratory behavior is considered a key ingredient of children’s visit to science museums (Allen, 2002, 2004), hence this result is highly relevant to the practice of informal science learning. However, on the basis of this result no causal conclusions can be drawn. To understand what mechanisms are underlying this relation, it is important for future research to replicate this result with an experimental paradigm.
The second research question concerned preschoolers’ learning on shadow size. Three groups of children with different naïve theories, and a group of children with incoherent responses were distinguished on the basis of both the pre- and the post-task data. The detected theories were similar to those found in previous studies (Chen 2009; Ebersbach

142 | Chapter 7
& Resing, 2007; Siegler, 1981; Van Schijndel et al., 2012 / Chapter 6). It was found that a third of the preschoolers that did not use the most advanced theory on the pre-task, learned during their visit to the exhibition. That is, they had a more advanced theory after visiting the exhibition compared to before. In the next paragraphs we will first discuss the results concerning the relation between children’s learning and exploration, followed by the results concerning the relation between children’s learning and parent explanation.
In line with studies in more controlled settings (Bonawitz et al., 2012; Gweon & Schulz, 2008; Schulz et al., 2007; Van Schijndel et al., 2012 / Chapter 6), a relation was found between preschoolers’ exploratory behavior and learning. However, in contrast to the findings of the controlled studies, in the present study this relation was negative: children who demonstrated higher mean EBS levels were less likely to learn than children who demonstrated lower mean EBS levels. Even though it is difficult to draw conclusions on the basis of unexpected results, we do spend some words on reflecting on this result, because besides theory-driven explanations, several methodological explanations exist for the found contrast. For example, in the controlled studies domain-specific measures for exploration were used, while in this study a domain-general measure for exploration was used. Instead of coding whether children did or did not generate instances of evidence that could support learning in the knowledge domain at hand, we used the EBS to determine the general level to which children explored their physical environment. Possibly, children’s high EBS levels reflected them exploring a different principle than the relation between object size, object distance and shadow size. For example, they might have investigated the relation between object transparency and shadow color, or a principle that the Shadow Painting exhibit was not designed to illustrate. However, an observation that runs counter to this explanation is that random checks of the parent explanation transcripts suggested that all child-parent teams had generated multiple instances of evidence supporting learning on shadow size. The finding of a weaker relation between generating evidence and learning in this study compared to the studies in controlled settings (Bonawitz et al., 2012; Gweon & Schulz, 2008; Schulz et al., 2007; Van Schijndel et al., 2012 / Chapter 6), can be explained by the fact that in this study children’s exploration took place in an exhibition space with many distractions. Moreover, for children to perform well on the learning task some transfer of knowledge was needed, which is known to be difficult. Another explanation for the contrasting findings on the relation between exploration and learning is that this study used mean levels of exploratory behavior over time intervals, while the studies in controlled settings did not (Bonawitz et al., 2012; Gweon & Schulz, 2008; Schulz et al., 2007; Van Schijndel et al., 2012 / Chapter 6). Possibly, the lower mean EBS levels in this study reflected children thinking or talking about the generated evidence. Reflection may increase learning from observations, explaining the negative correlation between exploratory behavior and learning.
Importantly, these findings do not diminish the value of the EBS as a measure for preschoolers’ exploration in natural settings. In the case of the present study, children were
Explanation, exploration and learning in a shadow exhibition | 143
encouraged by the design of the exhibition to explore a relatively wide range of knowledge: multiple shadow principles. The EBS produced a general level of behavior, including behaviors that were anticipated, and behaviors that were unanticipated by the exhibition developers. At the same time, children’s knowledge acquisition was measured in a relatively narrow domain: on one of the shadow principles. In cases like this, the EBS might not be the best measure to uncover relations between behavior and learning. However, when a study aims at comparing children’s exploratory behavior under different conditions, the EBS can be considered highly suitable. For example, the EBS can be used to investigate whether differences between exhibits or different types of adult guidance affect children’s exploratory behavior (Van Schijndel, Franse et al., 2010 / Chapter 3; Van Schijndel, Singer et al., 2010 / Chapter 2).
Next, we investigated the relation between different types of parent explanation and preschooler’s learning. Fender and Cowley (2007) found a relation between parents’ causal explanations and children’s conceptual learning, but not their mechanistic and procedural learning. As the task that was used in this study for assessing children’s learning can best be characterized as being on a mechanistic or procedural level, our results can be considered in line with Fender and Crowley’s (2007): no relations between parent explanation and children’s learning were found. One explanation for the lack of this relation is that parent explanation was measured on a domain-general level. To check whether parents’ domain-specific explanation was related to children’s learning, we went back to the transcribed parent talk. We coded whether parents’ utterances did or did not refer to one of the two factors influencing shadow size: the size of the object and the distance of the object to the light source. For example, utterances were coded as referring to the size dimension as parents used words such as “big”, “bigger”, “small”, or “smaller”. Utterances were coded as referring to the distance dimension when parents used words such as “close”, “closer”, “far”, or “further”. However, no relations were found between the number of utterances in which parents referred to the size and/ or distance dimension, and children’s learning. These results speak to the complicated question of the relative contributions of children’s self-directed exploration and their interactions with other people to their learning. The relative power of these two sources of input on children’s learning under different task constraints is an important question for future research (Gelman, 2009).
The last research question concerned the effects of the theater show. In contrast to our expectations, no effects of theater attendance were found on parent explanation. Possibly parents have overlooked the principles in the show, or they might already have been familiar with the principles. However, there are multiple explanations for this outcome and only future research can shed light on this issue. Concerning the child variables, no effects of theater attendance were found on preschoolers’ exploratory behavior. We did find an effect on preschoolers’ learning: children in teams that had attended the theater show were more likely to learn than children in teams that had not attended the show. As discussed before,

144 | Chapter 7
this effect was not mediated by parent explanation. Possibly, the effect was caused by the theater show having a calming effect on children. Alternatively, the effect might have been caused by the longer amount of time that the theater group had been engaged in shadow activities. As the finding of a positive effect of theater attendance on children’s learning is of relevance for the field of informal science education, further research into the robustness and mechanisms of the effect is needed.
acknowledgementsThe research of Tessa van Schijndel is sponsored by an NWO-Aspasia grant and the Dutch Curious Minds program, which is supported by the Dutch Ministry of Education, Culture and Science and the Platform Bèta Techniek. The research of Maartje Raijmakers is sponsored by a NWO-VIDI grant. We would like to thank children and parents for their participation in the study. We thank Rooske Franse and Meie van Laar for help with the logistics of the project. We thank Elizabeth Borlefs, Jiska Osterhaus, Rudi Mur, and Juri Peters for help with the data collection and coding. We thank Brenda Jansen, Han van der Maas, Ingmar Visser, and Wouter Weeda for statistical advice.

Explanation, exploration and learning in a shadow exhibition | 145
notes1. In all exhibits the distance between the light
source and screen was fixed, so this variable
could not be taken along in child-parent team’s
investigations on shadow size. Similarly, in
the task that was used to assess children’s
knowledge on shadow size, the distance
between the light sources and screen was kept
constant.
2. As on the basis of the sole use of size- and
distance items in this study children applying
Rule 2 could not be distinguished from children
applying Rule 3 or 4 (see Siegler, 1981), the plus
sign (Rule 2+) was used to indicate the possible
use of a more advanced rule.
3. In the regression analyses on children’s
exploratory behavior and learning, five types
of parent explanation were included: open
questions, closed questions, explanations,
evidence descriptions, and content-related
directions. To limit the number of variables in
the analyses, two explanation types which were
used very infrequently by parents, affective talk
(4% of the utterances), and navigation-related
direction (3% of the utterances) were not
included. Besides its infrequent use, another
reason not to include navigation-related
direction was that these explanations did not
concern children’s exploration or leaning at
the exhibits, but solely the team’s navigation
through the exhibition.
4. As stepwise techniques are influenced by
random variation in the data and seldom give
replicable results if the model is retested within
the same sample (Field, 2005), we used the
enter method for the regression analyses in
this study.


chaPter 8
Summary and general discussion

148 | Chapter 8
This thesis contains six empirical studies concerning preschoolers’ science learning. The studies focus on preschoolers’ exploratory play, naïve theories, and causal learning in both natural and controlled settings. In the following paragraphs, we will discuss the findings concerning each of these topics and indicate directions for future research. Finally, we will come back to the collaboration between the UvA research group and science center NEMO. We will briefly summarize the activities that were undertaken to bridge the gap between research and practice, and discuss the added value of the collaboration for both parties.
PresChoolers’ exPlorAtory PlAy in nAtUrAl settingsThe studies in Chapters 2, 3, and 7 concerned effects of adult guidance on preschoolers’ exploratory play. We started by investigating effects of a wide range of adult behaviors in Chapter 2, but focused increasingly on investigating effects of specific aspects of adult behavior in the subsequent chapters. In a daycare setting, we found that a sciencing program affected the quality of young preschoolers’ exploratory play (Chapter 2). In a museum setting, we compared the effects of different adult coaching styles on preschoolers’ exploration at exhibits (Chapter 3). We found that, dependent on the exhibit, a different coaching style resulted in the highest quality of exploratory play. In a second experiment we found that informing parents about an effective way of coaching influenced their children’s exploratory play at exhibits. In Chapter 7 we investigated relations between different types of parent explanation and preschoolers’ exploration in a museum setting. It was found that children whose parents gave more evidence descriptions demonstrated a higher quality of exploratory play. However, the design of the study does not allow us to draw causal conclusions about this relation. Future research might therefore be aimed at replicating this finding with an experimental paradigm.
To quantify preschoolers’ exploration in natural settings we developed the Exploratory Behavior Scale (EBS). This scale has the advantage of being domain-general and applicable in different settings, while at the same time being a relatively detailed measure that can be used to assess the quality of preschoolers’ exploration. We have shown that the EBS is a suitable measure for investigating effects of parent guidance on preschoolers’ behavior (Chapters 2, 3 and 7). However, the EBS’s domain-general nature might make the scale less suitable for investigating relations between exploration and domain-specific learning (Chapter 7).
PresChoolers’ exPlorAtory PlAy in Controlled settingsThe study in Chapter 6 concerned the effect of conflicting evidence on preschoolers’ exploratory play. Previous studies demonstrated effects of uncertainty caused by the ambiguity of evidence on preschoolers’ exploration (Cook, Goodman & Schulz, 2011; Gweon & Schulz, 2008; Schulz & Bonawitz, 2007). Bonawitz, Van Schijndel, Friel, and Schulz (2012)

Summary and general discussion | 149
demonstrated the effect of uncertainty generated by conflicting evidence on the duration of young children’s play. We extended those results by showing that this type of uncertainty also affects the quality of play: children who were shown evidence conflicting with their naïve theory conducted a higher number of unconfounded, informative experiments during free play than children who were confronted with consistent evidence.
Important questions for the future concern the relation between preschoolers’ observation of evidence, their exploration, and learning. One topic of interest is preschoolers’ explanations for evidence conflicting with their naïve theory. Siegler and Chen (2008) showed that asking primary school-aged children to explain answers affected their learning, and that explaining why incorrect answers were incorrect had an additive affect compared to solely explaining why correct answers were correct. A first question for future research is whether, besides affecting learning, explaining conflicting evidence also affects exploration. Specifically, we are interested in the question whether explaining conflicting evidence has an effect on the quality of children’s exploration in addition to only observing conflicting evidence. A second question for future research is how children’s explanations are related to their exploration; that is, are specific explanations related to specific patterns of play? Legare (2012) found evidence for this claim in the preschool age group. She demonstrated that children who explained conflicting evidence by referring to a problem with the functioning of an object, engaged in more variable exploration, and were more likely to show behavior consistent with a search for an internal mechanism, than children giving other causal explanations. In line with the hypothesis that explanations affect learning by making children notice explanatory variables that they had not noticed before (Calin-Jageman & Ratner, 2005; Siegler & Chen, 2008), we are interested in investigating whether this noticing of variables also guides children’s play. Do children who mention a new variable in their explanation focus mostly on investigating that variable during exploration?
Children’s nAïve theoriesIn Chapter 4, 6 and 7 we presented studies concerning children’s naïve theories in several different areas of science. We applied an individual differences approach: based on children’s response patterns to a series of items, different types of knowledge were distinguished. These qualitatively different theories were subsequently related to age. Compared to inspecting average accuracies per age group, the individual differences approach yields a more detailed description of development. We used Siegler’s (1976, 1981) Rule Assessment Methodology to apply the approach, but instead of analyzing response patterns by matching observed to expected response patterns we applied a latent variable technique (e.g. McCutcheon, 1987; Rindskopf, 1987). One of the advantages of a latent variable technique over pattern matching is that the technique makes it possible to detect unanticipated response patterns, or theories (see Van der Maas & Straatemeier, 2008 for a more extended discussion). In addition, the

150 | Chapter 8
technique allows for disentangling different sources of variance in children’s responses: variance resulting from different theories and variance resulting from children making errors in applying their theories.
In Chapter 4 we investigated primary school-aged children’s naïve theories about prenatal development. Results of a forced-choice questionnaire showed that children have coherent, age-related, theories about the shape of the fetus, but not about bodily functions. The shape theories were in line with previous work on children’s reasoning about natural transformations (Rosengren, Gelman, Kalish & McCormick, 1991) and constraints in representational flexibility (Karmiloff-Smith, 1992). In addition, we explored two issues related to the use of different methodologies for assessing children’s naïve theories. First, we examined whether a generative task leads children to form theories “on the spot” (Vosniadou, Skopeliti, & Ikospentaki, 2004). In line with this hypothesis, we found a preceding drawing task to enhance the coherence of children’s theories as measured by the questionnaire. A question for future research is whether other types of generative tasks, such as open-ended interviews, have the same effect. Second, we compared several methodologies for assessing children’s naïve theories (e.g. Nobes et al., 2003; Straatemeier, Van der Maas & Jansen, 2008; Vosniadou, Skopeliti & Ikospentaki, 2004). We found the results of the drawing task not to be related to age, and the coherence of the interview to be considerably less than for the questionnaire. Therefore, we concluded that drawing tasks and interviews are suboptimal methodologies for assessing children’s theories.
In Chapter 6 and 7 we investigated preschoolers’ naïve theories about shadow size. In line with previous research (Chen 2009; Ebersbach & Resing, 2007; Siegler, 1981) two age-related theories were distinguished: children taking into account object size, and children taking into account both object size and the distance of an object to the light source in determining shadow size. In addition, we distinguished a group of children giving incoherent responses. However, to our knowledge, we were the first to systematically demonstrate the existence of a third theory: children taking into account the size dimension in the right direction, but the distance dimension in the wrong direction in determining shadow size (Rule 2-reversed). Learning data (see the next paragraph, “Preschoolers’ causal learning”) suggested that children applying this theory might be a transitional group, making them more susceptible to evidence than children in other theory groups. However, future research has to show whether this is the case. Regardless, the finding of the new theory group clearly illustrates the advantage of using a latent variable technique over pattern matching.
This work, as well as other work on children’s naïve theories in areas of science (e.g. Boom, Hoijtink, & Kunnen, 2001; Jansen & Van der Maas 1997, 2001, 2002; Straatemeier, Van der Maas & Jansen, 2008), demonstrates that differences between domains exist in the development of children’s knowledge. These differences might be related to available sources of knowledge: for example, some domains allow for children to have hands-on

Summary and general discussion | 151
experiences, while other domains only allow for information to be obtained through books, television or interactions with other people. However, the studies of specific domains do contribute to gaining a better understanding of knowledge development in general. Topics for future research that transcend domains concern relations between generative tasks and the coherence of knowledge, the process by which implicit knowledge gained by experience is integrated with explicit knowledge gained by interactions with others, and relations between different sources of knowledge and the coherence of knowledge (e.g. Gelman, 2009; Harris & Koenig, 2006).
PresChoolers’ CAUsAl leArningIn Chapter 5 we investigated a prerequisite for learning from exploration: preschoolers’ ability to make causal inferences form observed evidence. To our knowledge, this study was the first to apply the individual differences approach in this line of research (see Gopnik et al., 2004 for a review). To this end, we administered a series of carefully selected causal inference trials to preschoolers of a relatively broad age range. We distinguished different types of response patterns with the goal of interpreting these as types of causal inferences. Results showed a developmental pattern based on three age-related types of causal inferences. Possibly these types reflect different mechanisms for causal inference: older children responded consistent with the Causal Graphical Model framework (Gopnik et al., 2004), while younger children responded consistent with causal inference on the basis of associative models (Dickinson, 2001; Rescorla & Wagner, 1972; Shanks & Dickinson, 1987). However, as the study did not test the existence of these mechanisms directly, these interpretations should be considered preliminary. Other possible interpretations of the developmental pattern concern children’s developing information processing capacities and motor abilities in combination with demands of the procedure used (Sobel & Kirkham, 2006). Future research could be aimed at further unraveling the factors underlying these individual differences by using new procedures (e.g. Beckers, Vandorpe, Debeys & De Houwer, 2009; Sobel & Munro, 2009). Studies could either focus on selecting additional procedures for distinguishing between possible mechanisms for causal inference, such as trials including information about the base rate of certain events occurring (e.g. Sobel, Tenenbaum & Gopnik, 2004), or focus on selecting procedures for minimizing the demands on abilities other than children’s causal reasoning abilities (Sobel & Kirkham, 2006).
In Chapter 6 and 7 we investigated preschoolers’ causal learning from exploration in the domain of shadow size. In a controlled setting (Chapter 6), we investigated relations between children’s prior knowledge and learning, and between their exploration and learning. We found that children who had a Rule 2-reversed theory at the start of the experiment showed larger negative changes in knowledge on the size dimension and larger positive changes in knowledge on the distance dimension over time than children in the other theory groups.

152 | Chapter 8
In addition, we found that children who conducted more distance experiments during free play, showed a larger increase in knowledge on the distance dimension than children who conducted less distance experiments during free play. In a museum setting (Chapter 7) we investigated relations between parent explanation and children’s learning, and between children’s exploration and learning. In addition, we investigated whether attending a theater show prior to visiting the exhibition space affected children’s learning. We did not find relations between parent explanation and children’s learning. In contrast to the results in a controlled setting, a negative relation between children’s exploration and learning was found: children who demonstrated higher mean EBS levels were less likely to learn than children who demonstrated lower mean EBS levels. Last, we found an effect of theater attendance on children’s learning: children in teams that had attended the theater show were more likely to learn than children in teams that had not attended the show.
Future research could further investigate the process by which preschoolers learn from exploration in domains such as shadow size. In line with previous work on preschoolers’ causal learning (e.g. Gweon & Schulz, 2008; Schulz, Gopnik & Glymour, 2007), we found only small percentages of children to show a more advanced theory after exploration compared to before. Work on primary school-aged children’s science learning, suggests that the relation between exploration and learning is mediated by the hypotheses children have in mind when designing experiments and the conclusions they draw based on the results of experiments (e.g. Dunbar & Klahr, 1989; Schauble, 1990). Future studies in controlled settings could be aimed at investigating these factors in the preschool age group.
CollAborAtion UvA & neMo: bridging reseArCh And PracticeThe studies described in this thesis had the double aim of contributing to theory development on preschoolers’ exploratory play, naïve theories and causal learning, and at the same time describing children’s science learning in natural settings. The work was performed within the framework of Curious Minds: a program at the intersection of research and practice. In meeting the goals of Curious Minds, the UvA research group collaborates closely with science center NEMO. During the last 5 years the UvA and NEMO have collaborated on gaining experience and knowledge on young children’s science learning, and sharing this knowledge with different parties in the fields of formal and informal education. As mentioned in Chapter 1, activities of the UvA and NEMO included giving workshops to teachers, writing a guide with recommendations for developing science activities for preschoolers (Franse, Van Schijndel & Raijmakers, 2010), and developing the Young explorers in NEMO exhibition (http://www.e-nemo.nl/kleutersaanzet). In addition, we have also contributed to bridging the gap between research and practice by offering advice to Dutch science museums on exhibition development, and by regular presentations on science center conferences.

Summary and general discussion | 153
The collaboration between the UvA and NEMO has proved fruitful for both parties. For the UvA the added value of the collaboration lies in the opportunity to study children’s science learning in a natural setting. NEMO is visited frequently by families with young children and this allows for investigating whether research results that have been obtained in controlled settings can be replicated in a natural setting. In addition, working with NEMO on educational products, allows the researchers to gain insight on the relevance of research questions for professionals. For NEMO the added value of the collaboration lies in advancing knowledge on children’s cognitive and social-emotional development. What are preschoolers’ skills and knowledge in the field of science? And how can preschoolers’ exploration and learning be stimulated in a museum setting? In addition, the researchers offer the museum advice on the evaluation of activities for young children. As measuring preschoolers’ behavior in an informal setting can be a complicated undertaking, the UvA research group’s methodological expertise comes in handy for this purpose. To conclude, looking at the advantages for both collaborating parties and the products resulting from the collaboration, the choice for performing three types of research-related activities within the framework of this thesis (studies in controlled settings, studies in natural settings, and the application of research outcomes in the practice of science education) can be considered a valuable approach.


References
156
Afonso, A. S., & Gilbert, J. K. (2007). Educational value
of different types of exhibits in an interactive
science and technology center. Science
Education, 91(6), 967-987.
Allen, S. (2002). Looking for learning in visitor talk:
A methodological exploration. In G. Leinhardt,
K. Crowley, & K. Knutson (Eds.), Learning
conversations in museums (pp. 259–303).
Mahwah, NJ: Lawrence Erlbaum Associates.
Allen, S. (2004). Designs for learning: studying science
museum exhibits that do more than entertain.
Science Education, 88 (1), 17–33.
Arnold, D. H., Fisher, P. H., Doctoroff, G. L., & Dobbs,
J. (2002). Accelerating math development in
Head Start classrooms. Journal of Educational
Psychology, 94(4), 762-770.
Ash, D. (2003). Dialogic inquiry in life science
conversations of family groups in a museum.
Journal of Research in Science Teaching, 40(2),
138–162.
Au, T. K. Romo, L.F. (1999). Mechanical causality in
children’s “folkbiology” In: D. Medin, & S. Atran
(Eds.), Folkbiology (pp. 355-401). Cambridge,
MA: MIT Press.
Aubrey, C., Bottle, G., & Godfrey, R. (2003). Early
mathematics in the home and out-of-home
contexts. International Journal of early Years
Education, 11, 91-103.
Barlow, C. M., Jolley, R.P., White, D. G., & Galbraith,
D. (2003). Rigidity in children’s drawings and its
relation with representational change. Journal of
Experimental Child Psychology, 86, 124–152.
Beckers, T., Vandorpe, S., Debeys, I., & De Houwer,
J. (2009). Three-year-olds’ retrospective
revaluation in the blicket detector task: Backward
blocking or recovery from overshadowing?
Experimental Psychology, 56, 27-32.
Belsky, J., Goode, M. K., & Most, R. K. (1980). Maternal
stimulation and infant exploratory competence:
Cross-sectional, correlational and experimental
analyses. Child Development, 51, 1163-1178.
Berlyne, D. E. (1960). Conflict, arousal and curiosity.
New York: McGraw-Hill.
Bernstein, A. C. & Cowan, P. A. (1975). Children‘s
concepts of how people get babies. Child
Development, 46, 77-91.
Boisvert, D. L.,& Slez, B. J. (1994). The relationship
between visitor characteristics and learning-
associated behaviors in a science museum
discovery space. Science Education, 79, 503-518.
Boisvert, D. L.,& Slez, B. J. (1995). The relationship
between exhibit characteristics and learning-
associated behaviors in a science museum
discovery space. Science Education, 78, 137-148.
Bonawitz, E. B., Shafto, P., Gweon, H., Goodman,
N., Spelke, E., & Schulz, L. E. (2011). The
double-edged sword of pedagogy: Teaching
limits children’s spontaneous exploration and
discovery. Cognition, 120(3), 322-330.
Bonawitz, E. B., Van Schijndel, T. J. P., Friel, D., &
Schulz, L. E. (2012). Children balance theories
and evidence in exploration, explanation, and
learning. Cognitive Psychology 64, 215–234.
Boom, J., Hoijtink, H., & Kunnen, S. (2001). Rules in
the balance scale: Classes, strategies, or rules for
the balance scale task? Cognitive Development,
16, 717–735.
Bouwmeester, S., & Sijtsma, K. (2007). Latent class
modeling of phase transition in the development
of transitive reasoning. Multivariate Behavioral
Research, 42(3), 457-480.
Brainerd, C. J., & Hooper, F. H. (1975). A
methodological analysis of developmental
studies of identity conservation and equivalence
conservation. Psychological bulletin, 82(5), 725-
737.

References | 157
Brody, M., Bangert, A. & Dillon, J. (2008). Assessing
Learning in Informal Science Contexts. Paper
commissioned by the US National Research
Council for Science Learning in Informal
Environments Committee. Available at: http://
www7.nationalacademies.org/bose/Brody_
Commissioned_Paper.pdf.
Bronson, M. B. (1994). The usefulness of an
observational measure of young children’s
social and mastery behaviors in early childhood
classrooms. Early Childhood Research Quarterly,
9, 19-43.
Brown, C. (1995). Making the most of family visits:
Some observations of parents with children in a
museum science centre. Museum Management
and Curatorship, 14(1), 65-71.
Calin-Jageman, R. J., & Ratner, H. H. (2005). The
role of encoding in the self-explanation effect.
Cognition and Instruction, 23, 523–543.
Callanan, M., & Valle, A. (2008). Co-constructing
conceptual domains through family
conversations and activities. In B. Ross (Ed.), The
psychology of learning and motivation (Vol. 49,
pp. 147–165). New York: Elsevier.
Carey, S. (1985). Conceptual change in adulthood.
Boston, MA: MIT Press.
Carson, R. (1984). The sense of wonder. New York:
Harper and Row Publishers.
Chak, A. (2002). Understanding children’s curiosity
and exploration through the lenses of Lewin’s
Field Theory: On developing an appraisal
framework. Early Child Development and Care,
172(1), 77-87.
Chen, S. (2009). Shadows: Young Taiwanese children’s
views and understanding. International Journal
of Science Education, 31(1), 59-79.
Chen, Z., & Klahr, D. (1999). All other things being
equal: Acquisition and transfer of the Control
of Variables Strategy. Child Development, 70(5),
1098-1120.
Cheng, P. W. (1997). From covariation to causation: A
causal power theory. Psychological Review, 104,
367-405.
Clements, D. H., & Sarama, J. (2007). Effects of a
preschool mathematics curriculum: Summative
research on the Building Blocks project. Journal
for Research in Mathematics Education, 38, 136-
163.
Cohen, J. (1988). Statistical power analysis for the
behavioral sciences (2nd ed.). Hillsdale, NJ:
Lawrence Earlbaum Associates.
Cook, C., Goodman, N. D., & Schulz, L. E. (2011).
Where science starts: Spontaneous experiments
in preschoolers’ exploratory play. Cognition, 120,
341-349.
Critten, S., Pine, K., & Steffler, D. (2007). Spelling
development in young children, a case of
representational redescription? Journal of
Educational Psychology, 99(1), 207–220.
Crowley, K., Callanan, M. A., Jipson, J. L., Galco, J.,
Topping, K., & Shrager, J. (2001). Shared scientific
thinking in everyday parent-child interaction.
Science Education, 85(6), 712-732.
Crowley, K., Callanan, M. A., Tenenbaum, H. R., &
Allen, E. (2001). Parents explain more often
to boys than to girls during shared scientific
thinking. Psychological Science, 12(3), 258-261.
Davidson, D. (1996). The effects of decision
characteristics on children’s selective search of
predecisional information. Acta Psychologica,
92, 263-281.
De Houwer J., & Beckers, T. (2002). A review of recent
developments in research and theories on
human contingency learning. Quarterly Journal
of Experimental Psychology, 55B, 289-310.
158
De Kruif, R. E. L., Riksen-walraven, J. M. A., Gervers
Deynoot-Schaub, M. J. J. M., Helmerhorts, K. O.
W., Tavecchio, L. W. C., & Fukkink, R. G. (2009).
Pedagogische kwaliteit van de opvang voor
0-4-jarigen in Nederlandse kinderdagverblijven
[Pedagogical quality of Dutch daycare centers].
Amsterdam, The Netherlands: University of
Amsterdam.
Denton, K., & West, J. (2002). Children’s reading and
mathematics achievement in kindergarten and
first grade. Education Statistics Quarterly, 4(1),
19-26.
Dickinson, A. (2001). Causal learning: Association
versus computation. Current Directions in
Psychological Science, 10, 127-132.
Dierking, L. D., & Falk, J. H. (1994). Family behavior
and learning in informal science settings: A
review of the research. Science Education, 78(1),
57–72.
DiSessa, A. A. (1988). Knowledge in pieces. In G.
Forman, & P. B. Pufall (Eds.), Constructivism
in the computer age (pp. 49-70). Hillsdale, NJ:
Lawrence Erlbaum Associates.
DiSessa, A. A. (2008). A bird’s-eye view of the
‘‘pieces’’ vs. ‘‘coherence’’ controversy. In S.
Vosniadou (Ed.), International handbook of
research on conceptual change (pp. 35–60). New
York: Routledge.
DiSessa, A. A., Gillespie, N. M., & Esterly, J. B.
(2004). Coherence versus fragmentation in the
development of the concept of force. Cognitive
Science, 28, 843–900.
Dreef, T., & Eriksson, S. (2007). Onderzoekend spel bij
kleuters in science center NEMO [Preschoolers’
exploratory play in science center NEMO].
Unpublished master’s thesis, University of
Amsterdam, Amsterdam, The Netherlands.
Dunbar, K. & Klahr, D. (1989). Developmental
differences in scientific discovery processes.
In D. Klahr and K. Kotovsky (Eds.), Complex
Information Processing: The Impact of Herbert A.
Simon. Hillsdale, NJ: Lawrence Erlbaum.
Dunn, L., Kontos, S., & Potter, L. (1996). Mixed age
interactions in family child care. Early Education
and Development, 7(4), 349-366.
Duschl, R., Schweingruber, H., & Shouse, A., (Eds.),
(2007). Taking science to school: Learning and
teaching science in grades k-8. Washington, DC:
National Academies Press.
Ebersbach, M., & Resing, W. C. M. (2007). Shedding
new light on an old problem: The estimation of
shadow sizes in children and adults. Journal of
Experimental Child Psychology, 97, 265-285.
Eshach, H., & Fried, M. N. (2005). Should science be
taught in early childhood? Journal of Science
Education and Technology, 14(3), 315-336.
Feher, E., & Rice, K. (1988). Shadows and anti-images:
Children’s conceptions of light and vision. II.
Science Education, 72(5), 637–647.
Fender, J. G., & Crowley, K. (2007). How parent
explanation changes what children learn from
everyday scientific thinking. Journal of Applied
Developmental Psychology, 28, 189–210.
Field, A. (2005). Discovering statistics using SPSS for
Windows. London, UK: Sage Publications.
Flavell, J. H., Green, F. L., & Flavell, E. R. (1995).
Young children’s knowledge about thinking.
Monographs of the Society for Research in Child
Development, 60(1), Serial No. 243, 1–96.
Fleer, M. (1996). Early learning about light: Mapping
preschool children’s thinking about light before,
during and after involvement in a two week
teaching programme. International Journal of
Science Education, 18(7), 819–836.

References | 159
Flobbe, L., Verbrugge, R., Hendriks, P., & Krämer, I.
(2008). Children’s Application of Theory of Mind
in Reasoning and Language. Journal of Logic,
Language and Information, 17(4), 417-442.
Forman, G. E., & Kuschner, D. S. (2005). The child’s
construction of knowledge: Piaget for teaching
children. Amherst (MA), Perfomanetics Press.
Fortner-Wood, C.,& Henderson, B. B. (1997).
Individual differences in two-year-olds’ curiosity
in the assessment setting and in the grocery
store. The Journal of Genetic Psychology, 158(4),
495-497.
Franse, R. K., Van Schijndel, T. J. P., & Raijmakers, M.
E. J. (2010). Kleuters aan zet in science centers:
Een voorstudie voor science center NEMO [Young
explorers in NEMO: a prestudy for science center
NEMO]. Amsterdam, The Netherlands: science
center NEMO.
Frède, V., Nobes, G., Frappart, S., Panagiotaki, G.,
Troadec, B., & Martin, A. (2011). The acquisition
of scientific knowledge: the influence of methods
of questioning and analysis on the interpretation
of children’s conceptions of the Earth. Infant and
Child Development, 20(4), 432-448.
French, L. (2004). Science as the center of a coherent,
integrated early childhood curriculum. Early
Childhood Research Quarterly, 19(1), 150-158.
Gellert, E. (1962). Children’s conceptions of the
content and functions of the human body.
Genetic Psychology Monographs, 65, 293–405.
Gelman, R., & Brenneman, K. (2004). Science learning
pathways for young children. Early Childhood
Research Quarterly, 19, 138-149.
Gelman, R., Brenneman, K., Macdonald, G., & Roman,
M. (2010). Preschool Pathways to Science:
Facilitating scientific ways of thinking, talking,
doing, and understanding. Baltimore, MD: Paul
H. Brookes Publishing Co., Inc.
Gelman, S. A., & Hirschfeld, L. A. (1999). How
biological is essentialism? In D. Medin & S. Atran
(Eds.), Folkbiology (pp. 403–446). Cambridge,
MA: MIT Press.
Gelman, S. A. (2009). Learning from others: Children’s
construction of concepts. Annual Review of
Psychology, 60, 115–140.
Gelman, S. A., & Wellman, H. M. (1991). Insides
and essence: Early understandings of the non-
obvious. Cognition, 38, 213–244.
Gifford, S. (2004). A new mathematics pedagogy
for the early years: in search of principles for
practice. International Journal of Early Years
Education, 12(2), 99-115.
Ginsburg, H. P., & Golbeck, S. L. (2004). Thoughts on
the future of mathematics and science learning
and education. Early Childhood Research
Quarterly, 19, 190-200.
Glymour, C. (2001). The mind’s arrows: Bayes nets
and graphical causal models in psychology.
Cambridge, MA: MIT Press.
Göncü, A. (1993). Development of intersubjectivity in
the dyadic play of preschoolers. Early Childhood
Research Quarterly, 8, 99-116.
Gopnik, A., Glymour, C., Sobel, D. M., Schulz, L. E.,
Kushnir, T., & Danks, D. (2004). A theory of causal
learning in children: Causal maps and Bayes nets.
Psychological Review, 111(1), 3-32.
Gopnik, A., & Meltzoff, A. N. (1997). Words, thoughts,
and theories. Cambridge, Mass.: Bradford, MIT
Press.
Gopnik, A., & Sobel, D. M. (2000). Detecting blickets:
How young children use information about novel
causal powers in categorization and induction.
Child Development, 71(5), 1205-1222.
160
Gopnik, A., Sobel, D. M., Schulz, L. E., & Glymour,
C. (2001). Causal learning mechanisms in very
young children: Two-, three-, and four-year-olds
infer causal relations from patterns of variation
and covariation. Developmental Psychology,
37(5), 620-629.
Gottfried, G. M., & Gelman, S. A. (2005). Developing
domain-specific causal-explanatory frameworks:
The role of insides and immanence. Cognitive
Development, 205,137–158.
Grasman, R. P. P. P. (2005). Filmpjes scoren op de UvA
[computer software], from http://purl.oclc.org/
NET/rgrasman/jscript/filmpjes_scoren.zip.
Greenes, C., Ginsburg, H. P., & Balfanz, R. (2004). Big
math for little kids. Early Childhood Research
Quarterly, 19, 159-166.
Gweon, H. & Schulz, L.E. (2008) Stretching to
Learn: Ambiguous evidence and variability in
preschoolers’ exploratory play. Proceedings of
the 30th Annual Conference of the Cognitive
Science Society, 570-574.
Harris P. L., Koenig, M. A. (2006). Trust in testimony:
How children learn about science and religion.
Child Development ,77, 505–24.
Hatano, G., & Inagaki, K. (1994). Young children’s
naïve theory of biology. Cognition, 50, 171-188.
Hatano, G. & Inagaki, K. (1999). A developmental
perspective on informal biology. In D. L. Medin &
S. Atran. Folkbiology (pp. 321–354). Cambridge,
MA: MIT Press.
Havu-Nuutinen, S. (2005). Examining young children’s
conceptual change process in floating and
sinking from a social constructivist perspective.
International Journal of Science Education, 27(3),
259-279.
Henderson, B. B. (1984). Parents and exploration:
the effect of context on individual differences
in exploratory behavior. Child Development, 55,
1237-1245.
Henderson, B., & Moore, S. G. (1980). Children’s
responses to objects differing in novelty in
relation to level of curiosity and adult behavior.
Child Development, 51, 457-465.
Hollis, S. & Low, J. (2005). Karmiloff-Smith’s
RRM distinction between adjunctions and
redescriptions: It’s about time (and children’s
drawings). British Journal of Developmental
Psychology, 23, 623–644.
Howe, C., Tolmie, A., Duchak-Tanner, V., & Rattray,
C. (2000). Hypothesis testing in science: Group
consensus and the acquisition of conceptual and
procedural knowledge. Learning and Instruction,
10, 361-391.
Huizinga, M., Dolan, C. V., & Van der Molen, M. W.
(2006). Age-related change in executive function:
Developmental trends and a latent variable
analysis. Neuropsychologia, 44, 2017-2036.
Inagaki, K. (1997). The emergence of core domains
of thought: Children’s reasoning about physical,
psychological, and biological phenomena. In:
H. M. Wellman, & K. Inagaki, K. (Eds.), New
directions for child development (75, pp. 27-44).
San Francisco, CA:
Inagaki, K., & Hatano, G. (1993). Young Children’s
understanding of the mind-body distinction.
Child Development, 64(5), 1534-1549.
Inagaki, K., & Hatano, G. (1996). Young children’s
recognition of commonalities between animals
and plants. Child Development, 67, 2823–2840.
Inagaki, K., & Hatano, G. (2004). Vitalistic causality
in young children’s naive biology. Trends in
cognitive sciences, 8(8), 356-62.
Inhelder, B., & Piaget, J. (1958). The growth of logical
thinking from childhood to adolescence. New
York: Basic Books.
Inhelder, B., & Piaget, J. (1964). The early growth of
logic in the child: Classification and seriation.
London: Routledge & Kegan Paul.

References | 161
Jaakkola, R. O. (1997). The development of scientific
understanding: Children’s construction of
their first biological theory. Unpublished Ph.D.
thesis, Massachusetts Institute of Technology,
Cambridge, MA.
Jansen, B. R. J., & Van der Maas, H. L. J. (1997).
Statistical test of the rule assessment
methodology by latent class analysis.
Developmental Review, 17(3), 321-357.
Jansen, B. R. J., & Van der Maas, H. L. J. (2001).
Evidence for the phase transition from rule I to
rule II on the balance scale task. Developmental
Review, 21, 450–494.
Jansen, B. R. J., & Van der Maas, H. L. J. (2002).
The development of children’s rule use on the
balance scale task. Journal of Experimental Child
Psychology, 81(4), 383-416.
Jennings, K. D., Harmon, R. J. Morgan, G. A., Gaiter,
J. L., & Yarrow, L. J. (1979). Exploratory play as
an index of mastery motivation: Relationships
to persistence, cognitive functioning and
environmental measures. Developmental
Psychology, 15(4), 386-394.
Johnson-Laird, P. N. (1983). Mental models: Towards
a cognitive science of language, inference, and
consciousness. Cambridge, UK: Cambridge
University Press.
Kalish, C. (1996). Causes and Symptoms in
Preschoolers’ Conceptions of Illness. Child
Development, 67(4), 1647-1670.
Karmiloff-Smith, A. (1990). Constraints on
representational change: Evidence from
children’s drawing. Cognition, 34, 57-83.
Karmiloff-Smith, A. (1992). Beyond modularity: A
developmental perspective on cognitive science.
MIT Press.
Karmiloff-Smith, A., & Inhelder, B. (1975). If you want
to get ahead, get a theory. Cognition, 3, 195-212.
Keil, F.C. (1992). The origins of an autonomous
biology. In M. R. Gunnar & M. Maratsos
(Eds.), Modularity and constraints in language
and cognition: Minnesota symposia on child
psychology (Vol. XXV, pp. 103-138). Hillsdale, NJ:
Erlbaum.
Kelemen, D. (1999). The scope of teleological thinking
in preschool children. Cognition, 70, 241–272.
Kirkham, N. Z., Slemmer, J. A., & Johnson, S. P. (2002).
Visual statistical learning in infancy: evidence
for a domain general learning mechanism.
Cognition, 83(2), B35-B42.
Klahr, D. (2005). Early science instruction: Addressing
fundamental issues. Psychological Science,
16(11), 871-872.
Klahr, D., & Nigam, M. (2004). The equivalence of
learning paths in early science instruction: Effects
of direct instruction and discovery learning.
Psychological Science, 15(10), 661-667.
Klibanoff, R. S., Levine, S. C., Hedges, L. V., & Vasilyeva,
M. (2006). Developmental Psychology, 42, 59-69.
Kontos, S. (1999). Preschool teachers’ talk, roles, and
activity settings during free play. Early Childhood
Research Quarterly, 14, 363-382.
Kreitler, H., & Kreitler, S. (1966). Children’s concepts
of sexuality and birth. Child Development, 37(2),
363-378.
Kuhn, D., & Dean, D., Jr. ( 2005). Is developing
scientific thinking all about learning to control
variables? Psychological Science, 16(11), 866-
870.
Kuhn, D., Garcia-Mila, M., Zohar, A., & Andersen,
C. (1995). Strategies of knowledge acquisition.
Monographs of the Society for Research in Child
Development, 60(4), Serial No. 245, 1–128.
Lagnado, D., & Sloman, S. A. (2004). The advantage
of timely intervention. Journal of Experimental
Psychology: Learning, Memory and Cognition,
30, 856-876.

162
Lagnado, D., & Sloman, S. A. (2006). Time as a guide
to case. Journal of Experimental Psychology:
Learning, Memory and Cognition, 32(3), 451–
460
Langeheine, R., Pannekoek, J., & Van de Pol, F.
(1995). Bootstrapping goodness-of-fit measures
in categorical data analysis. CBS Statistics, The
Netherlands.
Legare, C. H., Gelman, S. A., & Wellman, H. M. (2010).
Inconsistency with prior knowledge triggers
children’s causal explanatory reasoning. Child
Development, 81(3), 929-944.
Legare, C. H. (2012). Exploring explanation: Explaining
inconsistent evidence informs exploratory,
hypothesis-testing behavior in young children.
Child Development, 83(1), 173-185.
Lindahl, M., & Pramling Samuelsson, I. (2002).
Imitation and variation: reflections on toddlers’
strategies for learning. Scandinavian Journal of
Educational Research, 46(1), 25-45.
Lisbon European Council (2000). Presidency
Conclusions. Retrieved January 17, 2012 from
http://www.europarl.europa.eu/summits/lis1_
en.htm#b
Mandler, J. M., & McDonough, L. (1993). Concept
formation in infancy. Cognitive Development, 8,
291-318.
Maynard, T., & Waters, J. (2007). Learning in the
outdoor environment: a missed opportunity?
Early Years, 27, 255-265.
McCutcheon, A. L. (1985). A latent class analysis of
tolerance for nonconformity in the American
public. The Public Opinion Quarterly, 49(4), 474-
488.
McCutcheon, A. L. (1987). Latent class analysis.
Newbury Park, CA: Sage Publications.
McManus, P. M. (1987). It’s the company you keep...
The social determination of Learning-related
behavior in a science museum. International
Journal of Museum Management and
Curatorship, 6, 263–270.
Meisner, R., Vom Lehn, D., Heath, C., Burch, A.,
Gammon, B., & Reisman, M. (2007). Exhibiting
performance: Co-participation in science centres
and museums. International Journal of Science
Education, 29(12), 1531-1555.
Miller, P. H., & Weiss, M. G. (1981). Children’s
attention allocation, understanding of attention,
and performance on the incidental learning task.
Child Development, 52, 1183-1190.
Morris, S. C., Taplin, J. E., & Gelman, S. A.
(2000). Vitalism in naive biological thinking.
Developmental Psychology, 36(5), 582-595.
Nagy, M. H. (1953). Children’s birth theories.
Pedagogical Seminary and Journal of Genetic
Psychology, 83, 217-226.
National Science Board (2009). National Science
Board STEM education recommendations for the
President-Elect Obama administration. Retrieved
January 10, 2012, from http://www.nsf.gov/nsb/
publications/2009/01_10_stem_rec_obama.pdf
Nazzi, T., & Gopnik, A. (2000). A shift in children’s use
of perceptual and causal clues to categorization.
Developmental Science, 3, 389-396.
Nazzi, T., & Gopnik, A. (2003). Sorting and acting with
objects in early childhood: an exploration of
the use of causal cues. Cognitive Development,
18(3), 299-317.
Neuman, D. (1971). Sciencing, an activity for young
children. Education, 91(4), 292-297.
Nobes, G., Martin, A. E., & Panagiotaki, G. (2005).
The development of scientific knowledge of
the earth. British Journal of Developmental
Psychology, 23, 47–64.

References | 163
Nobes, G., Moore, D. G., Martin, A. E., Clifford, B. R.,
Butterworth, G., Panagiotaki, G., & Siegal, M.
(2003). Children’s understanding of the earth
in a multicultural community. Developmental
Science, 6, 74–87.
Palmquist, S., & Cowley, K. (2007). From Teachers to
Testers: How Parents Talk to Novice and Expert
Children in a Natural History Museum. Science
Education, 91(5), 712-732.
Peterson, S. M., & French, L. (2008). Supporting
young children’s explanations through inquiry
science in preschool. Early Childhood Quarterly,
23, 395-408.
Picard, D., & Vinter, A. (2007). Relationships between
procedural rigidity and interrepresentational
change in children’s drawing behavior. Child
Development, 78(2), 522 – 541.
Pramling Samuelsson, I., & Pramling, N. (2009).
Children’s perspectives as ‘touch downs’ in
time: assessing and developing children’s
understanding simultaneously. Early Child
Development and Care, 179, 205-216.
R Development Core Team (2010/ 2011). R: A
Language and Environment for Statistical
Computing. R Foundation for Statistical
Computing, Vienna, Austria. ISBN 3-900051-07-
0, URL http: //www.R-project.org/.
Raijmakers, M. E. J., Jansen, B. R. J. & Van der Maas,
H. L. J. (2004). Rules and development in triad
classification task performance. Developmental
Review, 24(3), 289-321.
Ramey-Gassert, L., Walberg III, H. J., & Walberg, H.
J. (1994). Reexamining connections: Museums
as science learning environments. Science
Education, 78(4), 345–363.
Ramsey, J. L., & Fowler, M. L. (2004). ‘What do you
notice?’ Using posters containing questions
and general instructions to guide preschoolers’
science and mathematics learning. Early Child
Development and Care, 174(1), 31-45.
Reichenbach, H. (1956). The direction of time.
Berkeley, CA: University of California Press.
Rescorla, R. A., & Wagner, A. R. (1972). A theory
of Pavlovian conditioning: Variations in
the effectiveness of reinforcement and
nonreinforcement. In A. H. Black & W. F. Prokasy
(Eds.), Classical conditioning II: Current theory
and research (pp.64-99). New York: Appleton-
Century-Crofts.
Review, 7, 66–85.
Rindskopf, D. (1987). Using latent class analysis to
test developmental models. Developmental
Review, 7, 66–85
Rocard, M., Csermely, P., Jorde, D., Lenzen, D.,
Walberg-Henrikson, H., & Hemmo, V. (2007).
Science Education NOW: A renewed pedagogy
for the future of Europe. Retrieved January 10,
from http://ec.europa.eu/research/science-
society/document_library/pdf_06/report-
rocard-on-science-education_en.pdf
Rogoff, B. (1995). Observing sociocultural activity
on three planes: Participatory appropriation,
guided participation, and apprenticeship. In
J. V. Wertsch, P. Del Rio, & A. Alvarez (Eds.),
Sociocultural studies of mind (pp. 139–164).
Cambridge, England: Cambridge University
Press.
Rosengren, K. S., Gelman, S. A., Kalish, C. W., &
McCormick, M. (1991). As time goes by :
Children’s early understanding of growth in
animals. Child Development, 62(6), 1302-1320.
Rubenstein, J., & Howes, C. (1979). Caregiving
and infant behavior in day care and in homes.
Developmental Psychology, 15, 1-24.

164
Ruby, M., Kenner, C., Jessel, J., Gregory, E., & Arju, T.
(2007). Gardening with grandparents: an early
engagement with the science curriculum. Early
Years, 27, 131-144.
Rusher, A. S., Cross, D. R., & Ware, A. M. (1995). Infant
and toddler play: Assessment of exploratory
style and development level. Early Childhood
Research Quarterly, 10, 297-315.
Saffran, J. R., Aslin, R. N., & Newport, E. L. (1996).
Statistical learning by 8-month-old infants.
Science, 274(5294), 1926-1928.
Samarapungavan, A., & Wiers, R. W. (1997). Children’s
thoughts on the origin of species: A study of
explanatory coherence. Cognitive Science, 21,
147–177.
Samarapungavan, A., Vosniadou, S., & Brewer, W.
(1996). Mental models of the earth, sun, and
moon: Indian children’s cosmologies. Cognitive
Development, 11, 491–521.
Sandifer, C. (1997). Time-based behaviors at an
interactive science museum: Exploring the
differences between weekday/weekend and
family/ nonfamily visitors. Science Education, 81,
689-701.
Sandifer, C. (2003). Technological novelty and open-
endedness: Two characteristics of interactive
exhibits that contribute to the holding of visitor
attention in a science museum. Journal of
Research in Science Teaching, 40(2), 121-137.
Sattler, J. M. (2002). Assessment of behavior by
observational methods: Part 2. In J. M. Sattler
(Ed.), Assessment of children: Behavioral and
clinical applications (4th ed.). San Diego: Jerome
M. Sattler Publisher Inc.
Schauble, L. (1990). Belief revision in children:
The role of prior knowledge and strategies for
generating evidence. Journal of Experimental
Child Psychology, 49, 31-57.
Schauble, L. (1996). The development of scientific
reasoning in knowledge-rich contexts.
Developmental Psychology, 32, 102-119.
Schauble, L., Gleason, M., Lehrer, R., Bartlett, K.,
Petrosino, A., Allen, A., …Street, J. (2002).
Supporting science learning in museums. In
G. Leinhardt, K. Crowley, & K. Knutson (Eds.),
Learning conversations in museums (pp.
425–452). Mahwah, NJ: Lawrence Erlbaum
Associates.
Schmittmann, V. D., Van der Maas, H. L. J., &
Raijmakers, M. E. J., (in press). Distinct
discrimination learning strategies and their
relation with spatial memory and attentional
control in 4- to 14-year-olds. Journal of
Experimental Child Psychology.
Schulz, L. E., & Bonawitz, E. B. (2007). Serious fun:
Preschoolers engage in more exploratory play
when evidence is confounded. Developmental
Psychology, 43(4), 1045-1050.
Schulz, L. E., & Gopnik, A. (2004). Causal learning
across domains. Developmental Psychology,
40(2), 162-176.
Schulz, L. E., Bonawitz, E. B., & Griffiths, T. L. (2007).
Can being scared cause tummy aches? Naïve
theories, ambiguous evidence, and preschoolers‘
causal inferences. Developmental Psychology,
43(5), 1124-1139.
Schulz, L. E., Gopnik, A., & Glymour, C. (2007).
Preschool children learn about causal structure
from conditional interventions. Developmental
Science, 10(3), 322-332.
Schwartz, M. S. & Sadler, P. M. (2007). Empowerment
in Science Curriculum Development: A
microdevelopmental approach. International
Journal of Science Education, 29(8), 987-1017.
Schwarz, G. (1978). Estimating the dimension of a
model. The Annals of Statistics, 6(2), 461-464.

References | 165
Segal, G., & Cosgrove, M. (1993). ‘The sun is sleeping
now’: Early learning about light and shadows.
Research in Science Education, 23, 176–285.
Serrell, B. (1998). Paying attention: Visitors and
museum exhibitions. Washington, DC: American
Association of Museums.
Shanks, D. R., & Dickinson, A. (1987). Associative
accounts of causality judgement. In G. H. Bower
(Ed.), The psychology of learning and motivation:
Advances in research and theory (Vol. 21, pp.
229-261). San Diego, CA: Academic Press.
Siegal M. (1997). Knowing children: Experiments in
conversation and cognition (2nd ed.), Hove, UK:
Psychology Press.
Siegel, D., Esterly, J., Callanan, M. A., Wright, R., &
Navarro, R. (2007). Conversations about science
across contexts in Mexican-descent families.
International Journal of Science Education,
29(12), 1447-1466.
Siegel, L. S., McCabe, A. E., Brand, J., & Matthews, J.
(1978). Evidence for the understanding of class
inclusion in preschool children: Linguistic factors
and training effects. Child Development, 49(3),
688-693.
Siegler, R. S. (1976). Three aspects of cognitive
development. Cognitive Psychology, 8, 481–520.
Siegler, R. S. (1978). The origins of scientific reasoning.
In R. S. Siegler (Ed.), Children’s thinking: What
develops? Hillsdale, NJ: Erlbaum.
Siegler, R. S. (1981). Developmental sequences within
and between concepts. Monographs of the
Society for Research in Child Development, 46(2),
Serial No. 189, 1–74.
Siegler, R. S., & Chen, Z. (2008). Differentiation and
integration: guiding principles for analyzing
cognitive change. Developmental Science 11(4),
433–453.
Singer, E. (2002). The logic of young children’s
(nonverbal) behavior. European Early Childhood
Education Research Association Journal, 10, 55-
64.
Smilansky, S. (1968). The effects of sociodramatic
play on disadvantaged preschool children. New
York: Wiley.
Sobel, D. M., & Munro, S. E. (2009). Domain
generality and specificity in children’s causal
inference about ambiguous data. Developmental
Psychology, 45(2), 511-524.
Sobel, D. M., & Kirkham, N. Z. (2006). Blickets and
babies: The development of causal reasoning in
toddlers and infants. Developmental Psychology,
42(6), 1103-1115.
Sobel, D. M., Tenenbaum, J. B., & Gopnik, A. (2004).
Children’s causal inferences from indirect
evidence: Backwards blocking and Bayesian
reasoning in preschoolers. Cognitive Science,
28(3), 303-333.
Spensley, F., & Taylor, J. (1999). The development
of cognitive flexibility: Evidence from children’s
drawings. Human Development, 42, 300–324.
Springer, K. (1999). How a naïve theory of biology
is acquired. In M. Siegal & C. Peterson (Eds.),
Children’s understanding of biology and health
(pp. 45–70). Cambridge, UK: Cambridge
University Press.
Stevenson, A. (2010, June). Young children and
grown-ups discovering together: Exhibits and
workshops. Talk held at the Ecsite Annual
Conference, Dortmund, Germany.
Steyvers, M., Tenenbaum, J. B., Wagenmakers, E.-
J., & Blum, B. (2003). Inferring causal networks
from observations and interventions. Cognitive
Science, 27, 453-489.

166
Straatemeier, M., Van der Maas, H. L. J., & Jansen, B.
R. J. (2008). Children’s knowledge of the earth:
A new methodological and statistical approach.
Journal of Experimental Child Psychology, 100,
276–296.
Sutton-Smith, B. (1975). The useless Made useful:
Play as variability training. The School Review,
83(2), 197-214.
Sylva, K., Taggart, B., Siraj-Blatchford, I., Totsika,
V., Ereky-Stevens, K., Gilden, R. et al. (2007).
Curricular quality and day-to-day learning
activities in pre-school. International Journal of
Early Years Education, 15(1), 49-65.
Szechter, L. E., & Carey, E. J. (2009). Gravitating
toward science: Parent–child interactions
at a gravitational-wave observatory. Science
Education, 93(5), 846-858.
Tenenbaum, J. B., & Griffiths, T. L. (2003). Theory-
based causal inference. In S. Becker, S. Thrun
& K. Obermayer (Eds.), Advances in Neural
Information Processing Systems, 15 (pp. 35–42).
Cambridge, MA: MIT Press.
Tiemersma, J., & Van den Berg Van Saparoea, B. M.
(2007). Onderzoekend gedrag van kinderen
stimuleren met een uitdagende buitenruimte
[Stimulating children’s exploratory behavior with
a challenging outside play area]. Unpublished
master’s thesis, University of Amsterdam,
Amsterdam, The Netherlands.
Tu, T. (2006). Preschool science environment: what is
available in a preschool classroom? Early Years,
33, 245-251.
Tuckey, C. (1992). Children’s informal learning at an
interactive science centre. International Journal
of Science Education, 14(3), 273-278.
Tunnicliffe, S. D. (2000). Conversations of family
and primary school groups at robotic dinosaur
exhibits in a museum: What do they talk about?
International Journal of Science Education, 22(7),
739 – 754.
Van Beek, L. (2008). De invloed van coaching op
het onderzoekend spel van kleuters in science
center NEMO [The influence of coaching on
preschoolers’ exploratory play in science center
NEMO]. Unpublished master’s thesis, University
of Amsterdam, Amsterdam.
Van de Pol, F., Langeheine, R., & De Jong, W. (1996).
PANMARK 3: Panel analysis using Markov chains
- A latent class analysis program [user manual].
Voorburg, The Netherlands.
Van der Maas, H. L. J., & Straatemeier, M. (2008).
How to detect cognitive strategies: Commentary
on ‘‘Differentiation and Integration: Guiding
principles for analyzing cognitive change.”
Developmental Science, 11, 449-453
Van Eerde, D., Peltenburg, M., Van den Boer, C.,
& Nelissen, J. (2009). Jong geleerd, oud(er)
gedaan: Eindrapportage onderzoeksproject
SamenRekenen onderzocht. Utrecht, The
Netherlands: Freudenthal Institute for Science
and Mathematics Education.
Van Egeren, L. A., Watson, M. A., & Morris, B. J.
(2007, march). Head Start on Science: the impact
of an early childhood science curriculum. Poster
session presented at the Society for Research on
Child Development biennial meeting, Boston,
MA.

References | 167
Van Es, S. E., Van Schijndel, T. J. P., Franse, R.
K., & Raijmakers, M. E. J. (2009). Children’s
thoughts on unborn babies, Representational
redescription in preconceptions of children
on fetal development. In N. A. Taatgen & H.
van Rijn (Eds.), Proceedings of the 31st Annual
Conference of the Cognitive Science Society (pp.
112-117). Austin, TX: Cognitive Science Society.
Van Schijndel, T. J. P., Franse, R. K., & Raijmakers,
M. E. J. (2010). The exploratory behavior scale:
assessing young visitors hands-on behavior in
science museums. Science Education, 94(5), 794-
809.
Van Schijndel, T. J. P., Singer, E., & Raijmakers,
M. E. J. (2007). De Exploratief Spel Schaal
[The Exploratory Play Scale] (Tech. Rep.).
The Netherlands, University of Amsterdam,
Department of Developmental Psychology.
Van Schijndel, T. J. P., Singer, E., Van der Maas, H.
L. J., & Raijmakers, M. E. J. (2010). A sciencing
programme and young childrenʼs exploratory
play in the sandpit. European Journal of
Developmental Psychology, 7(5), 603-617.
Van Schijndel, T. J. P., Visser, I., Van Bers, B. M. C. W.,
& Raijmakers, M. E. J. (2012). Young children
perform better experiments after observing
evidence conflicting with their prior knowledge.
Manuscript in revision.
Veen, A., Roeleveld, J., & Leseman, P. P. M. (2000).
Evaluatie van Kaleidoscoop en Piramide
[Evaluation of kaleidoscoop and Piramide].
Amsterdam: SCO Kohnstamm Instituut.
Visser, I. (2011). Seven things to remember about
hidden Markov models: A tutorial on Markovian
models for time series. Journal of Mathematical
Psychology, 55, 403–415.
Visser, I., & Speekenbrink, M. (2010). depmixS4: An
R-package for hidden Markov models. Journal of
Statistical Software, 36(7), 1-21.
Vosniadou, S., & Brewer, W. F. (1992). Mental models
of the earth: A study of conceptual change in
childhood. Cognitive Psychology, 24, 535–585.
Vosniadou, S., Skopeliti, I., & Ikospentaki, K. (2004).
Modes of knowing and ways of reasoning in
elementary astronomy. Cognitive Development,
19, 203-222.
Vygotsky, L. S. (1978). Mind in society: The
development of higher psychological processes.
Cambridge, MA: Harvard University Press.
Wasserman, S. (1988). Play-debrief-replay: An
instructional model for science. Childhood
Education, 2, 232-234.
Weisler, A., & Mc Call, R. B. (1976). Exploration
and play: Résumé and redirection. American
Psychologist, 31, 492-508.
Wellman, H. (1990). The child’s theory of mind.
Cambridge, MA: MIT Press.
Wellman, H. M., & Gelman, S. A. (1992). Cognitive
development: Foundational theories of core
domains. Annual Review of Psychology, 43, 337-
375.
Wellman, H. M., Gelman, S. A. (1998). Knowledge
acquisition in foundational domains. In W.
Damon (Ed.), Handbook of child psychology:
Cognition, perception, and language (vol 2, pp.
523-573). Hoboken, NJ: John Wiley & Sons.
Welsh, M. C., Pennington, B. F., & Groisser, D. B. (1991).
A normative-developmental study of executive
function: A window on prefrontal function in
children. Developmental Neuropsychology, 7,
131-149.
Zimmerman, H. T., Reeve, S. and Bell, P. (2009).
Family sense-making practices in science center
conversations. Science Education, 94(3), 478-
505.
Zoldosova, K., & Prokop, P. (2007). Primary pupils’
preconceptions about child fetal development.
Eurasia Journal of Mathematics, Science &
Technology Education, 3(3), 239-246.


Samenvatting (Summary in Dutch)
170
het leren vAn wetensChAP en teChnologie door jonge kinderen & tAlentenkrAChtWetenschap en technologie zijn geschikte onderwerpen voor peuters en kleuters. De onderwerpen sluiten aan bij de motivatie van jonge kinderen om de wereld om hen heen te onderzoeken. Tijdens hun spel zijn kinderen uit zichzelf bezig met wetenschappelijke en technologische principes. Zij stuiteren bijvoorbeeld een bal en merken dat deze anders stuitert op het gras dan op de tegels. Zij observeren dat hun schaduw verandert als zij bewegen en merken op dat bladeren verschillende vormen hebben en in de loop van het jaar van kleur veranderen. Naast dat kinderen geïnteresseerd zijn in wetenschap en technologie, bezitten zij ook al voldoende capaciteiten om over deze onderwerpen te leren. Zij hebben kennis op verschillende gebieden, zoals de biologie en natuurkunde. Peuters kunnen bijvoorbeeld al onderscheid maken tussen levende en niet levende objecten en kleuters begrijpen dat dieren van dezelfde categorie dezelfde inwendige lichaamsdelen hebben. Naast kennis, bezitten jonge kinderen ook vaardigheden die hen in staat stellen om te leren van hun observaties. Peuters zijn bijvoorbeeld al in staat relatief complexe causale afleidingen te maken.
Dit proefschrift omvat studies over het leren van wetenschap en technologie door jonge kinderen. De studies zijn uitgevoerd in het kader van TalentenKracht (www.talentenkracht.nl): een programma van het Platform Bèta Techniek dat is gericht op onderzoek naar de kennis en vaardigheden van jonge kinderen op het gebied van wetenschap en technologie. Tevens heeft het programma ten doel om het wetenschaps- en technologieonderwijs voor jonge kinderen te optimaliseren. Daarmee slaat het programma een brug tussen wetenschap en praktijk. Het onderzoek in dit proefschrift is uitgevoerd bij de UvA onderzoeksgroep van TalentenKracht. De onderzoeksgroep is gesitueerd bij de Programmagroep Ontwikkelingspsychologie en wordt geleid door Prof. Dr. Maartje Raijmakers. In lijn met de doelstellingen van het programma zijn in het kader van dit proefschrift drie typen onderzoeksgerelateerde activiteiten uitgevoerd: studies in gecontroleerde situaties, studies in natuurlijke situaties, en de toepassing van de onderzoeksresultaten in het veld van wetenschaps- en technologieonderwijs. Studies in gecontroleerde situaties maakten het mogelijk specifieke aspecten van het wetenschaps- en technologie leren van jonge kinderen tot in detail te onderzoeken. Studies in natuurlijke situaties maakten het mogelijk de effecten van interventies op het leren van jonge kinderen in de praktijk te onderzoeken. Voor de derde activiteit, het toepassen van de onderzoeksopbrengsten in de praktijk, is de UvA onderzoeksgroep een langdurige samenwerking aangegaan met science center NEMO. In de volgende paragrafen zullen eerst de wetenschappelijke studies aan bod komen, waarna kort aandacht wordt besteed aan de samenwerking met NEMO en de producten voor de science center praktijk die deze samenwerking heeft opgeleverd.
Samenvatting (Summary in Dutch) | 171
het onderzoekend sPel vAn jonge kinderenHet primaire onderwerp van studie in dit proefschrift is het onderzoekend spel van jonge kinderen. Onderzoekend spel staat centraal in het wetenschaps- en technologieonderwijs aan jonge kinderen: programma’s voor kinderdagverblijven en kleuterscholen benadrukken het belang van het leren van onderzoeksvaardigheden en science centers beschouwen onderzoekend, interactief gedrag als onmisbaar tijdens tentoonstellingsbezoek (e.g. Allen, 2002, 2004; French, 2004; Gelman & Brenneman, 2004). Begeleiding door volwassenen wordt gezien als een belangrijke factor in het structureren van het spel van kinderen. Een eerste serie studies in dit proefschrift heeft betrekking op de effecten van deze begeleiding op het spel van kinderen in natuurlijke situaties. Een studie in een kinderdagverblijf setting liet zien dat een wetenschapsprogramma het zandbakspel van peuters op een positieve manier kan beïnvloeden (Hoofdstuk 2). Het wetenschapsprogramma omvatte een wijde range van gedrag van volwassenen, in vervolgstudies hebben wij daarom de effecten van meer specifieke aspecten van gedrag van volwassenen op het spel van kinderen onderzocht. Een studie in een science center setting liet zien dat de optimale coachingsstijl voor het stimuleren van onderzoekend spel van kleuters verschilt per exhibit (Hoofdstuk 3). Een tweede experiment wees uit dat het informeren van ouders over een efficiënte manier van coachen een positief effect heeft op het onderzoekend spel van kleuters bij exhibits. In een laatste studie in een science center setting hebben we de samenhang tussen verschillende typen ouderuitleg en het onderzoekend spel van kleuters onderzocht (Hoofdstuk 7). We vonden dat de kinderen van ouders die meer onderdelen en effecten van exhibits beschrijven op een hoger niveau spelen dan kinderen van ouders die dit gedrag minder vertonen.
Om het onderzoekend spel van kinderen in natuurlijke situaties te meten hebben wij de Exploratory Behavior Scale (EBS) ontwikkeld (Hoofdstuk 2, 3, en 7). Ten opzichte van bestaande maten voor onderzoekend spel (e.g. Boisvert & Slez, 1994, 1995; Crowley, Callanan, Jipson et al., 2001) biedt deze schaal een mooie balans tussen specificiteit en toepasbaarheid: de EBS geeft informatie over de kwantiteit én kwaliteit van spel, en is toepasbaar in verschillende situaties, zoals kinderdagverblijven en science centers.
de nAïeve theorieën vAn jonge kinderenHet onderzoekend spel van kinderen wordt beïnvloed door de domeinspecifieke kennis die zij hebben (e.g. Bonawitz, Van Schijndel, Friel & Schulz, 2012; Legare, 2012). Een tweede serie studies in dit proefschrift betreft daarom de kennisontwikkeling van kinderen in verschillende domeinen in de biologie en natuurkunde. In Hoofdstuk 4 brachten wij de naïeve theorieën over prenatale ontwikkeling van kinderen in de basisschoolleeftijd in kaart. In Hoofdstukken 6 en 7 brachten wij de naïeve theorieën van kleuters over schaduwgrootte in kaart. Deze studies onderscheiden zich van bestaand werk door een focus op individuele verschillen (Siegler, 1981). Dit houdt in dat we kwalitatief verschillende theorieën hebben

172
onderscheiden en deze vervolgens aan leeftijd hebben gerelateerd. Deze benadering levert een meer gedetailleerde beschrijving op van kennisontwikkeling dan het middelen over leeftijdsgroepen. Het gebruik van een latente variabelen techniek maakte het mogelijk om theorieën te detecteren die niet van te voren waren gedefinieerd (e.g. McCutcheon, 1987; Rindskopf, 1987). Dit bleek waardevol in de studies over schaduwgrootte: we vonden een groep kleuters die een theorie heeft die kwalitatief verschillend is van de in de bestaande literatuur beschreven theorieën (e.g. Chen 2009; Ebersbach & Resing, 2007; Siegler, 1981). Deze groep begrijpt de relatie tussen objectgrootte en schaduwgrootte, maar heeft een omgekeerd idee over relatie tussen de afstand van een object tot de lichtbron en schaduwgrootte (“Omgekeerde Regel 2”).
Een volgende studie ging dieper in op de vraag hoe domeinspecifieke kennis het onderzoekend spel van kinderen beïnvloedt (Hoofdstuk 6). In een eerdere studie was een effect van conflicterend bewijs op de duur van het onderzoekend spel van kleuters aangetoond (Bonawitz et al., 2012). Conflicterend bewijs is bewijs dat ingaat tegen de (naïeve) theorie van een kind. Wij onderzochten het effect van dit type bewijs op de kwaliteit van het onderzoekend spel van kleuters in een gecontroleerde situatie. We vonden dat kinderen die conflicterend bewijs te zien krijgen meer informatieve experimenten uitvoeren tijdens het vrije spel dan kinderen die niet-conflicterend bewijs te zien krijgen. Deze bevinding laat zien dat het spel van jonge kinderen geleid wordt door de domeinspecifieke kennis die zij hebben: het zien van één voorbeeld dat ingaat tegen de theorie van kinderen heeft effect op de kwaliteit van spel.
het CAUsAAl leren vAn jonge kinderenNaast dat het onderzoekend spel van jonge kinderen beïnvloed wordt door domeinspecifieke kennis, levert het ook kennis op (e.g. Gweon & Schulz, 2008; Schulz, Gopnik & Glymour, 2007). Een laatste serie studies in dit proefschrift betreft dit proces. In Hoofdstuk 5 onderzochten wij een voorwaarde voor het leren van onderzoekend spel: de vaardigheid voor het maken van causale afleidingen. Deze studie was de eerste in deze lijn van onderzoek (e.g. Gopnik, 2004) waarin een individuele verschillen benadering werd toegepast. Wij namen een serie opgaven af bij peuters en kleuters en onderscheidden verschillende typen causale afleidingen. Deze typen afleidingen werden vervolgens gerelateerd aan leeftijd. Mogelijke interpretaties voor de gevonden groepen zijn te vinden in de verschillende in de literatuur voorgestelde mechanismen voor het maken van causale afleidingen (e.g. Sobel et al., 2004). Er is echter meer onderzoek nodig om hier definitieve conclusies over te kunnen trekken.
Ten slotte hebben we het causale leren van kleuters over schaduwgrootte onderzocht. In een gecontroleerde situatie onderzochten we hoe het leren van kinderen verband houdt met hun voorkennis en onderzoekend spel (hoofdstuk 6). We vonden een specifieke relatie tussen voorkennis en leren: kinderen die een bepaalde theorie hebben (“Omgekeerde Regel
Samenvatting (Summary in Dutch) | 173
2”, zie boven) laten over tijd grotere toe- en afnamen van kennis zien dan kinderen met andere theorieën. Deze groep is mogelijk gevoeliger voor bewijs dat hen getoond wordt of bewijs dat zij genereren tijdens hun spel dan andere groepen. Ook vonden we een relatie tussen onderzoekend spel en leren: kinderen die meer experimenten uitvoeren waarin zij alleen de afstand van een object tot de lichtbron variëren, leren meer over deze causale relatie dan kinderen die minder experimenten van dit type uitvoeren. In een science center setting konden we deze relatie tussen onderzoekend spel en leren niet repliceren (Hoofdstuk 7). Noch vonden we in deze studie een verband tussen het leren van kinderen en de uitleg van ouders. Wel vonden we een effect van het zien van een theatervoorstelling als onderdeel van het bezoek aan de tentoonstelling. Kinderen die de voorstelling zien hebben een grotere kans om te leren dan kinderen die de voorstelling niet zien.
het toePAssen vAn de onderzoeksresUltAten in de PrAktijk: sAMenwerking UvA & neMoSinds het begin van TalentenKracht werkt de UvA onderzoeksgroep samen met het Science Learning Center van science center NEMO. De samenwerking heet: Kleuters aan zet in NEMO (http://www.e-nemo.nl/kleutersaanzet). Voor NEMO levert de samenwerking kennis op over de cognitieve en sociaal-emotionele ontwikkeling van kinderen. Voor de UvA levert de samenwerking de mogelijkheid op om het leren van kinderen over wetenschap en technologie in een natuurlijke situatie te bestuderen. Naast wetenschappelijke studies in de science center setting, heeft de samenwerking ook producten voor het veld van wetenschaps- en technologieonderwijs opgeleverd. Er zijn workshops ontwikkeld voor leerkrachten en er is advies gegeven aan science center professionals in binnen- en buitenland. Daarnaast is een gids geschreven met aanbevelingen voor het realiseren van wetenschap- en technologieactiviteiten voor jonge kinderen (Franse, Van Schijndel & Raijmakers, 2010). Op basis van de gids is vervolgens de Kleuters aan zet tentoonstelling in NEMO ontwikkeld: de eerste tentoonstelling die NEMO speciaal heeft ontwikkeld voor kleuters en hun ouders. De tentoonstelling was gedurende twee jaar tijdens weekenden en vakanties te bezoeken in NEMO. Kijkend naar de meerwaarde van de samenwerking voor beide partners en de producten die de samenwerking heeft opgeleverd, kan de aanpak van het onderzoek (studies in gecontroleerde situaties, studies in natuurlijke situaties en het toepassen van de onderzoeksopbrengsten in de praktijk) als waardevol worden gezien.


Dankwoord (Acknowledgements)

176
Het tot stand komen van dit proefschrift was niet mogelijk geweest zonder de hulp van een heleboel mensen. Ik wil de volgende mensen graag bedanken:
Promotor en co-promotor. Maartje, veel dank voor je betrokkenheid, toewijding en vertrouwen. Ik waardeer het ontzettend dat je me mogelijkheden hebt geboden om me verder te ontwikkelen op onderzoeksgebied en me daarbij de vrijheid hebt gegeven mijn eigen interesses te volgen. Han, de ministage die ik bij je heb gelopen aan het begin van mijn tweede studiejaar en de daarop volgende student-assistentschappen hebben in belangrijke mate bijgedragen aan mijn enthousiasme voor onderzoek. Ik heb de gesprekken die we hebben gevoerd in de loop der jaren en je advies bij voor mij belangrijke beslissingen zeer gewaardeerd.
De leden van de promotiecommissie. Ik wil jullie graag bedanken voor de tijd die jullie hebben gestoken in het lezen van het proefschrift en jullie bijdrage aan de verdediging. Laura, thanks for the time you put into reading my thesis. Elly, bedankt voor het samenwerken aan de zandbak studie, ik heb veel geleerd van je expertise op het gebied van onderzoek in kindercentra.
Kamergenoten aan de UvA. Anna en Bianca, van begin tot eind, jullie waren onmisbaar! Anna, ik zal je witte broodjes met hagelslag, roze koeken, verjaardagsslingers en ballonnen, ringtone van de dag en YouTube-liedjes missen als je naar Leiden gaat. Bianca, ik heb veel gehad aan onze gesprekken over onderzoek, maar ook aan onze gesprekken over... tja, waar niet over? Ik hoop dat we nog lang collega’s en vriendinnen blijven. Diamantbeurskamergenoten Anika en Maaike, het is niet voor niets dat collega’s onze kamer de gezelligste van de zesde noemen...
Collega’s aan de UvA. CODE-P collega’s, ik wil jullie graag bedanken voor de interessante en inspirerende praatjes en discussies. Ingmar, dank voor je R en Depmix hulp. Brenda, dank voor de verhelderende gesprekken. Hilde en Wouter, dank voor het statistische advies. Dorothy, thanks for your helpful comments on drafts of my papers. OP-aio’s (Anna, Anika, Bianca, Bregtje, Denise, Dilene, Helga, Irene, Janna, Maaike, Marijke, Melle, Tim, Thomas, Wouter en anderen) dank voor het verrassingsfeestje bij mijn vertrek naar Boston en alle gezellige borrels, etentjes en feestjes. Dilene, dank voor de prettige samenwerking als zelfbenoemde AC-directie. Ellen, dank voor je hulp bij allerlei te regelen zaken. Maurits, dank voor het pleiten voor de zichtbaarheid van cognitieve ontwikkeling als belangrijk onderzoeksonderwerp binnen de afdeling. OP-collega’s, dank voor een fijne werkomgeving en, niet onbelangrijk, de vele potjes tafeltennis. Raoul, dank voor je hulp bij het gebruik van het programma “Filmpjes scoren op de UvA”. Nico, René en Coos, dank voor de onmisbare audiovisuele en technische ondersteuning.
NEMO collega’s. Een deel van het werk in het proefschrift is uitgevoerd in samenwerking met het Science Learning Center van science center NEMO. Managers van het Science Learning Center, Leo, Amito en Marjolein, bedankt voor de prettige samenwerking. Directie

Dankwoord (Acknowledgements) | 177
van NEMO, Michiel, Rob en Jan Willem, veel dank voor de steun die jullie hebben verleend aan de samenwerking. Diana, Hendrike, Teun, Ramses en publieksbegeleiders, ik heb met veel plezier met jullie samengewerkt aan de Kleuters aan zet tentoonstelling. Ecsite-bezoekers, dank voor de leuke tijden in Boedapest, Milaan, Dortmund en Warschau. En last but not least, Rooske, een betere NEMO-collega had ik me niet kunnen wensen! Ik bewonder je expertise en manier van werken en heb veel van je geleerd. Na jaren onofficieel collega’s te zijn geweest zijn we nu officieel collega’s. Ik kijk uit naar onze toekomstige samenwerking aan de UvA.
TalentenKracht collega’s. Het werk in dit proefschrift is uitgevoerd in het kader van het TalentenKracht programma. Jan en Anneleen, bedankt voor de tijd en energie die jullie in het programma hebben gestoken. TalentenKracht collega’s, dank voor de interessante uitwisselingen van ideeën.
Early Childhood Cognition Lab colleagues. During my PhD I worked in Laura Schulz´s Early Childhood Cognition Lab at MIT for a couple of months. Laura, thank you for welcoming me in your lab, I had a wonderful and inspiring time. I learned a lot from your expertise in translating research questions into elegant research designs. Paul, thanks for being my office mate, I’m taking good care of the guinea pigs. Hyo, Melissa, Danny and Elise, thanks for your help in starting up my studies.
Deelnemers aan het onderzoek & studenten en student-assistenten. Zonder de hulp van kinderen en hun ouders was dit werk onmogelijk geweest. Ik wil ook de kinderdagverblijven en scholen die hun medewerking aan het onderzoek hebben verleend bedanken. Studenten en studentassistenten, bedankt voor jullie enthousiasme, goede suggesties en het vele werk dat jullie hebben verzet.
Vrienden en vriendinnen. Vriendinnen die ook in het onderzoek zitten, in het bijzonder Christien, Noortje, Miranda en Esther, ik heb veel gehad aan onze gesprekken over de pieken en dalen in het promotieproces. Vrienden en vriendinnen die niet in het onderzoek zitten, in het bijzonder Emmy, Annelies, Guido, Mascha en Joukje, de relativerende gesprekken met jullie waren onmisbaar. Ik heb veel energie gehaald uit alle leuke activiteiten en vakanties die we samen hebben ondernomen. Guido, ik heb ontzettende zin in 27 april met jou als paranimf!
Familie. Marius, bedankt voor je steun en advies. Rieks, bedankt voor het luisteren, het begrip en het vertrouwen. De smsjes tijdens de laatste loodjes hebben zeker geholpen! Wil, bedankt voor je betrokkenheid, ik vond het fijn dat ik welkom was om bij jullie te komen schrijven. Michiel en Jette, de gezellige momenten in de Jordaan maakten dat ik de volgende dag weer fris, en soms wat minder fris, aan het werk ging. Michiel, ik vind het bijzonder dat je paranimf wil zijn en 27 april naast me staat.
Tessa van Schijndel, Maart 2012


Tessa J. P. van Schijndel
Graag nodig ik u uit voor het bijwonen van de openbare
verdediging van mijn proefschrift
A developmentAl psycholoGy perspective
on preschool science leArninG:children’s explorAtory plAy,
nAïve theories, And cAusAl leArninG
de verdediging vindt plaats op vrijdag 27 april 2012
om 12:00 uur in de Agnietenkapel van de universiteit van Amsterdam
oudezijds voorburgwal 231
Na afloop bent u van harte welkom op de receptie in het Compagniecafé
Kloveniersburgwal 50
tessa van schijndel [email protected]
paranimfen:
Guido smeets [email protected]
michiel van schijndel [email protected]
A developmental psychology perspective on preschool science learning: Children’s exploratory play, naïve theories, and causal learning
tessA J. p. vAn schiJndel
A developmentAl psycholoGy perspective on preschool science leArninG:
children’s explorAtory plAy,nAïve theories, And cAusAl leArninG
uitnodiGinG