vakils - pg.com · pdf fileindia, us, china, philippines and singapore. mr. karthik natarajan...
TRANSCRIPT

vaki
ls

CONTENTS
Chairman’s Letter ..................................................... 3
Managing Director’s Letter....................................... 4-5
Report of the Directors ............................................. 6-39
Management Discussion & Analysis ....................... 40-42
Corporate Governance ........................................... 43-55
Auditors’ Report ........................................................ 56-61
Balance Sheet ......................................................... 62
Statement of Profit & Loss ......................................... 63
Cash Flow Statement ............................................... 64-65
Statement of Changes in Equity .............................. 66
Notes forming part of the Financial Statements ..... 67-114
Ten Year Financial Highlights ................................... 115

1Annual Report 2016-2017
Company Overview
Board’s Report
Management Discussion and Analysis
Corporate Governance
Financial Statements
Corporate InformationBoard of Directors & Key Managerial Personnel
Mr. Rajendra A. Shah ChairmanMr. Al Rajwani Managing DirectorMr. Bansidhar S. Mehta DirectorMr. Anil Kumar Gupta DirectorMr. Pramod Agarwal DirectorMr. Karthik Natarajan DirectorMs. Sonali Dhawan DirectorMr. Shailyamanyu Singh Rathore DirectorMr. Prashant Bhatnagar Chief Financial OfficerMr. Ishan Sonthalia Company Secretary
Registered Office:
Procter & Gamble Hygiene and Health Care Limited(CIN: L24239MH1964PLC012971)
P&G Plaza, Cardinal Gracias Road, Chakala, Andheri (East), Mumbai – 400 099Tel. No.: (022) 2826 6000 (Extn: 7468 / 7283)Email Id: [email protected]
Registrar & Share Transfer Agents:
Link Intime India Private LimitedC-101, 247 Park, L.B.S. Marg, Vikhroli (West), Mumbai – 400 083 Tel. No.: (022) 4918 6270 Fax: (022) 4918 6060 e-mail: [email protected]
Auditors:Statutory Auditor:Deloitte Haskins & Sells LLPChartered Accountants
Cost Auditor:
Ashwin Solanki & AssociatesCost Accountants
Secretarial Auditor:
Dholakia & Associates LLPCompany Secretaries
Listed on Stock Exchanges:
National Stock Exchange of India LimitedBSE Limited

2 Procter & Gamble Hygiene and Health Care Limited
Mr. Rajwani received his degree in Chemical Engineering from the University of Calgary (Canada) in 1981. He has more than 35 years’ experience working for Procter & Gamble in a variety of leadership roles across Product Supply, Marketing and General Management positions in the US, Canada, China, Korea and Arabian Peninsula.
Mr. Al RajwaniManaging Director
Mr. Shah is a leading solicitor and a senior partner of Crawford Bayley & Co., a firm of solicitors and advocates. He specializes in broad spectrum of corporate laws. He is a Director on the Boards of several prominent companies in India.
Mr. R. A. ShahChairman
Mr. Natarajan is a Chartered Accountant and has completed his Bachelor of Commerce from RA Podar College, Mumbai. Mr. Natarajan has been with P&G for over 16 years and is currently the Director, Finance & Accounting, India, Middle East & Africa. He has, over his experience at P&G, worked across multiple locations including India, US, China, Philippines and Singapore.
Mr. Karthik NatarajanDirector
Mr. Rathore graduated in Law from Maharishi Dayanand University, Rohtak, and completed his Masters of Law from Bond University, Australia. He is a fellow member of the Center for American and International Law, Texas. Mr. Rathore has been associated with Procter & Gamble for last nine years and has held various positions in legal department in Singapore and India.
Mr. Shailyamanyu Singh RathoreDirector
Ms. Dhawan is a graduate from Lady Shriram College, with a B.Com. (Hons.) in Business Studies. She completed her MBA in marketing from the Indian Institute of Management, Ahmedabad. She has been awarded as ‘Marketer of the Year FMCG’ by IAA awards in 2014 and has been rated as Number 7 in the IMPACT 50 most influential women in Marketing and Advertising for last two years.
Ms. Sonali DhawanDirector
Mr. Agarwal is an MBA from Indian Institute of Management, Ahmedabad. After over 28 years of experience with P&G, he retired in 2016. He has worked in seven geographies – India, Thailand, Japan, Philippines, USA, Singapore and Switzerland. Mr. Agarwal has led several major changes which have had a lasting impact on the business and organization.
Mr. Pramod AgarwalDirector
Mr. Gupta is an engineer from IIT New Delhi. He also holds a PG Diploma in Industrial Management from Jamnalal Bajaj Institute of Management Studies, Mumbai. He has a vast experience of over 40 years in India and abroad in the field of Manufacturing, Projects and Supply Chain Management.
Mr. A. K. GuptaDirector
Mr. Mehta is a graduate in commerce and a Fellow Member of The Institute of Chartered Accountants of India. He is a Chartered Accountant in practice dealing with taxation, accountancy and valuation of mergers and acquisitions. He is a Director on the Boards of several prominent companies in India.
Mr. B. S. MehtaDirector
2
3Annual Report 2016-2017
Company Overview
Board’s Report
Management Discussion and Analysis
Corporate Governance
Financial Statements
Dear Shareholders,
It gives me great pleasure to share with you the overall
performance of our Company in 2016-17.
Sales were up 3% versus year ago, while Profit
After Tax (PAT) grew by 2%. Despite the market
volatility and macro-economic challenges of this
Financial Year, your Company delivered growth and
created value. This was driven by continual sharp
focus on winning with consumers, customers and
shareholders. The markets are starting to recover. It is this dedicated approach towards value creation that will
drive the business for years to come.
This Financial Year, the Board of Directors declared a special interim dividend of ` 362/- per Equity Share from
accumulated surplus from profits of earlier years and the current year to celebrate 30th anniversary of Make
in India of its flagship brand Whisper. This takes Total Dividend for the Financial Year to be ` 389/- per Equity
Share.
With the growth in disposable income and increased urbanization, the outlook for Consumer goods industry
remains positive. We will continue to innovate so that we grow sales, profit and cash more consistently and
more sustainably.
As a responsible Company, we also do right thing for the communities we operate in. P&G Shiksha the Company’s
flagship CSR provides children from underprivileged backgrounds with an access to a holistic education. By the
end of Financial Year 2016-17, P&G Shiksha built and supported over 1,500 (+500 since last year) schools across
the country that will impact the lives of over 1.2 million (+200,000 since last year) children.
As a Company, we are keenly focused to create value for our shareholders. We are continuing to make progress
to strengthen business fundamentals, improve productivity and empower our organization and culture to deliver
sustained strong performance.
Lastly, I would also like to express my gratitude to all our consumers, customers, employees, business partners
and YOU, our valued shareholders. I look forward to your sustained support and participation in the growth of
our Company.
R. A. ShahChairman
Mr. R. A. ShahChairman

4 Procter & Gamble Hygiene and Health Care Limited
Dear Shareholders,
It gives me great pleasure to share with you the overall
performance of our Company in 2016-17, which was a
very challenging year due to volatile market conditions.
This Financial Year, we continued our journey towards
sustainable balanced growth with a brutal obsession with
fundamentals. We’re raising the bar across everything
we do to continue to accelerate sales growth, improve
productivity, and empower our organization and culture
to deliver sustained, strong performance.
Our Company delivered sales of ` 2,419 crores, up 3% versus year ago despite challenges of liquidity
crunch in the second quarter and trade destocking ahead of GST in the fourth quarter. The Company responded
to these challenges with agility and continued to strengthen brand fundamentals. The Profit after Tax (PAT)
for the Financial Year stood at ` 433 crores, up 2% versus year ago.
We are establishing a higher standard of excellence for all our brands, with greater superiority in all elements of
our consumer proposition. These include superior products, superior packaging, superior brand communications,
excellent in-store & online execution and winning consumer & retail value equations.
In the Feminine Care business, Whisper continues to be the market leader with several strategic initiatives
launched in the Financial Year to meet the consumers’ needs across both top and mid-end of the segment.
On top end of the portfolio, we made a strategic foray in emerging comfort segment with our new Whisper
Ultra Soft product launch which offers a no-trade off experience between comfort and protection. Our digital
#LikeAGirl campaign struck a chord with millions of girls strengthening Whisper’s brand connect with consumers
and won several external recognitions: Best Local Execution of a Global Brand (Bronze) by Festival of Media, and
Most Engaging Campaign on Instagram across Asia Pacific by Campaign Asia and Unmetric.
On Whisper Choice, we continued to drive increased usage of sanitary napkins, particularly among non-users
in their early teen years via new ‘Check Check’ campaign and continued to focus on the ‘Point of Market’
entry consumers. We also continued to extend the availability of breadth and depth of our portfolio via sharply
designed Go-to-market plans.
Mr. Al RajwaniManaging Director
5Annual Report 2016-2017
Company Overview
Board’s Report
Management Discussion and Analysis
Corporate Governance
Financial Statements
In the Health Care business, your Company posted strong sales growth this Financial Year. We continued to grow
share in the Cough & Cold category with offtake growing strong double-digit behind the strength of our equities
and our portfolio, which includes Vicks VapoRub, Vicks Cough Drops, Vicks Action 500 Advanced and Vicks Inhaler.
We’re setting a higher standard of excellence on advertising quality with a focus on brand performance
claims that communicate the brand’s benefit superiority to create awareness and trial. The Vicks #Touchofcare
campaign was a great example of that. Vicks VapoRub grew penetration and has gained share in the Financial
Year 2016-17. Vicks Cough Drops offtake grew strong with share gain in the Cough Lozenges category.
As the business grows, we continue to drive positive change with our brands. A great example of this is P&G’s
‘Whisper School Program’ in schools. Today, the program on an average reaches 4.4 million girls annually,
providing them with timely menstrual education and product samples. P&G’s Whisper School Program, over the
past 2 decades, has protected millions of adolescent girls in India from unhealthy practices of using unhygienic
cloth for sanitary protection.
We are also strengthening our Go-to-market execution. In stores, this means having the right store coverage,
product forms, sizes, price points, shelving and merchandising execution. Online, it means having the right
content, assortment, ratings, reviews, search and subscription offerings.
As a responsible corporate citizen, ours is a Company that cares and strives every day to improve lives. Not just
for the consumers that trust our brands, or the many partners that we work with, but also for the communities
in which we operate. By the end of Financial Year 2016-17, our flagship CSR program P&G Shiksha built and
supported over 1,500 (+500 since last year) schools across the country that will impact the lives of over 1.2
million (+200,000 since last year) children. Over the recent years, we are especially excited about the impact
P&G Shiksha has been making to improve the ‘quality of education’ which we believe can result in far-reaching
impact on the learning outcomes and overall development of the children we reach. Through our Early Childhood
Education and Remedial Learning programs, our goal is to set up P&G Shiksha students up for success from the
day they enter school to the day they graduate.
India’s FMCG sector continues to be an important contributor to the country’s GDP. After a challenging year,
the market has started showing signs of recovery. We will continue to focus on balanced growth behind brand
fundamentals, strength of product portfolio and improved in-store execution.
Al Rajwani Managing Director
6 Procter & Gamble Hygiene and Health Care Limited
REPORT OF THE DIRECTORS
Your Directors have the pleasure of presenting
the 53rd Annual Report and the Audited Accounts of the
Company for the Financial Year ended June 30, 2017.
FINANCIAL RESULTS
(Figures in ` crores)
2016-17 2015-16
Revenue from operations 2419 2349
Profit before tax 672 636
Profit after tax 433 423
FINANCIAL YEAR
The Company continues to follow its Financial Year as
July 1st to June 30th, pursuant to the approval received
from the Company Law Board in terms of Section 2 (41)
of the Companies Act, 2013.
DIVIDEND
The Directors are pleased to recommend a final dividend
of ` 27/- per Equity Share for the Financial Year ended
June 30, 2017. During the Financial
Year, the Board of Directors declared
a special interim dividend of
` 362/- per Equity Share, out of
the profits for the current year and
accumulated surplus from profits of
earlier years. This was to celebrate
30th anniversary of Make in India of
its flagship brand Whisper. The said
interim dividend was paid to the
Shareholders on June 1, 2017.
BUSINESS PERFORMANCE
Your Company delivered another
year of balanced performance in
a volatile external environment
growing both top and bottom line.
This was possible due to its strength
of product portfolio and superior
value propositions. Sales for the Financial Year 2016-17
increased by 3% to ` 2419 crores as against ` 2349 crores
during the previous Financial Year.
Profit after tax increased by 2% to ` 433 crores while
Profit before tax increased by 6% to ` 672 crores. This was
behind continued focus on productivity and cost efficiency.
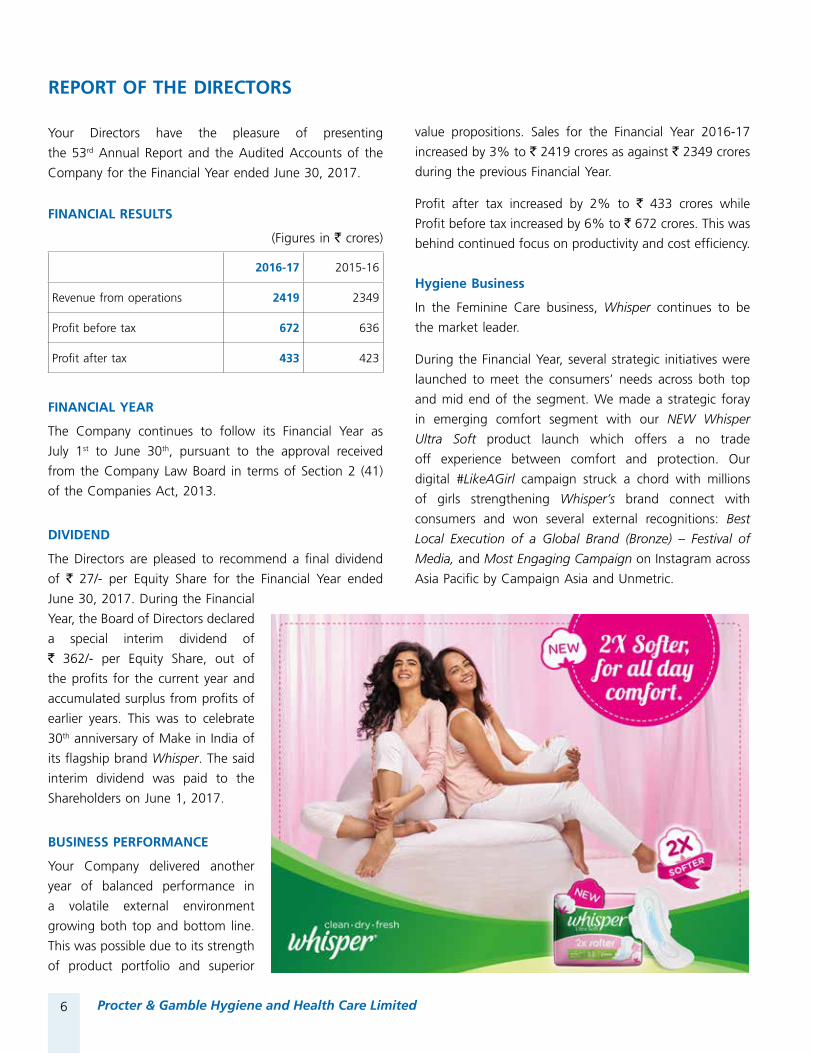
Hygiene Business
In the Feminine Care business, Whisper continues to be
the market leader.
During the Financial Year, several strategic initiatives were
launched to meet the consumers’ needs across both top
and mid end of the segment. We made a strategic foray
in emerging comfort segment with our NEW Whisper
Ultra Soft product launch which offers a no trade
off experience between comfort and protection. Our
digital #LikeAGirl campaign struck a chord with millions
of girls strengthening Whisper’s brand connect with
consumers and won several external recognitions: Best
Local Execution of a Global Brand (Bronze) – Festival of
Media, and Most Engaging Campaign on Instagram across
Asia Pacific by Campaign Asia and Unmetric.

7
Company Overview
Board’s Report
Management Discussion and Analysis
Corporate Governance
Financial Statements
Annual Report 2016-2017
On Whisper Choice, we continued to drive increased
usage of sanitary napkins, particularly among non-users
in their early teen years via new ‘Check Check’ campaign
and continued focus on the ‘Point of Market’ entry
consumer. We also continued to extend availability of
breadth and depth of our portfolio via sharply designed
Go-to-market plan.
Old Spice de-grew on value sales in the Financial Year
2016-17. It was a conscious choice to hold back investments
on the brand until we have a winning proposition in a
category that is highly dynamic and competitive.
Health Care Business
The Company’s Health Care sales posted strong growth
this Financial Year. The Company continued to grow
share in the Cough & Cold category with offtake
growing strong double-digit behind the strength of our
equities and our portfolio, which includes Vicks VapoRub,
Vicks Cough Drops, Vicks Action 500 Advanced and
Vicks Inhaler. The growth was driven by combination of
strong focus on driving brand fundamentals, key business
drivers and equity building campaigns like #Touchofcare.
Vicks VapoRub grew penetration and has gained shared
in the Financial Year 2016-17. Vicks Cough Drops offtake
grew strong with share gain in the cough lozenges category
behind our new campaign with the iconic ‘Khich Khich
Monster’.
Overall, the Company continued to focus on driving
consumer meaningful innovations backed by distribution
expansion and strong advertising thereby delivering
consistent growth.
P&GIN1765 Vicks VVR Siesta_A3 KEY VISUAL; India (Hindi); (SUG)
DON’T LET A COLD* DISTURB THEIR DREAMS
*Relief from nasal congestion due to cold.
UP TO
HOURSRELIEF*

8 Procter & Gamble Hygiene and Health Care Limited
‘‘I have often been asked what the essence of P&G’s purpose is. What the recipe is to becoming a reputed Company
which millions of people trust, everyday. I have for them, but four words
‘Touching lives. Improving life .’
Everyday, each one of us at P&G wakes up to try and see how we can get just one step closer to improving lives, more completely.
Not just for the consumers that trust our brands, or the partners that we work with along the way, but also for the communities in which we operate.”
Al Rajwani,Managing Director

9
Company Overview
Board’s Report
Management Discussion and Analysis
Corporate Governance
Financial Statements
Annual Report 2016-2017
CORPORATE SOCIAL RESPONSIBILITY (‘CSR’)
The only way to build a sustainable
business is to improve lives
For your Company, sustainability means making every day
better for people through how we innovate and how we
act. This strategy has inspired an enduring CSR strategy
supported by two pillars – P&G Shiksha and Timely
Disaster Relief. While P&G Shiksha provides children from
underprivileged backgrounds with an access to a holistic
education, your Company’s disaster relief activities aim to
rehabilitate and empower the victims of natural disasters
by providing them with daily essential commodities and
safe drinking water.
Your Company’s signature corporate sustainability program
P&G Shiksha has till date built and supported over 1500
(+500 since last year) schools across the country that will
impact the lives of over 1.2 million (+200,000 since last
year) children, in partnership with a number of NGOs like
— Round Table India (RTI), Save the Children, Pratham,
Army Wives Welfare Association (AWWA), Navy Wives
Welfare Association (NWWA), Air Force Wives Welfare
Association (AFWWA) amongst others. These partners serve
as specialists, lending their expertise to particular aspects of
the education system. RTI for example is dedicated towards
constructing educational infrastructure and supporting
schools across India. Save the Children focuses on girl
child’s education by aiding government funded programs
like the Kasturba Gandhi Balika Vidhyalayas. Pratham has
special expertise in remedial learning to help bring children
up to speed with the learning levels in their curriculum.
Similarly, the NGOs AWWA and NWWA are experts in
serving the educational needs of disabled children.
Since its commencement in 2005, P&G Shiksha has
also empowered consumers to contribute towards the
education of underprivileged children by making conscious
brand choices. This has enabled your Company to share
a part of the sales towards this movement. P&G Shiksha
has till date made a cumulative donation of over ` 65
crores towards building new schools, providing critical
infrastructural amenities at existing schools or reviving
non-operational government schools.
During the Financial Year, Save the Children in partnership
with P&G Shiksha has continued to empower marginalized
girls through improving learning effectiveness and has also
expanded its impact. Thirteen Kasturba Gandhi Balika
Vidyalayas (KGBVs) were supported through the provision
of sports kits and laboratory equipment. Additionally, Baal
Sansads and School Management Committees (SMCs)
have also been strengthened through capacity building
of its members. These initiatives have thus resulted in
a positive change in the overall environment of KGBVs.
For example, teachers have started taking initiatives
in practicing innovative pedagogical methods (such as
promoting an effective use of the library facility, project
work, story building as well as an overall better planning
and execution of multi-level teaching).
Your Company continued to impact the communities
around its plants in a holistic manner throughout the
Financial Year. At Goa, in association with Matruchhaya,
a local public charitable trust, your Company is providing
educational and infrastructural support to a school for the
orphaned, destitute and abandoned children. In Goa, with
the NGO RTI, the company built and supported 7 schools
directly impacting more than 2,000 children.
10 Procter & Gamble Hygiene and Health Care Limited
Two years ago, we entered into partnership with Pratham
Education Foundation, a leading NGO in India in the
educational space to foray into Remedial Learning and
Early Childhood Education thereby focusing on learning
outcomes as well. P&G Shiksha partnered with Pratham’s
Read India initiative that aims to bridge the existing gap
between current and existing learning levels. The results
were phenomenal; we reached out to more than 500
schools and 65,000 children and saw the learning levels
in the schools rise at the end of the year following our
interventions. Before the intervention, only 20% children
in these schools who were able to read and write as per
their curriculum level, which increased to 70% after our
intervention. Similarly, there was more than a two fold
increase in the percentage of children who were able to
do basic arithmetic after our intervention.
Your Company also identified ‘Early Childhood Education’
as a key opportunity area in the educational landscape of
the country. The program builds capability of Anganwadi
workers in order to develop motor and cognitive skills
in children so that they are set for a fast paced growth
once they start going to school. We launched the program
in Bihar, Uttar Pradesh and Delhi through Pratham’s
partnership with the Government (ICDS), to impact early
childhood learning in Anganwadi centers to strengthen
school readiness in children. At the end of the year, to
assess their level of development, children were asked
to do several tasks like matching shapes, ability to trace
shapes to recognize number, ability to tell their name and
family background. The results were overwhelming, 80%
children in the intervention groups had competent motor
skills (ability to draw, hold a pencil, colour within a shape
etc.) versus 42% in the comparison groups. Similarly,
cognitive competence of the children in intervention groups
was more than two-fold than that of comparison groups.
We are encouraged by the results on our new areas of
focus in 2016-17 and P&G Shiksha is all set to strengthen
the Shiksha Upgrade by expanding these programs across
more states as per their respective needs in 2017-18. Since
the government has highlighted ‘quality of education’ as
one of the key focus areas for country’s growth in the next
decade, your Company is well poised to play an active role
in the India Success Story.
Your Company has constituted a Corporate Social
Responsibility Committee. The composition and terms of
reference of the Corporate Social Responsibility Committee
are provided in the Corporate Governance Report annexed
to this report.
Annual report on CSR activities as required under the
Companies (Corporate Social Responsibility Policy) Rules,
2014 has been appended as Annexure I to this Report.
ENVIRONMENTAL SUSTAINABILITY AND
CONSERVATION OF ENERGY
Environmental sustainability is embedded in our Purpose,
Values, Principles, and our business. In order to improve
lives, now and for generations to come, we ensure that our
products, packaging and operations are safe for employees,
consumers and the environment. We ensure this with a
focus on technologies, processes and improvements that
matter for the environment.
Your Company’s Head Office at Mumbai reduced its
annual energy consumption by over 21.2% over the last
15 years.
During the Financial Year, our plant in Goa became a
certified ‘zero waste to landfill’ site. In the last 5 years, the
plant has reduced carbon emission by more than 90%.
During this period, the plant has also achieved a 39%
improvement in both energy and water consumption.
11
Company Overview
Board’s Report
Management Discussion and Analysis
Corporate Governance
Financial Statements
Annual Report 2016-2017
For your Company, sustainability inspires and guides
everything we do. Moreover, we ensure environmental
friendly practices at our sites. These include reduction
in power consumption, optimal water consumption and
eliminating excess use of paper.
TECHNOLOGY ABSORPTION
i. Efforts made towards technology absorption:
Continued implementation of quality control/quality
assurance procedures of products and processes were
successfully adapted on commercial scale to utilize
local raw materials and machinery; technical services
for reliability, quality, cost savings and technology
transfer from overseas.
ii. Benefits derived like product improvement,
cost reduction, product development or import
substitution:
All the above efforts resulted in improving
process efficiencies, consistent quality of our
products, introduction of new products and
import substitution and successful absorption of
technology.
iii. Imported technology:
Your Company has the advantage of availing advanced
technology and continuous upgradation thereof
from The Procter & Gamble Company, USA and its
subsidiaries. This is a competitive advantage that helps
the Company deliver strong business results.
iv. Expenditure on Research & Development
Your Company has not incurred any expenditure
on research and development during the Financial
Year.
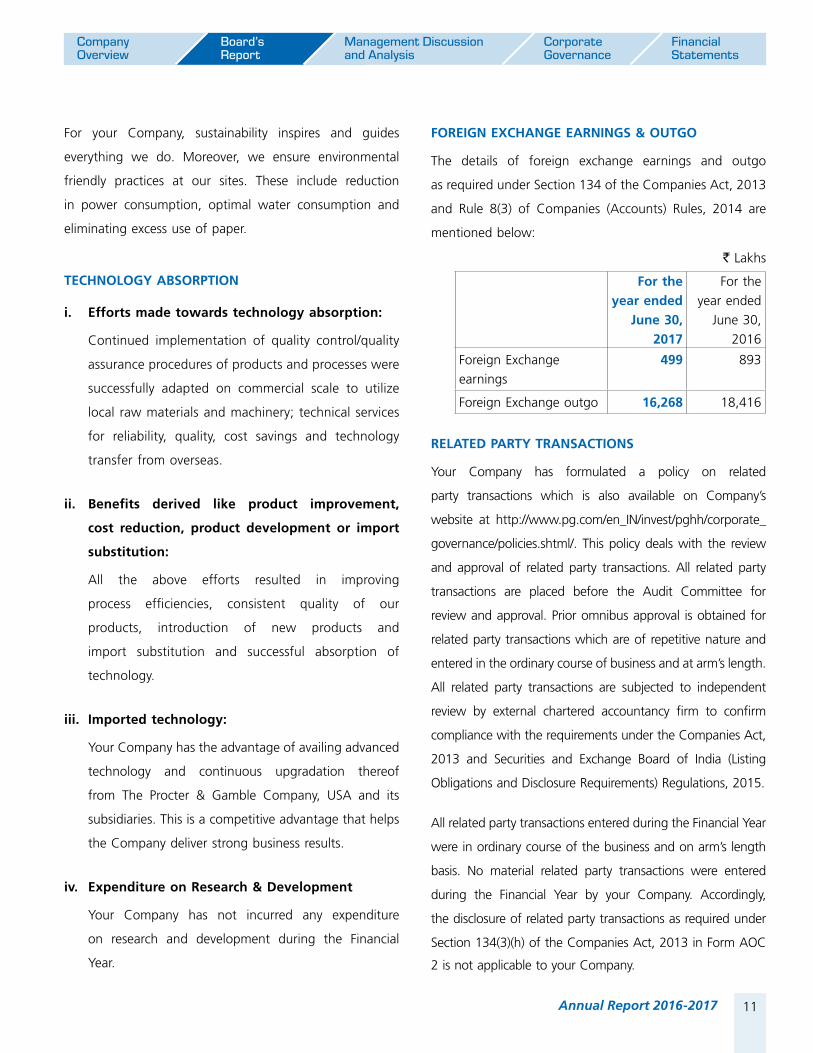
FOREIGN EXCHANGE EARNINGS & OUTGO
The details of foreign exchange earnings and outgo
as required under Section 134 of the Companies Act, 2013
and Rule 8(3) of Companies (Accounts) Rules, 2014 are
mentioned below:
` Lakhs
For the year ended
June 30, 2017
For the year ended
June 30, 2016
Foreign Exchange earnings
499 893
Foreign Exchange outgo 16,268 18,416
RELATED PARTY TRANSACTIONS
Your Company has formulated a policy on related
party transactions which is also available on Company’s
website at http://www.pg.com/en_IN/invest/pghh/corporate_
governance/policies.shtml/. This policy deals with the review
and approval of related party transactions. All related party
transactions are placed before the Audit Committee for
review and approval. Prior omnibus approval is obtained for
related party transactions which are of repetitive nature and
entered in the ordinary course of business and at arm’s length.
All related party transactions are subjected to independent
review by external chartered accountancy firm to confirm
compliance with the requirements under the Companies Act,
2013 and Securities and Exchange Board of India (Listing
Obligations and Disclosure Requirements) Regulations, 2015.
All related party transactions entered during the Financial Year
were in ordinary course of the business and on arm’s length
basis. No material related party transactions were entered
during the Financial Year by your Company. Accordingly,
the disclosure of related party transactions as required under
Section 134(3)(h) of the Companies Act, 2013 in Form AOC
2 is not applicable to your Company.
12 Procter & Gamble Hygiene and Health Care Limited
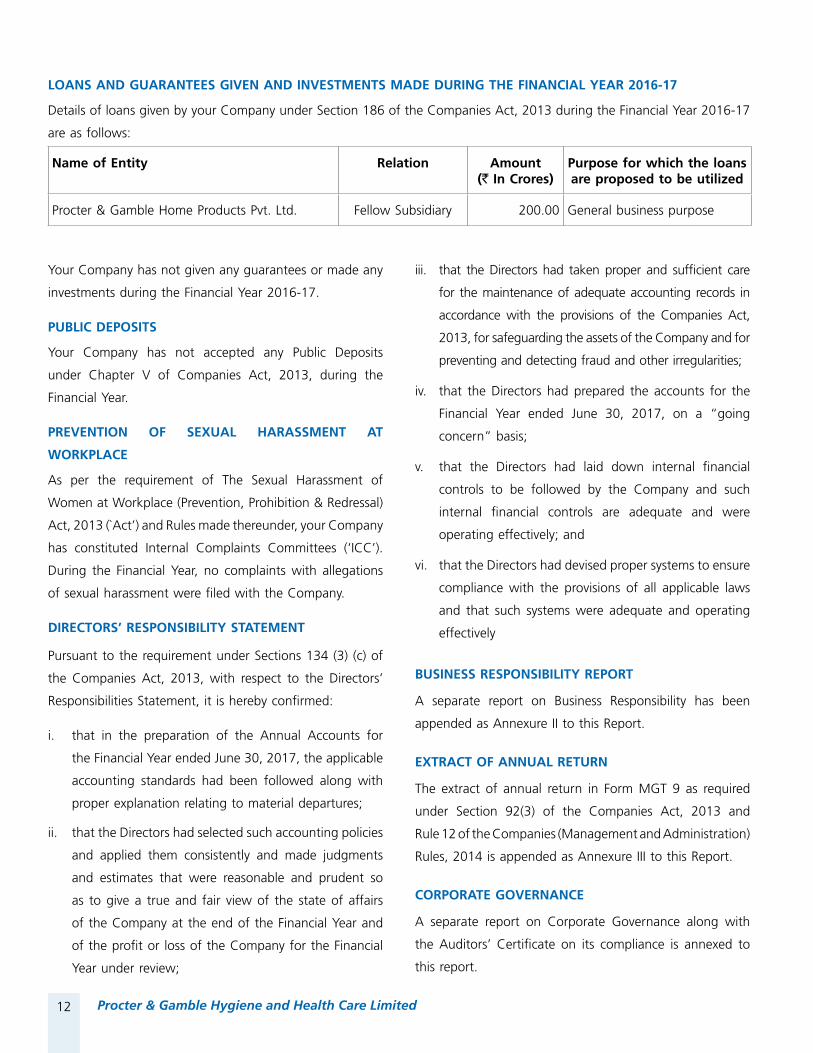
Your Company has not given any guarantees or made any
investments during the Financial Year 2016-17.
PUBLIC DEPOSITS
Your Company has not accepted any Public Deposits
under Chapter V of Companies Act, 2013, during the
Financial Year.
PREVENTION OF SEXUAL HARASSMENT AT
WORKPLACE
As per the requirement of The Sexual Harassment of
Women at Workplace (Prevention, Prohibition & Redressal)
Act, 2013 (`Act’) and Rules made thereunder, your Company
has constituted Internal Complaints Committees (‘ICC’).
During the Financial Year, no complaints with allegations
of sexual harassment were filed with the Company.
DIRECTORS’ RESPONSIBILITY STATEMENT
Pursuant to the requirement under Sections 134 (3) (c) of
the Companies Act, 2013, with respect to the Directors’
Responsibilities Statement, it is hereby confirmed:
i. that in the preparation of the Annual Accounts for
the Financial Year ended June 30, 2017, the applicable
accounting standards had been followed along with
proper explanation relating to material departures;
ii. that the Directors had selected such accounting policies
and applied them consistently and made judgments
and estimates that were reasonable and prudent so
as to give a true and fair view of the state of affairs
of the Company at the end of the Financial Year and
of the profit or loss of the Company for the Financial
Year under review;
iii. that the Directors had taken proper and sufficient care
for the maintenance of adequate accounting records in
accordance with the provisions of the Companies Act,
2013, for safeguarding the assets of the Company and for
preventing and detecting fraud and other irregularities;
iv. that the Directors had prepared the accounts for the
Financial Year ended June 30, 2017, on a “going
concern” basis;
v. that the Directors had laid down internal financial
controls to be followed by the Company and such
internal financial controls are adequate and were
operating effectively; and
vi. that the Directors had devised proper systems to ensure
compliance with the provisions of all applicable laws
and that such systems were adequate and operating
effectively
BUSINESS RESPONSIBILITY REPORT
A separate report on Business Responsibility has been
appended as Annexure II to this Report.
EXTRACT OF ANNUAL RETURN
The extract of annual return in Form MGT 9 as required
under Section 92(3) of the Companies Act, 2013 and
Rule 12 of the Companies (Management and Administration)
Rules, 2014 is appended as Annexure III to this Report.
CORPORATE GOVERNANCE
A separate report on Corporate Governance along with
the Auditors’ Certificate on its compliance is annexed to
this report.
LOANS AND GUARANTEES GIVEN AND INVESTMENTS MADE DURING THE FINANCIAL YEAR 2016-17
Details of loans given by your Company under Section 186 of the Companies Act, 2013 during the Financial Year 2016-17
are as follows:
Name of Entity Relation Amount (` In Crores)
Purpose for which the loans are proposed to be utilized
Procter & Gamble Home Products Pvt. Ltd. Fellow Subsidiary 200.00 General business purpose

13
Company Overview
Board’s Report
Management Discussion and Analysis
Corporate Governance
Financial Statements
Annual Report 2016-2017
MANAGEMENT & PERSONNEL
The strength of business over the past few years and
resilience in this particular year due to multiple economic
headwinds in the country demonstrates the core strengths
of our employees to stay reality based and influence the
course of business. Financial Year 2016-17 was a year of
overall strong growth in many categories. Our productivity
continues to be best-in-class with major progress in
Leadership and Talent Development.
The statement of Disclosure of Remuneration under Section
197 of Companies Act, 2013 and Rule 5(1) of Companies
(Appointment and Remuneration of Managerial Personnel)
Rules, 2014 is appended as Annexure IV to the Report.
The information as per Rule 5 (2) of the Companies
(Appointment and Remuneration of Managerial Personnel)
Rules, 2014 forms part of this Report. As per the provisions
of first proviso to Section 136 (1) of the Companies
Act, 2013 the Report and Financial Statements are being sent
to the Members of the Company excluding the statement of
particulars of employees under Rule 5 (2) of the Companies
(Appointment and Remuneration of Managerial Personnel)
Rules, 2014. Any Member interested in obtaining a copy of
the said statement may write to the Company Secretary at
the Registered Office of the Company.
DIRECTORS AND KEY MANAGERIAL PERSONNEL
During the year, there was no change in the Board of
Directors of your Company. Ms. Preeti Bishnoi ceased to
be the Company Secretary and Compliance Officer of the
Company effective January 19, 2017. Mr. Ishan Sonthalia was
appointed as the Company Secretary and Compliance Officer
of the Company effective May 5, 2017.
Mr. Karthik Natarajan, Director and Mr. Pramod Agarwal,
Director retire by rotation and being eligible, offer themselves
for re-appointment at the ensuing 53rd Annual General
Meeting of the Company.
The Independent Directors of your Company have given
Certificate of Independence to your Company stating that
they meet the criteria of independence as mentioned under
Section 149 (6) of the Companies Act, 2013 and Securities
and Exchange Board of India (Listing Obligations and
Disclosure Requirements) Regulations, 2015.
The details of training and familiarization programme and
Annual Board Evaluation process for Directors have been
provided under the Corporate Governance Report.
The policy on Directors’ appointment and remuneration
including criteria for determining qualifications, positive
attributes, independence of Directors, and remuneration for
Key Managerial Personnel has been appended as Annexure V
to this Report. The same is also available on the website
of the Company at http://www.pg.com/en_IN/invest/pghh/
corporate_governance/policies.shtml.
Brief resumes of Directors proposed to be re-appointed at the
ensuing 53rd Annual General Meeting and the details of the
Directorships held by them in other companies are given in
the “Corporate Governance” section of the Annual Report.
Appropriate resolutions for the re-appointment of the
aforesaid Directors are being moved at the ensuing
53rd Annual General Meeting, which the Board recommends
for your approval.
AUDITORS
The Report given by Deloitte Haskins & Sells LLP, Statutory
Auditors on the financial statements of the Company for
Financial Year ended June 30, 2017 is part of the Annual
Report. There has been no qualification, reservation or
adverse remark given by the Auditors in their Report.
Deloitte Haskins & Sells LLP were appointed as Statutory
Auditors of your Company at the 50th Annual General
Meeting held on September 24, 2014 for a term of three
consecutive years, which will be complete at the ensuing

14 Procter & Gamble Hygiene and Health Care Limited
53rd Annual General Meeting. It is proposed to appoint
Kalyaniwalla & Mistry LLP, Chartered Accountants as
Statutory Auditors of your Company from the conclusion
of the ensuing 53rd Annual General Meeting until the
conclusion of the 58th Annual General Meeting. Resolution
for the said appointment is being moved at the ensuing
53rd Annual General Meeting.
COST AUDITORS
Ashwin Solanki & Associates, Cost Accountants carried out
the cost audit for applicable business during the Financial
Year 2016-17. The Board of Directors has appointed
Ashwin Solanki & Associates, Cost Accountants for the
Financial Year 2017-18.
POLICIES
Your Company has adopted policies on related party
transactions, corporate social responsibility, vigil mechanism,
nomination and remuneration, materiality of events and
dividend distribution, which are available on the website
of the Company at http://www.pg.com/en_IN/invest/
pghh/corporate_governance/policies.shtml/. The dividend
distribution policy has been appended as Annexure VI to
this Report.
The details of the policies are provided in the Corporate
Governance Report annexed to this Report.
SECRETARIAL AUDIT
Secretarial Audit was carried out by Dholakia &
Associates LLP, Company Secretaries for the Financial
Year 2016-17. There were no qualifications, reservation
or adverse remarks given by Secretarial Auditors of the
Company. The Secretarial Audit report has been appended
as Annexure VII to this Report.
SECRETARIAL STANDARDS
During the Financial Year, your Company has complied
with applicable Secretarial Standards issued by the Institute
of Company Secretaries of India.
TRADE RELATIONS
The Directors wish to thank the retailers, wholesalers,
distributors, suppliers of goods & services, clearing
and forwarding agents and all other business associates
and acknowledge their efficiency and continued support
in promoting such healthy growth in the Company’s
business.
ACKNOWLEDGEMENT
We are grateful to The Procter & Gamble Company,
USA and its subsidiaries for their invaluable support in
terms of access to the latest information/knowledge
in the field of research & development for products,
ingredients and technologies; timely inputs to exceptional
marketing strategies; and the goodwill of its world-
renowned Trademarks and superior brands. We are proud
to acknowledge this unstinted association that has vastly
benefited the Company.
On behalf of the Board of Directors
Mumbai R. A. Shah
August 23, 2017 Chairman

15
Company Overview
Board’s Report
Management Discussion and Analysis
Corporate Governance
Financial Statements
Annual Report 2016-2017
ANNEXURE I
Annual Report on Corporate Social Responsibility[Pursuant to Companies (Corporate Social Responsibility Policy) Rules, 2014]
1. Brief outline of the Company’s CSR policy
Doing the right thing is the foundation of Procter & Gamble’s Purpose, Values, and Principles. It is naturally woven into the way we work every day — paying competitive wages, working consistently with our retailers and suppliers, preventing conflicts of interest, ensuring consumer privacy and maintaining financial stewardship. This approach to business is at the heart of all we do at P&G. Doing the right thing also includes investing in the communities in which we live, work, and serve. At its core, P&G’s Social Responsibility efforts aim to improve lives.
Companies Act, 2013 highlights the importance of Corporate Social Responsibility (“CSR”) as a strategic tool for sustainable growth of the people, the communities we operate in and the Company as a whole. In line with the global principles followed by the Procter & Gamble group and the terms of Companies Act, 2013 the policy on CSR is broadly framed taking into account the following:
1. We believe it is essential to run our business responsibly, and our operating practices reflect this commitment.
2. P&G is focused on making every day better for people and the planet through our innovations and our actions;
i) Environment by: Conservation of Resources, Using Renewable Resources, Generating Worth from Waste;
ii) Social by: Providing the comforts of home, improving health and hygiene of people, social and cultural development, imparting education, training and social awareness.
The CSR activities to be undertaken by the Company, include, but are not limited to the following:
a. Social and cultural development by: • Impartingeducation,training(vocationalandskillbased)andcreatingsocialawareness;
• Awarenessprogramsongirleducation; • Empowermentofwomenforeducation/health&self-employment; • Empowermentofdifferentiallyabledchildrenandtheirself-development; • Skilldevelopmentandgenerationofemploymentbylocallydriveninitiatives; • Promotingpreventivehealthcareandsanitationbyprovidinghealthandhygieneproducts; • Makingavailablesafedrinkingwater; • Promotingsportsandculturalactivities; • Creatingawarenessanddevelopmentofinfrastructureforsportsandculturalactivities; • Measuresforthebenefitofarmedforcesveterans,warwidowsandtheirdependents;and • Reliefandsupporttovictimsofnaturalcalamitiesinanypartofthecountry.
b. Ensuring Environmental Sustainability by:
• Conservationofresourcesbydesignandmanufactureofproductsthatmaximizetheconservationofresources; • Utilizationofrenewableenergyandrenewableorrecycledmaterials; • Generatingworthfromwaste.
c. Any other objectives as mentioned under Section 135 of Companies Act, 2013 and / or relevant Rules and Schedules.
The CSR Policy is available on the website of the Company at http://www.pg.com/en_IN/invest/pghh/corporate_governance/policies.shtml.
The composition of the CSR Committee as on date:
Mr. A. K. Gupta Chairman
Mr. Karthik Natarajan Member
Ms. Sonali Dhawan Member
Mr. Al Rajwani Member
16 Procter & Gamble Hygiene and Health Care Limited
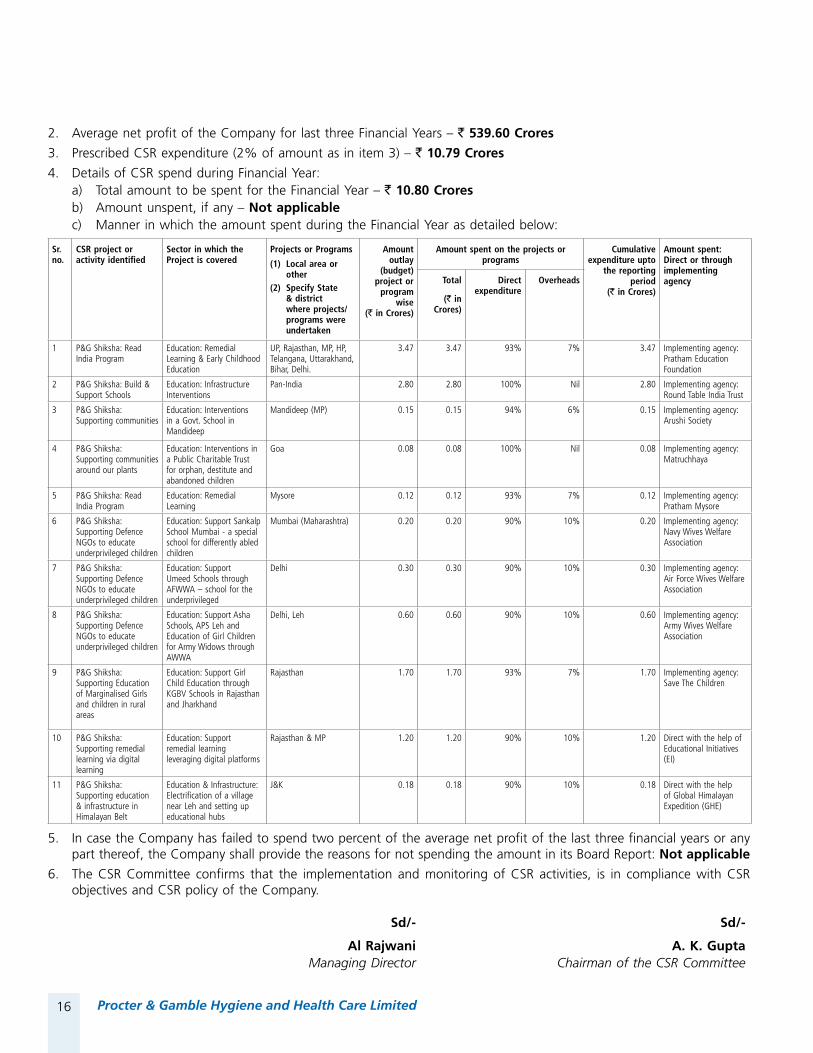
2. Average net profit of the Company for last three Financial Years – ` 539.60 Crores
3. Prescribed CSR expenditure (2% of amount as in item 3) – ` 10.79 Crores
4. Details of CSR spend during Financial Year: a) Total amount to be spent for the Financial Year – ` 10.80 Crores b) Amount unspent, if any – Not applicable c) Manner in which the amount spent during the Financial Year as detailed below:
Sr. no.
CSR project or activity identified
Sector in which the Project is covered
Projects or Programs
(1) Local area or other
(2) Specify State & district where projects/programs were undertaken
Amount outlay
(budget) project or
program wise
(` in Crores)
Amount spent on the projects or programs
Cumulative expenditure upto
the reporting period
(` in Crores)
Amount spent:Direct or through implementing agencyTotal
(` in Crores)
Direct expenditure
Overheads
1 P&G Shiksha: Read India Program
Education: Remedial Learning & Early Childhood Education
UP, Rajasthan, MP, HP, Telangana, Uttarakhand, Bihar, Delhi.
3.47 3.47 93% 7% 3.47 Implementing agency: Pratham Education Foundation
2 P&G Shiksha: Build & Support Schools
Education: Infrastructure Interventions
Pan-India 2.80 2.80 100% Nil 2.80 Implementing agency: Round Table India Trust
3 P&G Shiksha: Supporting communities
Education: Interventions in a Govt. School in Mandideep
Mandideep (MP) 0.15 0.15 94% 6% 0.15 Implementing agency: Arushi Society
4 P&G Shiksha: Supporting communities around our plants
Education: Interventions in a Public Charitable Trust for orphan, destitute and abandoned children
Goa 0.08 0.08 100% Nil 0.08 Implementing agency: Matruchhaya
5 P&G Shiksha: Read India Program
Education: Remedial Learning
Mysore 0.12 0.12 93% 7% 0.12 Implementing agency: Pratham Mysore
6 P&G Shiksha: Supporting Defence NGOs to educate underprivileged children
Education: Support Sankalp School Mumbai - a special school for differently abled children
Mumbai (Maharashtra) 0.20 0.20 90% 10% 0.20 Implementing agency: Navy Wives Welfare Association
7 P&G Shiksha: Supporting Defence NGOs to educate underprivileged children
Education: Support Umeed Schools through AFWWA – school for the underprivileged
Delhi 0.30 0.30 90% 10% 0.30 Implementing agency: Air Force Wives Welfare Association
8 P&G Shiksha: Supporting Defence NGOs to educate underprivileged children
Education: Support Asha Schools, APS Leh and Education of Girl Children for Army Widows through AWWA
Delhi, Leh 0.60 0.60 90% 10% 0.60 Implementing agency: Army Wives Welfare Association
9 P&G Shiksha: Supporting Education of Marginalised Girls and children in rural areas
Education: Support Girl Child Education through KGBV Schools in Rajasthan and Jharkhand
Rajasthan 1.70 1.70 93% 7% 1.70 Implementing agency: Save The Children
10 P&G Shiksha: Supporting remedial learning via digital learning
Education: Support remedial learning leveraging digital platforms
Rajasthan & MP 1.20 1.20 90% 10% 1.20 Direct with the help of Educational Initiatives (EI)
11 P&G Shiksha: Supporting education & infrastructure in Himalayan Belt
Education & Infrastructure: Electrification of a village near Leh and setting up educational hubs
J&K 0.18 0.18 90% 10% 0.18 Direct with the help of Global Himalayan Expedition (GHE)
5. In case the Company has failed to spend two percent of the average net profit of the last three financial years or any part thereof, the Company shall provide the reasons for not spending the amount in its Board Report: Not applicable
6. The CSR Committee confirms that the implementation and monitoring of CSR activities, is in compliance with CSR objectives and CSR policy of the Company.
Sd/- Sd/-
Al Rajwani A. K. GuptaManaging Director Chairman of the CSR Committee
17
Company Overview
Board’s Report
Management Discussion and Analysis
Corporate Governance
Financial Statements
Annual Report 2016-2017
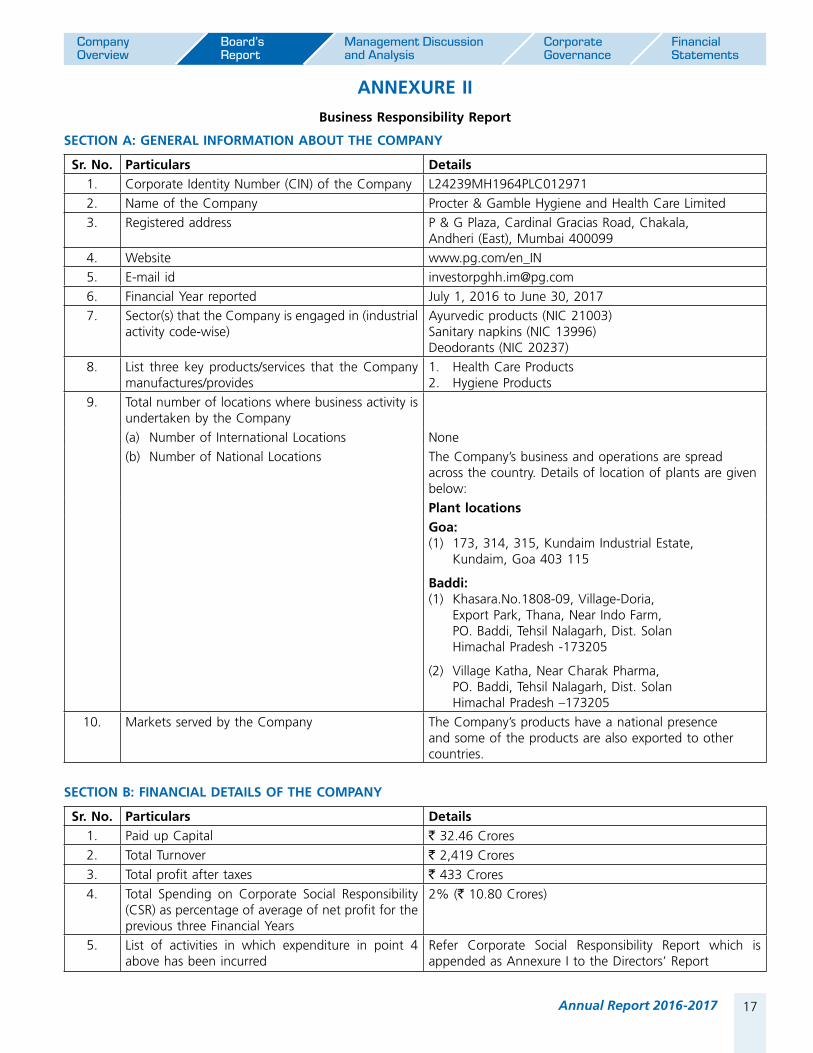
ANNEXURE II
Business Responsibility Report
SECTION A: GENERAL INFORMATION ABOUT THE COMPANY
Sr. No. Particulars Details1. Corporate Identity Number (CIN) of the Company L24239MH1964PLC0129712. Name of the Company Procter & Gamble Hygiene and Health Care Limited3. Registered address P & G Plaza, Cardinal Gracias Road, Chakala,
Andheri (East), Mumbai 4000994. Website www.pg.com/en_IN5. E-mail id [email protected]. Financial Year reported July 1, 2016 to June 30, 20177. Sector(s) that the Company is engaged in (industrial
activity code-wise)Ayurvedic products (NIC 21003)Sanitary napkins (NIC 13996)Deodorants (NIC 20237)
8. List three key products/services that the Company manufactures/provides
1. Health Care Products2. Hygiene Products
9. Total number of locations where business activity is undertaken by the Company(a) Number of International Locations None(b) Number of National Locations The Company’s business and operations are spread
across the country. Details of location of plants are given below:Plant locationsGoa: (1) 173, 314, 315, Kundaim Industrial Estate,
Kundaim, Goa 403 115
Baddi: (1) Khasara.No.1808-09, Village-Doria,
Export Park, Thana, Near Indo Farm, PO. Baddi, Tehsil Nalagarh, Dist. Solan Himachal Pradesh -173205
(2) Village Katha, Near Charak Pharma, PO. Baddi, Tehsil Nalagarh, Dist. Solan Himachal Pradesh –173205
10. Markets served by the Company The Company’s products have a national presence and some of the products are also exported to other countries.
SECTION B: FINANCIAL DETAILS OF THE COMPANY
Sr. No. Particulars Details1. Paid up Capital ` 32.46 Crores2. Total Turnover ` 2,419 Crores3. Total profit after taxes ` 433 Crores4. Total Spending on Corporate Social Responsibility
(CSR) as percentage of average of net profit for the previous three Financial Years
2% (` 10.80 Crores)
5. List of activities in which expenditure in point 4 above has been incurred
Refer Corporate Social Responsibility Report which is appended as Annexure I to the Directors’ Report

18 Procter & Gamble Hygiene and Health Care Limited
SECTION C: OTHER DETAILS
Sr. No. Particulars Details1. Does the Company have any Subsidiary Company/
Companies? The Company does not have any subsidiary company
2. Do the Subsidiary Company/Companies participate in the BR Initiatives of the parent company? If yes, then indicate the number of such subsidiary company(s)
Not applicable as the Company does not have any subsidiary company
3. Do any other entity/entities (e.g. suppliers, distributors etc.) that the Company does business with, participate in the BR initiatives of the Company?
Your Company’s Sustainability Guidelines for External Business Partners set our expectations with our external partners with regard to Social and Environmental Responsibility. We actively seek business relationships with partners that share these values, and that promote high standards within their own supply chains. Our risk-based audit program supports this effort by assessing partners through third-party audits, and identifying and remediating issues. We strive to effect change in our supply base when we identify improvement opportunities, and this is an important way we fulfill our purpose. We want to build a robust system of External Business Partners that is fully integrated and synchronized with your Company’s business and values.
SECTION D: BUSINESS RESPONSIBILITY INFORMATION
1. Details of Director/Directors responsible for Business Responsibility
The Corporate Social Responsibility Committee of the Company is responsible for the Business Responsibility policies of the Company.
Details of the Directors responsible for implementation of the Business Responsibility policies:
1. DIN 02588131 07251300 06685891 068085272. Name Mr. A. K. Gupta Mr. Al Rajwani Mr. K. Natarajan Ms. S. Dhawan3. Designation Independent Director Managing Director Non-executive Director Non-executive Director
2. Principle-wise (as per NVGs) Business Responsibility Policy(ies)
All successful and sustainable companies have one thing in common – good governance practices. Your Company believes in “Doing right Thing, Everytime”. Your Company has a strong history of operating with integrity - at all levels, both internally and externally. Our actions and the actions of all our employees are governed by our Purpose, Values and Principles (PVP). Your Company reinforces responsibilities on all its employees, of observing high standards of Corporate Governance through the Company's "Worldwide Business Conduct Manual" which sets forth management's commitment to conduct its business affairs with high ethical standards. These standards flow from the following core values of the Company:
• TreattheCompany’sassetsasyouwouldtreatyourown; • BehavewiththeCompany’slongtermsuccessinmind; • Alwaysdotherightthing;and • Operatewithintheletterandspiritoflaw.
Business Responsibility Principles:
Principle 1: Ethics, Transparency and Accountability (P1) Principle 6: Environment Protection (P6)Principle 2: Safe Products & Products Lifecycle Sustainability (P2) Principle 7: Policy Advocacy (P7)Principle 3: Employees’ Well-being (P3) Principle 8: Inclusive Growth (P8)Principle 4: Stakeholder Engagement (P4) Principle 9: Customer Value (P9)Principle 5: Human Rights (P5)

19
Company Overview
Board’s Report
Management Discussion and Analysis
Corporate Governance
Financial Statements
Annual Report 2016-2017
Details of compliance:
Sr. No.
Questions P1 P2 P3 P4 P5 P6 P7 P8 P9
1. Does the Company have a policy(ies) for the relevant Principle?
Y Y Y Y Y Y Y Y Y
2. Has the policy being formulated in consultation with the relevant stakeholders?
Y Y Y Y Y Y Y Y Y
3. Does the policy conform to any national / international standards?
The World-wide business conduct manual and the Human Rights policy statement apply UN guiding principles on Business & Human Rights
4. Has the policy being approved by the Board? Y Y Y Y Y Y Y Y Y5. Does the Company have a specified Committee of the
Board/ Director/ Official to oversee the implementation of the policy?
Y Y Y Y Y Y Y Y Y
6. Indicate the link for the policy to be viewed online www.pg.com/en_IN7. Has the policy been formally communicated to all relevant
internal and external stakeholders? Y Y Y Y Y Y Y Y Y
8. Does the company have in-house structure to implement the policies?
Y Y Y Y Y Y Y Y Y
9. Does the Company have a grievance redressal mechanism related to the policy(ies) to address stakeholders’ grievances related to the policy(ies)?
Y Y Y Y Y Y Y Y Y
10. Has the Company carried out independent audit/evaluation of the working of this policy by an internal or external agency?
Y Y Y Y Y Y Y Y Y
3. Governance related to Business Responsibility
The Corporate Social Responsibility Committee and the Board of Directors assess the Business Responsibility performance annually. The Business Responsibility Report shall be issued annually along with the Annual Report of the Company. The Business Responsibility Report can be viewed at www.pg.com/en_IN.
SECTION E: PRINCIPLE-WISE PERFORMANCE
Principle 1: Ethics, Transparency and Accountability
Your Company is committed to being a good corporate citizen and doing the right thing. Our Purpose, Values and Principles (PVPs) are the foundation of the Company. Our objective is to create industry-leading value by maintaining and enhancing our strong corporate reputation through a strong ethics and compliance culture. We operate within the spirit and letter of the law, maintaining high ethical standards wherever we conduct business. We believe that good governance practices contribute to better results for shareholders. We maintain governance principles, policies and practices that support management accountability.
These are in the best interest of the Company and our shareholders, and they are consistent with the Company’s Purpose, Values and Principles. Company reinforces responsibilities on all its employees, of observing high standards of Corporate Governance through the Company's Worldwide Business Conduct Manual which sets forth management's commitment to conduct its business affairs with high ethical standards. The Sustainability Guidelines for External Business Partners explain the global standards to be followed by the external business partners in their daily business activities on behalf of the Company. External business partners and their suppliers are expected to share your Company’s commitment to these standards.
Your Company being a part of the Procter & Gamble group is guided by a Whistle Blower Policy as laid down in its Worldwide Business Conduct Manual. Any employee or other interested person can call on The Worldwide Business Conduct Helpline, twenty-four hours a day, seven days a week, to report any concerns about violations of the Company’s Worldwide Business Conduct Standards. The Worldwide Business Conduct Helpline is not staffed or monitored by the Company personnel. All calls can be

20 Procter & Gamble Hygiene and Health Care Limited
completed anonymous if the caller desires. The Helpline can take calls in most languages spoken by employees around the world. Calls made to the Helpline are reported to the Company’s Corporate Security and Legal personnel, who will ensure appropriate investigation and follow-up of all calls. Callers are given a confidential identification number so they can inquire about the status of their reported concerns. The Worldwide Business Conduct Helpline is accessible to all employees. In compliance with the requirement under the SEBI (Listing Obligations and Disclosure Requirements) Regulations, 2015 and Section 177 of the Companies Act, 2013 and the Rules made thereunder, the Company has adopted the whistle blowing policy as the vigilance mechanism for Directors and employees to report genuine concerns or grievances such as unethical behaviour, actual or suspected fraud or violation of the Company’s code of conduct or ethics policy. The Audit Committee oversees the vigil mechanism and number of cases reported alongwith the status report and action taken (if any) are reported to the Committee. During the Financial Year, 16 complaints were received and same were dealt with in accordance with the Worldwide Business Conduct Manual.
Principle 2 : Safe Products & Product Lifecycle Sustainability
In order to improve lives, now and for generations to come, we ensure that our products, packaging and operations are safe for employees, consumers and the environment. We ensure this with a focus on technologies, processes and improvements that matter for the environment. Product quality and safety are of the utmost importance to your Company. Customers choose your Company because we provide products of superior quality and value that improve the lives of the world’s consumers. Just as we provide safe, quality products, we expect our suppliers to assure the quality and safety of the products and services they provide to us.
Your Company strives to deliver products with an improved environmental profile. To reduce the environmental impact of our products your Company uses life cycle analysis to understand where the biggest impact exists, so we know where to focus our innovation. Our deep understanding of the consumers enables us to develop sustainable products that will delight them, without tradeoffs in price or performance.
Your Company is focused on the environmental performance of our entire supply chain, including our own manufacturing facilities, our suppliers, and the logistics of our finished products. Your Company is focused on creating efficiencies in energy, water, waste, and emissions.
Our sustainability work goes beyond the core of our manufacturing operations, extending to a holistic end-to-end view of opportunities. We deliver strong results across the supply chain, ranging from manufacturing to finished product logistics — engaging our suppliers throughout the process.
• Manufacturing: Between the procurement of raw materials and the creation of a product, we strive to reduce waste, water, energy, and CO2 through systemic conservation efforts. We apply smart eco-design through innovative construction process improvements. And, we re-use where feasible, giving new life to what was once waste.
• Finished Product Logistics: In the logistics stage, we reduce waste in customization by applying more sustainable designs. We have also optimized our transportation efficiency by making changes to the rate, route, mode and method of transportation. We have focused on eliminating inefficiencies such as loading and unloading delays, rush transport up-charges, dead legs (empty trucks) and production line stops.
• Supplier Engagement: We collaborate closely with suppliers across the entire supply chain. We have implemented a supplier sustainability scorecard, which assesses the environmental footprint of our suppliers, enabling your Company to partner and help reduce the environmental impact along the supply chain.
Your Company ensures that it meets all applicable legislative and regulatory requirements related to product quality, safety and labeling.
During the Financial Year, our plant in Goa became a certified ‘zero waste to landfill’ site. 100% of the waste generated within plant is recycled.
Principle 3: Employees’ Well-Being
For your Company, people are its most valuable asset. Accordingly, we are committed to the highest standards of safety to protect the employees as well as external parties who work at or visit the Company sites.

21
Company Overview
Board’s Report
Management Discussion and Analysis
Corporate Governance
Financial Statements
Annual Report 2016-2017
Your Company is committed to-
• Providing harassment free and safe workingenvironment
• Providingequalopportunitiesinemployment
• Developingandretainingadiverseworkforce
Your Company forbids the use of child or forced labor in any of its operations or facilities. Your Company fully respects and follows all applicable labour laws.
Your Company respects every employee’s right to choose to join or not to join a trade union, or to have recognized employee representation in accordance with applicable law.
As on June 30, 2017, your Company had 362 employees, 65 permanent women employees and 250 persons engaged on temporary / contractual basis. During the Financial Year under review, the Company did not receive any complaints relating to child labour, forced labour, involuntary labour, sexual harassment or discriminatory employment. All the employees and persons engaged on temporary / contractual basis were given safety & skill up-gradation training.
Principle 4 : Stakeholder Engagement
Your Company actively engages with various internal & external stakeholders, which include, employees, consumers, customers, shareholders, external business partners and the government.
Your Company believes that only way to build a sustainable business is to improve lives. It engages with disadvantaged, vulnerable and marginalized stakeholders through its Corporate Social Responsibility initiatives, which include P&G Shiksha and Timely Disaster Relief.
Principle 5 : Human Rights
Our core values as a Company include treating everyone with respect. We have a strong non-discrimination policy and have zero tolerance for unlawful discrimination. The coalition advocates for all employees, regardless of race, religion, gender, sexuality, age or disability. We respect everyone’s right to be who they are, and want all employees to feel safe, included and able to bring their whole selves to work.
The Human Rights Policy statement extends to all the employees and all stakeholders associated with the Company. No complaints with respect to Human Rights
violation were received by the Company during the Financial Year under review.
Principle 6 : Environment Protection
Protecting the earth is both a responsibility and a business opportunity. Our goal is to create brands that enable consumers to make more sustainable choices. We have integrated sustainability into our business practices, operations, innovation, brand building and culture. The environment sustainability guidelines of the Company cover both the Company and other people associated with the Company. The details on Environmental Sustainability initiatives can be viewed at http://www.pg.com/en_IN/sustainability/environmental-sustainability.shtml.
Your Company had made a long-term environmental sustainability vision and 2020 goals in the year 2010 because it’s our responsibility to help solve some of the sustainability challenges that face the world.
Our complete visionary end-points are outlined below:
Long term Product end points:
• Using 100% renewable or recycled materials for allproducts and packaging
• Havingzeroconsumerwastegotolandfills
• Designing products to delight consumers whilemaximizing the conservation of resources
Long term Operational end points:
• Poweringourplantswith100%renewableenergy
• Emittingnofossil-basedCO2 or toxic emissions
• Deliveringeffluentwaterqualitythat isasgoodasorbetter than influent water quality with no contribution to water scarcity
• Havingzeromanufacturingwastegotolandfills
The emissions/waste generated by the Company are within the permissible limits given by CPCB/SPCB for the Financial Year under review.
Your Company’s Head Office at Mumbai reduced its annual energy consumption by over 21.2% over the last 15 years. During the Financial Year, our plant in Goa became a certified ‘zero waste to landfill’ site. In the last 5 years, the plant has reduced carbon emission by more than 90%. During this period, the plant has also achieved a 39% improvement in both energy and water consumption.
22 Procter & Gamble Hygiene and Health Care Limited
For your Company, sustainability inspires and guides everything we do. Moreover, we ensure environmental friendly practices at our sites. These include reduction in power consumption, optimal water consumption and eliminating excess use of paper.
Principle 7 : Policy Advocacy
As a corporate citizen, your Company often engages in efforts to affect legislation or government policy on issues that could impact our business and society at large. Your Company ensures that all its lobbying activities are consistent with our Purpose, Values & Principles (PVPs) and applicable laws.
Your Company is a member of various trade and chamber of associations, which include:
— Federation of Indian Chambers of Commerce & Industry
— Confederation of Indian Industry
— Feminine and Infant Hygiene Association of India
— American Chamber of Commerce in India
— India Home & Personal Care Industry Association
Some of the key issues on which your Company engaged with the Government in 2016-17 include:
— Solid Waste Management rules
— GST implementation
— Standard packaging rules
Principle 8 : Inclusive growth
Your Company believes that the only way to build a sustainable business is to improve lives. At P&G, sustainability means making every day better for people through how we innovate and how we act. As one of the world’s largest consumer products Company, we have both
a responsibility and an opportunity to do the right thing and create change. This strategy has inspired an enduring CSR strategy supported by two pillars – P&G Shiksha and Timely Disaster Relief. While P&G Shiksha provides children from underprivileged backgrounds with an access to a holistic education, P&G's disaster relief activities aim to rehabilitate and empower the victims of natural disasters by providing them with daily essential commodities and safe drinking water.
The Company has undertaken Corporate Social Responsibility initiatives during the Financial Year amounting to Rs. 10.80 Crores which are detailed in the Corporate Social Responsibility report which is appended as Annexure I to the Directors’ Report.
Principle 9 : Customer Value
We are committed to providing products and services that can help improve the lives of our consumers. In developing and marketing our products, we adopt a “Consumer Is Boss” approach to ensure that we delight consumers by launching new products and product improvements that genuinely meet their needs. We actively encourage consumers to contact us because we want to hear about our consumers’ experiences with our products.
Our aspiration is to serve the world’s consumers better than our best competitors, in every category where we choose to compete — creating superior shareholder value in the process. Innovation is at the heart of your Company’s business. It differentiates our brands vs. competition and prevents commoditization of our categories and brands. It’s how we delight consumers, create value with retail partners, and create new businesses. Your Company combines “what’s needed” with “what’s possible,” conducting hundreds of consumer research studies each year to understand what people need and want, in order to create superior value and product experience every day.

23
Company Overview
Board’s Report
Management Discussion and Analysis
Corporate Governance
Financial Statements
Annual Report 2016-2017
ANNEXURE III
Extract of Annual Return
Form No. MGT-9
(As on the Financial Year ended on June 30, 2017)
[Pursuant to Section 92(3) of the Companies Act, 2013 and Rule 12(1) of the Companies (Management and Administration) Rules, 2014]
I. REGISTRATION AND OTHER DETAILS:
i) CIN : L24239MH1964PLC012971
ii) Registration Date : July 20, 1964
iii) Name of the Company : Procter & Gamble Hygiene and Health Care Limited
iv) Category / Sub-Category of the Company : Company limited by shares/Indian Non-Government Company
v) Address of the Registered Office and contact details
: P & G Plaza, Cardinal Gracias Road, Chakala, Andheri (East), Mumbai - 400 099Tel: 022-2826 6000Fax: 022-2826 7303Website: www.pg.com/en_IN
vi) Whether Listed Company : Yes
vii) Name, Address and Contact details of Registrar and Transfer Agent, if any
: Link Intime India Private LimitedC-101, 247 Park, LBS Marg,Vikhroli (West), Mumbai 400 083 Tel – (022) 4918 6270 Fax – (022) 4918 6060e-mail – [email protected]
II. PRINCIPAL BUSINESS ACTIVITIES OF THE COMPANY:
Sr. No.
Name and Description of Products NIC Code of the Product
% to total turnover of the
Company
1 Ayurvedic products 21003 30
2 Sanitary napkins 13996 68
III. PARTICULARS OF HOLDING, SUBSIDIARY AND ASSOCIATE COMPANIES:
Holding Company [Section 2(46)]:
Sr. No.
Name and address of the Company CIN/GLN % of Shares held
1 The Procter & Gamble Company, USA(Ultimate holding Company)
Not applicable(Foreign Company)
Holds 70.64% through its subsidiaries
2 Procter & Gamble Overseas India B.V., Netherlands(Holding Company)
Not applicable(Foreign Company)
Holds 68.73% directly
The Company does not have any subsidiary companies or associate companies.
24 Procter & Gamble Hygiene and Health Care Limited
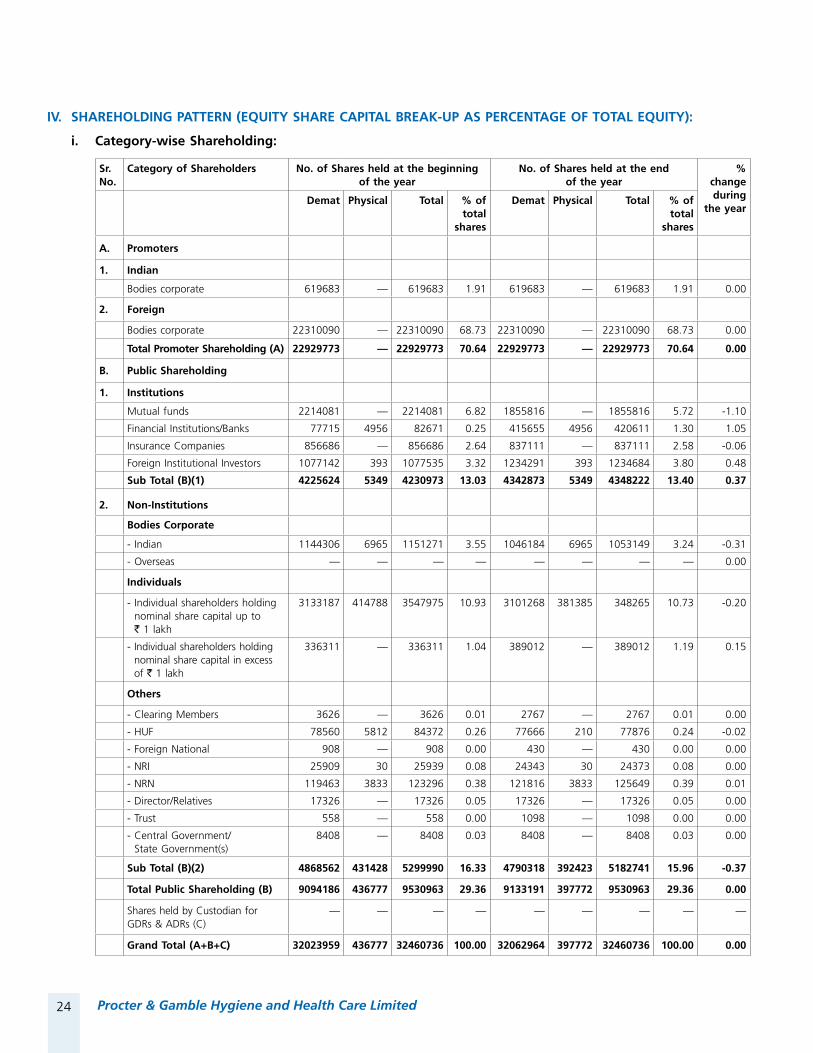
IV. SHAREHOLDING PATTERN (EQUITY SHARE CAPITAL BREAK-UP AS PERCENTAGE OF TOTAL EQUITY):
i. Category-wise Shareholding:
Sr. No.
Category of Shareholders No. of Shares held at the beginning of the year
No. of Shares held at the end of the year
% change during
the yearDemat Physical Total % of
total shares
Demat Physical Total % of total
shares
A. Promoters
1. Indian
Bodies corporate 619683 — 619683 1.91 619683 — 619683 1.91 0.00
2. Foreign
Bodies corporate 22310090 — 22310090 68.73 22310090 — 22310090 68.73 0.00
Total Promoter Shareholding (A) 22929773 — 22929773 70.64 22929773 — 22929773 70.64 0.00
B. Public Shareholding
1. Institutions
Mutual funds 2214081 — 2214081 6.82 1855816 — 1855816 5.72 -1.10
Financial Institutions/Banks 77715 4956 82671 0.25 415655 4956 420611 1.30 1.05
Insurance Companies 856686 — 856686 2.64 837111 — 837111 2.58 -0.06
Foreign Institutional Investors 1077142 393 1077535 3.32 1234291 393 1234684 3.80 0.48
Sub Total (B)(1) 4225624 5349 4230973 13.03 4342873 5349 4348222 13.40 0.37
2. Non-Institutions
Bodies Corporate
- Indian 1144306 6965 1151271 3.55 1046184 6965 1053149 3.24 -0.31
- Overseas — — — — — — — — 0.00
Individuals
- Individual shareholders holding nominal share capital up to ` 1 lakh
3133187 414788 3547975 10.93 3101268 381385 348265 10.73 -0.20
- Individual shareholders holding nominal share capital in excess of ` 1 lakh
336311 — 336311 1.04 389012 — 389012 1.19 0.15
Others
- Clearing Members 3626 — 3626 0.01 2767 — 2767 0.01 0.00
- HUF 78560 5812 84372 0.26 77666 210 77876 0.24 -0.02
- Foreign National 908 — 908 0.00 430 — 430 0.00 0.00
- NRI 25909 30 25939 0.08 24343 30 24373 0.08 0.00
- NRN 119463 3833 123296 0.38 121816 3833 125649 0.39 0.01
- Director/Relatives 17326 — 17326 0.05 17326 — 17326 0.05 0.00
- Trust 558 — 558 0.00 1098 — 1098 0.00 0.00
- Central Government/ State Government(s)
8408 — 8408 0.03 8408 — 8408 0.03 0.00
Sub Total (B)(2) 4868562 431428 5299990 16.33 4790318 392423 5182741 15.96 -0.37
Total Public Shareholding (B) 9094186 436777 9530963 29.36 9133191 397772 9530963 29.36 0.00
Shares held by Custodian for GDRs & ADRs (C)
— — — — — — — — —
Grand Total (A+B+C) 32023959 436777 32460736 100.00 32062964 397772 32460736 100.00 0.00
25
Company Overview
Board’s Report
Management Discussion and Analysis
Corporate Governance
Financial Statements
Annual Report 2016-2017
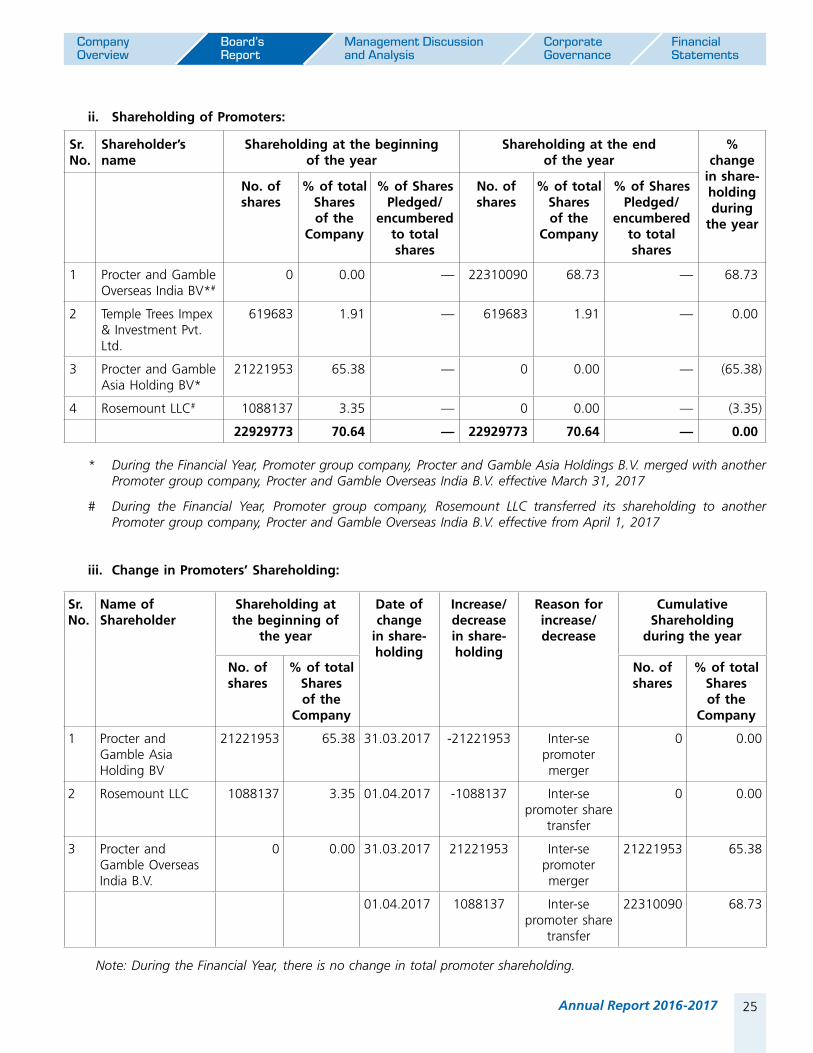
ii. Shareholding of Promoters:
Sr. No.
Shareholder’s name
Shareholding at the beginning of the year
Shareholding at the end of the year
% change
in share- holding during
the year
No. of shares
% of total Shares of the
Company
% of Shares Pledged/
encumbered to total shares
No. of shares
% of total Shares of the
Company
% of Shares Pledged/
encumbered to total shares
1 Procter and Gamble Overseas India BV*#
0 0.00 — 22310090 68.73 — 68.73
2 Temple Trees Impex & Investment Pvt. Ltd.
619683 1.91 — 619683 1.91 — 0.00
3 Procter and Gamble Asia Holding BV*
21221953 65.38 — 0 0.00 — (65.38)
4 Rosemount LLC# 1088137 3.35 — 0 0.00 — (3.35)
22929773 70.64 — 22929773 70.64 — 0.00
* During the Financial Year, Promoter group company, Procter and Gamble Asia Holdings B.V. merged with another Promoter group company, Procter and Gamble Overseas India B.V. effective March 31, 2017
# During the Financial Year, Promoter group company, Rosemount LLC transferred its shareholding to another Promoter group company, Procter and Gamble Overseas India B.V. effective from April 1, 2017
iii. Change in Promoters’ Shareholding:
Sr. No.
Name of Shareholder
Shareholding at the beginning of
the year
Date of change
in share- holding
Increase/decrease in share- holding
Reason for increase/decrease
Cumulative Shareholding
during the year
No. of shares
% of total Shares of the
Company
No. of shares
% of total Shares of the
Company
1 Procter and Gamble Asia Holding BV
21221953 65.38 31.03.2017 -21221953 Inter-se promoter merger
0 0.00
2 Rosemount LLC 1088137 3.35 01.04.2017 -1088137 Inter-se promoter share
transfer
0 0.00
3 Procter and Gamble Overseas India B.V.
0 0.00 31.03.2017 21221953 Inter-se promoter merger
21221953 65.38
01.04.2017 1088137 Inter-se promoter share
transfer
22310090 68.73
Note: During the Financial Year, there is no change in total promoter shareholding.

26 Procter & Gamble Hygiene and Health Care Limited
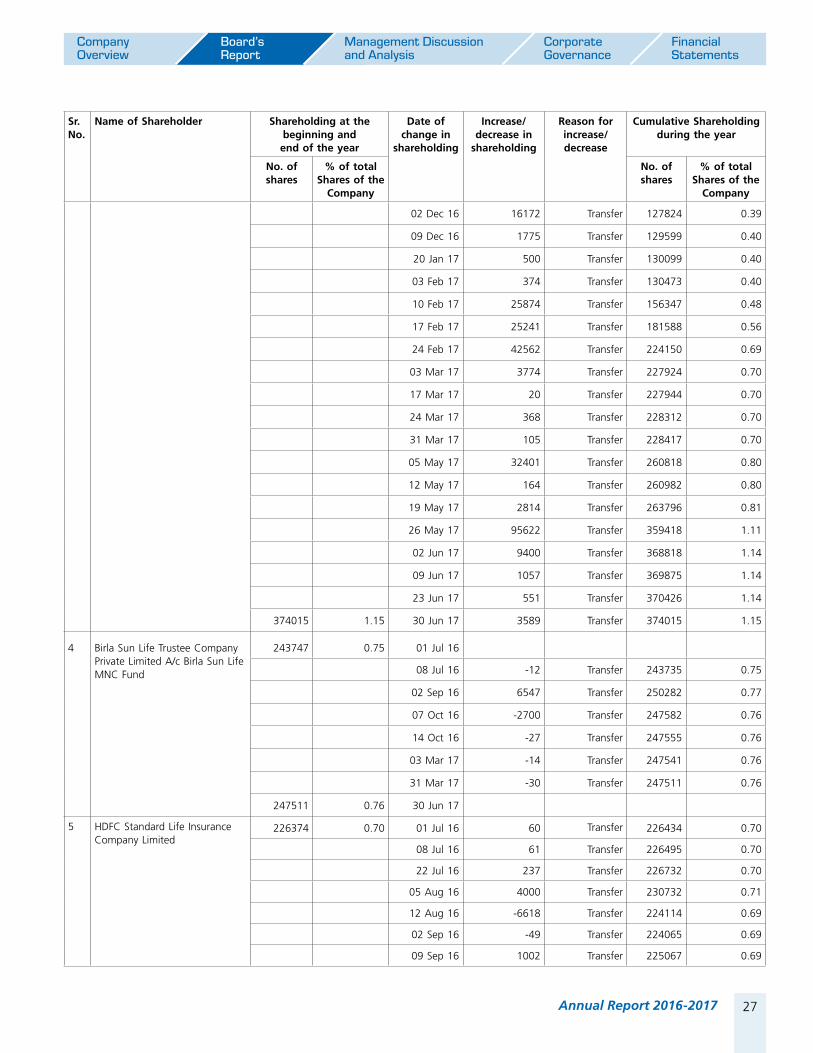
iv. Shareholding Pattern of top ten Shareholders (other than Directors, Promoters and Holders of GDRs and ADRs) as on June 30, 2017:
Sr. No.
Name of Shareholder Shareholding at the beginning and end of the year
Date of change in
shareholding
Increase/decrease in
shareholding
Reason for increase/decrease
Cumulative Shareholding during the year
No. of shares
% of total Shares of the
Company
No. of shares
% of total Shares of the
Company
1 SBI Emerging Businesses Fund 966045 2.98 01 Jul 16
15 Jul 16 -4000 Transfer 962045 2.96
29 Jul 16 -175 Transfer 961870 2.96
04 Nov 16 5 Transfer 961875 2.96
11 Nov 16 5 Transfer 961880 2.96
18 Nov 16 -730 Transfer 961150 2.96
25 Nov 16 -14570 Transfer 946580 2.92
02 Dec 16 2780 Transfer 949360 2.92
09 Dec 16 420 Transfer 949780 2.93
16 Dec 16 -10000 Transfer 939780 2.90
23 Dec 16 -2000 Transfer 937780 2.89
17 Feb 17 -3500 Transfer 934280 2.88
07 Apr 17 3 Transfer 934283 2.88
21 Apr 17 -852 Transfer 933431 2.88
28 Apr 17 -4600 Transfer 928831 2.86
05 May 17 -35925 Transfer 892906 2.75
12 May 17 67 Transfer 892973 2.75
19 May 17 62 Transfer 893035 2.75
26 May17 62 Transfer 893097 2.75
02 Jun 17 23 Transfer 893120 2.75
09 Jun 17 6 Transfer 893126 2.75
23 Jun 17 14500 Transfer 907626 2.80
907626 2.80 30 Jun 17
2 General Insurance Corporation of India
517195 1.59 01 Jul 16 — No change during the year
517195 1.59
517195 1.59 30 Jun 17
3 Life Insurance Corporation of India**
0 0.00 01 Jul 16
09 Sep 16 15500 Transfer 15500 0.05
16 Sep 16 35080 Transfer 50580 0.16
23 Sep 16 30331 Transfer 80911 0.25
07 Oct 16 1410 Transfer 82321 0.25
14 Oct 16 5002 Transfer 87323 0.27
21 Oct 16 5739 Transfer 93062 0.29
28 Oct 16 6169 Transfer 99231 0.31
04 Nov 16 2816 Transfer 102047 0.31
11 Nov 16 9605 Transfer 111652 0.34
27
Company Overview
Board’s Report
Management Discussion and Analysis
Corporate Governance
Financial Statements
Annual Report 2016-2017
Sr. No.
Name of Shareholder Shareholding at the beginning and end of the year
Date of change in
shareholding
Increase/decrease in
shareholding
Reason for increase/decrease
Cumulative Shareholding during the year
No. of shares
% of total Shares of the
Company
No. of shares
% of total Shares of the
Company
02 Dec 16 16172 Transfer 127824 0.39
09 Dec 16 1775 Transfer 129599 0.40
20 Jan 17 500 Transfer 130099 0.40
03 Feb 17 374 Transfer 130473 0.40
10 Feb 17 25874 Transfer 156347 0.48
17 Feb 17 25241 Transfer 181588 0.56
24 Feb 17 42562 Transfer 224150 0.69
03 Mar 17 3774 Transfer 227924 0.70
17 Mar 17 20 Transfer 227944 0.70
24 Mar 17 368 Transfer 228312 0.70
31 Mar 17 105 Transfer 228417 0.70
05 May 17 32401 Transfer 260818 0.80
12 May 17 164 Transfer 260982 0.80
19 May 17 2814 Transfer 263796 0.81
26 May 17 95622 Transfer 359418 1.11
02 Jun 17 9400 Transfer 368818 1.14
09 Jun 17 1057 Transfer 369875 1.14
23 Jun 17 551 Transfer 370426 1.14
374015 1.15 30 Jun 17 3589 Transfer 374015 1.15
4 Birla Sun Life Trustee Company Private Limited A/c Birla Sun Life MNC Fund
243747 0.75 01 Jul 16
08 Jul 16 -12 Transfer 243735 0.75
02 Sep 16 6547 Transfer 250282 0.77
07 Oct 16 -2700 Transfer 247582 0.76
14 Oct 16 -27 Transfer 247555 0.76
03 Mar 17 -14 Transfer 247541 0.76
31 Mar 17 -30 Transfer 247511 0.76
247511 0.76 30 Jun 17
5 HDFC Standard Life Insurance Company Limited
226374 0.70 01 Jul 16 60 Transfer 226434 0.70
08 Jul 16 61 Transfer 226495 0.70
22 Jul 16 237 Transfer 226732 0.70
05 Aug 16 4000 Transfer 230732 0.71
12 Aug 16 -6618 Transfer 224114 0.69
02 Sep 16 -49 Transfer 224065 0.69
09 Sep 16 1002 Transfer 225067 0.69
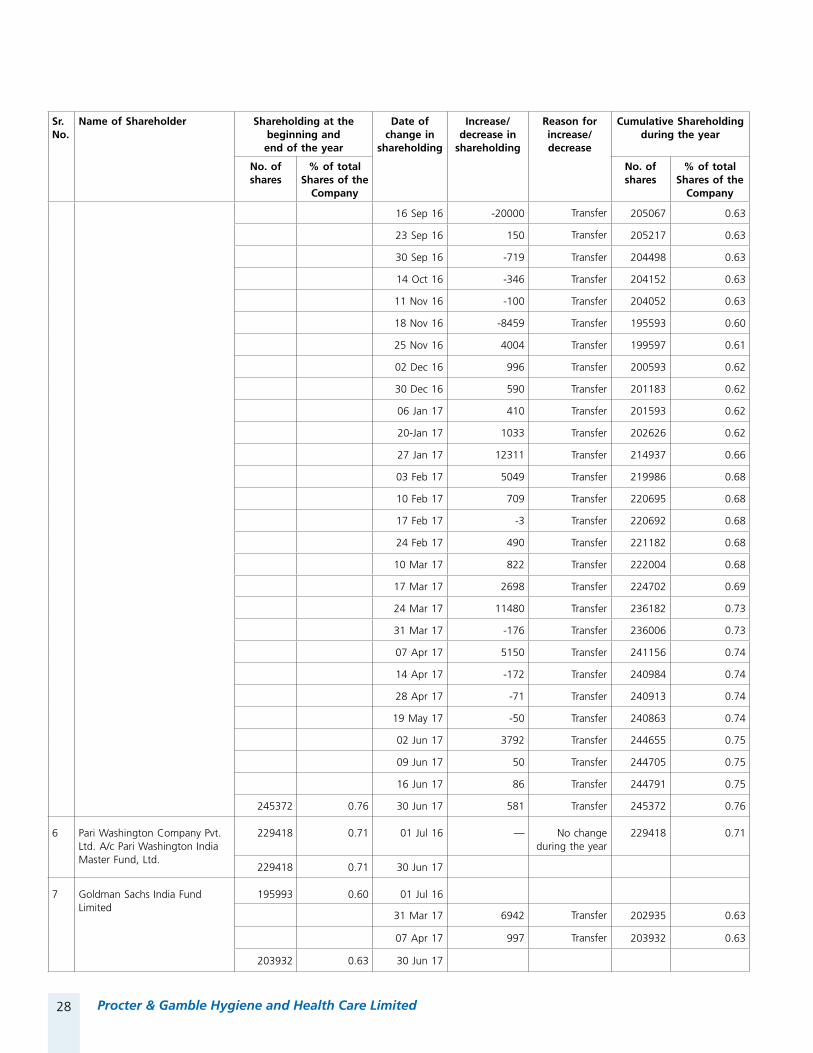
28 Procter & Gamble Hygiene and Health Care Limited
Sr. No.
Name of Shareholder Shareholding at the beginning and end of the year
Date of change in
shareholding
Increase/decrease in
shareholding
Reason for increase/decrease
Cumulative Shareholding during the year
No. of shares
% of total Shares of the
Company
No. of shares
% of total Shares of the
Company
16 Sep 16 -20000 Transfer 205067 0.63
23 Sep 16 150 Transfer 205217 0.63
30 Sep 16 -719 Transfer 204498 0.63
14 Oct 16 -346 Transfer 204152 0.63
11 Nov 16 -100 Transfer 204052 0.63
18 Nov 16 -8459 Transfer 195593 0.60
25 Nov 16 4004 Transfer 199597 0.61
02 Dec 16 996 Transfer 200593 0.62
30 Dec 16 590 Transfer 201183 0.62
06 Jan 17 410 Transfer 201593 0.62
20-Jan 17 1033 Transfer 202626 0.62
27 Jan 17 12311 Transfer 214937 0.66
03 Feb 17 5049 Transfer 219986 0.68
10 Feb 17 709 Transfer 220695 0.68
17 Feb 17 -3 Transfer 220692 0.68
24 Feb 17 490 Transfer 221182 0.68
10 Mar 17 822 Transfer 222004 0.68
17 Mar 17 2698 Transfer 224702 0.69
24 Mar 17 11480 Transfer 236182 0.73
31 Mar 17 -176 Transfer 236006 0.73
07 Apr 17 5150 Transfer 241156 0.74
14 Apr 17 -172 Transfer 240984 0.74
28 Apr 17 -71 Transfer 240913 0.74
19 May 17 -50 Transfer 240863 0.74
02 Jun 17 3792 Transfer 244655 0.75
09 Jun 17 50 Transfer 244705 0.75
16 Jun 17 86 Transfer 244791 0.75
245372 0.76 30 Jun 17 581 Transfer 245372 0.76
6 Pari Washington Company Pvt. Ltd. A/c Pari Washington India Master Fund, Ltd.
229418 0.71 01 Jul 16 — No change during the year
229418 0.71
229418 0.71 30 Jun 17
7 Goldman Sachs India Fund Limited
195993 0.60 01 Jul 16
31 Mar 17 6942 Transfer 202935 0.63
07 Apr 17 997 Transfer 203932 0.63
203932 0.63 30 Jun 17
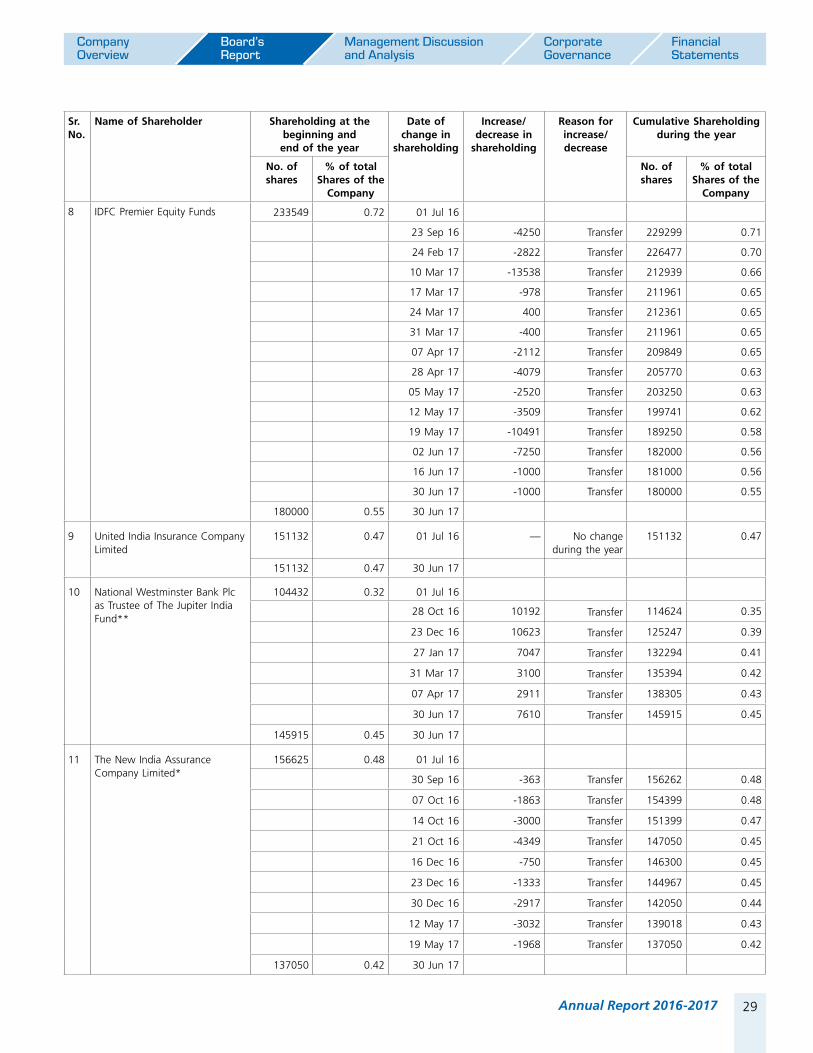
29
Company Overview
Board’s Report
Management Discussion and Analysis
Corporate Governance
Financial Statements
Annual Report 2016-2017
Sr. No.
Name of Shareholder Shareholding at the beginning and end of the year
Date of change in
shareholding
Increase/decrease in
shareholding
Reason for increase/decrease
Cumulative Shareholding during the year
No. of shares
% of total Shares of the
Company
No. of shares
% of total Shares of the
Company
8 IDFC Premier Equity Funds 233549 0.72 01 Jul 16
23 Sep 16 -4250 Transfer 229299 0.71
24 Feb 17 -2822 Transfer 226477 0.70
10 Mar 17 -13538 Transfer 212939 0.66
17 Mar 17 -978 Transfer 211961 0.65
24 Mar 17 400 Transfer 212361 0.65
31 Mar 17 -400 Transfer 211961 0.65
07 Apr 17 -2112 Transfer 209849 0.65
28 Apr 17 -4079 Transfer 205770 0.63
05 May 17 -2520 Transfer 203250 0.63
12 May 17 -3509 Transfer 199741 0.62
19 May 17 -10491 Transfer 189250 0.58
02 Jun 17 -7250 Transfer 182000 0.56
16 Jun 17 -1000 Transfer 181000 0.56
30 Jun 17 -1000 Transfer 180000 0.55
180000 0.55 30 Jun 17
9 United India Insurance Company Limited
151132 0.47 01 Jul 16 — No change during the year
151132 0.47
151132 0.47 30 Jun 17
10 National Westminster Bank Plc as Trustee of The Jupiter India Fund**
104432 0.32 01 Jul 16
28 Oct 16 10192 Transfer 114624 0.35
23 Dec 16 10623 Transfer 125247 0.39
27 Jan 17 7047 Transfer 132294 0.41
31 Mar 17 3100 Transfer 135394 0.42
07 Apr 17 2911 Transfer 138305 0.43
30 Jun 17 7610 Transfer 145915 0.45
145915 0.45 30 Jun 17
11 The New India Assurance Company Limited*
156625 0.48 01 Jul 16
30 Sep 16 -363 Transfer 156262 0.48
07 Oct 16 -1863 Transfer 154399 0.48
14 Oct 16 -3000 Transfer 151399 0.47
21 Oct 16 -4349 Transfer 147050 0.45
16 Dec 16 -750 Transfer 146300 0.45
23 Dec 16 -1333 Transfer 144967 0.45
30 Dec 16 -2917 Transfer 142050 0.44
12 May 17 -3032 Transfer 139018 0.43
19 May 17 -1968 Transfer 137050 0.42
137050 0.42 30 Jun 17

30 Procter & Gamble Hygiene and Health Care Limited
Sr. No.
Name of Shareholder Shareholding at the beginning and end of the year
Date of change in
shareholding
Increase/decrease in
shareholding
Reason for increase/decrease
Cumulative Shareholding during the year
No. of shares
% of total Shares of the
Company
No. of shares
% of total Shares of the
Company
12 UTI – Dividend Yield Fund* 145037 0.45 01 Jul 16
02 Sep 16 11200 Transfer 156237 0.48
09 Sep 16 6000 Transfer 162237 0.50
16 Sep 16 16748 Transfer 178985 0.55
23 Sep 16 851 Transfer 179836 0.55
25 Nov 16 -2700 Transfer 177136 0.55
02 Dec 16 -4500 Transfer 172636 0.53
09 Dec 16 -651 Transfer 171985 0.53
16 Dec 16 -49 Transfer 171936 0.53
23 Dec 16 200 Transfer 172136 0.53
30 Dec 16 3356 Transfer 175492 0.54
10 Feb 17 -3600 Transfer 171892 0.53
17 Feb 17 -31500 Transfer 140392 0.43
03 Mar 17 -500 Transfer 139892 0.43
10 Mar 17 -895 Transfer 138997 0.43
31 Mar 17 -900 Transfer 138097 0.43
05 May 17 2928 Transfer 141025 0.43
02 Jun 17 -709 Transfer 140316 0.43
140316 0.43 30 Jun 17
13 HDFC Trustee Company Limited – HDFC Tax Saverfund*
197688 0.61 01 Jul 16
08 Jul 16 -10500 Transfer 187188 0.58
22 Jul 16 -263 Transfer 186925 0.58
05 Aug 16 -19000 Transfer 167925 0.52
12 Aug 16 -70400 Transfer 97525 0.30
19 Aug 16 -10000 Transfer 87525 0.27
26 Aug 16 -2200 Transfer 85325 0.26
02 Sep 16 -8800 Transfer 76525 0.24
09 Sep 16 -31050 Transfer 45475 0.14
16 Sep 16 -16632 Transfer 28843 0.09
23 Sep 16 -17000 Transfer 11843 0.04
30 Sep 16 -9400 Transfer 2443 0.01
07 Oct 16 -2443 Transfer 0 0.00
0 0.00 30 Jun 17
Note: The above information is based on the weekly beneficiary position received from Depositories.
* Ceased to be in the list of Top 10 shareholders as on June 30, 2017. The same is reflected above since the shareholder was one of the Top 10
shareholder as on July 1, 2016.
** Not in the list of Top 10 shareholders as on July 1, 2016. The same has been reflected above since the shareholder was one of the Top 10
shareholders as on June 30, 2017.

31
Company Overview
Board’s Report
Management Discussion and Analysis
Corporate Governance
Financial Statements
Annual Report 2016-2017
v. Shareholding of Directors and Key Managerial Personnel
Sr. No.
Name of the Directors / Key Managerial Personnel
Shareholding at the beginning and end of
the year
Date of change in
shareholding
Increase/decrease in
shareholding
Reason for increase/decrease
Cumulative Shareholding
during the year
No. of Shares
% of total Shares of the Company
No. of Shares
1. Mr. R. A. Shah 12906 0.04 01 July, 2016 — No change during the year
12906
12906 0.04 30 June, 2017
2. Mr. B. S. Mehta 3799 0.01 01 July, 2016 — No change during the year
3799
3799 0.01 30 June, 2017
Note: No other Director apart from the above mentioned Directors, held any shares of the Company during the Financial Year 2016-2017.
V. INDEBTEDNESS:
The Company had no indebtedness with respect to secured or unsecured loans or deposits during the Financial Year 2016-17.
VI. REMUNERATION OF DIRECTORS AND KEY MANAGERIAL PERSONNEL:
A. REMUNERATION TO MANAGING DIRECTOR
Sr. No.
Particulars of Remuneration Mr. Al Rajwani Managing Director(Amount in ` lakhs)
1. Gross salary
(a) Salary as per provisions contained in Section 17(1) of the Income-tax Act, 1961
(b) Value of perquisites u/s 17(2) Income-tax Act, 1961
(c) Profits in lieu of salary under Section 17(3) Income-tax Act, 1961
1,105.14 — —
2. Stock Option —
3. Sweat Equity —
4. Commission
– as % of profit
– Others.
— —
5. Others, please specify* 324.82
Total (A) 1,429.96
Ceiling as per the Act 3,358.40
* All employees of the Company are given the right to purchase shares of the ultimate Holding Company – The Procter & Gamble Company, USA under its ‘International Stock Ownership Plan.’ Certain employees of the Company are also entitled to Stock Option of the ultimate Holding Company under its Employee Stock Option Plan. Details of the same are disclosed vide Note 31 forming part of the Financial Statements.

32 Procter & Gamble Hygiene and Health Care Limited
B. REMUNERATION TO OTHER DIRECTORS
` in lakhs
Particulars of Remuneration Mr. R. A. Shah Mr. B. S. Mehta Mr. A. K. Gupta Total Amount
Independent Directors
Fee for attending Board / Committee meetings
2.90 2.60 3.80 9.30
Commission 11.00 11.00 11.00 33.00
Total 13.90 13.60 14.80 42.30
Ceiling as per the Act
(1% of Net Profits of the Company calculated as per Section 198 of the Companies Act, 2013)
671.68
C. REMUNERATION TO KEY MANAGERIAL PERSONNEL OTHER THAN MANAGING DIRECTOR/MANAGER/WHOLE-TIME DIRECTOR
` in lakhs
Sr. No.
Particulars of Remuneration Ms. Preeti Bishnoi$ Company Secretary
Mr. Ishan Sonthalia^ Company Secretary
Mr. Prashant Bhatnagar#
Chief Financial Officer
1. Gross salary
(a) Salary as per provisions contained in Section 17(1) of the Income-tax Act, 1961 — 5.95 43.11
(b) Value of perquisites u/s 17(2) of the Income-tax Act, 1961 3.64 3.31 2.83
(c) Profits in lieu of salary under Section 17(3) of the Income-tax Act, 1961 — — —
2. Stock Option — — —
3. Sweat Equity — — —
4. Commission– as % of profit– others, specify
— — —
5. Others, please specify — — —
Total 3.64 9.26 45.94
$ Ms. Preeti Bishnoi ceased to be Company Secretary of the Company effective January 19, 2017. Ms. Bishnoi received remuneration from P&G Geneva. Certain perquisites have been charged to the Company during the year.
^ Mr. Ishan Sonthalia was appointed as Company Secretary of the Company effective May 5, 2017.
# Mr. Prashant Bhatnagar receives remuneration from Gillette India Limited, and the Company reimburses towards the same in proportion to its Net Outside Sales.
VII. PENALTIES/PUNISHMENT/COMPOUNDING OF OFFENCES:
There were no penalties / punishment / compounding of offences for breach of any section of the Companies Act against the Company or its Directors or other officers in default during the Financial Year.

33
Company Overview
Board’s Report
Management Discussion and Analysis
Corporate Governance
Financial Statements
Annual Report 2016-2017
ANNEXURE IV
Statement of Disclosure of Remuneration under Section 197 of the Companies Act, 2013 and Rule 5(1) of Companies (Appointment and Remuneration of Managerial Personnel) Rules, 2014
i. Ratio of remuneration of each Director to the median remuneration of the employees of the Company for the Financial Year:
Name of Director DesignationSalary
` in lakhsCommission ` in lakhs
Sitting Fees ` in lakhs
Total ` in lakhs
Ratio
Mr. Al Rajwani Managing Director 1429.96 — — 1429.96 94.56
Mr. R. A. Shah Independent Director — 11.00 2.90 13.90 0.92
Mr. B. S. Mehta Independent Director — 11.00 2.60 13.60 0.90
Mr. A. K. Gupta Independent Director — 11.00 3.80 14.80 0.98
Mr. P. Agarwal Non-Executive Director — — — 0 0
Mr. S. Singh Rathore Non-Executive Director — — — 0 0
Ms. S. Dhawan Non-Executive Director — — — 0 0
Mr. K. Natarajan Non-Executive Director — — — 0 0
ii. % increase in remuneration of each Director, Chief Financial Officer, Chief Executive Officer, Company Secretary or Manager, if any, in the Financial Year:
Designation Name of Employee % increase in remuneration
Managing Director Mr. Al Rajwani 3.35%*
Company Secretary Mr. Ishan Sonthalia Not Applicable**
Chief Financial Officer Mr. Prashant Bhatnagar 9.51%
* This is a currency neutral base salary increase versus previous year
** Mr. Ishan Sonthalia was not the Company Secretary of the Company in the Financial Year 2015-16, hence % increase in
remuneration cannot be computed.
iii. The % increase in the median remuneration of employees in the Financial Year is 6.4%.
iv. The number of permanent employees on the rolls of Company is 362.
v. Average percentile increase already made in the salaries of employees other than the managerial personnel in the last Financial Year and its comparison with the percentile increase in the managerial remuneration and justification thereof and point out if there are any exceptional circumstances for increase in the managerial remuneration:
The average percentage increase made in the salaries of employees other than the managerial personnel in the Financial Year was 6.4% whereas the increase in managerial remuneration was 12.69%. The average increase every year is an outcome of Company’s market competitiveness as against peer group companies.
vi. We affirm that the remuneration is as per the remuneration policy of the Company.
34 Procter & Gamble Hygiene and Health Care Limited
ANNEXURE V
Nomination & Remuneration Policy and its Framework
1. CHARTER
This charter governs the formation and operation of the Nomination and Remuneration Committee (the ‘Committee’) of Procter & Gamble Hygiene and Health Care Limited (the ‘Company’).
2. INTRODUCTION
The Company believes in conducting its affairs in a non-discriminatory and transparent manner by adopting highest standards of professionalism and good corporate governance practices. The Company believes that a good corporate governance system is necessary to ensure its long term success. The Company ensures good governance through the implementation of effective policies and procedures, which is mandated and regularly reviewed by the Board and/or the Committees of the members of the Board.
3. FORMATION OF COMMITTEE
The Nomination and Remuneration Committee of the Company was constituted on August 12, 2014 consisting of 3 Directors. The Committee and Nomination and Remuneration Policy (the ‘Policy’) is in compliance with all applicable provisions of the Companies Act, 2013, particularly Section 178 read together with the applicable rules thereto and Clause 49 of the Listing Agreement.
4. CONSTITUTION OF THE COMMITTEE
4.1 The Committee shall consist of a minimum 3 non-executive directors, majority of them being independent.
4.2 Term of the Committee shall be continued unless terminated by the Board of Directors.
4.3 Chairman of the Committee shall be an Independent Director. The Chairperson of the Company may be appointed as a member of the Committee but shall not be the Chairman of the Committee.
5. QUORUM & MEETINGS
Minimum two (2) members shall constitute a quorum for a Committee meeting. In the event only two (2) members are present, the unanimous vote of the two (2) members shall constitute an act of the Committee.
In case of an equality of votes, the Chairman shall have a second or casting vote. Where the Committee comprises of more than two (2) members, the act of a majority of the members present will constitute an act of the Committee.
The Committee shall meet at least twice in a Financial Year, with additional meetings when circumstances require, as determined by the Committee Chairman.
6. MINUTES
Minutes of each meeting will be prepared by or under the direction of the Company Secretary. The Company Secretary shall maintain a permanent record of the minutes of the meeting/s, and shall distribute minutes to members of the Committee as also directors who are not members of the Committee.
7. REPORTING AND DISCLOSURE
The Company Secretary or any other person nominated by the Board shall apprise the Board at its next meeting or earlier, if required by the law, of all material matters and recommendations proposed by the Committee from time to time.
Membership of the Committee, brief description of term of reference, programs under corporate social responsibility and attendance of the member of the Committee during the year shall be disclosed in the Annual Report.
8. SECRETARY
The Company Secretary of the Company shall act as Secretary of the Committee.
9. FUNCTIONS OF THE COMMITTEE
9.1 Corporate Governance: To ensure that the Board is comprised of directors who contribute to the successful management of the Company and discharge their duties having regard to the law and the highest standards of Corporate Governance;
9.2 Board diversity: Review the composition of the Board and devise a policy on Board diversity;
9.3 Appointment Criteria: To formulate criteria for determining qualifications, positive attributes and independence of a director and to identify persons who are qualified to become directors and who may be appointed in senior management in

35
Company Overview
Board’s Report
Management Discussion and Analysis
Corporate Governance
Financial Statements
Annual Report 2016-2017
accordance with the criteria laid down and recommend the Board of their appointment and removal;
9.4 Appointment of Independent Directors: To formulate the criteria for evaluation of independent directors on the Board;
9.5 Remuneration Policy: To review and recommend to the Board the overall strategies in relation to executive and non-executive remuneration policies;
9.6 Performance evaluation: To carry out evaluation of every director’s performance
10. REVIEW
The Committee shall review and reassess the framework and the Policy, on an annual basis and obtain the approval of the Board of Directors, for any changes/amendment in the framework/policy.
NOMINATION AND REMUNERATION POLICY
1. PREFACE
The Nomination and Remuneration Policy (‘Policy’) for members of the Board of Directors, Key Managerial Personnel and Senior Management of the Company is designed to attract, motivate and retain leadership members in a competitive and international market. The Policy reflects the Company’s objectives for good corporate governance as well as sustained long-term value creation for shareholders.
2. POLICY IS APPLICABLE TO:
Persons Covered
Directors Key Managerial Senior Management
Chief Executive Officer
Managing Director
Manager
Employees
Designated as
Vice President and
above
Company Secretary
Whole Time Director
Chief Financial Officer
3.1 GUIDING PRINCIPLES – Key Management Personnel Compensation
Our fundamental and overriding objective is to create value for our shareholders at leadership levels on a consistent long-term basis. To accomplish this goal, the global guidelines on executive compensation programs provide the following guiding principles:
1. Emphasize Pay for Performance
Aligning incentives with business strategies to reward executives who achieve or exceed Company, business unit, and individual goals, while discouraging excessive risk-taking by removing any incentive to focus on a single performance goal to the detriment of others.
2. Pay Competitively
Set target compensation opportunities to be competitive with other multinational corporations of similar size, value, and complexity.
3. Focus on Long-Term Success
Include equity as a cornerstone of our executive pay programs and by using a combination of short-term and long-term incentives to ensure a strong connection between Company performance and actual compensation realized.
3.2 GUIDING PRINCIPLES – Compensation to Independent Directors
1. Ensure compliance with local laws
Compensation to Independent Directors cannot exceed the threshold provided under local law as per the Companies Act.
2. Pay Competitively in line with peer companies
Target compensation to be competitive with other corporations of similar size, value, and complexity.
The Company will undertake periodic exercise to benchmark the pay-out of key peer/ same sector companies.
4. REMUNERATION OF EXECUTIVE DIRECTORS, KEY MANAGERIAL PERSONNEL AND SENIOR MANAGEMENT (“EXECUTIVE EMPLOYEE”)
The Human Resources department will determine remuneration criteria and recommend the same to the Board, using the above guiding principles.
36 Procter & Gamble Hygiene and Health Care Limited
i SALARY: Each executive employee will be entitled to receive a salary which will be competitive and based on executive’s responsibilities and performance;
ii SHORT TERM INCENTIVES: Based on the achievement of an individual, pre-defined financial and strategic business targets presented by the Committee and ratified by the Board of Directors;
iii LONG TERM INCENTIVES: Each Executive Employee will be entitled to receive long term incentives, as per the global guidelines and as recommended by the Management, from time to time;
iv SEVERANCE PAY AND PENSION CONTRIBUTION: As per employment terms;
v OTHER BENEFITS: Executive employees will be entitled to insurance policy(s), pension scheme and such other benefits as the Company may provide from time to time.
5. RATIFICATION OF REMUNERATION TO KEY MANAGEMENT PERSONNEL
The committee will bi-annually ratify the remuneration of the Key Management Personnel.
6. MAXIMUM MANAGERIAL REMUNERATION
The total managerial remuneration payable by the Company, to its directors, including managing director and whole-time director and non executive directors shall be within the limits as prescribed under the law.
7. REMUNERATION OF INDEPENDENT DIRECTOR
The Company will remunerate Independent Directors in a manner designed to attract and maintain high quality Board members. Independent Directors are paid remuneration by way of commission and/or sitting fees. The Company may pay a sitting fee per meeting to Independent Directors for attending Board meetings within the limits prescribed under law. Further, if the shareholders approve, commission may be paid to Independent Directors including Independent Directors within the statutory monetary limits. Such commission is paid on a uniform basis to reinforce the principle of collective responsibility.
The remuneration of Independent Directors is consistent with and supportive of maintaining the Independent Director’s independence.
8. POLICY AND PROCEDURE FOR SELECTION AND APPOINTMENT OF NEW DIRECTORS
(A) The selection criteria for the appointment and re-appointment of directors will normally be based on an analysis of the composition of the existing Board, its skill and experience and its independence requirements.
Factors to be considered when reviewing a potential candidate for Board appointment include without limitation:
• The skills, experience, expertise and personalqualities that will best complement Board effectiveness;
• The capability of the candidate to devote the necessary time and commitment to the role. This involves a consideration of matters such as other Board or executive appointments;
• Potentialconflictsofinterest,andindependencein accordance with the Companies Act, 2013 and the SEBI Regulations, as specified and applicable from time to time.
(B) Each director will prior to their appointment provide to the Company sufficient information to allow the Board to adequately assess the independence of the director. Directors should ensure that updated information is provided to the Board if the circumstances relating to the assessment of their independent status changes.
(C) The identification of potential directorial candidates may be assisted by the use of external search organisations as appropriate.
9. EVALUATION
9.1 Evaluation of Key Managerial Personnel
• The Managing Director performs theevaluation of performance on an annual basis.
• The Managing Director does a review of theperformance based on the efforts put in by the employee, results achieved against the goals set, and impact of external/internal factors.
• Theperformance reviewwill also include thereview of remuneration of the KMP.

37
Company Overview
Board’s Report
Management Discussion and Analysis
Corporate Governance
Financial Statements
Annual Report 2016-2017
9.2 Evaluation of Independent Directors
The performance evaluation of Independent Directors shall be done by the Board, excluding the Director being evaluated, basis the contributions made to the Board deliberations in the Board meetings.
10. REVIEW AND DISCLOSURE
10.1 The Company shall disclose in the Board’s report, the ratio of the remuneration of each director, to the median employee’s remuneration and such other details as prescribed under law.
10.2 The Company discloses in its Annual Report all elements of remuneration package of individual directors summarized under major groups details of fixed component and performance linked incentives together with material terms, service contracts like notice period, severance fees (if any) and stock option details (if any).
10.3 The Board is responsible for approving the remuneration strategy for directors, executive and senior management. In determining whether to approve the relevant level of remuneration, the Board is to consider the recommendations from the Committee, prevailing market conditions, performance by the individual and the business strategies and objectives of the Company. The Board shall disclose the remuneration of senior executives in the Company’s Annual Report. The Human Resources department of the Company will monitor the day to day compliance with this Policy.
ANNEXURE VI
Dividend Distribution Policy
In India, regulatory framework as laid down under the Securities and Exchange Board of India (Listing Obligations and Disclosure Requirements) Regulations, 2015, as amended, requires the Company to put in place policy framework for distribution of dividend. Accordingly, the Board of Directors of Procter & Gamble Hygiene and Health Care Limited (“the Company”) have formally adopted the following written policy.
This policy documents the principles for distribution of dividends for the Equity Shareholders of the Company.
Principles for considering dividend are as follows:
The Board of Directors will consider appropriate dividend periodically in a manner in which it:
1. Rewards the Shareholders with sustainable returns;
2. Retains sufficient capital that allows the Company to exploring business opportunities.
The Board of Directors will forward the dividend recommendation for the approval of the Shareholders.
The dividend distribution shall be made in accordance with the applicable provisions of the Companies Act, 2013; Rules framed thereunder, SEBI (Listing Obligations and Disclosure Requirements) Regulations, 2015 and other legislations governing dividends, as in force and as amended from time to time.
Periodicity:
The Company shall declare its Annual Dividend at its Annual General Meeting every year, as per recommendation by the Board of Directors. The Board may declare any interim dividend(s), based on management review during the Financial Year.
Accounting Year:
The Company shall account for dividend (including dividend distribution tax) in the year in which it is approved in the Annual General Meeting and the interim dividend in the year in which it is approved in Board meeting. This is subject to any regulatory requirements.
Disclosure:
This policy shall be disclosed on the website of the Company.

38 Procter & Gamble Hygiene and Health Care Limited
To, The Members, Procter & Gamble Hygiene and Health Care Limited P & G Plaza, Cardinal Gracias Road, Chakala, Andheri East, Mumbai – 400 099
We have conducted the Secretarial Audit of the compliance of applicable statutory provisions and the adherence to good corporate practices by Procter & Gamble Hygiene and Health Care Limited (CIN L24239MH1964PLC012971) (hereinafter called the “Company”) for the financial year ended 30th June, 2017. Secretarial Audit was conducted in a manner that provided us a reasonable basis for evaluating the corporate conducts/statutory compliances and expressing our opinion thereon.
A. In expressing our opinion it must be noted that- i. Maintenance of secretarial record is the
responsibility of the management of the Company. Our responsibility is to express an opinion on these secretarial records based on our audit.
ii. We have followed the audit practices and processes as were appropriate to obtain reasonable assurances about the correctness of the contents of the secretarial records. The verification was done on test basis to ensure that correct facts are reflected in secretarial records. We believe that the processes and practices we followed provide a reasonable basis of our opinion.
iii. We have not verified the correctness and appropriateness of the financial records and books of accounts of the Company.
iv. Wherever required, we have discussed with the management of the company, relied on the legal opinion and the management representation pertaining to compliance of laws, rules and regulations, happening of events, etc.
v. The compliance with the provisions of Corporate and other applicable laws, rules, regulations, standards is the responsibility of the management. Our examination was limited to the verification of procedures on test basis.
vi. The Secretarial Audit report is neither an assurance as to the future viability of the Company nor
of the efficacy or effectiveness with which the management has conducted the affairs of the Company.
B. Based on our verification of the Company’s books, papers, minute books, forms and returns filed and other records maintained by the Company and also the information provided by the Company, its officers, agents and authorized representatives during the conduct of Secretarial Audit, we hereby report that in our opinion, the Company has, during the audit period covering the financial year ended on 30th June, 2017, complied with the statutory provisions listed hereunder and also that the Company has proper Board-process (duly evolved) and compliance-mechanism in place to the extent and as applicable to the Company in the manner and subject to the reporting made hereinafter:
C. We have examined the books, papers, minute books, forms and returns filed and other records maintained by the Company for the financial year ended on 30th June, 2017 according to the provisions of:
I. The Companies Act, 2013 (the Act) and the rules made thereunder;
II. The Securities Contracts (Regulation) Act, 1956 (‘SCRA’) and the rules made thereunder;
III. The Depositories Act, 1996 and the Regulations and Bye-laws framed thereunder;
IV. The Company has neither made any Overseas Direct Investment nor obtained External Commercial Borrowings during the audit period and hence provisions of Foreign Exchange Management Act, 1999 and the rules and regulations made thereunder are applicable to the extent of Foreign Direct Investment only.
VA. The following Regulations and Guidelines prescribed under the Securities and Exchange Board of India Act, 1992 (‘SEBI Act’):
(a) The Securities and Exchange Board of India (Substantial Acquisition of Shares and Takeovers) Regulations, 2011;
(b) The Securities and Exchange Board of India (Prohibition of Insider Trading) Regulations, 2015;
ANNEXURE VII
Secretarial Audit Report
FORM NO. MR-3
SECRETARIAL AUDIT REPORT FOR THE FINANCIAL YEAR ENDED 30TH JUNE, 2017
[Pursuant to Section 204(1) of the Companies Act, 2013 and Rule No. 9 of the Companies (Appointment and Remuneration of Managerial Personnel) Rules, 2014 with modifications as deemed necessary,
without changing the substance of format given in MR-3]

39
Company Overview
Board’s Report
Management Discussion and Analysis
Corporate Governance
Financial Statements
Annual Report 2016-2017
(c) The Securities and Exchange Board of India (Registrar to an Issue and Share Transfer Agents) Regulations, 1993 regarding the Companies Act and dealing with client.
VB. The Company has not undertaken any of the activities during the audit period as envisaged in the following Regulations and Guidelines prescribed under the Securities and Exchange Board of India Act, 1992 (‘SEBI Act’) and hence are not relevant for the purpose of audit:-
(a) The Securities and Exchange Board of India (Buyback of Securities) Regulations, 1998;
(b) The Securities and Exchange Board of India (Issue and Listing of Debt Securities) Regulations, 2008;
(c) The Securities and Exchange Board of India (Issue of Capital and Disclosure Requirements) Regulations, 2009;
(d) The Securities and Exchange Board of India (Share Based Employee Benefits) Regulations, 2014 and
(e) The Securities and Exchange Board of India (Delisting of Equity Shares) Regulations, 2009.
VI. The following Acts and Rules made thereunder pertaining to Company’s business are applicable to the Company:
(a) Drugs and Cosmetics Act, 1940; (b) The Legal Metrology Act, 2009; and (c) The Legal Metrology (Packaged Commodities)
Rules, 2011.
D. We have also examined compliance with the applicable clauses which, are generally adhered to, of the following:
i. Secretarial Standards in respect of Meeting of Board of Directors (SS-1) and General Meetings (SS-2) issued by The Institute of Company Secretaries of India
ii. SEBI (Listing Obligations and Disclosure Requirements) Regulations, 2015 entered into by the Company with BSE Limited and National Stock Exchange of India Limited.
During the period under review the Company has complied with the provisions of the Act, Rules, Regulations, Guidelines, Standards etc. mentioned above.
E. We further report that, — I. The Board of Directors of the Company is
duly constituted with proper balance of Executive Directors, Non-Executive Directors and Independent Directors. There were no changes in the composition of the Board of Directors during the period under review.
II. Adequate notice is given to all directors to schedule the Board Meetings, agenda and detailed notes on agenda were sent well in advance, and a system exists for seeking and obtaining further information and clarifications on the agenda items before the meeting and for meaningful participation at the meeting.
III. Majority decision is carried through and there was no instance of any director expressing any dissenting views.
F. We further report that there are adequate systems and processes in the Company commensurate with its size and operations to monitor and ensure compliance with applicable laws, rules, regulations and guidelines.
G. We further report that during the audit period: 1. Promoter shareholder, Procter & Gamble Asia
Holding BV, The Netherlands (PGAHBV) holding 2,12,21,953 shares (65.38 % of total shareholding) merged with another promoter group company, Procter & Gamble Overseas India BV, The Netherlands (PGOIBV) effective 31st March, 2017.
2. Promoter shareholder, Rosemount LLC, US holding 10,88,137 shares (3.35% of total shareholding) transferred its entire shareholding to another promoter group company, Procter & Gamble Overseas India BV, The Netherlands (PGOIBV) effective 1st April, 2017.
There is no change in total percentage of P&G promoter shareholding as the share transfer is on account of merger / inter-se transfer among promoter group companies.
Except the above, none of the following events has taken place:
I. Public/Rights/Preferential Issue of Shares/Debentures/Sweat equity etc.
II. Redemption/buy back of securities. III. Major decisions taken by the members in
pursuance to Section 180 of the Companies Act, 2013.
IV. Merger/Amalgamation/Reconstruction, etc. V. Foreign Technical Collaborations.
For DHOLAKIA & ASSOCIATES LLP(Company Secretaries)
Sd/- CS Bhumitra V. Dholakia
Designated PartnerFCS - 977
CP No. 507Place : MumbaiDate : 23rd August, 2017

40 Procter & Gamble Hygiene and Health Care Limited
MANAGEMENT DISCUSSION AND ANALYSIS
Economy and Markets
The fundamentals of the Indian economy have remained
positive in a subdued global economic environment. Indian
Economy continues to grow mid to high single digits.
India’s FMCG sector is among the largest sector in the
economy and an important contributor to India’s GDP.
Despite the economic slowdown, the FMCG industry
has remained resilient and the overall outlook remains
positive for India’s consumer goods industry. Some
of the new emerging trends that will drive demand
going forward include – growth in disposable income,
e-commerce penetration, the rise of digital advertising, tax
structure simplification, infrastructure development and
rural consumption. To be successful, the FMCG industry
will need to remain focused on fundamentals and build
capabilities in line with emerging trends and provide Indian
consumers with superior products at superior value.
The liquidity crunch post demonetization and trade
destocking ahead of Goods and Services Tax Cut-over did
impact the economy and our results in 2016-17. But, the
business is starting to recover.
Outlook, Risks and Opportunities
The Indian economy presents significant opportunity with
a growing population, category whitespace and rising
incomes. We do expect growth rate in the categories
we compete to be around high single digits. However,
currency volatility, supply bottlenecks and intense
competition present significant near term challenges. Your
Company endeavours to overcome these risks and to
sustain and improve its market position behind superior
innovation, by driving favourable price/mix, consumer
relevant communication and through a relentless focus on
productivity.
Performance Overview
The Company operates in a single reportable business and
geographical segment. The Company’s core business is
manufacturing, marketing and distribution of Hygiene and
Health Care products. Under these businesses it has in its
portfolio: VICKS – India’s No-1 Healthcare brand, WHISPER
– India’s leading Feminine Hygiene brand (in value terms)
and OLD SPICE. The discussion on financial performance
of the Company and its various businesses is elaborated in
the Directors’ Report.
Risk Management
Your Company has set up a Risk Management Committee.
The Company has also adopted a Risk Management Policy.
Business, Finance & Operational risks
The Company‘s risk management policy is in line with the
parent Company’s global guidelines and as such adequate
measures have been adopted by the Company to
anticipate, plan and mitigate the spectrum of risks it faces.
On business risks (competition, consumer preferences
and technology changes) the Company undertakes a
Competition Response Model program. For financing risks
it has a robust operational contingency and legal plan.
It also undertakes Business Contingency Plan for key
vendors and natural disasters. The Company also has
adequate Insurance coverage to protect the value of its
assets. This coverage duly covers any risks relating to
business interruption resulting from property damage
and legal liability resulting from property damage or
personal injury.
The Company has in place a very stringent and responsive
system under which all its distributors and vendors are
assessed before being selected.
Regulatory and Compliance risks
Your Company operates within the letter and spirit of all
applicable laws. General compliance with legal requirements
is an important component of the Worldwide Business
Conduct Manual and the same directs the following action
from every employee:
• Toobeyalllegalrequirementsatalltimes;
• To understand exactly what legal requirements apply
to the work function;
• To consult the legal personnel if there are conflicting
legal requirements in different jurisdictions;

41
Company Overview
Board’s Report
Management Discussion and Analysis
Corporate Governance
Financial Statements
Annual Report 2016-2017
• Tostrictlyfollowthedirectionsfromthelegalpersonnel;
• Toaddressand resolve, ina timelymanner, any legal
compliance issues that have been identified;
• Absolutelynoviolationofanylaw;
• Toimmediatelyreportanyinstanceofviolationstothe
Legal Department.
Your Company has set in place the requisite mechanism
for meeting with the compliance requirements, periodic
monitoring of compliance to avoid any deviations, and
regular updates to keep pace with the regulatory changes.
Security Risks
Your Company has installed comprehensive security
programs supported by latest technology and trained
manpower to protect employees and assets, at all its
offices and plants. During the Financial Year under review,
no major security breaches or incidents occurred at any
of the Company’s plants. A comprehensive security risk
assessment is carried out regularly and adequate security
measures are implemented to cater to change security
scenario. Your Company has installed the best of the
security measures and processes to protect its personnel
and assets.
Internal Auditor
During the Financial Year, the Board of Directors had
appointed Ms. Garima Maheshwari, Chartered Accountant
as the Internal Auditor of the Company for the Financial
Year 2016-17.
Internal Controls & their adequacy
Your Company has strong Internal Controls Environment
and Risk Assessment/ Management systems. These systems
enable Company to comply with Internal Company policies,
procedures, standard guidelines and local laws to help
protect Company’s assets and confidential information
against financial losses and unauthorized use. The robust
controls environment at your Company is efficiently
managed through:
o Controls Self Assessments (CSAs) are performed
regularly across business processes. The organization
does detailed process reviews to evaluate process
compliances versus standards. This enables organization
to proactively identify control weaknesses and initiate
actions to sustainably fix them.
o Stewardship and Global Internal Audit (GIA)
Reviews led by a team of three fulltime Internal
Controls experts, ensure that all key processes i.e.
selling, revenue, distribution, trade & marketing spends,
vendor payments, and plant operations are reviewed
and assessed at frequent intervals. The observations
and findings are shared with senior management
for implementing quality action plans to strengthen
overall controls in these processes. The assessments
of High risks and SOX Compliance areas are assessed
by an independent internal audit department lead by
P&G’s Global Internal Audit team. This team comprises
of certified internal controls experts who has internal
controls experiences across the different markets that
P&G operates in.
o Governance and Stewardship Boards comprises
of the Managing Director, Group Chief Financial
Officer, Chief Human Resource Officer and Chief Legal
Officer. The Board looks at enterprise level current and
potential risks and works plans to eliminate / mitigate
them.
During the Financial Year under review, the Global Internal
Audit (GIA) performed Audits of key areas covering
purchasing and revenue processes, Controls were rated as
‘Strong with low controls risks’. Local management has
executed quality action plans to remediate all the findings
reported by GIA during their engagement.
Human Resource Initiatives
The Company operates in a highly competitive environment
vis-à-vis attracting the best talent for its operations and
therefore the human resources management function
has assumed vital importance in the Company. The
Company focuses on attracting, motivating and retaining

42 Procter & Gamble Hygiene and Health Care Limited
the best talent. Its people systems like talent supply,
performance management and talent development are
robust and competitive. We have put in place robust HR
programs to ensure that the organization is geared up to
deliver the future.
• Attracting&RetainingTalent:
India continues to be a key market for Global
talent. In this scenario, our recruiting focus,
innovative campus initiatives (digital and face
to face), foray into Social media helped us
reach a large number of prospective candidates.
We continue to strengthen our position as employer
of choice with innovative programs like ‘Emerging
Leader’ and ‘CEO Challenge’ to target campus
students. The application rate of more than 90% and
the Pre Placement Offer acceptance rate of 95% is
proof of our employer brand.
Our policies on leadership pipeline, talent planning,
mentoring and diversity & inclusion policies continue
to ensure that we attract and retain the best talent.
Providing challenging and meaningful careers,
competitive compensation & benefits, leadership
development opportunities continue to enable us to
attract the best talent that will keep the Company
growing from strength to strength. We are ranked
among the top few companies in the Annual Nielsen
Campus survey.
• DevelopingTalent:
Our organization survey scores were strong showing
good increase in areas of career and guidance,
employer of choice and simplification. New hires
into the company are given a thorough on-boarding
through our ‘i-LEAD Program’ and ‘SPARK- Sales New
Hire Program’ to ensure that they are early contributors
in their roles and feel valued. The Company’s
performance management system, is robust and drives
the employees to perform at their PEAK. It clearly
assesses and differentiates employees on the basis of
performance. The ‘CARE Program’ intends to build
capability of our people managers. The number of
employees as on June 30, 2017 was 362.
The Statements in the Management Discussion and Analysis
Report may be seen as forward looking statements. The
actual results may differ materially for those expressed or
implied in the statement depending on circumstances.

43Annual Report 2016-2017
Company Overview
Board’s Report
Management Discussion and Analysis
Corporate Governance
Financial Statements
CORPORATE GOVERNANCE
CORPORATE GOVERNANCE PhilOsOPhy
Your Directors are pleased to present the Corporate Governance Report.
Corporate Governance is the interaction of the Management, Members and the Board of Directors to help ensure that all stake holders are protected against managers acting solely in their own best interest. Governance process has to ensure that the societal measures employed by the Company are utilized in a manner that meets with the stakeholders’ aspirations and societal expectations. Corporate Governance consists of laws, policies, procedures, and, most importantly, practices, that ensure the well being of the assets of the Company. Corporate Governance is at its highest levels when Management is acting as if they are long-term investors in the Company.
Your Company has a strong history of operating with integrity – at all levels, both internally and externally. Our actions and the actions of all our employees are governed by our Purpose, Values and Principles (PVPs). Our commitment to operate responsibly is reflected in the steps we have in place to ensure rigorous financial discipline and Corporate Governance.
We have a highly experienced Board of Directors, which helps us maintain the highest standards of Corporate Governance. Our Audit Committee is comprised of Independent Directors, with appropriate financial skills to provide good oversight. We have in place strong internal controls, to ensure compliance with all relevant regulations and standards. Our rigorous business process controls include ongoing programs of self-assessment, controls, as well as internal and external audits. Your Company has adopted a Code of Conduct for its Directors, which is derived from three interlinked fundamental principles, viz. good corporate governance, good corporate citizenship and exemplary personal conduct.
Further, your Company reinforces responsibilities on all its employees, of observing high standards of Corporate Governance through the Company’s “Worldwide Business Conduct Manual” which sets forth management’s commitment to conduct its business affairs with high ethical standards. This Manual flows from our PVPs which is the umbrella for our critical policy areas, which in turn create specific guidelines and standards. This Manual enables the Company’s employees to make easier connection to relevant policies and the tools that support them. This Manual describes the Company’s “Worldwide Business Conduct Standards”. These standards flow from the following core values of the Company:
• Treat theCompany’sassetsas youwould treat yourown;
• BehavewiththeCompany’slongtermsuccessinmind;
• Alwaysdotherightthing;and
• Operatewithintheletterandspiritoflaw.
The “Worldwide Business Conduct Manual” also details the policy statements, operating policies/procedures/practices and Internal Controls being followed by the Company with specific emphasis on ethical behaviour of employees, compliance with all applicable laws in letter and spirit, ensuring accuracy of books and records, maintaining confidentiality of corporate data, avoidance of conflict of interest, fair dealings, fair competition, following best practices for safety and health of Company personnel, environmental protection, trading in securities and a host of special legal issues.
Our reputation is earned by our conduct: what we say, what we do, the products we make, the services we provide, and the way we act and treat others. As conscientious citizens and employees, we want to do what is right. For your Company, this is the only way to do business.
BOARD OF DiRECTORs
(a) Composition of the Board
The Board of Directors of the Company comprises an optimum combination of Executive and Non-Executive Directors. As on date, the Board is headed by a Non-Executive Independent Chairman, a Managing Director (Executive) and six other Non-Executive Directors.
The Non-Executive Independent Directors bring external perspective and independence to decision making. Mr. R. A. Shah (Chairman), Mr. B. S. Mehta and Mr. A. K. Gupta have been appointed as ‘Non-Executive Independent Directors’ for a period of five years w.e.f. September 24, 2014 by the Members at the Annual General Meeting held on September 24, 2014. They have provided certificate of independence to the Company stating that they meet the criteria of independence as mentioned under Section 149 (6) of the Companies Act, 2013 and the Securities and Exchange Board of India (Listing Obligations and Disclosure Requirements) Regulations, 2015 (“SEBI Listing Regulations, 2015”). The terms & conditions of appointment of Independent Directors is available on the website of the Company. All other Directors, except the Managing Director and the Non-Executive Independent Directors, are Directors liable to retire by rotation.

44 Procter & Gamble Hygiene and Health Care Limited
(b) Number of meetings of the Board
Four (4) meetings of the Board were held during the period July 1, 2016 to June 30, 2017. These meetings were held on August 26, 2016, December 3, 2016, February 7, 2017 and May 5, 2017.
(c) Directors’ attendance record and Directorships held
The attendance of the Directors at the Board meetings and at the last Annual General Meeting is as under:
Name of Director No. of Board
Meetings held during the tenure
No. of Board
Meetings attended
last Annual General Meeting (Whether attended)
Mr. R. A. Shah 4 4 Yes
Mr. Al Rajwani 4 4 Yes
Mr. B. S. Mehta 4 4 Yes
Mr. A. K. Gupta 4 4 Yes
Mr. P. Agarwal 4 4 Yes
Mr. S. S. Rathore 4 3 Yes
Ms. S. Dhawan 4 3 Yes
Mr. K. Natarajan 4 3 Yes
(d) separate meeting of independent Directors
The Independent Directors of the Company met separately without the presence of Non-Independent Directors or management representatives on June 16, 2017 to review the performance of non-independent directors; the Board & the Chairperson of the Company, and to assess the quality, quantity and timeliness of flow of information between the Company management and the Board that is necessary for the Board to effectively and reasonably perform their duties.
(e) Related Party Transactions
The Company has adopted Related Party Transaction Policy (‘RPT Policy’) to ensure that all Related Party Transactions entered into by the Company shall be in the best interest of the Company and in accordance with the provisions of the Companies Act, 2013 and Regulation 23 of the SEBI Listing Regulations, 2015. The RPT Policy is available on the Company’s website at http://www.pg.com/en_IN/invest/pghh/corporate_governance/policies.shtml.
Prior approval of the Audit Committee is obtained for all related party transactions. Prior omnibus approval
The composition and other required details of the Board of Directors as on date are given below:
Name of the Director Category Designation Directorships in other
companies*
Membership of Board Committees of other companies **
Member Chairman
Mr. R. A. Shah NED/ID Chairman 11 7 3
Mr. Al Rajwani ED Managing Director 2 2 Nil
Mr. B. S. Mehta NED/ID Director 9 8 3
Mr. A. K. Gupta NED/ID Director 1 2 1
Mr. P. Agarwal NED Director 1 Nil Nil
Mr. S. S. Rathore NED Director 2 Nil Nil
Ms. S. Dhawan NED Director 2 1 Nil
Mr. K. Natarajan NED Director 2 Nil Nil
NED – Non-Executive Director
ED – Executive Director
ID – Independent Director
* Includes directorships in private companies and companies registered under Section 8 of the Companies Act, 2013 and excludes directorships in foreign companies.
** Includes memberships of only Audit Committee and Stakeholders’ Relationship Committee of Public Companies.

45Annual Report 2016-2017
Company Overview
Board’s Report
Management Discussion and Analysis
Corporate Governance
Financial Statements
of the Audit Committee is obtained for all related party transactions which are of repetitive nature. All related party transactions are reviewed by external chartered accounting firm to ensure transactions are in ordinary course of business, at arm’s length and are in compliance with the RPT Policy of the Company. All related party transactions are placed before the Audit Committee for quarterly review.
There are no material pecuniary relationships / significant transactions made by the Company with its Promoters, Directors or management, their subsidiaries or relatives etc. which have potential conflict with the interests of the Company at large. Transactions with related parties are disclosed in Note 32 forming part of the Financial Statements.
(f) Remuneration of Directors
Members of the Company at their 51st Annual General Meeting held on October 28, 2015 had passed a Special Resolution according approval
for payment of commission to the Non-Executive Independent Directors of the Company upto a maximum of 1% of the net profits of the Company per annum in the aggregate, for a period of 5 years w.e.f. July 1, 2016. The said resolution had also empowered the Board of Directors to fix the quantum of commission payable to each of the Non-Executive Independent Directors and to also determine the period for which said commission is payable. In view of the above, the Board of Directors have accorded approval for payment of Annual Commission of `11 Lakhs to each of the Non-Executive Independent Directors for the Financial Year 2016-17. The said commission is within the limits of 1% of the net profits of the Company in the aggregate. The Non-Executive Directors are paid to compensate their valuable contribution to the Company owing to their wealth of experience and knowledge.
No fee/compensation is payable to the Directors on severance of Directorship of the Company.
Details of the remuneration paid/provided to the Directors of the Company during the Financial Year ended June 30, 2017 are given below:
Amount in `
Name of Director Relationship with other Directors
salary including Bonus + PF contribution
Commission sitting Fees shares held (Equity shares of
` 10/- each)*
Mr. R. A. Shah None — 11,00,000 2,90,000 12,906
Mr. Al Rajwani None 14,29,96,017# — — —
Mr. B. S. Mehta None — 11,00,000 2,60,000 3,799
Mr. A. K. Gupta None — 11,00,000 3,80,000 —
Mr. P. Agarwal None — — — —
Mr. S. S. Rathore None —$ — — —
Ms. S. Dhawan None —$$ — — —
Mr. K. Natarajan None —$$$ — — —
* Excludes shares held by relatives # Employee benefits expense under Note 38 to the Financial Statements includes expenses in respect of Managerial personnel
of ` 806 Lakhs cross charged to Gillette India Limited and Procter & Gamble Home Products Private Limited in terms of the common service agreement.
$ Employee benefits expense under Note 38 to the Financial Statements includes expenses in respect of Managerial personnel of ` 49 Lakhs cross charged from Gillette India Limited in terms of the common service agreement.
$$ Employee benefits expense under Note 38 to the Financial Statements includes expenses in respect of Managerial personnel of ` 96 Lakhs cross charged from Procter & Gamble Home Products Private Limited in terms of the common service agreement.
$$$ Employee benefits expense under Note 38 to the Financial Statements includes expenses in respect of Managerial personnel of ` 30 Lakhs cross charged from Gillette India Ltd in terms of the common service agreement.

46 Procter & Gamble Hygiene and Health Care Limited
stock Options
The Company does not have any Stock Option Plan for its employees. However, all employees of the Company including its Managing Director are given the right to purchase shares of the Ultimate Holding Company – The Procter & Gamble Company, USA under its ‘International Stock Ownership Plan.’ Certain employees of the Company are also entitled to Stock Option of the Ultimate Holding Company under its Employee Stock Option Plan. Details as regards the same are disclosed vide Note 31 forming part of the Financial Statements.
(g) Committees of the Board
Audit Committee
The Audit Committee comprises of Mr. R. A. Shah (Chairman), Mr. B. S. Mehta (Member), Mr. A. K. Gupta (Member) and Mr. Al Rajwani (Member). The Audit Committee met on August 26, 2016, December 3, 2016, February 7, 2017 and May 5, 2017.
Directors Designation Category Profession No. of Meetings
held during tenure
No. of Meetings attended
Mr. R. A. Shah Chairman NED/ID Solicitor 4 4
Mr. B. S. Mehta Member NED/ID Chartered Accountant
4 4
Mr. A. K. Gupta Member NED/ID Consultant 4 4
Mr. Al Rajwani Member ED General Manager
4 4
NED – Non-Executive DirectorID – Independent DirectorED – Executive Director
Mr. Ishan Sonthalia is the Secretary to the Committee.
The Audit Committee plays the role as is contemplated under Section 177 of the Companies Act, 2013 read with the SEBI Listing Regulations, 2015.
The Audit Committee powers include the following:
(a) to investigate any activity within its terms of reference;
(b) to seek information from any employee;
(c) to obtain outside legal or other professional advice; and
(d) to secure attendance of outsiders with relevant expertise, if it considers necessary.
The Audit Committee role includes the following:
i. Recommendation for appointment, remuneration and terms of appointment of auditors of the Company;
ii. Review and monitor the auditor’s independence and performance, and effectiveness of audit process;
iii. Approval or any subsequent modification of transactions of the Company with related parties;
iv. Scrutiny of inter-corporate loans and investments;
v. Valuation of undertakings or assets of the Company, wherever it is necessary;
vi. Evaluation of internal financial controls and risk management systems;
vii. Oversight of the Company’s financial reporting process and the disclosure of its financial information to ensure that the financial statement is correct, sufficient and credible;
viii. Approval of payment to statutory auditors for any other services rendered by the statutory auditors;
ix. Examination and reviewing, with the management, the annual financial statements and auditor’s report thereon before submission to the Board for approval, with particular reference to:
• Matters required to be included in theDirector’s Responsibility Statement to be included in the Board’s report in terms of Clause (c) of sub-section 3 of Section 134 of the Companies Act, 2013
• Changes, if any, in accounting policiesand practices and reasons for the same
• Major accounting entries involvingestimates based on the exercise of judgment by management
• Significant adjustments made in thefinancial statements arising out of audit findings
• Compliance with listing and otherlegal requirements relating to financial statements

47Annual Report 2016-2017
Company Overview
Board’s Report
Management Discussion and Analysis
Corporate Governance
Financial Statements
• Disclosureofanyrelatedpartytransactions
• Qualificationsinthedraftauditreport
x. Reviewing, with the management, the quarterly financial statements before submission to the Board for approval;
xi. Monitoring the end use of funds raised through public offers and related matters and reviewing, with the management, the statement of uses / application of funds raised through an issue (public issue, rights issue, preferential issue, etc.), the statement of funds utilized for purposes other than those stated in the offer document / prospectus / notice and the report submitted by the monitoring agency monitoring the utilisation of proceeds of a public or rights issue, and making appropriate recommendations to the Board to take up steps in this matter;
xii. Reviewing, with the management, performance of statutory and internal auditors, adequacy of the internal control systems;
xiii. Reviewing the adequacy of internal audit function, if any, including the structure of the internal audit department, staffing and seniority of the official heading the department, reporting structure coverage and frequency of internal audit;
xiv. Discussion with internal auditors of any significant findings and follow up there on;
xv. Reviewing the findings of any internal investigations by the internal auditors into matters where there is suspected fraud or irregularity or a failure of internal control systems of a material nature and reporting the matter to the Board;
xvi. Discussion with statutory auditors before the audit commences, about the nature and scope of audit as well as post-audit discussion to ascertain any area of concern;
xvii. To look into the reasons for substantial defaults in the payment to the depositors, debenture holders, shareholders (in case of non-payment of declared dividends) and creditors;
xviii. To review the functioning of the Whistle Blower mechanism;
xix. Approval of appointment of Chief Financial Officer (i.e., the whole-time Finance Director or any other person heading the finance function or discharging that function) after assessing the qualifications, experience and background, etc. of the candidate;
xx. Reviewing any other areas which may be specified as role of the Audit Committee under the SEBI Listing Regulations, 2015, Companies Act, 2013 and other statutes, as amended from time to time.
The minutes of the Committee are placed before the Board.
stakeholder Relationship Committee
The Committee comprises of Mr. Shailyamanyu Singh Rathore (Chairman), Mr. Al Rajwani (Member) and Mr. Anil Kumar Gupta (Member). Mr. Ishan Sonthalia is the Company Secretary and Compliance Officer to the Committee. During the Financial Year, four meetings were held on August 26, 2016, December 3, 2016, February 7, 2017 and May 5, 2017.
Directors No. of Meetings
held during tenure
No. of Meetings attended
Mr. S. S. Rathore 4 3
Mr. A. K. Gupta 4 4
Mr. Al Rajwani 4 4
The role of the Committee is as follows:
• Resolving the grievances of the security holders of the Company including complaints related to transfer of shares, non-receipt of Annual Report, non-receipt of declared dividends etc.
• Overseeing transfer/transmission of shares, issue of duplicate share certificates, and dematerialization/rematerialization of shares.
During the Financial Year, the Company received 22 complaints from Members. These complaints have been resolved during the year. There were no pending share transfers as on June 30, 2017.

48 Procter & Gamble Hygiene and Health Care Limited
Nomination and Remuneration Committee
The Nomination and Remuneration Committee comprises of Mr. A. K. Gupta (Chairman), Mr. R. A. Shah (Member) and Mr. Karthik Natarajan (Member). During the Financial Year, three meetings were held on August 26, 2016, February 7, 2017 and May 5, 2017.
Directors No. of Meetings
held during tenure
No. of Meetings attended
Mr. A. K. Gupta 3 3
Mr. R. A. Shah 3 3
Mr. Karthik Natarajan 3 2
The role of the Committee is as follows:
• Formulation of criteria for determiningqualifications, positive attributes and independence of Directors;
• Formulation of evaluation criteria forperformance evaluation of Independent Directors and the Board;
• Recommendation to the Board of a Policy,relating to the remuneration of Directors, Key Managerial Personnel and senior management;
• Identification of persons who are qualified tobecome Directors and who may be appointed in senior management and recommendation to the Board their appointment and removal;
• Carrying out evaluation of every Director’sperformance;
• DeviseapolicyonBoarddiversity;
• Any other role & responsibility, as may bemandated by any statutory legislation, from time to time.
The Company has adopted Nomination and Remuneration Policy. The Nomination and Remuneration Policy is in compliance with all applicable provisions of the Companies Act, 2013, particularly Section 178 read together with the applicable rules thereto and Regulation 19 of the SEBI Listing Regulations, 2015. The Policy is designed to attract, motivate and retain leadership members in a competitive and international market. The Policy
reflects the Company’s objectives for good corporate governance as well as sustained long-term value creation for shareholders. The Policy is available on the website of the Company at http://www.pg.com/en_IN/invest/pghh/corporate_governance/policies.shtml. This Policy is also annexed to this Directors’ report as Annexure V.
The Company has also adopted a Board Diversity Policy which is based on the principle that the Company’s Board of Directors should have a balance of skills, experience and diversity of perspectives appropriate to the Company’s business. The Company recognizes that a Board composed of appropriately qualified people with a broad spectrum of experience relevant to the business is important for effective corporate governance and sustained commercial success of the Company. The Company aims to achieve a sustainable and balanced development by building a diverse and inclusive culture.
The Committee carries out an evaluation of the performance of individual Directors. Feedback was sought by way of structured questionnaires covering various aspects in line with the Guidance Note on Board evaluation issued by the Securities and Exchange Board of India vide its circular dated January 5, 2017 and performance evaluation was carried out based on the responses received from the Directors.
Corporate social Responsibility Committee
The Corporate Social Responsibility Committee comprises of Mr. A. K. Gupta (Chairman), Mr. Al Rajwani (Member), Ms. Sonali Dhawan (Member) and Mr. Karthik Natarajan (Member). During the Financial Year, three meetings were held on August 26, 2016, December 3, 2016 and February 7, 2017.
Directors No. of Meetings
held during tenure
No. of Meetings attended
Mr. A. K. Gupta 3 3
Mr. Al Rajwani 3 3
Mr. K. Natarajan 3 2
Ms. S. Dhawan 3 2
The role of the Committee is as follows:
• Formulation and recommendation to the Board, a CSR Policy which shall indicate the activities to be undertaken by the Company;
49Annual Report 2016-2017
Company Overview
Board’s Report
Management Discussion and Analysis
Corporate Governance
Financial Statements
• Recommendation of the amount of expenditure to be incurred on the CSR activities;
• Monitoring the CSR Policy of the Company from time to time;
• Formulation and monitoring of implementation of business responsibility policies; and
• Annual assessment of the business responsibility performance and reporting.
The Company has adopted a Corporate Social Responsibility Policy (‘CSR Policy’). In line with the global principles followed by the Procter & Gamble group and the terms of the Companies Act, 2013, the CSR Policy is broadly framed taking into account the following:
• We believe it is essential to run our business responsibly and our operating practices reflect this commitment.
• We are focused on making every day better for people and the planet through our innovations and our actions:
– Environment by – Conservation of Resources, Using Renewable Resources, Generating Worth from Waste;
– Social by – providing the comforts of home, improving health and hygiene of people, social and cultural development, imparting education, training and social awareness.
Risk Management Committee
The Company has constituted a Risk Management Committee to monitor and the review the Risk Management Policy and plans of the Company.
The composition of the Risk Management Committee is as follows:
Name of Member Category Designation
Mr. Al Rajwani MD Chairman
Mr. K. Natarajan NED Member
Mr. P. Bhatnagar CFO Member
MD – Managing Director
NED – Non-Executive Director
CFO – Chief Financial Officer
The Company has adopted a Risk Management Policy which aims to create a standard, structured and efficient approach to identify, assess and mitigate risks. Our Company meetings are structured to plan, assess and mitigate risks. These include annual & monthly business planning meetings as well as specific category and Go-to-market assessments.
Cash & investment Committee
During the year, the Company has constituted a Cash & Investment Committee comprising of Mr. Pramod Agarwal (Chairman), Mr. Shailyaman Singh Rathore (Member), Mr. A. K. Gupta (Member) and Mr. Karthik Natarajan (Member). During the Financial Year, two meetings were held on February 7, 2017 and May 5, 2017.
The composition of the Cash & Investment Committee is as follows:
Name of Member No. of meetings
held during tenure
No. of meetings attended
Mr. Pramod Agarwal 2 2
Mr. A. K. Gupta 2 2
Mr. K. Natarajan 2 1
Mr. S. S. Rathore 2 2
The role of the Committee is as follows:
Assessment and recommendation to the Board the best possible utilization of cash generated by the Company, on basis of following primary considerations-
i) Protect long term growth of the Company
ii) Maximize return to the shareholders
iii) Ensure risk free investments
(h) Familiarization programme for independent Directors
The familiarization programme aims at familiarizing the Independent Directors with the Company, their roles, rights, responsibilities in the Company, nature of the industry in which the Company operates and business model of the Company.
The Company conducts presentations at meetings of the Board and meeting of various Committees of the Board periodically to familiarize the

50 Procter & Gamble Hygiene and Health Care Limited
Independent Directors with the business performance, business strategy, operations and functions of the Company. Such presentations help the Independent Directors to understand the Company’s strategy, business model, operations, market, competition, organization structure, risk analysis and such other areas.
The Company updates the Independent Directors on changes in relevant laws / regulations from time to time. Each member of the Board, including the Independent Directors, are given any information relating to the Company, whenever they so request. Independent Directors have the freedom to interact with the Company’s management.
In case of appointment of new Independent Director on the Board of the Company, the Company would:
• Issueaformalletterofappointmentcontainingroles and responsibilities at the time of appointment;
• Provide introductory documents includingAnnual Report, Board committee framework, codes of conducts as may be applicable to the Director, various Policies and procedures adopted by the Company.
The familiarization programme is available on the Company’s website at http://www.pg.com/en_IN/invest/pghh/corporate_governance/index.shtml.
(i) Annual Evaluation of the Directors
The Board has carried out an annual evaluation of its own performance and that of its Committees as well as performance of the Directors individually. Feedback was sought by way of structured questionnaires covering various aspects in line with the Guidance Note on Board evaluation issued by the Securities and Exchange Board of India vide its circular dated January 5, 2017 and performance evaluation was carried out based on the responses received from the Directors.
(j) Disclosures regarding re-appointment of Directors
i. Mr. Karthik Natarajan is a Chartered Accountant and has completed his Bachelor of Commerce from RA Podar College, Mumbai. Mr. Natarajan is currently the Director, Finance & Accounting, India, Middle East & Africa and has been with P&G for over 16 years. Prior to this
role, he has over his experience at P&G worked across multiple locations including India, US, China, Philippines and Singapore. He has held Global responsibilities and has led Strategy development, business and financial planning and operational execution with excellence for several important P&G businesses over his tenure with the Company.
Mr. Natarajan is also a Director on the Board of Gillette India Limited.
Mr. Natarajan, retires by rotation and being eligible, offers himself for re-appointment at the forthcoming 53rd Annual General Meeting.
ii. Mr. Pramod Agarwal, is an MBA from IIM, Ahmedabad. After over 28 years of experience with P&G, he retired in 2016. During his employment with P&G, he has worked in seven geographies – India, Thailand, Japan, Philippines, USA, Singapore and Switzerland. Mr. Agarwal has led several major changes which have had a lasting impact on the business and organization.
Mr. Agarwal is also a Director on the Board of Gillette India Limited.
Mr. Agarwal, retires by rotation and being eligible, offers himself for re-appointment at the forthcoming 53rd Annual General Meeting.
COMMuNiCATiON TO shAREhOlDERs
(i) The quarterly results of the Company are announced within 45 days of completion of the quarter or within the time as prescribed by the Securities and Exchange Board of India. Audited Annual Results are announced within 60 days of the end of Financial Year or within the time as prescribed by the Securities and Exchange Board of India which are published in the The Economic Times, Mumbai Lakshadeep and The Asian Age.
(ii) The Company’s results and official news releases are published on Company’s website: www.pg.com/en_IN.
(iii) No presentations were made to Analysts and Institutional Investors during the course of the Financial Year.
(iv) This Annual Report comprising of Notice calling the General Meeting, Audited Financial Statements, Directors’ Report, Auditors’ Report etc. for the

51Annual Report 2016-2017
Company Overview
Board’s Report
Management Discussion and Analysis
Corporate Governance
Financial Statements
Financial Year 2016-17, in electronic form, is being sent to the Members at the email ids provided/ updated by the Members with the Depository Participants/Registrar & Transfer Agents, as applicable.
sTATuTORy COMPliANCE
The Company has complied with all applicable requirements prescribed by the regulatory and statutory authorities during the preceding three Financial Years on all matters related to capital markets and no strictures or penalty was imposed on the Company.
GENERAl MEETiNGs
Annual General Meeting
Date Time Venue No. of special
resolutions passed
52nd December 2, 2016
11.00 a.m. All the three Annual General Meetings were held at Y. B. Chavan Pratisthan, Gen. Jagannathrao Bhonsle Marg, Mumbai-400 021
—
51st October 28, 2015
3.30 p.m. 1
50th September 24, 2014
3.30 p.m. —
At the 51st Annual General Meeting held on October 28, 2015, the following Special Resolution was passed:
Approval for payment of Commission to Non-Executive Independent Directors of the Company upto one percent of the net profits of the Company per annum in the aggregate for a period of five years with effect from July 1, 2016.
POsTAl BAllOT
No postal ballot was undertaken during the Financial Year ended June 30, 2017.
CEO / CFO CERTiFiCATiON
In terms of requirement of SEBI Listing Regulations, 2015, the Managing Director and the Chief Financial Officer have made a certification to the Board of Directors in the prescribed format for the Financial Year under review, which has been reviewed by the Audit Committee and taken on record by the Board.
ADOPTiON OF DisCRETiONARy REquiREMENTs
The Company has adopted following discretionary requirements of Regulation 27(1) of the SEBI Listing Regulations, 2015:
a. There are no audit qualifications in the Company’s financial statements for the Financial Year 2016-17.
b. The Company has appointed separate persons as Chairman and Managing Director of the Company.
WhisTlE BlOWER POliCy
The Company being a part of the Procter & Gamble group is guided by a Whistle Blower Policy as laid down in its “Worldwide Business Conduct Manual”. Any employee or other interested person can call on ‘The Worldwide Business Conduct Helpline (previously called the Alertline)’, twenty-four hours a day, seven days a week, to report any concerns about violations of the Company’s “Worldwide Business Conduct Standards”.
The Worldwide Business Conduct Helpline is not staffed or monitored by the Company personnel. All calls can be completed anonymous if the caller desires. The Helpline can take calls in most languages spoken by employees around the world.
Calls made to the Helpline are reported to the Company’s Corporate Security and Legal personnel, who will ensure appropriate investigation and follow-up of all calls. Callers are given a confidential identification number so they can inquire about the status of their reported concerns.
The ‘Worldwide Business Conduct Helpline’ is accessible to all employees.
In compliance with the requirement under the SEBI Listing Regulations, 2015 and Section 177 of the Companies Act, 2013 and the Rules made thereunder, the Company has adopted the whistle blowing policy as the vigilance mechanism for Directors and employees to report genuine concerns or grievances such as unethical behaviour, actual or suspected fraud or violation of the Company’s code of conduct or ethics policy.
The Audit Committee oversees the vigil mechanism and number of cases reported alongwith the status report and action taken (if any) are reported to the Committee. No personnel has been denied access to the Audit Committee.
The Vigil Mechanism is available on the Company’s website at http://www.pg.com/en_IN/invest/pghh/corporate_governance/policies.shtml.
CODE OF CONDuCT
(i) Code of Conduct for Directors
The Company has in place a Code of Conduct for its Directors and senior management. This Code is derived from three interlinked fundamental principles, viz. good corporate governance, good corporate

52 Procter & Gamble Hygiene and Health Care Limited
citizenship and exemplary personal conduct. The Board Members and Senior Management Personnel have affirmed their compliance with the Code of Conduct and a CEO certificate to that effect is annexed to this Corporate Governance Report. The Code of Conduct has been posted on the Company’s website at http://www.pg.com/en_IN/invest/pghh/corporate_governance/code_of_conduct.shtml.
(ii) Code of Conduct for Prohibition of insider Trading
The Board of the Company has adopted the Code of Conduct for prevention of Insider Trading under SEBI (Prohibition of Insider Trading) Regulations, 2015. The Code has been posted on the Company’s website at http://www.pg.com/en_IN/invest/pghh/corporate_governance/code_of_conduct.shtml.
GENERAl shAREhOlDER iNFORMATiON
i. Annual General Meeting
The 53rd Annual General Meeting will be held on Thursday, November 16, 2017 at 11.00 a.m. at Y. B. Chavan Pratisthan, Gen. Jagannathrao Bhonsle Marg, Mumbai – 400 021.
ii. Financial Calendar
Presently, the Company follows July-June Financial Year. The Financial Results are declared within timelines as prescribed by the Securities and Exchange Board of India.
iii. Book Closure Dates: Thursday, November 9, 2017, to Thursday, November 16, 2017 (both days inclusive).
The said book closure is for payment of dividend.
iV. Dividend Payment Date: Between November 23, 2017 to December 15, 2017.
V. listing of Equity shares on stock Exchange
The Company’s shares are listed on the BSE Limited, Mumbai and the National Stock Exchange of India Limited. Listing fees as prescribed have been paid to the respective Stock Exchanges.
Vi. stock Code
BSE Limited, Mumbai - Code : 500459
National Stock Exchange of India Limited - Code : PGHH
The dematerialization ISIN Code is iNE 179A01014
Vii. stock Price Data
Month BsE NsE
high low high low
July – 2016 6629.95 6165.00 6666.00 6175.00
August – 2016 7112.80 6315.05 7121.00 6295.55
September – 2016 7112.75 6491.25 7119.90 6485.00
October – 2016 7279.85 6720.05 7252.00 6767.30
November – 2016 7225.00 6427.85 7229.95 6001.00
December – 2016 7168.00 6525.00 7200.00 6500.00
January – 2017 7073.85 6667.00 7100.00 6700.10
February – 2017 7237.85 6883.15 7150.00 6865.20
March – 2017 7604.00 6667.95 7635.70 6611.15
April – 2017 7611.00 7226.80 7635.00 7260.25
May – 2017 8165.00 7300.00 8199.00 7316.00
June – 2017 8150.00 7451.55 8166.95 7460.05
(Source: www.bseindia.com & www.nseindia.com)
Note: High and low are in Rupees (`) per traded share
Viii. stock Performance in comparison to the BsE sensex and NsE Nifty
The following chart shows the performance of the Company’s shares as compared to the BSE Sensex during the Financial Year 2016-17:
The following chart shows the performance of the Company’s shares as compared to the NSE Nifty during the Financial Year 2016-17:

53Annual Report 2016-2017
Company Overview
Board’s Report
Management Discussion and Analysis
Corporate Governance
Financial Statements
iX. Registrar & Transfer Agents
Link Intime India Private Limited C-101, 247 Park, LBS Marg, Vikhroli (West), Mumbai 400 083 Tel – (022) 4918 6270, Fax – (022) 4918 6060 e-mail – [email protected]
X. share Transfer system
All Shares sent for transfer in the physical form are registered by the Registrar and Share Transfer Agents as per the terms of the SEBI Listing Regulations, 2015. Shares under objection are returned within two weeks.
All requests for dematerialization of shares are processed and the confirmation is given to the respective depositories i.e. National Securities Depository Limited (NSDL) and Central Depository Services Limited (CDSL) within 15 days.
Xi. Distribution of shareholding by size class as on June 30, 2017
shareholders shares
share holding Number % to Total
Number % to Total
Upto 500 26,909 94.00 17,51,349 5.39
501 – 1000 921 3.22 6,51,954 2.01
1001 – 2000 439 1.53 6,15,941 1.90
2001 – 3000 117 0.41 2,85,780 0.88
3001 – 4000 61 0.21 2,11,277 0.65
4001 – 5000 30 0.11 1,36,418 0.42
5001 – 10000 54 0.19 3,65,320 1.13
10001 and above 95 0.33 2,84,42,697 87.62
TOTAl 28,626 100.00 3,24,60,736 100.00
Xii. Distribution of shareholding by ownership as on June 30, 2017
Category Number of shares held
% of shares held
Foreign & Indian promoters 2,29,29,773 70.64
Resident Individuals and others 39,64,485 12.21
Mutual Funds 18,55,816 5.72
Financial Institutions/Banks 3,83,832 1.18
Insurance Companies 8,37,111 2.58
Foreign Financial Institutions 34,108 0.11
Foreign Portfolio Investors 12,34,684 3.80
Private Corporate Bodies 10,53,149 3.25
NRIs & Foreign Nationals 1,50,452 0.46
Directors and their relatives 17,326 0.05
TOTAl 3,24,60,736 100.00
Xiii. Dematerialization of shares and liquidity
The Company’s shares are required to be compulsorily traded in the stock exchanges in dematerialized form. As on June 30, 2017, the number of shares in dematerialized and physical mode is as under:
Particulars No. of shares
% to total capital issued
Held in dematerialized form in NSDL 3,12,18,673 96.17
Held in dematerialized form in CDSL 8,44,291 2.60
Held in Physical form 3,97,772 1.23
TOTAl 3,24,60,736 100.00
shares held in demat/physical form as on June 30, 2017
54 Procter & Gamble Hygiene and Health Care Limited
Declaration
As provided under the SEBI (Listing Obligations and Disclosure Requirements) Regulations, 2015, the Board Members have confirmed compliance with the Directors’ Code of Conduct for the Financial Year ended June 30, 2017 and the Senior Management has complied with the Business Conduct Manual for the Financial Year ended June 30, 2017.
For Procter & Gamble hygiene and health Care limited
sd/- MuMBAi Al RajwaniAugust 7, 2017 Managing Director
XiV. As on date, the Company has not issued GDR/ADR/warrants or any convertible instruments.
XV. unclaimed/unpaid Dividends
The amount of the unclaimed dividend for and upto the Financial Year ended June 30, 2009, has been transferred to the Investor Education and Protection Fund (“IEPF”) established by the Central Government. Those Members who have not claimed their dividend for the said periods shall not be entitled to claim the same from the Company.
Final dividend for the Financial Year ended June 30, 2010 and for the subsequent years, which remain unpaid or unclaimed, will be due for transfer to the IEPF of the Central Government on the dates mentioned in the table below. Members who have not encashed their dividend warrants for these years are requested to seek issue of duplicate warrants on or before the due dates mentioned therein, by writing to the Company’s Registrar & Share Transfer Agents, M/s Link Intime India Private Limited.
Date of Declaration
For the Financial year ended
Due for transfer to iEPF
15.10.2009 30.06.2009 20.11.2016
08.10.2010 30.06.2010 13.11.2017
23.11.2011 30.06.2011 29.12.2018
06.12.2012 30.06.2012 11.01.2020
09.12.2013 30.06.2013 14.01.2021
24.09.2014 30.06.2014 30.10.2021
28.10.2015 30.06.2015 03.12.2022
03.12.2016 30.06.2016 08.01.2024
05.05.2017 Interim 2016-17 10.06.2024
During the Financial Year 2016-17, unclaimed final dividend amount for the Financial Year ended June 30, 2009 of ` 16,82,752/- was transferred to the IEPF on December 17, 2016.
The details of unpaid/unclaimed dividend as on date of previous Annual General Meeting, i.e., December 2, 2016 have been posted on the website of the Company, viz., www.pg.com/en_IN.
XVi. Plant location
Goa:
(1) 173, 314, 315, Kundaim Industrial Estate, Kundaim, Goa - 403 115
Baddi:
(1) Khasara. No. 1808-09, Village-Doria, Export Park, Thana, Near Indo Farm, PO. Baddi, Tehsil: Nalagarh, Dist.: Solan Himachal Pradesh – 173 205
(2) Village Katha, Near Charak Pharma, PO. Baddi, Tehsil: Nalagarh, Dist.: Solan Himachal Pradesh – 173 205
XVii. Address for Correspondence: Company Secretary & Compliance Officer Procter & Gamble Hygiene and Health Care Limited, P&G Plaza, Cardinal Gracias Road, Chakala, Andheri (East), Mumbai - 400 099. Tel: (022) 2826 6000 Fax (022) 2826 7303 Email id: [email protected]

55Annual Report 2016-2017
Company Overview
Board’s Report
Management Discussion and Analysis
Corporate Governance
Financial Statements
independent Auditor’s Certificate on Corporate Governance
TO ThE MEMBERs OFPROCTER & GAMBlE hyGiENE AND hEAlTh CARE liMiTED
1. This certificate is issued in accordance with the terms of our engagement letter dated December 15, 2016.
2. We, Deloitte Haskins & Sells LLP, Chartered Accountants, the Statutory Auditors of Procter & Gamble Hygiene and Health Care Limited (“the Company”), have examined the compliance of conditions of Corporate Governance by the Company, for the year ended on June 30, 2017, as stipulated in regulations 17 to 27 and Clauses (b) to (i) of regulation 46(2) and para C and D of Schedule V of the SEBI (Listing Obligations and Disclosure Requirements) Regulations, 2015 (the Listing Regulations).
Managements’ Responsibility
3. The compliance of conditions of Corporate Governance is the responsibility of the Management. This responsibility includes the design, implementation and maintenance of internal control and procedures to ensure the compliance with the conditions of the Corporate Governance stipulated in Listing Regulations.
Auditor’s Responsibility
4. Our responsibility is limited to examining the procedures and implementation thereof, adopted by the Company for ensuring compliance with the conditions of the Corporate Governance. It is neither an audit nor an expression of opinion on the financial statements of the Company.
5. We have examined the books of account and other relevant records and documents maintained by the Company for the purposes of providing reasonable assurance on the compliance with Corporate Governance requirements by the Company.
6. We have carried out an examination of the relevant records of the Company in accordance with the Guidance Note on Certification of Corporate Governance issued by the Institute of the Chartered Accountants of India (the ICAI), the Standards on Auditing specified under Section 143(10) of the Companies Act 2013, in so far as applicable for the purpose of this certificate and as per the Guidance Note on Reports or Certificates for Special Purposes issued by the ICAI which requires that we comply with the ethical requirements of the Code of Ethics issued by the ICAI.
7. We have complied with the relevant applicable requirements of the Standard on Quality Control (SQC) 1, QualityControl for Firms that Perform Audits and Reviews of Historical Financial Information, and Other Assurance and Related Services Engagements.
Opinion
8. Based on our examination of the relevant records and according to the information and explanations provided to us and the representations provided by the Management, we certify that the Company has complied with the conditions of Corporate Governance as stipulated in regulations 17 to 27 and clauses (b) to (i) of regulation 46(2) and para C and D of Schedule V of the Listing Regulations during the year ended June 30, 2017.
9. We state that such compliance is neither an assurance as to the future viability of the Company nor the efficiency or effectiveness with which the Management has conducted the affairs of the Company.
For DElOiTTE hAsKiNs & sElls llPChartered Accountants
(Firm’s Registration No. 117366W/W-100018)
sd/- shyamak R Tata
PartnerMuMBAi, August 23, 2017 (Membership No. 038320)
56 Procter & Gamble Hygiene and Health Care Limited
To the Members of Procter & Gamble hygiene and health Care limited
Report on the ind As Financial statements
We have audited the accompanying Ind AS financial statements of Procter & Gamble hygiene and health Care limited (“the Company”), which comprise the Balance Sheet as at June 30, 2017 and the Statement of Profit and Loss (including Other Comprehensive Income), the Cash Flow Statement and the Statement of Changes in Equity for the year then ended, and a summary of the significant accounting policies and other explanatory information.
Management’s Responsibility for the ind As Financial statements
The Company’s Board of Directors is responsible for the matters stated in Section 134(5) of the Companies Act, 2013 (“the Act”) with respect to the preparation of these Ind AS financial statements that give a true and fair view of the financial position, financial performance including other comprehensive income, cash flows and changes in equity of the Company in accordance with the accounting principles generally accepted in India, including the Indian Accounting Standards (Ind AS) specified under Section 133 of the Act.
This responsibility also includes maintenance of adequate accounting records in accordance with the provisions of the Act for safeguarding the assets of the Company and for preventing and detecting frauds and other irregularities; selection and application of appropriate accounting policies; making judgements and estimates that are reasonable and prudent; and design, implementation and maintenance of adequate internal financial controls, that were operating effectively for ensuring the accuracy and completeness of the accounting records, relevant to the preparation and presentation of the Ind AS financial statements that give a true and fair view and are free from material misstatement, whether due to fraud or error.
Auditor’s Responsibility
Our responsibility is to express an opinion on these Ind AS financial statements based on our audit.
In conducting our audit, we have taken into account the provisions of the Act, the accounting and auditing standards and matters which are required to be included in the audit report under the provisions of the Act and the Rules made thereunder.
We conducted our audit of the Ind AS financial statements in accordance with the Standards on Auditing specified under Section 143(10) of the Act. Those Standards require that we comply with ethical requirements and plan and perform the audit to obtain reasonable assurance about whether the Ind AS financial statements are free from material misstatement.
An audit involves performing procedures to obtain audit evidence about the amounts and the disclosures in the Ind AS financial statements. The procedures selected depend on the auditor’s judgement, including the assessment of the risks of material misstatement of the Ind AS financial statements, whether due to fraud or error. In making those risk assessments, the auditor considers internal financial control relevant to the Company’s preparation of the Ind AS financial statements that give a true and fair view in order to design audit procedures that are appropriate in the circumstances. An audit also includes evaluating the appropriateness of the accounting policies used and the reasonableness of the accounting estimates made by the Company’s Directors, as well as evaluating the overall presentation of the Ind AS financial statements.
We believe that the audit evidence obtained by us is sufficient and appropriate to provide a basis for our audit opinion on the Ind AS financial statements.
Opinion
In our opinion and to the best of our information and according to the explanations given to us, the aforesaid Ind AS financial statements give the information required by the Act in the manner so required and give a true and fair view in conformity with the accounting principles generally accepted in India, of the state of affairs of the Company as at June 30, 2017, and its profit, total comprehensive income, its cash flows and the changes in equity for the year ended on that date.
Report on Other legal and Regulatory Requirements
1. As required by Section 143(3) of the Act, based on our audit, we report, to the extent applicable that:
(a) We have sought and obtained all the information and explanations which to the best of our knowledge and belief were necessary for the purposes of our audit.
(b) In our opinion, proper books of account as required by law have been kept by the Company
iNDEPENDENT AuDiTORs’ REPORT

57Annual Report 2016-2017
Company Overview
Board’s Report
Management Discussion and Analysis
Corporate Governance
Financial Statements
so far as it appears from our examination of those books.
(c) The Balance Sheet, the Statement of Profit and Loss including Other Comprehensive Income, the Cash Flow Statement and Statement of Changes in Equity dealt with by this Report are in agreement with the books of account.
(d) In our opinion, the aforesaid Ind AS financial statements comply with the Indian Accounting Standards prescribed under Section 133 of the Act.
(e) On the basis of the written representations received from the directors as on June 30, 2017 taken on record by the Board of Directors, none of the directors is disqualified as on June 30, 2017 from being appointed as a director in terms of Section 164(2) of the Act.
(f) With respect to the adequacy of the internal financial controls over financial reporting of the Company and the operating effectiveness of such controls, refer to our separate Report in “Annexure A”. Our report expresses an unmodified opinion on the adequacy and operating effectiveness of the Company’s internal financial controls over financial reporting.
(g) With respect to the other matters to be included in the Auditor’s Report in accordance with Rule 11 of the Companies (Audit and Auditors) Rules, 2014, as amended, in our opinion and to the best of our information and according to the explanations given to us:
i. The Company has disclosed the impact of pending litigations on its financial position in its Ind AS financial statements.
ii. The Company did not have any long–term contracts including derivative contracts for which there were any material foreseeable losses.
iii. There has been no delay in transferring amounts, required to be transferred, to the Investor Education and Protection Fund by the Company.
iv. The Company did not have any holdings or dealings in Specified Bank Notes as defined in the Notification S.O. 3407(E) dated the November 8, 2016 of the Ministry of Finance, during the period from November 8, 2016 to December 30, 2016.
2. As required by the Companies (Auditor’s Report) Order, 2016 (“the Order”) issued by the Central Government in terms of Section 143(11) of the Act, we give in “Annexure B” a statement on the matters specified in paragraphs 3 and 4 of the Order.
For DELOITTE HASKINS & SELLS LLPChartered Accountants
(Firm’s Registration No. 117366W/W-100018)
Sd/- Shyamak R Tata
Partner (Membership No. 038320)
MUMBAI, August 23, 2017

58 Procter & Gamble Hygiene and Health Care Limited
Report on the internal Financial Controls Over Financial Reporting under Clause (i) of sub-section 3 of section 143 of the Companies Act, 2013 (“the Act”)
We have audited the internal financial controls over financial reporting of Procter & Gamble Hygiene and Health Care Limited (“the Company”) as of June 30, 2017 in conjunction with our audit of the Ind AS financial statements of the Company for the year ended on that date.
Management’s Responsibility for internal Financial Controls
The Company’s Management is responsible for establishing and maintaining internal financial controls based on the internal control over financial reporting criteria established by the Company considering the essential components of internal control stated in the Guidance Note on Audit of Internal Financial Controls over Financial Reporting issued by the Institute of Chartered Accountants of India (“ICAI”). These responsibilities include the design, implementation and maintenance of adequate internal financial controls that were operating effectively for ensuring the orderly and efficient conduct of its business, including adherence to Company’s policies, the safeguarding of its assets, the prevention and detection of frauds and errors, the accuracy and completeness of the accounting records, and the timely preparation of reliable financial information, as required under the Companies Act, 2013.
Auditors’ Responsibility
Our responsibility is to express an opinion on the Company’s internal financial controls over financial reporting based on our audit. We conducted our audit in accordance with the Guidance Note on Audit of Internal Financial Controls Over Financial Reporting (the “Guidance Note”) issued by the Institute of Chartered Accountants of India and the Standards on Auditing prescribed under Section 143(10) of the Companies Act, 2013, to the extent applicable to an audit of internal financial controls. Those Standards and the Guidance Note require that we comply with ethical requirements and plan and perform the audit to obtain reasonable assurance about whether adequate internal financial controls over financial reporting was established and maintained and if such controls operated effectively in all material respects.
Our audit involves performing procedures to obtain audit evidence about the adequacy of the internal financial controls system over financial reporting and their operating effectiveness. Our audit of internal financial controls over financial reporting included obtaining an understanding of internal financial controls over financial reporting, assessing the risk that a material weakness exists, and testing and evaluating the design and operating effectiveness of internal control based on the assessed risk. The procedures selected depend on the auditor’s judgement, including the assessment of the risks of material misstatement of the financial statements, whether due to fraud or error.
We believe that the audit evidence we have obtained is sufficient and appropriate to provide a basis for our audit opinion on the Company’s internal financial controls system over financial reporting.
Meaning of internal Financial Controls Over Financial Reporting
A Company’s internal financial control over financial reporting is a process designed to provide reasonable assurance regarding the reliability of financial reporting and the preparation of financial statements for external purposes in accordance with generally accepted accounting principles. A Company’s internal financial control over financial reporting includes those policies and procedures that (1) pertain to the maintenance of records that, in reasonable detail, accurately and fairly reflect the transactions and dispositions of the assets of the Company; (2) provide reasonable assurance that transactions are recorded as necessary to permit preparation of financial statements in accordance with generally accepted accounting principles, and that receipts and expenditures of the Company are being made only in accordance with authorisations of Management and Directors of the Company; and (3) provide reasonable assurance regarding prevention or timely detection of unauthorised acquisition, use, or disposition of the Company’s assets that could have a material effect on the financial statements.
inherent limitations of internal Financial Controls Over Financial Reporting
Because of the inherent limitations of internal financial controls over financial reporting, including the possibility
ANNEXuRE – “A” TO ThE iNDEPENDENT AuDiTORs’ REPORT(Referred to in paragraph 1(f) under ‘Report on Other legal and Regulatory Requirements’ section of our report of even date)
59Annual Report 2016-2017
Company Overview
Board’s Report
Management Discussion and Analysis
Corporate Governance
Financial Statements
of collusion or improper Management override of controls, material misstatements due to error or fraud may occur and not be detected. Also, projections of any evaluation of the internal financial controls over financial reporting to future periods are subject to the risk that the internal financial control over financial reporting may become inadequate because of changes in conditions, or that the degree of compliance with the policies or procedures may deteriorate.
Opinion
In our opinion, to the best of our information and according to the explanations given to us, the Company has, in all material respects, an adequate internal financial controls system over financial reporting and such internal financial controls over financial reporting were operating effectively
as at June 30, 2017, based on the internal control over financial reporting criteria established by the Company considering the essential components of internal control stated in the Guidance Note on Audit of Internal Financial Controls Over Financial Reporting issued by the Institute of Chartered Accountants of India.
For DELOITTE HASKINS & SELLS LLPChartered Accountants
(Firm’s Registration No. 117366W/W-100018)
Sd/- Shyamak R Tata
Partner (Membership No. 038320)
MUMBAI, August 23, 2017

60 Procter & Gamble Hygiene and Health Care Limited
(i) a. The Company has maintained proper records showing full particulars, including quantitative details and situation of the property, plant and equipment.
b. The property, plant and equipment were physically verified during the year by the Management in accordance with a regular programme of verification which, in our opinion, provides for physical verification of all the property, plant and equipment at reasonable intervals. According to the information and explanations given to us no material discrepancies were noticed on such verification.
c. According to the information and explanations given to us and the records examined by us and based on the examination of the registered sale deed / transfer deed / conveyance deed provided to us, we report that, the title deeds, comprising all the immovable properties of land and buildings, other than self-constructed buildings, are held in the name of the Company as at the balance sheet date. In respect of immovable property of land that have been taken on lease and disclosed as non-current / current assets in the financial statements, the lease agreements are in the name of the Company, where the Company is the lessee in the agreement.
(ii) As explained to us, the inventories were physically verified during the year by the Management at reasonable intervals and no material discrepancies were noticed on such physical verification.
(iii) The Company has not granted any loans, secured or unsecured, to companies, firms, Limited Liability Partnerships or other parties covered in the Register maintained under Section 189 of the Companies Act, 2013.
(iv) In our opinion and according to the information and explanation given to us, the Company has complied with the provisions of Section 185 and 186 of the Companies Act, 2013 in respect of grant of loans, making investments and providing guarantees and securities, as applicable.
(v) According to the information and explanations given to us, the Company has not accepted any deposit during the year within the meaning of the provisions of Sections 73 and 76 or any other relevant provisions of the Companies Act, 2013. According to the information and explanations given to us, no order
has been passed by the Company Law Board or the National Company Law Tribunal or the Reserve Bank of India or any Court or any other Tribunal on the Company.
(vi) The maintenance of cost records has been prescribed by the Central Government under Section 148(1) of the Companies Act, 2013 in respect of specified products of the Company. For such products, we have broadly reviewed the cost records maintained by the Company pursuant to the Companies (Cost Records and Audit) Rules, 2014, as amended, and are of the opinion that, prima facie, the prescribed cost records have been made and maintained. We have, however, not made a detailed examination of the cost records with a view to determine whether they are accurate or complete.
(vii) According to the information and explanations given to us and according to the books and records as produced and examined by us, in our opinion:
a. The Company has been regular in depositing undisputed statutory dues including Provident Fund, Employees’ State Insurance, Income Tax, Sales Tax, Service Tax, Customs Duty, Excise Duty, Value Added Tax, Cess and other material statutory dues as applicable to it with the appropriate authorities.
b. As at June 30, 2017, the following are the particulars of dues on account of Income Tax, Sales Tax, Service Tax, Custom Duty, Excise Duty and Value Added Tax matters that have not been deposited on account of any dispute:
Name of statute Nature of dues
Forum where dispute is pending
Period to which the amount relates*
Amount involved
(` in lakhs)
Sales Tax Laws as per statutes applicable in various states
Sales Tax Appellate Authority – upto Commissioners/ Revisional authorities level
1997-98 to 2001-02,
2003-04 to 2014-2015
2 615
Appellate Authority – Tribunal
1996-97, 2001-02,
2005-06 to 2007-08
and 2012-13
710
High Court 1990-91 to 1997-98,
2002-03 and 2006-07 to
2009-10
137
sub-total 3 462
ANNEXuRE – “B” TO ThE iNDEPENDENT AuDiTORs’ REPORT(Referred to in paragraph 2 under ‘Report on Other legal and Regulatory Requirements’ section of our report of even date)

61Annual Report 2016-2017
Company Overview
Board’s Report
Management Discussion and Analysis
Corporate Governance
Financial Statements
Name of Statute Nature of dues
Forum where dispute is pending
Period to which the amount relates*
Amount involved
(` in lakhs)
The Central Excise Act, 1944
Excise Duty Customs, Excise and Service Tax Appellate Tribunal
2004-05 to 2008-09
10
Sub-total 10
Custom Act, 1962 Custom Duty Commissioner of Customs
1998-99 19
Sub-total 19
Finance Act, 1994 Service Tax Appellate Authority - upto Commissioners/ Revisional authorities level
2006-07 to 2012-13
1 225
Sub-total 1 225
Income Tax Act, 1961
Income Tax Income Tax Appellate Tribunal
2008-09, 2009-10 and
2011-12
5 864
Sub-total 5 864
Total 10 580
*generally, the year refers to the period April to March.
Out of the total disputed dues aggregating ` 10 580 lakhs as above, ` 5 864 lakhs has been stayed for recovery by the relevant authorities.
(viii) The Company has not taken any loans or borrowings from financial institutions, banks and government or has not issued any debentures and hence reporting under clause (viii) of the Order is not applicable to the Company.
(ix) The Company has not raised moneys by way of initial public offer or further public offer (including debt instruments) or term loans and hence reporting under clause (ix) of the Order is not applicable.
(x) To the best of our knowledge and according to the information and explanations given to us, no fraud by the Company and no material fraud on the Company by its officers or employees has been noticed or reported during the year.
(xi) In our opinion and according to the information and explanation given to us, the Company has paid / provided managerial remuneration in accordance with the requisite approvals mandated by the provisions of section 197 read with Schedule V to the Companies Act, 2013.
(xii) The Company is not a Nidhi Company and hence reporting under clause (xii) of the Order is not applicable.
(xiii) In our opinion and according to the information and explanation given to us the Company is in compliance with Section 177 and 188 of the Companies Act, 2013, where applicable, for all transactions with the related parties and the details of related party transactions have been disclosed in the financial statements etc. as required by the applicable accounting standards.
(xiv) During the year the Company has not made any preferential allotment or private placement of shares or fully or partly convertible debentures and hence reporting under clause (xiv) of the Order is not applicable to the Company.
(xv) In our opinion and according to the information and explanations given to us, during the year the Company has not entered into any non-cash transactions with its directors or directors of its Holding Company or persons connected with them and hence provisions of section 192 of the Companies Act, 2013 are not applicable. The Company did not have any subsidiary or associate company during the year.
(xvi) The Company is not required to be registered under section 45-IA of the Reserve Bank of India Act, 1934.
For DELOITTE HASKINS & SELLS LLPChartered Accountants
(Firm’s Registration No. 117366W/W-100018)
Sd/- Shyamak R Tata
Partner (Membership No. 038320)
MUMBAI, August 23, 2017

62 Procter & Gamble Hygiene and Health Care Limited
Balance Sheet as at June 30, 2017Notes As at
June 30, 2017As at
June 30, 2016As at
July 1, 2015` in lakhs ` in lakhs ` in lakhs
ASSetSNon-current assets Property, plant and equipment 4 28 571 31 743 30 934 Capital work-in-progress 4 4 084 3 472 3 898 Financial assets (i) Loans 6 5 096 5 677 5 655 (ii) Other financial assets 7 103 181 88 Deferred tax assets (Net) 15 2 627 894 396 Income tax assets (Net) 14 363 10 697 17 389 Other non-current assets 10 855 789 853total non-current assets 55 699 53 453 59 213Current assets Inventories 8 17 735 12 748 11 907 Financial assets (i) Trade receivables 5 13 280 14 962 11 394 (ii) Cash and cash equivalents 9 (a) 10 244 1 06 659 61 478 (iii) Bank balances other than (ii) above 9 (b) 1 439 659 297 (iv) Loans 6 9 760 20 586 41 856 (v) Other financial assets 7 6 250 6 379 5 436 Other current assets 10 1 605 1 195 3 262total current assets 60 313 1 63 188 1 35 630total assets 1 16 012 2 16 641 1 94 843equity ANd LiABiLitieSequity Equity share capital 11 3 246 3 246 3 246 Other equity 12 49 366 1 61 932 1 31 326total equity 52 612 1 65 178 1 34 572LiabilitiesNon-current liabilities Provisions 14 417 357 333total non-current liabilities 417 357 333Current liabilities Financial liabilities (i) Trade payables Due to micro and small enterprises 16 324 474 157 Due to others 16 35 995 31 939 37 073 (ii) Other financial liabilities 13 2 696 1 712 1 141 Provisions 14 415 310 364 Current tax liabilities (Net) 17 12 071 8 220 13 690 Other current liabilities 18 11 482 8 451 7 513total current liabilities 62 983 51 106 59 938total liabilities 63 400 51 463 60 271total equity and liabilities 1 16 012 2 16 641 1 94 843See accompanying notes to the financial statements
In terms of our report attachedFor deLOitte HASKiNS & SeLLS LLP For and on behalf of Board of directorsChartered Accountants R. A. Shah Karthik Natarajan
Chairman DirectorShyamak R tataPartner Prashant Bhatnagar i Sonthalia
Chief Financial Officer Company SecretaryPlace: Mumbai date: August 23, 2017

63Annual Report 2016-2017
Company Overview
Board’s Report
Management Discussion and Analysis
Corporate Governance
Financial Statements
Statement of Profit and Loss for the year ended June 30, 2017Notes year ended
June 30, 2017year ended
June 30, 2016` in lakhs ` in lakhs
income Revenue from operations 19 2 41 916 2 34 915 Other income 20 7 730 8 761
total income 2 49 646 2 43 676
expenses Cost of raw and packing materials consumed 21 61 252 56 198 Purchases of stock-in-trade (Traded Goods) 35 356 33 350 Changes in inventories of finished goods, work-in-progress
and stock-in-trade22 (5 111) (1 071)
Excise duty 9 876 7 376 Employee benefits expense 23 11 410 11 735 Finance costs 24 1 042 627 Depreciation expense 4 5 974 5 167 Other expenses 25 62 670 66 744
total expense 1 82 469 1 80 126
Profit before tax from operations 67 177 63 550 Tax expense
– Current tax 26.1 25 226 21 728 – Deferred tax 26.1 (1 322) (428)
income tax expense 23 904 21 300Profit for the year 43 273 42 250Other comprehensive income Items that will not be reclassified to Statement of Profit and Loss
Re-measurement of the defined benefit plans 29.2.B (1 189) (202) Income tax effect 26.2 411 70
total other comprehensive income for the year (778) (132)
total comprehensive income for the year 42 495 42 118
Earnings per equity share 28
– Basic (in `) 133.31 130.16
– Diluted (in `) 133.31 130.16
Face Value of Equity Share (in `) 10.00 10.00
See accompanying notes to the financial statements
In terms of our report attachedFor deLOitte HASKiNS & SeLLS LLP For and on behalf of Board of directorsChartered Accountants R. A. Shah Karthik Natarajan
Chairman DirectorShyamak R tataPartner Prashant Bhatnagar i Sonthalia
Chief Financial Officer Company SecretaryPlace: Mumbai date: August 23, 2017

64 Procter & Gamble Hygiene and Health Care Limited
Statement of Cash Flows for the year ended June 30, 2017year ended
June 30, 2017year ended
June 30, 2016 ` in lakhs ` in lakhs
A. Cash Flows from Operating Activities
Profit before tax 67 177 63 550
Adjustments for:
Depreciation expense 5 974 5 167
Loss on disposal of property, plant and equipment 1 005 251
Finance costs 1 042 627
Allowance for doubtful receivables (Net of recovery) 21 78
Interest income (7 478) (8 475)
Net foreign exchange (gain)/loss (6) 22
Expense recognised in respect of equity settled share based payments
437 306
Operating profit before working capital changes 68 172 61 526
Working capital adjustments
Decrease/(increase) in trade and other receivables 1 672 (3 659)
(Increase)/decrease in financial assets (995) 716
(Increase) in inventories (4 987) (841)
(Increase)/decrease in other assets (476) 2 131
Increase/(decrease) in trade and other payables 6 004 (4 437)
Increase/(decrease) in provisions 136 (57)
Cash generated from operations 69 526 55 379
Income taxes paid (25 000) (20 133)
Net cash generated from operating activities 44 526 35 246
B. Cash Flows from investing Activities
Interest received 9 087 6 398
Loans realised 31 000 62 600
Loans given (20 000) (41 300)
Payment to acquire property, plant and equipment (4 413) (5 265)
Proceeds from sale of property, plant and equipment 35 34
Net bank deposits (placed)/matured (42) 66
Changes in earmarked balances (738) (428)
Net cash generated by investing activities 14 929 22 105

65Annual Report 2016-2017
Company Overview
Board’s Report
Management Discussion and Analysis
Corporate Governance
Financial Statements
year ended June 30, 2017
year ended June 30, 2016
` in lakhs ` in lakhs
C. Cash Flows from Financing Activities
Dividend and dividend tax paid (1 55 498) (11 818)
Interest paid (372) (352)
Net cash flows used in financing activities (1 55 870) (12 170)
Net (decrease)/increase in cash and cash equivalents (96 415) 45 181
Cash and cash equivalents at the beginning of the year 1 06 659 61 478
Cash and cash equivalents at the end of the year (refer note 9(a)) 10 244 1 06 659
Note:
The above Cash Flow Statement has been prepared under the “Indirect Method” as set out in the Indian Accounting Standard (Ind AS 7) - Statement of Cash Flows.
See accompanying notes to the financial statements
In terms of our report attachedFor deLOitte HASKiNS & SeLLS LLP For and on behalf of Board of directorsChartered Accountants R. A. Shah Karthik Natarajan
Chairman DirectorShyamak R tataPartner Prashant Bhatnagar i Sonthalia
Chief Financial Officer Company SecretaryPlace: Mumbai date: August 23, 2017
Statement of Cash Flows for the year ended June 30, 2017

66 Procter & Gamble Hygiene and Health Care Limited
Statement of Changes in equity for the year ended June 30, 2017Statement of Changes in equity for the year ended June 30, 2017
Amount` in lakhs
a. equity share capitalBalance as at July 1, 2015 3 246
Changes in equity share capital during the year —
Balance as at June 30, 2016 3 246
Changes in equity share capital during the year —
Balance as at June 30, 2017 3 246
b. Other equityAttributable to the equity share holders of the Company
Reserves & surplus
General reserve
Securities premium reserve
Share options outstanding
accountRetained earnings total
` in lakhs ` in lakhs ` in lakhs ` in lakhs ` in lakhs
Balance as at July 1, 2015 26 727 7 519 48 97 032 1 31 326
Profit for the year — — — 42 250 42 250
Items of OCI for the year, net of tax
Remeasurement benefit of defined benefit plans
— — — (132) (132)
total comprehensive income for the year — — — 42 118 42 118
Payment of dividends (refer note 39) — — — (9 819) (9 819)
Payment of dividend distribution tax — — — (1 999) (1 999)
Transfer from retained earnings 4 232 — — (4 232) —
Recognition of share-based payments — — 306 — 306
Balance as at June 30, 2016 30 959 7 519 354 1 23 100 1 61 932
Profit for the year — — — 43 273 43 273
Items of OCI for the year, net of tax
Remeasurement benefit of defined benefit plans
— — — (778) (778)
total comprehensive income for the year — — — 42 495 42 495
Payment of dividends (refer note 39) — — — (1 29 194) (1 29 194)
Payment of dividend distribution tax — — — (26 304) (26 304)
Recognition of share-based payments — — 437 — 437
Balance as at June 30, 2017 30 959 7 519 791 10 097 49 366
See accompanying notes to the financial statements
In terms of our report attached
For deLOitte HASKiNS & SeLLS LLP For and on behalf of Board of directorsChartered Accountants R. A. Shah Karthik Natarajan
Chairman DirectorShyamak R tataPartner Prashant Bhatnagar i Sonthalia
Chief Financial Officer Company SecretaryPlace: Mumbai date: August 23, 2017

67Annual Report 2016-2017
Company Overview
Board’s Report
Management Discussion and Analysis
Corporate Governance
Financial Statements
Notes to Financial Statements for the year ended June 30, 2017
1. Corporate information
Procter & Gamble Hygiene and Health Care Limited (‘the Company’) is a public company domiciled in India and is incorporated under the provisions of the Companies Act, 1956. Its ordinary shares (Equity) are listed on two recognised stock exchanges in India. The registered office of the Company is located at P&G Plaza, Cardinal Gracias Road, Chakala, Andheri (E), Mumbai - 400099.
The Company is engaged in manufacturing and selling of branded packaged fast moving consumer goods in the femcare and healthcare businesses. The Company’s products are sold through retail operations including mass merchandisers, grocery stores, membership club stores, drug stores, department stores and high frequency stores. The Company has its manufacturing locations at Goa and Baddi in Himachal Pradesh, apart from third party manufacturing locations spread across India.
2. Significant accounting policies
2.1 Statement of compliance
The financial statements of the Company have been prepared in accordance with Indian Accounting Standard (Ind AS) as per the Companies (Indian Accounting Standards) Rules, 2015 as amended and notified under Section 133 of the Companies Act, 2013 (“the Act”) and other relevant provisions of the Act.
Upto the year ended June 30, 2016, the Company prepared its financial statements in accordance with the requirements of previous GAAP, which includes Standards notified under the Companies (Accounting Standard) Rules, 2006 notified under Section 133 of the Act and other relevant provisions of the Act. These are the Company’s first Ind AS financial statements. The date of transition to Ind AS is July 1, 2015. Refer Note 2.4 for the details of first-time adoption exemptions availed by the Company.
2.2 Basis of preparation and presentation
The financial statements have been prepared on the historical cost basis except for certain items that are measured at fair values at the end of the reporting period, as explained in accounting policies below.
Historical cost is generally based on the fair value of the consideration given in exchange for goods and services.
Fair value is the price that would be received to sell an asset or paid to transfer a liability in an orderly transaction between market participants at the measurement date, regardless of whether that price is directly observable or estimated using another valuation technique. In estimating the fair value of an asset or a liability, the Company takes into account the characteristics of the asset or liability if market participants would take those characteristics into account when pricing the asset or liability at the measurement date. Fair value for measurement and/or disclosure purposes in these financial statements is determined on such a basis, except for share-based payment transactions that are within the scope of Ind AS 102, leasing transactions that are within the scope of Ind AS 17, and measurement that have some similarities to fair value but are not fair value, such as net realisable value in Ind AS 2.
In addition, for the financial reporting purposes, fair value measurements are categorised into Level 1, 2, or 3 based on the degree to which the inputs to the fair value measurements are observable and the significance of the inputs to the fair value measurement in its entirety, which are described as follows:
Level 1 inputs are quoted prices (unadjusted) in active markets for identical assets or liabilities that the entity can access at the measurement date;
Level 2 inputs are inputs, other than quoted prices included within level 1, that are observable for asset or liability, either directly or indirectly; and
Level 3 inputs are unobservable inputs for the asset or liability.
2.3 Summary of Significant accounting policies
a. Revenue recognition
Revenue is recognised to the extent that it is probable that the economic benefits will flow to the Company and the revenue can be reliably measured, regardless of when the payment is being made. Revenue is measured

68 Procter & Gamble Hygiene and Health Care Limited
Notes to Financial Statements for the year ended June 30, 2017
at the fair value of the consideration received or receivable, taking into account contractually defined terms of payment and excluding taxes or duties collected on behalf of the government. The Company has concluded that it is the principal in all of its revenue arrangements since it is the primary obligor in all the revenue arrangements as it has pricing latitude and is also exposed to inventory and credit risks. Revenue is reduced for rebates and other similar allowances.
The Company’s revenue includes recovery of excise duty flows to the Company on its own account. This is for the reason that it is the liability of the manufacturer which forms part of the cost of production, irrespective of whether the goods are sold or not. Since the recovery of excise duty flows to the company on its own account, revenue includes excise duty.
However, sales tax/value added tax (VAT) is not received by the company on its own account. Rather, it is tax collected on value added to the commodity by the seller on behalf of the government. Accordingly, it is excluded from revenue.
The specific recognition criteria described below must also be met before revenue is recognised.
Sale of goods
Revenue from the sale of goods is recognised when the goods are delivered and titles have passed, at which time all the following conditions are satisfied:
a. the Company has transferred to the buyer the significant risks and rewards of ownership of the goods;
b. the Company retains neither continuing managerial involvement to the degree usually associated with ownership nor effective control over the goods sold;
c. the amount of revenue can be measured reliably;
d. it is probable that the economic benefits associated with the transaction will flow to the Company; and
e. the costs incurred or to be incurred in respect of the transaction can be measured reliably.
interest income
Interest income is recorded using the Effective Interest Rate (EIR). Interest income is included in other income in the Statement of Profit and Loss.
b. Leasing
Leases are classified as finance lease whenever the terms of the lease transfer substantially all the risks and rewards of ownership to the lessee. All other leases are classified as operating lease.
The determination of whether an arrangement is (or contains) a lease is based on the substance of the arrangement at the inception of the lease. The arrangement is, or contains, a lease if fulfillment of the arrangement is dependent on the use of a specific asset or assets and the arrangement conveys a right to use the asset or assets, even if that right is not explicitly specified in an arrangement.
For arrangements entered into prior to July 1, 2015, the Company has determined whether the arrangement contain lease on the basis of facts and circumstances existing on the date of transition.
the Company as a lessee
Assets held under finance leases are initially recognised at their fair value at the inception of the lease or, if lower, at the present value of the minimum lease payments. The corresponding liability to the lessor is included in the balance sheet as a financial lease obligation.
Lease payments are apportioned between finance expenses and reduction of the lease obligation so as to achieve a constant rate of interest on the remaining balance of the liability. Finance expenses are recognised immediately in the Statement of Profit and Loss, unless they are directly attributable to qualifying assets, in which case they are capitalised in accordance with the Company’s general policy on the borrowing costs (refer note 2.3(d)).

69Annual Report 2016-2017
Company Overview
Board’s Report
Management Discussion and Analysis
Corporate Governance
Financial Statements
Notes to Financial Statements for the year ended June 30, 2017
Rental expenses from operating leases is generally recognised on a straight-line basis over the lease term of the relevant lease. Where the rentals are structured solely to increase in line with the expected general inflation to compensate for the lessor’s expected inflationary cost increase, such increases are recognised in the year in which such benefits accrue. Contingent rental arising under operating leases are recognised as an expense in the period in which they are incurred.
In the event that lease incentives are received to enter into operating leases, such incentives are recognised as a liability. The aggregate benefit of incentives is recognised as a reduction of rental expense on a straight-line basis, except where another systematic basis is more representative of the time pattern in which economic benefits from the leased asset are consumed.
c. Foreign currencies
The financial statements are presented in Indian Rupees (` in lakhs), which is also the Company’s functional currency.
transaction and balances
Transactions in currencies other than the Company’s functional currency i.e. (foreign currencies) are recognised at the rates of exchange prevailing at the dates of the transactions. At the end of each reporting period, monetary items denominated in foreign currencies are retranslated at the rates prevailing at that date. Non-monetary items carried at fair value that are denominated in foreign currencies are retranslated at the rates prevailing at the date when the fair value is determined. Non-monetary items that are measured in terms of historical cost in a foreign currency are not retranslated.
Exchange differences on monetary items are recognised in the Statement of Profit and Loss in the period which they arise.
d. Borrowing costs
Borrowing costs directly attributable to the acquisition, construction or production of qualifying assets, which are assets that necessarily takes a substantial period of time to get ready for its intended use or sale, are added to the cost of those assets, until such time as the assets are substantially ready for their intended use or sale.
All other borrowing costs are recognised in the Statement of Profit and Loss in the period in which they are incurred.
e. employee benefits
(i) Post-employment Benefits
(a) Defined Contribution Plans:
The Company has Defined Contribution Plans for post employment benefits charged to the Statement of Profit and Loss, in the form of
– Provident Fund administered by the Regional Provident Fund Commissioner;
– Superannuation Fund as per Company policy administered by Company managed trust; and
– State Defined Contribution Plans: Employer’s Contribution to Employees’ State Insurance.
(b) Defined Benefit Plans:
Funded Plan: The Company has Defined Benefit Plan for post employment benefits in the form of
– Gratuity for all employees administered through trust.
Unfunded Plan: The Company has unfunded Defined Benefit Plans in the form of Post Retirement Medical Benefits (PRMB) and Compensated Absences (plant technicians) as per its policy.
Liability for the above defined benefit plans is provided on the basis of valuation, as at the Balance Sheet date, carried out by independent actuary. The actuarial method used for measuring the liability is the Projected Unit Credit method.

70 Procter & Gamble Hygiene and Health Care Limited
Notes to Financial Statements for the year ended June 30, 2017
Remeasurements, comprising actuarial gains and losses, the effect of the asset ceiling, excluding amounts included in net interest on the net defined benefit liability and the return on plan assets (excluding amounts included in net interest on the net defined benefit liability), are recognised immediately in the balance sheet with a corresponding debit or credit to retained earnings through other comprehensive income in the period in which they occur. Remeasurements are not reclassified to the Statement of Profit and Loss in subsequent periods.
Past service costs are recognised in the Statement of Profit and Loss on the earlier of:
The date of the plan amendment or curtailment, and
The date that the company recognises related restructuring costs
Net interest is calculated by applying the discount rate at the beginning of the year to the net defined benefit liability or asset. The Company recognises the following changes in the net defined benefit obligation as an expense in the Statement of Profit and Loss:
Service costs comprising current service costs, past-service costs, gains and losses on curtailments and non-routine settlements; and
Net interest expense or income
(ii) Liability for Compensated Absences and Leave Travel Allowance which are in the nature of short term benefits is provided for as per company rules based on the undiscounted amount of benefits expected to be paid in exchange of services rendered.
(iii) Termination benefits and long service awards in terms of Company policy are recognised as an expense as and when incurred.
f. Share-based payment arrangements
Employees (including senior executives) of the Company receive remuneration in the form of share-based payments, whereby employees render services as consideration for equity instruments (equity-settled transactions).
equity-settled transactions
The Procter & Gamble Company, USA has an “Employee Stock Option Plan (ESOP)” whereby the specified employees covered by the plan are granted an option to purchase shares of the Ultimate Holding Company i.e. - The Procter & Gamble Company, USA at a fixed price (grant price) for a fixed period of time. The difference between the market price and grant price on the exercise of the stock options issued by the Ultimate Holding Company to the employees of the Company is charged in the year of exercise by the employees. Parent Company will recharge an amount equal to spread as on date of exercise of options.
The cost of equity-settled transactions is recognised in employee benefits expense (refer note 2.3(e)), together with a corresponding increase in equity (other reserves) over the period in which the service and performance conditions are fulfilled (the vesting period). The cumulative expense recognised for equity-settled transactions at each reporting date until the vesting date reflects the extent to which the vesting period has expired and the Company’s best estimate of the number of equity instruments that will ultimately vest. Recharge to parent company to the extent of fair value of options will be debited in equity reserves and any excess recharge above the fair value of options will be recognised as equity distribution from the company. However in respect of options granted and fully vested prior to the IND AS transition date i.e. July 1, 2015, the Company would continue to account for the same in the Statement of Profit and Loss in the period when the employee exercises and the same is re-charged by the Parent to the Company.
employee share purchase plan
The Procter & Gamble Company, USA has an “International Stock Ownership Plan (ISOP)” (employee share purchase plan) whereby specified employees of its subsidiaries have been given a right to purchase shares of the Ultimate Holding Company i.e. The Procter & Gamble Company, USA. Every employee who opts for the scheme contributes by way of payroll deduction up to a specified percentage (upto 15%) of base salary

71Annual Report 2016-2017
Company Overview
Board’s Report
Management Discussion and Analysis
Corporate Governance
Financial Statements
towards purchase of shares on a monthly basis. The Company contributes 50% of employee’s contribution (restricted to 2.5% of his base salary) and charged to employee benefits expense. The expenses related to ISOP are recognised immediately in the Statement of Profit and Loss since there are no vesting conditions attached to the scheme.
The expense in the Statement of Profit and Loss for a period represents the movement in cumulative expense recognised as at the beginning and end of that period.
When the terms of an equity-settled award are modified, the minimum expense recognised is the expense had the terms had not been modified, if the original terms of the award are met. An additional expense is recognised for any modification that increases the total fair value of the share-based payment transaction, or is otherwise beneficial to the employee as measured at the date of modification. Where an award is cancelled by the entity or by the counterparty, any remaining element of the fair value of the award is expensed immediately through the Statement of Profit and Loss.
g. taxation Income tax expense represents the sum of the current tax and deferred tax.
Current tax
Provision for current tax for the Company’s financial year ended on June 30 is based on the results of the period July 1 to March 31 (later part of the fiscal year ended March 31) and for the balance period April 1 to June 30 (beginning of the next fiscal year) as per the provisions of the Income Tax Act, 1961 and other applicable tax laws. Taxable profit differs from ‘profit before tax’ as reported in the Statement of Profit and Loss because of items of income or expense that are taxable or deductible in other years and items that are never taxable or deductible. The Company’s current tax is calculated using tax rates that have been enacted or substantively enacted by the end of the reporting period.
deferred tax
Deferred tax is recognised on temporary differences between the carrying amounts of assets and liabilities in the financial statements and the corresponding tax bases used in the computation of taxable profits. Deferred tax liabilities are generally recognised for all taxable temporary differences. Deferred tax assets are generally recognised for all deductible temporary differences to the extent that it is probable that taxable profit will be available against which those deductible temporary differences can be utilised.
The carrying amount of deferred tax assets is reviewed at each reporting date and reduced to the extent that it is no longer probable that sufficient taxable profit will be available to allow all or part of the asset to be recovered.
Deferred tax liabilities and assets are measured at the tax rates that are expected to apply in the period in which the liability is settled or the asset is realised, based on tax rates (and tax laws) that have been enacted or substantively enacted by the end of the reporting period.
The measurement of deferred tax liabilities and assets reflects the tax consequences that would follow from the manner in which the Company expects, at the end of the reporting period, to recover or settle the carrying amount of its assets and liabilities.
Current and deferred tax for the year
Current and deferred tax are recognised in the Statement of Profit and Loss, except when they relate to items that are recognised in other comprehensive income or directly in equity, in which case, the current and deferred tax are also recognised in other comprehensive income or directly in equity respectively.
h. Property, plant and equipment
Land and buildings held for use in the production or supply of goods or services, or for administrative purposes, are stated in the balance sheet at cost less accumulated depreciation and accumulated impairment losses. Freehold land is not depreciated.
Notes to Financial Statements for the year ended June 30, 2017

72 Procter & Gamble Hygiene and Health Care Limited
Properties in the course of construction for production, supply or administrative purposes are carried at cost, less any recognised impairment loss. Cost includes professional fees and, for qualifying assets, borrowing costs capitalised in accordance with the Company’s accounting policy. Such properties are classified to the appropriate categories of property, plant and equipment when completed and ready for intended use. Depreciation of these assets, on the same basis as other property assets, commences when the assets are ready for their intended use.
Fixtures and equipments are stated at cost less accumulated depreciation and accumulated impairment losses.
Cost of assets not ready for intended use, as on the Balance Sheet date, is shown as capital work-in-progress.
Depreciation is recognised so as to write off the cost of assets (other than freehold land) less their residual values over their useful life, using straight-line method. The estimated useful lives, residual values and depreciation method are reviewed at the end of each reporting period, with the effect of any changes in estimate accounted for on a prospective basis.
The management’s estimate of useful lives are in accordance with Schedule II to the Companies Act, 2013 other than certain assets which are based on Company’s expected usage pattern supported by technical assessment.
The estimated useful life of certain property, plant and equipment of the Company are as follows:
Asset Class useful livesBuildings 20-30 yearsPlant & equipment 10-15 yearsFurniture and fixtures 3-15 yearsOffice equipment 3-15 yearsVehicles 4-8 yearsMoulds & Dies 3-15 years
An item of property, plant and equipment is derecognised upon disposal or when no future economic benefits are expected to arise from the continued use of the asset. Any gain or loss arising on the disposal or retirement of an item of property, plant and equipment is determined as the difference between the sale proceeds and the carrying amount of the asset and is recognised in the Statement of Profit and Loss.
i. impairment of property, plant and equipment
At the end of each reporting period, the Company reviews the carrying amounts of its tangible assets to determine whether there is any indication that those assets have suffered an impairment loss. If any such indication exists, the recoverable amount is estimated in order to determine the extent of the impairment loss (if any). When it is not possible to estimate the recoverable amount of an individual asset, the Company estimates the recoverable amount of the cash-generating unit to which the asset belongs. When a reasonable and consistent basis of allocation can be identified, corporate assets are also allocated to individual cash-generating units, or otherwise they are allocated to the smallest group of cash-generating units for which a reasonable and consistent basis can be identified.
Recoverable amount is the higher of fair value less costs of disposal and value in use. In assessing value in use, the estimated future cash flows are discounted to their present value using a pre-tax discount rate that reflects current market assessments of the time value of money and the risks specific to the asset for which the estimates of future cash flows have not been adjusted.
If the recoverable amount of an asset (or cash-generating unit) is estimated to be less than its own carrying amount, the carrying amount of the asset (or cash-generating unit) is reduced to its recoverable amount. An impairment loss is recognised immediately in the Statement of Profit and Loss.
When an impairment loss subsequently reverses, the carrying amount of the asset (or a cash-generating unit) is increased to the revised estimate of its recoverable amount, but so that the increased carrying amount does not exceed the carrying amount that would have been determined had no impairment loss been recognised for the asset (or cash-generating unit) in prior years. A reversal is recognised immediately in the Statement of Profit and Loss.
Notes to Financial Statements for the year ended June 30, 2017

73Annual Report 2016-2017
Company Overview
Board’s Report
Management Discussion and Analysis
Corporate Governance
Financial Statements
j. inventories
Inventories consist of raw and packing materials, stores and spares, work-in-progress, stock-in-trade and finished goods. Inventories are valued at lower of cost and net realisable value after providing for obsolescence and other losses where considered necessary. Cost of Inventories is determined on weighted average basis. Cost of manufactured finished goods and work-in-progress includes material cost determined on weighted average basis and also includes an appropriate portion of allocable overheads.
Net realisable value is the estimated selling price in the ordinary course of business, less estimated costs of completion and the estimated costs necessary to make the sale.
k. Provisions, Contingent Liabilities and Contingent Assets
Provisions are recognised when the Company has a present obligation (legal or constructive) as a result of a past event, it is probable that an outflow of resources embodying economic benefits will be required to settle the obligation and a reliable estimate can be made of the amount of the obligation. When the Company expects some or all of a provision to be reimbursed, for example, under an insurance contract, the reimbursement is recognised as a separate asset, but only when the reimbursement is virtually certain. The expense relating to a provision is presented in the Statement of Profit and Loss net of any reimbursement.
If the effect of the time value of money is material, provisions are discounted using a current pre-tax rate that reflects, when appropriate, the risks specific to the liability. When discounting is used, the increase in the provision due to the passage of time is recognised as a finance cost.
Contingent liabilities are disclosed in the Notes. Contingent liabilities are disclosed for (1) possible obligations which will be confirmed only by future events not wholly within the control of the Company or (2) present obligations arising from past events where it is not probable that an outflow of resources will be required to settle the obligation or a reliable estimate of the amount of the obligation cannot be made.
Contingent assets are not recognised in the financial statements as this may result in the recognition of income that may never be there.
l. Financial instruments
Financial assets and financial liabilities are recognised when the Company becomes a party to the contractual provisions of the instrument.
Financial assets and financial liabilities are initially measured at fair value. Transaction costs that are directly attributable to the acquisition or issue of the financial assets and financial liabilities (other than financial assets and financial liabilities at fair value through profit or loss) are added to or deducted from the fair value of the financial assets or financial liabilities, as appropriate, on initial recognition. Transactions costs directly attributable to the acquisition of financial assets and financial liabilities at fair value through profit or loss are recognised immediately in the Statement of Profit and Loss.
m. Financial assets
All regular way purchases or sales of financial assets are recognised and derecognised on a trade date basis. Regular way purchases or sales are purchases or sales of financial assets that require delivery of assets within the time frame established by regulation or convention in the market place.
All recognised financial assets are subsequently measured at either amortised cost or fair value, depending on the classification of the financial assets.
Classification of financial assets
Debt instruments that meet the following conditions are subsequently measured at amortised cost:
(a) The asset is held within a business model whose objective is to hold assets in order or collect contractual cash flows; and
(b) The contractual terms of the instrument give rise on specified dates to cash flows that are solely payments of principal and interest on the principal amount outstanding.
Debt instruments that does not meet the above conditions are subsequently measured at fair value.
Notes to Financial Statements for the year ended June 30, 2017

74 Procter & Gamble Hygiene and Health Care Limited
Notes to Financial Statements for the year ended June 30, 2017
effective interest method
The effective interest is a method calculating the amortised cost of a debt instrument and of allocating interest income over the relevant period. The effective interest rate is the rate that exactly discounts estimated future cash receipts through the expected life of the debt instrument, or, where appropriate, a shorter period, to the net carrying amount in initial recognition.
Income is recognised on an effective interest basis for debt instruments. Interest income is recognised in Statement of Profit and Loss and is included in the “Other income” line item.
impairment of financial assets
The Company applies expected credit loss model for recognising impairment loss on financial assets measured at amortised cost, trade receivables and other contractual rights to receive cash or other financial asset.
Expected credit losses are the weighted average of credit losses with the respective risks of default occurring as the weights. Credit loss is the difference between all contractual cash flows that are due to the Company in accordance with the contract and all the cash flows that the Company expects to receive (i.e. all cash shortfalls), discounted at the original effective interest rate (or credit-adjusted effective interest rate for purchased or originated credit-impaired financial assets). The Company estimates cash flows by considering all contractual terms of the financial instrument (for example, prepayment, extension, call and similar options) through the expected life of that financial instrument.
The Company measures the loss allowance for a financial instrument at an amount equal to the lifetime expected credit losses if the credit risk on that financial instrument has increased significantly since initial recognition. If the credit risk on a financial instrument has not increased significantly since initial recognition, the Company measures the loss allowance for that financial instrument at an amount equal to 12-month expected credit losses. 12-month expected credit losses are portion of the life-time expected credit losses and represent the lifetime cash shortfalls that will result if default occurs within the 12 months after the reporting date and thus, are not cash shortfalls that are predicted over the next 12 months.
For trade receivables or any contractual right to receive cash, the Company always measures the loss allowance at an amount equal to lifetime expected credit losses.
Further, for the purpose of measuring lifetime expected credit loss allowance for trade receivables, the Company has used a practical expedient as permitted under Ind AS 109. This expected credit loss allowance is computed based on a provision matrix which takes into account historical credit loss experience with adjusted for forward-looking information.
derecognition of financial assets
The Company derecognises a financial asset when the contractual rights to the cash flows from the asset expire, or when it transfers the financial asset and substantially all the risks and rewards of ownership of the asset to another party. If the Company neither transfers nor retains substantially all of the risks and rewards of ownership and continues to control the transferred asset, the Company recognises its retained interest in the asset and an associated liability for amounts it may have to pay. If the Company retains substantially all of the risks and rewards of ownership of a transferred financial asset, the Company continues to recognise the financial asset and also recognises a collateralised borrowing for the proceeds received.
On derecognition of a financial asset in its entirety, the difference between the asset’s carrying amount and the sum of the consideration received and receivable and the cumulative gain or loss that had been recognised in other comprehensive income and accumulated in equity is recognised in profit or loss if such gain or loss would have otherwise been recognised in the Statement of Profit and Loss on disposal of that financial asset.
On derecognition of a financial asset other than in its entirety, the Company allocates the previous carrying amount of the financial asset between the part it continues to recognise under continuing involvement, and the part it no longer recognises on the basis of the relative fair values of those parts on the date of the transfer. The difference between the carrying amount allocated to the part that is no longer recognised and the sum of the consideration received for the part no longer recognised and any cumulative gain or loss allocated to

75Annual Report 2016-2017
Company Overview
Board’s Report
Management Discussion and Analysis
Corporate Governance
Financial Statements
it that had been recognised in other comprehensive income is recognised in the Statement of Profit and Loss on disposal of that financial asset. A cumulative gain or loss that had been recognised in other comprehensive income is allocated between the part that continues to be recognised and the part that is no longer recognised on the basis of the relative fair values of those parts.
Foreign exchange gains and losses
The fair value of financial assets denominated in a foreign currency is determined in that foreign currency and translated at the spot rate at the end of each reporting period.
For foreign currency denominated financial assets measured at amortised cost, the exchange differences are recognised in Statement of Profit and Loss.
n. Financial liabilities and equity instruments
Classification as debt or equity
Debt and equity instruments issued by the Company are classified as either financial liability or as equity in accordance with the substance of the contractual arrangements and the definitions of a financial liability and an equity instrument.
equity instruments
An equity instrument is any contract that evidences a residual interest in the assets of an entity after deducting all of its liabilities. Equity instruments issued by the Company is recognised at the proceeds received, net of direct issue costs.
Repurchase of the Company’s own equity instruments is recognised and deducted directly in equity. No gain or loss is recognised in Statement of Profit and Loss on the purchase, sale, issue or cancellation of the Company’s own equity instruments.
Financial liabilities
All financial liabilities are subsequently measured at amortised cost using the effective interest method.
Financial liabilities are classified, at initial recognition, as financial liabilities at fair value through profit or loss, loans and borrowings, payables, as appropriate.
Financial liabilities that are not held-for-trading and are not designated as at fair value through profit or loss are measured at amortised cost at the end of the subsequent accounting period. The carrying amount of financial liabilities that are subsequently measured at amortised cost are determined based on the effective interest method. Interest expense that is not capitalised as part of costs of an asset is included in the “Finance costs” line item.
The effective interest method is a method of calculating the amortised cost of a financial liability and of allocating interest expense over the relevant period. The effective interest rate is the rate that exactly discounts estimated future cash payments through the expected life of the financial liability, or, (where appropriate), a shorter period, to the net carrying amount at initial recognition.
Foreign exchange gains and losses
For financial liabilities that are denominated in a foreign currency and are measured at amortised cost at the end of each reporting period, the foreign exchange gains and losses are determined based on the amortised cost of the instrument and are recognised in Statement of Profit and Loss.
derecognition
The Company derecognises a financial liability when, and only when, the Company’s obligations are discharged, cancelled or have expired. An exchange with a lender of debt instruments with substantially different terms is accounted for as an extinguishment of the original financial liability and the recognition of a new liability. Similarly, a substantial modification of the terms of an existing financial liability is accounted for as an extinguishment of the original financial liability and the recognition of a new liability. The difference between the carrying amount of the financial liability derecognised and the consideration paid and payable is recognised in Statement of Profit and Loss.
Notes to Financial Statements for the year ended June 30, 2017

76 Procter & Gamble Hygiene and Health Care Limited
Notes to Financial Statements for the year ended June 30, 2017
o. Segment Reporting
Operating segments are reported in a manner consistent with the internal reporting provided to the Chief Operating Decision Maker (CODM) of the Company. The CODM is responsible for allocating resources and assessing performance of the operating segments of the Company.
p. Cash and Cash equivalents
Cash and cash equivalents for the purpose of Cash Flow Statement comprise cash and cheques in hand, bank balances, demand deposits with banks where the original maturity is three months or less and other short term highly liquid investments.
q. earnings Per Share
Basic earnings per share is computed by dividing the net profit for the year attributable to the equity shareholders of the Company by the weighted average number of equity shares outstanding during the period. The weighted average number of equity shares outstanding during the period and for all periods presented is adjusted for events, such as bonus shares, other than the conversion of potential equity shares that have changed the number of equity shares outstanding, without a corresponding change in resources.
For the purpose of calculating diluted earnings per share, the net profit for the year attributable to equity shareholders and the weighted average number of shares outstanding during the period is adjusted for the effects of all dilutive potential equity shares.
r. Claims
Claims against the Company not acknowledged as debts are disclosed after a careful evaluation of the facts and legal aspects of the matter involved.
s. Recent accounting pronouncements
Standards issued but not yet effective
In March 2017, the Ministry of Corporate Affairs issued the Companies (Indian Accounting Standards) (Amendments) Rules, 2017, notifying amendment to Ind AS 7, ‘Statement of cash flows’. This amendment is in accordance with the recent amendments made by International Accounting Standards Board (IASB) to IAS 7, ‘Statement of cash flows’. The amendment is applicable to the Company from July 1, 2017.
Amendments to Ind AS 7
The amendments to Ind AS 7 requires the entities to provide disclosures that enable users of financial statements to evaluate changes in liabilities arising from financing activities, including both changes arising from cash flows and non-cash changes, suggesting inclusion of a reconciliation between the opening and closing balances in the Balance Sheet for liabilities arising from financing activities, to meet the disclosure requirement.
The Company is evaluating the requirements of the amendment and the effect on the financial statements is being evaluated.
Amendments to Ind AS 102
The amendment to Ind AS 102 provides specific guidance to measurement of cash-settled awards, modification of cash-settled awards and awards that include a net settlement feature in respect of withholding taxes.
The Company is currently not having any cash-settled share-based payments. No impact is currently foreseen.
2.4 First-time adoption — mandatory exceptions, optional exemptions
a. Overall principle
The Company has prepared the opening balance sheet as per Ind AS as of July 1, 2015 (the transition date) by recognising all assets and liabilities whose recognition is required by Ind AS, not recognising items of assets and liabilities which are not permitted by Ind AS, by reclassifying items from previous GAAP to Ind AS required under Ind AS, and applying Ind AS in measurement of recognised assets and liabilities. However, this principle is subject to the certain exception and certain optional exemptions availed by the Company as detailed below.

77Annual Report 2016-2017
Company Overview
Board’s Report
Management Discussion and Analysis
Corporate Governance
Financial Statements
b. deemed cost for property, plant and equipment
The Company has elected to continue with the carrying value of all its property, plant and equipment recognised as of July 1, 2015 (transition date) measured as per the previous GAAP and use the carrying value as its deemed cost as of the transition date.
c. determining whether an arrangement contains a lease
The Company has applied Appendix C to Ind AS 17 Determining whether an Arrangement contains a Lease to determine whether an arrangement existing at the transition date contains a lease on the basis of facts and circumstances existed at the transition date.
3. Critical accounting judgments and key sources of estimation uncertainty
3.1 Critical judgments in applying accounting policies
In the application of the Company’s accounting policies, which are described in note 2, the directors of the Company are required to make judgments, estimates and assumptions about the carrying amounts of assets and liabilities that are not readily apparent from other sources. The estimates and associated assumptions are based on historical experience and other factors that are considered to be relevant. Actual results may differ from these estimates.
The estimates and underlying assumptions are reviewed on an ongoing basis. Revisions to accounting estimates are recognised in the period in which the estimate is revised if the revision affects only that period, or in the period of the revision and future periods of the revision affects both current and future periods.
3.2 Key sources of estimation uncertainty
The following are the key assumptions concerning the future, and other key sources of estimation uncertainty at the end of the reporting period that may have a significant risk of causing a material adjustment to the carrying amounts of assets and liabilities within the next financial year.
a. useful lives of property, plant and equipment
As described at 2.3 (h) above, the Company reviews the estimated useful lives of property, plant and equipment at the end of each reporting period.
b. Fair value measurements and valuation processes
Some of the Company’s assets and liabilities are measured at fair value for financial reporting purposes. The management of the Company determines the appropriate valuation techniques and inputs for fair value measurements.
In estimating the fair value of an asset or a liability, the Company uses market-observable data to the extent it is available. Where level 1 inputs are not available, the Company engages third party qualified valuers to perform the valuation. The management works closely with the qualified external valuers to establish the appropriate valuation techniques and inputs to the model.
Information about the valuation techniques and inputs used in determining the fair value of various assets and liabilities is disclosed in note 30.
c. defined benefit obligation
The costs of providing pensions and other post-employment benefits are charged to the Statement of Profit and Loss in accordance with Ind AS 19 ‘Employee benefits’ over the period during which benefit is derived from the employees’ services. The costs are assessed on the basis of assumptions selected by the management. These assumptions include salary escalation rate, discount rates, expected rate of return on assets and mortality rates. The same is disclosed in Note 23, ‘Employee benefits expense’.
d. income taxes
The Company’s tax jurisdiction is India. Significant judgments are involved in estimating budgeted profits for the purpose of paying advance tax, determining the provision for income taxes, including amount expected to be paid/recovered for uncertain tax positions (refer note 26).
Notes to Financial Statements for the year ended June 30, 2017
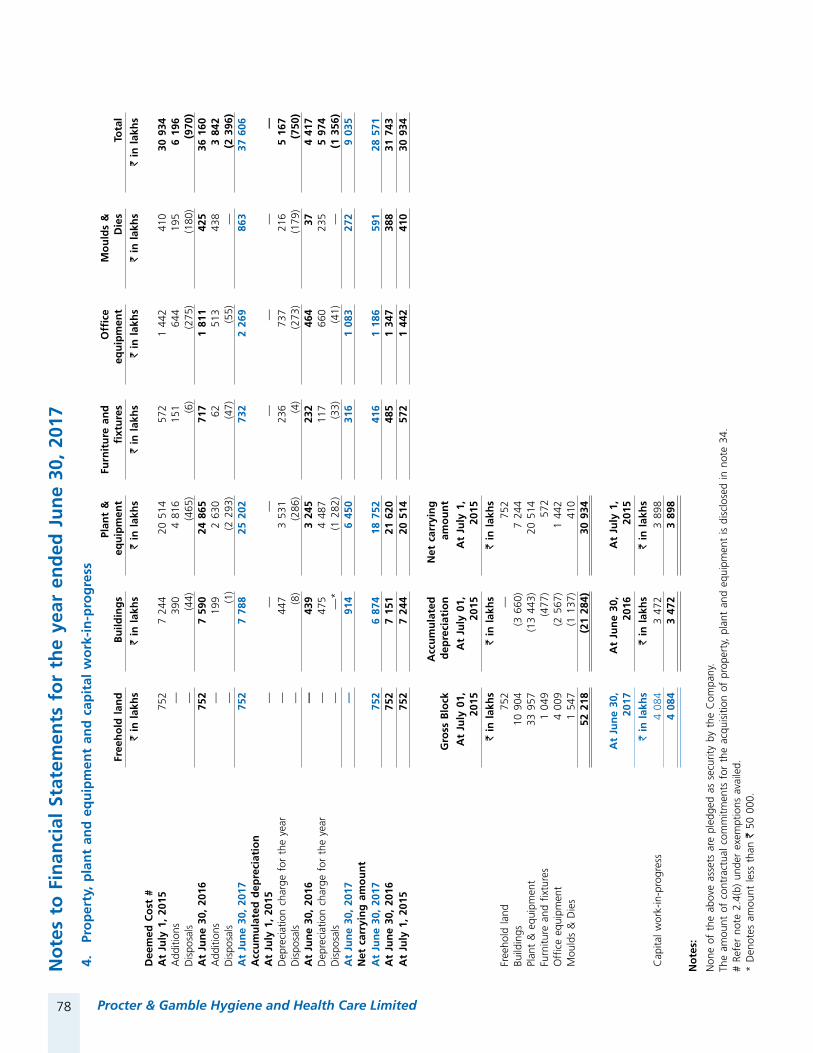
78 Procter & Gamble Hygiene and Health Care Limited
4.
Pro
per
ty,
pla
nt
and
eq
uip
men
t an
d c
apit
al w
ork
-in
-pro
gre
ss
Free
ho
ld l
and
Bu
ildin
gs
Plan
t &
eq
uip
men
tFu
rnit
ure
an
d
fixt
ure
sO
ffice
eq
uip
men
tM
ou
lds
&
die
sto
tal
` in
lak
hs
` in
lak
hs
` in
lak
hs
` in
lak
hs
` in
lak
hs
` in
lak
hs
` in
lak
hs
dee
med
Co
st #
At
July
1,
2015
752
7
244
2
0 51
4 5
72
1 4
42
410
3
0 93
4 A
dditi
ons
— 3
90
4 8
16
151
6
44
195
6
196
D
ispo
sals
—(4
4)(4
65)
(6)
(275
)(1
80)
(970
)A
t Ju
ne
30,
2016
752
7
590
2
4 86
5 7
17
1 8
11
425
3
6 16
0 A
dditi
ons
— 1
99
2 6
30
62
513
4
38
3 8
42
Dis
posa
ls—
(1)
(2 2
93)
(47)
(55)
—(2
396
)A
t Ju
ne
30,
2017
752
7
788
2
5 20
2 7
32
2 2
69
863
3
7 60
6 A
ccu
mu
late
d d
epre
ciat
ion
At
July
1,
2015
——
——
——
—D
epre
ciat
ion
char
ge f
or t
he y
ear
— 4
47
3 5
31
236
7
37
216
5
167
D
ispo
sals
—(8
)(2
86)
(4)
(273
)(1
79)
(750
)A
t Ju
ne
30,
2016
— 4
39
3 2
45
232
4
64
37
4 4
17
Dep
reci
atio
n ch
arge
for
the
yea
r—
475
4
487
1
17
660
2
35
5 9
74
Dis
posa
ls—
—*
(1 2
82)
(33)
(41)
—(1
356
)A
t Ju
ne
30,
2017
— 9
14
6 4
50
316
1
083
2
72
9 0
35
Net
car
ryin
g a
mo
un
tA
t Ju
ne
30,
2017
752
6
874
1
8 75
2 4
16
1 1
86
591
2
8 57
1 A
t Ju
ne
30,
2016
752
7
151
2
1 62
0 4
85
1 3
47
388
3
1 74
3 A
t Ju
ly 1
, 20
15 7
52
7 2
44
20
514
572
1
442
4
10
30
934
Gro
ss B
lock
Acc
um
ula
ted
d
epre
ciat
ion
Net
car
ryin
g
amo
un
t
At
July
01,
20
15A
t Ju
ly 0
1,
2015
At
July
1,
2015
` in
lak
hs
` in
lak
hs
` in
lak
hs
Free
hold
land
752
—
752
Build
ings
10
904
(3 6
60)
7 24
4 Pl
ant
& e
quip
men
t 3
3 95
7 (1
3 44
3)20
514
Fu
rnitu
re a
nd fi
xtur
es 1
049
(4
77)
572
O
ffice
equ
ipm
ent
4 0
09
(2 5
67)
1 44
2 M
ould
s &
Die
s 1
547
(1
137
)41
0 5
2 21
8 (2
1 28
4)30
934
At
Jun
e 30
, 20
17A
t Ju
ne
30,
2016
At
July
1,
2015
` in
lak
hs
` in
lak
hs
` in
lak
hs
Cap
ital w
ork-
in-p
rogr
ess
4 0
84
3 4
72
3 8
98
4 0
84
3 4
72
3 8
98
No
tes:
Non
e of
the
abo
ve a
sset
s ar
e pl
edge
d as
sec
urity
by
the
Com
pany
.Th
e am
ount
of
cont
ract
ual c
omm
itmen
ts f
or t
he a
cqui
sitio
n of
pro
pert
y, p
lant
and
equ
ipm
ent
is d
iscl
osed
in n
ote
34.
# Re
fer
note
2.4
(b)
unde
r ex
empt
ions
ava
iled.
* D
enot
es a
mou
nt le
ss t
han
` 50
000
.
No
tes
to F
inan
cial
Sta
tem
ents
fo
r th
e ye
ar e
nd
ed J
un
e 30
, 20
17

79Annual Report 2016-2017
Company Overview
Board’s Report
Management Discussion and Analysis
Corporate Governance
Financial Statements
5. trade receivablesAs at
June 30, 2017As at
June 30, 2016As at
July 1, 2015` in lakhs ` in lakhs ` in lakhs
Unsecured, considered good 13 280 14 962 11 394 Doubtful 145 132 56
13 425 15 094 11 450 Less: Allowance for doubtful receivables (145) (132) (56)
13 280 14 962 11 394
The Company has used a practical expedient by computing the expected credit loss allowance for trade receivables based on a provision matrix. The provision matrix takes into account historical credit loss experience and adjusted for forward-looking information. The expected credit loss allowance is based on the ageing of the days the receivables are due and the rates as per the provision matrix.
The concentration of credit risk is limited due to the fact that the customer base is large and unrelated.
Movement in the allowance for doubtful receivables
As at June 30, 2017
As at June 30, 2016
` in lakhs ` in lakhsBalance at the beginning of the year 132 56 Amounts written off during the year (net) (8) (2)Changes in allowance for doubtful receivables 21 78
Balance at end of the year 145 132
6. LoansAs at
June 30, 2017As at
June 30, 2016As at
July 1, 2015` in lakhs ` in lakhs ` in lakhs
unsecured considered goodNon-currentSecurity deposits 508 545 238 Loans to related parties (refer note (a), (c) and note 32) 19 23 —Loan to employees (refer note (c)) 4 569 5 109 5 417
5 096 5 677 5 655
CurrentSecurity deposits 5 4 21 Loans to related parties (refer note (b), (c) and note 32) 9 004 20 004 41 300 Loan to employees (refer note (c)) 751 578 535
9 760 20 586 41 856
Notes: (a) Non-current loans to related parties includes loan to key managerial personnel ` 19 lakhs (June 30, 2016:
` 23 lakhs; July 1, 2015: ` Nil lakhs). (b) Current loans to related parties includes: (i) Loan to fellow subsidiaries of the Ultimate Holding Company ` 9 000 lakhs (June 30, 2016: ` 20 000 lakhs;
July 1, 2015: ` 41 300 lakhs). (ii) Loan to key managerial personnel ` 4 lakhs (June 30, 2016: ` 4 lakhs; July 1, 2015: ` Nil lakhs). (c) Loans given to employees/key managerial personnel as per the Company’s policy are not considered for the
purposes of disclosure under Section 186 (4) of the Companies Act, 2013.
Notes to Financial Statements for the year ended June 30, 2017

80 Procter & Gamble Hygiene and Health Care Limited
7. Other financial assets
As at June 30, 2017
As at June 30, 2016
As at July 1, 2015
` in lakhs ` in lakhs ` in lakhsNon-currentBank deposits with original maturity more than 12 months 88 169 83
Interest accrued on deposits with banks 15 12 5
103 181 88
Current
Receivable on account of sale of scrap 42 17 51 Receivable on account of sale of raw material — 65 10
Due from related parties (refer note 32) 5 667 4 144 5 019
Interest accrued on loans to related parties (refer note 32) 520 1 628 92
Interest accrued on deposits with banks 21 525 264
6 250 6 379 5 436
8. inventories
As at June 30, 2017
As at June 30, 2016
As at July 1, 2015
` in lakhs ` in lakhs ` in lakhs
inventories (lower of cost and net realisable value)Raw materials (Including packing materials) 2 090 2 041 2 244 Work-in-progress 137 513 235 Finished goods 9 868 5 090 4 802
Stock-in-trade (goods purchased for resale) (` 1 297 lakhs (June 30, 2016 : ` Nil lakhs, July 1, 2015: ` Nil lakhs in transit))
4 169 3 460 2 955
Consumable stores and spares 1 471 1 644 1 671
17 735 12 748 11 907
The cost of inventories recognised as an expense during the year is disclosed in note 21 and 22.
9(a). Cash and cash equivalents
For the purpose of the Statement of Cash Flows, cash and cash equivalents include cash in banks, net of outstanding bank overdrafts. Cash and cash equivalents at the end of the reporting year as shown in the Statement of Cash Flows can be reconciled to the related items in the Balance Sheet as follows:
As at June 30, 2017
As at June 30, 2016
As at July 1, 2015
` in lakhs ` in lakhs ` in lakhs
Balances with banks: — On current accounts 1 418 2 416 2 017 — Deposits with original maturity of less than three months 8 826 1 04 243 59 461
Cash and cash equivalents as per Balance Sheet 10 244 1 06 659 61 478
Cash and cash equivalents as per Statement of Cash Flows 10 244 1 06 659 61 478
Notes to Financial Statements for the year ended June 30, 2017

81Annual Report 2016-2017
Company Overview
Board’s Report
Management Discussion and Analysis
Corporate Governance
Financial Statements
9(b). Other bank balances
As at June 30, 2017
As at June 30, 2016
As at July 1, 2015
` in lakhs ` in lakhs ` in lakhs
Earmarked accounts
— Unpaid/Unclaimed dividend account 1 069 146 145 — ISOP Account 269 454 27 — Other earmarked accounts (deposits with sales tax authorities)# — — —
Bank deposits with original maturity more than 3 months 101 59 125
1 439 659 297
# denotes amount less than ` 50 000
10. Other assets
As at June 30, 2017
As at June 30, 2016
As at July 1, 2015
` in lakhs ` in lakhs ` in lakhsNon-currentPrepaid expenses 14 16 18
Other loans and advances (refer note (a) below) 841 773 835
Doubtful loans and advances 1 062 1 062 1 062
Less : Provision for doubtful loans and advances (1 062) (1 062) (1 062)
855 789 853
Current
Prepaid expenses 4 37 175 Other loans and advances (includes advances to vendors) 274 224 2 612
Advance to employees (refer note (b) below) 129 212 264
Balances with government authorities (includes Service Tax and Cenvat credit receivable)
1 198 722 211
1 605 1 195 3 262
(a) Includes amounts deposited with Excise, Sales Tax and other authorities as demanded, pending resolution of disputes.
(b) Advances given to employees as per the Company’s policy are not considered for the purposes of disclosure under Section 186 (4) of the Companies Act, 2013.
11. equity share capital
As at June 30, 2017
As at June 30, 2016
As at July 1, 2015
` in lakhs ` in lakhs ` in lakhs
Authorised share capital:
3 50 00 000 fully paid equity shares of ` 10 each 3 500 3 500 3 500
issued and subscribed share capital:
3 24 60 736 fully paid equity shares of ` 10 each 3 246 3 246 3 246
3 246 3 246 3 246
Notes to Financial Statements for the year ended June 30, 2017

82 Procter & Gamble Hygiene and Health Care Limited
11.1 Fully paid equity shares
Number of shares
Share Capital
` in lakhsBalance at July 1, 2015 3 24 60 736 3 246 Movements — —
Balance at June 30, 2016 3 24 60 736 3 246 Movements — —
Balance at June 30, 2017 3 24 60 736 3 246
The company has only one class of equity shares having par value of ` 10 per share. Each holder of equity shares is entitled to one vote per share. The Company declares and pays dividends in Indian rupees. The dividend proposed by the Board of Directors is subject to the approval of the shareholders in the ensuing Annual General Meeting.
In the event of liquidation of the Company, the holders of equity shares will be entitled to receive remaining assets of the Company, after distribution of all preferential amounts. The distribution will be in proportion to the number of equity shares held by the shareholders.
11.2 details of shares held by ultimate holding company/holding company and/or their subsidiaries/associates
As at June 30, 2017
As at June 30, 2016
As at July 1, 2015
` in lakhs ` in lakhs ` in lakhsultimate Holding CompanyThe Procter & Gamble Company, USA — — —Holding CompanyProcter & Gamble Overseas India BV, The Netherlands # 2 231 — —Procter & Gamble Asia Holding BV, The Netherlands # — 2 122 2 122 Subsidiaries of the ultimate Holding CompanyRosemount LLC # — 109 109 Temple Trees Impex & Investment Pvt. Ltd. 62 62 62
11.3 details of shareholders holding more than 5% equity shares in the company
As at June 30, 2017
As at June 30, 2016
Number of shares held
% holding of equity shares
Number of shares held
% holding of equity shares
Equity shares of ` 10 each fully paidProcter & Gamble Overseas India BV, The Netherlands # 2 23 10 090 68.73 — —Procter & Gamble Asia Holding BV, The Netherlands # — — 2 12 21 953 65.38
As at July 1, 2015
Number of shares held
% holding of equity shares
Equity shares of ` 10 each fully paidProcter & Gamble Asia Holding BV, The Netherlands # 2 12 21 953 65.38
# Procter & Gamble Asia Holding B.V., The Netherlands has been merged into Procter & Gamble Overseas India BV, The Netherlands with effect from March 31, 2017. Further, promoter shareholder Rosemount LLC has transferred 10 88 137 equity shares held in the Company to Procter & Gamble Overseas India BV, The Netherlands on April 1, 2017.
Notes to Financial Statements for the year ended June 30, 2017

83Annual Report 2016-2017
Company Overview
Board’s Report
Management Discussion and Analysis
Corporate Governance
Financial Statements
12. Other equity
As at June 30, 2017
As at June 30, 2016
As at July 1, 2015
` in lakhs ` in lakhs ` in lakhs
Reserves & surplus
General reserve 30 959 30 959 26 727 Securities premium reserve 7 519 7 519 7 519 Share options outstanding account 791 354 48 Retained earnings 10 097 1 23 100 97 032
49 366 1 61 932 1 31 326
12.1 General reserve
year ended June 30, 2017
year ended June 30, 2016
` in lakhs ` in lakhs
Balance at the beginning of year 30 959 26 727 Transferred from surplus in Statement of Profit and Loss — 4 232
Balance at the end of year 30 959 30 959
The general reserve is used from time to time to transfer profits from retained earnings for appropriation purposes. As the general reserve is created by a transfer from one component of equity to another and is not an item of other comprehensive income, items included in the general reserve will not be reclassified subsequently to the Statement of Profit and Loss.
12.2 Securities premium reserve
year ended June 30, 2017
year ended June 30, 2016
` in lakhs ` in lakhs
Balance at the beginning of year 7 519 7 519 Movements — —
Balance at the end of year 7 519 7 519
The amount received in excess of face value of the equity shares is recognised in securities premium reserve.
12.3 Share options outstanding account
year ended June 30, 2017
year ended June 30, 2016
` in lakhs ` in lakhs
Balance at the beginning of year 354 48 Arising on share-based compensation 437 306
Balance at the end of year 791 354
The above reserve relates to share options granted by the Ultimate Holding Company to specific employees of its subsidiaries under its employee stock option plan. Further information about share-based payments to employees is set out in note 31.
Notes to Financial Statements for the year ended June 30, 2017

84 Procter & Gamble Hygiene and Health Care Limited
12.4 Retained earningsyear ended
June 30, 2017year ended
June 30, 2016` in lakhs ` in lakhs
Balance at the beginning of year 1 23 100 97 032 Profit attributable to the owners of the Company 43 273 42 250 Other comprehensive income arising from remeasurement of defined benefit obligation (net of income tax)
(778) (132)
Payment of interim/final dividend on equity shares (refer note 39) (1 29 194) (9 819)Dividend distribution tax (26 304) (1 999)Transfer to general reserve — (4 232)
Balance at the end of year 10 097 1 23 100
This Reserve represents the cumulative profits of the Company and effects of remeasurement of defined benefit obligations. This Reserve can be utilised in accordance with the provisions of the Companies Act, 2013.
In December 2016, final dividend of ` 36 per share (total dividend including tax thereon ` 14 065 lakhs) was paid to holders of fully paid equity shares. In November 2015, the final dividend paid was ` 30.25 per share (total dividend including tax thereon ` 11 818 lakhs).
In June 2017, an interim dividend of ` 362 per share (total dividend including tax thereon ` 1 41 433 lakhs) was paid to holders of fully paid equity shares.
13. Other financial liabilities
As at June 30, 2017
As at June 30, 2016
As at July 1, 2015
` in lakhs ` in lakhs ` in lakhs
Current
Financial lease obligation payable 209 189 189 Payables for property, plant and equipment 1 411 1 370 800 Deposits from customers and others 7 7 7 Unpaid/Unclaimed dividend # 1 069 146 145
2 696 1 712 1 141
# There are no amounts due and outstanding to be credited to Investor Education and Protection Fund.
14. Provisions
As at June 30, 2017
As at June 30, 2016
As at July 1, 2015
` in lakhs ` in lakhs ` in lakhs
Employee benefits (refer note below) 832 667 697
832 667 697
Current 415 310 364 Non-current 417 357 333
832 667 697
The provision for employee benefits includes post retirement medical benefits (PRMB) and compensated absences. The increase/decrease in the carrying amount of the provision for the current year results from benefits being paid in the current year. For other disclosures refer note 29.
Notes to Financial Statements for the year ended June 30, 2017
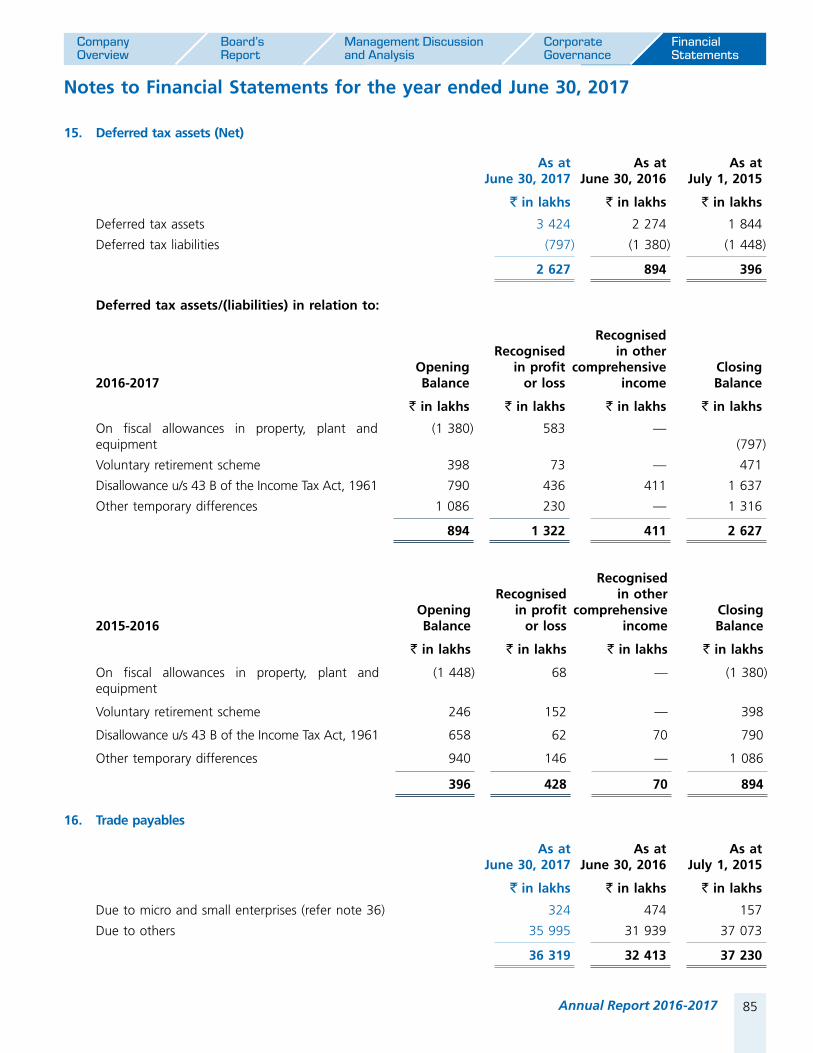
85Annual Report 2016-2017
Company Overview
Board’s Report
Management Discussion and Analysis
Corporate Governance
Financial Statements
Notes to Financial Statements for the year ended June 30, 2017
15. deferred tax assets (Net)
As at June 30, 2017
As at June 30, 2016
As at July 1, 2015
` in lakhs ` in lakhs ` in lakhs
Deferred tax assets 3 424 2 274 1 844
Deferred tax liabilities (797) (1 380) (1 448)
2 627 894 396
deferred tax assets/(liabilities) in relation to:
2016-2017Opening Balance
Recognised in profit
or loss
Recognised in other
comprehensive income
Closing Balance
` in lakhs ` in lakhs ` in lakhs ` in lakhs
On fiscal allowances in property, plant and equipment
(1 380) 583 —(797)
Voluntary retirement scheme 398 73 — 471
Disallowance u/s 43 B of the Income Tax Act, 1961 790 436 411 1 637
Other temporary differences 1 086 230 — 1 316
894 1 322 411 2 627
2015-2016Opening Balance
Recognised in profit
or loss
Recognised in other
comprehensive income
Closing Balance
` in lakhs ` in lakhs ` in lakhs ` in lakhs
On fiscal allowances in property, plant and equipment
(1 448) 68 — (1 380)
Voluntary retirement scheme 246 152 — 398
Disallowance u/s 43 B of the Income Tax Act, 1961 658 62 70 790
Other temporary differences 940 146 — 1 086
396 428 70 894
16. trade payables
As at June 30, 2017
As at June 30, 2016
As at July 1, 2015
` in lakhs ` in lakhs ` in lakhs
Due to micro and small enterprises (refer note 36) 324 474 157
Due to others 35 995 31 939 37 073
36 319 32 413 37 230

86 Procter & Gamble Hygiene and Health Care Limited
Notes to Financial Statements for the year ended June 30, 2017
17. Current tax liabilities (Net)
As at June 30, 2017
As at June 30, 2016
As at July 1, 2015
` in lakhs ` in lakhs ` in lakhs
Income tax payable 12 071 8 220 13 690
12 071 8 220 13 690
18. Other current liabilities
As at June 30, 2017
As at June 30, 2016
As at July 1, 2015
` in lakhs ` in lakhs ` in lakhs
Gratuity (refer note 29) 4 752 3 058 2 415
Superannuation 13 27 17
Taxes and other liabilities (including statutory remittances, excise and sales tax payable)
6 717 5 366 5 081
11 482 8 451 7 513
19. Revenue from operations
Year ended June 30, 2017
Year ended June 30, 2016
` in lakhs ` in lakhs
Sale of products (including excise duty) 2 41 856 2 34 650
Other operating revenues
Scrap sales 60 265
2 41 916 2 34 915
20. Other Income
Year ended June 30, 2017
Year ended June 30, 2016
` in lakhs ` in lakhs
Interest income earned on:
Bank deposits 5 926 5 529
Loan to related parties (refer note 32) 1 552 2 673
Income tax refund — 273
Other financial assets carried at amortised cost 202 190
7 680 8 665
Other non-operating income (net of expenses directly attributable to such income)
Miscellaneous income 50 96
50 96
Total 7 730 8 761

87Annual Report 2016-2017
Company Overview
Board’s Report
Management Discussion and Analysis
Corporate Governance
Financial Statements
Notes to Financial Statements for the year ended June 30, 2017
21. Cost of raw and packing materials consumed
Year ended June 30, 2017
Year ended June 30, 2016
` in lakhs ` in lakhs
Inventories at the beginning of year 2 041 2 244
Add: Purchases 61 301 55 995
63 342 58 239
Less: Inventories at the end of year 2 090 2 041
Cost of raw and packing materials consumed# 61 252 56 198
# Previous year figures includes consumption of raw material and packing material supplied by the Company to a third party manufacturer for manufacture and supply of goods purchased for resale.
22. Changes in inventories of finished goods, work-in-progress and stock-in-trade
Year ended June 30, 2017
Year ended June 30, 2016
` in lakhs ` in lakhs
Inventories at the beginning of year:
Finished Goods 5 090 4 802
Stock-in-Trade 3 460 2 955
Work-in-Progress 513 235
9 063 7 992
Inventories at the end of year:
Finished Goods 9 868 5 090
Stock-in-Trade 4 169 3 460
Work-in-Progress 137 513
14 174 9 063
Net Increase (5 111) (1 071)
23. Employee benefits expense
Year ended June 30, 2017
Year ended June 30, 2016
` in lakhs ` in lakhs
Salaries and wages* 9 071 8 438
Contribution to provident and other funds (refer note 29) 1 232 1 103
Share-based payment to employees (refer note 31) 1 089 2 233
Staff welfare expense 1 198 1 456
Recovery of employee cost cross charged by related parties (refer note 37) (1 180) (1 495)
11 410 11 735
* Salaries and Wages includes ` 302 lakhs (Previous year: ` 484 lakhs) for expenditure on Voluntary Retirement Scheme.
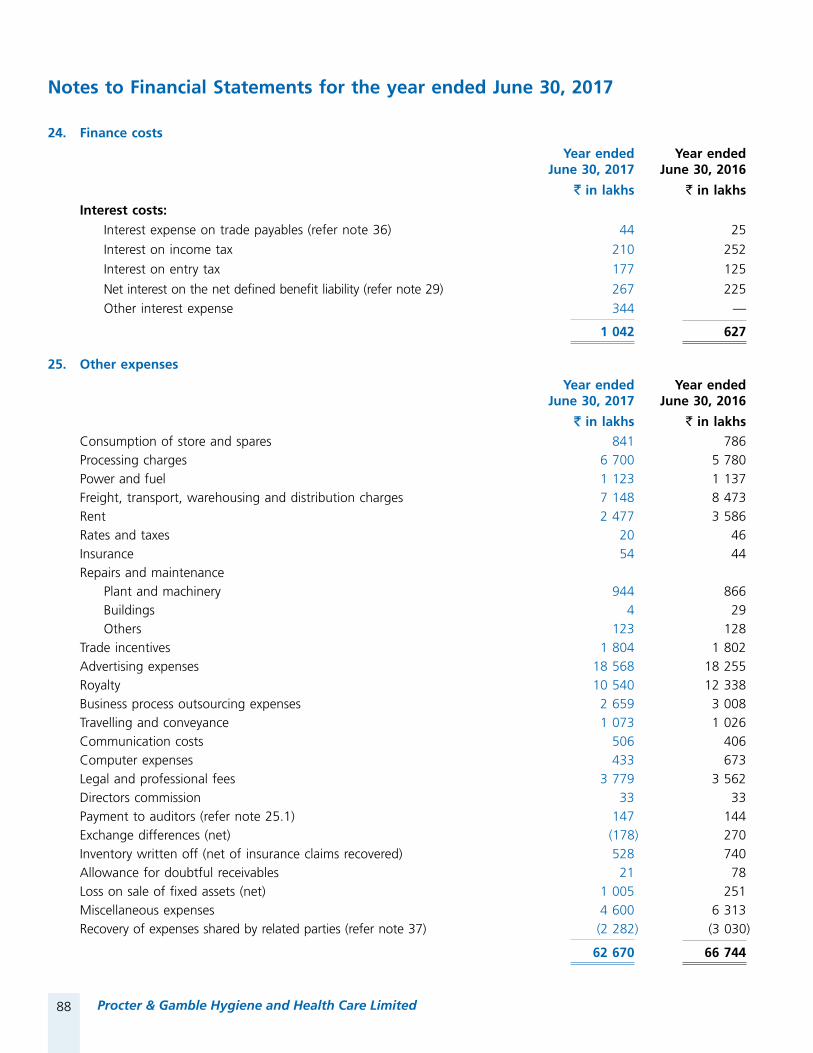
88 Procter & Gamble Hygiene and Health Care Limited
24. Finance costs
Year ended June 30, 2017
Year ended June 30, 2016
` in lakhs ` in lakhs
Interest costs: Interest expense on trade payables (refer note 36) 44 25
Interest on income tax 210 252
Interest on entry tax 177 125
Net interest on the net defined benefit liability (refer note 29) 267 225 Other interest expense 344 —
1 042 627
25. Other expenses
Year ended June 30, 2017
Year ended June 30, 2016
` in lakhs ` in lakhsConsumption of store and spares 841 786 Processing charges 6 700 5 780 Power and fuel 1 123 1 137 Freight, transport, warehousing and distribution charges 7 148 8 473 Rent 2 477 3 586 Rates and taxes 20 46 Insurance 54 44 Repairs and maintenance Plant and machinery 944 866 Buildings 4 29 Others 123 128 Trade incentives 1 804 1 802 Advertising expenses 18 568 18 255 Royalty 10 540 12 338 Business process outsourcing expenses 2 659 3 008 Travelling and conveyance 1 073 1 026 Communication costs 506 406 Computer expenses 433 673 Legal and professional fees 3 779 3 562 Directors commission 33 33 Payment to auditors (refer note 25.1) 147 144 Exchange differences (net) (178) 270 Inventory written off (net of insurance claims recovered) 528 740 Allowance for doubtful receivables 21 78 Loss on sale of fixed assets (net) 1 005 251 Miscellaneous expenses 4 600 6 313 Recovery of expenses shared by related parties (refer note 37) (2 282) (3 030)
62 670 66 744
Notes to Financial Statements for the year ended June 30, 2017

89Annual Report 2016-2017
Company Overview
Board’s Report
Management Discussion and Analysis
Corporate Governance
Financial Statements
25.1 Payments to auditors:
Year ended June 30, 2017
Year ended June 30, 2016
` in lakhs ` in lakhs(i) To statutory auditors (excluding service tax) For audit 107 110 For other services 19 19 Reimbursement of expenses 12 7 (ii) To cost auditors for cost audit 9 8
147 144
25.2 Expenditure incurred and paid during the year for corporate social responsibility
1 080 845
26. Income tax expense26.1 Income tax recognised in profit or loss
Year ended June 30, 2017
Year ended June 30, 2016
` in lakhs ` in lakhsCurrent taxIn respect of the current year 24 674 21 636 In respect of prior years 552 92
25 226 21 728
Deferred taxIn respect of the current year (1 257) (336)
In respect of prior years (65) (92)
(1 322) (428)
Total income tax expense recognised in the current year 23 904 21 300
The income tax expense for the year can be reconciled to the accounting profit as follows:
As at June 30, 2017
As at June 30, 2016
` in lakhs ` in lakhs
Profit before tax 67 177 63 550
Income tax expense calculated at 34.608% (2015-2016: 34.608%) 23 249 21 993 Effect of allowances — (280)Effect of expenses that are not deductible in determining taxable profits 168 273 Effect of income that is exempt from taxation — (686)
23 417 21 300 Adjustments recognised in the current year in relation to the current tax of prior years
487 —
Income tax expense recognised in Statement of Profit and Loss 23 904 21 300
The tax rate used for 2016-2017 and 2015-2016 reconciliations above is the corporate tax rate of 34.608% payable by corporate entities in India on taxable (losses)/profits under the Indian tax law.
Notes to Financial Statements for the year ended June 30, 2017
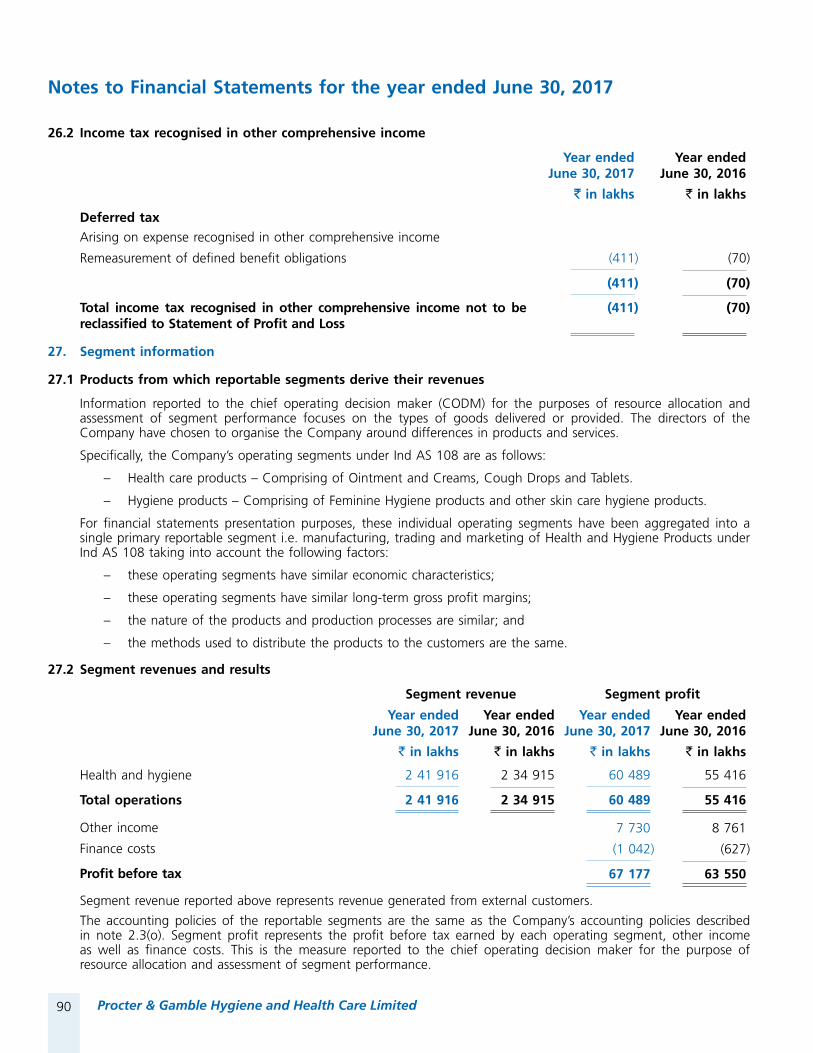
90 Procter & Gamble Hygiene and Health Care Limited
26.2 Income tax recognised in other comprehensive income
Year ended June 30, 2017
Year ended June 30, 2016
` in lakhs ` in lakhs
Deferred taxArising on expense recognised in other comprehensive income
Remeasurement of defined benefit obligations (411) (70)
(411) (70)
Total income tax recognised in other comprehensive income not to be reclassified to Statement of Profit and Loss
(411) (70)
27. Segment information
27.1 Products from which reportable segments derive their revenues
Information reported to the chief operating decision maker (CODM) for the purposes of resource allocation and assessment of segment performance focuses on the types of goods delivered or provided. The directors of the Company have chosen to organise the Company around differences in products and services.
Specifically, the Company’s operating segments under Ind AS 108 are as follows:
– Health care products – Comprising of Ointment and Creams, Cough Drops and Tablets.
– Hygiene products – Comprising of Feminine Hygiene products and other skin care hygiene products.
For financial statements presentation purposes, these individual operating segments have been aggregated into a single primary reportable segment i.e. manufacturing, trading and marketing of Health and Hygiene Products under Ind AS 108 taking into account the following factors:
– these operating segments have similar economic characteristics;
– these operating segments have similar long-term gross profit margins;
– the nature of the products and production processes are similar; and
– the methods used to distribute the products to the customers are the same.
27.2 Segment revenues and results
Segment revenue Segment profit
Year ended June 30, 2017
Year ended June 30, 2016
Year ended June 30, 2017
Year ended June 30, 2016
` in lakhs ` in lakhs ` in lakhs ` in lakhs
Health and hygiene 2 41 916 2 34 915 60 489 55 416
Total operations 2 41 916 2 34 915 60 489 55 416
Other income 7 730 8 761
Finance costs (1 042) (627)
Profit before tax 67 177 63 550
Segment revenue reported above represents revenue generated from external customers.
The accounting policies of the reportable segments are the same as the Company’s accounting policies described in note 2.3(o). Segment profit represents the profit before tax earned by each operating segment, other income as well as finance costs. This is the measure reported to the chief operating decision maker for the purpose of resource allocation and assessment of segment performance.
Notes to Financial Statements for the year ended June 30, 2017

91Annual Report 2016-2017
Company Overview
Board’s Report
Management Discussion and Analysis
Corporate Governance
Financial Statements
27.3 Segment assets and liabilities
As at June 30, 2017
As at June 30, 2016
As at July 1, 2015
` in lakhs ` in lakhs ` in lakhsSegment assetsHealth and hygiene 1 16 012 2 16 641 1 94 843
Total segment assets 1 16 012 2 16 641 1 94 843
Segment liabilitiesHealth and hygiene 63 400 51 463 60 271
Total segment liabilities 63 400 51 463 60 271
27.4 Other segment information
Depreciation expense Capital ExpenditureYear ended
June 30, 2017Year ended
June 30, 2016Year ended
June 30, 2017Year ended
June 30, 2016` in lakhs ` in lakhs ` in lakhs ` in lakhs
Health and hygiene 5 974 5 167 4 413 5 265
5 974 5 167 4 413 5 265
27.5 Revenue from major products
The following is an analysis of the Company’s revenue from its major products.
Year ended June 30, 2017
Year ended June 30, 2016
` in lakhs ` in lakhsOintments and Creams 41 222 36 744
Cough Drops 26 498 24 314
Tablets 5 055 6 654
Other hygiene products 1 69 141 1 67 203
2 41 916 2 34 915
27.6 Geographical information
The Company operates in two principal geographical areas - India (country of domicile) and outside India.
The Company’s revenue from external customers by location of operations and information about its segment assets by location of assets are detailed below.
Revenue from external customers
Segment assets
Year ended June 30, 2017
Year ended June 30, 2016
As at June 30, 2017
As at June 30, 2016
` in lakhs ` in lakhs ` in lakhs ` in lakhs
India 2 39 585 2 32 100 1 16 012 2 16 641
Outside India 2 331 2 815 — —
2 41 916 2 34 915 1 16 012 2 16 641
There are no transactions with single external customer which amounts to 10% or more of the Company’s revenue.
Notes to Financial Statements for the year ended June 30, 2017

92 Procter & Gamble Hygiene and Health Care Limited
28. Earnings per shareYear ended
June 30, 2017Year ended
June 30, 2016` per share ` per share
Basic and diluted earnings per share
Total basic earnings per share (face value ` 10) 133.31 130.16 Total diluted earnings per share (face value ` 10) 133.31 130.16
28.1 Basic and diluted earnings per share
The earnings and weighted average number of equity shares used in the calculation of basic and diluted earnings per share are as follows:
Year ended June 30, 2017
Year ended June 30, 2016
` in lakhs ` in lakhsEarnings used in calculation of basic and diluted earnings per share from operations
43 273 42 250
Year ended June 30, 2017
Year ended June 30, 2016
Weighted average number of equity shares for the purposes of basic and diluted earnings per share
3 24 60 736 3 24 60 736
29. Employee benefit plans
29.1 Defined contribution plansThe Company operates defined contribution provident fund, superannuation fund and employees’ state insurance plan for all qualifying employees of the Company. Where employees leave the plan, the contributions payable by the Company is reduced by the amount of forfeited contributions.
The employees of the Company are members of a state-managed employer’s contribution to employees’ state insurance plan, provident fund operated by the government and superannuation fund which is administered through a trust that is legally separated from the Company. The assets of the plan is held separately from those of the Company in funds under the control of trustees. The Company is required to contribute a specific percentage of payroll costs to the contribution schemes to fund the benefit. The only obligation of the Company with respect to the contribution plan is to make the specified contributions.
The total expense recognised in the statement of profit and loss of ` 786 lakhs (for the year ended June 30, 2016: ` 665 lakhs) for provident fund, ` 153 lakhs (for the year ended June 30, 2016: ` 171 lakhs) for superannuation fund represent contributions payable to these plans by the Company at rates specified in the rules of the plans. As at June 30, 2017, contributions of ` 13 lakhs (as at June 30, 2016: ` 27 lakhs) due in respect of 2016-2017 (2015-2016) reporting period had not been paid over to the plans. The amounts were paid subsequent to the end of the reporting periods.
29.2 Defined benefit plans
a) Gratuity Plan (Funded) The Company sponsors funded defined benefit gratuity plan for all eligible employees of the Company. The Company’s
defined benefit gratuity plan is a final salary plan for India employees, which requires contributions to be made to a separately administered trust. The gratuity plan is governed by the Payment of Gratuity Act, 1972. Under the act, employee who has completed five years of service is entitled to specific benefit. The level of benefits provided depends on the member’s length of service and salary at retirement age. The gratuity plan is administered by a separate trust that is legally separated from the Company. The board of the trust is composed of representatives from both employer and employees. The board of the trust is required by law and by its articles of association to act in the interest of the trust and of all relevant stakeholders in the scheme, i.e. active employees, inactive employees, retirees, employer. The board of the trust is responsible for the investment policy with regard to the assets of the trust.
Notes to Financial Statements for the year ended June 30, 2017
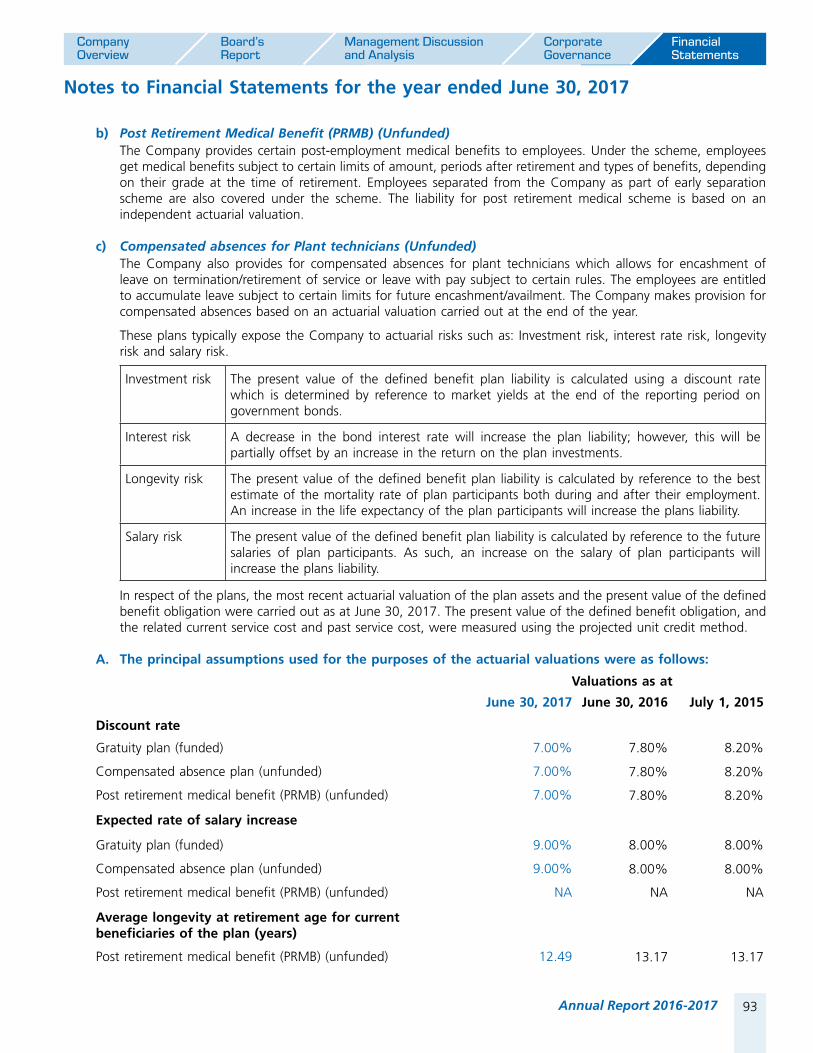
93Annual Report 2016-2017
Company Overview
Board’s Report
Management Discussion and Analysis
Corporate Governance
Financial Statements
b) Post Retirement Medical Benefit (PRMB) (Unfunded) The Company provides certain post-employment medical benefits to employees. Under the scheme, employees
get medical benefits subject to certain limits of amount, periods after retirement and types of benefits, depending on their grade at the time of retirement. Employees separated from the Company as part of early separation scheme are also covered under the scheme. The liability for post retirement medical scheme is based on an independent actuarial valuation.
c) Compensated absences for Plant technicians (Unfunded) The Company also provides for compensated absences for plant technicians which allows for encashment of
leave on termination/retirement of service or leave with pay subject to certain rules. The employees are entitled to accumulate leave subject to certain limits for future encashment/availment. The Company makes provision for compensated absences based on an actuarial valuation carried out at the end of the year.
These plans typically expose the Company to actuarial risks such as: Investment risk, interest rate risk, longevity risk and salary risk.
Investment risk The present value of the defined benefit plan liability is calculated using a discount rate which is determined by reference to market yields at the end of the reporting period on government bonds.
Interest risk A decrease in the bond interest rate will increase the plan liability; however, this will be partially offset by an increase in the return on the plan investments.
Longevity risk The present value of the defined benefit plan liability is calculated by reference to the best estimate of the mortality rate of plan participants both during and after their employment. An increase in the life expectancy of the plan participants will increase the plans liability.
Salary risk The present value of the defined benefit plan liability is calculated by reference to the future salaries of plan participants. As such, an increase on the salary of plan participants will increase the plans liability.
In respect of the plans, the most recent actuarial valuation of the plan assets and the present value of the defined benefit obligation were carried out as at June 30, 2017. The present value of the defined benefit obligation, and the related current service cost and past service cost, were measured using the projected unit credit method.
A. The principal assumptions used for the purposes of the actuarial valuations were as follows:
Valuations as at
June 30, 2017 June 30, 2016 July 1, 2015
Discount rate
Gratuity plan (funded) 7.00% 7.80% 8.20%
Compensated absence plan (unfunded) 7.00% 7.80% 8.20%
Post retirement medical benefit (PRMB) (unfunded) 7.00% 7.80% 8.20%
Expected rate of salary increase
Gratuity plan (funded) 9.00% 8.00% 8.00%
Compensated absence plan (unfunded) 9.00% 8.00% 8.00%
Post retirement medical benefit (PRMB) (unfunded) NA NA NA
Average longevity at retirement age for current beneficiaries of the plan (years)
Post retirement medical benefit (PRMB) (unfunded) 12.49 13.17 13.17
Notes to Financial Statements for the year ended June 30, 2017

94 Procter & Gamble Hygiene and Health Care Limited
B. Amounts recognised in the statement of profit or loss in respect of these defined benefit plans are as follows:
Year ended June 30, 2017
Year ended June 30, 2016
` in lakhs ` in lakhsGratuity Plan (Funded)Service costs: Current service cost 293 267Net interest expense 238 198
Components of defined benefit costs recognised in statement of profit and loss (A)
531 465
Remeasurement on the net defined benefit liability: Return on plan assets (excluding amounts included in net interest expense) —# 22 Actuarial (gains)/losses arising from changes in assumptions 1 107 184 Actuarial (gains)/losses arising from changes in experience adjustments 56 (28)
Components of defined benefit costs recognised in other comprehensive income (B)
1 163 178
Total (C = (A+B)) 1 694 643
# denotes amount less than ` 50 000
Compensated absence plan (Unfunded)Service costs: Current service cost 11 12 Net interest expense 8 7 Immediate recognition of (gains)/losses – other long term employee benefit plans 30 (7)
Components of defined benefit costs recognised in statement of profit and loss (D)
49 12
Post retirement medical benefit (PRMB) (Unfunded)Service costs: Current service cost 8 8 Net interest expense 21 20
Components of defined benefit costs recognised in statement of profit and loss (E)
29 28
Remeasurement on the net defined benefit liability: Actuarial (gains)/losses arising from changes in assumptions 51 24 Actuarial (gains)/losses arising from changes in experience adjustments (25) —
Components of defined benefit costs recognised in other comprehensive income (F)
26 24
Total (G = (E+F)) 55 52
Total defined benefit costs recognised in statement of profit and loss 609 505 Total defined benefit costs recognised in other comprehensive income 1 189 202
The current service cost for the year are included in the ‘Employee benefits expense’ line item in the statement of profit and loss.
The net interest expenses for the year are included in the ‘Finance costs’ line item in the statement of profit and loss. The remeasurement of the net defined benefit liability is included in other comprehensive income.
Notes to Financial Statements for the year ended June 30, 2017

95Annual Report 2016-2017
Company Overview
Board’s Report
Management Discussion and Analysis
Corporate Governance
Financial Statements
C. The amount included in the balance sheet arising from the entity’s obligation in respect of its defined benefit plans is as follows:
As at June 30, 2017
As at June 30, 2016
As at July 1, 2015
` in lakhs ` in lakhs ` in lakhs
Gratuity Plan (Funded)
Present value of funded defined benefit obligation 5 753 4 182 4 395
Fair value of plan assets (1 001) (1 124) (1 980)
Net liability arising from defined benefit obligation 4 752 3 058 2 415
Compensated absence plan (Unfunded)
Present value of funded defined benefit obligation 147 101 89
Net liability arising from defined benefit obligation 147 101 89
Post retirement medical benefit (PRMB) (Unfunded)
Present value of funded defined benefit obligation 307 273 261
Net liability arising from defined benefit obligation 307 273 261
D. Movement in the present value of the defined benefit obligation are as follows:
Year ended June 30, 2017
Year ended June 30, 2016
` in lakhs ` in lakhsGratuity Plan (Funded)Opening defined benefit obligation 4 182 4 395 Current service cost 293 267 Interest cost 318 321 Remeasurement on the net defined benefit liability: Actuarial (gains)/losses arising from changes in assumptions 1 107 184 Actuarial (gains)/losses arising from changes in experience adjustments 56 (28)Benefits paid (203) (957)
Closing defined benefit obligation 5 753 4 182
Compensated absence plan (Unfunded)Opening defined benefit obligation 101 89 Current service cost 11 12 Interest cost 8 7 Immediate recognition of (gains)/losses – other long term employee benefit plans
30 (7)
Benefits paid (3) —#
Closing defined benefit obligation 147 101
# denotes amount less than ` 50 000
Notes to Financial Statements for the year ended June 30, 2017

96 Procter & Gamble Hygiene and Health Care Limited
Year ended June 30, 2017
Year ended June 30, 2016
` in lakhs ` in lakhsPost retirement medical benefit (PRMB) (Unfunded)Opening defined benefit obligation 273 261 Current service cost 8 8 Interest cost 21 20 Remeasurement on the net defined benefit liability: Actuarial (gains)/losses arising from changes in assumptions 51 24 Actuarial (gains)/losses arising from changes in experience adjustments (25) — Benefits paid (21) (40)
Closing defined benefit obligation 307 273
E. Movement in the fair value of the plan assets are as follows:
Year ended June 30, 2017
Year ended June 30, 2016
` in lakhs ` in lakhsGratuity PlanOpening fair value of plan assets 1 124 1 980 Interest Income 80 123 Remeasurement gain/(loss):
Return on plan assets (excluding amounts included in net interest expense) —# (22)Benefits paid (203) (957)
Closing fair value of plan assets 1 001 1 124
# denotes amount less than ` 50 000
F. The fair value of the plan assets for plan at the end of the reporting year for each category, are as follows:
Gratuity Plan
As at June 30, 2017
As at June 30, 2016
As at July 1, 2015
` in lakhs ` in lakhs ` in lakhs
High quality Corporate Bonds (including Public Sector Unit) 420 450 891
Government of India Securities (Central and State) 151 191 733 Cash (including Special Deposit Scheme) 400 483 356 Private Sector Unit 30 — —
Total 1 001 1 124 1 980
The fair values of the above equity and debt instruments are determined based on quoted market prices in active markets.
The actual return on plan assets was ` 80 lakhs (for the year ended June 30, 2016: ` 101 lakhs)
Significant actuarial assumptions of the determination of the defined obligation are discount rate, expected salary increase and mortality. The sensitivity analyses below have been determined based on reasonable possible changes of the respective assumptions occurring at the end of the reporting period, while holding all other assumptions constant.
Notes to Financial Statements for the year ended June 30, 2017
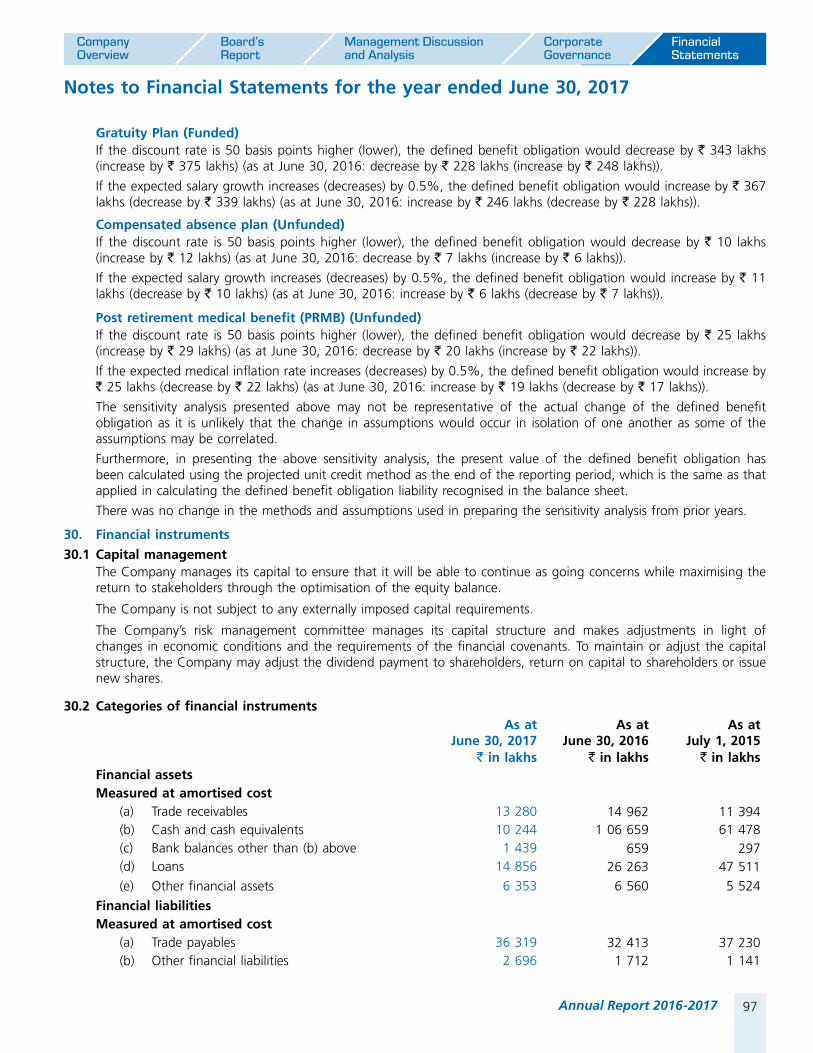
97Annual Report 2016-2017
Company Overview
Board’s Report
Management Discussion and Analysis
Corporate Governance
Financial Statements
Gratuity Plan (Funded) If the discount rate is 50 basis points higher (lower), the defined benefit obligation would decrease by ` 343 lakhs
(increase by ` 375 lakhs) (as at June 30, 2016: decrease by ` 228 lakhs (increase by ` 248 lakhs)).
If the expected salary growth increases (decreases) by 0.5%, the defined benefit obligation would increase by ` 367 lakhs (decrease by ` 339 lakhs) (as at June 30, 2016: increase by ` 246 lakhs (decrease by ` 228 lakhs)).
Compensated absence plan (Unfunded) If the discount rate is 50 basis points higher (lower), the defined benefit obligation would decrease by ` 10 lakhs
(increase by ` 12 lakhs) (as at June 30, 2016: decrease by ` 7 lakhs (increase by ` 6 lakhs)).
If the expected salary growth increases (decreases) by 0.5%, the defined benefit obligation would increase by ` 11 lakhs (decrease by ` 10 lakhs) (as at June 30, 2016: increase by ` 6 lakhs (decrease by ` 7 lakhs)).
Post retirement medical benefit (PRMB) (Unfunded) If the discount rate is 50 basis points higher (lower), the defined benefit obligation would decrease by ` 25 lakhs
(increase by ` 29 lakhs) (as at June 30, 2016: decrease by ` 20 lakhs (increase by ` 22 lakhs)).
If the expected medical inflation rate increases (decreases) by 0.5%, the defined benefit obligation would increase by ` 25 lakhs (decrease by ` 22 lakhs) (as at June 30, 2016: increase by ` 19 lakhs (decrease by ` 17 lakhs)).
The sensitivity analysis presented above may not be representative of the actual change of the defined benefit obligation as it is unlikely that the change in assumptions would occur in isolation of one another as some of the assumptions may be correlated.
Furthermore, in presenting the above sensitivity analysis, the present value of the defined benefit obligation has been calculated using the projected unit credit method as the end of the reporting period, which is the same as that applied in calculating the defined benefit obligation liability recognised in the balance sheet.
There was no change in the methods and assumptions used in preparing the sensitivity analysis from prior years.
30. Financial instruments
30.1 Capital management The Company manages its capital to ensure that it will be able to continue as going concerns while maximising the
return to stakeholders through the optimisation of the equity balance.
The Company is not subject to any externally imposed capital requirements.
The Company’s risk management committee manages its capital structure and makes adjustments in light of changes in economic conditions and the requirements of the financial covenants. To maintain or adjust the capital structure, the Company may adjust the dividend payment to shareholders, return on capital to shareholders or issue new shares.
30.2 Categories of financial instrumentsAs at
June 30, 2017As at
June 30, 2016As at
July 1, 2015` in lakhs ` in lakhs ` in lakhs
Financial assetsMeasured at amortised cost (a) Trade receivables 13 280 14 962 11 394 (b) Cash and cash equivalents 10 244 1 06 659 61 478 (c) Bank balances other than (b) above 1 439 659 297 (d) Loans 14 856 26 263 47 511 (e) Other financial assets 6 353 6 560 5 524
Financial liabilitiesMeasured at amortised cost (a) Trade payables 36 319 32 413 37 230 (b) Other financial liabilities 2 696 1 712 1 141
Notes to Financial Statements for the year ended June 30, 2017

98 Procter & Gamble Hygiene and Health Care Limited
30.3 Financial risk management objectives
The Company’s overall policy with respect to managing risks associated with financial instruments is to minimise potential adverse effects of financial performance of the Company. The policies for managing specific risks are summarised below.
30.4 Foreign currency risk management
The Company undertakes transactions denominated in foreign currencies; consequently, exposures to exchange rate fluctuations arise. Exchange rate exposures are managed within approved policy parameters.
The carrying amounts of the Company’s foreign currency denominated monetary assets and monetary liabilities at the end of the reporting period are as follows:
Liabilities as at Assets as atAs at
June 30, 2017As at
June 30, 2016As at
July 1, 2015As at
June 30, 2017As at
June 30, 2016As at
July 1, 2015` in lakhs ` in lakhs ` in lakhs ` in lakhs ` in lakhs ` in lakhs
USD 9 283 7 026 3 408 416 826 578
EUR 1 294 698 610 — 8 —
CNY 3 — 839 — — —
GBP — — 13 — — —
JPY — — 4 — — —
SGD — — 1 — — —
KRW 6 — — — — —
30.4.1 Foreign currency sensitivity analysis
The Company is mainly exposed to the currencies stated above.
The following table details impact to profit or loss of the Company by sensitivity analysis of a 10% increase and decrease in the respective currencies against the functional currency of the Company. 10% is the sensitivity rate used when reporting foreign currency risk internally to key management personnel and represents management’s assessment of the reasonably possible changes in foreign exchange rates. The sensitivity analysis includes only outstanding foreign currency denominated monetary items and adjusts their translation at the period end for a 10% change on foreign currency rates.
If the relevant foreign currency strengthens/weakens by 10% against the functional currency of the Company, profit or loss will increase (decrease) by:
Increase/(decrease) at +10% Increase/(decrease) at -10%
As at June 30, 2017
As at June 30, 2016
As at July 1, 2015
As at June 30, 2017
As at June 30, 2016
As at July 1, 2015
` in lakhs ` in lakhs ` in lakhs ` in lakhs ` in lakhs ` in lakhs
USD (887) (620) (283) 887 620 283
EUR (129) (69) (61) 129 69 61
CNY —¥ — (84) —¥ — 84
GBP — — (1) — — 1
JPY — — —¥ — — —¥
SGD — — —¥ — — —¥
KRW (1) — — 1 — —
¥ denotes amount less than ` 50 000
Notes to Financial Statements for the year ended June 30, 2017

99Annual Report 2016-2017
Company Overview
Board’s Report
Management Discussion and Analysis
Corporate Governance
Financial Statements
30.5 Credit risk management
Credit risk refers to the risk that a counterparty will default on its contractual obligations resulting in financial loss to the Company. The Company performs ongoing credit evaluation of the counterparty’s financial position as a means of mitigating the risk of financial loss arising from defaults. The Company only grants credit to creditworthy counterparties.
The Company does not have any significant credit risk exposure to any single counterparty or any group of counterparties having similar characteristics as disclosed in Note 5 to the financial statements.
30.6 Interest rate risk management
Interest rate risk is the risk that the fair value or future cash flows of a financial instrument will fluctuate because of changes in market interest rates. Since the Company does not have interest bearing borrowings, it is not exposed to risk of changes in market interest rates. The Company has not used any interest rate derivatives.
30.7 Other price risk management
Other price risk is the risk that the fair value of a financial instrument will fluctuate due to changes in market traded price. The Company is not exposed to pricing risk as the Company does not have any investments in equity instruments and bonds.
30.8 Liquidity risk management
Liquidity risk is the risk that the Company will encounter difficulty in raising funds to meet commitments associated with financial instruments that are settled by delivering cash or another financial asset. Liquidity risk may result from an inability to sell a financial asset quickly at close to its fair value. The Company maintains adequate highly liquid assets in the form of cash to ensure necessary liquidity.
The table below analyse financial liabilities of the Company into relevant maturity groupings based on the reporting period from the reporting date to the contractual maturity date:
Less than 1 year
Between 1 to 5 years
Over 5 years Total
Carrying Value
` in lakhs ` in lakhs ` in lakhs ` in lakhs ` in lakhs
At June 30, 2017
Trade Payables 36 319 — — 36 319 36 319
Other financial liabilities 2 696 — — 2 696 2 696
Provisions 415 417 — 832 832
Other Current Liabilities 11 482 — — 11 482 11 482
At June 30, 2016
Trade Payables 32 413 — — 32 413 32 413
Other financial liabilities 1 712 — — 1 712 1 712
Provisions 310 357 — 667 667
Other Current Liabilities 8 451 — — 8 451 8 451
At July 1, 2015
Trade Payables 37 230 — — 37 230 37 230
Other financial liabilities 1 141 — — 1 141 1 141
Provisions 364 333 — 697 697
Other Current Liabilities 7 513 — — 7 513 7 513
Notes to Financial Statements for the year ended June 30, 2017

100 Procter & Gamble Hygiene and Health Care Limited
30.9 Fair value measurements
The carrying amount of financial assets and financial liabilities measured at amortised cost in the financial statements are a reasonable approximation of their fair values since the Company does not anticipate that the carrying amounts would be significantly different from the values that would eventually be received or settled.
31. Share-based payments
a) International Stock Ownership Plan (Stocks of the Ultimate Holding Company)
The Procter & Gamble Company, USA has an “International Stock Ownership Plan” (employee share purchase plan) whereby specified employees of its subsidiaries have been given a right to purchase shares of the Ultimate Holding Company i.e. The Procter & Gamble Company, USA. Every employee who opts for the scheme contributes by way of payroll deduction up to a specified percentage (upto 15%) of base salary towards purchase of shares on a monthly basis. The Company contributes 50% of employee’s contribution (restricted to 2.5% of his base salary). Such contribution is charged under employee benefits expense.
The shares of The Procter & Gamble Company, USA are listed with New York Stock Exchange and are purchased on behalf of the employees at market price on the date of purchase. During the year ended June 30, 2017, 4 651.17 (June 30, 2016: 4 390.24) shares were purchased by employees at weighted average fair value of ` 5 253.08 (June 30, 2016: ` 5 226.93) per share. The Company’s contribution during the year on such purchase of shares amounting to ` 71 lakhs (June 30, 2016: ` 63 lakhs) has been charged under employee benefits expense under Note 23.
b) Employees Stock Options Plan (Stocks of the Ultimate Holding Company)
The Procter & Gamble Company, USA has an “Employee Stock Option Plan” whereby specified employees of its subsidiaries covered by the plan are granted an option to purchase shares of the Ultimate Holding Company i.e. The Procter & Gamble Company, USA at a fixed price (grant price) for a fixed year of time. The shares of The Procter & Gamble Company, USA are listed with New York Stock Exchange. The Options Exercise price equal to the market price of the underlying shares on the date of the grant. The Grants issued are vested after 3 years and have a 5/10 years life cycle.
The expense recognised for employee services received during the year is shown in the following table:
As at June 30, 2017
As at June 30, 2016
` in lakhs ` in lakhs
Expense arising from equity-settled share-based payment transactions 1 018 2 170
Total expense arising from share-based payment transactions 1 018 2 170
There were no cancellations or modifications to the awards in June 30, 2017 or June 30, 2016.
Notes to Financial Statements for the year ended June 30, 2017

101Annual Report 2016-2017
Company Overview
Board’s Report
Management Discussion and Analysis
Corporate Governance
Financial Statements
Movements during the year
The following table illustrates the number and weighted average exercise prices (WAEP) of, and movements in, share options during the year (excluding SARs):
As at June 30,
2017
As at June 30,
2017
Estimated fair value of Option
Granted
As at June 30,
2016
As at June 30,
2016
Estimated fair value of Option
Granted
Number WAEP (in $) In ` Number WAEP (in $) In `
Outstanding at July 1 2 28 919 84.67 2 71 847 78.24 —
Granted during the year
4-Aug-16 466 83.20 5 551 — — —
15-Sep-16 2 102 88.06 583 — — —
28-Feb-17 59 915 91.07 687 — — —
28-Feb-17 2 878 91.07 5 705 — — —
28-Feb-17 1 742 91.07 6 079 — — —
15-Sep-15 — — — 1 160 69.45 546
29-Feb-16 — — — 4 457 80.29 564
29-Feb-16 — — — 1 554 80.29 4,447
Forfeited during the year (4 125) — — — — —
Exercised during the year (52 948) 88.48 — (40 403) 80.84 —
Expired during the year (5 965) — — (9 696) — —
Outstanding at June 30 2 32 984 87.05 2 28 919 84.67
Exercisable at June 30 1 33 675 87.05 1 74 171 84.67
The weighted average share price at the date of exercise of these options was $ 88.48 (June 30, 2016: $ 80.84).
The weighted average remaining contractual life for the share options outstanding as at June 30, 2017 was 5.24 years (June 30, 2016: 3.87 years).
The weighted average fair value of options granted during the year was ` 1 073 (June 30, 2016: ` 1 403).
These fair values for share options granted during the year were calculated using binomial lattice-based model. The following tables list the inputs to the models used for the plans for the years ended June 30, 2017 and June 30, 2016, respectively:
As at June 30, 2017
As at June 30, 2016
Dividend yield (%) 3.21% 3.16%
Expected volatility (%) 15.08% 15.62%
Risk–free interest rate (%) 2.55% 1.76%
Notes to Financial Statements for the year ended June 30, 2017
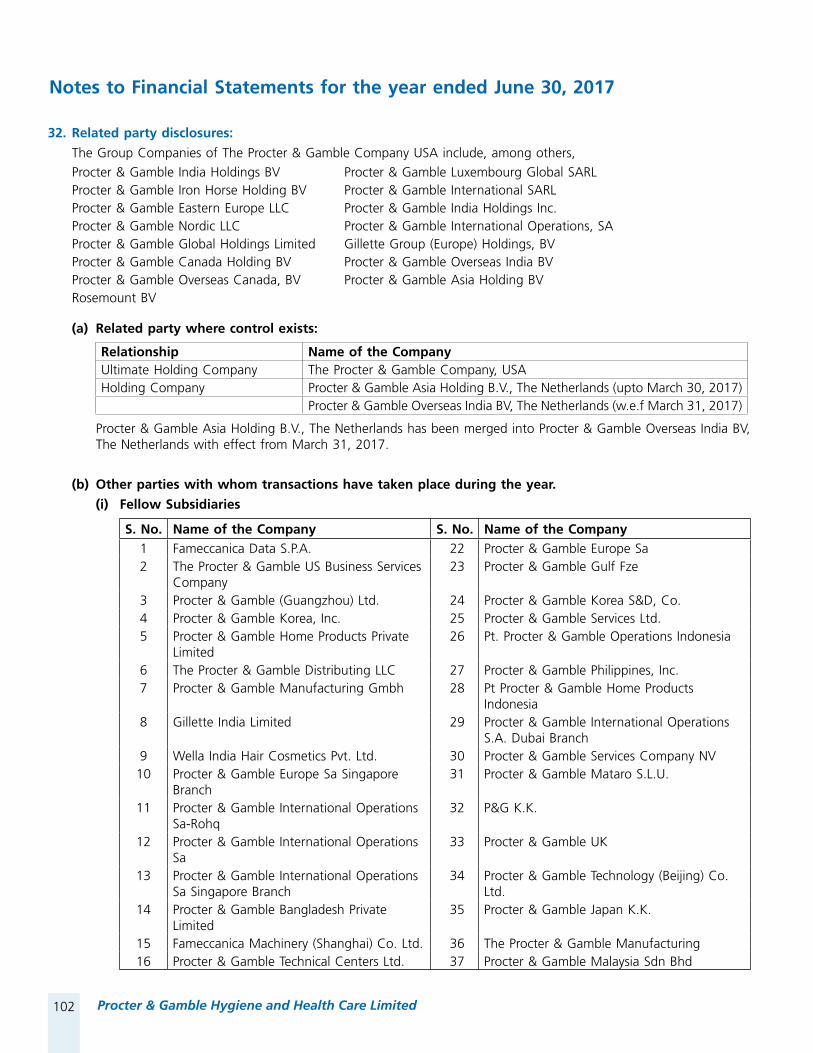
102 Procter & Gamble Hygiene and Health Care Limited
Notes to Financial Statements for the year ended June 30, 2017
32. Related party disclosures:
The Group Companies of The Procter & Gamble Company USA include, among others,Procter & Gamble India Holdings BV Procter & Gamble Luxembourg Global SARLProcter & Gamble Iron Horse Holding BV Procter & Gamble International SARLProcter & Gamble Eastern Europe LLC Procter & Gamble India Holdings Inc.Procter & Gamble Nordic LLC Procter & Gamble International Operations, SAProcter & Gamble Global Holdings Limited Gillette Group (Europe) Holdings, BVProcter & Gamble Canada Holding BV Procter & Gamble Overseas India BVProcter & Gamble Overseas Canada, BV Procter & Gamble Asia Holding BVRosemount BV
(a) Related party where control exists:
Relationship Name of the CompanyUltimate Holding Company The Procter & Gamble Company, USA Holding Company Procter & Gamble Asia Holding B.V., The Netherlands (upto March 30, 2017)
Procter & Gamble Overseas India BV, The Netherlands (w.e.f March 31, 2017)
Procter & Gamble Asia Holding B.V., The Netherlands has been merged into Procter & Gamble Overseas India BV, The Netherlands with effect from March 31, 2017.
(b) Other parties with whom transactions have taken place during the year.
(i) Fellow Subsidiaries
S. No. Name of the Company S. No. Name of the Company1 Fameccanica Data S.P.A. 22 Procter & Gamble Europe Sa2 The Procter & Gamble US Business Services
Company23 Procter & Gamble Gulf Fze
3 Procter & Gamble (Guangzhou) Ltd. 24 Procter & Gamble Korea S&D, Co.4 Procter & Gamble Korea, Inc. 25 Procter & Gamble Services Ltd.5 Procter & Gamble Home Products Private
Limited26 Pt. Procter & Gamble Operations Indonesia
6 The Procter & Gamble Distributing LLC 27 Procter & Gamble Philippines, Inc.7 Procter & Gamble Manufacturing Gmbh 28 Pt Procter & Gamble Home Products
Indonesia8 Gillette India Limited 29 Procter & Gamble International Operations
S.A. Dubai Branch9 Wella India Hair Cosmetics Pvt. Ltd. 30 Procter & Gamble Services Company NV
10 Procter & Gamble Europe Sa Singapore Branch
31 Procter & Gamble Mataro S.L.U.
11 Procter & Gamble International Operations Sa-Rohq
32 P&G K.K.
12 Procter & Gamble International Operations Sa
33 Procter & Gamble UK
13 Procter & Gamble International Operations Sa Singapore Branch
34 Procter & Gamble Technology (Beijing) Co. Ltd.
14 Procter & Gamble Bangladesh Private Limited
35 Procter & Gamble Japan K.K.
15 Fameccanica Machinery (Shanghai) Co. Ltd. 36 The Procter & Gamble Manufacturing16 Procter & Gamble Technical Centers Ltd. 37 Procter & Gamble Malaysia Sdn Bhd

103
Company Overview
Board’s Report
Management Discussion and Analysis
Corporate Governance
Financial Statements
Annual Report 2016-2017
Notes to Financial Statements for the year ended June 30, 2017
S. No. Name of the Company S. No. Name of the Company17 Procter & Gamble Australia Pty Ltd. 38 Procter & Gamble Manufacturing (Thailand)
Ltd18 Procter & Gamble Hong Kong Limited 39 Procter & Gamble Product Supply (U.K.)
Limited19 Procter & Gamble Trading (Thailand) Ltd. 40 Procter & Gamble Distributing (Philippines),
Inc.20 Procter & Gamble Middle East Fze 41 Gillette Diversified Operations Pvt. Ltd.21 Rosemount LLC
(ii) Key Management Personnel of the Company:
S. No. Name Designation1 Mr. Al Rajwani Managing Director w.e.f August 29, 20152 Mr. Karthik Natarajan Non-executive Director3 Ms. Sonali Dhawan Non-executive Director4 Mr. Pramod Agarwal Non-executive Director5 Mr. Shailyamanyu Singh Rathore Non-executive Director6 Mr. Prashant Bhatnagar Chief Financial Officer
Note: Related parties have been identified by the management
(c) Details of related party transactions between the Company and its related parties are as under:
` in lakhs
S. No. Nature of Transactions For the year ended
June 30
Ultimate Holding
& Holding Company
Fellow Subsidiary Companies
Key Managerial
Personnel
1 Purchase of Goods 2017 302 5 754 — 2016 — 18 726 —
2 Purchase of Equipment/Assets/Spares 2017 — 701 — 2016 — 1 572 —
3 Sale of Products 2017 — 495 — 2016 — 952 —
4 Sale of Capital goods 2017 — 75 — 2016 — — —
5 Loans Given 2017 — 20 000 —
2016 — 41 300 30 6 Loans Realised 2017 — 31 000 4
2016 — 62 600 3 7 Interest Income 2017 — 1 552 —
2016 — 2 673 — 8 Recovery of Expenses Cross charged 2017 3 936 7 221 —
2016 4 466 4 907 —
9 Expenses cross-charged 2017 1 892 8 422 — 2016 2 051 11 956 —
10 Reimbursement of expenses shared by group cos. (Income)
2017 2016
— —
4 903 6 370
— —

104 Procter & Gamble Hygiene and Health Care Limited
Notes to Financial Statements for the year ended June 30, 2017
` in lakhs
S. No. Nature of Transactions For the year ended
June 30
Ultimate Holding
& Holding Company
Fellow Subsidiary Companies
Key Managerial
Personnel
11 Reimbursement of expenses shared by group cos. (Expense)
2017 2016
— —
1 441 1 845
— —
12 Business Process Outsourcing expenses
2017 2016
— —
2 878 2 830
— —
13 Royalty 2017 9 929 — —
2016 10 773 — —
14 Computer Expenses 2017 — 418 — 2016 — 670 —
15 Rent expenses 2017 — 2 142 — 2016 — 320 —
16 Dividend Remitted/Paid 2017 88 403 2 858 — 2016 6 420 516 —
17 Managerial Remuneration 2017 — — 846 2016 — — 732
18 Processing Charges 2017 — 6 382 — 2016 — 2 497 —
19 Outstanding as at June 30thLoans given 2017 — 9 000 23
2016 — 20 000 27
2015 — 41 300 —
Interest Income Accrued 2017 — 520 — 2016 — 1 628 —
2015 — 92 —
Trade and other receivables 2017 17 4 848 — 2016 628 3 712 —
2015 213 4 936 —
Trade payables 2017 4 475 8 267 —2016 2 748 5 770 —
2015 4 300 7 506 —
The sales to and purchases from related parties are made on terms equivalent to those that prevail in arm’s length transactions.
Outstanding balances at the year-end are unsecured and settlement occurs in cash. There have been no guarantees provided or received for any related party receivables or payables. The Company has not recorded any impairment of receivables relating to amounts owed by related parties in the current year or prior years. This assessment is undertaken each financial year through examining the financial position of the related party and the market in which the related party operates.

105
Company Overview
Board’s Report
Management Discussion and Analysis
Corporate Governance
Financial Statements
Annual Report 2016-2017
(d) Disclosure in respect of material transactions of the same type with related parties during the year:
` in lakhs
S. No. Nature of Transactions Year endedJune 30, 2017
Year endedJune 30, 2016
1 Purchase of Goods Procter & Gamble International Operations SA Singapore Br 4 686 — The Procter & Gamble Company 302 — Procter & Gamble Home Products Private Limited 784 18 311 Procter & Gamble (Guangzhou) Limited 284 — Others — 415
2 Purchase of Equipment/Assets/Spares The Procter & Gamble Distributing LLC 379 1 318 Fameccanica Data S.P.A 232 — Procter & Gamble Manufacturing GMBH 82 — Others 8 254
3 Sale of Products Procter & Gamble International Operations SA Singapore Br 59 218 Procter & Gamble Bangladesh Private Limited 435 675 Others 1 59
4 Sale of Capital goods Gillette India Limited 39 —
Procter & Gamble Home Products Private Limited 36 —
5 Loans Given Procter & Gamble Home Products Private Limited 20 000 20 000 Wella India Haircosmetics Private Limited — 20 000 Others — 1 300
6 Loans Realised Procter & Gamble Home Products Private Limited 31 000 20 000 Wella India Haircosmetics Private Limited — 40 000 Others — 2 600
7 Interest Income Procter & Gamble Home Products Private Limited 1 552 1 809 Wella India Haircosmetics Private Limited — 811 Others — 53
8 Recovery of Expenses Cross charged The Procter & Gamble Company 3 936 4 466 Procter & Gamble Home Products Private Limited 5 880 3 424 Gillette India Limited 670 1 062 Others 671 421
9 Expenses cross-charged The Procter & Gamble Company 1 892 2 051 Procter & Gamble Home Products Private Limited 7 396 11 201 Gillette India Limited 938 — Others 88 755
Notes to Financial Statements for the year ended June 30, 2017
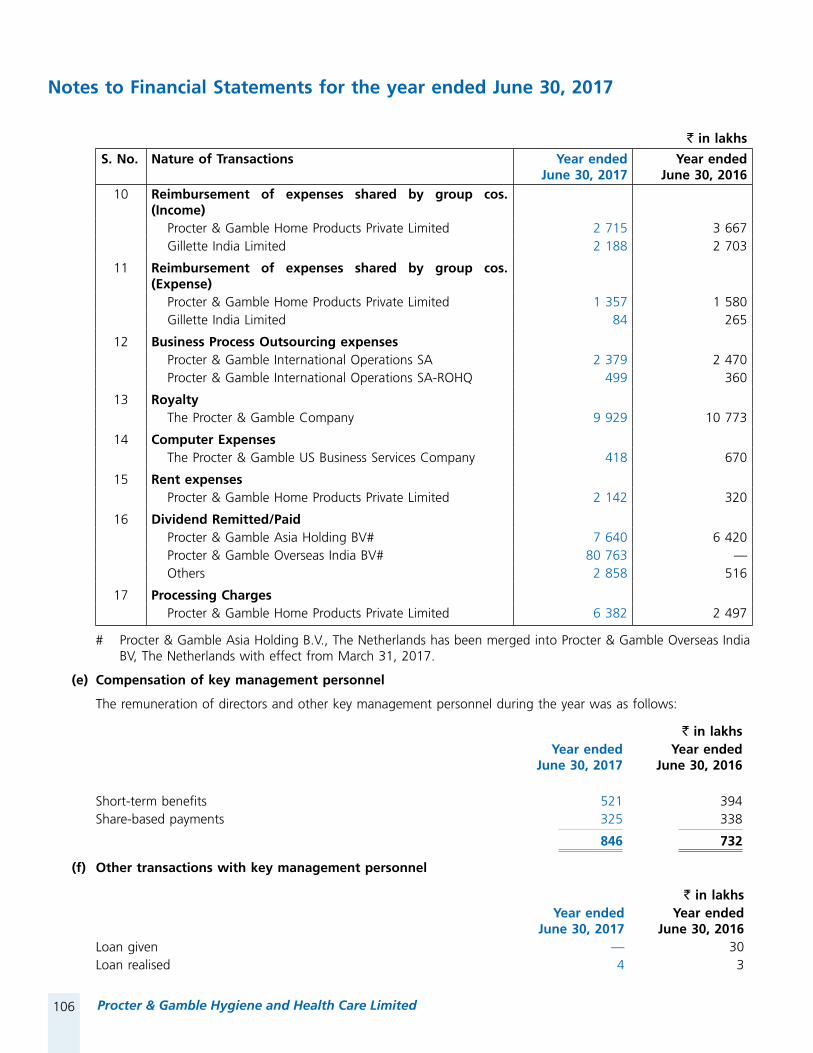
106 Procter & Gamble Hygiene and Health Care Limited
` in lakhs
S. No. Nature of Transactions Year endedJune 30, 2017
Year endedJune 30, 2016
10 Reimbursement of expenses shared by group cos. (Income) Procter & Gamble Home Products Private Limited 2 715 3 667 Gillette India Limited 2 188 2 703
11 Reimbursement of expenses shared by group cos. (Expense) Procter & Gamble Home Products Private Limited 1 357 1 580 Gillette India Limited 84 265
12 Business Process Outsourcing expenses Procter & Gamble International Operations SA 2 379 2 470 Procter & Gamble International Operations SA-ROHQ 499 360
13 Royalty The Procter & Gamble Company 9 929 10 773
14 Computer Expenses The Procter & Gamble US Business Services Company 418 670
15 Rent expenses Procter & Gamble Home Products Private Limited 2 142 320
16 Dividend Remitted/Paid Procter & Gamble Asia Holding BV# 7 640 6 420 Procter & Gamble Overseas India BV# 80 763 — Others 2 858 516
17 Processing Charges Procter & Gamble Home Products Private Limited 6 382 2 497
# Procter & Gamble Asia Holding B.V., The Netherlands has been merged into Procter & Gamble Overseas India BV, The Netherlands with effect from March 31, 2017.
(e) Compensation of key management personnel
The remuneration of directors and other key management personnel during the year was as follows:
` in lakhsYear ended
June 30, 2017Year ended
June 30, 2016
Short-term benefits 521 394 Share-based payments 325 338
846 732
(f) Other transactions with key management personnel
` in lakhsYear ended
June 30, 2017Year ended
June 30, 2016Loan given — 30 Loan realised 4 3
Notes to Financial Statements for the year ended June 30, 2017

107
Company Overview
Board’s Report
Management Discussion and Analysis
Corporate Governance
Financial Statements
Annual Report 2016-2017
Note:
1 Disclosure required under section 186(4) of the Companies Act, 2013 for Loans given:` in lakhs
Sr. No.
Name Relations Amount given during for the
year ended June 30, 2017
Amount given during for the
year ended June 30, 2016
Inter corporate loans
1 Procter & Gamble Home Products Private Limited Fellow Subsidiary 20 000 20 000
2 Wella India Hair Cosmetics Pvt. Ltd. Fellow Subsidiary — 20 000
3 Gillette Diversified Operations Pvt. Ltd. Fellow Subsidiary — 1 300
Above inter corporate loans have been given for general business purposes for meeting their working capital requirements.
33. Operating lease arrangements
Company as a lessee.
33.1 Leasing arrangements
The Company has taken on lease guesthouses for accommodation of employees, with an option of renewal at the end of the lease term and escalation clause in some of the cases. These leases can be terminated with a prior notice as per terms and conditions of the respective lease agreements.
33.2 Payments recognised as an expense
Year ended June 30, 2017
` in lakhs
Year ended June 30, 2016
` in lakhs
Minimum lease payments 2 665 3 749
2 665 3 749
33.3 Non-cancellable operating lease commitments
As at June 30, 2017
` in lakhs
As at June 30, 2016
` in lakhs
As at July 1, 2015
` in lakhs
Not later than one year 241 291 280
Later than one year but not later than five years — 241 532
Later than five years — — —
Total 241 532 812
34. Commitments
As at June 30, 2017
` in lakhs
As at June 30, 2016
` in lakhs
As at July 1, 2015
` in lakhs
Estimated amount of contracts remaining to be executed on capital account and not provided for
109 357 65
109 357 65
Notes to Financial Statements for the year ended June 30, 2017
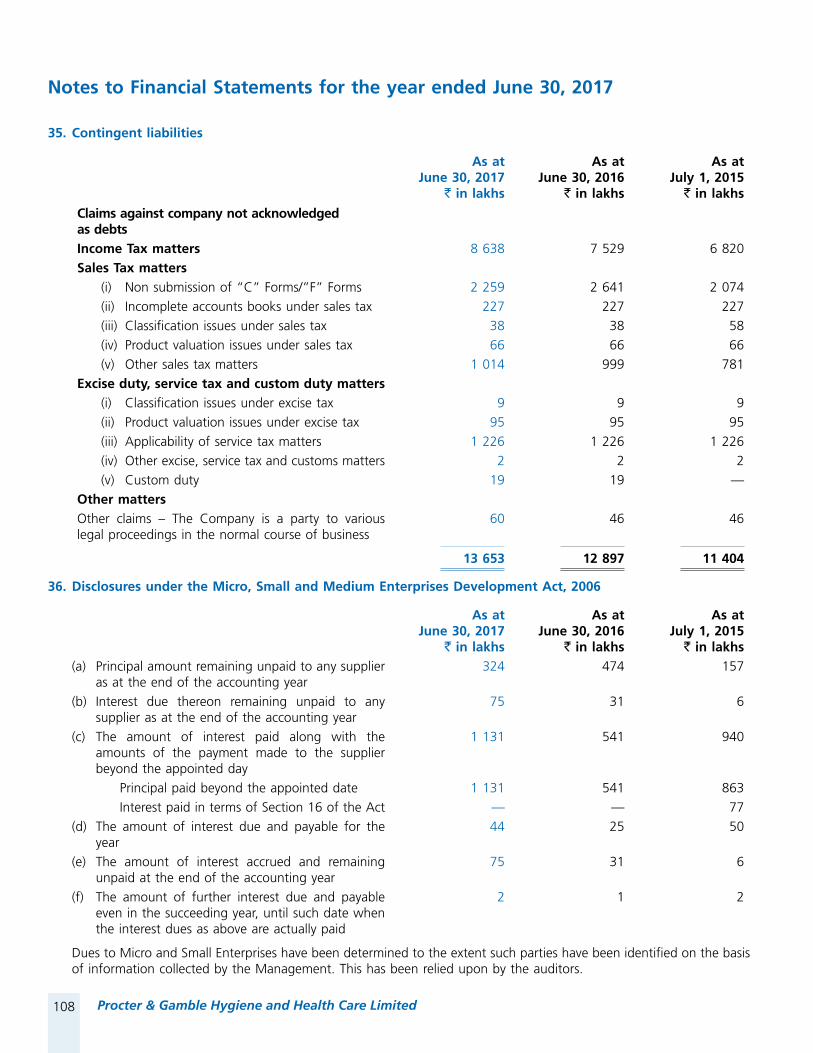
108 Procter & Gamble Hygiene and Health Care Limited
Notes to Financial Statements for the year ended June 30, 2017
35. Contingent liabilities
As at June 30, 2017
` in lakhs
As at June 30, 2016
` in lakhs
As at July 1, 2015
` in lakhs
Claims against company not acknowledged as debtsIncome Tax matters 8 638 7 529 6 820 Sales Tax matters (i) Non submission of “C” Forms/”F” Forms 2 259 2 641 2 074 (ii) Incomplete accounts books under sales tax 227 227 227 (iii) Classification issues under sales tax 38 38 58 (iv) Product valuation issues under sales tax 66 66 66 (v) Other sales tax matters 1 014 999 781 Excise duty, service tax and custom duty matters (i) Classification issues under excise tax 9 9 9 (ii) Product valuation issues under excise tax 95 95 95 (iii) Applicability of service tax matters 1 226 1 226 1 226 (iv) Other excise, service tax and customs matters 2 2 2 (v) Custom duty 19 19 — Other mattersOther claims – The Company is a party to various legal proceedings in the normal course of business
60 46 46
13 653 12 897 11 404
36. Disclosures under the Micro, Small and Medium Enterprises Development Act, 2006
As at June 30, 2017
` in lakhs
As at June 30, 2016
` in lakhs
As at July 1, 2015
` in lakhs (a) Principal amount remaining unpaid to any supplier
as at the end of the accounting year 324 474 157
(b) Interest due thereon remaining unpaid to any supplier as at the end of the accounting year
75 31 6
(c) The amount of interest paid along with the amounts of the payment made to the supplier beyond the appointed day
1 131 541 940
Principal paid beyond the appointed date 1 131 541 863 Interest paid in terms of Section 16 of the Act — — 77 (d) The amount of interest due and payable for the
year 44 25 50
(e) The amount of interest accrued and remaining unpaid at the end of the accounting year
75 31 6
(f) The amount of further interest due and payable even in the succeeding year, until such date when the interest dues as above are actually paid
2 1 2
Dues to Micro and Small Enterprises have been determined to the extent such parties have been identified on the basis of information collected by the Management. This has been relied upon by the auditors.

109
Company Overview
Board’s Report
Management Discussion and Analysis
Corporate Governance
Financial Statements
Annual Report 2016-2017
37. (a) Reimbursement / (recovery) of expenses cross charged to related parties include payments / recoveries on account of finance, personnel, secretarial, administration and planning services rendered under common services agreements with Procter & Gamble Home Products Private Limited and Gillette India Limited. (Refer note 38).
(b) Certain expenses in the nature of employee costs, relocation costs and other expenses are cross charged by the Company to its fellow subsidiaries at actual. Similar expenses incurred by fellow subsidiaries are cross charged to the Company at actual.
38. (a) Employee Benefits Expense includes expenses in respect of Managerial personnel of ` 806 lakhs (Previous Year: ` 515 lakhs) cross charged to Gillette India Limited and Procter & Gamble Home Products Private Limited in terms of the common services agreement (Refer Note 37).
(b) Employee Benefits Expense includes expenses in respect of Managerial personnel of ` 175 lakhs (Previous Year: ` 170 lakhs) cross charged from Gillette India Limited and Procter & Gamble Home Products Private Limited in terms of the common services agreement (Refer Note 37).
39. Dividend
Year ended June 30, 2017
` in lakhs
Year ended June 30, 2016
` in lakhsDividend on equity shares paid during the year Final dividend for the FY 2015-16: ` 36 (Previous year: FY 2014-15 ` 30.25) per equity share of ` 10 each
11 686 9 819
Dividend distribution tax on final dividend 2 379 1 999 Interim dividend for the FY 2016-17: ` 362 (Previous year: Nil) per equity share of ` 10 each
1 17 508 —
Dividend distribution tax on interim dividend 23 925 —
Total 1 55 498 11 818
Proposed Dividend:
The Board of Directors at its meeting held on August 23, 2017 have recommended a payment of final dividend of ` 27 per equity share of face value of ` 10 each for the financial year ended June 30, 2017. The same amounts to ` 10 549 lakhs including dividend distribution tax of ` 1 785 lakhs.
The above is subject to approval at the ensuing Annual General Meeting of the Company and hence is not recognised as a liability.
40. The Company did not have any Specified Bank Notes or any other denomination notes as defined in MCA notification G.S.R. 308 (E) dated March 31, 2017 on the details of Specified Bank Notes (SBN) held and transacted during the period from November 8, 2016 to December 30, 2016. The denomination wise SBNs and other notes as per the notification is given below:
SBNs Other denomination notes Total` in lakhs ` in lakhs ` in lakhs
Closing cash in hand as on November 8, 2016 — — — (+) Permitted receipts — — — (-) Permitted payments — — — (-) Amount deposited in banks — — —
Closing cash in hand as on December 30, 2016 — — —
For the purpose of this clause, the term “Specified Bank Note” shall have the same meaning provided in the notification of the Government of India, in the Ministry of Finance Department of Economic Affairs No. S.O. 3407 (E), dated the November 8, 2016.
41. Approval of financial statements
The financial statements were approved for issue by the Board of Directors on August 23, 2017.
Notes to Financial Statements for the year ended June 30, 2017

110 Procter & Gamble Hygiene and Health Care Limited
Notes to Financial Statements for the year ended June 30, 2017
42. First-time Ind AS adoption reconciliations
42.1 Effect of Ind AS adoption on the balance sheet as at July 1, 2015 (date of transition to Ind AS)
Indian GAAP Adjustments Ind AS
Footnotes ` in lakhs ` in lakhs ` in lakhsAssetsNon-current assets Property, plant and equipment a 30 879 55 30 934 Capital work-in-progress 3 898 — 3 898 Financial assets (i) Loans 5 655 — 5 655 (ii) Other financial assets 88 — 88 Deferred tax assets (Net) 396 — 396 Income tax assets (Net) 17 389 — 17 389 Other non-current assets a 835 18 853
Total non-current assets 59 140 73 59 213
Current assets Inventories 11 907 — 11 907 Financial assets (i) Trade receivables 11 394 — 11 394 (ii) Cash and cash equivalents 61 478 — 61 478 (iii) Bank balances other than (ii) above 297 — 297 (iv) Loans 41 856 — 41 856 (v) Other financial assets 5 436 — 5 436 Other current assets a 3 260 2 3 262
Total current assets 1 35 628 2 1 35 630
Total assets 1 94 768 75 1 94 843
Equity and liabilitiesEquity Equity share capital 3 246 — 3 246 Other equity a,b 1 19 622 11 704 1 31 326
Total equity 1 22 868 11 704 1 34 572 Non-current liabilities Financial liabilities Provisions 333 — 333
Total non-current liabilities 333 — 333
Current liabilities Financial liabilities (i) Trade payables 37 230 — 37 230 (ii) Other financial liabilities a 952 189 1 141 Provisions 364 — 364 Current tax liabilities (Net) 13 690 — 13 690 Other current liabilities b 19 331 (11 818) 7 513
Total current liabilities 71 567 (11 629) 59 938
Total liabilities 71 900 (11 629) 60 271
Total equity and liabilities 1 94 768 75 1 94 843

111
Company Overview
Board’s Report
Management Discussion and Analysis
Corporate Governance
Financial Statements
Annual Report 2016-2017
42.2 Effect of Ind AS adoption on the balance sheet as at June 30, 2016
Indian GAAP Adjustments Ind AS
Footnotes ` in lakhs ` in lakhs ` in lakhsAssetsNon-current assets Property, plant and equipment a 31 686 57 31 743 Capital work-in-progress 3 472 — 3 472 Financial assets (i) Loans 5 677 — 5 677 (ii) Other financial assets 181 — 181 Deferred tax assets (Net) e 788 106 894 Income tax assets (Net) 10 697 — 10 697 Other non-current assets a 773 16 789
Total non-current assets 53 274 179 53 453
Current assets Inventories 12 748 — 12 748 Financial assets (i) Trade receivables 14 962 — 14 962 (ii) Cash and cash equivalents 1 06 659 — 1 06 659 (iii) Bank balances other than (ii) above 659 — 659 (iv) Loans 20 586 — 20 586 (v) Other financial assets 6 379 — 6 379 Other current assets a 1 193 2 1 195
Total current assets 1 63 186 2 1 63 188
Total assets 2 16 460 181 2 16 641
Equity and liabilitiesEquity Equity share capital 3 246 — 3 246 Other equity a,b,e 1 47 875 14 057 1 61 932
Total equity 1 51 121 14 057 1 65 178
Non-current liabilities Financial liabilities Provisions 357 — 357
Total non-current liabilities 357 — 357
Current liabilities Financial liabilities (i) Trade payables 32 413 — 32 413 (ii) Other financial liabilities a 1 523 189 1 712 Provisions 310 — 310 Current tax liabilities (Net) 8 220 — 8 220 Other current liabilities b 22 516 (14 065) 8 451
Total current liabilities 64 982 (13 876) 51 106
Total liabilities 65 339 (13 876) 51 463
Total equity and liabilities 2 16 460 181 2 16 641
Notes to Financial Statements for the year ended June 30, 2017

112 Procter & Gamble Hygiene and Health Care Limited
Notes to Financial Statements for the year ended June 30, 2017
42.3 Reconciliation of total equity as at June 30, 2016 and July 1, 2015 (date of transition to Ind AS)
Notes As at June 30, 2016
(End of last period presented
previous GAAP)
As at July 1, 2015
(date of transition to
Ind AS)
` in lakhs ` in lakhsTotal equity (shareholder’s funds) under previous GAAP 1 47 875 1 19 622 Recognition of deferred taxes using the balance sheet approach under Ind AS
e 106 —
Finance lease obligations a (114) (114)Dividends not recognised as liability until declared under Ind AS b 14 065 11 818
Total adjustment to equity 14 057 11 704
Total equity under Ind AS 1 61 932 1 31 326
42.4 Effect of Ind AS adoption on the statement of profit or loss for the year ended June 30, 2016
Indian GAAP Adjustments Ind AS
Footnotes ` in lakhs ` in lakhs ` in lakhsRevenue from operations c 2 48 433 (13 518) 2 34 915 Other income 8 761 — 8 761 Total income 2 57 194 (13 518) 2 43 676 ExpensesCost of raw and packing materials consumed f 59 163 (2 965) 56 198 Purchases of stock-in-trade (Traded Goods) 33 350 — 33 350 Changes in inventories of finished goods, work-in-progress and stock-in-trade
(1 071) — (1 071)
Excise duty on sale of goods c 272 7 104 7 376 Employee benefits expense d,e 11 856 (121) 11 735 Finance costs d 402 225 627 Depreciation and amortisation expense a 5 169 (2) 5 167 Other expenses a,c,f 84 399 (17 655) 66 744
Total expense 1 93 540 (13 414) 1 80 126 Profit before tax 63 654 (104) 63 550 Tax expense Current tax 21 728 — 21 728 Deferred tax d,e (392) (36) (428)
Income tax expense 21 336 (36) 21 300 Profit for the year 42 318 (68) 42 250 Other comprehensive incomeOther comprehensive income not to be reclassified to profit or loss in subsequent periods: Re-measurement of the defined benefit plans d — (202) (202) Income tax effect d — 70 70
Total other comprehensive income for the year — (132) (132)
Total comprehensive income for the year 42 318 (200) 42 118

113
Company Overview
Board’s Report
Management Discussion and Analysis
Corporate Governance
Financial Statements
Annual Report 2016-2017
42.5 Effect of Ind AS adoption on the Statement of Cash Flows for the year ended June 30, 2016
There are no material adjustments to the Statement of Cash Flows as reported under the previous GAAP.
Notes to the reconciliations:
a. Property, plant and equipment:
In the financial statements prepared under previous GAAP, Leasehold land was disclosed as a part of fixed assets and measured at the total lease payment made at the time of lease agreement and the same was amortised over the period of lease on a yearly basis. Under Ind AS, the leasehold land is treated as prepaid expenses for lease rentals and the prepayment forms a part of other current and non-current assets. Accordingly, the prepaid expense as at July 1, 2015 is ` 20 lakhs, current portion is ` 2 lakhs and non current is ` 18 lakhs and as at June 30, 2016 is ` 18 lakhs, current portion is ` 2 lakhs and non current is ` 16 lakhs. Additionally the amortisation on leasehold land is treated as rent expense and ` 2 lakhs for the year ended June 30, 2016 is transferred from depreciation expense to other expenses.
Under Ind AS, the Company has identified agreements which in substance fall under the category of Finance Leases. Accordingly Finance lease obligation payable has been created in the books as at July 1, 2015 (` 189 lakhs) and as at June 30, 2016 (` 189 lakhs) and corresponding Freehold Land as at July 1, 2015 (` 75 lakhs) and as at June 30, 2016 (` 75 lakhs). The effect of this change is an decrease in total equity as at July 1, 2015 (` 114 lakhs) and as at June 30, 2016 (` 114 lakhs), but does not affect profit before tax and total profit for the year ended June 30, 2016.
b. Proposed Dividend:
In the financial statements prepared under previous GAAP, dividend on equity shares recommended by the Board of Directors after the end of reporting period but before the financial statements were approved for issue, was recognised as a liability in the financial statements in the reporting period relating to which dividend was proposed. Under Ind AS, such dividend is recognised in the reporting period in which the same is approved by the members in a general meeting.
On the date of transition, the above change in accounting treatment of proposed dividend has resulted in increase in Equity with a corresponding decrease in Provisions by ` 14 065 lakhs as at June 30, 2016. The above change has also resulted in an increase in Equity with a corresponding decrease in provision by ` 11 818 lakhs as at July 1, 2015.
c. Revenue from operations:
In the financial statements prepared under previous GAAP, revenue from sale of products was presented net of excise duty. However, under Ind AS, revenue from sale of products includes excise duty. Excise duty expense amounting to ` 7 104 lakhs is presented separately on the face of the Statement of Profit and Loss for the year ended June 30, 2016.
In the financial statements prepared under previous GAAP, sales incentive scheme expenses were shown as a part of other expenses. However, under Ind AS, such discounts and sales promotional expenses amounting to ` 20 622 lakhs for the year ended June 30, 2016, are reduced from revenue from sale of products.
In light of the above, revenue from sale of products under Ind AS has decreased by ` 13 518 lakhs (` 20 622 lakhs less ` 7 104 lakhs) with an corresponding increase in excise duty by ` 7 104 lakhs and decrease in other expenses by ` 20 622 lakhs in the Statement of Profit and Loss for the year ended June 30, 2016.
The above changes do not affect equity as at date of transition to Ind AS, profit after tax for the year ended June 30, 2016 and Equity as at June 30, 2016.
Notes to Financial Statements for the year ended June 30, 2017

114 Procter & Gamble Hygiene and Health Care Limited
d. Remeasurement benefit of defined benefit plans:
In the financial statements prepared under previous GAAP, remeasurement benefit of defined plans, arising primarily due to change in actuarial assumptions was recognised as employee benefits expense in the Statement of Profit and Loss. Under Ind AS, such remeasurement benefits relating to defined benefit plans is recognised in OCI as per the requirements of Ind AS 19- Employee benefits. Consequently, the related tax effect of the same has also been recognised in OCI.
For the year ended June 30, 2016, remeasurement of gratuity liability and PRMB resulted in a net benefit of ` 202 lakhs which has now been removed from employee benefits expense in the Statement of Profit and Loss and recognised separately in OCI.
Under Previous GAAP, the interest cost on defined benefit liability was recognised as employee benefit expenses in the Statement of Profit and Loss. Under Ind AS, the Company has recognised the net interest cost on defined benefit plans amounting to ` 225 lakhs for the year ended June 30, 2016 as finance cost.
This has resulted in decrease in employee benefits expense by ` 427 lakhs (` 202 lakhs and ` 225 lakhs) and gain in OCI by ` 202 lakhs and finance cost by ` 225 lakhs for the year ended June 30, 2016. Consequently, tax effect of the same amounting to ` 70 lakhs is also recognised separately in OCI.
The above changes do not affect Equity as at date of transition to Ind AS and as at June 30, 2016. However, Profit before tax and profit for the year ended June 30, 2016 decreased by ` 202 lakhs and ` 132 lakhs respectively.
e. Employee stock option plan:
In the financial statement prepared under previous GAAP, the cost of equity-settled employee share-based payments was recognised at the time of exercise of the stock options. Under Ind AS, the cost of equity-settled employee share-based payments is recognised based on the fair value of the options as on the grant date. On transitioning to Ind AS, fair value of partially vested share-based payment plans has been recognised in equity of ` 48 lakhs as at July 1, 2015 and ` 306 lakhs for the year ended June 30, 2016.
The above change has resulted in decrease in profit after tax for the year ended June 30, 2016 by ` 306 lakhs increase in deferred tax asset as at June 30, 2016 by ` 106 lakhs and increase in equity as at June 30, 2016 by ` 106 lakhs.
f. Embedded lease:
Under Ind AS, the Company has identified arrangements which in substance fall under the Appendix C to IND AS 17 Determining whether an arrangement contains a lease and the payments for the lease have been bifurcated from payments for other elements in the arrangement. Accordingly, the payment for the lease is treated as rent expense and ` 2 965 lakhs for the year ended June 30, 2016 is transferred from Cost of raw and packing materials consumed to other expenses. The above changes do not affect profit after tax for the year ended June 30, 2016 and Equity as at June 30, 2016.
Notes to Financial Statements for the year ended June 30, 2017
Signatures to Note 1 to 42
For and on behalf of Board of Directors
R. A. Shah Karthik NatarajanChairman Director
Prashant Bhatnagar I SonthaliaChief Financial Officer Company Secretary
Mumbai August 23, 2017

115
Company Overview
Board’s Report
Management Discussion and Analysis
Corporate Governance
Financial Statements
Annual Report 2016-2017
TEN YEAR FINANCIAL HIGHLIGHTS
2008 2009 2010 2011 2012 2013 2014 2015 2016^ 2017^
YEAR END FINANCIAL POSITION ( ̀ Crores)
Gross Fixed Assets 203.1 221.8 243.0 312.9 345.9 377.5 428.1 523.7 574.4 588.9
Net Fixed Assets 123.1 132.3 130.3 190.4 198.4 214.9 239.5 308.8 352.2 326.6
Net Worth 346.6 440.0 534.6 600.6 786.6 805.3 1002.9 1228.7 1651.8 526.1
SUMMARY OF OPERATIONS ( ̀ Crores)
Gross Sales 652.6 773.0 913.5 1037.0 1310.1 1696.7 2063.6 2358.4 2349.2 2419.2
Profit before Tax 180.6 231.7 233.6 178.7 223.0 286.2 460.3 500.8 635.5 671.8
Profit after Tax 131.4 178.8 179.8 150.9 182.9 203.2 302.0 346.1 422.5 432.7
Dividend 64.9 73.0 73.0 73.0 73.0 81.2 89.3 98.2 98.2 1291.9*
PER SHARE DATA
EPS ( ̀ ) 40.48 55.10 55.38 46.48 57.30 62.61 93.04 106.63 130.16 133.31
Dividend (%) 200 225 225 225 225 250 275 302 302 3980
NUMBER OF SHARES
Shares (Lakhs) 324.61 324.61 324.61 324.61 324.61 324.61 324.61 324.61 324.61 324.61
^ Figures for these years are as per new accounting standards (Ind AS) and Schedule III of Companies Act, 2013. Hence these numbers are not comparable with previous years
* Includes interim Dividend

116 Procter & Gamble Hygiene and Health Care Limited
NOTES

vaki
ls