validation of safety-critical systems for aircraft loss-of ... · american institute of aeronautics...
TRANSCRIPT
American Institute of Aeronautics and Astronautics
1
Validation of Safety-Critical Systems for Aircraft Loss-of-Control Prevention and Recovery
Christine M. Belcastro1 NASA Langley Research Center, Hampton, Virginia, 23681
Validation of technologies developed for loss of control (LOC) prevention and recovery poses significant challenges. Aircraft LOC can result from a wide spectrum of hazards, often occurring in combination, which cannot be fully replicated during evaluation. Technologies developed for LOC prevention and recovery must therefore be effective under a wide variety of hazardous and uncertain conditions, and the validation framework must provide some measure of assurance that the new vehicle safety technologies do no harm (i.e., that they themselves do not introduce new safety risks). This paper summarizes a proposed validation framework for safety-critical systems, provides an overview of validation methods and tools developed by NASA to date within the Vehicle Systems Safety Project, and develops a preliminary set of test scenarios for the validation of technologies for LOC prevention and recovery.
I. Introduction
IRCRAFT loss of control (LOC) can result from a wide spectrum of hazards, often occurring in combination, which cannot be fully replicated during evaluation. 1 Technologies developed for LOC prevention and
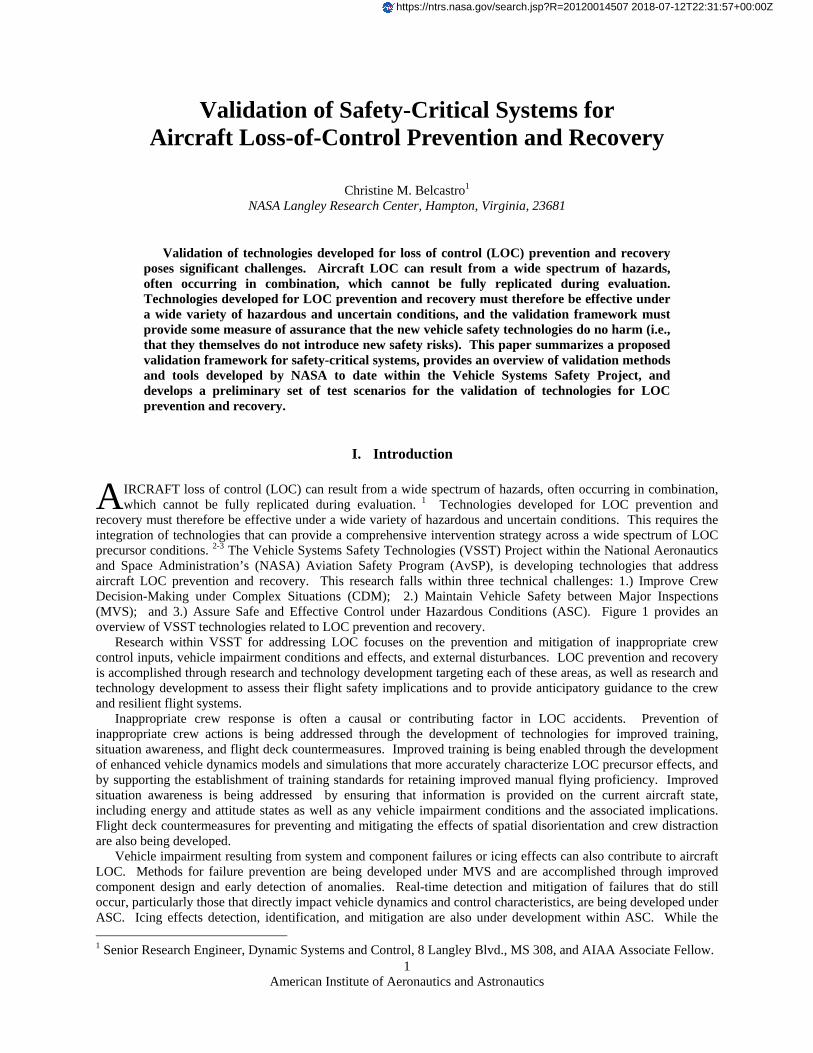
recovery must therefore be effective under a wide variety of hazardous and uncertain conditions. This requires the integration of technologies that can provide a comprehensive intervention strategy across a wide spectrum of LOC precursor conditions. 2-3 The Vehicle Systems Safety Technologies (VSST) Project within the National Aeronautics and Space Administration’s (NASA) Aviation Safety Program (AvSP), is developing technologies that address aircraft LOC prevention and recovery. This research falls within three technical challenges: 1.) Improve Crew Decision-Making under Complex Situations (CDM); 2.) Maintain Vehicle Safety between Major Inspections (MVS); and 3.) Assure Safe and Effective Control under Hazardous Conditions (ASC). Figure 1 provides an overview of VSST technologies related to LOC prevention and recovery.
Research within VSST for addressing LOC focuses on the prevention and mitigation of inappropriate crew control inputs, vehicle impairment conditions and effects, and external disturbances. LOC prevention and recovery is accomplished through research and technology development targeting each of these areas, as well as research and technology development to assess their flight safety implications and to provide anticipatory guidance to the crew and resilient flight systems.
Inappropriate crew response is often a causal or contributing factor in LOC accidents. Prevention of inappropriate crew actions is being addressed through the development of technologies for improved training, situation awareness, and flight deck countermeasures. Improved training is being enabled through the development of enhanced vehicle dynamics models and simulations that more accurately characterize LOC precursor effects, and by supporting the establishment of training standards for retaining improved manual flying proficiency. Improved situation awareness is being addressed by ensuring that information is provided on the current aircraft state, including energy and attitude states as well as any vehicle impairment conditions and the associated implications. Flight deck countermeasures for preventing and mitigating the effects of spatial disorientation and crew distraction are also being developed.
Vehicle impairment resulting from system and component failures or icing effects can also contribute to aircraft LOC. Methods for failure prevention are being developed under MVS and are accomplished through improved component design and early detection of anomalies. Real-time detection and mitigation of failures that do still occur, particularly those that directly impact vehicle dynamics and control characteristics, are being developed under ASC. Icing effects detection, identification, and mitigation are also under development within ASC. While the 1 Senior Research Engineer, Dynamic Systems and Control, 8 Langley Blvd., MS 308, and AIAA Associate Fellow.
A
https://ntrs.nasa.gov/search.jsp?R=20120014507 2018-07-12T22:31:57+00:00Z
American Institute of Aeronautics and Astronautics
2
detection of environmental hazards is not explicitly being addressed under VSST, methods for the mitigation of their effects are being considered under ASC, with a focus on wake vortex and turbulence encounters. Multiple hazards effects from all of these categories are also being addressed under ASC, as well as methods for assessing their implications on flight safety. Specific aspects of flight safety being addressed include identification of maneuverability constraints resulting from vehicle impairment conditions, detection of the onset of a vehicle upset condition (in the presence of other hazards, including inappropriate control inputs by the crew), and LOC prediction methods. This information is provided to the crew as well as to the resilient vehicle systems.
Figure 1. VSST technologies that focus on LOC prevention and recovery.
The validation of technologies developed for LOC prevention and recovery, such as those summarized in Fig. 1, poses significant challenges. The term “validation” in this paper refers to the confirmation that the algorithms are performing their intended functions (i.e., LOC prevention and recovery), and an affirmation of their effectiveness in these functions. The validation framework must provide some measure of assurance that the new vehicle safety technologies do no harm; i.e., that they themselves (individually and as an integrated system) do not introduce new safety risks. This paper summarizes methods, software tools, and test capabilities developed to date or under development for the validation of technologies developed for LOC prevention and recovery. A preliminary set of LOC test scenarios for use in technology evaluations is also proposed. Section II provides an overview of the validation framework under development, Section III provides a summary of advanced validation methods developed and applied to date, Section IV provides a discussion of validation requirements and presents a preliminary set of LOC test scenarios for use in technology validation, and Section V provides a summary and some concluding remarks.
II. Validation Framework for Integrated LOC Prevention & Recovery Technologies The VSST Project seeks to address cross-cutting aviation safety challenges that require integrated system
effectiveness across technologies developed by the three technical challenges, as indicated in Fig. 1 for LOC prevention and recovery. Future vehicle-related safety technologies must mitigate emerging risks related to increasing automation and system complexity, increasing traffic density, new vehicle designs and materials, new
Prevent / Mitigate Inappropriate Control
Inputs by Crew
Flight Safety Assessment & Anticipatory Guidance
Mitigate Adverse Environmental Effects
• Improved Training− Vehicle Dynamics under LOC− Manual Proficiency
• Improved Aircraft State Awareness− Energy− Attitude− Health
• Flight Deck Countermeasures − Spatial Disorientation− Pilot Engagement
• Detection and Mitigation of External Disturbances− Wake Vortices− Turbulence
• Maneuverability Constraints• Upset Onset Detection• LOC Prediction
• Prevention, Detection, and Mitigation of Vehicle Impairment Conditions & their Effects− Vehicle / System Failures− Airframe / Engine Icing
Prevent / Mitigate Vehicle Impairment
American Institute of Aeronautics and Astronautics
3
operations, and greater fleet diversity. Technologies developed under VSST must enable the safe implementation of new capabilities (e.g., NextGen) and assure favorable outcomes under hazardous conditions (e.g., LOC precursors). While accomplishing this, it must be ensured that new vehicle safety technologies do no harm; i.e., that they themselves do not introduce new safety risks. Significant reduction of LOC as a key contributor to fatal aircraft accidents will require a coordinated effort across CDM, MVS, and ASC, and ultimately integrated system technologies that provide improved crew interfaces to support situation awareness and decision-making (CDM), real-time vehicle health management (MVS), and effective guidance and control under hazardous conditions (ASC). The safe realization of NextGen will also require vehicle capabilities that span each of the VSST TCs.
Advanced evaluation methods are needed to accomplish effective validation of the technologies being developed for LOC prevention and recovery. Current analytical methods and tools are based on linear system theory, and are therefore limited for analyses under highly nonlinear and off-nominal conditions. For the analysis of LOC prevention and recovery technologies, analytical methods and tools are needed for evaluating nonlinear, adaptive, hybrid, diagnostic, prognostic, and other decision-based systems technologies — as well as integrated technologies that provide these capabilities. Moreover, expanded operational envelopes and adverse conditions associated with aircraft LOC may render full Monte Carlo evaluations infeasible because of the very large operational space that must be considered. Transport simulations have also traditionally been developed for normal flight conditions. Development of enhanced transport simulations that provide an accurate characterization of LOC conditions is essential for evaluation of technologies developed for LOC prevention and recovery. Moreover, these enhanced simulation models must also be validated. Experimental methods, ground-based and in-flight, for integrated technologies operating under high-risk conditions are also very limited.
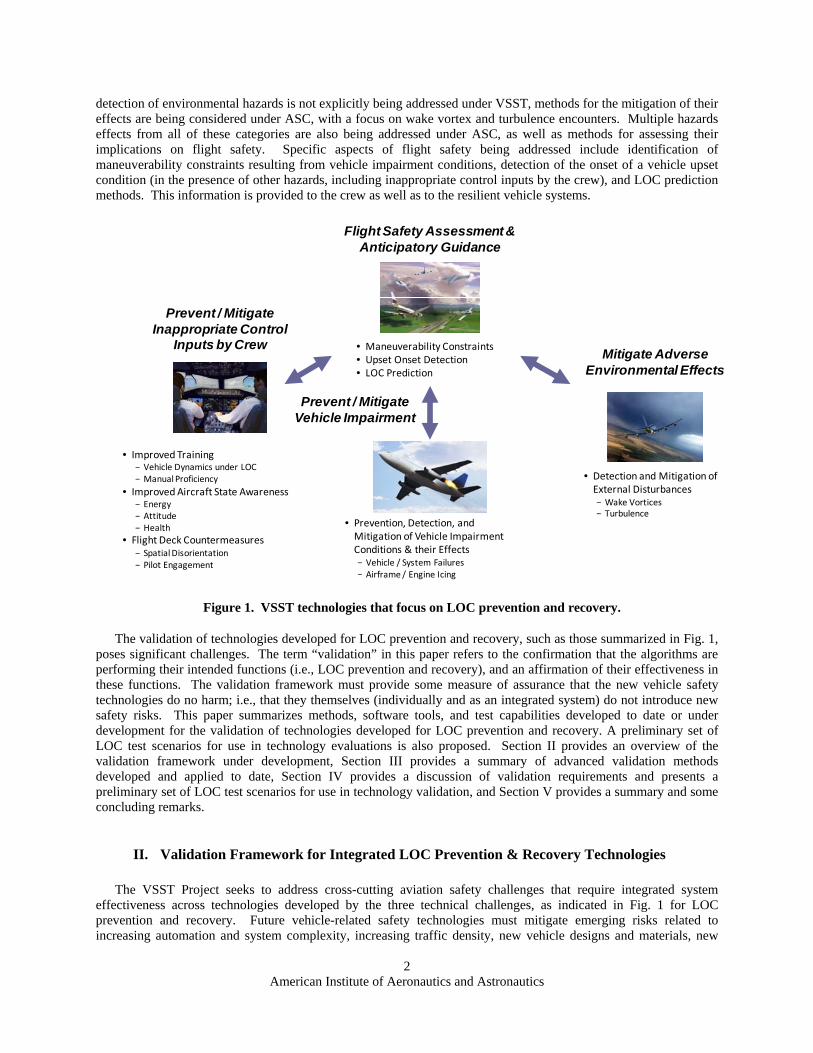
In order to address this critical need, NASA has defined a comprehensive evaluation framework for validating integrated systems technologies developed for safe operation under hazardous conditions.4, 5 This framework uses a combination of analytical, simulation, and experimental methods to identify technology limitations, regions of safe and uncertain operation, and their boundaries. Figure 2 graphically illustrates the key elements of this approach. Analytical methods are used to identify regions of potential problems relative to stability, performance, robustness, or coverage limitations. Results from these methods can be used in guided Monte Carlo studies and piloted simulation evaluations. Experimental test methods are used to investigate system properties and high-risk condition effects. Real-time monitoring techniques can be used to enable testing under multiple hazards.
Figure 2. Key elements of an approach for validating safety-critical technologies developed for LOC prevention and recovery.
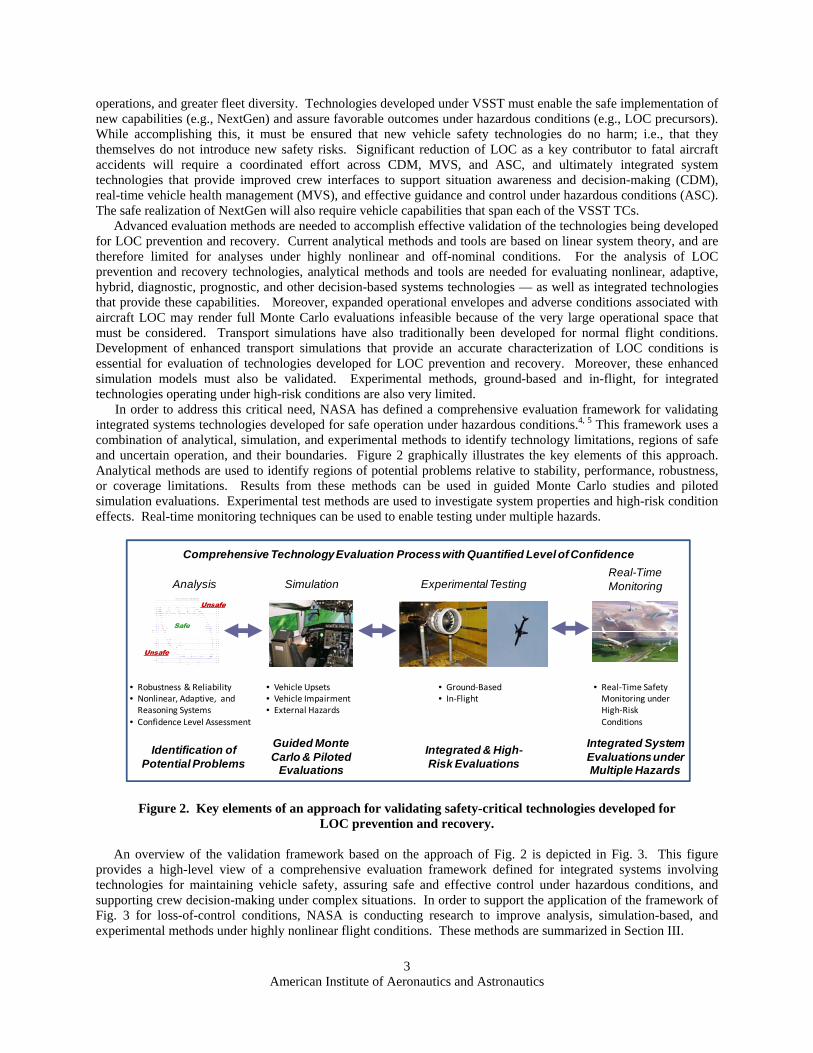
An overview of the validation framework based on the approach of Fig. 2 is depicted in Fig. 3. This figure
provides a high-level view of a comprehensive evaluation framework defined for integrated systems involving technologies for maintaining vehicle safety, assuring safe and effective control under hazardous conditions, and supporting crew decision-making under complex situations. In order to support the application of the framework of Fig. 3 for loss-of-control conditions, NASA is conducting research to improve analysis, simulation-based, and experimental methods under highly nonlinear flight conditions. These methods are summarized in Section III.
SimulationAnalysis
Comprehensive Technology Evaluation Process with Quantified Level of Confidence
Experimental Testing
• Robustness & Reliability• Nonlinear, Adaptive, and Reasoning Systems
• Confidence Level Assessment
• Vehicle Upsets• Vehicle Impairment• External Hazards
• Ground‐Based• In‐Flight
SafeInvariant Set
Unsafe
Unsafe
Safe
Real-Time Monitoring
• Real‐Time Safety Monitoring under High‐Risk Conditions
Identification of Potential Problems
Guided Monte Carlo & Piloted
Evaluations
Integrated & High-Risk Evaluations
Integrated System Evaluations under Multiple Hazards
American Institute of Aeronautics and Astronautics
4
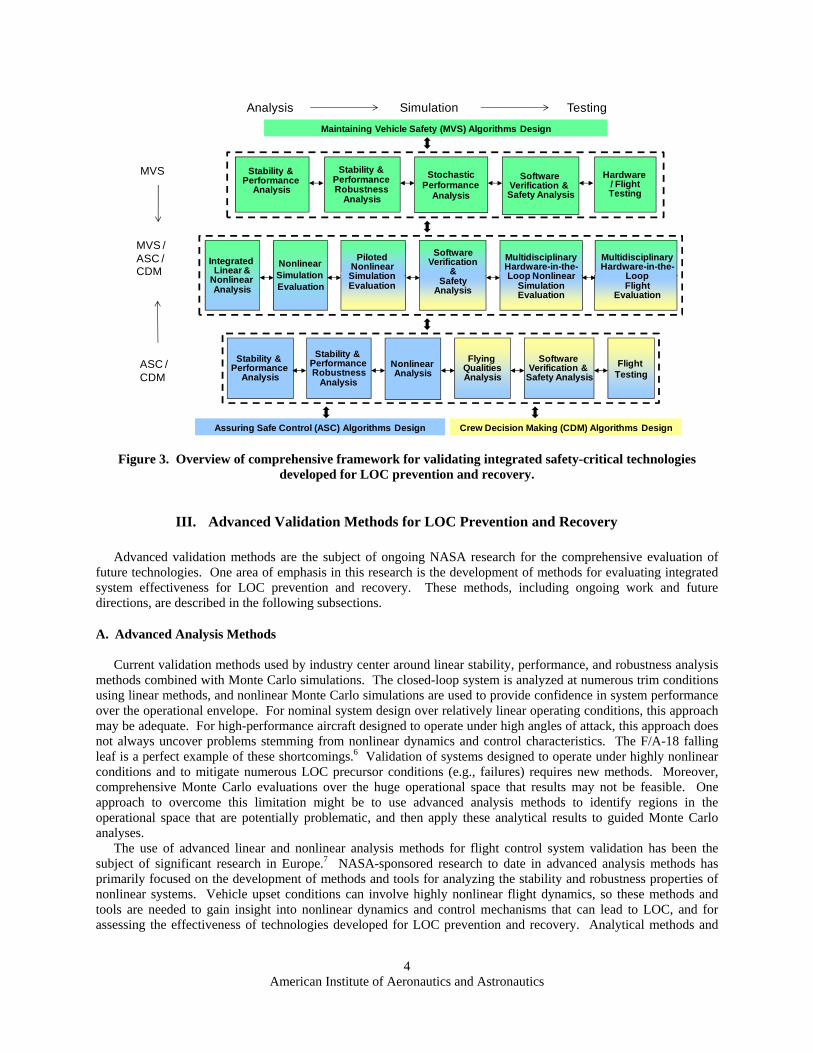
Figure 3. Overview of comprehensive framework for validating integrated safety-critical technologies developed for LOC prevention and recovery.
III. Advanced Validation Methods for LOC Prevention and Recovery Advanced validation methods are the subject of ongoing NASA research for the comprehensive evaluation of
future technologies. One area of emphasis in this research is the development of methods for evaluating integrated system effectiveness for LOC prevention and recovery. These methods, including ongoing work and future directions, are described in the following subsections.
A. Advanced Analysis Methods Current validation methods used by industry center around linear stability, performance, and robustness analysis
methods combined with Monte Carlo simulations. The closed-loop system is analyzed at numerous trim conditions using linear methods, and nonlinear Monte Carlo simulations are used to provide confidence in system performance over the operational envelope. For nominal system design over relatively linear operating conditions, this approach may be adequate. For high-performance aircraft designed to operate under high angles of attack, this approach does not always uncover problems stemming from nonlinear dynamics and control characteristics. The F/A-18 falling leaf is a perfect example of these shortcomings.6 Validation of systems designed to operate under highly nonlinear conditions and to mitigate numerous LOC precursor conditions (e.g., failures) requires new methods. Moreover, comprehensive Monte Carlo evaluations over the huge operational space that results may not be feasible. One approach to overcome this limitation might be to use advanced analysis methods to identify regions in the operational space that are potentially problematic, and then apply these analytical results to guided Monte Carlo analyses.
The use of advanced linear and nonlinear analysis methods for flight control system validation has been the subject of significant research in Europe.7 NASA-sponsored research to date in advanced analysis methods has primarily focused on the development of methods and tools for analyzing the stability and robustness properties of nonlinear systems. Vehicle upset conditions can involve highly nonlinear flight dynamics, so these methods and tools are needed to gain insight into nonlinear dynamics and control mechanisms that can lead to LOC, and for assessing the effectiveness of technologies developed for LOC prevention and recovery. Analytical methods and
Assuring Safe Control (ASC) Algorithms Design
Maintaining Vehicle Safety (MVS) Algorithms Design
Crew Decision Making (CDM) Algorithms Design
Analysis Simulation Testing
MVS
ASC / CDM
MVS /ASC / CDM
Stochastic Performance
Analysis
Hardware / FlightTesting
Stability & Performance
Analysis
Stability & Performance Robustness
Analysis
Software Verification & Safety Analysis
Nonlinear Simulation Evaluation
Piloted Nonlinear Simulation Evaluation
Multidisciplinary Hardware-in-the-Loop Nonlinear
Simulation Evaluation
Multidisciplinary Hardware-in-the-
Loop Flight
Evaluation
Integrated Linear &
Nonlinear Analysis
Software Verification
& Safety
Analysis
Stability & Performance
Analysis
Stability & Performance Robustness
Analysis
Nonlinear Analysis
Flying QualitiesAnalysis
Flight Testing
Software Verification &
Safety Analysis
American Institute of Aeronautics and Astronautics
5
software tools have been developed for nonlinear region of attraction analysis,8 uncertainty quantification and stochastic robustness analysis of nonlinear systems,9 and nonlinear dynamics and control analysis.10
The region of attraction for a nonlinear system provides an indication of the region of stability around an equilibrium point. For a nonlinear closed-loop system, this can be thought of as a measure of local robustness about a trim condition. Finding the exact region of attraction analytically may not be possible.11 However, recent methods have been developed for estimating regions of attraction using Sum-of-Squares (SOS) techniques (see Ref. 8), and they have been successfully used in analyzing closed-loop systems associated with the F/A-18 falling leaf mode.12 Advanced linear robustness analysis methods were also applied to the F/A-18 falling leaf problem.13
Assessing the risk of unlikely events (e.g., failures) is also an important problem. Probabilistic analysis methods were developed to bridge the gap between worst-case analysis and probabilistic measures of rare events.14,15,16,17 These methods were recently applied to an example flight control problem and the analysis results compared with worst-case and Monte Carlo analysis to emphasize the potential benefits of combining worst-case analysis with traditional probabilistic methods.18
Uncertainty quantification and stochastic robustness analysis methods have also been developed for nonlinear systems involving uncertain parameters (see Ref. 9). The associated analysis tool provides a methodology for evaluating the robustness of a control system relative to its ability to satisfy multiple design requirements.19 This methodology provides the ability to bound the region in the uncertain parameter space where the degradation in open-loop or closed-loop performance remains acceptable. The uncertain parameters can be represented using deterministic or probabilistic models. The analysis framework allows high-order models and arbitrary control structures, with arbitrary functional dependencies between the requirements and the uncertain parameters. The design requirements are specified as hard inequality constraints. This analysis method has been applied to the determination of the safely recoverable flight envelope near stall. 20 This methodology has also recently been extended to a unifying framework that includes mixed aleatory and epistemic uncertainties represented in polynomial functional forms.21
Nonlinear dynamics and control analysis methods and tools have also been the subject of NASA-sponsored research (see Ref. 10). Among the tools available for analyzing nonlinear flight characteristics is that of bifurcation analysis using continuation methods.22 This tool allows efficient generation of one-parameter trim curves. A related method using symbolic computing generates multi-parameter trim surfaces.23 These procedures can be supplemented to produce linear parameter varying (LPV) models that are useful for investigating controllability and observability properties, performing linear analysis over a nonlinear parameter space, as well as for designing gain scheduled linear regulators and parameter adaptive controllers. These methods and tools have been applied to the analysis of transport aircraft under LOC conditions.24 Other significant methods and tools for nonlinear bifurcation analysis have been developed25 and applied to high-performance aircraft26–27 and to aircraft LOC problems.28
Validation of diagnostic systems poses significant technical challenges, but has received less attention. Initial work in this area focused on the application of generalized polynomial chaos (gPC) theory to model diagnostic system performance and on the development of a diagnostic validation framework to address the interactions between diagnostic systems and inner-loop control systems.29-30 This methodology has been applied to an example system that is representative of advanced diagnostic algorithms.31
These analysis methods should be used in a coordinated manner with each other and with advanced simulation methods, as suggested by Fig. 3, in order to identify potential regions in the operational space (including LOC precursor conditions) within which the closed-loop system is potentially inadequate relative to stability, performance, robustness, and/or coverage.
B. Advanced Simulation Methods In order to conduct simulation evaluations of technologies developed for LOC prevention and recovery, the
simulation must be capable of characterizing the vehicle dynamics and control effects of LOC precursor conditions, including vehicle upset conditions, vehicle impairment, and external disturbance effects. This is not the current state-of-the-art in transport aircraft simulations, because the modeling of LOC precursor effects poses significant technical challenges. In particular, these effects require multidisciplinary modeling methods, and they involve modeling of nonlinear and unsteady dynamics effects. The development of advanced modeling and simulation methods for LOC characterization in transport aircraft has been the subject of significant research within NASA over the past 10–15 years.
Significant advances have been made in vehicle upset modeling and simulation for transport aircraft.32 These advances address a critical need for improved stall training for commercial33,34 and military35 transport pilots. Continuing research in this area is underway to develop upset models that meet requirements for improved crew
American Institute of Aeronautics and Astronautics
6
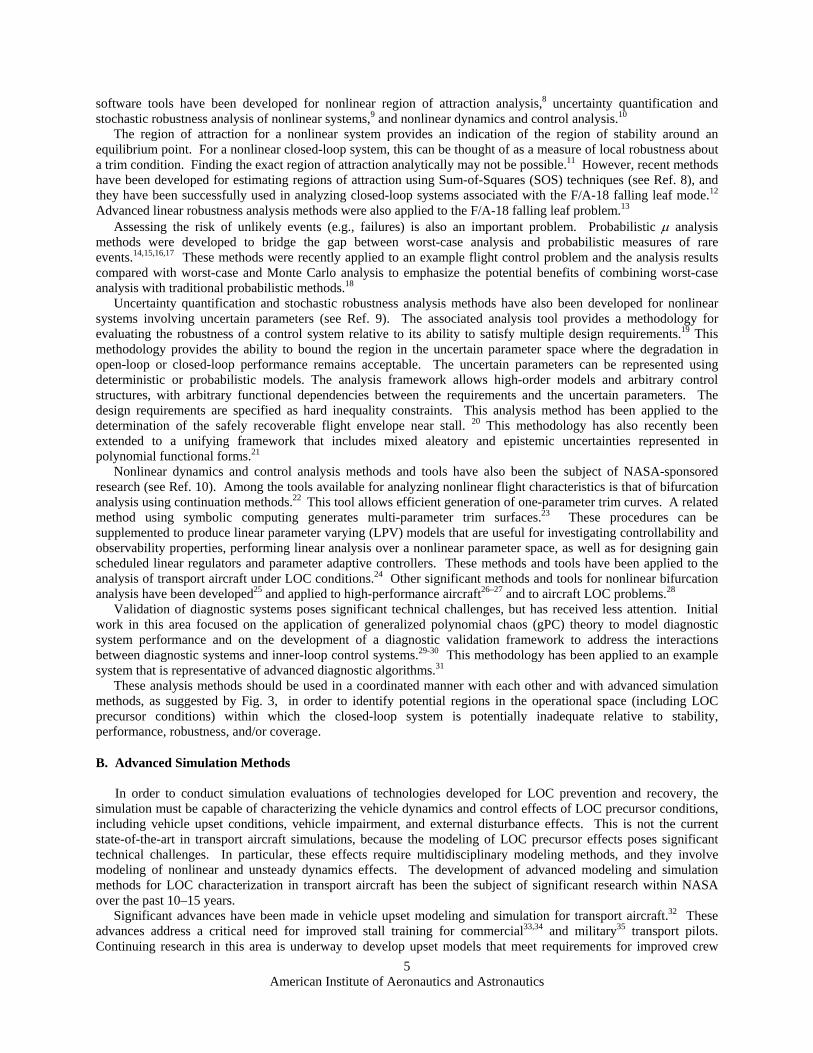
training recommended by the International Committee for Aviation Training in Extended Envelopes (ICATEE).36,37 Moreover, representative upset modeling methods are being developed, including those under the VSST Project, for characterizing upset characteristics across classes of transport aircraft with similar geometric features and dynamical properties. These representative modeling methods are vital to supporting improved training in a cost-effective and timely manner and are also needed for enhanced engineering simulations. While the development of enhanced training simulations is a critical near-term need for improved pilot training, the development of enhanced engineering simulations for the development and evaluation of LOC prevention and recovery technologies is an equally important need and an even greater technical challenge. Figure 4 provides a depiction of a proposed stall modeling envelope for crew training. The red trace in Fig. 4 illustrates the excursions that can occur in extreme LOC accidents. As indicated in the figure, these excursions in angles of attack and sideslip can go well beyond the improved training envelope. While training is expected to significantly reduce LOC accidents, it is unlikely that training can eliminate all long-term causal factors, such as those due to structural damage or changes in operational conditions. Moreover, training may not fully replicate the element of surprise and the panic that ensues under conditions such as these, nor can it fully predict (or prescribe) the human response under time-critical life-threatening complex situations. Onboard systems technologies that can provide LOC prevention and recovery under these extreme conditions are therefore also needed for effective LOC accident prevention (see Ref. 2 and 3). For the development and evaluation of these technologies, enhanced engineering simulations are needed across the entire envelope illustrated in Fig. 4. This therefore poses an even greater modeling and simulation challenge.
Another area of significant modeling and simulation research and development is in characterizing vehicle impairment conditions resulting from vehicle damage and icing effects. Vehicle damage can result as a collateral effect of system failures (e.g., uncontained engine failures38) and maintenance errors (e.g., insufficient lubrication of control surface fasteners39 and undetected fatigue cracks in the airframe structure40). Vehicle damage can also result from design errors and/or inappropriate crew response.41 Recent and ongoing research in this area is being performed in collaboration with the United States Air Force, who also has a high interest in the safe flight of damaged transport aircraft.42 Recent and ongoing research into icing effects focuses on airframe icing43 as well as engine icing.44-45 The modeling and detection of airframe icing effects under turbulence conditions is also the subject of current research,46-47 as is the modeling and detection of engine icing effects.48
Figure 4. Depiction of potential stall modeling envelope for pilot training.
Simulation-based evaluation methods are also being used to evaluate the potential effectiveness of integrated
flight and enhanced propulsion control capability for LOC prevention and recovery,49 as well as for determining the achievable dynamics of an impaired vehicle.50
StallModelingEnvelope
For Improved Training
Full‐scale flight test data
Stall
American Institute of Aeronautics and Astronautics
7
C. Integrated and High-Risk Experimental Testing Integrated ground testing across VSST technologies for LOC prevention and recovery will be performed in the
Systems and Airframe Failure Emulation, Testing, and Integration (SAFETI) Laboratory. The SAFETI Lab is being developed to provide modular hardware-in-the-loop capability, including advanced programmable avionics systems, actuators, and sensors. A linked-lab capability will enable the interconnection of laboratories within NASA Langley, NASA, or elsewhere. The distributed multidisciplinary test capability of the SAFETI Lab will enable the closed-loop evaluation of error propagation and containment between integrated safety-critical subsystems, including the effects of missed detections, incorrect decisions, and inappropriate control actions. Reference 4 has a more detailed description of the SAFETI Lab.
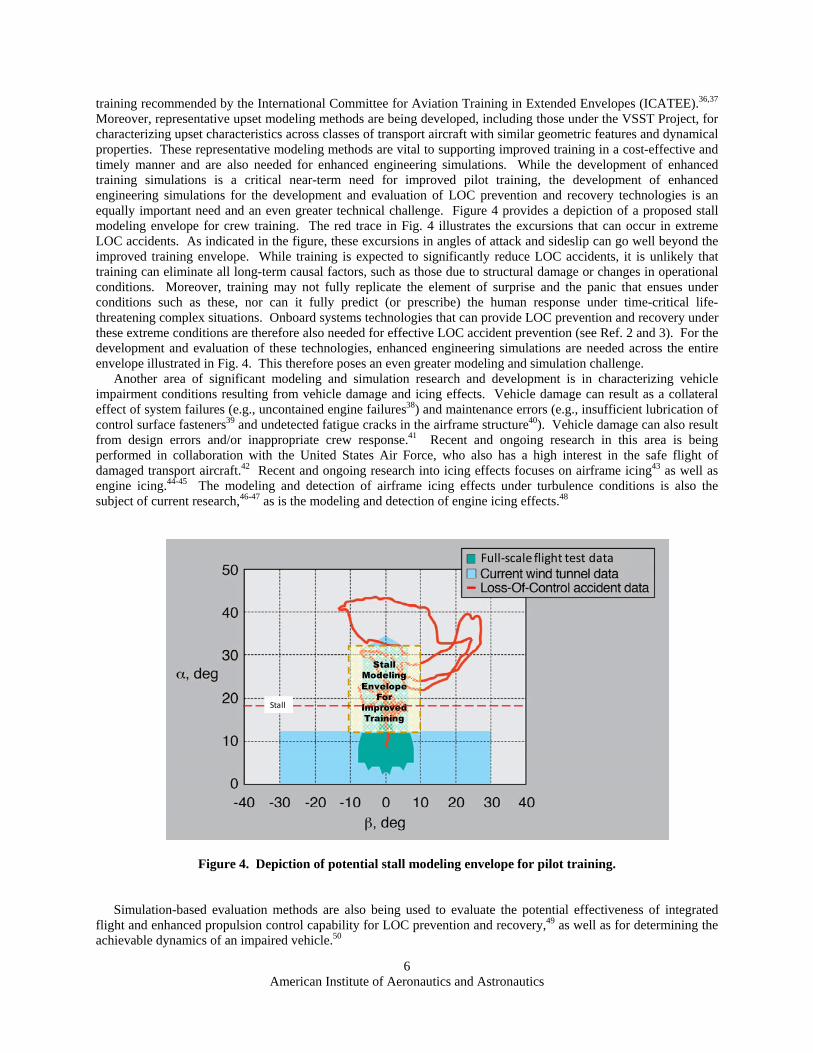
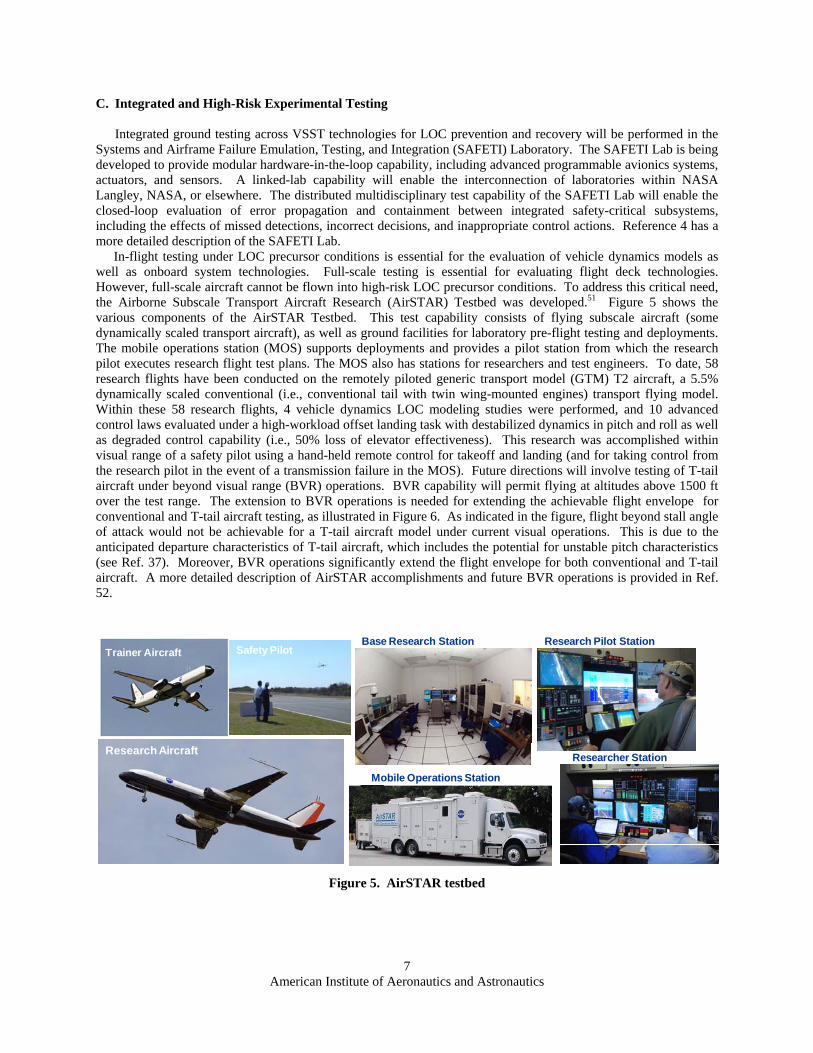
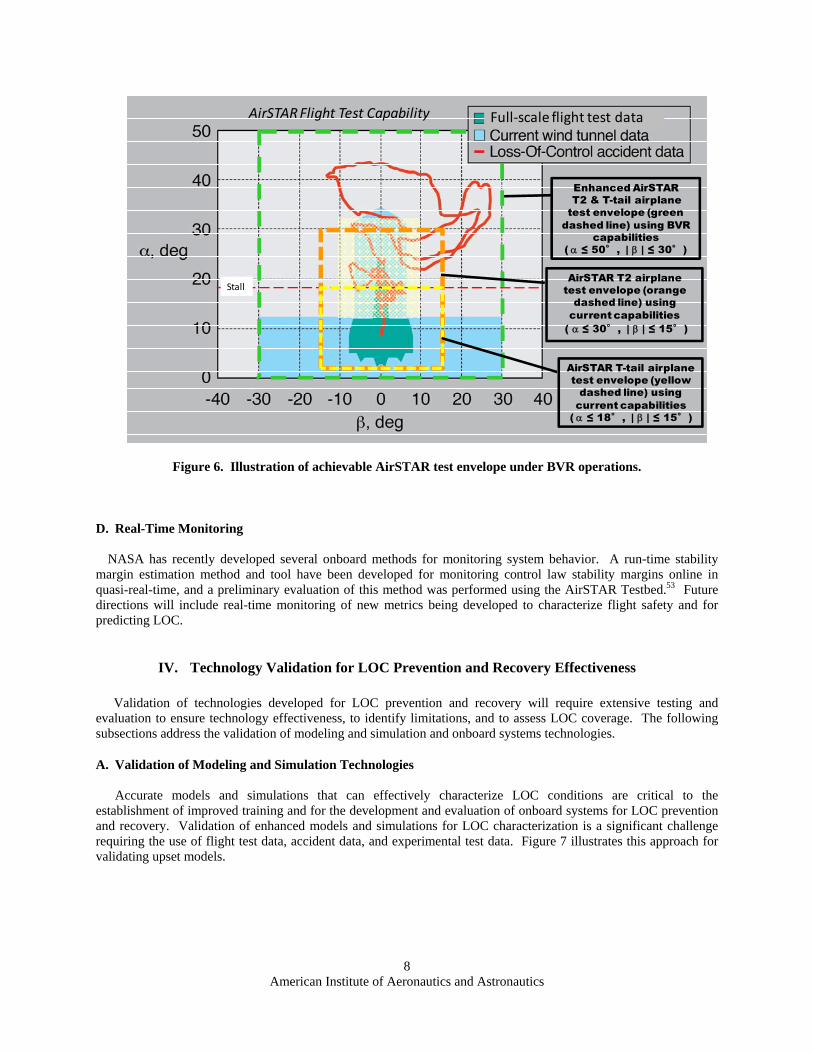
In-flight testing under LOC precursor conditions is essential for the evaluation of vehicle dynamics models as well as onboard system technologies. Full-scale testing is essential for evaluating flight deck technologies. However, full-scale aircraft cannot be flown into high-risk LOC precursor conditions. To address this critical need, the Airborne Subscale Transport Aircraft Research (AirSTAR) Testbed was developed.51 Figure 5 shows the various components of the AirSTAR Testbed. This test capability consists of flying subscale aircraft (some dynamically scaled transport aircraft), as well as ground facilities for laboratory pre-flight testing and deployments. The mobile operations station (MOS) supports deployments and provides a pilot station from which the research pilot executes research flight test plans. The MOS also has stations for researchers and test engineers. To date, 58 research flights have been conducted on the remotely piloted generic transport model (GTM) T2 aircraft, a 5.5% dynamically scaled conventional (i.e., conventional tail with twin wing-mounted engines) transport flying model. Within these 58 research flights, 4 vehicle dynamics LOC modeling studies were performed, and 10 advanced control laws evaluated under a high-workload offset landing task with destabilized dynamics in pitch and roll as well as degraded control capability (i.e., 50% loss of elevator effectiveness). This research was accomplished within visual range of a safety pilot using a hand-held remote control for takeoff and landing (and for taking control from the research pilot in the event of a transmission failure in the MOS). Future directions will involve testing of T-tail aircraft under beyond visual range (BVR) operations. BVR capability will permit flying at altitudes above 1500 ft over the test range. The extension to BVR operations is needed for extending the achievable flight envelope for conventional and T-tail aircraft testing, as illustrated in Figure 6. As indicated in the figure, flight beyond stall angle of attack would not be achievable for a T-tail aircraft model under current visual operations. This is due to the anticipated departure characteristics of T-tail aircraft, which includes the potential for unstable pitch characteristics (see Ref. 37). Moreover, BVR operations significantly extend the flight envelope for both conventional and T-tail aircraft. A more detailed description of AirSTAR accomplishments and future BVR operations is provided in Ref. 52.
Figure 5. AirSTAR testbed
Research Aircraft
Base Research Station
Mobile Operations Station
Research Pilot Station
Researcher Station
Trainer Aircraft Safety Pilot
American Institute of Aeronautics and Astronautics
8
Figure 6. Illustration of achievable AirSTAR test envelope under BVR operations.
D. Real-Time Monitoring
NASA has recently developed several onboard methods for monitoring system behavior. A run-time stability margin estimation method and tool have been developed for monitoring control law stability margins online in quasi-real-time, and a preliminary evaluation of this method was performed using the AirSTAR Testbed.53 Future directions will include real-time monitoring of new metrics being developed to characterize flight safety and for predicting LOC.
IV. Technology Validation for LOC Prevention and Recovery Effectiveness Validation of technologies developed for LOC prevention and recovery will require extensive testing and
evaluation to ensure technology effectiveness, to identify limitations, and to assess LOC coverage. The following subsections address the validation of modeling and simulation and onboard systems technologies.
A. Validation of Modeling and Simulation Technologies Accurate models and simulations that can effectively characterize LOC conditions are critical to the
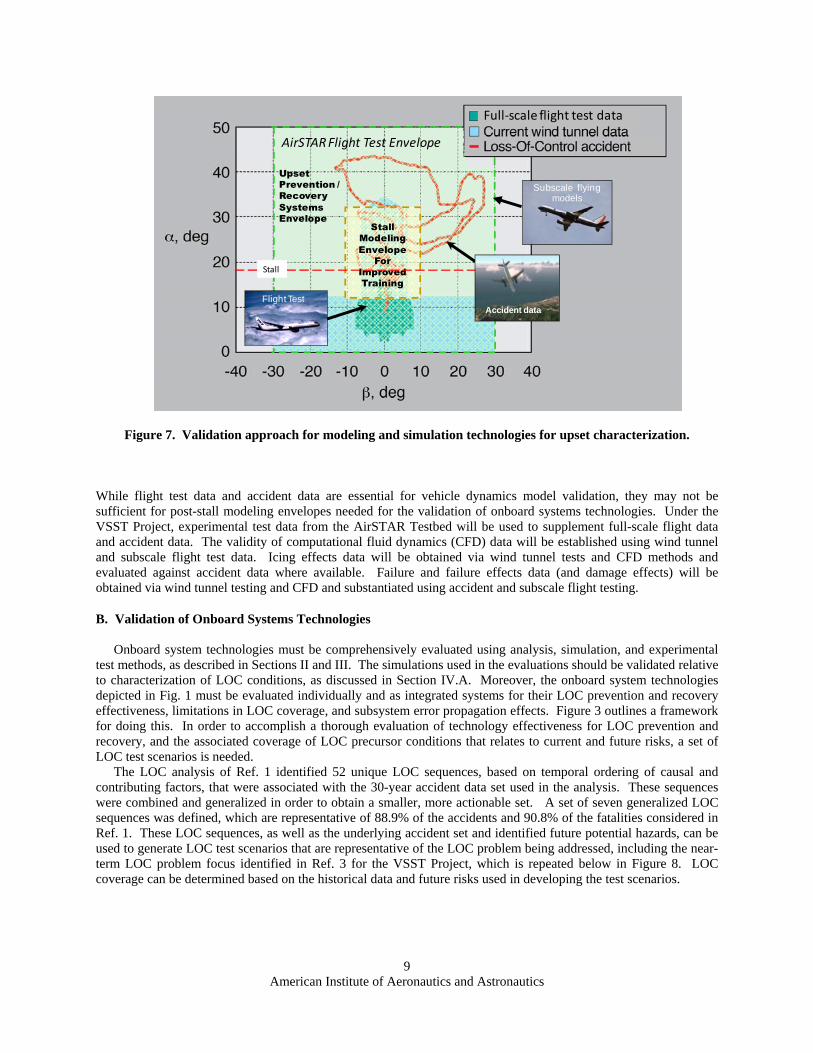
establishment of improved training and for the development and evaluation of onboard systems for LOC prevention and recovery. Validation of enhanced models and simulations for LOC characterization is a significant challenge requiring the use of flight test data, accident data, and experimental test data. Figure 7 illustrates this approach for validating upset models.
Stall
Full‐scale flight test data
Enhanced AirSTAR T2 & T-tail airplane
test envelope (green dashed line) using BVR
capabilities ( ≤ 50°, | | ≤ 30°)
AirSTARFlight Test Capability
AirSTAR T2 airplane test envelope (orange
dashed line) using current capabilities
( ≤ 30°, | | ≤ 15°)
AirSTAR T-tail airplane test envelope (yellow
dashed line) using current capabilities
( ≤ 18°, | | ≤ 15°)
American Institute of Aeronautics and Astronautics
9
Figure 7. Validation approach for modeling and simulation technologies for upset characterization.
While flight test data and accident data are essential for vehicle dynamics model validation, they may not be sufficient for post-stall modeling envelopes needed for the validation of onboard systems technologies. Under the VSST Project, experimental test data from the AirSTAR Testbed will be used to supplement full-scale flight data and accident data. The validity of computational fluid dynamics (CFD) data will be established using wind tunnel and subscale flight test data. Icing effects data will be obtained via wind tunnel tests and CFD methods and evaluated against accident data where available. Failure and failure effects data (and damage effects) will be obtained via wind tunnel testing and CFD and substantiated using accident and subscale flight testing.
B. Validation of Onboard Systems Technologies Onboard system technologies must be comprehensively evaluated using analysis, simulation, and experimental
test methods, as described in Sections II and III. The simulations used in the evaluations should be validated relative to characterization of LOC conditions, as discussed in Section IV.A. Moreover, the onboard system technologies depicted in Fig. 1 must be evaluated individually and as integrated systems for their LOC prevention and recovery effectiveness, limitations in LOC coverage, and subsystem error propagation effects. Figure 3 outlines a framework for doing this. In order to accomplish a thorough evaluation of technology effectiveness for LOC prevention and recovery, and the associated coverage of LOC precursor conditions that relates to current and future risks, a set of LOC test scenarios is needed.
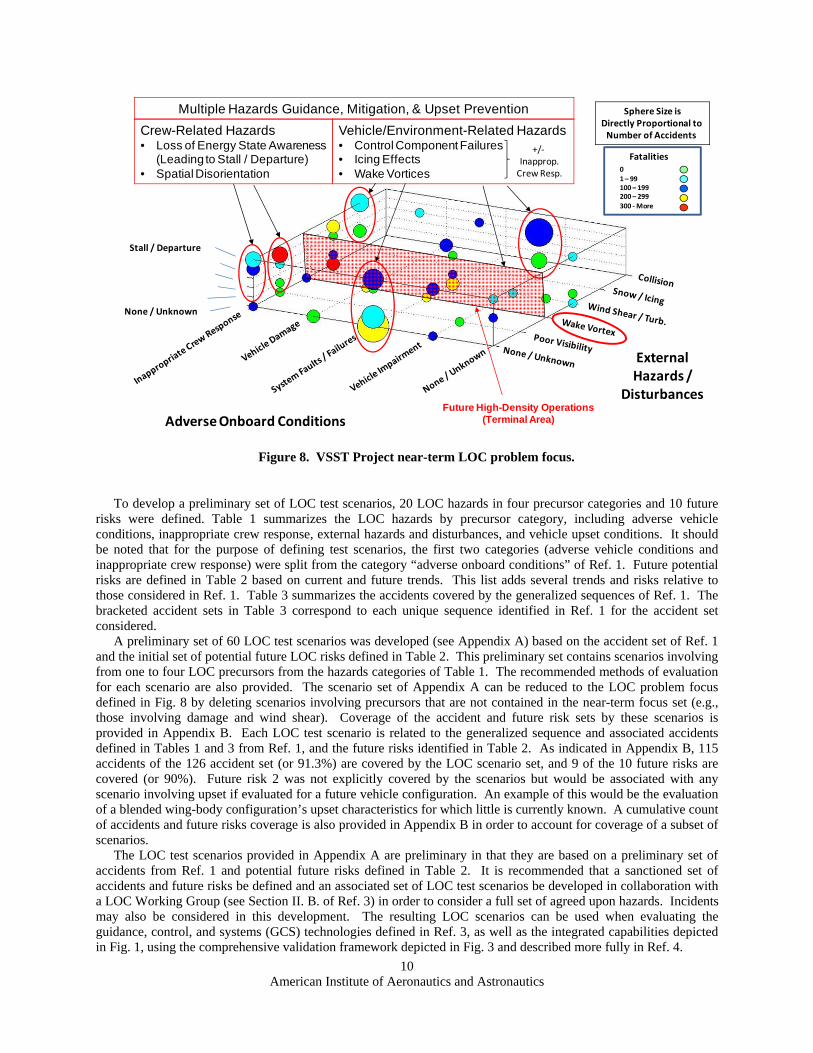
The LOC analysis of Ref. 1 identified 52 unique LOC sequences, based on temporal ordering of causal and contributing factors, that were associated with the 30-year accident data set used in the analysis. These sequences were combined and generalized in order to obtain a smaller, more actionable set. A set of seven generalized LOC sequences was defined, which are representative of 88.9% of the accidents and 90.8% of the fatalities considered in Ref. 1. These LOC sequences, as well as the underlying accident set and identified future potential hazards, can be used to generate LOC test scenarios that are representative of the LOC problem being addressed, including the near-term LOC problem focus identified in Ref. 3 for the VSST Project, which is repeated below in Figure 8. LOC coverage can be determined based on the historical data and future risks used in developing the test scenarios.
Upset Prevention /RecoverySystemsEnvelope
StallModelingEnvelope
For Improved Training
Full‐scale flight test data
AirSTARFlight Test Envelope
Subscale flying models
Flight Test
Stall
Accident data
American Institute of Aeronautics and Astronautics
10
Figure 8. VSST Project near-term LOC problem focus.
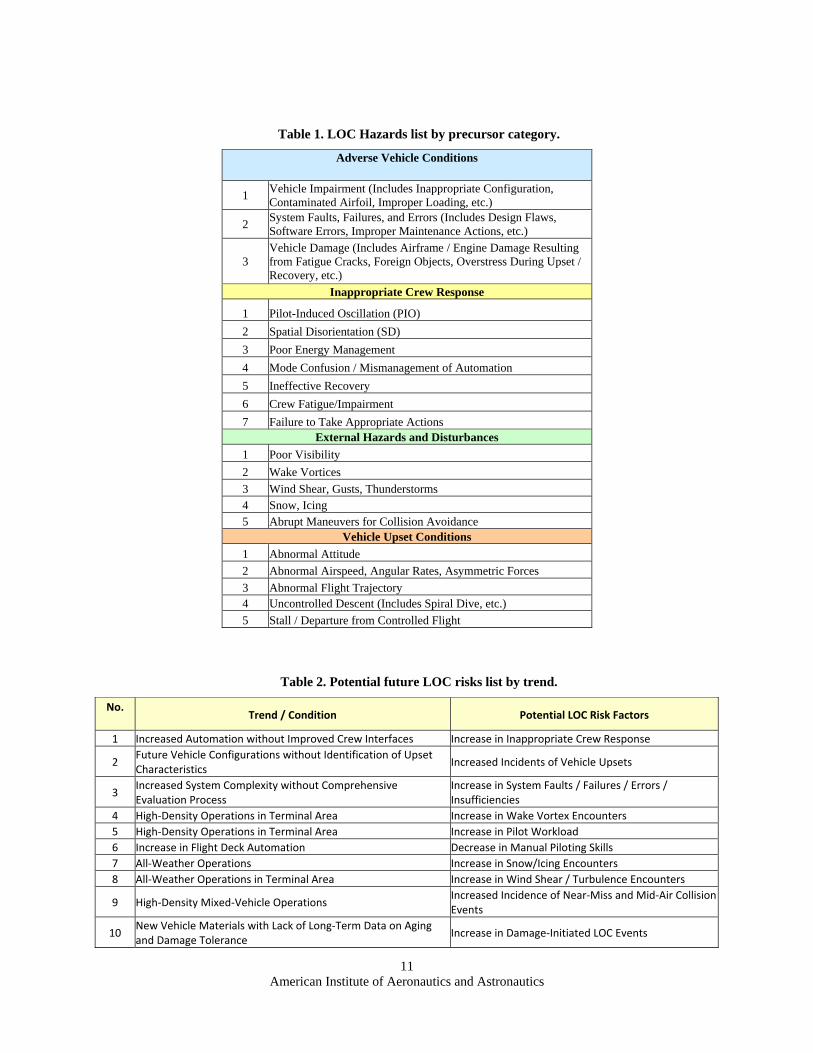
To develop a preliminary set of LOC test scenarios, 20 LOC hazards in four precursor categories and 10 future
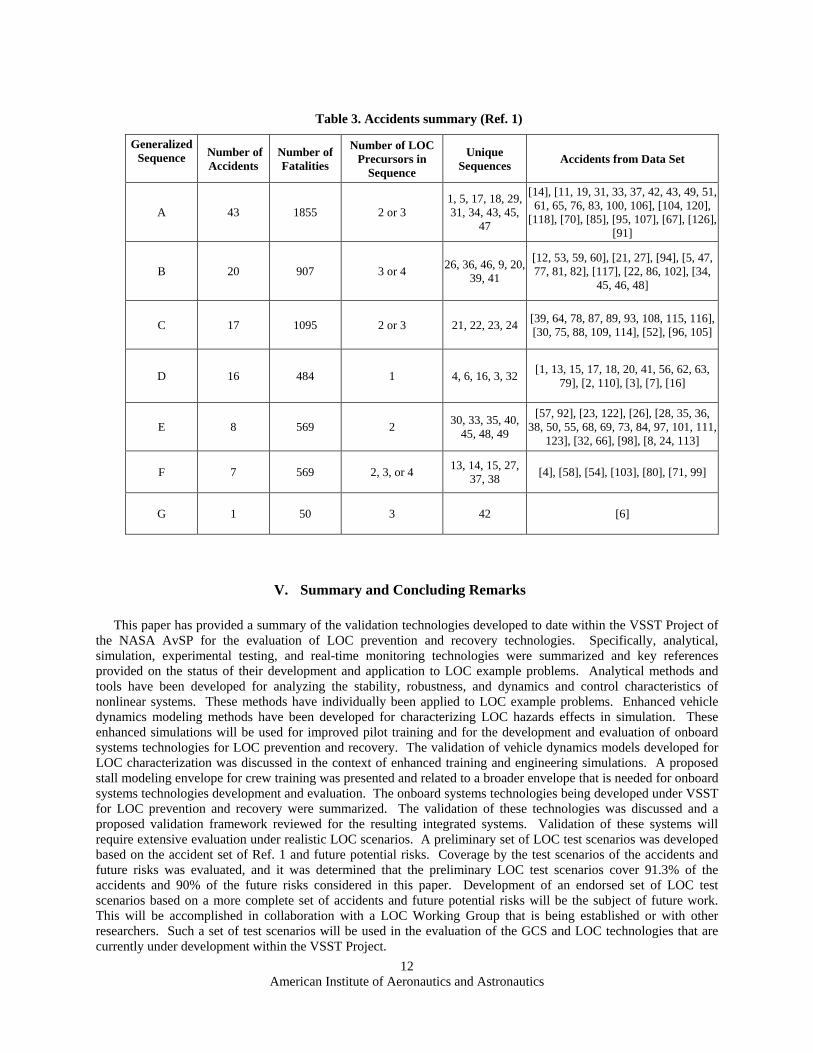
risks were defined. Table 1 summarizes the LOC hazards by precursor category, including adverse vehicle conditions, inappropriate crew response, external hazards and disturbances, and vehicle upset conditions. It should be noted that for the purpose of defining test scenarios, the first two categories (adverse vehicle conditions and inappropriate crew response) were split from the category “adverse onboard conditions” of Ref. 1. Future potential risks are defined in Table 2 based on current and future trends. This list adds several trends and risks relative to those considered in Ref. 1. Table 3 summarizes the accidents covered by the generalized sequences of Ref. 1. The bracketed accident sets in Table 3 correspond to each unique sequence identified in Ref. 1 for the accident set considered.
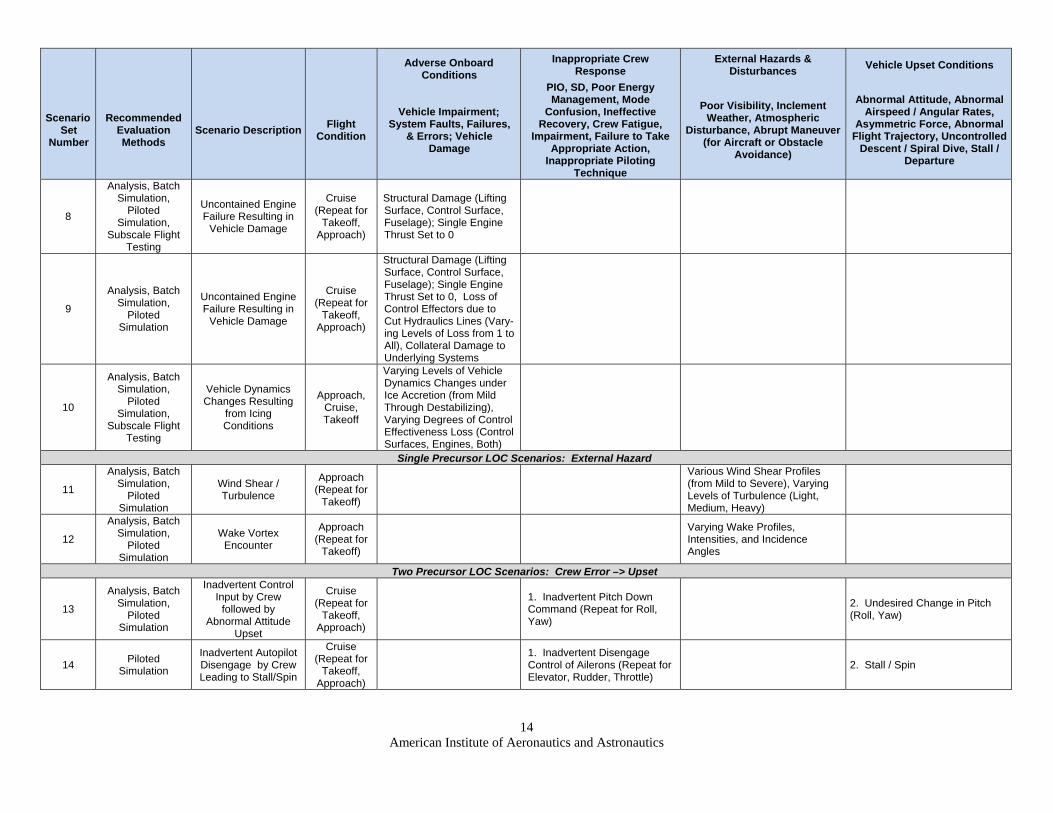
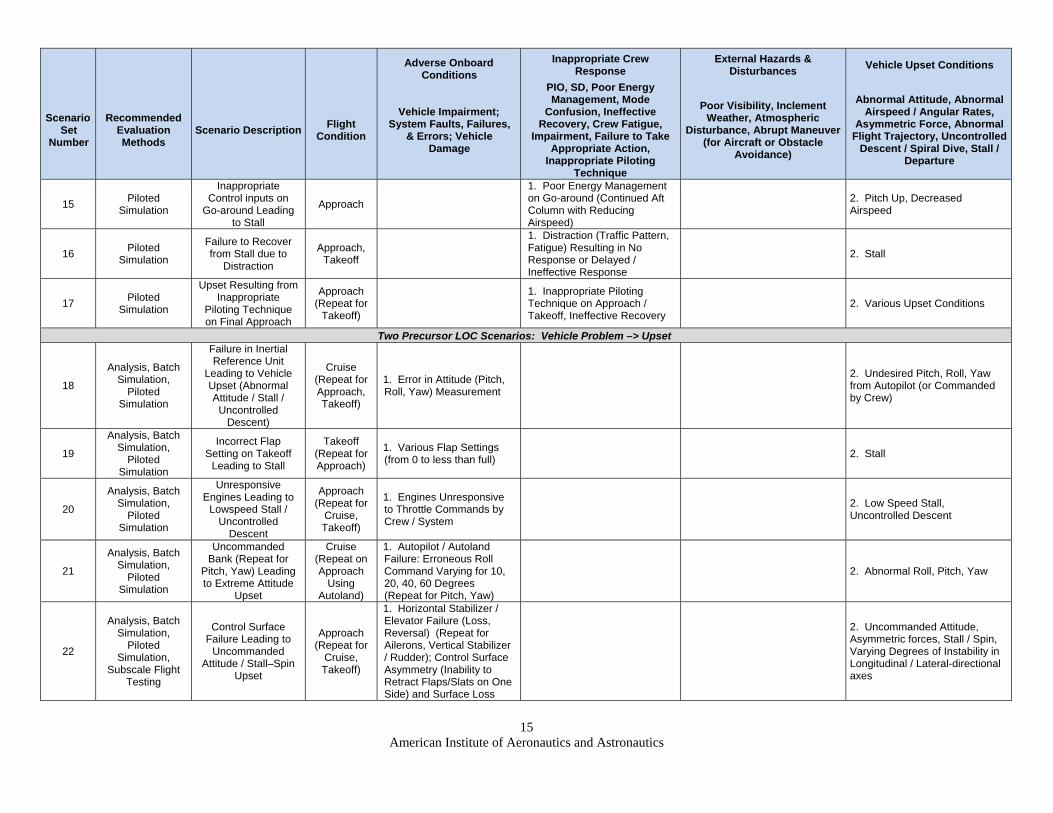
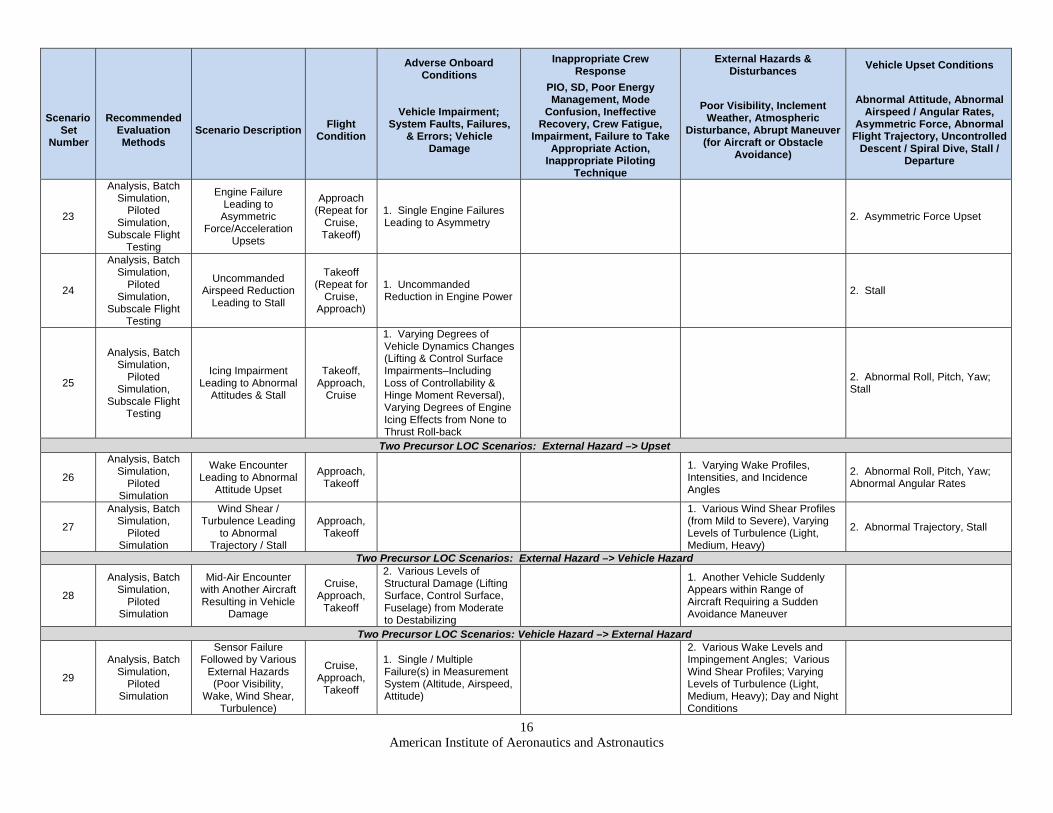
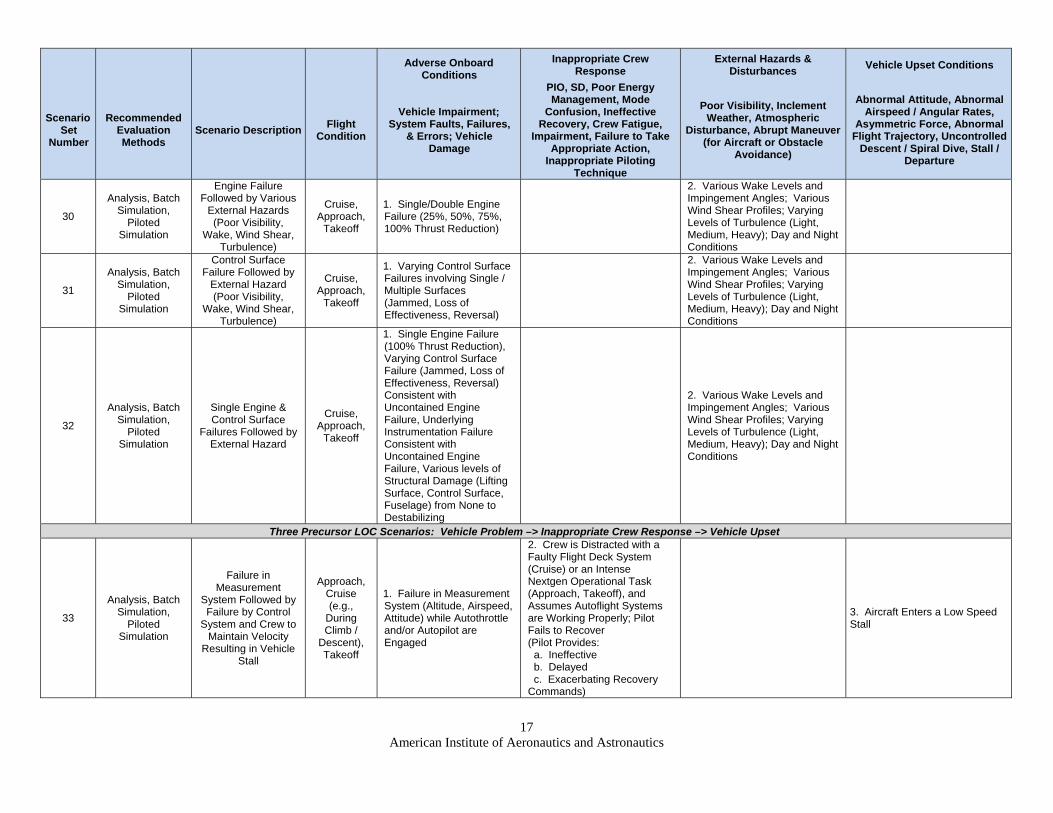
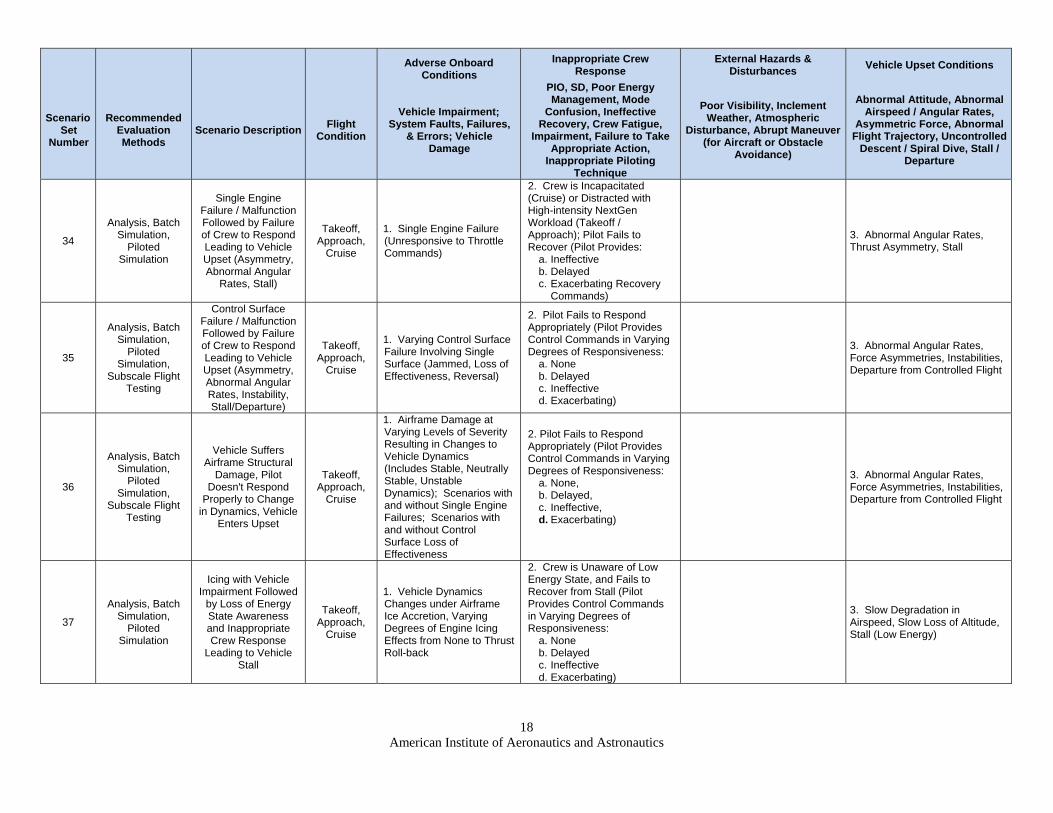
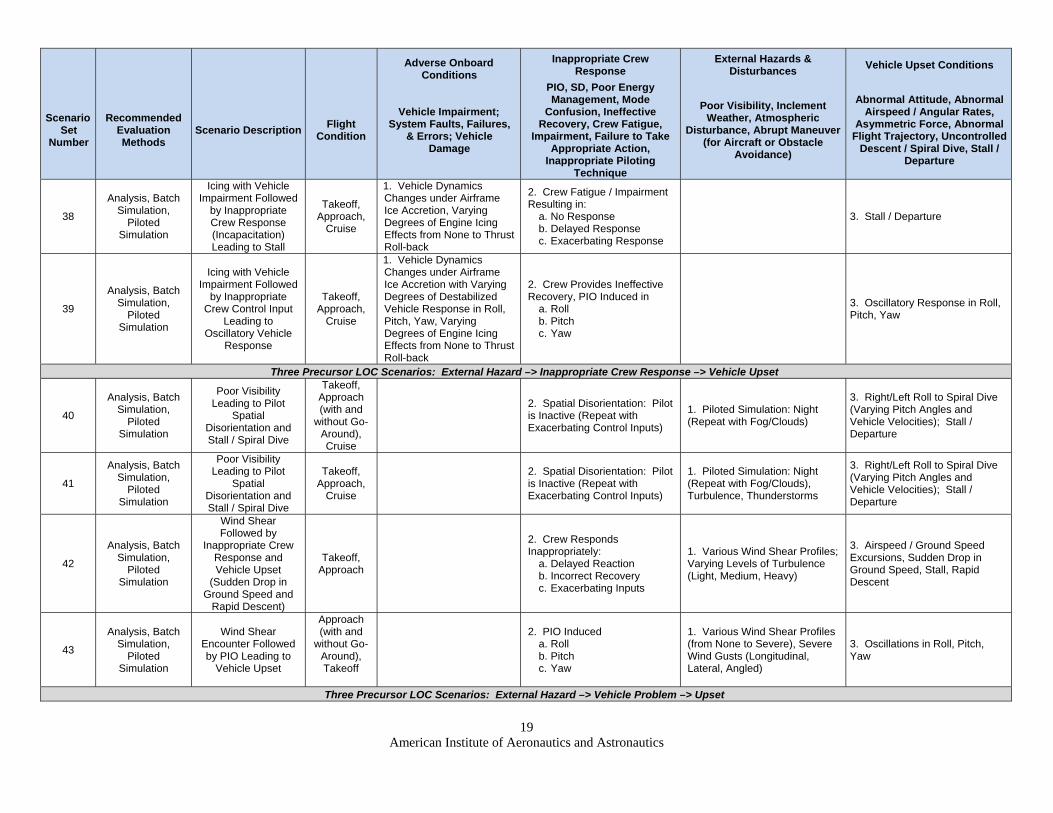
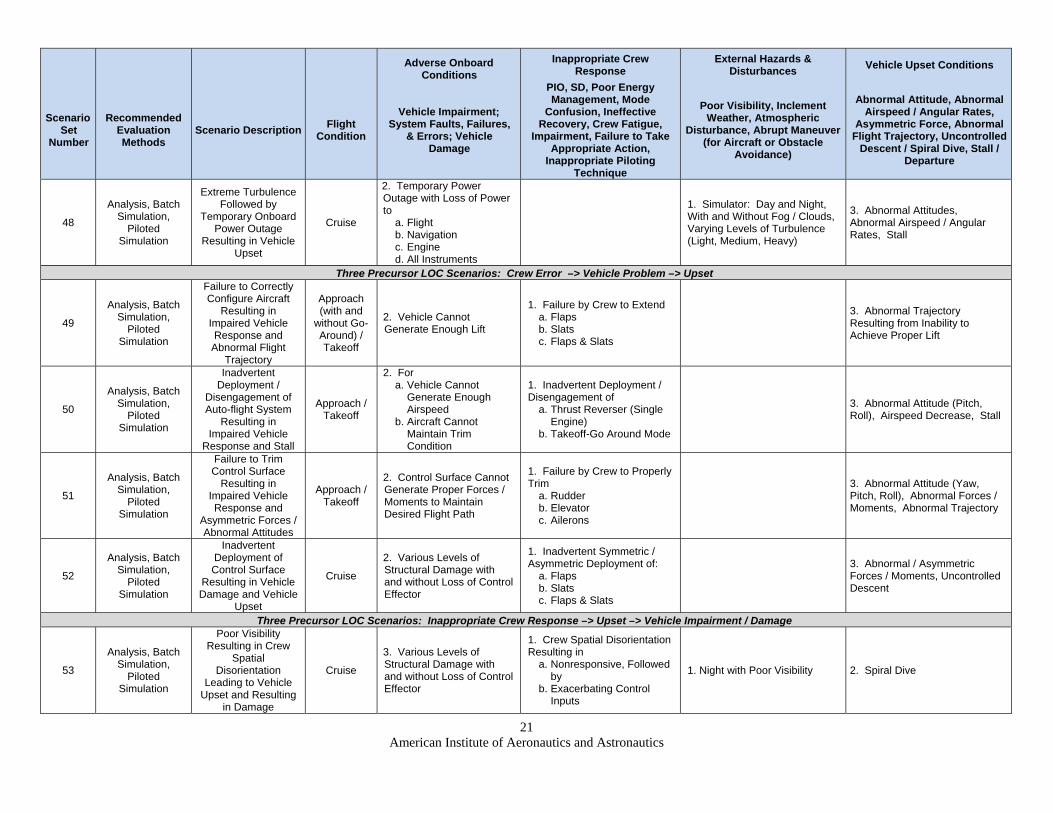
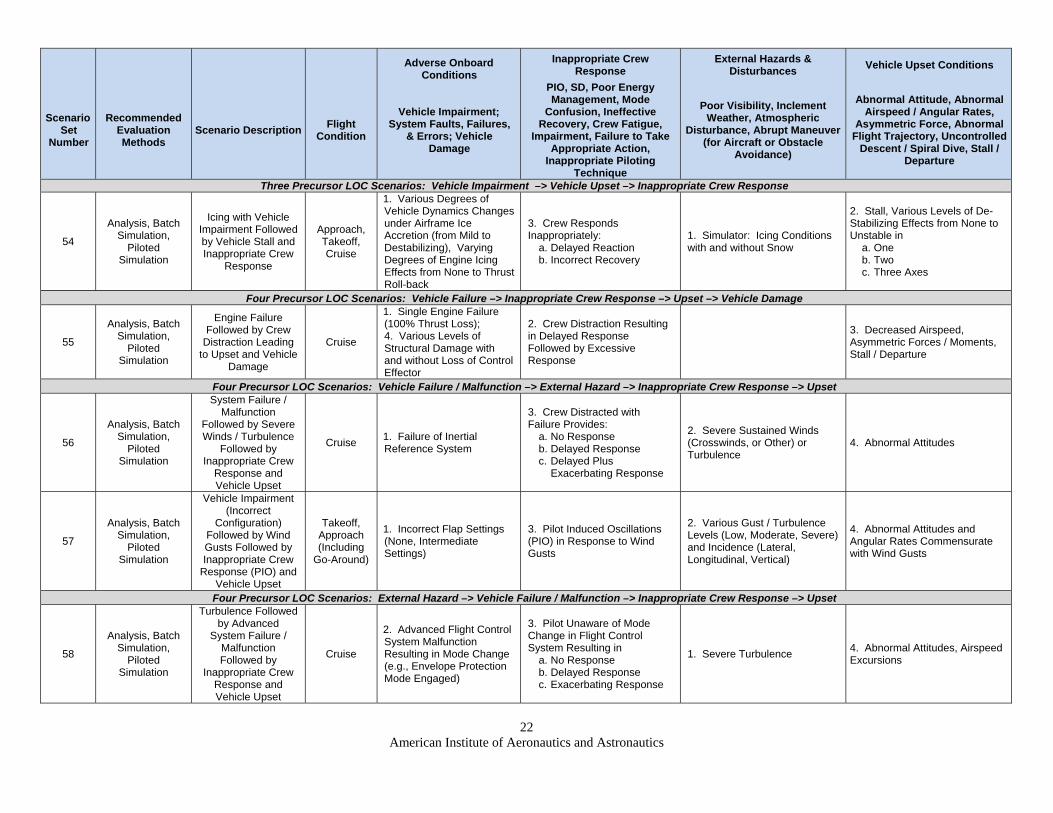
A preliminary set of 60 LOC test scenarios was developed (see Appendix A) based on the accident set of Ref. 1 and the initial set of potential future LOC risks defined in Table 2. This preliminary set contains scenarios involving from one to four LOC precursors from the hazards categories of Table 1. The recommended methods of evaluation for each scenario are also provided. The scenario set of Appendix A can be reduced to the LOC problem focus defined in Fig. 8 by deleting scenarios involving precursors that are not contained in the near-term focus set (e.g., those involving damage and wind shear). Coverage of the accident and future risk sets by these scenarios is provided in Appendix B. Each LOC test scenario is related to the generalized sequence and associated accidents defined in Tables 1 and 3 from Ref. 1, and the future risks identified in Table 2. As indicated in Appendix B, 115 accidents of the 126 accident set (or 91.3%) are covered by the LOC scenario set, and 9 of the 10 future risks are covered (or 90%). Future risk 2 was not explicitly covered by the scenarios but would be associated with any scenario involving upset if evaluated for a future vehicle configuration. An example of this would be the evaluation of a blended wing-body configuration’s upset characteristics for which little is currently known. A cumulative count of accidents and future risks coverage is also provided in Appendix B in order to account for coverage of a subset of scenarios.
The LOC test scenarios provided in Appendix A are preliminary in that they are based on a preliminary set of accidents from Ref. 1 and potential future risks defined in Table 2. It is recommended that a sanctioned set of accidents and future risks be defined and an associated set of LOC test scenarios be developed in collaboration with a LOC Working Group (see Section II. B. of Ref. 3) in order to consider a full set of agreed upon hazards. Incidents may also be considered in this development. The resulting LOC scenarios can be used when evaluating the guidance, control, and systems (GCS) technologies defined in Ref. 3, as well as the integrated capabilities depicted in Fig. 1, using the comprehensive validation framework depicted in Fig. 3 and described more fully in Ref. 4.
Fatalities0
1 – 99100 – 199200 – 299
300 ‐More
Sphere Size isDirectly Proportional to Number of Accidents
Adverse Onboard Conditions
External Hazards /
Disturbances
None / Unknown
Stall / Departure
Crew-Related Hazards• Loss of Energy State Awareness
(Leading to Stall / Departure)• Spatial Disorientation
Vehicle/Environment-Related Hazards• Control Component Failures• Icing Effects• Wake Vortices
Multiple Hazards Guidance, Mitigation, & Upset Prevention
Future High-Density Operations (Terminal Area)
+/‐Inapprop.Crew Resp.
American Institute of Aeronautics and Astronautics
11
Table 1. LOC Hazards list by precursor category.
Adverse Vehicle Conditions
1 Vehicle Impairment (Includes Inappropriate Configuration, Contaminated Airfoil, Improper Loading, etc.)
2 System Faults, Failures, and Errors (Includes Design Flaws, Software Errors, Improper Maintenance Actions, etc.)
3 Vehicle Damage (Includes Airframe / Engine Damage Resulting from Fatigue Cracks, Foreign Objects, Overstress During Upset / Recovery, etc.)
Inappropriate Crew Response
1 Pilot-Induced Oscillation (PIO)
2 Spatial Disorientation (SD)
3 Poor Energy Management
4 Mode Confusion / Mismanagement of Automation
5 Ineffective Recovery
6 Crew Fatigue/Impairment
7 Failure to Take Appropriate Actions External Hazards and Disturbances
1 Poor Visibility
2 Wake Vortices 3 Wind Shear, Gusts, Thunderstorms 4 Snow, Icing 5 Abrupt Maneuvers for Collision Avoidance
Vehicle Upset Conditions
1 Abnormal Attitude 2 Abnormal Airspeed, Angular Rates, Asymmetric Forces
3 Abnormal Flight Trajectory 4 Uncontrolled Descent (Includes Spiral Dive, etc.) 5 Stall / Departure from Controlled Flight
Table 2. Potential future LOC risks list by trend.
No. Trend / Condition Potential LOC Risk Factors 1 Increased Automation without Improved Crew Interfaces Increase in Inappropriate Crew Response
2 Future Vehicle Configurations without Identification of Upset Characteristics
Increased Incidents of Vehicle Upsets 3 Increased System Complexity without Comprehensive
Evaluation ProcessIncrease in System Faults / Failures / Errors / Insufficiencies
4 High‐Density Operations in Terminal Area Increase in Wake Vortex Encounters
5 High‐Density Operations in Terminal Area Increase in Pilot Workload
6 Increase in Flight Deck Automation Decrease in Manual Piloting Skills
7 All‐Weather Operations Increase in Snow/Icing Encounters
8 All‐Weather Operations in Terminal Area Increase in Wind Shear / Turbulence Encounters
9 High‐Density Mixed‐Vehicle Operations Increased Incidence of Near‐Miss and Mid‐Air Collision Events
10 New Vehicle Materials with Lack of Long‐Term Data on Aging and Damage Tolerance
Increase in Damage‐Initiated LOC Events
American Institute of Aeronautics and Astronautics
12
Table 3. Accidents summary (Ref. 1)
Generalized Sequence Number of
Accidents Number of Fatalities
Number of LOC Precursors in
Sequence
Unique Sequences Accidents from Data Set
A 43 1855 2 or 3 1, 5, 17, 18, 29, 31, 34, 43, 45,
47
[14], [11, 19, 31, 33, 37, 42, 43, 49, 51, 61, 65, 76, 83, 100, 106], [104, 120],
[118], [70], [85], [95, 107], [67], [126], [91]
B 20 907 3 or 4 26, 36, 46, 9, 20, 39, 41
[12, 53, 59, 60], [21, 27], [94], [5, 47, 77, 81, 82], [117], [22, 86, 102], [34,
45, 46, 48]
C 17 1095 2 or 3 21, 22, 23, 24[39, 64, 78, 87, 89, 93, 108, 115, 116], [30, 75, 88, 109, 114], [52], [96, 105]
D 16 484 1 4, 6, 16, 3, 32[1, 13, 15, 17, 18, 20, 41, 56, 62, 63,
79], [2, 110], [3], [7], [16]
E 8 569 2 30, 33, 35, 40, 45, 48, 49
[57, 92], [23, 122], [26], [28, 35, 36, 38, 50, 55, 68, 69, 73, 84, 97, 101, 111,
123], [32, 66], [98], [8, 24, 113]
F 7 569 2, 3, or 4 13, 14, 15, 27, 37, 38 [4], [58], [54], [103], [80], [71, 99]
G 1 50 3 42 [6]
V. Summary and Concluding Remarks
This paper has provided a summary of the validation technologies developed to date within the VSST Project of the NASA AvSP for the evaluation of LOC prevention and recovery technologies. Specifically, analytical, simulation, experimental testing, and real-time monitoring technologies were summarized and key references provided on the status of their development and application to LOC example problems. Analytical methods and tools have been developed for analyzing the stability, robustness, and dynamics and control characteristics of nonlinear systems. These methods have individually been applied to LOC example problems. Enhanced vehicle dynamics modeling methods have been developed for characterizing LOC hazards effects in simulation. These enhanced simulations will be used for improved pilot training and for the development and evaluation of onboard systems technologies for LOC prevention and recovery. The validation of vehicle dynamics models developed for LOC characterization was discussed in the context of enhanced training and engineering simulations. A proposed stall modeling envelope for crew training was presented and related to a broader envelope that is needed for onboard systems technologies development and evaluation. The onboard systems technologies being developed under VSST for LOC prevention and recovery were summarized. The validation of these technologies was discussed and a proposed validation framework reviewed for the resulting integrated systems. Validation of these systems will require extensive evaluation under realistic LOC scenarios. A preliminary set of LOC test scenarios was developed based on the accident set of Ref. 1 and future potential risks. Coverage by the test scenarios of the accidents and future risks was evaluated, and it was determined that the preliminary LOC test scenarios cover 91.3% of the accidents and 90% of the future risks considered in this paper. Development of an endorsed set of LOC test scenarios based on a more complete set of accidents and future potential risks will be the subject of future work. This will be accomplished in collaboration with a LOC Working Group that is being established or with other researchers. Such a set of test scenarios will be used in the evaluation of the GCS and LOC technologies that are currently under development within the VSST Project.

American Institute of Aeronautics and Astronautics
13
Appendix A: LOC Test Scenarios
Adverse Onboard Conditions
Inappropriate Crew Response
External Hazards & Disturbances
Vehicle Upset Conditions
Scenario Set
Number
Recommended Evaluation Methods
Scenario Description Flight
Condition
Vehicle Impairment; System Faults, Failures,
& Errors; Vehicle Damage
PIO, SD, Poor Energy Management, Mode
Confusion, Ineffective Recovery, Crew Fatigue,
Impairment, Failure to Take Appropriate Action,
Inappropriate Piloting Technique
Poor Visibility, Inclement Weather, Atmospheric
Disturbance, Abrupt Maneuver (for Aircraft or Obstacle
Avoidance)
Abnormal Attitude, Abnormal Airspeed / Angular Rates,
Asymmetric Force, Abnormal Flight Trajectory, Uncontrolled
Descent / Spiral Dive, Stall / Departure
Single Precursor LOC Scenarios: Vehicle Failure, Damage
1
Analysis, Batch Simulation,
Piloted Simulation,
Subscale Flight Testing
Flight Control Component Failure
(Control Surface Actuator)
Takeoff (Repeat for Approach,
Cruise)
Jammed Surface Actuator (Varying Positions from Neutral to Hard-over)
2
Analysis, Batch Simulation,
Piloted Simulation,
Subscale Flight Testing
Flight Control Component Failure
(Control Surface Actuator)
Takeoff (Repeat for Approach,
Cruise)
Loss of Control Effectiveness (25%, 50%, 75%, 100%)
3
Analysis, Batch Simulation,
Piloted Simulation,
Subscale Flight Testing
Flight Control Component Failure
(Engine)
Takeoff (Repeat for Approach,
Cruise)
Single Engine Failure (25%, 50%, 75%, 100% Thrust Reduction)
4
Analysis, Batch Simulation,
Piloted Simulation
Flight Control Component Failure
(Engine)
Takeoff (Repeat for Approach,
Cruise)
Double Engine Failure (25%, 50%, 75%, 100% Thrust Reduction)
5
Analysis, Batch Simulation,
Piloted Simulation
Flight Control Component Failure
(Actuator)
Landing (Repeat for
Takeoff, Cruise)
Control Effector Reversal
6
Analysis, Batch Simulation,
Piloted Simulation,
Subscale Flight Testing
Vehicle Impairment Resulting from Overweight /
Improper Loading
Cruise (Repeat for
Takeoff, Approach)
Variations in Weight & C.G. location
7
Analysis, Batch Simulation,
Piloted Simulation,
Subscale Flight Testing
Vehicle Dynamics Changes Resulting
from Damage Conditions
Cruise (Repeat for
Takeoff, Approach)
Fuselage Damage
American Institute of Aeronautics and Astronautics
14
Adverse Onboard Conditions
Inappropriate Crew Response
External Hazards & Disturbances
Vehicle Upset Conditions
Scenario Set
Number
Recommended Evaluation Methods
Scenario Description Flight
Condition
Vehicle Impairment; System Faults, Failures,
& Errors; Vehicle Damage
PIO, SD, Poor Energy Management, Mode
Confusion, Ineffective Recovery, Crew Fatigue,
Impairment, Failure to Take Appropriate Action,
Inappropriate Piloting Technique
Poor Visibility, Inclement Weather, Atmospheric
Disturbance, Abrupt Maneuver (for Aircraft or Obstacle
Avoidance)
Abnormal Attitude, Abnormal Airspeed / Angular Rates,
Asymmetric Force, Abnormal Flight Trajectory, Uncontrolled
Descent / Spiral Dive, Stall / Departure
8
Analysis, Batch Simulation,
Piloted Simulation,
Subscale Flight Testing
Uncontained Engine Failure Resulting in
Vehicle Damage
Cruise (Repeat for
Takeoff, Approach)
Structural Damage (Lifting Surface, Control Surface, Fuselage); Single Engine Thrust Set to 0
9
Analysis, Batch Simulation,
Piloted Simulation
Uncontained Engine Failure Resulting in
Vehicle Damage
Cruise (Repeat for
Takeoff, Approach)
Structural Damage (Lifting Surface, Control Surface, Fuselage); Single Engine Thrust Set to 0, Loss of Control Effectors due to Cut Hydraulics Lines (Vary-ing Levels of Loss from 1 to All), Collateral Damage to Underlying Systems
10
Analysis, Batch Simulation,
Piloted Simulation,
Subscale Flight Testing
Vehicle Dynamics Changes Resulting
from Icing Conditions
Approach, Cruise, Takeoff
Varying Levels of Vehicle Dynamics Changes under Ice Accretion (from Mild Through Destabilizing), Varying Degrees of Control Effectiveness Loss (Control Surfaces, Engines, Both)
Single Precursor LOC Scenarios: External Hazard
11
Analysis, Batch Simulation,
Piloted Simulation
Wind Shear / Turbulence
Approach (Repeat for
Takeoff)
Various Wind Shear Profiles (from Mild to Severe), Varying Levels of Turbulence (Light, Medium, Heavy)
12
Analysis, Batch Simulation,
Piloted Simulation
Wake Vortex Encounter
Approach (Repeat for
Takeoff)
Varying Wake Profiles, Intensities, and Incidence Angles
Two Precursor LOC Scenarios: Crew Error –> Upset
13
Analysis, Batch Simulation,
Piloted Simulation
Inadvertent Control Input by Crew
followed by Abnormal Attitude
Upset
Cruise (Repeat for
Takeoff, Approach)
1. Inadvertent Pitch Down Command (Repeat for Roll, Yaw)
2. Undesired Change in Pitch (Roll, Yaw)
14 Piloted
Simulation
Inadvertent Autopilot Disengage by Crew Leading to Stall/Spin
Cruise (Repeat for
Takeoff, Approach)
1. Inadvertent Disengage Control of Ailerons (Repeat for Elevator, Rudder, Throttle)
2. Stall / Spin
American Institute of Aeronautics and Astronautics
15
Adverse Onboard Conditions
Inappropriate Crew Response
External Hazards & Disturbances
Vehicle Upset Conditions
Scenario Set
Number
Recommended Evaluation Methods
Scenario Description Flight
Condition
Vehicle Impairment; System Faults, Failures,
& Errors; Vehicle Damage
PIO, SD, Poor Energy Management, Mode
Confusion, Ineffective Recovery, Crew Fatigue,
Impairment, Failure to Take Appropriate Action,
Inappropriate Piloting Technique
Poor Visibility, Inclement Weather, Atmospheric
Disturbance, Abrupt Maneuver (for Aircraft or Obstacle
Avoidance)
Abnormal Attitude, Abnormal Airspeed / Angular Rates,
Asymmetric Force, Abnormal Flight Trajectory, Uncontrolled
Descent / Spiral Dive, Stall / Departure
15 Piloted
Simulation
Inappropriate Control inputs on
Go-around Leading to Stall
Approach
1. Poor Energy Management on Go-around (Continued Aft Column with Reducing Airspeed)
2. Pitch Up, Decreased Airspeed
16 Piloted
Simulation
Failure to Recover from Stall due to
Distraction
Approach, Takeoff
1. Distraction (Traffic Pattern, Fatigue) Resulting in No Response or Delayed / Ineffective Response
2. Stall
17 Piloted
Simulation
Upset Resulting from Inappropriate
Piloting Technique on Final Approach
Approach (Repeat for
Takeoff)
1. Inappropriate Piloting Technique on Approach / Takeoff, Ineffective Recovery
2. Various Upset Conditions
Two Precursor LOC Scenarios: Vehicle Problem –> Upset
18
Analysis, Batch Simulation,
Piloted Simulation
Failure in Inertial Reference Unit
Leading to Vehicle Upset (Abnormal Attitude / Stall /
Uncontrolled Descent)
Cruise (Repeat for Approach, Takeoff)
1. Error in Attitude (Pitch, Roll, Yaw) Measurement
2. Undesired Pitch, Roll, Yaw from Autopilot (or Commanded by Crew)
19
Analysis, Batch Simulation,
Piloted Simulation
Incorrect Flap Setting on Takeoff
Leading to Stall
Takeoff (Repeat for Approach)
1. Various Flap Settings (from 0 to less than full)
2. Stall
20
Analysis, Batch Simulation,
Piloted Simulation
Unresponsive Engines Leading to
Lowspeed Stall / Uncontrolled
Descent
Approach (Repeat for
Cruise, Takeoff)
1. Engines Unresponsive to Throttle Commands by Crew / System
2. Low Speed Stall, Uncontrolled Descent
21
Analysis, Batch Simulation,
Piloted Simulation
Uncommanded Bank (Repeat for
Pitch, Yaw) Leading to Extreme Attitude
Upset
Cruise (Repeat on Approach
Using Autoland)
1. Autopilot / Autoland Failure: Erroneous Roll Command Varying for 10, 20, 40, 60 Degrees (Repeat for Pitch, Yaw)
2. Abnormal Roll, Pitch, Yaw
22
Analysis, Batch Simulation,
Piloted Simulation,
Subscale Flight Testing
Control Surface Failure Leading to
Uncommanded Attitude / Stall–Spin
Upset
Approach (Repeat for
Cruise, Takeoff)
1. Horizontal Stabilizer / Elevator Failure (Loss, Reversal) (Repeat for Ailerons, Vertical Stabilizer / Rudder); Control Surface Asymmetry (Inability to Retract Flaps/Slats on One Side) and Surface Loss
2. Uncommanded Attitude, Asymmetric forces, Stall / Spin, Varying Degrees of Instability in Longitudinal / Lateral-directional axes
American Institute of Aeronautics and Astronautics
16
Adverse Onboard Conditions
Inappropriate Crew Response
External Hazards & Disturbances
Vehicle Upset Conditions
Scenario Set
Number
Recommended Evaluation Methods
Scenario Description Flight
Condition
Vehicle Impairment; System Faults, Failures,
& Errors; Vehicle Damage
PIO, SD, Poor Energy Management, Mode
Confusion, Ineffective Recovery, Crew Fatigue,
Impairment, Failure to Take Appropriate Action,
Inappropriate Piloting Technique
Poor Visibility, Inclement Weather, Atmospheric
Disturbance, Abrupt Maneuver (for Aircraft or Obstacle
Avoidance)
Abnormal Attitude, Abnormal Airspeed / Angular Rates,
Asymmetric Force, Abnormal Flight Trajectory, Uncontrolled
Descent / Spiral Dive, Stall / Departure
23
Analysis, Batch Simulation,
Piloted Simulation,
Subscale Flight Testing
Engine Failure Leading to
Asymmetric Force/Acceleration
Upsets
Approach (Repeat for
Cruise, Takeoff)
1. Single Engine Failures Leading to Asymmetry
2. Asymmetric Force Upset
24
Analysis, Batch Simulation,
Piloted Simulation,
Subscale Flight Testing
Uncommanded Airspeed Reduction
Leading to Stall
Takeoff (Repeat for
Cruise, Approach)
1. Uncommanded Reduction in Engine Power
2. Stall
25
Analysis, Batch Simulation,
Piloted Simulation,
Subscale Flight Testing
Icing Impairment Leading to Abnormal
Attitudes & Stall
Takeoff, Approach,
Cruise
1. Varying Degrees of Vehicle Dynamics Changes (Lifting & Control Surface Impairments–Including Loss of Controllability & Hinge Moment Reversal), Varying Degrees of Engine Icing Effects from None to Thrust Roll-back
2. Abnormal Roll, Pitch, Yaw; Stall
Two Precursor LOC Scenarios: External Hazard –> Upset
26
Analysis, Batch Simulation,
Piloted Simulation
Wake Encounter Leading to Abnormal
Attitude Upset
Approach, Takeoff
1. Varying Wake Profiles, Intensities, and Incidence Angles
2. Abnormal Roll, Pitch, Yaw; Abnormal Angular Rates
27
Analysis, Batch Simulation,
Piloted Simulation
Wind Shear / Turbulence Leading
to Abnormal Trajectory / Stall
Approach, Takeoff
1. Various Wind Shear Profiles (from Mild to Severe), Varying Levels of Turbulence (Light, Medium, Heavy)
2. Abnormal Trajectory, Stall
Two Precursor LOC Scenarios: External Hazard –> Vehicle Hazard
28
Analysis, Batch Simulation,
Piloted Simulation
Mid-Air Encounter with Another Aircraft Resulting in Vehicle
Damage
Cruise, Approach,
Takeoff
2. Various Levels of Structural Damage (Lifting Surface, Control Surface, Fuselage) from Moderate to Destabilizing
1. Another Vehicle Suddenly Appears within Range of Aircraft Requiring a Sudden Avoidance Maneuver
Two Precursor LOC Scenarios: Vehicle Hazard –> External Hazard
29
Analysis, Batch Simulation,
Piloted Simulation
Sensor Failure Followed by Various
External Hazards (Poor Visibility,
Wake, Wind Shear, Turbulence)
Cruise, Approach,
Takeoff
1. Single / Multiple Failure(s) in Measurement System (Altitude, Airspeed, Attitude)
2. Various Wake Levels and Impingement Angles; Various Wind Shear Profiles; Varying Levels of Turbulence (Light, Medium, Heavy); Day and Night Conditions
American Institute of Aeronautics and Astronautics
17
Adverse Onboard Conditions
Inappropriate Crew Response
External Hazards & Disturbances
Vehicle Upset Conditions
Scenario Set
Number
Recommended Evaluation Methods
Scenario Description Flight
Condition
Vehicle Impairment; System Faults, Failures,
& Errors; Vehicle Damage
PIO, SD, Poor Energy Management, Mode
Confusion, Ineffective Recovery, Crew Fatigue,
Impairment, Failure to Take Appropriate Action,
Inappropriate Piloting Technique
Poor Visibility, Inclement Weather, Atmospheric
Disturbance, Abrupt Maneuver (for Aircraft or Obstacle
Avoidance)
Abnormal Attitude, Abnormal Airspeed / Angular Rates,
Asymmetric Force, Abnormal Flight Trajectory, Uncontrolled
Descent / Spiral Dive, Stall / Departure
30
Analysis, Batch Simulation,
Piloted Simulation
Engine Failure Followed by Various
External Hazards (Poor Visibility,
Wake, Wind Shear, Turbulence)
Cruise, Approach,
Takeoff
1. Single/Double Engine Failure (25%, 50%, 75%, 100% Thrust Reduction)
2. Various Wake Levels and Impingement Angles; Various Wind Shear Profiles; Varying Levels of Turbulence (Light, Medium, Heavy); Day and Night Conditions
31
Analysis, Batch Simulation,
Piloted Simulation
Control Surface Failure Followed by
External Hazard (Poor Visibility,
Wake, Wind Shear, Turbulence)
Cruise, Approach,
Takeoff
1. Varying Control Surface Failures involving Single / Multiple Surfaces (Jammed, Loss of Effectiveness, Reversal)
2. Various Wake Levels and Impingement Angles; Various Wind Shear Profiles; Varying Levels of Turbulence (Light, Medium, Heavy); Day and Night Conditions
32
Analysis, Batch Simulation,
Piloted Simulation
Single Engine & Control Surface
Failures Followed by External Hazard
Cruise, Approach,
Takeoff
1. Single Engine Failure (100% Thrust Reduction), Varying Control Surface Failure (Jammed, Loss of Effectiveness, Reversal) Consistent with Uncontained Engine Failure, Underlying Instrumentation Failure Consistent with Uncontained Engine Failure, Various levels of Structural Damage (Lifting Surface, Control Surface, Fuselage) from None to Destabilizing
2. Various Wake Levels and Impingement Angles; Various Wind Shear Profiles; Varying Levels of Turbulence (Light, Medium, Heavy); Day and Night Conditions
Three Precursor LOC Scenarios: Vehicle Problem –> Inappropriate Crew Response –> Vehicle Upset
33
Analysis, Batch Simulation,
Piloted Simulation
Failure in Measurement
System Followed by Failure by Control
System and Crew to Maintain Velocity
Resulting in Vehicle Stall
Approach, Cruise (e.g.,
During Climb /
Descent), Takeoff
1. Failure in Measurement System (Altitude, Airspeed, Attitude) while Autothrottle and/or Autopilot are Engaged
2. Crew is Distracted with a Faulty Flight Deck System (Cruise) or an Intense Nextgen Operational Task (Approach, Takeoff), and Assumes Autoflight Systems are Working Properly; Pilot Fails to Recover (Pilot Provides: a. Ineffective b. Delayed c. Exacerbating Recovery Commands)
3. Aircraft Enters a Low Speed Stall
American Institute of Aeronautics and Astronautics
18
Adverse Onboard Conditions
Inappropriate Crew Response
External Hazards & Disturbances
Vehicle Upset Conditions
Scenario Set
Number
Recommended Evaluation Methods
Scenario Description Flight
Condition
Vehicle Impairment; System Faults, Failures,
& Errors; Vehicle Damage
PIO, SD, Poor Energy Management, Mode
Confusion, Ineffective Recovery, Crew Fatigue,
Impairment, Failure to Take Appropriate Action,
Inappropriate Piloting Technique
Poor Visibility, Inclement Weather, Atmospheric
Disturbance, Abrupt Maneuver (for Aircraft or Obstacle
Avoidance)
Abnormal Attitude, Abnormal Airspeed / Angular Rates,
Asymmetric Force, Abnormal Flight Trajectory, Uncontrolled
Descent / Spiral Dive, Stall / Departure
34
Analysis, Batch Simulation,
Piloted Simulation
Single Engine Failure / Malfunction Followed by Failure of Crew to Respond Leading to Vehicle Upset (Asymmetry, Abnormal Angular
Rates, Stall)
Takeoff, Approach,
Cruise
1. Single Engine Failure (Unresponsive to Throttle Commands)
2. Crew is Incapacitated (Cruise) or Distracted with High-intensity NextGen Workload (Takeoff / Approach); Pilot Fails to Recover (Pilot Provides:
a. Ineffective b. Delayed c. Exacerbating Recovery
Commands)
3. Abnormal Angular Rates, Thrust Asymmetry, Stall
35
Analysis, Batch Simulation,
Piloted Simulation,
Subscale Flight Testing
Control Surface Failure / Malfunction Followed by Failure of Crew to Respond Leading to Vehicle Upset (Asymmetry, Abnormal Angular Rates, Instability, Stall/Departure)
Takeoff, Approach,
Cruise
1. Varying Control Surface Failure Involving Single Surface (Jammed, Loss of Effectiveness, Reversal)
2. Pilot Fails to Respond Appropriately (Pilot Provides Control Commands in Varying Degrees of Responsiveness:
a. None b. Delayed c. Ineffective d. Exacerbating)
3. Abnormal Angular Rates, Force Asymmetries, Instabilities, Departure from Controlled Flight
36
Analysis, Batch Simulation,
Piloted Simulation,
Subscale Flight Testing
Vehicle Suffers Airframe Structural
Damage, Pilot Doesn't Respond
Properly to Change in Dynamics, Vehicle
Enters Upset
Takeoff, Approach,
Cruise
1. Airframe Damage at Varying Levels of Severity Resulting in Changes to Vehicle Dynamics (Includes Stable, Neutrally Stable, Unstable Dynamics); Scenarios with and without Single Engine Failures; Scenarios with and without Control Surface Loss of Effectiveness
2. Pilot Fails to Respond Appropriately (Pilot Provides Control Commands in Varying Degrees of Responsiveness:
a. None, b. Delayed, c. Ineffective, d. Exacerbating)
3. Abnormal Angular Rates, Force Asymmetries, Instabilities, Departure from Controlled Flight
37
Analysis, Batch Simulation,
Piloted Simulation
Icing with Vehicle Impairment Followed
by Loss of Energy State Awareness and Inappropriate Crew Response
Leading to Vehicle Stall
Takeoff, Approach,
Cruise
1. Vehicle Dynamics Changes under Airframe Ice Accretion, Varying Degrees of Engine Icing Effects from None to Thrust Roll-back
2. Crew is Unaware of Low Energy State, and Fails to Recover from Stall (Pilot Provides Control Commands in Varying Degrees of Responsiveness:
a. None b. Delayed c. Ineffective d. Exacerbating)
3. Slow Degradation in Airspeed, Slow Loss of Altitude, Stall (Low Energy)
American Institute of Aeronautics and Astronautics
19
Adverse Onboard Conditions
Inappropriate Crew Response
External Hazards & Disturbances
Vehicle Upset Conditions
Scenario Set
Number
Recommended Evaluation Methods
Scenario Description Flight
Condition
Vehicle Impairment; System Faults, Failures,
& Errors; Vehicle Damage
PIO, SD, Poor Energy Management, Mode
Confusion, Ineffective Recovery, Crew Fatigue,
Impairment, Failure to Take Appropriate Action,
Inappropriate Piloting Technique
Poor Visibility, Inclement Weather, Atmospheric
Disturbance, Abrupt Maneuver (for Aircraft or Obstacle
Avoidance)
Abnormal Attitude, Abnormal Airspeed / Angular Rates,
Asymmetric Force, Abnormal Flight Trajectory, Uncontrolled
Descent / Spiral Dive, Stall / Departure
38
Analysis, Batch Simulation,
Piloted Simulation
Icing with Vehicle Impairment Followed
by Inappropriate Crew Response (Incapacitation) Leading to Stall
Takeoff, Approach,
Cruise
1. Vehicle Dynamics Changes under Airframe Ice Accretion, Varying Degrees of Engine Icing Effects from None to Thrust Roll-back
2. Crew Fatigue / Impairment Resulting in:
a. No Response b. Delayed Response c. Exacerbating Response
3. Stall / Departure
39
Analysis, Batch Simulation,
Piloted Simulation
Icing with Vehicle Impairment Followed
by Inappropriate Crew Control Input
Leading to Oscillatory Vehicle
Response
Takeoff, Approach,
Cruise
1. Vehicle Dynamics Changes under Airframe Ice Accretion with Varying Degrees of Destabilized Vehicle Response in Roll, Pitch, Yaw, Varying Degrees of Engine Icing Effects from None to Thrust Roll-back
2. Crew Provides Ineffective Recovery, PIO Induced in
a. Roll b. Pitch c. Yaw
3. Oscillatory Response in Roll, Pitch, Yaw
Three Precursor LOC Scenarios: External Hazard –> Inappropriate Crew Response –> Vehicle Upset
40
Analysis, Batch Simulation,
Piloted Simulation
Poor Visibility Leading to Pilot
Spatial Disorientation and Stall / Spiral Dive
Takeoff, Approach (with and
without Go-Around), Cruise
2. Spatial Disorientation: Pilot is Inactive (Repeat with Exacerbating Control Inputs)
1. Piloted Simulation: Night (Repeat with Fog/Clouds)
3. Right/Left Roll to Spiral Dive (Varying Pitch Angles and Vehicle Velocities); Stall / Departure
41
Analysis, Batch Simulation,
Piloted Simulation
Poor Visibility Leading to Pilot
Spatial Disorientation and Stall / Spiral Dive
Takeoff, Approach,
Cruise
2. Spatial Disorientation: Pilot is Inactive (Repeat with Exacerbating Control Inputs)
1. Piloted Simulation: Night (Repeat with Fog/Clouds), Turbulence, Thunderstorms
3. Right/Left Roll to Spiral Dive (Varying Pitch Angles and Vehicle Velocities); Stall / Departure
42
Analysis, Batch Simulation,
Piloted Simulation
Wind Shear Followed by
Inappropriate Crew Response and Vehicle Upset
(Sudden Drop in Ground Speed and
Rapid Descent)
Takeoff, Approach
2. Crew Responds Inappropriately:
a. Delayed Reaction b. Incorrect Recovery c. Exacerbating Inputs
1. Various Wind Shear Profiles; Varying Levels of Turbulence (Light, Medium, Heavy)
3. Airspeed / Ground Speed Excursions, Sudden Drop in Ground Speed, Stall, Rapid Descent
43
Analysis, Batch Simulation,
Piloted Simulation
Wind Shear Encounter Followed by PIO Leading to
Vehicle Upset
Approach (with and
without Go-Around), Takeoff
2. PIO Induced a. Roll b. Pitch c. Yaw
1. Various Wind Shear Profiles (from None to Severe), Severe Wind Gusts (Longitudinal, Lateral, Angled)
3. Oscillations in Roll, Pitch, Yaw
Three Precursor LOC Scenarios: External Hazard –> Vehicle Problem –> Upset

American Institute of Aeronautics and Astronautics
20
Adverse Onboard Conditions
Inappropriate Crew Response
External Hazards & Disturbances
Vehicle Upset Conditions
Scenario Set
Number
Recommended Evaluation Methods
Scenario Description Flight
Condition
Vehicle Impairment; System Faults, Failures,
& Errors; Vehicle Damage
PIO, SD, Poor Energy Management, Mode
Confusion, Ineffective Recovery, Crew Fatigue,
Impairment, Failure to Take Appropriate Action,
Inappropriate Piloting Technique
Poor Visibility, Inclement Weather, Atmospheric
Disturbance, Abrupt Maneuver (for Aircraft or Obstacle
Avoidance)
Abnormal Attitude, Abnormal Airspeed / Angular Rates,
Asymmetric Force, Abnormal Flight Trajectory, Uncontrolled
Descent / Spiral Dive, Stall / Departure
Three Precursor LOC Scenarios: External Hazard –> Vehicle Problem –> Upset
44
Analysis, Batch Simulation,
Piloted Simulation,
Subscale Flight Testing
Icing with Vehicle Impairment Followed
by Failure of Airspeed Sensor
(Blocked Pilot Tube) Leading to Vehicle
Stall
Approach, Takeoff, Cruise
1. Vehicle Dynamics Changes under Airframe Ice Accretion, Varying Degrees of Engine Icing Effects from None to Thrust Roll-back; 2. Erratic Airspeed Measurements
1. Simulator: Day and Night, with and without Fog / Clouds, Icing Conditions with and without Snow
3. Stall, Various Levels of Destabilizing Effects from None to Unstable in
a. One b. Two c. Three Axes
45
Analysis, Batch Simulation,
Piloted Simulation,
Subscale Flight Testing
Icing with Vehicle Impairment Followed by Control Surface Failure Leading to
Vehicle Stall
Approach, Takeoff, Cruise
1. Vehicle Dynamics Changes under Airframe Ice Accretion, Varying Degrees of Engine Icing Effects from None to Thrust Roll-back; 2. Horizontal Stabilizer / Elevator Failure (Loss, Reversal) (Repeat for Ailerons, Vertical Stabilizer / Rudder); Control Surface Asymmetry (Inability to Retract Flaps/Slats on One Side) and Surface Loss
1. Simulator: Day and Night, With and Without Fog / Clouds, Icing Conditions with and without Snow
3. Asymmetric Forces, Stall, Various Levels of Destabilizing Effects from None to Unstable in
a. One b. Two c. Three Axes
46
Analysis, Batch Simulation,
Piloted Simulation
Icing with Vehicle Impairment Followed by All Engine Flame-
Out Leading to Vehicle Stall
Cruise
1. Various Degrees of Vehicle Dynamics Changes under Airframe Ice Accretion (from None to Destabilizing); 2. Engine Flame-out Effects on All Engines (Thrust Set to Zero)
1. Simulator: Day and Night, With and Without Fog / Clouds, Icing Conditions with and without Snow
3. Decreasing Airspeed, Stall, Various Levels of Destabilizing Effects from None to Unstable in
a. One b. Two c. Three Axes
47
Analysis, Batch Simulation,
Piloted Simulation
Wind Shear Encounter Followed by Control System Failure Leading to
Stall
Approach (with and
without Go-Around), Takeoff
2. Failure in a. Autopilot b. Autothrottle c. Control Surface
Actuators (Jammed, Reversal);
Scenarios with and without Single Engine Failures
1. Simulator: Day and Night, With and Without Fog / Clouds, Various Wind Shear Profiles (with and without Rain / Thunderstorm Activity), Varying Levels of Turbulence (Light, Medium, Heavy)
3. Attitude Excursions a. Roll b. Pitch c. Yaw;
Airspeed Variations: a. Decreasing b. Increasing;
Asymmetric Forces under Jammed Surface Failures; Stall
American Institute of Aeronautics and Astronautics
21
Adverse Onboard Conditions
Inappropriate Crew Response
External Hazards & Disturbances
Vehicle Upset Conditions
Scenario Set
Number
Recommended Evaluation Methods
Scenario Description Flight
Condition
Vehicle Impairment; System Faults, Failures,
& Errors; Vehicle Damage
PIO, SD, Poor Energy Management, Mode
Confusion, Ineffective Recovery, Crew Fatigue,
Impairment, Failure to Take Appropriate Action,
Inappropriate Piloting Technique
Poor Visibility, Inclement Weather, Atmospheric
Disturbance, Abrupt Maneuver (for Aircraft or Obstacle
Avoidance)
Abnormal Attitude, Abnormal Airspeed / Angular Rates,
Asymmetric Force, Abnormal Flight Trajectory, Uncontrolled
Descent / Spiral Dive, Stall / Departure
48
Analysis, Batch Simulation,
Piloted Simulation
Extreme Turbulence Followed by
Temporary Onboard Power Outage
Resulting in Vehicle Upset
Cruise
2. Temporary Power Outage with Loss of Power to
a. Flight b. Navigation c. Engine d. All Instruments
1. Simulator: Day and Night, With and Without Fog / Clouds, Varying Levels of Turbulence (Light, Medium, Heavy)
3. Abnormal Attitudes, Abnormal Airspeed / Angular Rates, Stall
Three Precursor LOC Scenarios: Crew Error –> Vehicle Problem –> Upset
49
Analysis, Batch Simulation,
Piloted Simulation
Failure to Correctly Configure Aircraft
Resulting in Impaired Vehicle Response and
Abnormal Flight Trajectory
Approach (with and
without Go-Around) / Takeoff
2. Vehicle Cannot Generate Enough Lift
1. Failure by Crew to Extend a. Flaps b. Slats c. Flaps & Slats
3. Abnormal Trajectory Resulting from Inability to Achieve Proper Lift
50
Analysis, Batch Simulation,
Piloted Simulation
Inadvertent Deployment /
Disengagement of Auto-flight System
Resulting in Impaired Vehicle
Response and Stall
Approach / Takeoff
2. For a. Vehicle Cannot
Generate Enough Airspeed
b. Aircraft Cannot Maintain Trim Condition
1. Inadvertent Deployment / Disengagement of
a. Thrust Reverser (Single Engine)
b. Takeoff-Go Around Mode
3. Abnormal Attitude (Pitch, Roll), Airspeed Decrease, Stall
51
Analysis, Batch Simulation,
Piloted Simulation
Failure to Trim Control Surface
Resulting in Impaired Vehicle Response and
Asymmetric Forces / Abnormal Attitudes
Approach / Takeoff
2. Control Surface Cannot Generate Proper Forces / Moments to Maintain Desired Flight Path
1. Failure by Crew to Properly Trim
a. Rudder b. Elevator c. Ailerons
3. Abnormal Attitude (Yaw, Pitch, Roll), Abnormal Forces / Moments, Abnormal Trajectory
52
Analysis, Batch Simulation,
Piloted Simulation
Inadvertent Deployment of Control Surface
Resulting in Vehicle Damage and Vehicle
Upset
Cruise
2. Various Levels of Structural Damage with and without Loss of Control Effector
1. Inadvertent Symmetric / Asymmetric Deployment of:
a. Flaps b. Slats c. Flaps & Slats
3. Abnormal / Asymmetric Forces / Moments, Uncontrolled Descent
Three Precursor LOC Scenarios: Inappropriate Crew Response –> Upset –> Vehicle Impairment / Damage
53
Analysis, Batch Simulation,
Piloted Simulation
Poor Visibility Resulting in Crew
Spatial Disorientation
Leading to Vehicle Upset and Resulting
in Damage
Cruise
3. Various Levels of Structural Damage with and without Loss of Control Effector
1. Crew Spatial Disorientation Resulting in
a. Nonresponsive, Followed by
b. Exacerbating Control Inputs
1. Night with Poor Visibility 2. Spiral Dive
American Institute of Aeronautics and Astronautics
22
Adverse Onboard Conditions
Inappropriate Crew Response
External Hazards & Disturbances
Vehicle Upset Conditions
Scenario Set
Number
Recommended Evaluation Methods
Scenario Description Flight
Condition
Vehicle Impairment; System Faults, Failures,
& Errors; Vehicle Damage
PIO, SD, Poor Energy Management, Mode
Confusion, Ineffective Recovery, Crew Fatigue,
Impairment, Failure to Take Appropriate Action,
Inappropriate Piloting Technique
Poor Visibility, Inclement Weather, Atmospheric
Disturbance, Abrupt Maneuver (for Aircraft or Obstacle
Avoidance)
Abnormal Attitude, Abnormal Airspeed / Angular Rates,
Asymmetric Force, Abnormal Flight Trajectory, Uncontrolled
Descent / Spiral Dive, Stall / Departure
Three Precursor LOC Scenarios: Vehicle Impairment –> Vehicle Upset –> Inappropriate Crew Response
54
Analysis, Batch Simulation,
Piloted Simulation
Icing with Vehicle Impairment Followed by Vehicle Stall and Inappropriate Crew
Response
Approach, Takeoff, Cruise
1. Various Degrees of Vehicle Dynamics Changes under Airframe Ice Accretion (from Mild to Destabilizing), Varying Degrees of Engine Icing Effects from None to Thrust Roll-back
3. Crew Responds Inappropriately:
a. Delayed Reaction b. Incorrect Recovery
1. Simulator: Icing Conditions with and without Snow
2. Stall, Various Levels of De-Stabilizing Effects from None to Unstable in
a. One b. Two c. Three Axes
Four Precursor LOC Scenarios: Vehicle Failure –> Inappropriate Crew Response –> Upset –> Vehicle Damage
55
Analysis, Batch Simulation,
Piloted Simulation
Engine Failure Followed by Crew
Distraction Leading to Upset and Vehicle
Damage
Cruise
1. Single Engine Failure (100% Thrust Loss); 4. Various Levels of Structural Damage with and without Loss of Control Effector
2. Crew Distraction Resulting in Delayed Response Followed by Excessive Response
3. Decreased Airspeed, Asymmetric Forces / Moments, Stall / Departure
Four Precursor LOC Scenarios: Vehicle Failure / Malfunction –> External Hazard –> Inappropriate Crew Response –> Upset
56
Analysis, Batch Simulation,
Piloted Simulation
System Failure / Malfunction
Followed by Severe Winds / Turbulence
Followed by Inappropriate Crew
Response and Vehicle Upset
Cruise 1. Failure of Inertial Reference System
3. Crew Distracted with Failure Provides:
a. No Response b. Delayed Response c. Delayed Plus
Exacerbating Response
2. Severe Sustained Winds (Crosswinds, or Other) or Turbulence
4. Abnormal Attitudes
57
Analysis, Batch Simulation,
Piloted Simulation
Vehicle Impairment (Incorrect
Configuration) Followed by Wind Gusts Followed by Inappropriate Crew
Response (PIO) and Vehicle Upset
Takeoff, Approach (Including
Go-Around)
1. Incorrect Flap Settings (None, Intermediate Settings)
3. Pilot Induced Oscillations (PIO) in Response to Wind Gusts
2. Various Gust / Turbulence Levels (Low, Moderate, Severe) and Incidence (Lateral, Longitudinal, Vertical)
4. Abnormal Attitudes and Angular Rates Commensurate with Wind Gusts
Four Precursor LOC Scenarios: External Hazard –> Vehicle Failure / Malfunction –> Inappropriate Crew Response –> Upset
58
Analysis, Batch Simulation,
Piloted Simulation
Turbulence Followed by Advanced
System Failure / Malfunction Followed by
Inappropriate Crew Response and Vehicle Upset
Cruise
2. Advanced Flight Control System Malfunction Resulting in Mode Change (e.g., Envelope Protection Mode Engaged)
3. Pilot Unaware of Mode Change in Flight Control System Resulting in
a. No Response b. Delayed Response c. Exacerbating Response
1. Severe Turbulence 4. Abnormal Attitudes, Airspeed Excursions
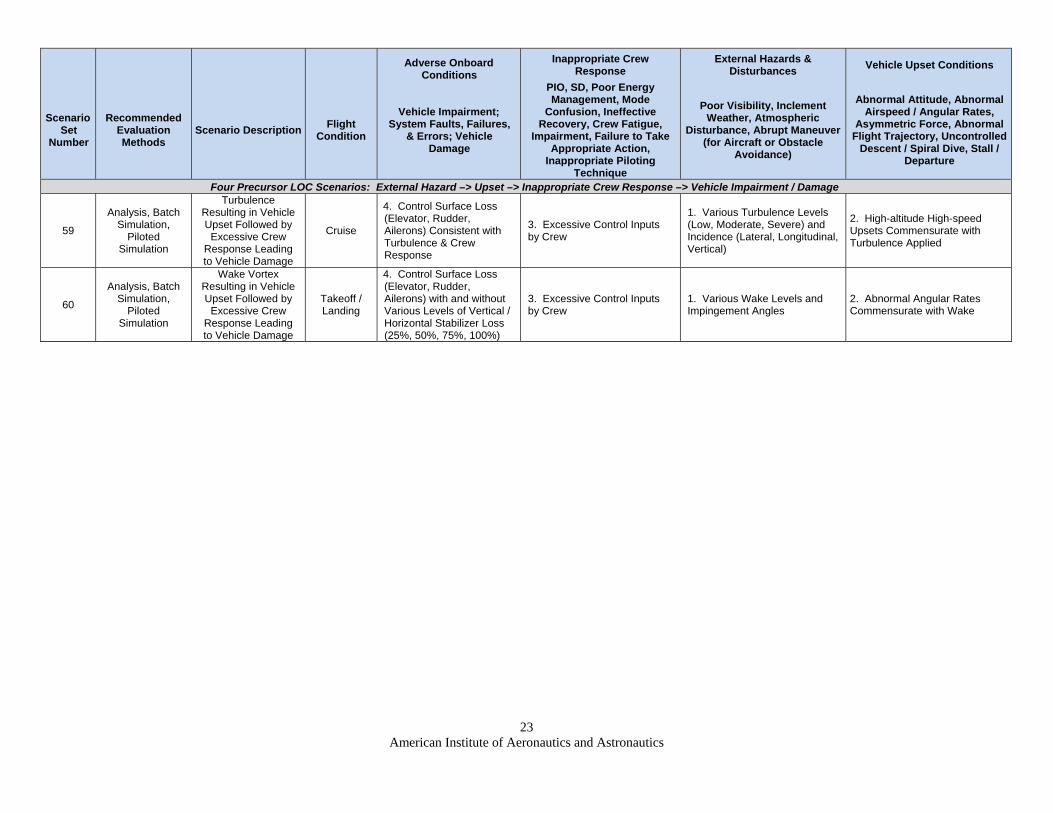
American Institute of Aeronautics and Astronautics
23
Adverse Onboard Conditions
Inappropriate Crew Response
External Hazards & Disturbances
Vehicle Upset Conditions
Scenario Set
Number
Recommended Evaluation Methods
Scenario Description Flight
Condition
Vehicle Impairment; System Faults, Failures,
& Errors; Vehicle Damage
PIO, SD, Poor Energy Management, Mode
Confusion, Ineffective Recovery, Crew Fatigue,
Impairment, Failure to Take Appropriate Action,
Inappropriate Piloting Technique
Poor Visibility, Inclement Weather, Atmospheric
Disturbance, Abrupt Maneuver (for Aircraft or Obstacle
Avoidance)
Abnormal Attitude, Abnormal Airspeed / Angular Rates,
Asymmetric Force, Abnormal Flight Trajectory, Uncontrolled
Descent / Spiral Dive, Stall / Departure
Four Precursor LOC Scenarios: External Hazard –> Upset –> Inappropriate Crew Response –> Vehicle Impairment / Damage
59
Analysis, Batch Simulation,
Piloted Simulation
Turbulence Resulting in Vehicle Upset Followed by
Excessive Crew Response Leading to Vehicle Damage
Cruise
4. Control Surface Loss (Elevator, Rudder, Ailerons) Consistent with Turbulence & Crew Response
3. Excessive Control Inputs by Crew
1. Various Turbulence Levels (Low, Moderate, Severe) and Incidence (Lateral, Longitudinal, Vertical)
2. High-altitude High-speed Upsets Commensurate with Turbulence Applied
60
Analysis, Batch Simulation,
Piloted Simulation
Wake Vortex Resulting in Vehicle Upset Followed by
Excessive Crew Response Leading to Vehicle Damage
Takeoff / Landing
4. Control Surface Loss (Elevator, Rudder, Ailerons) with and without Various Levels of Vertical / Horizontal Stabilizer Loss (25%, 50%, 75%, 100%)
3. Excessive Control Inputs by Crew
1. Various Wake Levels and Impingement Angles
2. Abnormal Angular Rates Commensurate with Wake
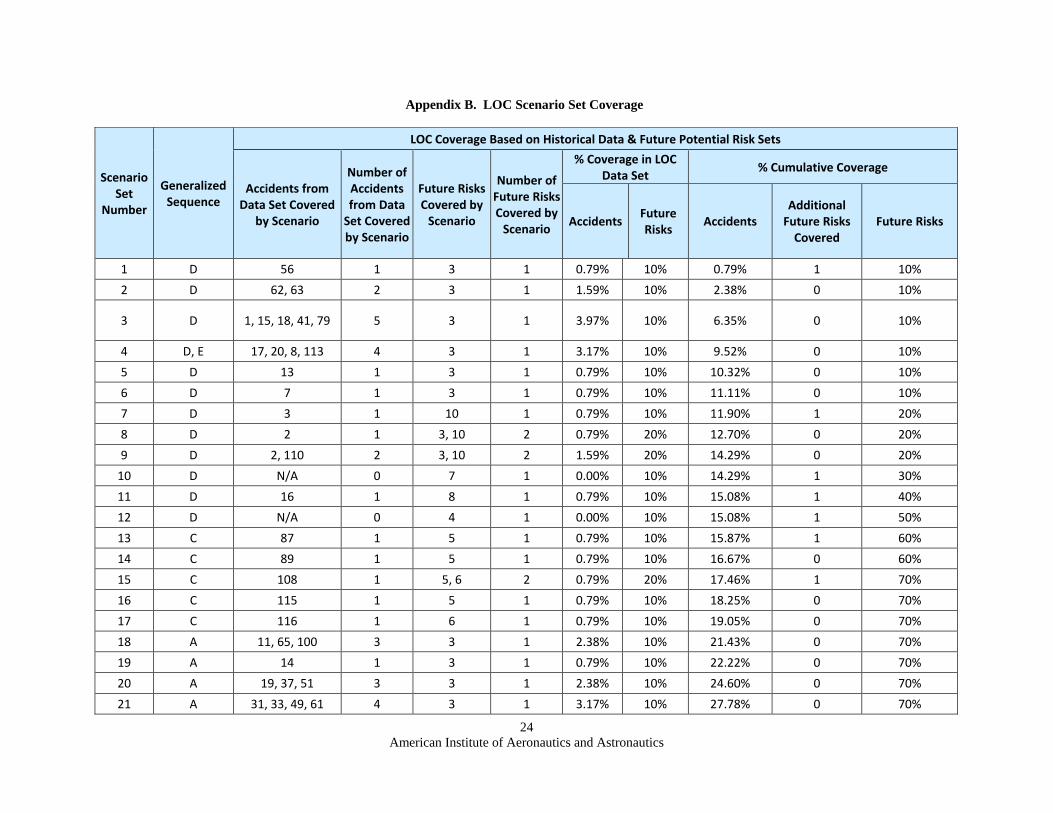
American Institute of Aeronautics and Astronautics
24
Appendix B. LOC Scenario Set Coverage
Scenario Set
Number
Generalized Sequence
LOC Coverage Based on Historical Data & Future Potential Risk Sets
Accidents from Data Set Covered
by Scenario
Number of Accidents from Data Set Covered by Scenario
Future Risks Covered by Scenario
Number of Future Risks Covered by Scenario
% Coverage in LOC Data Set
% Cumulative Coverage
Accidents Future Risks
Accidents Additional Future Risks Covered
Future Risks
1 D 56 1 3 1 0.79% 10% 0.79% 1 10%
2 D 62, 63 2 3 1 1.59% 10% 2.38% 0 10%
3 D 1, 15, 18, 41, 79 5 3 1 3.97% 10% 6.35% 0 10%
4 D, E 17, 20, 8, 113 4 3 1 3.17% 10% 9.52% 0 10%
5 D 13 1 3 1 0.79% 10% 10.32% 0 10%
6 D 7 1 3 1 0.79% 10% 11.11% 0 10%
7 D 3 1 10 1 0.79% 10% 11.90% 1 20%
8 D 2 1 3, 10 2 0.79% 20% 12.70% 0 20%
9 D 2, 110 2 3, 10 2 1.59% 20% 14.29% 0 20%
10 D N/A 0 7 1 0.00% 10% 14.29% 1 30%
11 D 16 1 8 1 0.79% 10% 15.08% 1 40%
12 D N/A 0 4 1 0.00% 10% 15.08% 1 50%
13 C 87 1 5 1 0.79% 10% 15.87% 1 60%
14 C 89 1 5 1 0.79% 10% 16.67% 0 60%
15 C 108 1 5, 6 2 0.79% 20% 17.46% 1 70%
16 C 115 1 5 1 0.79% 10% 18.25% 0 70%
17 C 116 1 6 1 0.79% 10% 19.05% 0 70%
18 A 11, 65, 100 3 3 1 2.38% 10% 21.43% 0 70%
19 A 14 1 3 1 0.79% 10% 22.22% 0 70%
20 A 19, 37, 51 3 3 1 2.38% 10% 24.60% 0 70%
21 A 31, 33, 49, 61 4 3 1 3.17% 10% 27.78% 0 70%
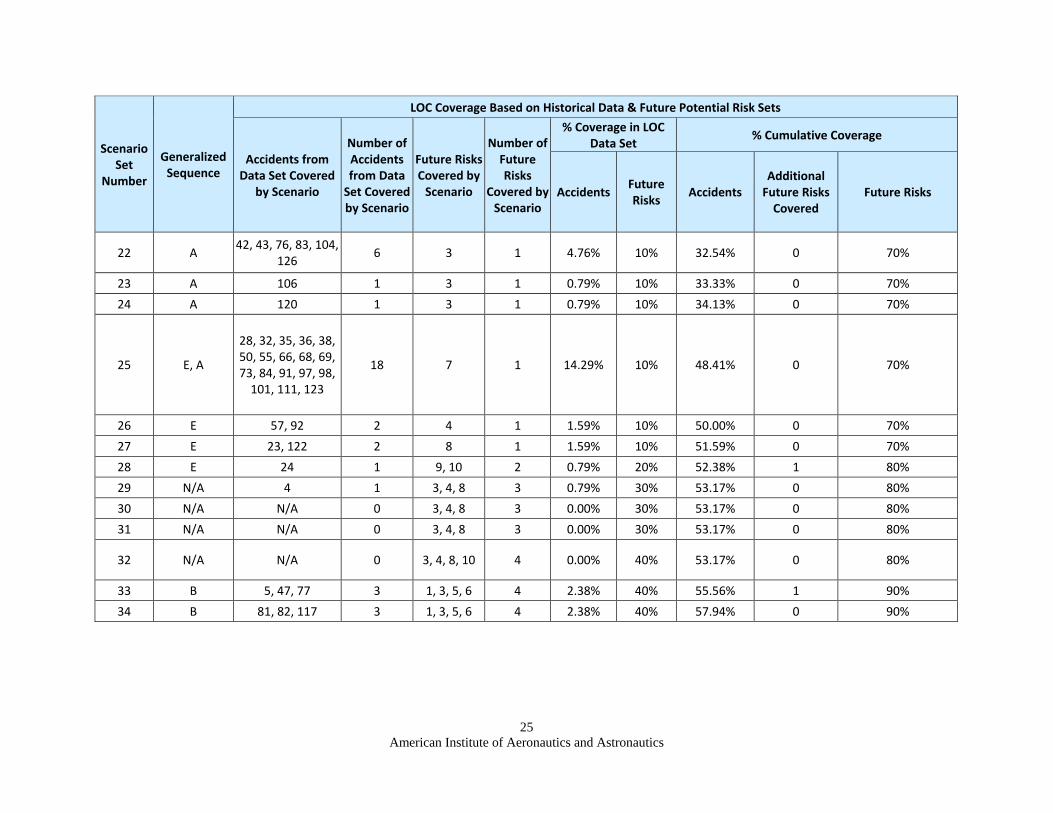
American Institute of Aeronautics and Astronautics
25
Scenario Set
Number
Generalized Sequence
LOC Coverage Based on Historical Data & Future Potential Risk Sets
Accidents from Data Set Covered
by Scenario
Number of Accidents from Data Set Covered by Scenario
Future Risks Covered by Scenario
Number of Future Risks
Covered by Scenario
% Coverage in LOC Data Set
% Cumulative Coverage
Accidents Future Risks
Accidents Additional Future Risks Covered
Future Risks
22 A 42, 43, 76, 83, 104,
126 6 3 1 4.76% 10% 32.54% 0 70%
23 A 106 1 3 1 0.79% 10% 33.33% 0 70%
24 A 120 1 3 1 0.79% 10% 34.13% 0 70%
25 E, A
28, 32, 35, 36, 38, 50, 55, 66, 68, 69, 73, 84, 91, 97, 98, 101, 111, 123
18 7 1 14.29% 10% 48.41% 0 70%
26 E 57, 92 2 4 1 1.59% 10% 50.00% 0 70%
27 E 23, 122 2 8 1 1.59% 10% 51.59% 0 70%
28 E 24 1 9, 10 2 0.79% 20% 52.38% 1 80%
29 N/A 4 1 3, 4, 8 3 0.79% 30% 53.17% 0 80%
30 N/A N/A 0 3, 4, 8 3 0.00% 30% 53.17% 0 80%
31 N/A N/A 0 3, 4, 8 3 0.00% 30% 53.17% 0 80%
32 N/A N/A 0 3, 4, 8, 10 4 0.00% 40% 53.17% 0 80%
33 B 5, 47, 77 3 1, 3, 5, 6 4 2.38% 40% 55.56% 1 90%
34 B 81, 82, 117 3 1, 3, 5, 6 4 2.38% 40% 57.94% 0 90%
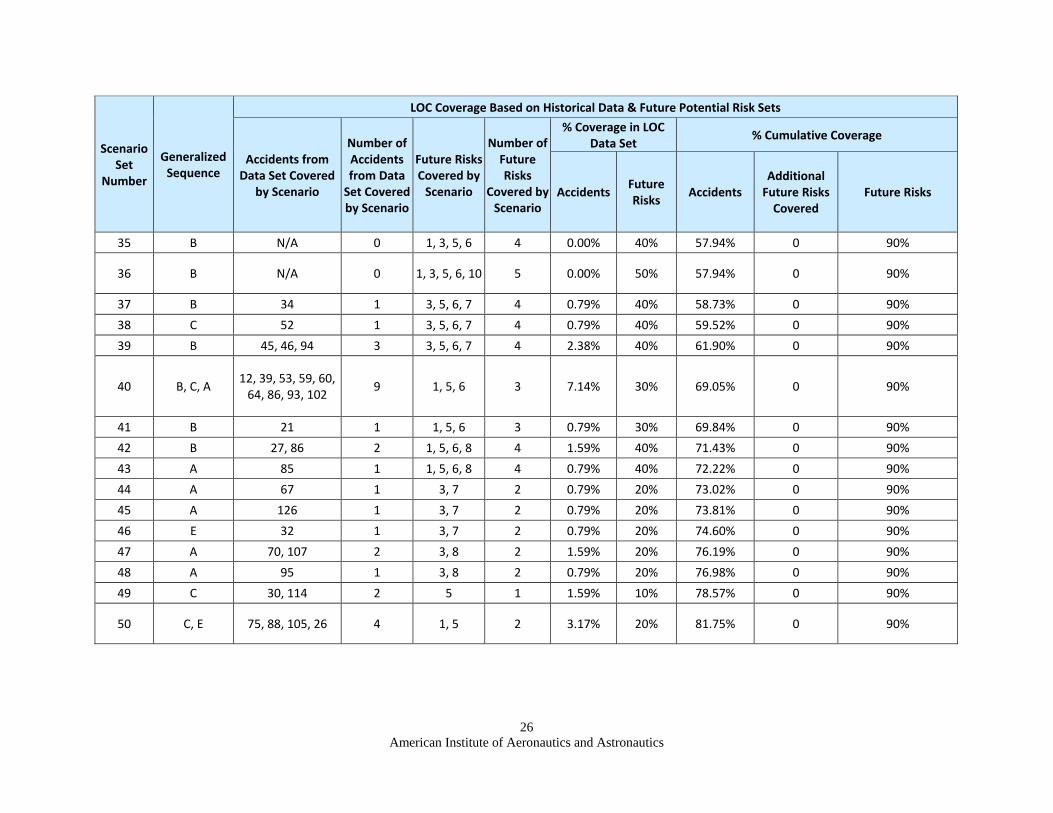
American Institute of Aeronautics and Astronautics
26
Scenario Set
Number
Generalized Sequence
LOC Coverage Based on Historical Data & Future Potential Risk Sets
Accidents from Data Set Covered
by Scenario
Number of Accidents from Data Set Covered by Scenario
Future Risks Covered by Scenario
Number of Future Risks
Covered by Scenario
% Coverage in LOC Data Set
% Cumulative Coverage
Accidents Future Risks
Accidents Additional Future Risks Covered
Future Risks
35 B N/A 0 1, 3, 5, 6 4 0.00% 40% 57.94% 0 90%
36 B N/A 0 1, 3, 5, 6, 10 5 0.00% 50% 57.94% 0 90%
37 B 34 1 3, 5, 6, 7 4 0.79% 40% 58.73% 0 90%
38 C 52 1 3, 5, 6, 7 4 0.79% 40% 59.52% 0 90%
39 B 45, 46, 94 3 3, 5, 6, 7 4 2.38% 40% 61.90% 0 90%
40 B, C, A 12, 39, 53, 59, 60, 64, 86, 93, 102
9 1, 5, 6 3 7.14% 30% 69.05% 0 90%
41 B 21 1 1, 5, 6 3 0.79% 30% 69.84% 0 90%
42 B 27, 86 2 1, 5, 6, 8 4 1.59% 40% 71.43% 0 90%
43 A 85 1 1, 5, 6, 8 4 0.79% 40% 72.22% 0 90%
44 A 67 1 3, 7 2 0.79% 20% 73.02% 0 90%
45 A 126 1 3, 7 2 0.79% 20% 73.81% 0 90%
46 E 32 1 3, 7 2 0.79% 20% 74.60% 0 90%
47 A 70, 107 2 3, 8 2 1.59% 20% 76.19% 0 90%
48 A 95 1 3, 8 2 0.79% 20% 76.98% 0 90%
49 C 30, 114 2 5 1 1.59% 10% 78.57% 0 90%
50 C, E 75, 88, 105, 26 4 1, 5 2 3.17% 20% 81.75% 0 90%
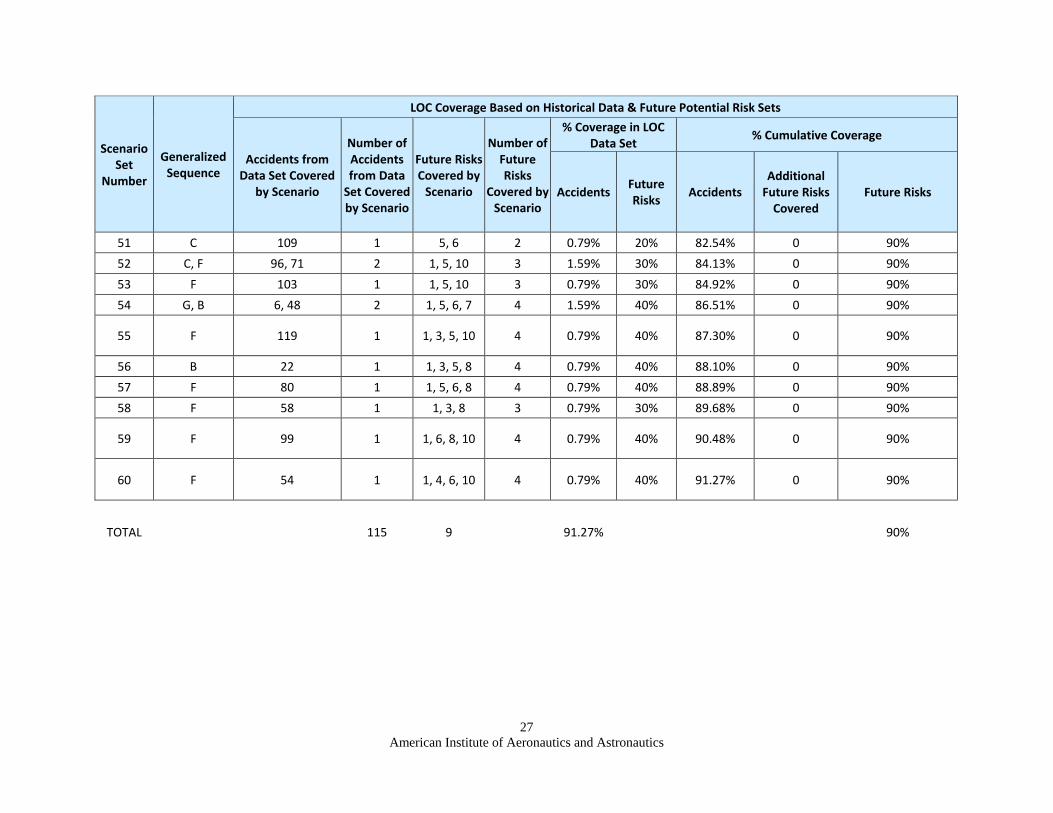
American Institute of Aeronautics and Astronautics
27
Scenario Set
Number
Generalized Sequence
LOC Coverage Based on Historical Data & Future Potential Risk Sets
Accidents from Data Set Covered
by Scenario
Number of Accidents from Data Set Covered by Scenario
Future Risks Covered by Scenario
Number of Future Risks
Covered by Scenario
% Coverage in LOC Data Set
% Cumulative Coverage
Accidents Future Risks
Accidents Additional Future Risks Covered
Future Risks
51 C 109 1 5, 6 2 0.79% 20% 82.54% 0 90%
52 C, F 96, 71 2 1, 5, 10 3 1.59% 30% 84.13% 0 90%
53 F 103 1 1, 5, 10 3 0.79% 30% 84.92% 0 90%
54 G, B 6, 48 2 1, 5, 6, 7 4 1.59% 40% 86.51% 0 90%
55 F 119 1 1, 3, 5, 10 4 0.79% 40% 87.30% 0 90%
56 B 22 1 1, 3, 5, 8 4 0.79% 40% 88.10% 0 90%
57 F 80 1 1, 5, 6, 8 4 0.79% 40% 88.89% 0 90%
58 F 58 1 1, 3, 8 3 0.79% 30% 89.68% 0 90%
59 F 99 1 1, 6, 8, 10 4 0.79% 40% 90.48% 0 90%
60 F 54 1 1, 4, 6, 10 4 0.79% 40% 91.27% 0 90%
TOTAL 115 9 91.27% 90%
American Institute of Aeronautics and Astronautics
28
Acknowledgments AirSTAR test envelopes under current and future operations were determined by Kevin Cunningham, and the
stall modeling envelope for improved training was determined by John Foster – both of NASA Langley Research Center. The research presented in this paper is dedicated to the memory and research contributions of Dr. Celeste M. Belcastro of NASA Langley Research Center, who was the beloved identical twin and research partner of the author.
References
1 Belcastro, Christine M. and Foster, John V.: Aircraft Loss-of-Control Accident Analysis; AIAA Guidance, Navigation and Control Conference, Toronto, 2-5 August 2010.
2 Belcastro, Christine M. and Jacobson, Steven: Future Integrated Systems Concept for Preventing Aircraft Loss-of-Control
Accidents; AIAA Guidance, Navigation and Control Conference, Toronto, 2-5 August 2010. 3 Belcastro, Christine M., “Loss of Control Prevention and Recovery: Onboard Guidance, Control, and Systems Technologies,”
AIAA Conference on Guidance, Navigation and Control, Minneapolis, Minnesota, August 2012. 4 Belcastro, Christine M.: Validation and Verification of Future Integrated Safety-Critical Systems Operating under Off-
Nominal Conditions; AIAA Guidance, Navigation and Control Conference, Toronto, 2010. 5 Belcastro, Christine M.: Validation & Verification of Safety-Critical Systems Operating under Off-Nominal Conditions.
Chapter 20, Optimization-Based Clearance of Flight Control Laws, Springer, 2011. 6 Foster, John V., “Investigation of the Susceptibility of Fighter Airplanes to the Out-of-Control Falling Leaf Mode,” NASA TP-
2001-211048, August 2001. 7 Varga, Andreas, Hansson, Anders, and Puyou, Guilhem (Eds.), Optimization Based Clearance of Flight Control Laws, A Civil
Aircraft Application, Springer-Verlag Berlin Heidelberg, 2012. 8 Chakraborty, A., Seiler, P., and Balas, G. J., Nonlinear region of attraction analysis for flight control verification and
validation, IFAC Control Engineering Practice Journal, 2011, Vol. 19, Issue 4, pp. 335–345. 9 Kenny, Sean P., Crespo, Luis G., and Giesy, Daniel P., “UQTools: The Uncertainty Quantification Toolbox – Introduction and
Tutorial,” NASA TM 2012-217561, April 2012. 10 Kwatny, H. G., Dongmo, J-E. T., Allen, R. C., Chang, B-C, and Bajpai, G., “Loss-of-Control: Perspectives on Flight
Dynamics and Control of Impaired Aircraft,” AIAA Conference on Guidance, Navigation and Control, Toronto, Ontario, Canada, 2-5 August 2010.
11 Khalil, Hassan K., Nonlinear Systems, Third Edition, Prentice Hall, 2002. 12 Chakraborty, Abhijit, Seiler, Peter, and Balas, Gary J., “Susceptibility of F/A-18 Flight Controllers to the Falling-Leaf Mode:
Nonlinear Analysis,” Journal of Guidance, Control, and Dynamics, Vol. 34, No. 1, January-February 2011. 13 Chakraborty, Abhijit, Seiler, Peter, and Balas, Gary J., “Susceptibility of F/A-18 Flight Controllers to the Falling-Leaf Mode:
Linear Analysis,” Journal of Guidance, Control, and Dynamics, Vol. 34, No. 1, January-February 2011. 14 Khatri, S. and Parrilo, P., "Guaranteed bounds on probabilistic ," Proceedings of the 37th IEEE Conference on Decision and
Control, pp.3349-3354, 1998. Tampa, FL. 15 Zhu, X., Hunag, Y., and Doyle, J., "Soft vs. hard bounds in probabilistic robustness analysis," Proceedings of the 35th IEEE
Conference on Decision and Control, pp. 3412-3417, 1996. Kobe, Japan. 16 Zhu, X., "Improved Bounds Computation for Probabilistic ," Proceedings of the American Control Conference, Chicago, IL,
2000, pp. 43336-4340.
American Institute of Aeronautics and Astronautics
29
17 Zhu, X., Khatri, S., and Parrilo, P., " with Linear Cuts: Upper Bound Computation," Proceedings of the American Control
Conference, San Diego, California, June 1999. 18 Balas, Gary J., Seiler, Peter J., Packard, Andrew, “Analysis of an UAV Flight Control System Using Probabilistic mu,” AIAA
Guidance, Navigation, and Control Conference, 2012, Minneapolis, Minnesota. 19 Crespo, Luis G., Kenny, Sean P., and Giesy, Daniel P., “A Computational Framework to Control Verification and Robustness
Analysis,” NASA TP–2010–216189, January 2010. 20 Crespo, Luis G., Kenny, Sean P., Murri, Daniel G., and Giesy, Daniel P., “A Study of the Safely Recoverable Flight Envelope
Near Stall,” AIAA Guidance, Navigation, and Control Conference, 2012, Minneapolis, Minnesota. 21 Crespo, Luis G., Giesy, Daniel P., and Kenny, Sean P., “A Unifying Framework to Uncertainty Quantification of Polynomial
Systems Subject to Aleatory and Epistemic Uncertainty,” Journal on Reliable Computing (Accepted for Publication). 22 Kwatny, H. G., Dongmo, J-E. T, Chang, B. C., Bajpai, G., Yassar, M. and Belcastro, C., "Aircraft Accident Prevention: Loss-
of-Control Analysis," AIAA Guidance, Navigation and Control Conference, Chicago, 2009. 23 Kwatny, H. G., and Chang, B. C., "Constructing Linear Families from Parameter-Dependent Nonlinear Dynamics," IEEE
Transactions on Automatic Control, Vol. 43, 1998, pp. 1143-1147. 24 Kwatny, Harry G., Dongmo, Jean-Etienne T., Chang, Bor-Chin, Bajpai, Gaurav, Yasar, Murat, and Belcastro, Christine,
“Nonlinear Analysis of Aircraft Loss-of-Control,” Journal of Guidance, Control, and Dynamics (To be Published). 25 Avanzini, G. and de Matteis, G., "Bifurcation Analysis of a Highly Augmented Aircraft Model", Journal of Guidance, Control
& Dynamics, Vol. 20, No. 4, July–August 1997. 26 Goman, M.G., Zagainov, G.I., and Khramtsovsky, A.V., "Application of Bifurcation Methods to Nonlinear Flight Dynamics
Problems", Progress in Aerospace Sciences, Vol. 33, 1997, pp539–586. 27 Thompson, J.M.T. and Macmillen, F.B.J., "Nonlinear Flight Dynamics of High-Performance Aircraft", Philosophical
Transactions of the Royal Society A on Mathematical, Physical, and Engineering Sciences, London, Vol. 356, No. 1745, October 1998.
28 Gill, Stephen J., Lowenberg, M. H., Krauskopf, B., and Puyou, Guilhem, “Bifurcation Analysis of the NASA GTM with a
View to Upset Recovery,” AIAA Guidance, Navigation, and Control Conference, 2012, Minneapolis, Minnesota. 29 Bateman, A., DeVore, M., and Balas, G. “A Validation Tool for Diagnostic Systems”, AIAA Guidance, Navigation, and
Control Conference, Chicago, IL, August 2009. AIAA-2009-5673. 30 Bateman, A., DeVore, M., “A Polynomial Chaos Framework for Integrating Design Time Stochastic Models and Flight Data,”
AIAA Modeling and Simulation Technologies Conference, Toronto, CA, August 2010. AIAA-2010-7619.
31 Bateman, Alec, DeVore, Michael, Gandhi, Neha, and Hjartarson, Arnar, “Validation of Diagnostic Systems and their Interactions with Feedback Control Systems,” AIAA Guidance, Navigation, and Control Conference, 2012, Minneapolis, Minnesota.
32 Foster, John V., Cunningham, Kevin, Fremaux, Charles M., Shah, Gautam H., Stewart, Eric C., Rivers, Robert A., Wilborn,
James, E., and Gato, William, “Dynamics Modeling and Simulation of Large Transport Airplanes in Upset Conditions,” AIAA Guidance, Navigation, and Control Conference, 2005, San Francisco, California.
33 Advani, Sunjoo K., “Upset Prevention and Recovery Training – Bridging the Gap between Training and Research,” AIAA
Modeling and Simulation Technologies Conference, 2012, Minneapolis, Minnesota. 34 Schroeder, Jeffery A., “Research and Technology in Support of Upset Prevention and Recovery Training,” AIAA Modeling and
Simulation Technologies Conference, 2012, Minneapolis, Minnesota. 35 Donaldson, Steven, Priest, James, Cunningham, Kevin, and Foster, John, “Upset Simulation and Training Initiatives for U.S.
Navy Commercial Derivative Aircraft,” AIAA Modeling and Simulation Technologies Conference, 2012, Minneapolis, Minnesota.
American Institute of Aeronautics and Astronautics
30
36 John N. Ralston, David R. Gingras, Chris Wilkening, and Paul Desrochers, “The Application of Potential Data Sources to
Comply with ICATEE Recommended Stall Modeling Requirements,” AIAA Modeling and Simulation Technologies Conference, 2012, Minneapolis, Minnesota.
37 Crider, Dennis and Foster, John, “Simulation Modeling Requirements for Loss-of-Control Accident Prevention of Turboprop
Transport Aircraft,” AIAA Modeling and Simulation Technologies Conference, 2012, Minneapolis, Minnesota. 38 ATSB, “In-Flight Uncontained Engine Failure Overhead, Batam Island, Indonesia, November 4, 2010,” AO–2010–089,
Preliminary. 39 NTSB, “Loss of Control and Impact with Pacific Ocean, Alaska Airlines Flight 261, January 31, 2000”, NTSB/AAR-02/01,
December 30, 2002. 40 NTSB, “Rapid Decompression Due to Fuselage Rupture, Southwest Airlines Flight 812, April 1, 2011,” DCA11MA039,
Preliminary. 41 NTSB, "In-Flight Separation of Vertical Stabilizer, American Airlines Flight 587, Belle Harbor, New York, November 12,
2001," NTSB/AAR-04/04, 26 October 2004. 42 Shah, Gautam H. and Hill, Melissa A., “Flight Dynamics Modeling and Simulation of a Damaged Transport Aircraft,” AIAA
Modeling and Simulation Technologies Conference, 2012, Minneapolis, Minnesota. 43 Broeren, Andy P., Lee, Sam, Shah, Gautam H., and Murphy, Patrick, C, “Aerodynamic Effects of Simulated Ice Accretion on
a Generic Transport Model,” SAE International, SAE Paper No. 2011–38–0065, June 13, 2011. 44 Jorgenson, P.C.E., Veres, J.P., May, R.D., and Wright, W.B., “Engine Icing Modeling and Simulation (Part 1): Ice Crystal
Accretion on Compression System Components and Modeling its Effects on Engine Performance,” 2011-38-0025, SAE International Conference on Aircraft and Engine Icing and Ground Deicing, Chicago, IL, 13-17 June 2011.
45 May, R.D., Guo, T-H., Veres, J.P., and Jorgenson, P.C.E., “Engine Icing Modeling and Simulation (Part 2): Performance
Simulation of Engine Rollback Phenomena,” 2011–38–0026, SAE International Conference on Aircraft and Engine Icing and Ground Deicing, Chicago, IL, 13–17 June 2011.
46 Martos, Borja and Morelli, Eugene A., “Using Indirect Turbulence Measurements for Real-Time Parameter Estimation in
Turbulent Air,” AIAA Atmospheric Flight Mechanics Conference, 2012, Minneapolis, Minnesota. 47 Morelli, Eugene A. and Cunningham, Kevin, “Aircraft Dynamic Modeling in Turbulence,” AIAA Atmospheric Flight
Mechanics Conference, 2012, Minneapolis, Minnesota. 48 May, Ryan D., Simon, Donald L., and Guo, Ten-Huei, “Modeling and Detection of Ice Particle Accretion in Aircraft Engine
Compression Systems,” AIAA Atmospheric Flight Mechanics Conference, 2012, Minneapolis, Minnesota. 49 Litt, Jonathan S., and Guo, Ten-Huei, Sowers, T. Shane, Chicatelli, Amy K., Fulton, Christopher E., May, Ryan D., and
Owen, A. Karl, “Pilot-in-the-Loop Evaluation of a Yaw Rate to Throttle Feedback Control with Enhanced Engine Response,” AIAA Guidance, Navigation, and Control Conference, 2012, Minneapolis, Minnesota.
50 Bacon, Barton J., “Quaternion-Based Control Architecture for Determining Controllability/ Maneuverability Limits,” AIAA
Guidance, Navigation, and Control Conference, 2012, Minneapolis, Minnesota. 51 Jordan, T. L. and Bailey, R. M., “NASA Langley’s AirSTAR Testbed – A Subscale Flight Test Capability for Flight Dynamics
and Control System Experiments,” AIAA Guidance, Navigation and Control Conference and Exhibit, 18–21 August 2008, Honolulu, Hawaii, AIAA–2008–6660.
52 Cox, David E., Cunningham, Kevin, and Jordan, Thomas, “Subscale Flight Testing for Aircraft Loss of Control:
Accomplishments and Future Directions,” AIAA Guidance, Navigation, and Control Conference, 2012, Minneapolis, Minnesota.
53 Lichter, Matthew D., Bateman, Alec J., and Balas, Gary J., “Flight Test Evaluation of a Run-time Stability Margin Estimation
Tool,” AIAA Guidance, Navigation, and Control Conference, 2009.