virginia's climate modeling and species vulnerability assessment · 2016-08-31 · i...
TRANSCRIPT
Virginia’s Climate Modeling and Species Vulnerability Assessment: How Climate Data Can Inform Management and Conservation
Virginia’s Climate Modeling and Species Vulnerability Assessment Virginia’s Climate Modeling and Species Vulnerability Assessmenti
Acknowledgements
Funding for this project was provided by the U.S. Fish and Wildlife Service’s State Wildlife Grants Program and the Doris Duke Charitable Foundation.
Authors: Austin Kane, National Wildlife Federation (NWF); Chris Burkett, Virginia Department of Game and Inland Fisheries; Scott Klopfer, Conservation Management Institute; and Jacob Sewall, PhD, Kutztown University.
Authors would like to thank David Kramar (CMI) for managing data and contributions to the species models. They also would like to thank Patty Glick (NWF) and Naomi Edelson (NWF) for their review of the document, and Ryan Kingston (NWF) for his assistance with graphics. We would also like to thank Maja Smith of MajaDesign, Inc. for the graphic design work.
Cover photo: Gray Tree Frog/Rick Hansen, USFWS.
Suggested Citation
Kane, A., T.C. Burkett, S. Kloper, and J. Sewall. 2013. Virginia’s Climate Modeling and Species Vulnerability Assessment: How Climate Data Can Inform Management and Conservation. National Wildlife Federation, Reston, Virginia.
National Wildlife Federation
706 Giddings Avenue, Suite 1B
Annapolis, Maryland 21401
444.759.3400
www.nwf.org
Virginia’s Climate Modeling and Species Vulnerability Assessment ii
Green Heron/Carol Norris
Virginia’s Climate Modeling and Species Vulnerability Assessment: How Climate Data Can Inform Management and Conservation

Virginia’s Climate Modeling and Species Vulnerability Assessmentiii
ContentsI. Introduction .........................................................................................................................................................................................1
II. Climate Change Impacts in Virginia ............................................................................................................................3
III. Project Approach ....................................................................................................................................................................... 5 Vulnerability Assessment Process ...................................................................................................................................5 Climate Data: Dynamic Downscaling ..............................................................................................................................5 Species Vulnerability Assessment ....................................................................................................................................8 Utilizing and Sharing Data and Results ..........................................................................................................................9
IV. Key Findings ................................................................................................................................................................................11 Physical Climate Impacts .................................................................................................................................................. 11 Ecological and Species Responses to Climate Change ......................................................................................... 14 Species Assessment Summaries ....................................................................................................................................16 Species Maps: Projected Distribution Changes under Climate Change........................................................ 29
V. Management Implications .................................................................................................................................................49 Forest Management Implications ..................................................................................................................................50 Cold Water Fish and Habitat Management Implications .................................................................................... 51 Frog and Toad Management Implications .................................................................................................................52 Invasive Species Management Implications .............................................................................................................52 Overarching Management Implications .....................................................................................................................54
VI. Next Steps ....................................................................................................................................................................................57 Wildlife Action Plan Update .............................................................................................................................................57 Climate Atlas Development ..............................................................................................................................................57 Integration with Other State Plans and Programs .................................................................................................58 Climate Change and Virginia’s Conservation Lands Portfolio ...........................................................................58
VII. References ................................................................................................................................................................................... 59
Virginia’s Climate Modeling and Species Vulnerability Assessment
1Virginia’s Climate Modeling and Species Vulnerability Assessment
Conservation Network (VCN) over five years ago on an effort to update Virginia’s Wildlife Action Plan (Action Plan) for climate change. The first part of this effort focused on building support in the state for integrating climate change into the Action Plan. The outcome of that effort was the publication of Virginia’s Strategy for Safeguarding Species of Greatest Conservation Need from the Effects of Climate Change (2009), a climate change strategy for the Action Plan.1 This strategy outlines the importance of considering a changing climate in developing and implementing successful wildlife conservation practices, particularly for those species already experiencing stressors that threaten their long-term viability and persistence in Virginia. It also describes how climate change stressors should be included in wildlife management plans. Research recommendations are included that if implemented would improve the understanding of how the climate in Virginia will change and how that might result in changes in species distribution across the Commonwealth.
ish and wildlife make up an important part of Virginia’s rich ecological, economic, and cultural heritage. The diverse array of species and habitats are part of the distinct character of the state and the basis for a strong conservation ethic among Virginians – one that will be necessary to sustain under continuing challenges posed by increases in population growth and in demands for land, water, and other natural resources, as well as by climate change.
Scientific research indicates that climate change is already having a significant impact on natural systems across the Chesapeake Bay region, including Virginia, and further changes are likely in the coming decades (Pyke et al., 2008; CCSP, 2009). Virginia is projected to experience a range of impacts from climate change from sea-level rise along the coast to increasing air and water temperatures and changes to precipitation patterns. These climate change impacts will directly affect wildlife and their habitats as well as exacerbate already existing stressors, and as a result conservation and management goals and strategies will likely need to be reconsidered in light of these changes.
Recognizing the importance of climate change’s projected impacts on Virginia’s fish, wildlife, and habitats, the Virginia Department of Game and Inland Fisheries (VDGIF) partnered with the National Wildlife Federation (NWF) and Virginia
I. Introduction
James River Spiny Mussel/ Jess Jones, USFWS
F
Virginia is projected to experience a range of impacts from climate change from sea-level rise along the coast to increasing air and water temperatures and changes to precipitation patterns.
1 www.bewildvirginia.org
Virginia’s Climate Modeling and Species Vulnerability Assessment2 Virginia’s Climate Modeling and Species Vulnerability Assessment
One key research recommendation recognizes the need for downscaled climate change information to guide decisions specifically for Virginia and recommends addressing these data and modeling needs related to climate change, including assessment of climate models and wildlife vulnerability. To meet this need and provide essential climate information for updating Virginia’s Wildlife Action Plan by 2015 (as required by U.S. Congress), VDGIF and NWF began a project with the Conservation Management Institute (CMI) at Virginia Tech to downscale climate data for Virginia and conduct a vulnerability assessment of a selection of species of greatest conservation need (SGCN) from the Action Plan. This project was designed with the intent to create spatially explicit climate forecasts to be used to update the Action Plan, and to help determine the magnitude and occurrence of future climate changes within the Commonwealth and the impacts that those climate changes may have on the distributions of a selection of SGCN and their habitats. The analysis, however, focuses solely on climatic suitability (using the climate factors modeled) and potential distribution changes for target species under various scenarios. It is important to note that other potential climate impacts that could affect species (e.g., phenology impacts, ecological mismatches, etc.) were not examined as a part of this effort, and that climate-envelope models, such as the one used for assessment, also do not capture other climate-related factors such as altered streamflows, sea-level rise, changes in disturbance regimes, among
others. This type of modeling process and vulnerability assessment do provide an important first step in understanding changes to species and habitats in Virginia.
This report includes a summary of the findings from the modeling effort and assessment as well as highlights management concerns and implications based on the assessment results.2 The information developed through this project and included in this document will help inform the update of Virginia’s Wildlife Action Plan. The climate strategy developed in 2009 was a first step in considering climate change impacts on Virginia’s fish, wildlife, and habitats. This climate data-driven vulnerability assessment will allow for integration of climate change into the updated version of the Action Plan at multiple levels, including revision of SGCN list, consideration of priorities, and development of conservation actions, among others. The climate data, assessment, and management implications developed through this project also will be useful to partner agencies and sectors in Virginia, such as the Natural Heritage Program, local planners, transportation officials, coastal program managers, and other organizations in their planning and programs. By bringing together multiple voices and partners, the information and recommendations in this report provide a feasible and effective way of working together to address climate change to conserve the wildlife and habitats of Virginia.
2 A companion report written by CMI provides an overview and discussion of the more technical aspects of the climate data down-scaling effort and species modeling (Klopfer et al., 2012). Please see http://cmi.vt.edu/Articles/art_ClimateChange.html.
3Virginia’s Climate Modeling and Species Vulnerability Assessment
range of climate change information, data, and models are available that focus on Virginia; however, much of the information available prior to this project was through regional modeling efforts and reports (e.g., CCSP, 2008; Pyke et al 2008; Najjar et al, 2010) as well as online tools that allow for spatial visualization of average temperature and precipitation (e.g., The Nature Conservancy’s Climate Wizard). There are several Virginia-based reports that touch on climate impacts more specific to Virginia. For example, the Governor’s Commission on Climate Change issued its Final Report: A Climate Change Action Plan in 2008 (Governor’s Commission on Climate Change 2008). The report includes general descriptions of climate change impacts for Virginia, based on projections by George Mason and Center for Ocean-Land-Atmosphere Studies in Maryland for temperature and precipitation by 2100 using the A1B emissions scenario and the Intergovernmental Panel on Climate Change (IPCC) 4th Assessment Report IPCC’s data (Governor’s Commission on Climate Change, 2008). The Nature Conservancy conducted a region-specific vulnerability assessment as a part of developing adaptation recommendations for the Eastern Shore in The Eastern Shore of Virginia: Strategies for Adapting to Climate Change (TNC, 2011). The Virginia
Institute of Marine Science (VIMS) conducts research and develops reports on sea-level rise and related issues for the state and region.3 VIMS also led the development of a Virginia General Assembly and Governor mandated effort to examine strategies to adapt to recurrent flooding in the Tidewater Region and the Eastern Shore. The report, Recurrent Flooding Study for Tidewater Virginia, was completed in early 2013 (VIMS, 2013).
Based on these reports and research, it is clear that temperatures will get warmer and precipitation will likely increase in the state, storms will become more intense, and sea-levels will rise. The models developed for Virginia’s Climate Action Plan project that average temperatures in Virginia will increase by 3.1°C (5.6°F) at the end of the century (Governor’s Commission on
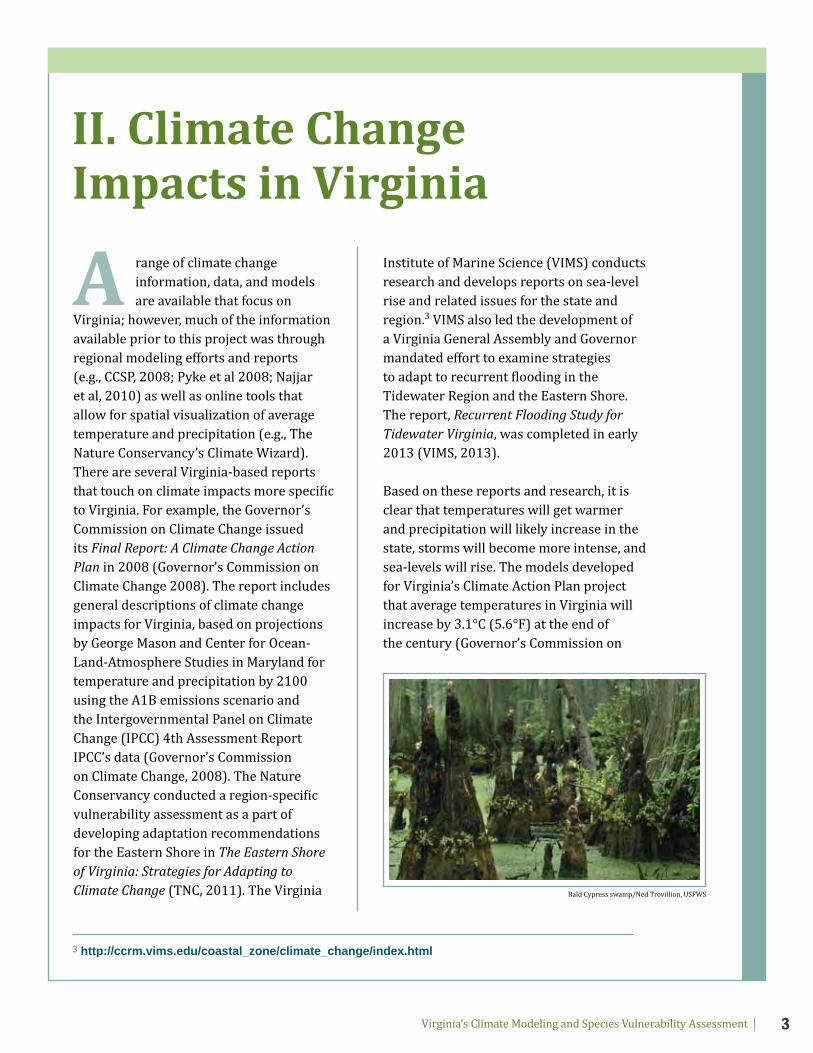
Bald Cypress swamp/Ned Trovillion, USFWS
II. Climate Change Impacts in Virginia
A
3 http://ccrm.vims.edu/coastal_zone/climate_change/index.html
Virginia’s Climate Modeling and Species Vulnerability AssessmentVirginia’s Climate Modeling and Species Vulnerability Assessment4
Climate Change, 2008). The Climate Change and the Chesapeake Bay report completed by the Chesapeake Bay Program Science and Technical Advisory Committee projects that temperature in the Chesapeake Bay region (Virginia and Maryland) may have a broader potential range of increase: 4°F under a lower emissions scenario and 11°F under a higher emissions scenario by 2100 (Pyke et al., 2008). The Climate Action Plan and the Chesapeake Bay report have similar projections for precipitation: 11 percent and 10 percent respectively. Additionally, precipitation increases will most likely occur in the winter and spring months (2008).
Sea-level rise is also likely to be significant in Virginia, rising two to five feet by the end of the century (Pyke et al., 2008). A more recent study, however, projects rates to be three to four times higher in the Mid-Atlantic than previously estimated (Sallenger et al., 2012). Storms are also projected to become more intense and possibly more frequent, which would result in an increase in coastal storm surges and inundation (CCSP, 2009). Winter storms may also become more intense in the North Atlantic as they shift poleward (CCSP, 2009; IPCC, 2007).
Although these climate change projections are useful, they tend to frame the climate discussion in terms of averages, such as changes in the average amounts or rainfall, average increases in summer temperatures, etc. While averages are important in understanding long-term trends, it is vital that natural resource managers recognize that changes in average temperature and precipitation will be driven by extreme events and these extreme, short duration events can have significant
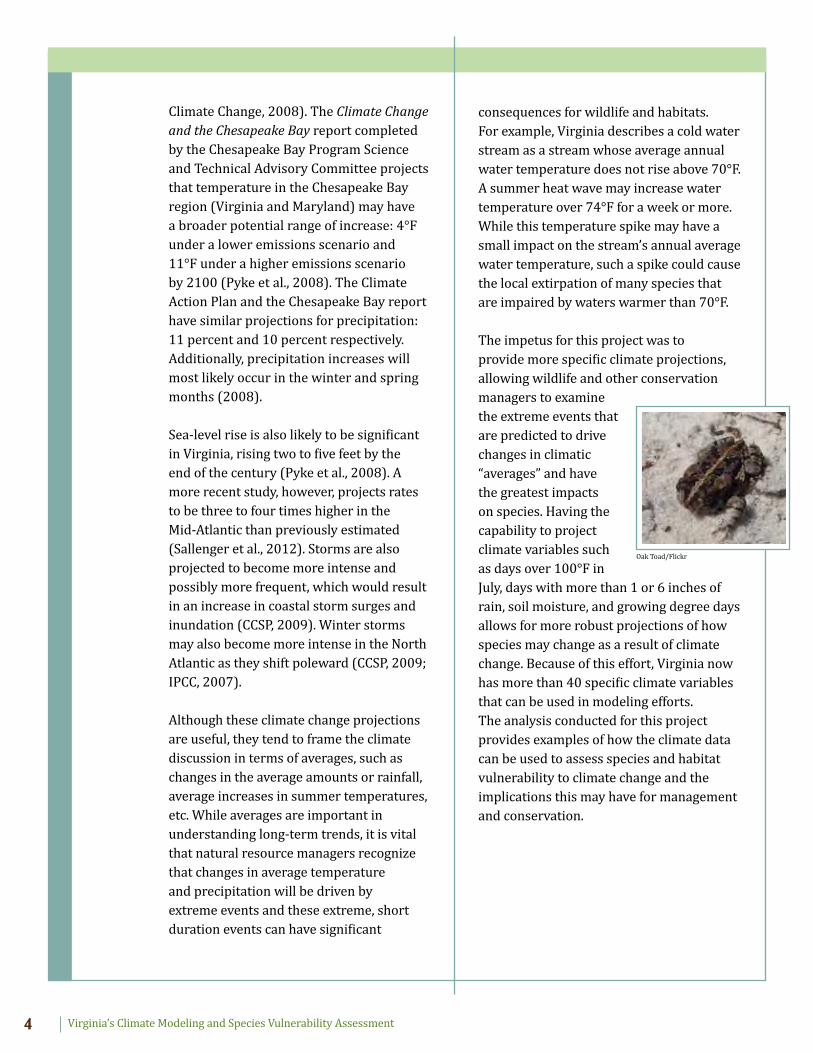
consequences for wildlife and habitats. For example, Virginia describes a cold water stream as a stream whose average annual water temperature does not rise above 70°F. A summer heat wave may increase water temperature over 74°F for a week or more. While this temperature spike may have a small impact on the stream’s annual average water temperature, such a spike could cause the local extirpation of many species that are impaired by waters warmer than 70°F.
The impetus for this project was to provide more specific climate projections, allowing wildlife and other conservation managers to examine the extreme events that are predicted to drive changes in climatic “averages” and have the greatest impacts on species. Having the capability to project climate variables such as days over 100°F in July, days with more than 1 or 6 inches of rain, soil moisture, and growing degree days allows for more robust projections of how species may change as a result of climate change. Because of this effort, Virginia now has more than 40 specific climate variables that can be used in modeling efforts. The analysis conducted for this project provides examples of how the climate data can be used to assess species and habitat vulnerability to climate change and the implications this may have for management and conservation.
Oak Toad/Flickr
Virginia’s Climate Modeling and Species Vulnerability Assessment 5
he goal of this effort was to conduct a spatially-explicit species vulnerability assessment using dynamically downscaled projected changes in climate to better understand how climate will likely affect species and habitats in Virginia, and to provide essential climate information for use in updating the Virginia Wildlife Action Plan. The Action Plan was completed by VDGIF in 2005 to help Virginia’s conservation community prevent species from becoming endangered. It highlights species of greatest conservation need, their threats, and conservation actions to help protect them. At the time of its development, climate change was not included as a key threat to wildlife and habitats.
To provide climate information for the Action Plan and others in Virginia, this project involved two phases: developing down-scaled climate data for Virginia and conducting the vulnerability assessments for specific target species. The results from this assessment were then used to identify management implications for the target species and habitats in Virginia. Stakeholders were involved in the development of the management implications and in discussions of how other agencies, sectors, and organizations may be able to use the climate data and assessment results. VDGIF and NWF partnered with CMI to lead the assessment process. CMI coordinated the climate modeling with Kutztown University and developed the species vulnerability assessment models. NWF and VDGIF led
efforts to inform stakeholders about the project and its results as well as develop related management implications.
Vulnerability Assessment Process
Climate Data: Dynamic Downscaling
Before the research team could conduct vulnerability assessments for individual species, new climate models had to be developed to better project climatic changes in Virginia. When this project began, the commonly available climate models projected changes across continents or hemispheres. While these models were very useful for describing long-term trends over large land masses, such maps tended to be very coarse and ill suited for local management purposes. Such models do not incorporate important details in local landscapes that influence climatic conditions, such as mountain ranges. Virginia has a number of mountain ranges, like the Blue Ridge, that influence weather and result in localized climatic patterns (such as orographic precipitation or precipitation produced when moist air is lifted over a mountain range) that are distinctly different from the surrounding landscapes. Prior to this effort, the research team felt existing climate models would be unsuitable for generating reliable and meaningful species vulnerability assessments. In order to address this concern, the first step of Virginia’s
III. Project Approach
T
Virginia’s Climate Modeling and Species Vulnerability AssessmentVirginia’s Climate Modeling and Species Vulnerability Assessment6
vulnerability assessment was to produce a more regionally explicit, or “downscaled,” set of climate models that could provide more detailed and locally relevant climate projections and would better inform the species threats assessments.
Downscaling to project more local climatic changes can be completed using either of two general methods – statistical downscaling or dynamic downscaling. Statistical downscaling involves applying existing climate measurements to a landscape, then modifying those values through various methods to incorporate the effects that local factors such as elevation or land cover will have on these climate measures. The other approach, dynamic downscaling, requires the use of mathematical equations that reflect how global patterns affect local weather conditions. The models used in dynamic downscaling are known as regional climate models and are based on both larger, global-scale models and smaller, weather forecasting models. The resulting climate estimates are the product of simulation and can provide a broader array of metrics for use in species distribution models than can be obtained from statistical downscaling.
A dynamic downscaling approach was used for this project, allowing the model to capture specific weather events during the simulations that would be unavailable from statistically downscaled forecasts. These weather events were important in understanding observed species patterns on the landscape. For example, with dynamically downscaled climate forecast models statistics such as the frequency of unseasonably cold weather in January that may be the ultimate cause of range limitations for species at their northern limit were captured.
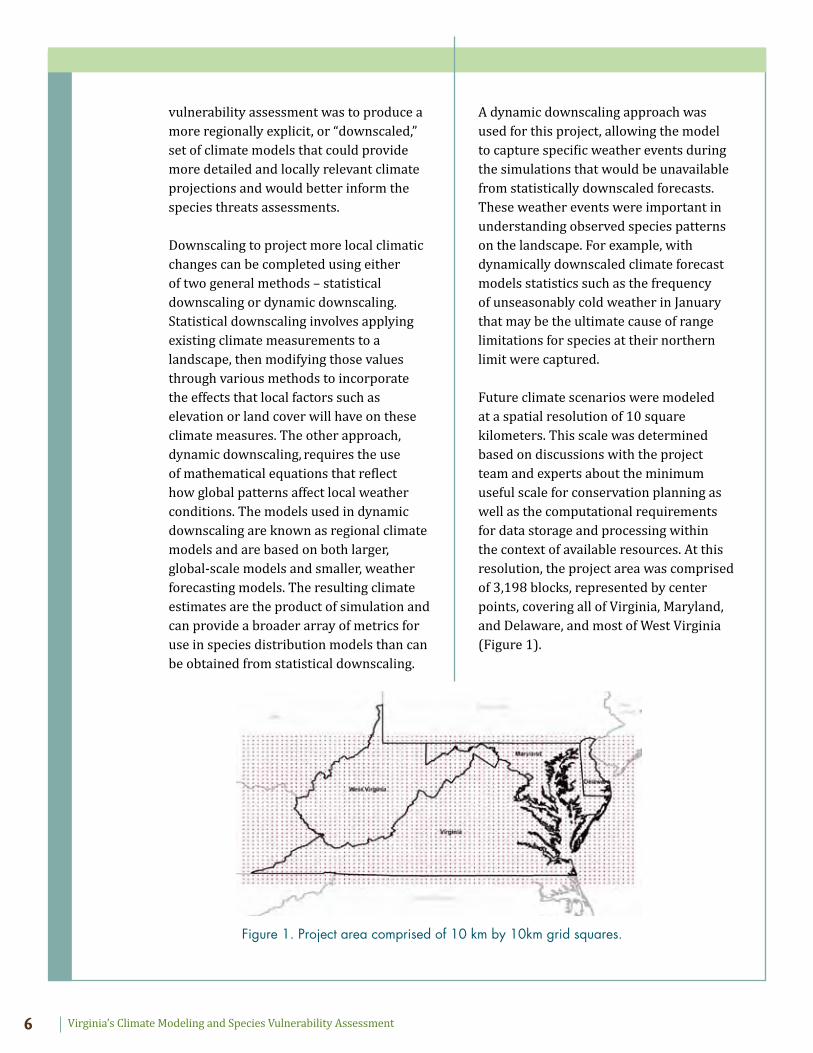
Future climate scenarios were modeled at a spatial resolution of 10 square kilometers. This scale was determined based on discussions with the project team and experts about the minimum useful scale for conservation planning as well as the computational requirements for data storage and processing within the context of available resources. At this resolution, the project area was comprised of 3,198 blocks, represented by center points, covering all of Virginia, Maryland, and Delaware, and most of West Virginia (Figure 1).
Figure 1. Project area comprised of 10 km by 10km grid squares.
Virginia’s Climate Modeling and Species Vulnerability Assessment 7
Three climate scenarios, a control and two future scenarios, were used in the model. The control (or “current”) scenario represented model results run for the late 20th century (1990-1999). The two future scenarios represented lower and higher estimates of potential changes to emissions,4 and were created by the IPCC.5 They have the following assumptions:
• SRES 6 B1: a moderate climate change scenario with 550 parts per million (ppm) carbon dioxide (CO2) concentration stabilization @ 2100.
• SRES A1FI: aggressive fossil fuel use in the next century with CO2 emissions stabilizing @ 2080 but with concentrations exceeding 1000 ppm in 2100.
Simulations were run to the end of the century for each emissions scenario in each of the 10 by 10 kilometer blocks. Multiple iterations for the simulation forecasts were run in order to account for the variability from using dynamically downscaled models. Raw climate data were collected at 4 hour intervals, and were then harvested as output for a 10 year period around the control (late 20th century), mid-century (2050), and late century (2100) (Klopfer et al., 2012).
CMI used the data provided by the downscaling effort to create raster representations of the climate variables to facilitate visual interpretation. This process was repeated for each of the climate change scenarios, time period, and variable until a
full suite of climate variables was available to incorporate into the species distribution models. However, individual maps for each climate variable produced were not created due to time and resource constraints (Klopfer et al., 2012).
By working directly from “raw” climate information CMI was able to calculate variables – such as “number of cold snap days” that would otherwise have been unavailable. Specific climate-based variables were developed that were integral to producing species distribution change models that could capture specific climate events rather than long term means (Klopfer et al., 2012). For example, a period of unusually cold temperatures during the spring in Virginia could diminish local insect populations or limit suitable roost sites, negatively affecting migratory
4 The regional model used for these simulations was the ICTP Regional Climate Model v. 3 (RegCM3). Details of RegCM3 are available at: http://users.ictp.it/~pubregcm/.5 More information on these greenhouse gas scenarios can be obtained from the International Panel on Climate Change at: http://www.ipcc.ch/pdf/special-reports/spm/sres-en.pdf. 6 Special Report emission scenarios often referred to as the acronym “SRES” in climate modeling circles.
USWFS
Virginia’s Climate Modeling and Species Vulnerability AssessmentVirginia’s Climate Modeling and Species Vulnerability Assessment8
populations of birds that stopover in Virginia on their way to summer breeding ranges (Klopfer et al., 2012). If these episodic events occur too frequently the species would be unlikely to sustain populations and their distribution would reflect this climatic change.
Species Vulnerability Assessment
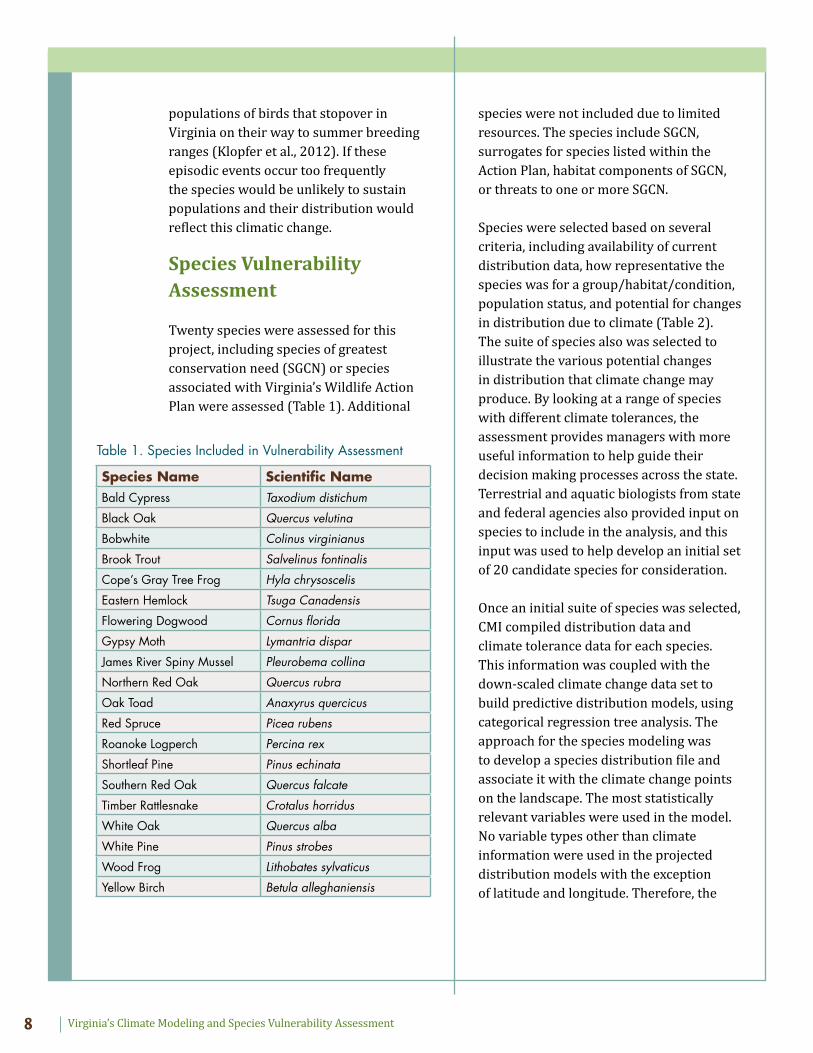
Twenty species were assessed for this project, including species of greatest conservation need (SGCN) or species associated with Virginia’s Wildlife Action Plan were assessed (Table 1). Additional
species were not included due to limited resources. The species include SGCN, surrogates for species listed within the Action Plan, habitat components of SGCN, or threats to one or more SGCN.
Species were selected based on several criteria, including availability of current distribution data, how representative the species was for a group/habitat/condition, population status, and potential for changes in distribution due to climate (Table 2). The suite of species also was selected to illustrate the various potential changes in distribution that climate change may produce. By looking at a range of species with different climate tolerances, the assessment provides managers with more useful information to help guide their decision making processes across the state. Terrestrial and aquatic biologists from state and federal agencies also provided input on species to include in the analysis, and this input was used to help develop an initial set of 20 candidate species for consideration.
Once an initial suite of species was selected, CMI compiled distribution data and climate tolerance data for each species. This information was coupled with the down-scaled climate change data set to build predictive distribution models, using categorical regression tree analysis. The approach for the species modeling was to develop a species distribution file and associate it with the climate change points on the landscape. The most statistically relevant variables were used in the model. No variable types other than climate information were used in the projected distribution models with the exception of latitude and longitude. Therefore, the
Species Name Scientific NameBald Cypress Taxodium distichum
Black Oak Quercus velutina
Bobwhite Colinus virginianus
Brook Trout Salvelinus fontinalis
Cope’s Gray Tree Frog Hyla chrysoscelis
Eastern Hemlock Tsuga Canadensis
Flowering Dogwood Cornus florida
Gypsy Moth Lymantria dispar
James River Spiny Mussel Pleurobema collina
Northern Red Oak Quercus rubra
Oak Toad Anaxyrus quercicus
Red Spruce Picea rubens
Roanoke Logperch Percina rex
Shortleaf Pine Pinus echinata
Southern Red Oak Quercus falcate
Timber Rattlesnake Crotalus horridus
White Oak Quercus alba
White Pine Pinus strobes
Wood Frog Lithobates sylvaticus
Yellow Birch Betula alleghaniensis
Table 1. Species Included in Vulnerability Assessment
Virginia’s Climate Modeling and Species Vulnerability Assessment 9
model output is based solely on climate variables and does not include any additional site specific information such as land use, population density, etc. This type of approach is a bioclimate envelope model (Pearson and Dawson, 2003).
Once the best species distribution model had been identified using current modeled climate data (control), projected distributions for future climate scenarios were created by inserting the analogous climate variables from the future scenarios into the model and calculating the result for each. CMI used the model results to identify patterns and commonalities to describe the likely responses of species as a result of projected climate change. The results of the assessment are a series of species distribution maps under current and future climate projections that were produced for each of the 20 species analyzed (Klopfer, 2012).
Utilizing and Sharing Data and Results
The primary purpose of this project was to assess species future distribution and vulnerability based on certain factors associated with climate change (e.g., variables related to temperature and precipitation changes, moisture regimes, wind speeds, runoff, etc.) to help VDGIF better understand what climate change may mean for the state’s species and habitats and implications for management and conservation. The resulting species maps were used to help identify wildlife and habitat management concerns and implications under a changing climate. These maps also were shared with various stakeholders in Virginia from partner agencies to conservation groups. Additionally, this information will be essential in updating Virginia’s Wildlife
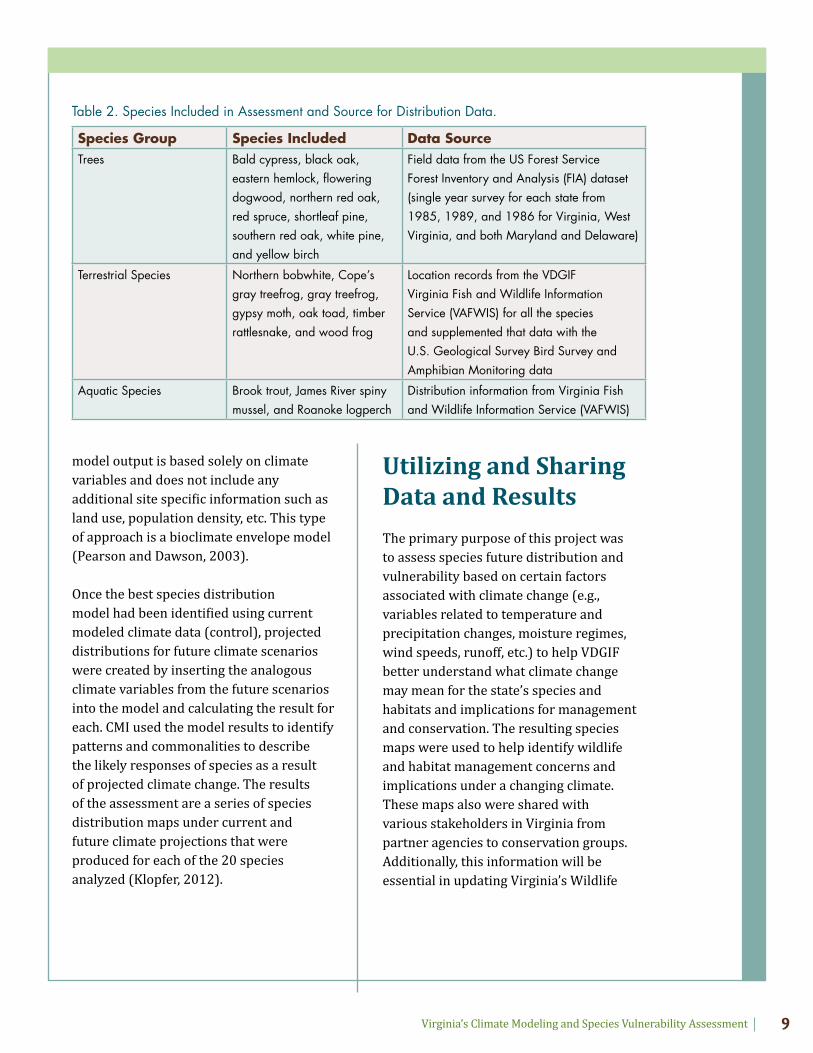
Species Group Species Included Data SourceTrees Bald cypress, black oak,
eastern hemlock, flowering dogwood, northern red oak, red spruce, shortleaf pine, southern red oak, white pine, and yellow birch
Field data from the US Forest Service Forest Inventory and Analysis (FIA) dataset (single year survey for each state from 1985, 1989, and 1986 for Virginia, West Virginia, and both Maryland and Delaware)
Terrestrial Species Northern bobwhite, Cope’s gray treefrog, gray treefrog, gypsy moth, oak toad, timber rattlesnake, and wood frog
Location records from the VDGIF Virginia Fish and Wildlife Information Service (VAFWIS) for all the species and supplemented that data with the U.S. Geological Survey Bird Survey and Amphibian Monitoring data
Aquatic Species Brook trout, James River spiny mussel, and Roanoke logperch
Distribution information from Virginia Fish and Wildlife Information Service (VAFWIS)
Table 2. Species Included in Assessment and Source for Distribution Data.
Virginia’s Climate Modeling and Species Vulnerability AssessmentVirginia’s Climate Modeling and Species Vulnerability Assessment10
Action Plan – both the species maps as well as the climate data. Results from this project will be used in assessing Virginia’s SGCN and developing new conservation and management plans including Virginia’s Wildlife Action Plan.
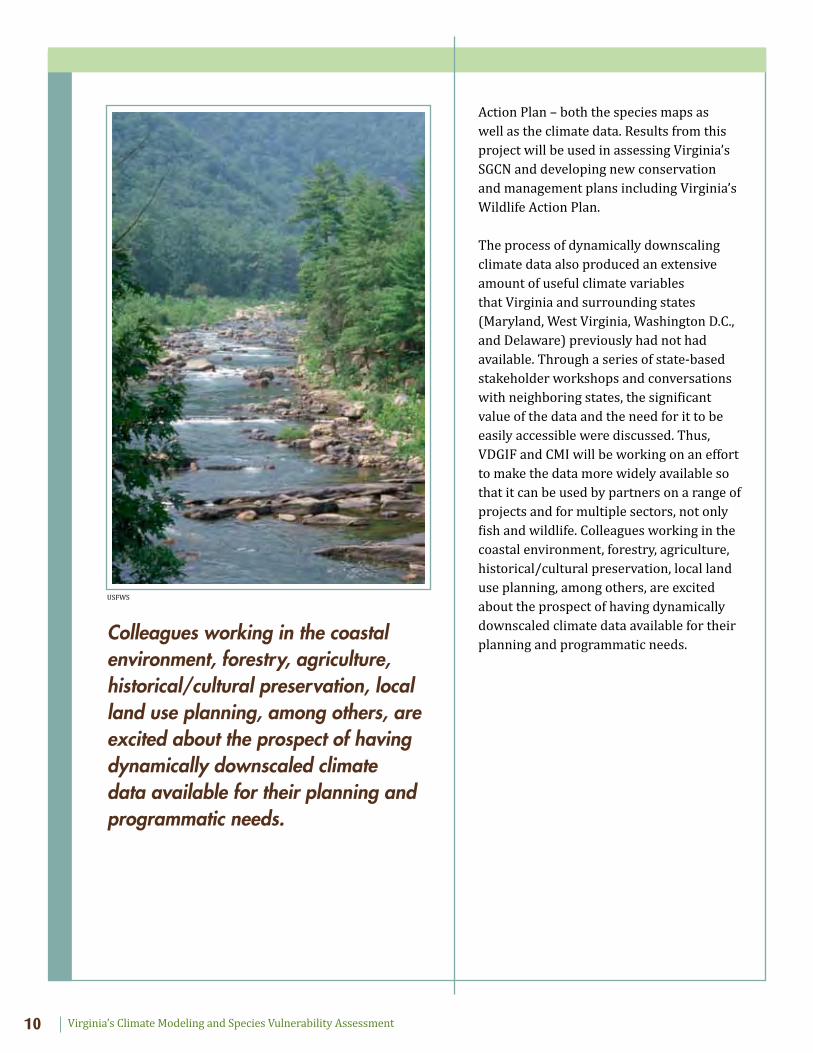
The process of dynamically downscaling climate data also produced an extensive amount of useful climate variables that Virginia and surrounding states (Maryland, West Virginia, Washington D.C., and Delaware) previously had not had available. Through a series of state-based stakeholder workshops and conversations with neighboring states, the significant value of the data and the need for it to be easily accessible were discussed. Thus, VDGIF and CMI will be working on an effort to make the data more widely available so that it can be used by partners on a range of projects and for multiple sectors, not only fish and wildlife. Colleagues working in the coastal environment, forestry, agriculture, historical/cultural preservation, local land use planning, among others, are excited about the prospect of having dynamically downscaled climate data available for their planning and programmatic needs.
USFWS
Colleagues working in the coastal environment, forestry, agriculture, historical/cultural preservation, local land use planning, among others, are excited about the prospect of having dynamically downscaled climate data available for their planning and programmatic needs.

Virginia’s Climate Modeling and Species Vulnerability Assessment 11
Physical Climate Impacts
ver 40 variables generated from the dynamically downscaled climate data modeling process were determined to be potentially significant to the life history of the species of focus and were extracted from the downscaled climate model data. Examples of the types of climate variables obtained include: heating and cooling degree days; soil, topsoil, and root soil moisture; days with more than one inch and six inches of snow; and days with more than one inch of runoff. Although most variables were derivatives of precipitation and temperature, the models were able to include other climatic features, such as wind speed. Some variables were included to serve as proxy for specific climate change impacts. For example, water levels in Virginia’s rivers are influenced by runoff and groundwater. The climate models were able to predict run off and soil moisture which helps describe how water is likely to flow into Virginia’s river systems and influence aquatic species and habitats.
Also, these climate variables were not individually mapped for this project as the modeling process generated considerably more data than were anticipated, and the project budget was insufficient to conduct the species vulnerability assessment and produce maps for all climate variables. Thus, the focus of this project was integrating the climate information into
the vulnerability assessment and species distribution maps. Project partners have committed to making the climate data available under a second project (see Section V).
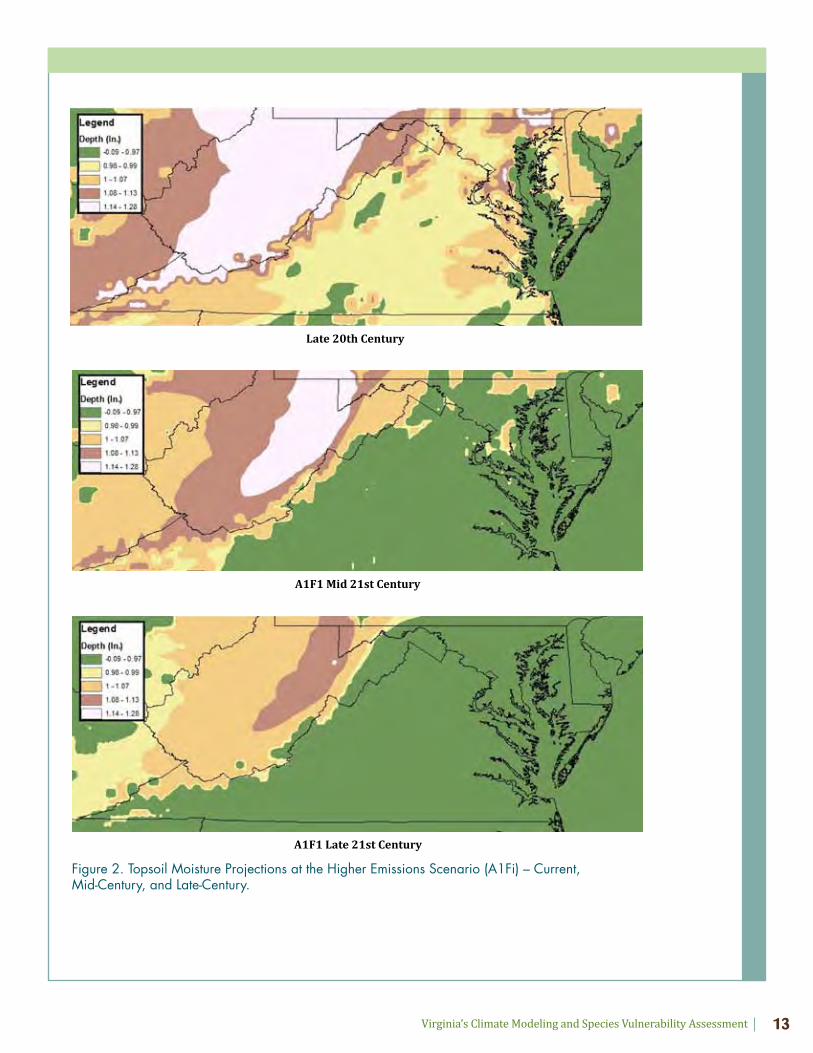
Species have different climate tolerances and life histories; thus, each will have its own suite of climate variables that affects its distribution. As mentioned above, maps were not developed for all 40 plus climate variables; however, CMI analyzed how the climate variables would increase or decrease across the state under the two emissions scenarios (A1Fi and B1) at mid and late century. Table 3 highlights a selection of climate variables generated through the down-scaling effort and their respective projected changes at mid and late century (2050 and 2090) based on the higher emissions scenario (A1Fi). For example, it is projected that top soil moisture levels will decrease for a large percentage of the state by mid and late century. An example of how a climate variable would look mapped on the landscape is provided in Figure 2, where topsoil moisture is projected spatially across Virginia at current, mid-century, and late century at the higher emissions scenario (Figure 2, page 13). No species distribution data is included.
IV. Key Findings
O
Species have different climate tolerances and life histories; thus, each will have its own suite of climate variables that affects its distribution.
Virginia’s Climate Modeling and Species Vulnerability AssessmentVirginia’s Climate Modeling and Species Vulnerability Assessment12
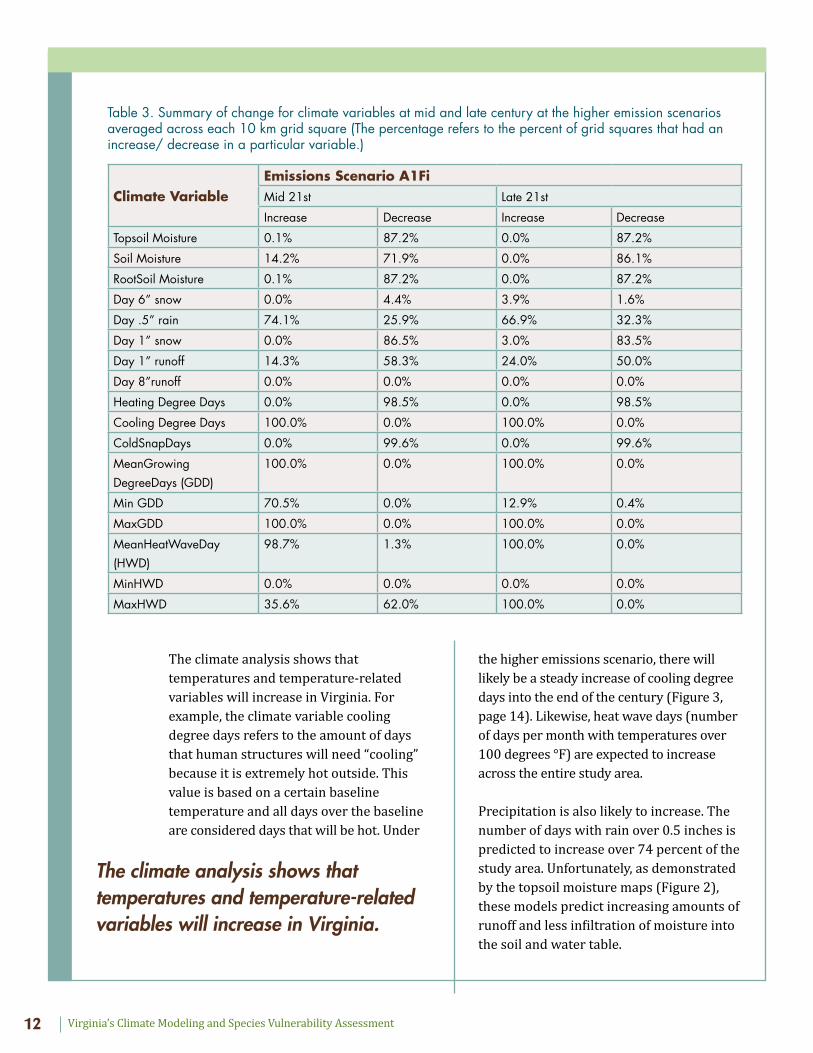
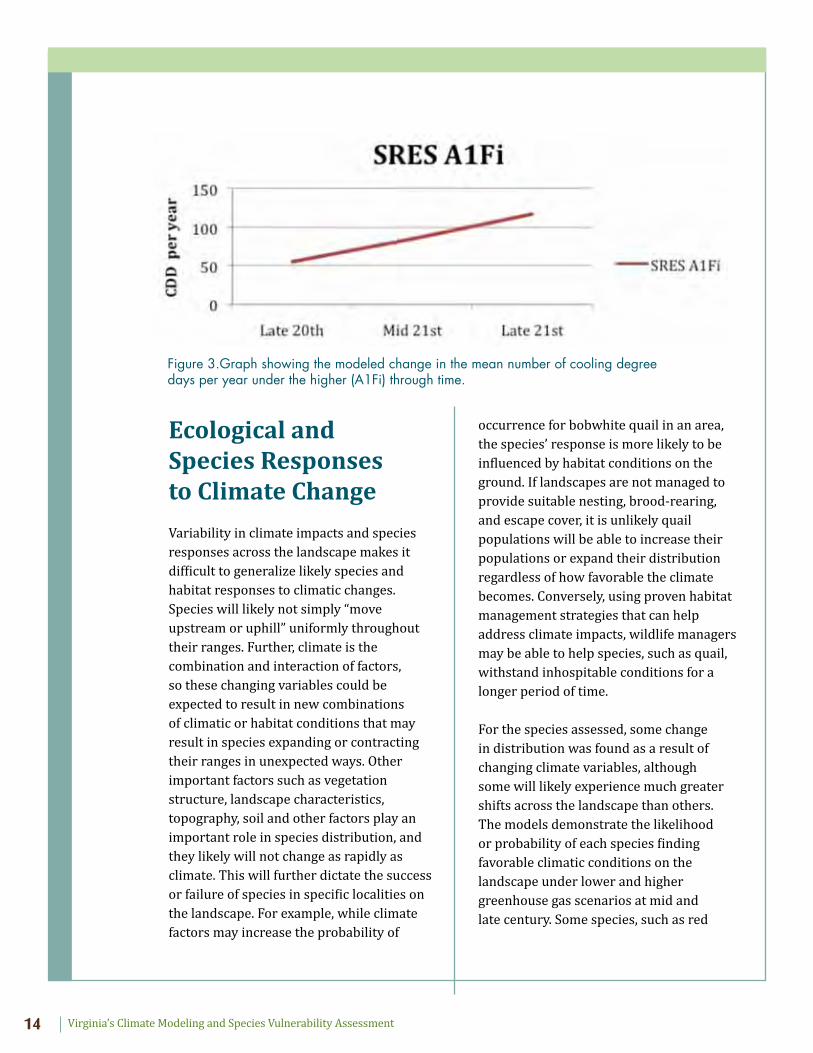
The climate analysis shows that temperatures and temperature-related variables will increase in Virginia. For example, the climate variable cooling degree days refers to the amount of days that human structures will need “cooling” because it is extremely hot outside. This value is based on a certain baseline temperature and all days over the baseline are considered days that will be hot. Under
the higher emissions scenario, there will likely be a steady increase of cooling degree days into the end of the century (Figure 3, page 14). Likewise, heat wave days (number of days per month with temperatures over 100 degrees °F) are expected to increase across the entire study area.
Precipitation is also likely to increase. The number of days with rain over 0.5 inches is predicted to increase over 74 percent of the study area. Unfortunately, as demonstrated by the topsoil moisture maps (Figure 2), these models predict increasing amounts of runoff and less infiltration of moisture into the soil and water table.
Climate VariableEmissions Scenario A1FiMid 21st Late 21st
Increase Decrease Increase Decrease
Topsoil Moisture 0.1% 87.2% 0.0% 87.2%
Soil Moisture 14.2% 71.9% 0.0% 86.1%
RootSoil Moisture 0.1% 87.2% 0.0% 87.2%
Day 6” snow 0.0% 4.4% 3.9% 1.6%
Day .5” rain 74.1% 25.9% 66.9% 32.3%
Day 1” snow 0.0% 86.5% 3.0% 83.5%
Day 1” runoff 14.3% 58.3% 24.0% 50.0%
Day 8”runoff 0.0% 0.0% 0.0% 0.0%
Heating Degree Days 0.0% 98.5% 0.0% 98.5%
Cooling Degree Days 100.0% 0.0% 100.0% 0.0%
ColdSnapDays 0.0% 99.6% 0.0% 99.6%
MeanGrowing DegreeDays (GDD)
100.0% 0.0% 100.0% 0.0%
Min GDD 70.5% 0.0% 12.9% 0.4%
MaxGDD 100.0% 0.0% 100.0% 0.0%
MeanHeatWaveDay (HWD)
98.7% 1.3% 100.0% 0.0%
MinHWD 0.0% 0.0% 0.0% 0.0%
MaxHWD 35.6% 62.0% 100.0% 0.0%
Table 3. Summary of change for climate variables at mid and late century at the higher emission scenarios averaged across each 10 km grid square (The percentage refers to the percent of grid squares that had an increase/ decrease in a particular variable.)
The climate analysis shows that temperatures and temperature-related variables will increase in Virginia.
Virginia’s Climate Modeling and Species Vulnerability Assessment 13
Climate VariableEmissions Scenario A1FiMid 21st Late 21st
Increase Decrease Increase Decrease
Topsoil Moisture 0.1% 87.2% 0.0% 87.2%
Soil Moisture 14.2% 71.9% 0.0% 86.1%
RootSoil Moisture 0.1% 87.2% 0.0% 87.2%
Day 6” snow 0.0% 4.4% 3.9% 1.6%
Day .5” rain 74.1% 25.9% 66.9% 32.3%
Day 1” snow 0.0% 86.5% 3.0% 83.5%
Day 1” runoff 14.3% 58.3% 24.0% 50.0%
Day 8”runoff 0.0% 0.0% 0.0% 0.0%
Heating Degree Days 0.0% 98.5% 0.0% 98.5%
Cooling Degree Days 100.0% 0.0% 100.0% 0.0%
ColdSnapDays 0.0% 99.6% 0.0% 99.6%
MeanGrowing DegreeDays (GDD)
100.0% 0.0% 100.0% 0.0%
Min GDD 70.5% 0.0% 12.9% 0.4%
MaxGDD 100.0% 0.0% 100.0% 0.0%
MeanHeatWaveDay (HWD)
98.7% 1.3% 100.0% 0.0%
MinHWD 0.0% 0.0% 0.0% 0.0%
MaxHWD 35.6% 62.0% 100.0% 0.0%
Late 20th Century
A1F1 Mid 21st Century
A1F1 Late 21st Century
Figure 2. Topsoil Moisture Projections at the Higher Emissions Scenario (A1Fi) – Current, Mid-Century, and Late-Century.
Virginia’s Climate Modeling and Species Vulnerability AssessmentVirginia’s Climate Modeling and Species Vulnerability Assessment14
Ecological and Species Responses to Climate Change
Variability in climate impacts and species responses across the landscape makes it difficult to generalize likely species and habitat responses to climatic changes. Species will likely not simply “move upstream or uphill” uniformly throughout their ranges. Further, climate is the combination and interaction of factors, so these changing variables could be expected to result in new combinations of climatic or habitat conditions that may result in species expanding or contracting their ranges in unexpected ways. Other important factors such as vegetation structure, landscape characteristics, topography, soil and other factors play an important role in species distribution, and they likely will not change as rapidly as climate. This will further dictate the success or failure of species in specific localities on the landscape. For example, while climate factors may increase the probability of
occurrence for bobwhite quail in an area, the species’ response is more likely to be influenced by habitat conditions on the ground. If landscapes are not managed to provide suitable nesting, brood-rearing, and escape cover, it is unlikely quail populations will be able to increase their populations or expand their distribution regardless of how favorable the climate becomes. Conversely, using proven habitat management strategies that can help address climate impacts, wildlife managers may be able to help species, such as quail, withstand inhospitable conditions for a longer period of time.
For the species assessed, some change in distribution was found as a result of changing climate variables, although some will likely experience much greater shifts across the landscape than others. The models demonstrate the likelihood or probability of each species finding favorable climatic conditions on the landscape under lower and higher greenhouse gas scenarios at mid and late century. Some species, such as red
Figure 3.Graph showing the modeled change in the mean number of cooling degree days per year under the higher (A1Fi) through time.
Virginia’s Climate Modeling and Species Vulnerability Assessment 15
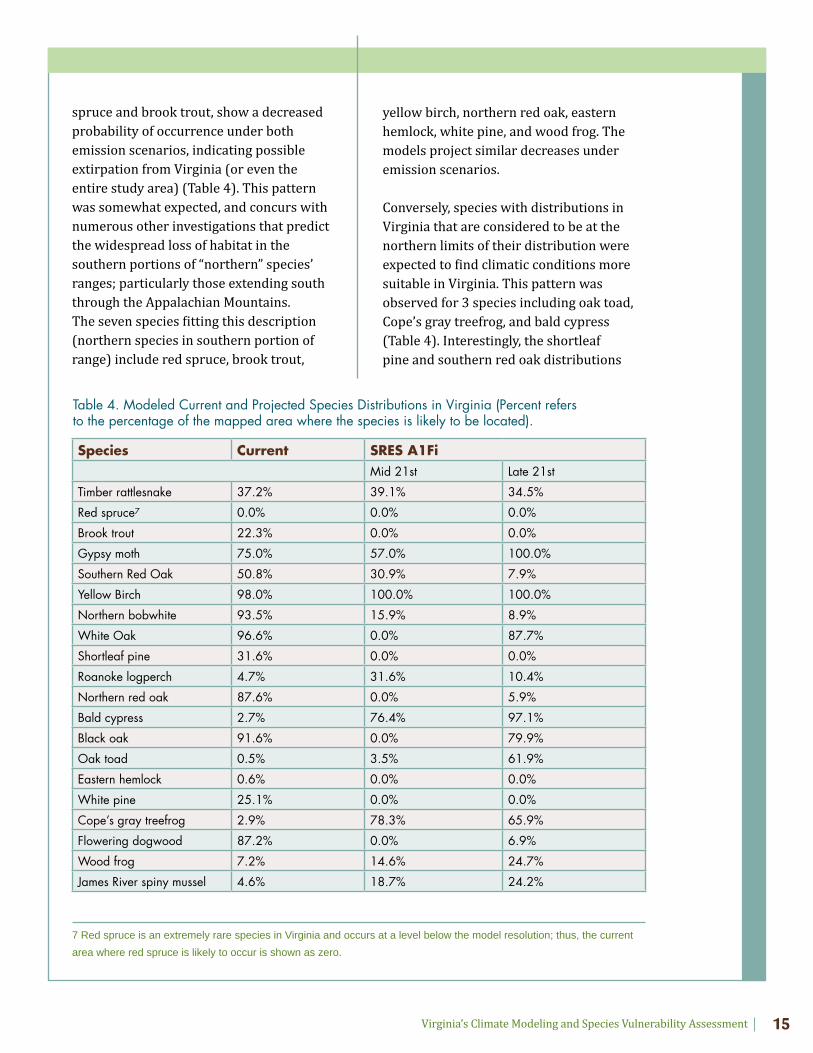
spruce and brook trout, show a decreased probability of occurrence under both emission scenarios, indicating possible extirpation from Virginia (or even the entire study area) (Table 4). This pattern was somewhat expected, and concurs with numerous other investigations that predict the widespread loss of habitat in the southern portions of “northern” species’ ranges; particularly those extending south through the Appalachian Mountains. The seven species fitting this description (northern species in southern portion of range) include red spruce, brook trout,
yellow birch, northern red oak, eastern hemlock, white pine, and wood frog. The models project similar decreases under emission scenarios.
Conversely, species with distributions in Virginia that are considered to be at the northern limits of their distribution were expected to find climatic conditions more suitable in Virginia. This pattern was observed for 3 species including oak toad, Cope’s gray treefrog, and bald cypress (Table 4). Interestingly, the shortleaf pine and southern red oak distributions
Species Current SRES A1FiMid 21st Late 21st
Timber rattlesnake 37.2% 39.1% 34.5%
Red spruce7 0.0% 0.0% 0.0%
Brook trout 22.3% 0.0% 0.0%
Gypsy moth 75.0% 57.0% 100.0%
Southern Red Oak 50.8% 30.9% 7.9%
Yellow Birch 98.0% 100.0% 100.0%
Northern bobwhite 93.5% 15.9% 8.9%
White Oak 96.6% 0.0% 87.7%
Shortleaf pine 31.6% 0.0% 0.0%
Roanoke logperch 4.7% 31.6% 10.4%
Northern red oak 87.6% 0.0% 5.9%
Bald cypress 2.7% 76.4% 97.1%
Black oak 91.6% 0.0% 79.9%
Oak toad 0.5% 3.5% 61.9%
Eastern hemlock 0.6% 0.0% 0.0%
White pine 25.1% 0.0% 0.0%
Cope’s gray treefrog 2.9% 78.3% 65.9%
Flowering dogwood 87.2% 0.0% 6.9%
Wood frog 7.2% 14.6% 24.7%
James River spiny mussel 4.6% 18.7% 24.2%
Table 4. Modeled Current and Projected Species Distributions in Virginia (Percent refers to the percentage of the mapped area where the species is likely to be located).
7 Red spruce is an extremely rare species in Virginia and occurs at a level below the model resolution; thus, the current area where red spruce is likely to occur is shown as zero.
Virginia’s Climate Modeling and Species Vulnerability AssessmentVirginia’s Climate Modeling and Species Vulnerability Assessment16
actually decreased in terms of having a high probability of occurrence in Virginia. However, their ranges do expand northward and westward but at a low probability of occurring in the state.
The remaining nine species modeled could be considered to be within the heart of their geographic range in Virginia. The results for these species are a mix of expected and unexpected results, but they clearly show how complex climate changes will likely be for species in Virginia (Table 4). For example, the model for timber rattlesnake indicates that while some changes in distribution will occur, the overall proportion of the landscape categorized as high probability will remain the same through all climate scenarios and time periods. Even when areas within the highest probability of occurrence (e.g., the Shenandoah Valley), it is likely that other stressors such as land use and proximity to human development will have a greater impact on timber rattlesnakes than the climate changes will (if they have not already done so). Another example would be the Roanoke logperch, a species that may actually expand its range in Virginia
under these climate change scenarios; however, this species requires clean silt-free substrates to succeed and could only expand within rivers that are unobstructed by dams or other structures.
Species Assessment Summaries
Using the species projections and climate data, VDGIF and NWF summarized the impacts to the species analyzed for this project (or groups of species) and considerations/ concerns that arise as a result of the climate change vulnerability assessment. Identifying these considerations helped guide development of management implications in the following section.
Forest Habitat
Approximately 61 percent of Virginia is covered by some type of forest and these forest communities provide habitats for hundreds of wildlife species in Virginia (VDGIF, 2005). These forests also help maintain the quality of water in Virginia’s rivers and sequester large amounts of atmospheric carbon. Per the Virginia Department of Forestry, Virginia’s forest resources contribute $27.5 billion annually to Virginia’s economy and support more than 144,000 Virginia jobs (VDOF, 2013).
As with any other taxonomic group, tree distributions are influenced by a variety of factors, including climate conditions, soils, slope, and management efforts. Based on the modeling of the 10 tree species conducted as part of this research, it is likely that changing climatic conditions will impact the variety and density of trees that occur on Virginia’s landscape.
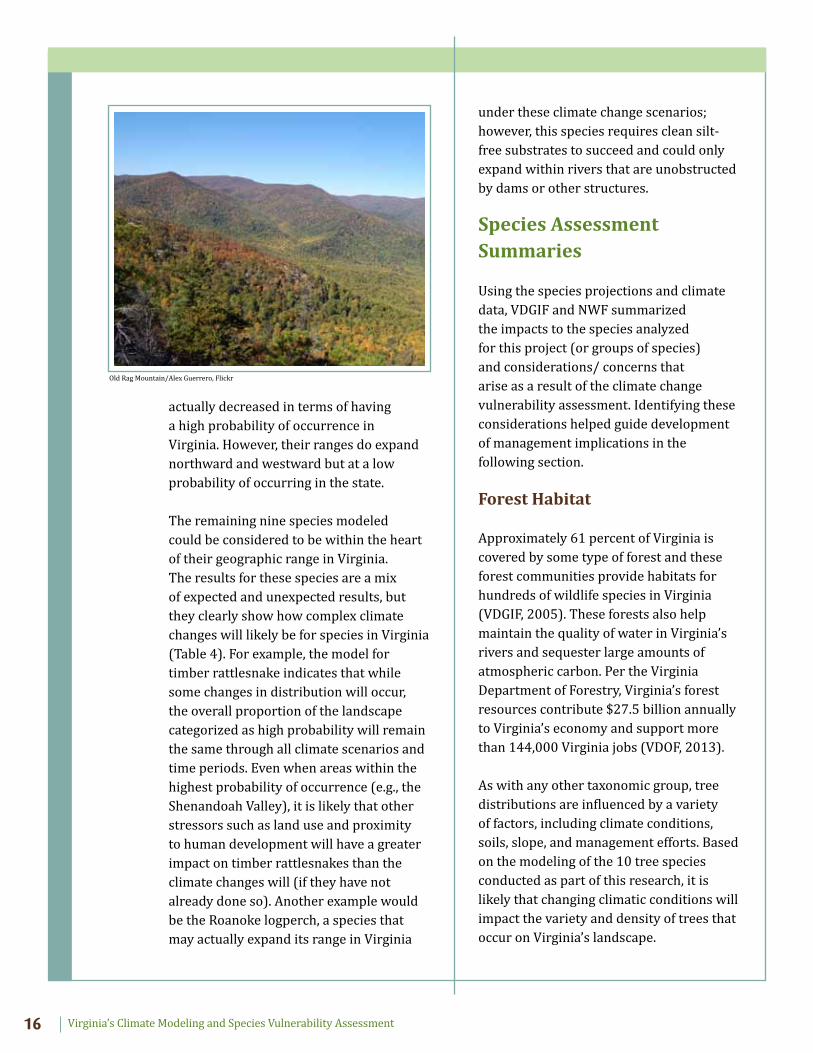
Old Rag Mountain/Alex Guerrero, Flickr
Virginia’s Climate Modeling and Species Vulnerability Assessment 17
Oaks
The Virginia Department of Forestry identifies 14 species of oaks which commonly occur in Virginia (VDOF, 2007). Members of the genus Quercus are mast producing trees that provide food and habitat to many of Virginia’s forest species. These trees are also commercially important and can be used for charcoal, construction timbers, furniture, and wood paneling. Many members of this genus can live for hundreds of years. For some species, Virginia is at the heart of their distribution. For other species, Virginia is a fringe area; either being at the northern or southern extent of their ranges (VDOF, 2007).
As part of the analysis, climatic responses for four members of the oak genus were modeled, including the black oak (Quercus velutina), the northern red oak (Quercus rubra), the southern red oak (Quercus falcatae), and the white oak (Quercus alba). These species are found concurrently in much of Virginia.
Despite their concurrence, these species were found to have different climatic tolerances and will likely respond differently to the project climate changes. For example, under the higher emissionsscenario (A1Fi), the models indicate the majority of Virginia will be less suitable, climatically, for northern red oaks by mid-century (maps on page 29). Conversely, under this higher emissions scenario, the models also indicate the climate should be more conducive for southern red oaks across a much greater portion of the mid-Atlantic region though they are likely to occur at lower densities as areas within their current range become less climatically
suitable (maps on page 30). The models for black oak and white oak are more complicated than the red oak models (maps on pages 31 and 32). Both black and white oaks currently occur throughout Virginia. Under the A1Fi scenario, the models indicate climatic conditions will become much less suitable for both species by mid-century. Neither is expected to be extirpated, but they could occur at much lower frequency. Surprisingly, the A1Fi models for the late century indicate the climate over much of the study area would return to a state of greater suitability for these species. It is unclear why this change is projected, but a more detailed analysis of the climate data scheduled to begin in the Summer/Fall of 2013 (see Section V) may help illuminate this discussion.
Based on this analysis, it seems reasonable to assume that other oak species in Virginia will respond similarly to this pattern with more northern species declining in distribution and abundance while more southern species will have opportunities to expand their distribution in Virginia. Finally, for other species for which Virginia represents a core portion of their current distribution, we should likely expect climate-related stress by mid-century that could abate a few decades later.
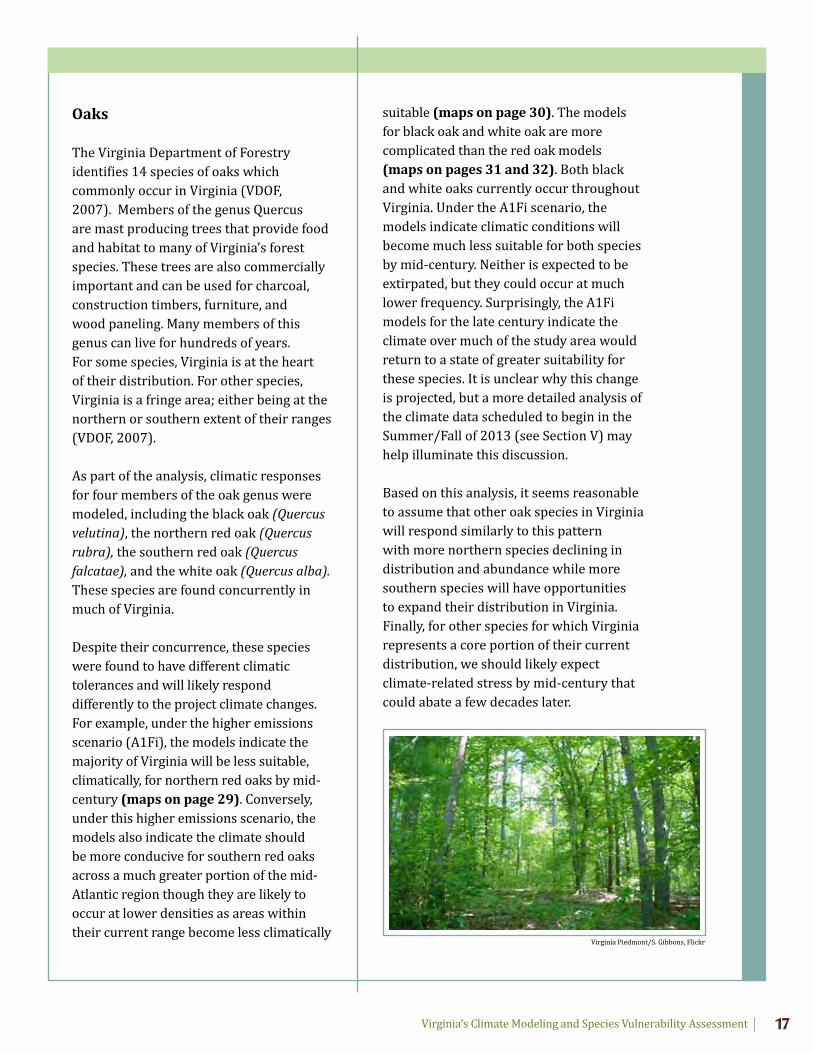
Virginia Piedmont/S. Gibbons, Flickr
Virginia’s Climate Modeling and Species Vulnerability AssessmentVirginia’s Climate Modeling and Species Vulnerability Assessment18
The climate analysis raises a number of questions and concerns regarding the future of oaks in Virginia’s forests and the habitats and economic benefits these trees provide. The most immediate concern relates to how quickly changes in climatic conditions will result in changes in the forest communities. It is unclear if forest changes will be abrupt (occurring with a decade or less) or if they will occur more gradually, over the course of several decades. As proven by their current distribution in Virginia and the frequency with which they occur in forest communities, mature and established oaks have demonstrated an ability to persist through short extreme weather events, such as ice storms, droughts, and hurricanes that currently occur in Virginia. However, it is important to recognize that if these types of extreme events become even more extreme (or frequent) under climate change, beyond the historic range of variability to which species have become adapted, impacts could be significant. Exploring such questions was beyond the scope of this project but would be a valuable research topic.
The oak models also raise other questions. For example, it is unclear from the data, whether a large numbers of mature oaks would die, en masse, or if they would persist for decades and slowly die of stress-related issues, because vulnerabilities will differ not only by tree species but also based on what stage of development of the species and community (Anderson and Palick, 2011). Additionally, species respond differently to stresses, and climate and biological stresses may interact in unpredictable ways to affect individual or stands of trees (Anderson and Palick, 2011). Thus, it is also unclear as to whether
during a protracted period of decline, if stressed trees would be able to fruit and reproduce. Research looking at migration of five species including southern red oak in response to climate change indicates southern red oaks may be able to migrate small distances over a 100 year timeframe, but longer distance migration (over 20 kilometers) will likely be a rare occurrence (Iverson et al., 2004). Finally, it is possible that other species, either native or invasive, might prove better adapted to the changing conditions and preclude the southern red oak from becoming a more prominent component of the Virginia’s forests.
In addition to the commercial impacts to forest products industry, changing forest composition could have significant impacts on a number of important issues including: wildfire, water quality, invasive species, and botanical diseases. There could be secondary impacts to human communities. For example, black bears depend heavily on the fall mast crop (acorns and other forest nuts) to put on weight for the winter. Currently, when mast crops are poor, bears are more likely to forage in town and cities than natural areas. If the number and diversity of mast producing trees change, resulting in smaller and less reliable mast crops, it is reasonable to think the number of human/bear conflicts could increase.
Bald Cypress
Models indicate many new portions of Virginia will become climatically suitable for the bald cypress (Taxodium distichum) (maps on page 33). This species is currently found within Virginia’s coastal plain, south of the James River (VDOF, 2007). It occurs along wet stream banks,

Virginia’s Climate Modeling and Species Vulnerability Assessment 19
bottomlands, swamps, and other areas that usually flood for long periods of time. The Great Dismal Swamp appears to have the highest concentration of this species.
By mid-century, both the lower and higher emissions scenario models project lowlands throughout Virginia could be climatically suitable for bald cypress based on temperature and precipitation related factors; however, bald cypress is sensitive to salinity regimes and inundation, which could not be captured as a part of this analysis. From one perspective, this could be beneficial to Virginia. In other parts of North America, bald cypress is a commercially important species that is used to produce diverse forest products ranging from mulch to timber to roof shingles. Bald cypress trees also provide forage and habitats for a variety of species including Wayne’s black throated green warbler, striped southern chorus frogs, turkeys, waterfowl, many-lined salamanders, bald eagles, mud snakes, ospreys, catfish and rainbow snakes. Bald cypress also helps reduce flooding along rivers (VDGIF 2005 and VDOF, 2007).
Ultimately, the bald cypress presents a complicated scenario that land owners, foresters, and wildlife managers will need to consider carefully. These discussions will need to take into account a number of issues. For example, how quickly could bald cypress expand within Virginia? Would this species be able to migrate across large rivers and highly fragmented landscapes? Would current shoreline or land management efforts preclude the future distribution of bald cypress? Would it be beneficial for human communities to facilitate the spread of cypress into new watersheds?
On the other hand, despite the wildlife benefits this species provides in the Dismal Swamp and other parts of North America, could its expanded distribution have detrimental effects on habitats, cities, and towns in other parts of Virginia? For example, stands of bald cypress are known to “…cause floodwaters to spread out, slow down, and infiltrate the soil” (USDA 1990a), but it is unclear how large populations of this species might impact local hydrology or storm water management and what those impacts might mean for broader human and natural communities.
Flowering Dogwood
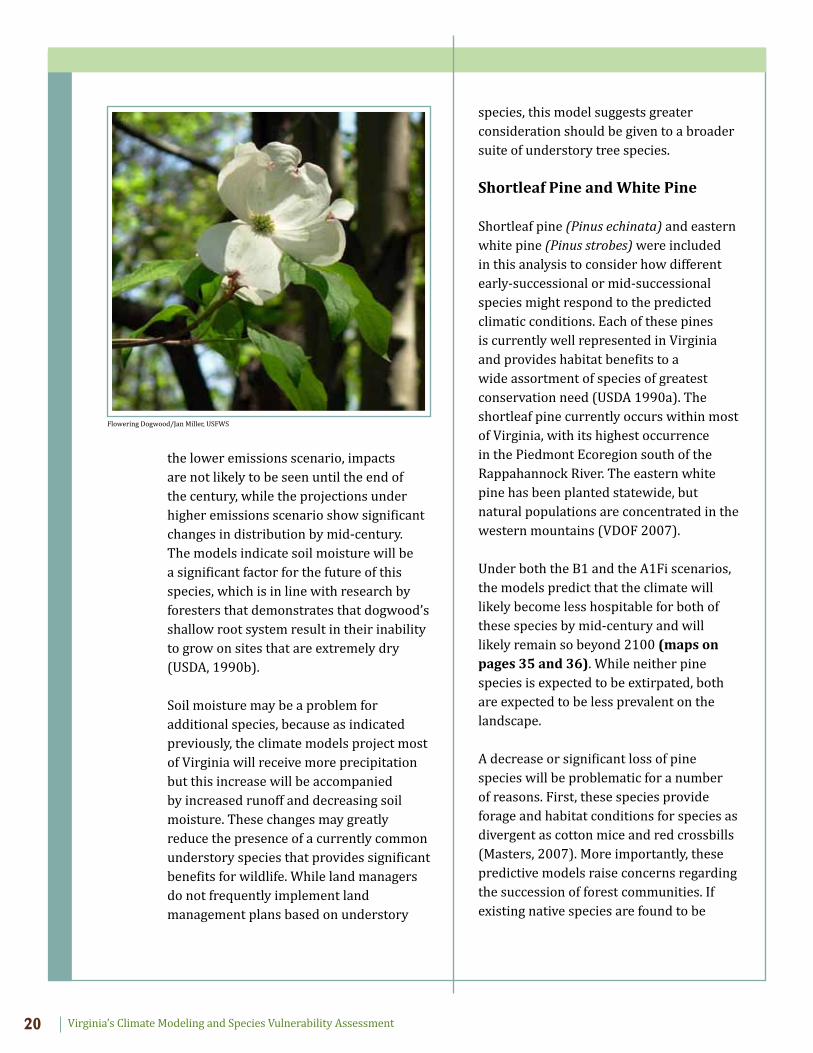
Virginia’s Wildlife Action Plan identifies dozens of SGCN that rely upon healthy understory habitats. Flowering dogwood (Cornus florida) was selected as an assessment species to represent the botanical portion of the understory community as it thrives in a variety of forest types and provides food for dozens of wildlife species (USDA, 1990a). This tree is native to most of the Eastern U.S., is tolerant of a variety of soil conditions, and is considered a popular ornamental tree in throughout the county (USDA, 1990b). Wild populations of flowering dogwood occur in Virginia, and this species has been widely planted as an ornamental species in urban and residential areas (VDOF, 2007).
Models for both the lower and higher emissions scenarios (B1 and A1Fi) project that the climate will become much less suitable for flowering dogwood (maps on page 34). While the models cannot predict the likelihood of extirpation, they do project flowering dogwoods are not likely to occur as frequently as they currently do in Virginia’s forests. Under
Virginia’s Climate Modeling and Species Vulnerability AssessmentVirginia’s Climate Modeling and Species Vulnerability Assessment20
the lower emissions scenario, impacts are not likely to be seen until the end of the century, while the projections under higher emissions scenario show significant changes in distribution by mid-century. The models indicate soil moisture will be a significant factor for the future of this species, which is in line with research by foresters that demonstrates that dogwood’s shallow root system result in their inability to grow on sites that are extremely dry (USDA, 1990b).
Soil moisture may be a problem for additional species, because as indicated previously, the climate models project most of Virginia will receive more precipitation but this increase will be accompanied by increased runoff and decreasing soil moisture. These changes may greatly reduce the presence of a currently common understory species that provides significant benefits for wildlife. While land managers do not frequently implement land management plans based on understory
species, this model suggests greater consideration should be given to a broader suite of understory tree species.
Shortleaf Pine and White Pine
Shortleaf pine (Pinus echinata) and eastern white pine (Pinus strobes) were included in this analysis to consider how different early-successional or mid-successional species might respond to the predicted climatic conditions. Each of these pines is currently well represented in Virginia and provides habitat benefits to a wide assortment of species of greatest conservation need (USDA 1990a). The shortleaf pine currently occurs within most of Virginia, with its highest occurrence in the Piedmont Ecoregion south of the Rappahannock River. The eastern white pine has been planted statewide, but natural populations are concentrated in the western mountains (VDOF 2007).
Under both the B1 and the A1Fi scenarios, the models predict that the climate will likely become less hospitable for both of these species by mid-century and will likely remain so beyond 2100 (maps on pages 35 and 36). While neither pine species is expected to be extirpated, both are expected to be less prevalent on the landscape.
A decrease or significant loss of pine species will be problematic for a number of reasons. First, these species provide forage and habitat conditions for species as divergent as cotton mice and red crossbills (Masters, 2007). More importantly, these predictive models raise concerns regarding the succession of forest communities. If existing native species are found to be
Flowering Dogwood/Jan Miller, USFWS
Virginia’s Climate Modeling and Species Vulnerability Assessment 21
less able to colonize disturbed landscapes due to climatic conditions, an important consideration is what other species might fill that niche and are those other species likely to provide similar conservation value. Fortunately, both the eastern white pine and the shortleaf pine are commercially viable forest species and techniques for their propagation and human- assisted restoration have been developed. However, considering how climate change may affect the efficacy of those techniques and how they may need to change will be important.
Red Spruce
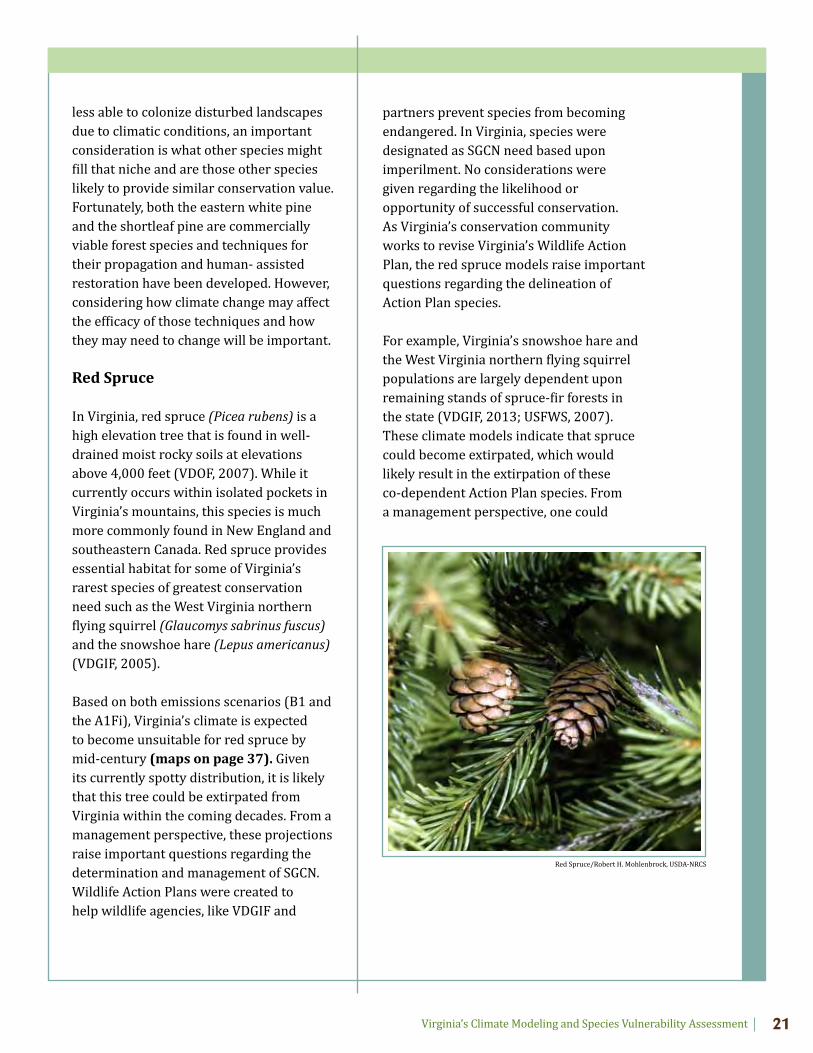
In Virginia, red spruce (Picea rubens) is a high elevation tree that is found in well-drained moist rocky soils at elevations above 4,000 feet (VDOF, 2007). While it currently occurs within isolated pockets in Virginia’s mountains, this species is much more commonly found in New England and southeastern Canada. Red spruce provides essential habitat for some of Virginia’s rarest species of greatest conservation need such as the West Virginia northern flying squirrel (Glaucomys sabrinus fuscus) and the snowshoe hare (Lepus americanus) (VDGIF, 2005).
Based on both emissions scenarios (B1 and the A1Fi), Virginia’s climate is expected to become unsuitable for red spruce by mid-century (maps on page 37). Given its currently spotty distribution, it is likely that this tree could be extirpated from Virginia within the coming decades. From a management perspective, these projections raise important questions regarding the determination and management of SGCN. Wildlife Action Plans were created to help wildlife agencies, like VDGIF and
partners prevent species from becoming endangered. In Virginia, species were designated as SGCN need based upon imperilment. No considerations were given regarding the likelihood or opportunity of successful conservation. As Virginia’s conservation community works to revise Virginia’s Wildlife Action Plan, the red spruce models raise important questions regarding the delineation of Action Plan species.
For example, Virginia’s snowshoe hare and the West Virginia northern flying squirrel populations are largely dependent upon remaining stands of spruce-fir forests in the state (VDGIF, 2013; USFWS, 2007). These climate models indicate that spruce could become extirpated, which would likely result in the extirpation of these co-dependent Action Plan species. From a management perspective, one could
Red Spruce/Robert H. Mohlenbrock, USDA-NRCS
Virginia’s Climate Modeling and Species Vulnerability AssessmentVirginia’s Climate Modeling and Species Vulnerability Assessment22
argue that there is almost no opportunity to conserve spruce and, subsequently, the snowshoe hare or the West Virginia northern flying squirrel in Virginia. Despite their level of imperilment, should these species still be considered to be species of greatest conservation need? Should any resources be allocated to their conservation? Should resources be allocated to other species and habitats with a greater opportunity to persist? These are important questions that Virginia’s conservation community will have to struggle with and resolve during the revision of the Action Plan.
Eastern Hemlock and Yellow Birch
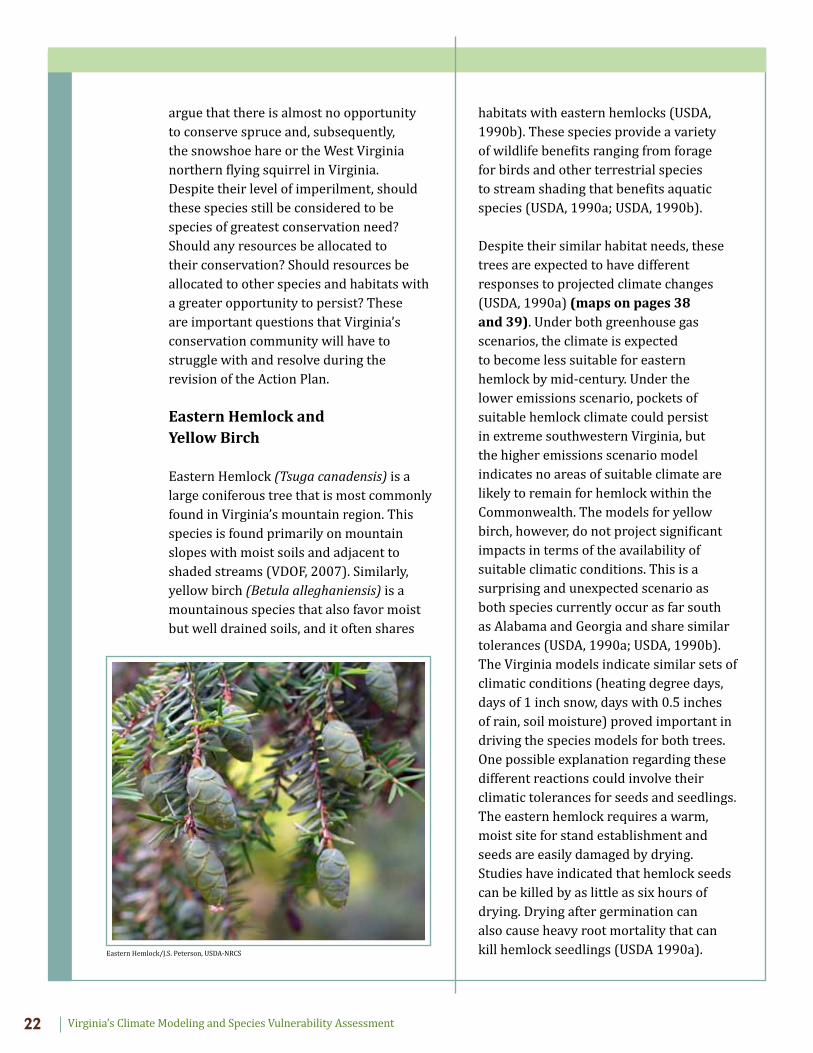
Eastern Hemlock (Tsuga canadensis) is a large coniferous tree that is most commonly found in Virginia’s mountain region. This species is found primarily on mountain slopes with moist soils and adjacent to shaded streams (VDOF, 2007). Similarly, yellow birch (Betula alleghaniensis) is a mountainous species that also favor moist but well drained soils, and it often shares
habitats with eastern hemlocks (USDA, 1990b). These species provide a variety of wildlife benefits ranging from forage for birds and other terrestrial species to stream shading that benefits aquatic species (USDA, 1990a; USDA, 1990b).
Despite their similar habitat needs, these trees are expected to have different responses to projected climate changes (USDA, 1990a) (maps on pages 38 and 39). Under both greenhouse gas scenarios, the climate is expected to become less suitable for eastern hemlock by mid-century. Under the lower emissions scenario, pockets of suitable hemlock climate could persist in extreme southwestern Virginia, but the higher emissions scenario model indicates no areas of suitable climate are likely to remain for hemlock within the Commonwealth. The models for yellow birch, however, do not project significant impacts in terms of the availability of suitable climatic conditions. This is a surprising and unexpected scenario as both species currently occur as far south as Alabama and Georgia and share similar tolerances (USDA, 1990a; USDA, 1990b). The Virginia models indicate similar sets of climatic conditions (heating degree days, days of 1 inch snow, days with 0.5 inches of rain, soil moisture) proved important in driving the species models for both trees. One possible explanation regarding these different reactions could involve their climatic tolerances for seeds and seedlings. The eastern hemlock requires a warm, moist site for stand establishment and seeds are easily damaged by drying. Studies have indicated that hemlock seeds can be killed by as little as six hours of drying. Drying after germination can also cause heavy root mortality that can kill hemlock seedlings (USDA 1990a). Eastern Hemlock/J.S. Peterson, USDA-NRCS
Virginia’s Climate Modeling and Species Vulnerability Assessment 23
In contrast, yellow birch trees have demonstrated an ability to germinate on well drained sites such as skidroads and other disturbed areas (USDA 1990b).
It is currently unclear what these projections might indicate or how they might impact management strategies. It is possible these potential distribution changes could signify a fundamental change in mountain forest communities where sympatric species cease to be associated within a landscape. It is also unclear what these predictions might mean for managers. For example, in Virginia’s mountains, trees help maintain coldwater habitats by shading the water from direct sunlight. As forest communities change, riparian management may become even more critical to brook trout conservation (see Brook Trout). Perhaps these findings indicate yellow birch would be a more suitable species for planting. However, given that the eastern hemlock currently occurs in parts of Georgia and Alabama, it may be possible for managers to overcome the impacts of climate change by propagating trees and maintaining them in suitable microhabitats within the landscape.
Aquatic Species
Approximately 60 percent of SGCN identified within Virginia’s Wildlife Action Plan are aquatic. These include almost half of Virginia’s fish species and over 80 percent of Virginia’s freshwater mussels. Recognizing this, it was important to include aquatic species as targets of the vulnerability assessment. Three important aquatic faunal communities are represented in the assessment: brook trout (Salvelinus fontinalis), a coldwater game fish; the Roanoke logperch (Percina rex)
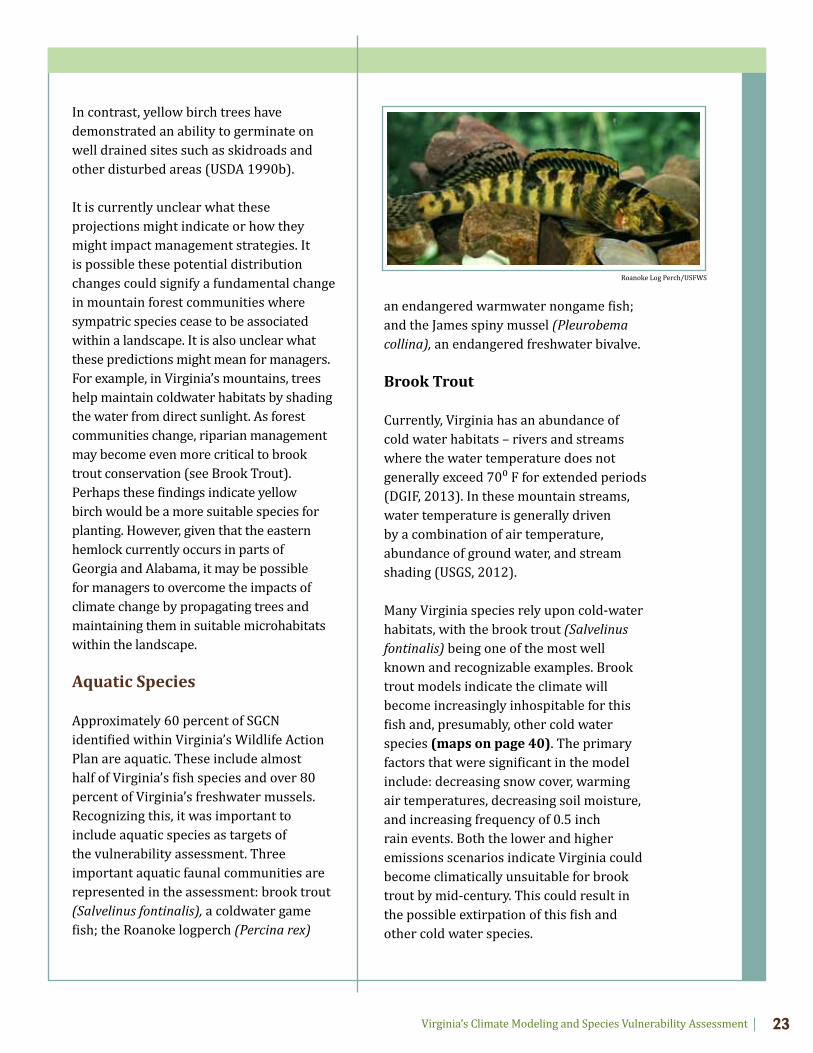
an endangered warmwater nongame fish; and the James spiny mussel (Pleurobema collina), an endangered freshwater bivalve.
Brook Trout
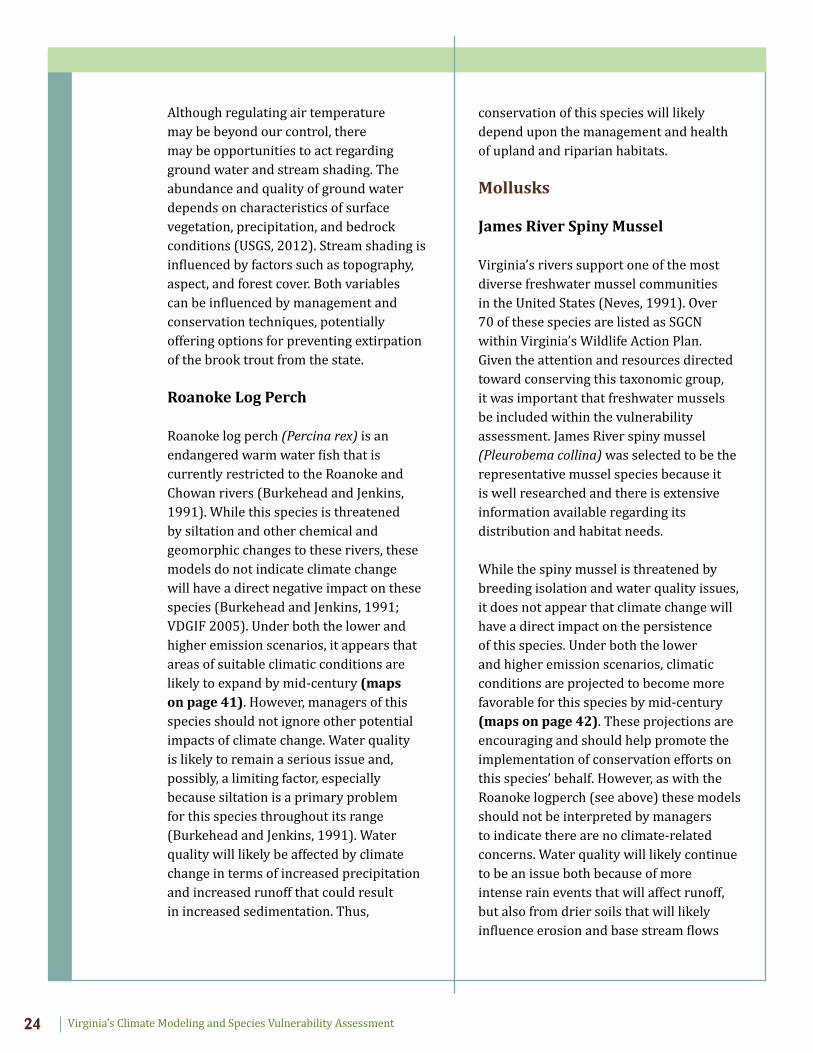
Currently, Virginia has an abundance of cold water habitats – rivers and streams where the water temperature does not generally exceed 70⁰ F for extended periods (DGIF, 2013). In these mountain streams, water temperature is generally driven by a combination of air temperature, abundance of ground water, and stream shading (USGS, 2012).
Many Virginia species rely upon cold-water habitats, with the brook trout (Salvelinus fontinalis) being one of the most well known and recognizable examples. Brook trout models indicate the climate will become increasingly inhospitable for this fish and, presumably, other cold water species (maps on page 40). The primary factors that were significant in the model include: decreasing snow cover, warming air temperatures, decreasing soil moisture, and increasing frequency of 0.5 inch rain events. Both the lower and higher emissions scenarios indicate Virginia could become climatically unsuitable for brook trout by mid-century. This could result in the possible extirpation of this fish and other cold water species.
Roanoke Log Perch/USFWS
Virginia’s Climate Modeling and Species Vulnerability AssessmentVirginia’s Climate Modeling and Species Vulnerability Assessment24
Although regulating air temperature may be beyond our control, there may be opportunities to act regarding ground water and stream shading. The abundance and quality of ground water depends on characteristics of surface vegetation, precipitation, and bedrock conditions (USGS, 2012). Stream shading is influenced by factors such as topography, aspect, and forest cover. Both variables can be influenced by management and conservation techniques, potentially offering options for preventing extirpation of the brook trout from the state.
Roanoke Log Perch
Roanoke log perch (Percina rex) is an endangered warm water fish that is currently restricted to the Roanoke and Chowan rivers (Burkehead and Jenkins, 1991). While this species is threatened by siltation and other chemical and geomorphic changes to these rivers, these models do not indicate climate change will have a direct negative impact on these species (Burkehead and Jenkins, 1991; VDGIF 2005). Under both the lower and higher emission scenarios, it appears that areas of suitable climatic conditions are likely to expand by mid-century (maps on page 41). However, managers of this species should not ignore other potential impacts of climate change. Water quality is likely to remain a serious issue and, possibly, a limiting factor, especially because siltation is a primary problem for this species throughout its range (Burkehead and Jenkins, 1991). Water quality will likely be affected by climate change in terms of increased precipitation and increased runoff that could result in increased sedimentation. Thus,
conservation of this species will likely depend upon the management and health of upland and riparian habitats.
Mollusks
James River Spiny Mussel
Virginia’s rivers support one of the most diverse freshwater mussel communities in the United States (Neves, 1991). Over 70 of these species are listed as SGCN within Virginia’s Wildlife Action Plan. Given the attention and resources directed toward conserving this taxonomic group, it was important that freshwater mussels be included within the vulnerability assessment. James River spiny mussel (Pleurobema collina) was selected to be the representative mussel species because it is well researched and there is extensive information available regarding its distribution and habitat needs.
While the spiny mussel is threatened by breeding isolation and water quality issues, it does not appear that climate change will have a direct impact on the persistence of this species. Under both the lower and higher emission scenarios, climatic conditions are projected to become more favorable for this species by mid-century (maps on page 42). These projections are encouraging and should help promote the implementation of conservation efforts on this species’ behalf. However, as with the Roanoke logperch (see above) these models should not be interpreted by managers to indicate there are no climate-related concerns. Water quality will likely continue to be an issue both because of more intense rain events that will affect runoff, but also from drier soils that will likely influence erosion and base stream flows
Virginia’s Climate Modeling and Species Vulnerability Assessment 25
as temperatures rise, especially in summer months. Because mussels are sedentary and cannot move, they will not be well-suited to respond to these climate-related impacts. As with the Roanoke logperch, conservation of this species will likely depend on the management and health of upland and riparian habitats.
Reptiles
Timber Rattlesnake
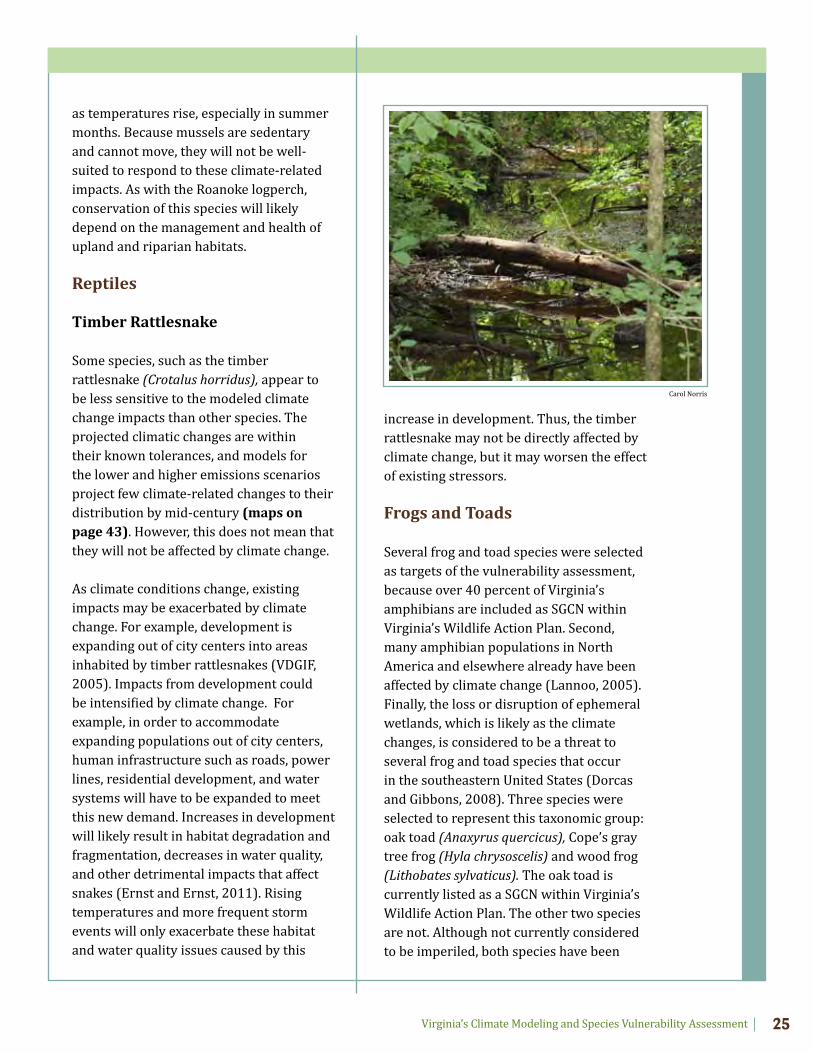
Some species, such as the timber rattlesnake (Crotalus horridus), appear to be less sensitive to the modeled climate change impacts than other species. The projected climatic changes are within their known tolerances, and models for the lower and higher emissions scenarios project few climate-related changes to their distribution by mid-century (maps on page 43). However, this does not mean that they will not be affected by climate change. As climate conditions change, existing impacts may be exacerbated by climate change. For example, development is expanding out of city centers into areas inhabited by timber rattlesnakes (VDGIF, 2005). Impacts from development could be intensified by climate change. For example, in order to accommodate expanding populations out of city centers, human infrastructure such as roads, power lines, residential development, and water systems will have to be expanded to meet this new demand. Increases in development will likely result in habitat degradation and fragmentation, decreases in water quality, and other detrimental impacts that affect snakes (Ernst and Ernst, 2011). Rising temperatures and more frequent storm events will only exacerbate these habitat and water quality issues caused by this
increase in development. Thus, the timber rattlesnake may not be directly affected by climate change, but it may worsen the effect of existing stressors.
Frogs and Toads
Several frog and toad species were selected as targets of the vulnerability assessment, because over 40 percent of Virginia’s amphibians are included as SGCN within Virginia’s Wildlife Action Plan. Second, many amphibian populations in North America and elsewhere already have been affected by climate change (Lannoo, 2005). Finally, the loss or disruption of ephemeral wetlands, which is likely as the climate changes, is considered to be a threat to several frog and toad species that occur in the southeastern United States (Dorcas and Gibbons, 2008). Three species were selected to represent this taxonomic group: oak toad (Anaxyrus quercicus), Cope’s gray tree frog (Hyla chrysoscelis) and wood frog (Lithobates sylvaticus). The oak toad is currently listed as a SGCN within Virginia’s Wildlife Action Plan. The other two species are not. Although not currently considered to be imperiled, both species have been
Carol Norris
Virginia’s Climate Modeling and Species Vulnerability AssessmentVirginia’s Climate Modeling and Species Vulnerability Assessment26
studied and their habitat and climatic tolerances are generally understood. Both are woodland species that depend upon ephemeral wetlands. Given that current models suggest that Virginia’s ephemeral wetlands and woodlands are likely to be affected by changing climatic conditions, the wood frog and Cope’s gray tree frog were included to represent a larger suite of amphibian Action Plan species that could not be included within this analysis due to a lack of distribution or climatic tolerance data.
Oak Toad
The oak toad is the smallest of the true toads in the United States and occupies a variety of woodland habitat types in the southeastern states (Dorcas and Gibbons, 2008). In Virginia, this species is restricted to the coastal plain south of the James River (VDGIF, 1999). The climate models demonstrate a complicated set of projections for this species. Under the lower emissions scenario, by mid-century, the climate is predicted to become more suitable for this species across the coastal plain, into Delmarva Peninsula, and into Delaware (maps on page 44). By late-century, the climate across almost all of Virginia, including the mountains of West
Virginia, would be conducive to this species. The higher emissions scenario model is more problematic as it indicates the climate will become almost entirely unsuitable within this species’ current range by mid-century. Then, as with the lower emissions scenario model, the climate is predicted to be suitable across almost all of the state.
Cope’s Gray Tree Frog
The Cope’s gray tree frog occupies habitats across much of the eastern United States. In Virginia, this species is found throughout almost the entire Commonwealth except the Ridge and Valley Ecoregion (VDGIF, 1999). The lower emissions scenario model projects that the climate will remain suitable for this species until mid-century, and by century’s end, the climate will likely become even more conducive for this species (maps on page 45). The higher emissions scenario model results are similar, projecting a climate that is more conducive to this species by mid-century and remaining suitable until the end of the century.
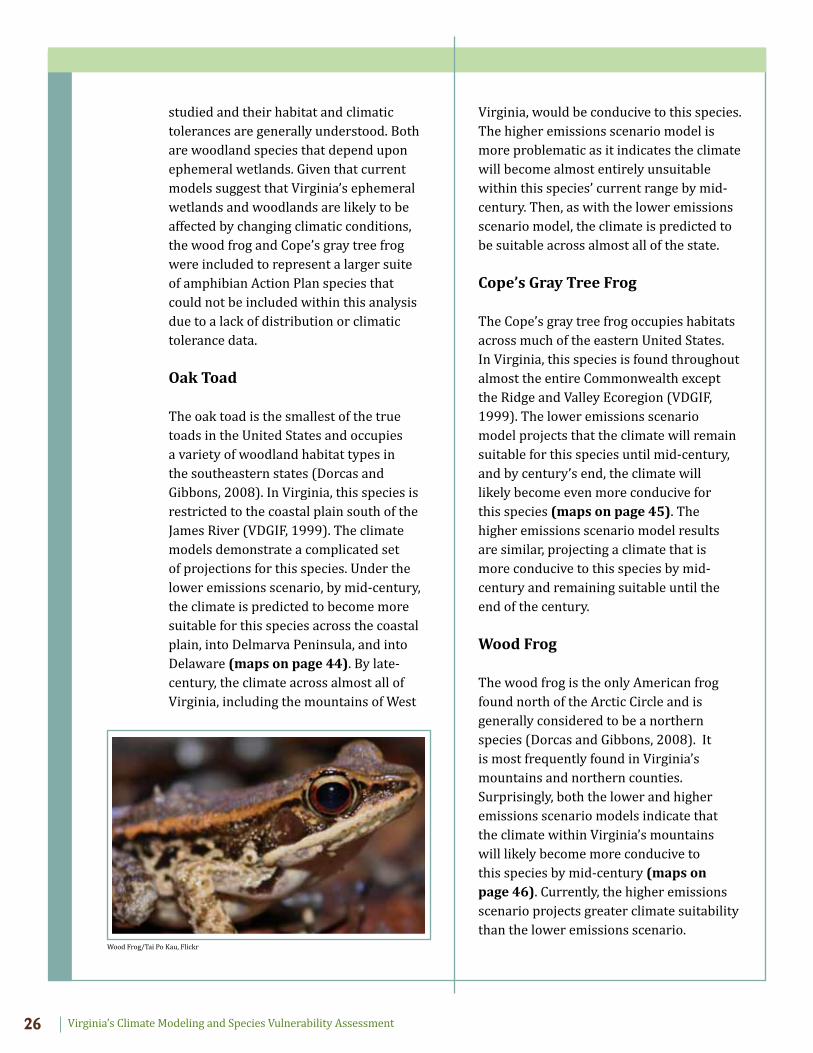
Wood Frog
The wood frog is the only American frog found north of the Arctic Circle and is generally considered to be a northern species (Dorcas and Gibbons, 2008). It is most frequently found in Virginia’s mountains and northern counties. Surprisingly, both the lower and higher emissions scenario models indicate that the climate within Virginia’s mountains will likely become more conducive to this species by mid-century (maps on page 46). Currently, the higher emissions scenario projects greater climate suitability than the lower emissions scenario.
Wood Frog/Tai Po Kau, Flickr
Virginia’s Climate Modeling and Species Vulnerability Assessment 27
These amphibian models should provide some measure of hope for conservationists working to preserve Virginia’s amphibian populations. Previous researchers have indicated, that climate change will convert southeastern forests into, “a dry chaparral-like ecosystem, conditions inconsistent with the life history requirements of the native amphibian assemblage” (Lannoo, 2005). Encouragingly, these climate models, when applied to various tree and amphibian species do not appear to support those earlier projections. However, that does not mean that climate change will not be a factor in future amphibian conservation. For example, many researchers have speculated that changing climatic conditions can influence the spread and persistence of infectious diseases in amphibian populations (Lannoo, 2005).
Due to their reliance on moisture, amphibians have poor dispersal ability compared to other taxonomic groups (Lannoo, 2005). Even if habitat expands for these three species in Virginia, it is unclear if these species will be able to take advantage of those habitat opportunities. Existing human infrastructure often impacts amphibian communities and, even without the impacts of climate change, Virginia’s human population is projected to expand during coming decades (U.S. Census Bureau, 2005).
Birds
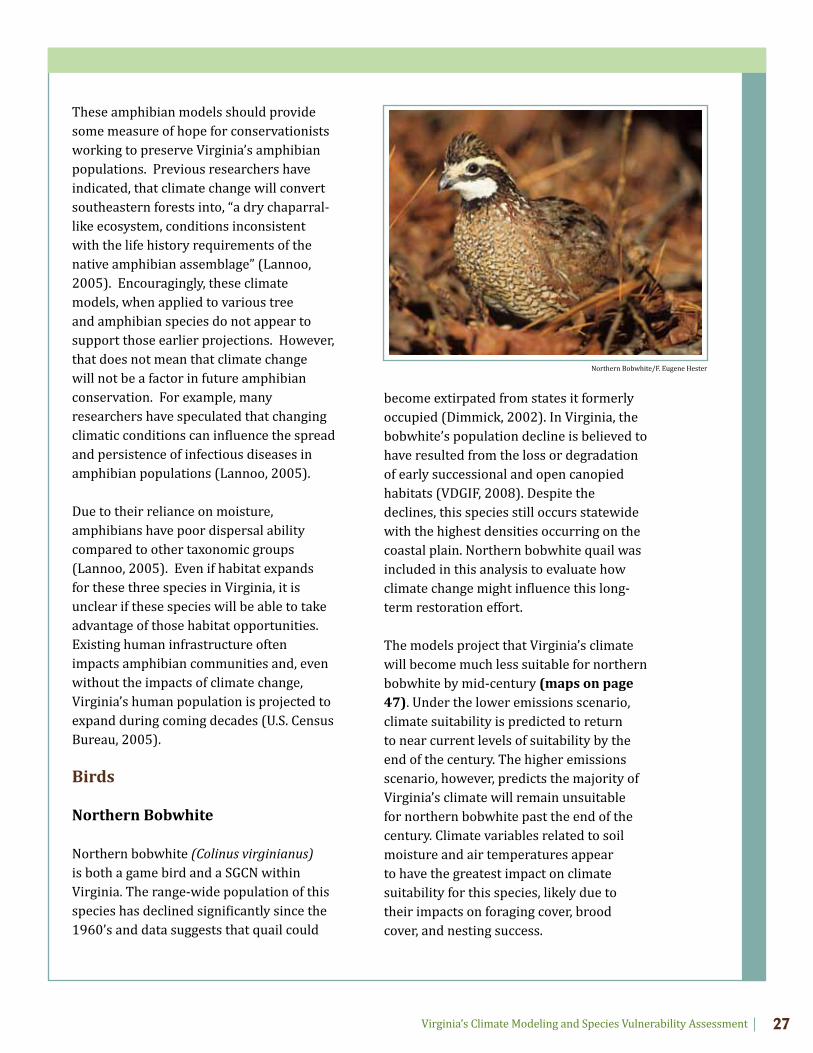
Northern Bobwhite
Northern bobwhite (Colinus virginianus) is both a game bird and a SGCN within Virginia. The range-wide population of this species has declined significantly since the 1960’s and data suggests that quail could
become extirpated from states it formerly occupied (Dimmick, 2002). In Virginia, the bobwhite’s population decline is believed to have resulted from the loss or degradation of early successional and open canopied habitats (VDGIF, 2008). Despite the declines, this species still occurs statewide with the highest densities occurring on the coastal plain. Northern bobwhite quail was included in this analysis to evaluate how climate change might influence this long-term restoration effort.
The models project that Virginia’s climate will become much less suitable for northern bobwhite by mid-century (maps on page 47). Under the lower emissions scenario, climate suitability is predicted to return to near current levels of suitability by the end of the century. The higher emissions scenario, however, predicts the majority of Virginia’s climate will remain unsuitable for northern bobwhite past the end of the century. Climate variables related to soil moisture and air temperatures appear to have the greatest impact on climate suitability for this species, likely due to their impacts on foraging cover, brood cover, and nesting success.
Northern Bobwhite/F. Eugene Hester
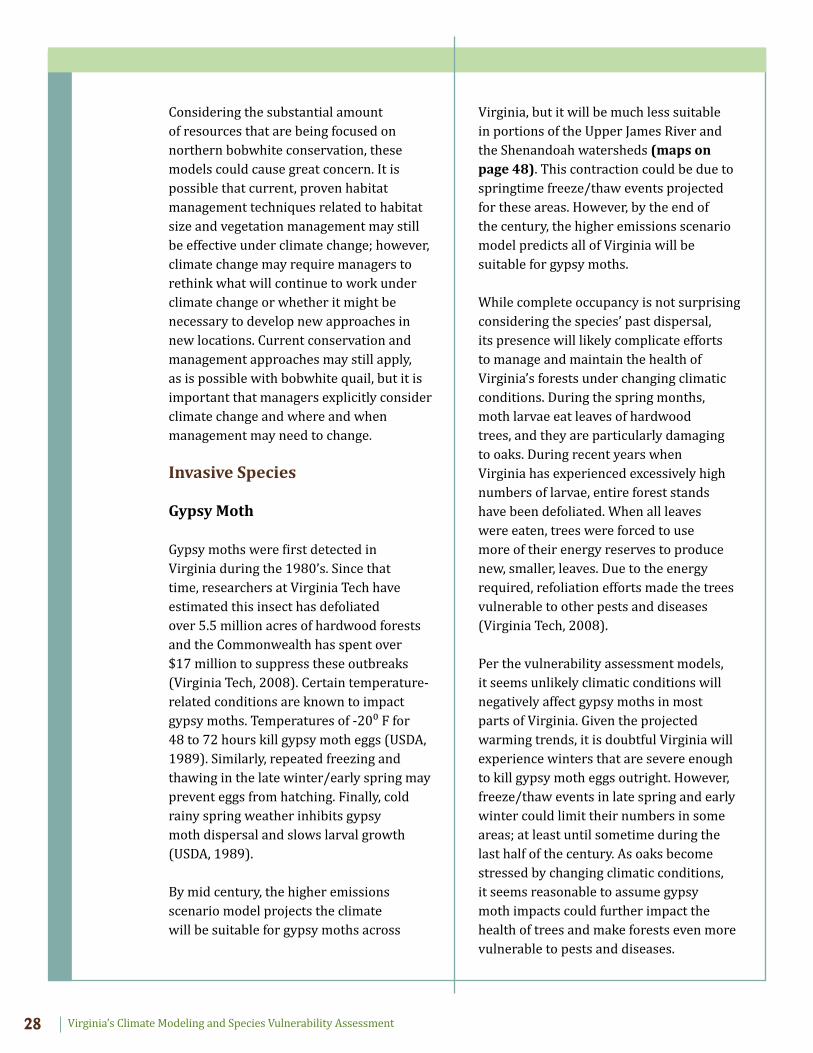
Virginia’s Climate Modeling and Species Vulnerability AssessmentVirginia’s Climate Modeling and Species Vulnerability Assessment28
Considering the substantial amount of resources that are being focused on northern bobwhite conservation, these models could cause great concern. It is possible that current, proven habitat management techniques related to habitat size and vegetation management may still be effective under climate change; however, climate change may require managers to rethink what will continue to work under climate change or whether it might be necessary to develop new approaches in new locations. Current conservation and management approaches may still apply, as is possible with bobwhite quail, but it is important that managers explicitly consider climate change and where and when management may need to change.
Invasive Species
Gypsy Moth
Gypsy moths were first detected in Virginia during the 1980’s. Since that time, researchers at Virginia Tech have estimated this insect has defoliated over 5.5 million acres of hardwood forests and the Commonwealth has spent over $17 million to suppress these outbreaks (Virginia Tech, 2008). Certain temperature-related conditions are known to impact gypsy moths. Temperatures of -20⁰ F for 48 to 72 hours kill gypsy moth eggs (USDA, 1989). Similarly, repeated freezing and thawing in the late winter/early spring may prevent eggs from hatching. Finally, cold rainy spring weather inhibits gypsy moth dispersal and slows larval growth (USDA, 1989).
By mid century, the higher emissions scenario model projects the climate will be suitable for gypsy moths across
Virginia, but it will be much less suitable in portions of the Upper James River and the Shenandoah watersheds (maps on page 48). This contraction could be due to springtime freeze/thaw events projected for these areas. However, by the end of the century, the higher emissions scenario model predicts all of Virginia will be suitable for gypsy moths.
While complete occupancy is not surprising considering the species’ past dispersal, its presence will likely complicate efforts to manage and maintain the health of Virginia’s forests under changing climatic conditions. During the spring months, moth larvae eat leaves of hardwood trees, and they are particularly damaging to oaks. During recent years when Virginia has experienced excessively high numbers of larvae, entire forest stands have been defoliated. When all leaves were eaten, trees were forced to use more of their energy reserves to produce new, smaller, leaves. Due to the energy required, refoliation efforts made the trees vulnerable to other pests and diseases (Virginia Tech, 2008).
Per the vulnerability assessment models, it seems unlikely climatic conditions will negatively affect gypsy moths in most parts of Virginia. Given the projected warming trends, it is doubtful Virginia will experience winters that are severe enough to kill gypsy moth eggs outright. However, freeze/thaw events in late spring and early winter could limit their numbers in some areas; at least until sometime during the last half of the century. As oaks become stressed by changing climatic conditions, it seems reasonable to assume gypsy moth impacts could further impact the health of trees and make forests even more vulnerable to pests and diseases.

Virginia’s Climate Modeling and Species Vulnerability Assessment 29
Northern Red Oak: Current Modeled Probability
Northern Red Oak: B1 Mid 21st Century Northern Red Oak: B1 Late 21st Century
Northern Red Oak: A1Fi Mid 21st Century Northern Red Oak: A1Fi Late 21st Century
Northern Red Oak
Species Maps: Projected Distribution Changes under Climate Change
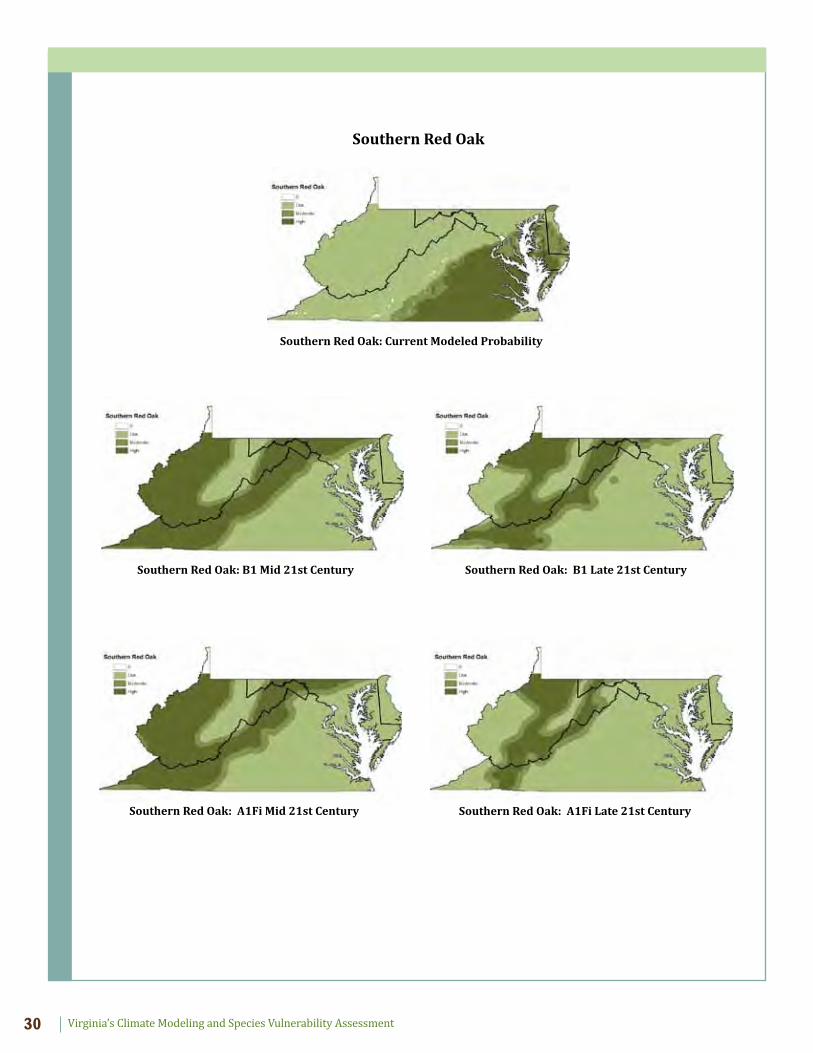
Virginia’s Climate Modeling and Species Vulnerability AssessmentVirginia’s Climate Modeling and Species Vulnerability Assessment30
Southern Red Oak: Current Modeled Probability
Southern Red Oak: B1 Mid 21st Century Southern Red Oak: B1 Late 21st Century
Southern Red Oak: A1Fi Mid 21st Century Southern Red Oak: A1Fi Late 21st Century
Southern Red Oak
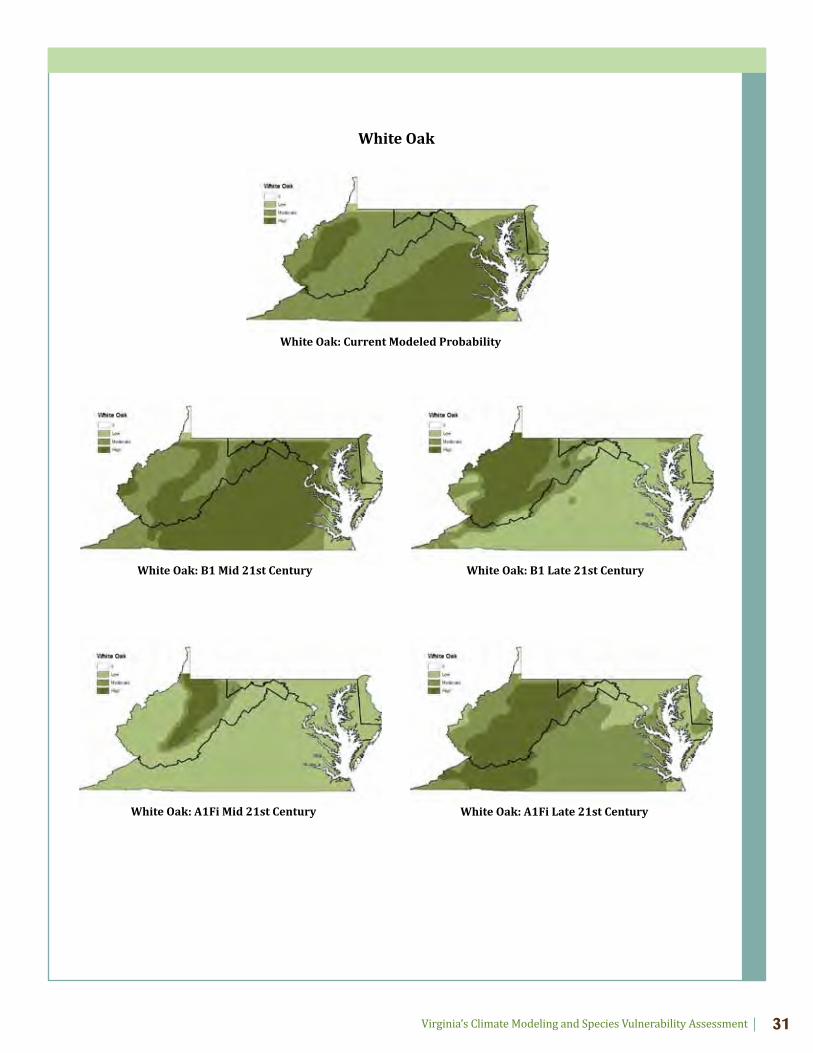
Virginia’s Climate Modeling and Species Vulnerability Assessment 31
White Oak: Current Modeled Probability
White Oak: B1 Mid 21st Century White Oak: B1 Late 21st Century
White Oak: A1Fi Mid 21st Century White Oak: A1Fi Late 21st Century
White Oak
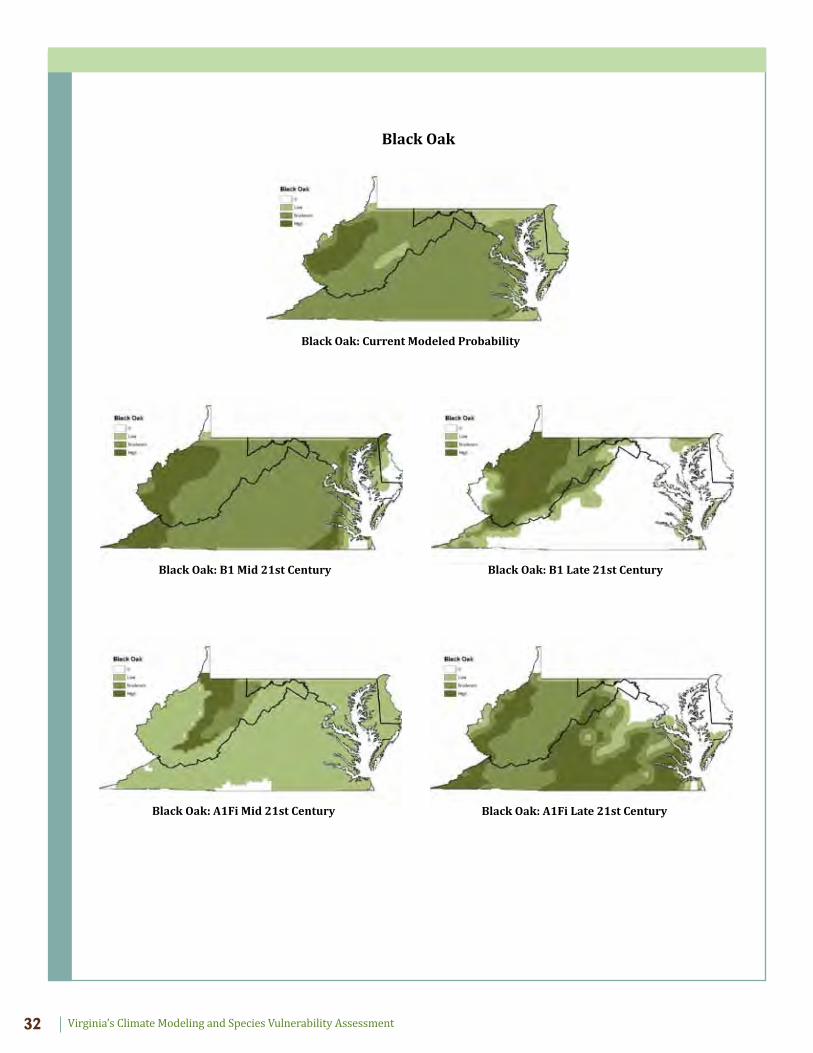
Virginia’s Climate Modeling and Species Vulnerability AssessmentVirginia’s Climate Modeling and Species Vulnerability Assessment32
Black Oak: Current Modeled Probability
Black Oak: B1 Mid 21st Century Black Oak: B1 Late 21st Century
Black Oak: A1Fi Mid 21st Century Black Oak: A1Fi Late 21st Century
Black Oak
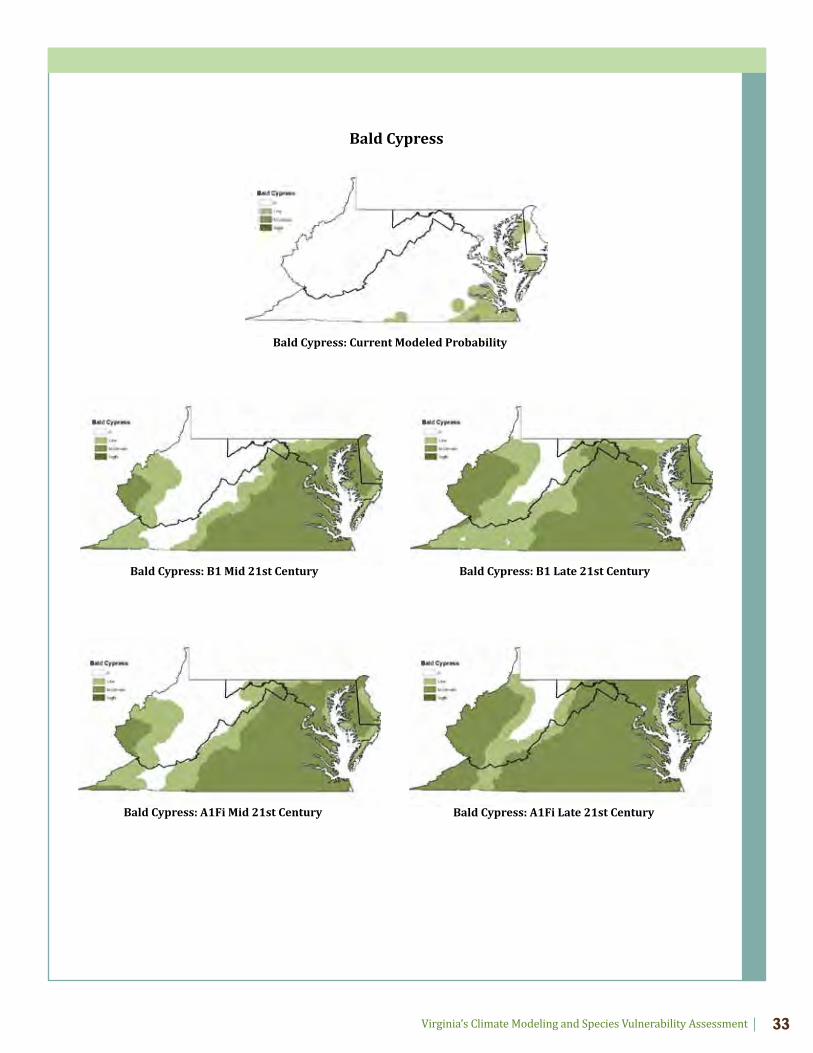
Virginia’s Climate Modeling and Species Vulnerability Assessment 33
Bald Cypress: Current Modeled Probability
Bald Cypress: B1 Mid 21st Century Bald Cypress: B1 Late 21st Century
Bald Cypress: A1Fi Mid 21st Century Bald Cypress: A1Fi Late 21st Century
Bald Cypress
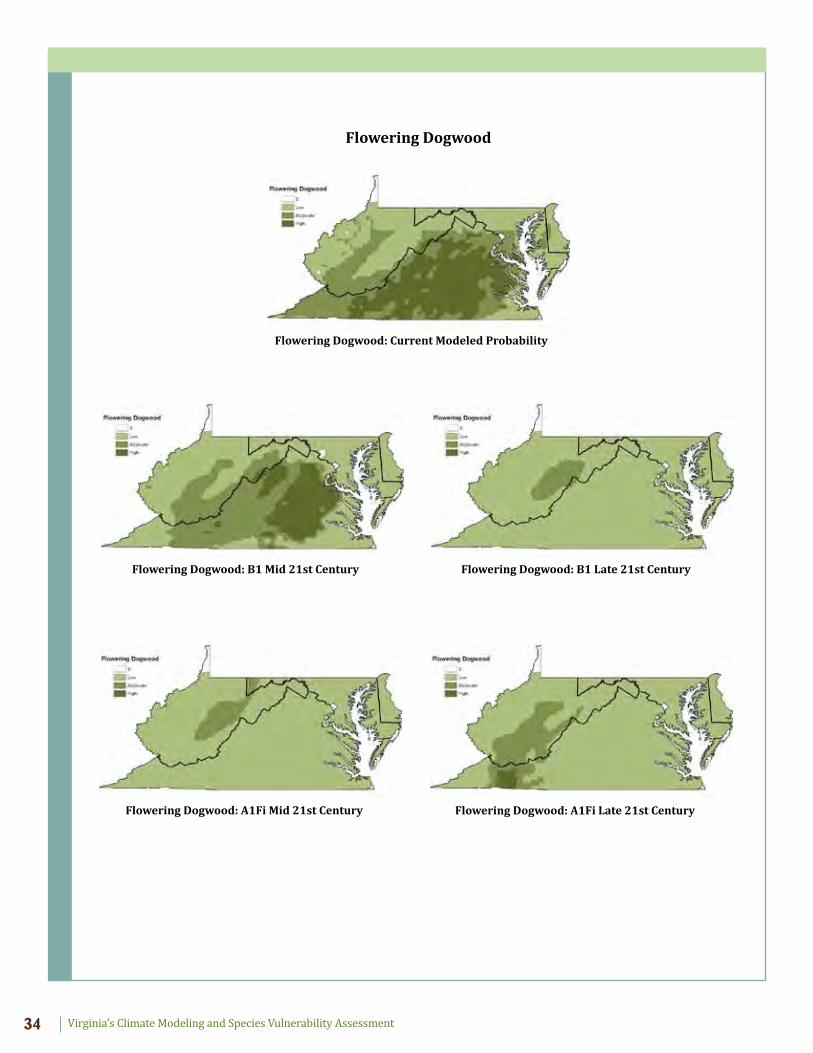
Virginia’s Climate Modeling and Species Vulnerability AssessmentVirginia’s Climate Modeling and Species Vulnerability Assessment34
Flowering Dogwood: Current Modeled Probability
Flowering Dogwood: B1 Mid 21st Century Flowering Dogwood: B1 Late 21st Century
Flowering Dogwood: A1Fi Mid 21st Century Flowering Dogwood: A1Fi Late 21st Century
Flowering Dogwood
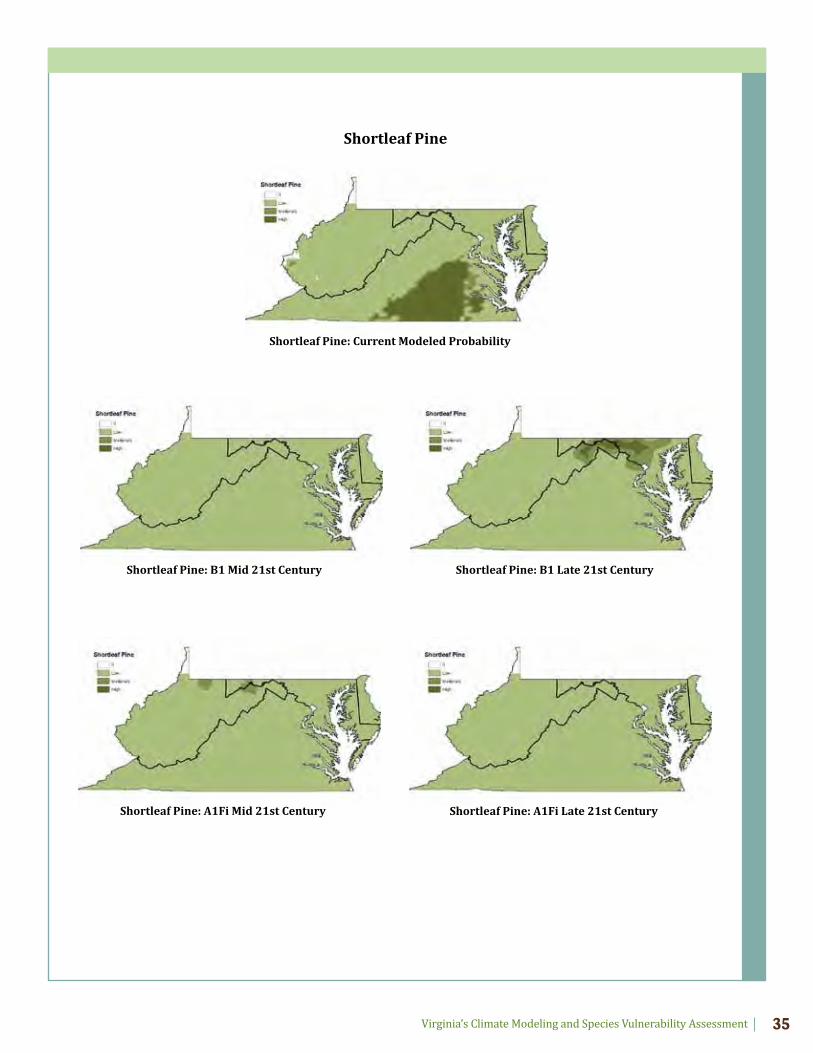
Virginia’s Climate Modeling and Species Vulnerability Assessment 35
Shortleaf Pine: Current Modeled Probability
Shortleaf Pine: B1 Mid 21st Century Shortleaf Pine: B1 Late 21st Century
Shortleaf Pine: A1Fi Mid 21st Century Shortleaf Pine: A1Fi Late 21st Century
Shortleaf Pine
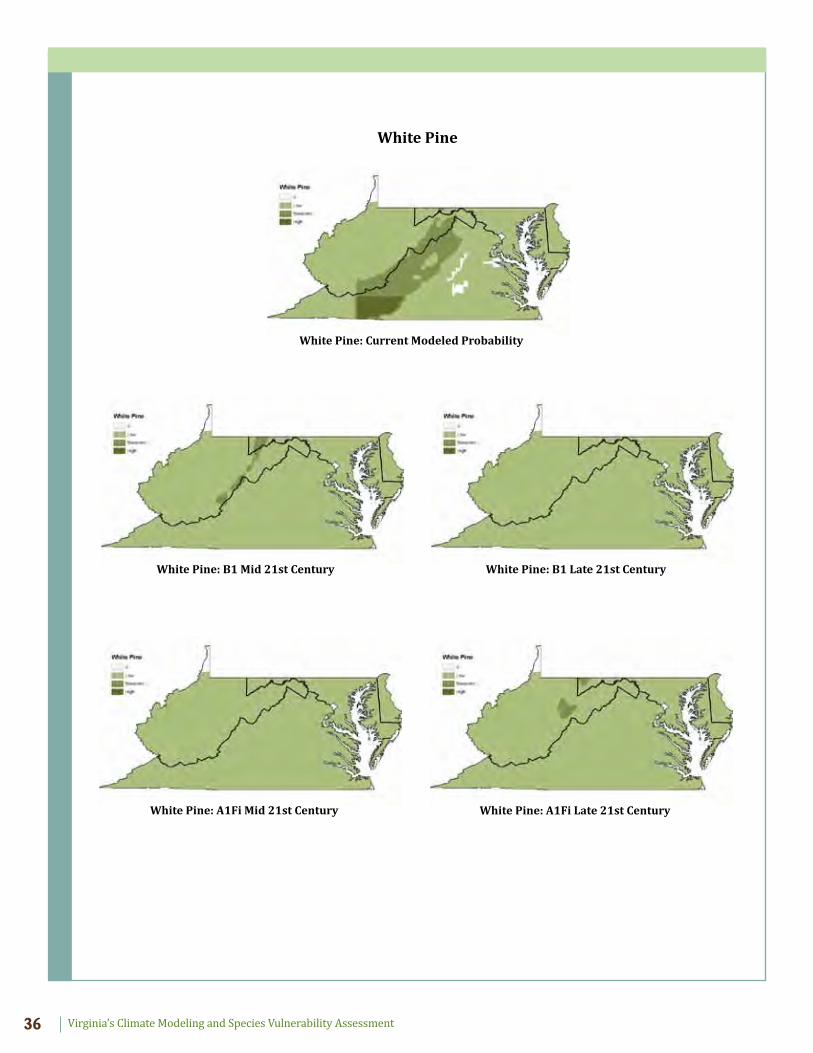
Virginia’s Climate Modeling and Species Vulnerability AssessmentVirginia’s Climate Modeling and Species Vulnerability Assessment36
White Pine: Current Modeled Probability
White Pine: B1 Mid 21st Century White Pine: B1 Late 21st Century
White Pine: A1Fi Mid 21st Century White Pine: A1Fi Late 21st Century
White Pine

Virginia’s Climate Modeling and Species Vulnerability Assessment 37
Red Spruce: Current Modeled Probability
Red Spruce: B1 Mid 21st Century Red Spruce: B1 Late 21st Century
Red Spruce: A1Fi Mid 21st Century Red Spruce: A1Fi Late 21st Century
Red Spruce
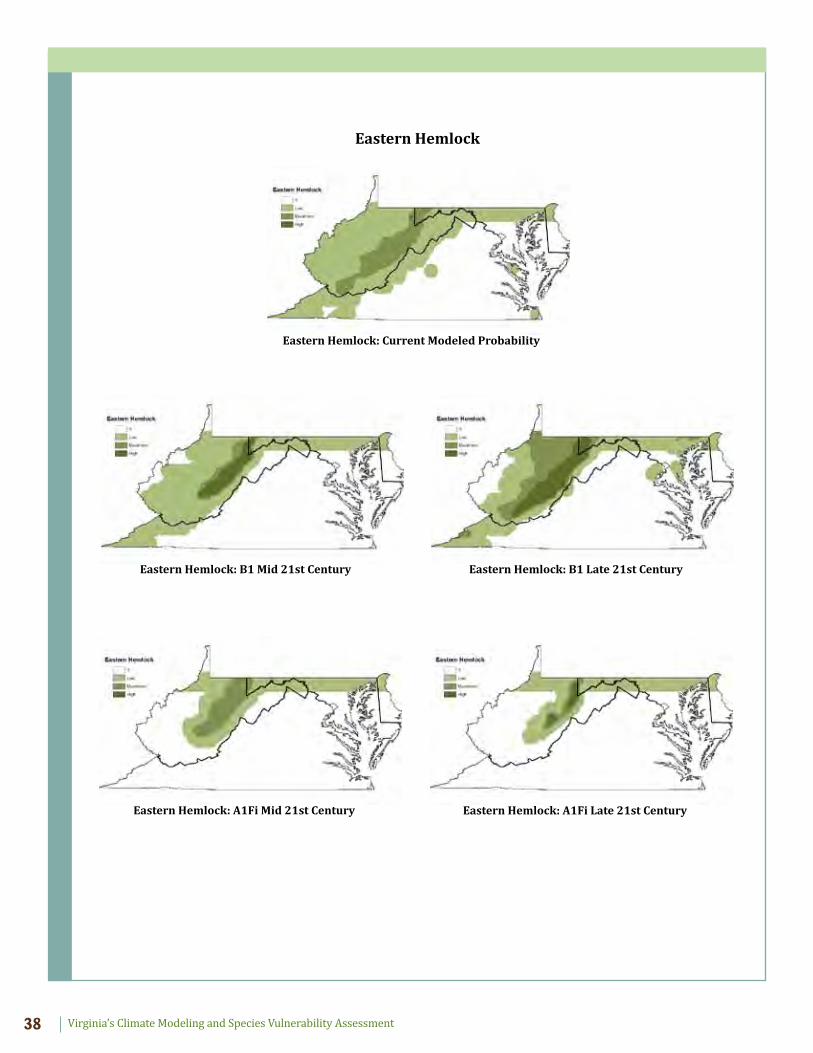
Virginia’s Climate Modeling and Species Vulnerability AssessmentVirginia’s Climate Modeling and Species Vulnerability Assessment38
Eastern Hemlock: Current Modeled Probability
Eastern Hemlock: B1 Mid 21st Century Eastern Hemlock: B1 Late 21st Century
Eastern Hemlock: A1Fi Mid 21st Century Eastern Hemlock: A1Fi Late 21st Century
Eastern Hemlock
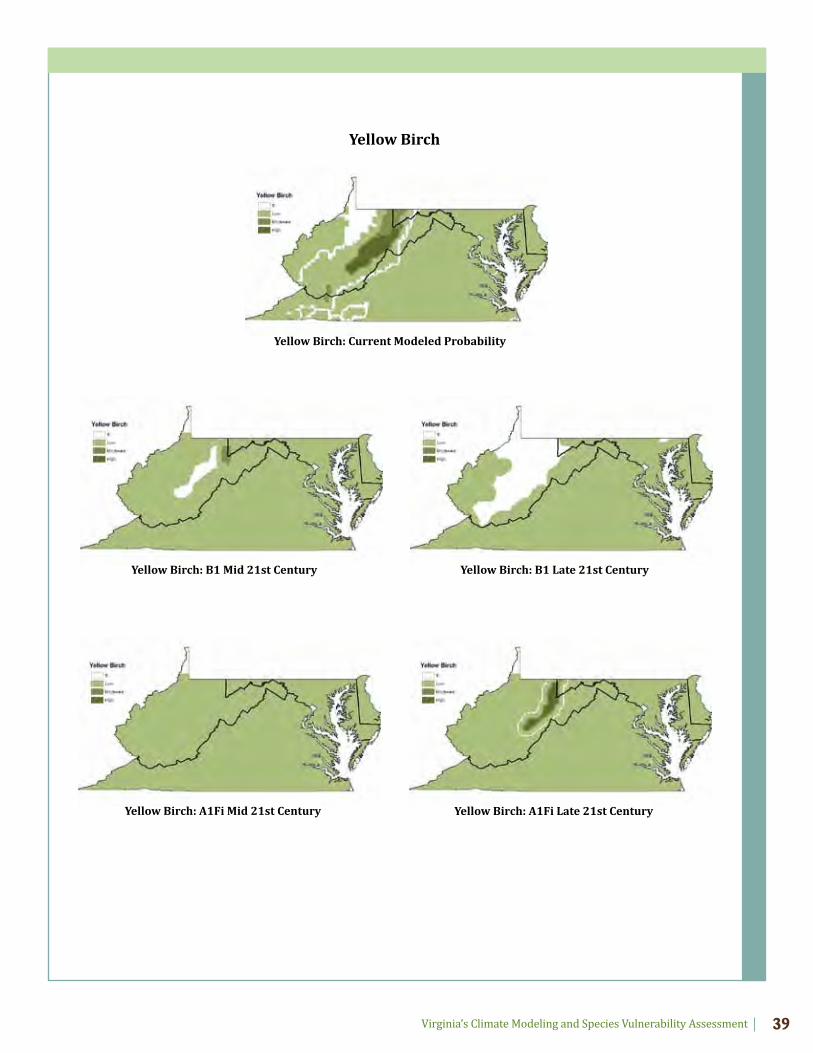
Virginia’s Climate Modeling and Species Vulnerability Assessment 39
Yellow Birch: Current Modeled Probability
Yellow Birch: B1 Mid 21st Century Yellow Birch: B1 Late 21st Century
Yellow Birch: A1Fi Mid 21st Century Yellow Birch: A1Fi Late 21st Century
Yellow Birch
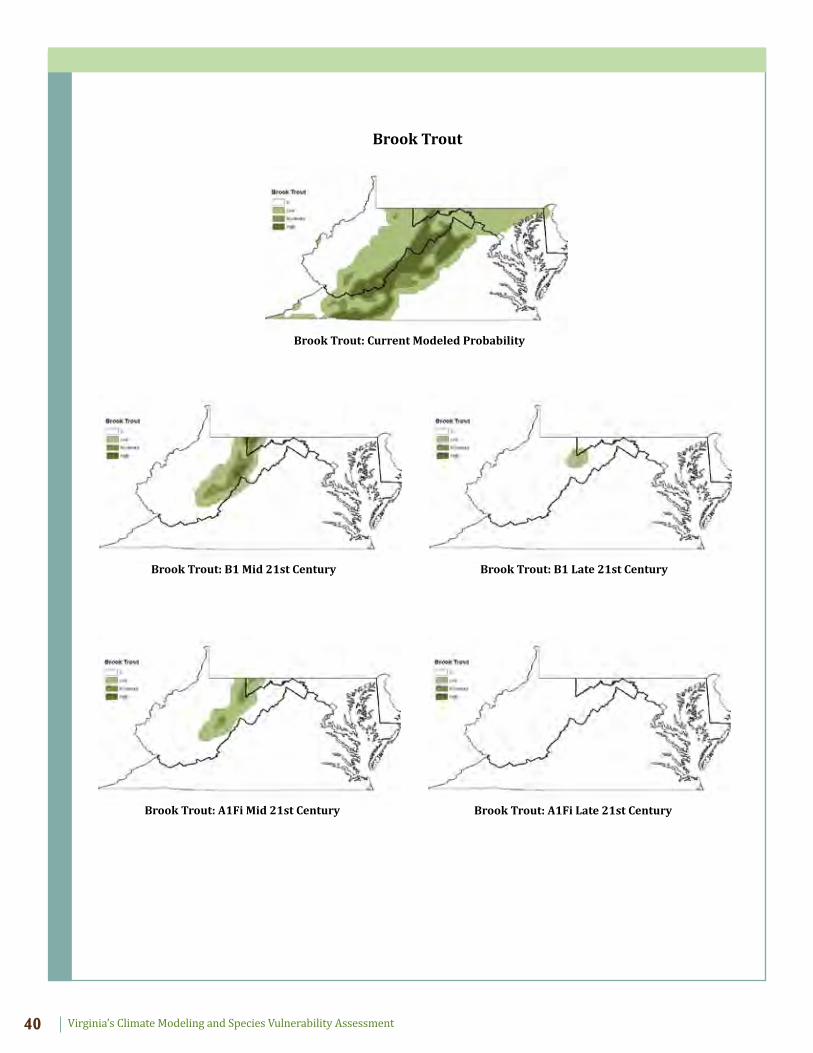
Virginia’s Climate Modeling and Species Vulnerability AssessmentVirginia’s Climate Modeling and Species Vulnerability Assessment40
Brook Trout: Current Modeled Probability
Brook Trout: B1 Mid 21st Century Brook Trout: B1 Late 21st Century
Brook Trout: A1Fi Mid 21st Century Brook Trout: A1Fi Late 21st Century
Brook Trout

Virginia’s Climate Modeling and Species Vulnerability Assessment 41
Roanoke Logperch: Current Modeled Probability
Roanoke Logperch: B1 Mid 21st Century Roanoke Logperch: B1 Late 21st Century
Roanoke Logperch: A1Fi Mid 21st Century Roanoke Logperch: A1Fi Late 21st Century
Roanoke Logperch
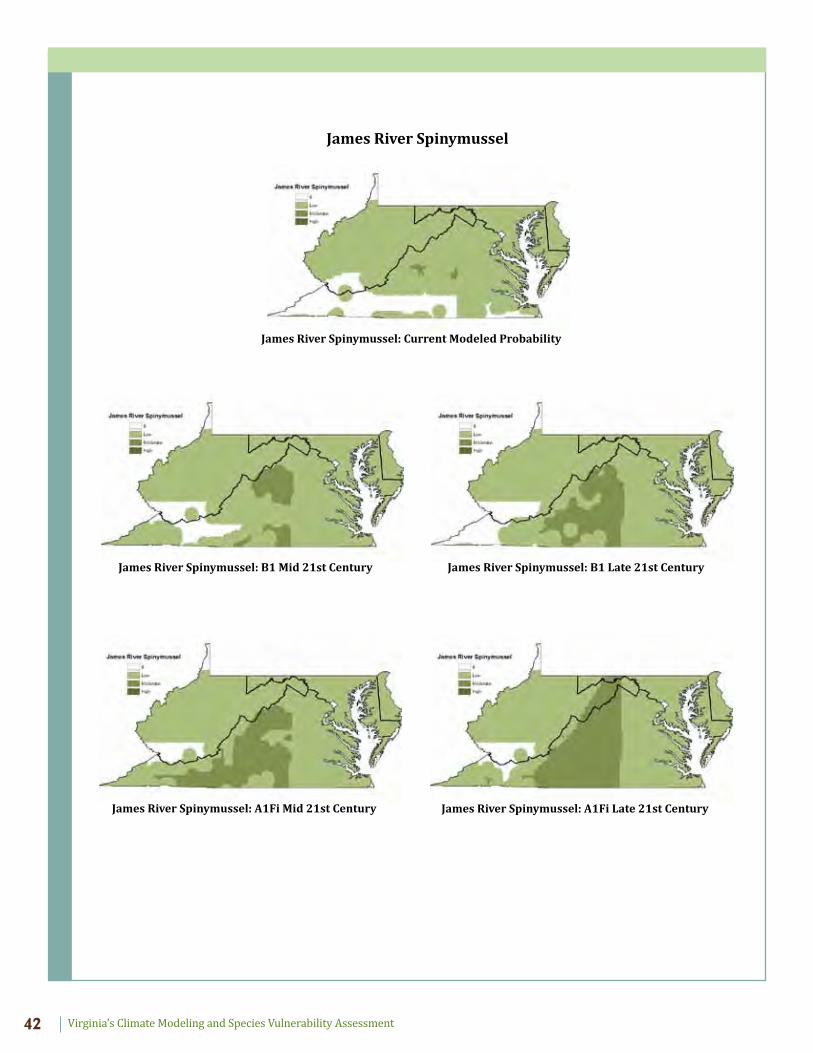
Virginia’s Climate Modeling and Species Vulnerability AssessmentVirginia’s Climate Modeling and Species Vulnerability Assessment42
James River Spinymussel: Current Modeled Probability
James River Spinymussel: B1 Mid 21st Century James River Spinymussel: B1 Late 21st Century
James River Spinymussel: A1Fi Mid 21st Century James River Spinymussel: A1Fi Late 21st Century
James River Spinymussel
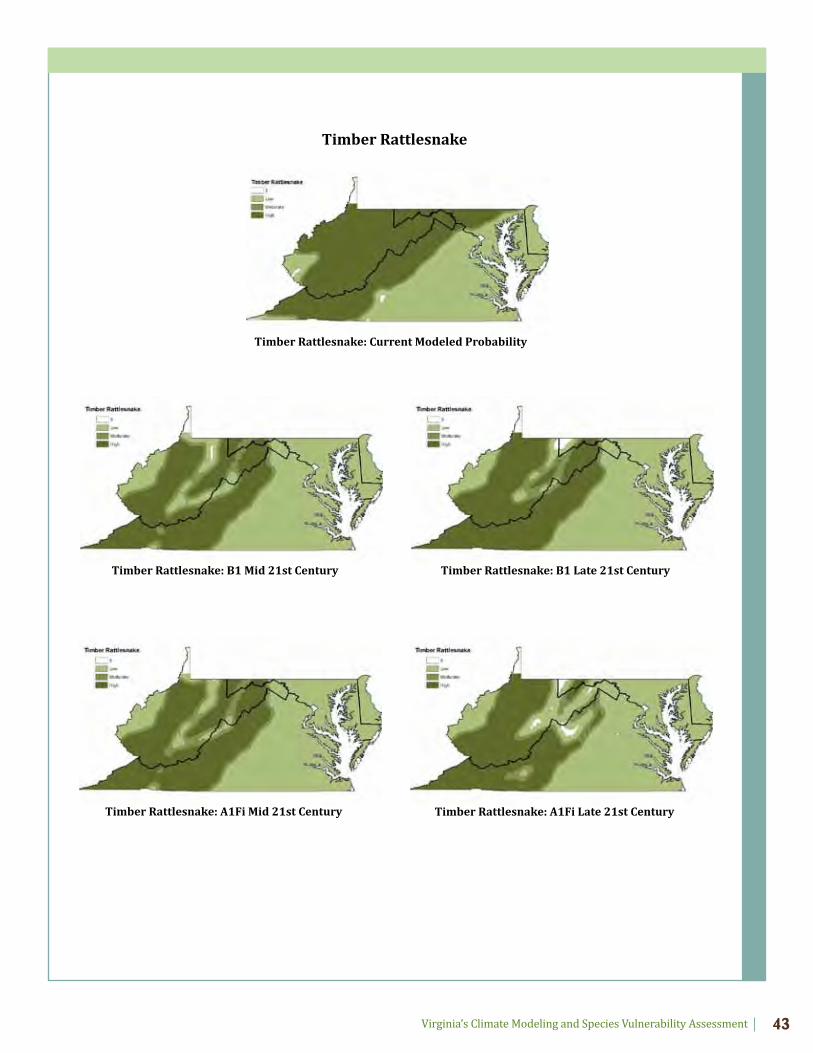
Virginia’s Climate Modeling and Species Vulnerability Assessment 43
Timber Rattlesnake: Current Modeled Probability
Timber Rattlesnake: B1 Mid 21st Century Timber Rattlesnake: B1 Late 21st Century
Timber Rattlesnake: A1Fi Mid 21st Century Timber Rattlesnake: A1Fi Late 21st Century
Timber Rattlesnake
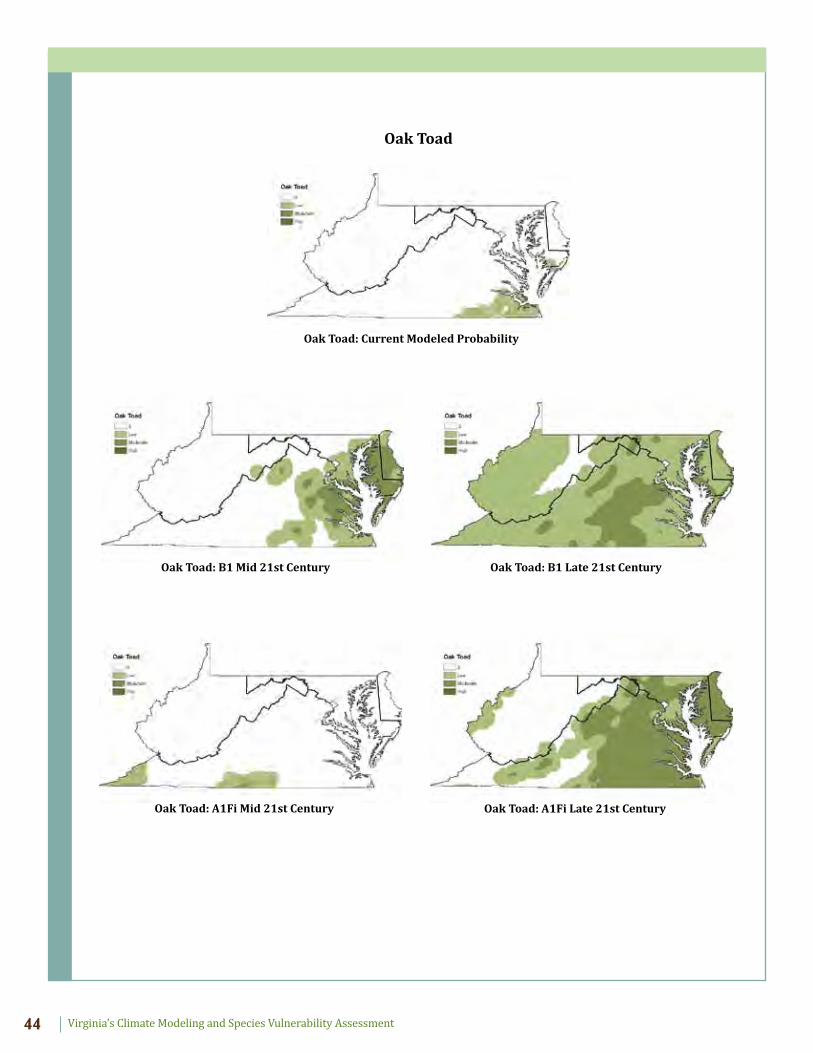
Virginia’s Climate Modeling and Species Vulnerability AssessmentVirginia’s Climate Modeling and Species Vulnerability Assessment44
Oak Toad: Current Modeled Probability
Oak Toad: B1 Mid 21st Century Oak Toad: B1 Late 21st Century
Oak Toad: A1Fi Mid 21st Century Oak Toad: A1Fi Late 21st Century
Oak Toad
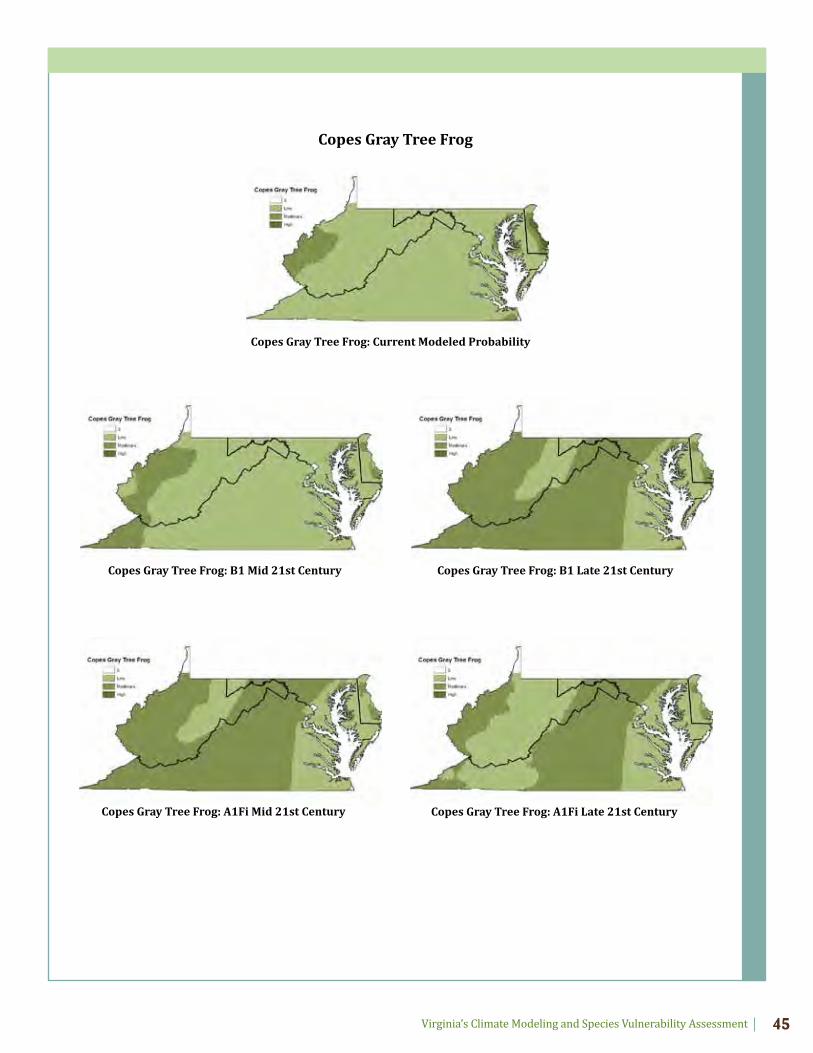
Virginia’s Climate Modeling and Species Vulnerability Assessment 45
Copes Gray Tree Frog: Current Modeled Probability
Copes Gray Tree Frog: B1 Mid 21st Century Copes Gray Tree Frog: B1 Late 21st Century
Copes Gray Tree Frog: A1Fi Mid 21st Century Copes Gray Tree Frog: A1Fi Late 21st Century
Copes Gray Tree Frog
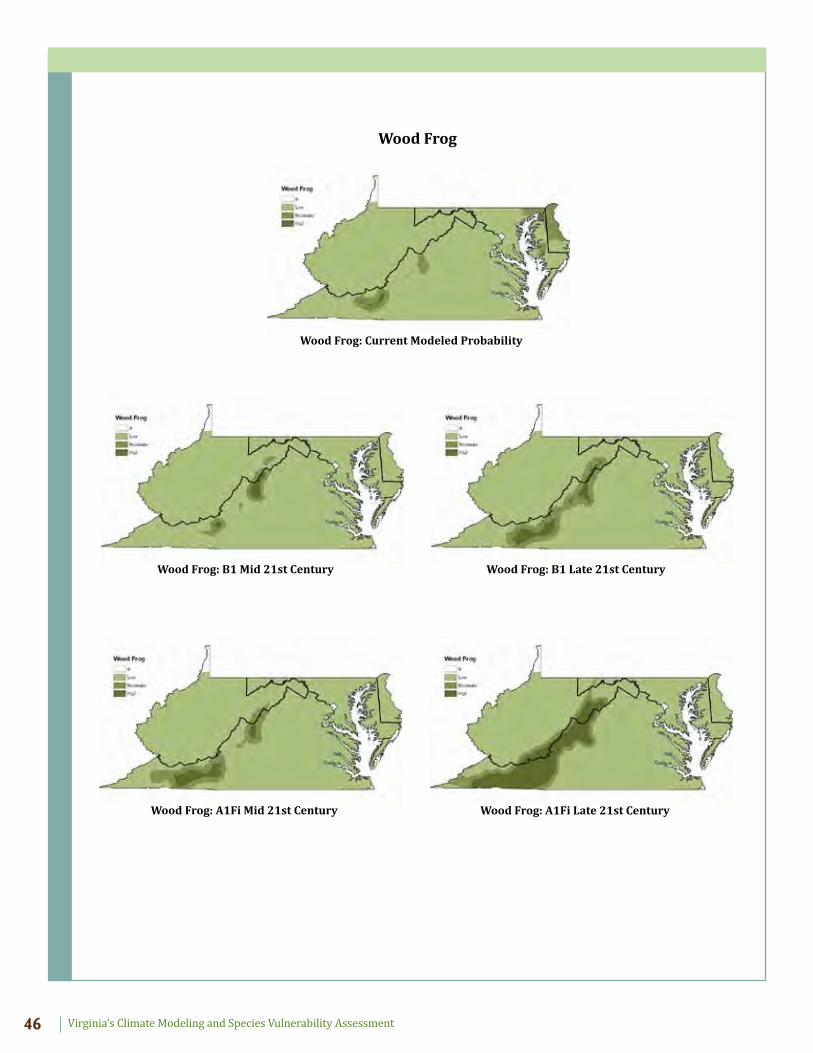
Virginia’s Climate Modeling and Species Vulnerability AssessmentVirginia’s Climate Modeling and Species Vulnerability Assessment46
Wood Frog: Current Modeled Probability
Wood Frog: B1 Mid 21st Century Wood Frog: B1 Late 21st Century
Wood Frog: A1Fi Mid 21st Century Wood Frog: A1Fi Late 21st Century
Wood Frog
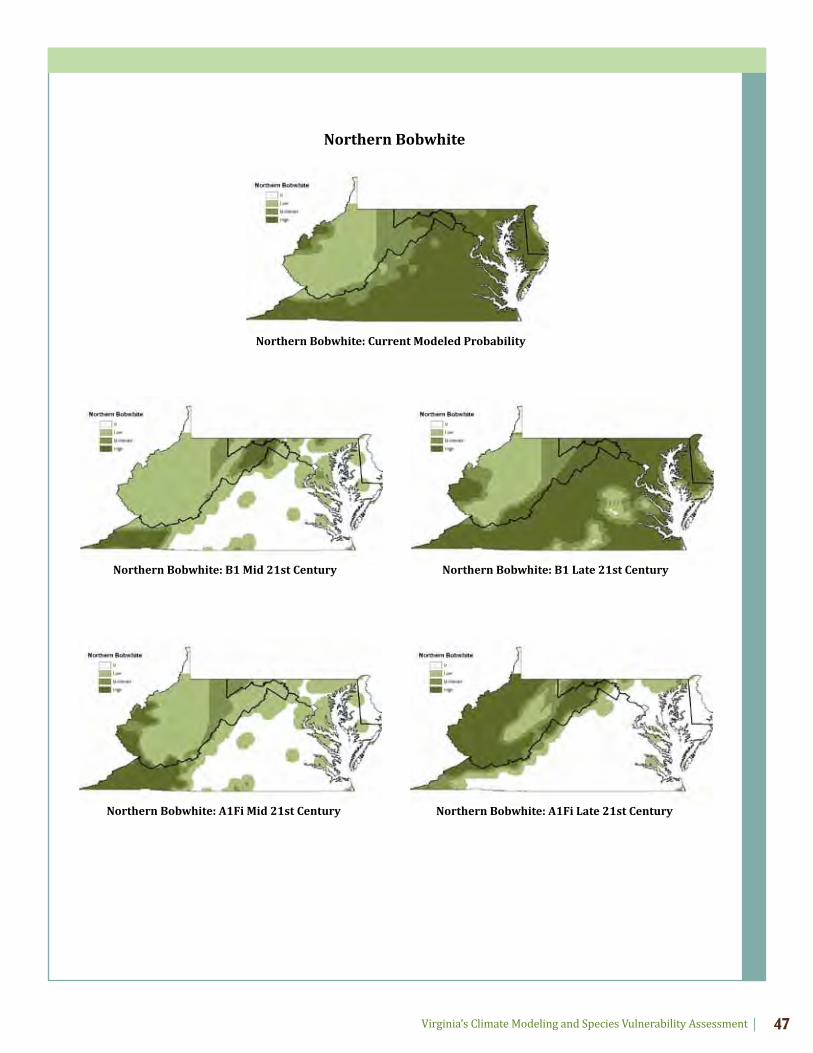
Virginia’s Climate Modeling and Species Vulnerability Assessment 47
Northern Bobwhite: Current Modeled Probability
Northern Bobwhite: B1 Mid 21st Century Northern Bobwhite: B1 Late 21st Century
Northern Bobwhite: A1Fi Mid 21st Century Northern Bobwhite: A1Fi Late 21st Century
Northern Bobwhite
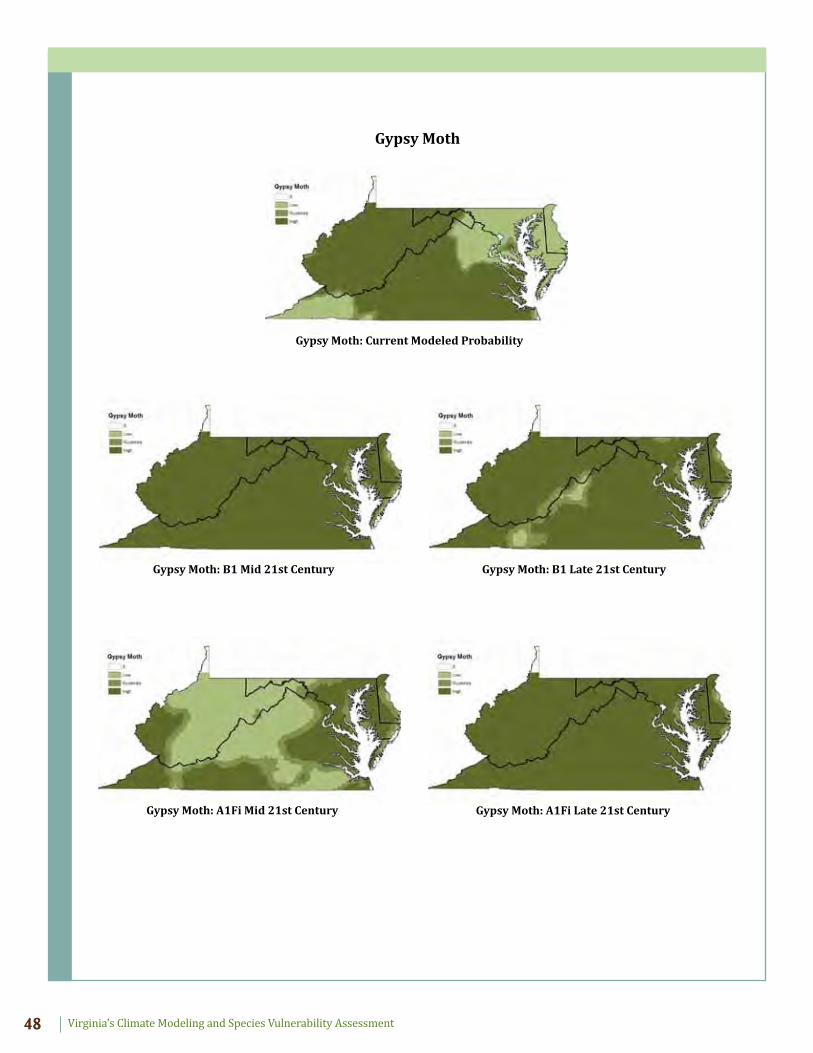
Virginia’s Climate Modeling and Species Vulnerability AssessmentVirginia’s Climate Modeling and Species Vulnerability Assessment48
Gypsy Moth: Current Modeled Probability
Gypsy Moth: B1 Mid 21st Century Gypsy Moth: B1 Late 21st Century
Gypsy Moth: A1Fi Mid 21st Century Gypsy Moth: A1Fi Late 21st Century
Gypsy Moth
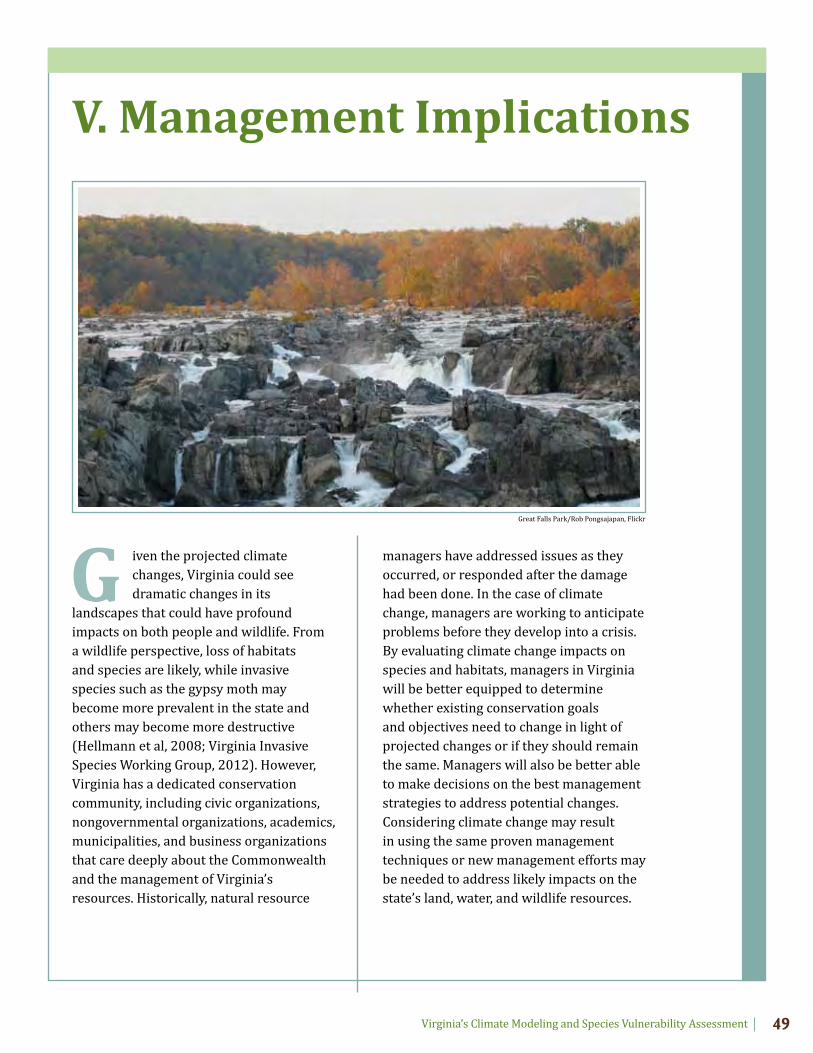
Virginia’s Climate Modeling and Species Vulnerability Assessment 49
iven the projected climate changes, Virginia could see dramatic changes in its landscapes that could have profound impacts on both people and wildlife. From a wildlife perspective, loss of habitats and species are likely, while invasive species such as the gypsy moth may become more prevalent in the state and others may become more destructive (Hellmann et al, 2008; Virginia Invasive Species Working Group, 2012). However, Virginia has a dedicated conservation community, including civic organizations, nongovernmental organizations, academics, municipalities, and business organizations that care deeply about the Commonwealth and the management of Virginia’s resources. Historically, natural resource
managers have addressed issues as they occurred, or responded after the damage had been done. In the case of climate change, managers are working to anticipate problems before they develop into a crisis. By evaluating climate change impacts on species and habitats, managers in Virginia will be better equipped to determine whether existing conservation goals and objectives need to change in light of projected changes or if they should remain the same. Managers will also be better able to make decisions on the best management strategies to address potential changes. Considering climate change may result in using the same proven management techniques or new management efforts may be needed to address likely impacts on the state’s land, water, and wildlife resources.
V. Management Implications
GGreat Falls Park/Rob Pongsajapan, Flickr
Virginia’s Climate Modeling and Species Vulnerability AssessmentVirginia’s Climate Modeling and Species Vulnerability Assessment50
As examples illustrate in this document, climate change will likely cause significant impacts to species and habitats in Virginia. Some species may be lost, such as red spruce, while other species such as bald cypress or oak toad might expand into new areas. It may become more difficult to manage some species, such as cold water fishes, but existing management strategies may provide us with an opportunity to retain these species in spite of climate change. It appears some species, such as timber rattlesnake, are not likely to be directly affected by the projected climatic changes but they may be affected by secondary impacts such as human migration.
In an effort to consider the types of management actions that may be needed in light of climate change, NWF and VDGIF personnel communicated with stakeholders and partners to identify management implications of this species vulnerability assessment for conserving Virginia’s wildlife and habitats as well as more overarching considerations. However, it is important to understand that this species assessment considered only some
aspects of climate change, not additional non-climate factors that will be important in determining a species’ viability into the future. Thus, the management implications outlined below represent a framework or guide within which to consider future management decisions.
Forest Management Implications
As discussed above, Virginia’s forests are a valuable resource that provides Virginians with wildlife, economic opportunities, and a suite of ecosystem services, such as carbon sequestration, soil retention, and water quality. While climate change could cause major impacts on the health and composition of Virginia’s forests, it would be a mistake to ignore or underestimate the other factors that could influence these resources in the future. For example, Virginia has an active land and forestry management community that may be able to mitigate or slow the rate of change using proven management strategies. Tree species could be propagated on farms and transplanted onto restoration sites. It may be possible to apply this technique to either help conserve tree populations that represent key habitat components in small areas of suitable habitat or to assist the migration of other species into new suitable habitats.
As resource managers work on forest management or mitigation projects it will be helpful to understand which tree species are likely to persist in the future and which may be more resilient in the system, so that the restoration practices can take advantage of more climatically tolerant species. For example, given the projections
While climate change could cause major impacts on the health and composition of Virginia’s forests, it would be a mistake to ignore or underestimate the other factors that could influence these resources in the future.
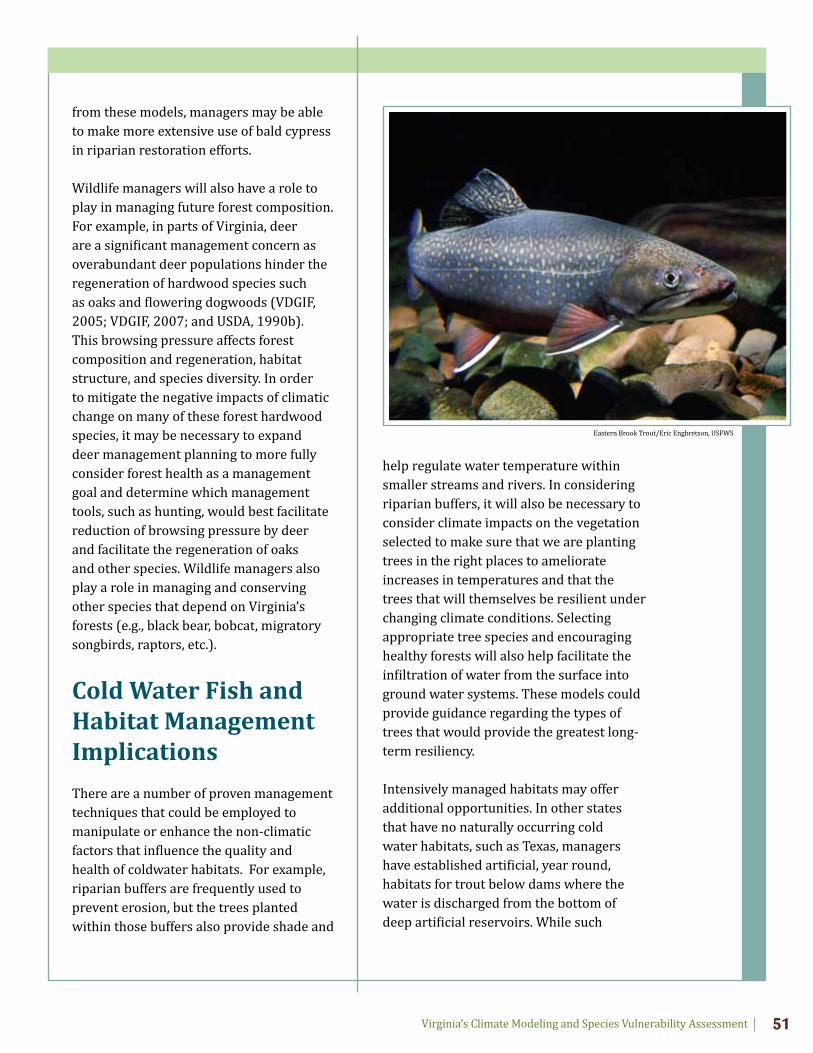
Virginia’s Climate Modeling and Species Vulnerability Assessment 51
from these models, managers may be able to make more extensive use of bald cypress in riparian restoration efforts.
Wildlife managers will also have a role to play in managing future forest composition. For example, in parts of Virginia, deer are a significant management concern as overabundant deer populations hinder the regeneration of hardwood species such as oaks and flowering dogwoods (VDGIF, 2005; VDGIF, 2007; and USDA, 1990b). This browsing pressure affects forest composition and regeneration, habitat structure, and species diversity. In order to mitigate the negative impacts of climatic change on many of these forest hardwood species, it may be necessary to expand deer management planning to more fully consider forest health as a management goal and determine which management tools, such as hunting, would best facilitate reduction of browsing pressure by deer and facilitate the regeneration of oaks and other species. Wildlife managers also play a role in managing and conserving other species that depend on Virginia’s forests (e.g., black bear, bobcat, migratory songbirds, raptors, etc.).
Cold Water Fish and Habitat Management Implications
There are a number of proven management techniques that could be employed to manipulate or enhance the non-climatic factors that influence the quality and health of coldwater habitats. For example, riparian buffers are frequently used to prevent erosion, but the trees planted within those buffers also provide shade and
help regulate water temperature within smaller streams and rivers. In considering riparian buffers, it will also be necessary to consider climate impacts on the vegetation selected to make sure that we are planting trees in the right places to ameliorate increases in temperatures and that the trees that will themselves be resilient under changing climate conditions. Selecting appropriate tree species and encouraging healthy forests will also help facilitate the infiltration of water from the surface into ground water systems. These models could provide guidance regarding the types of trees that would provide the greatest long-term resiliency.
Intensively managed habitats may offer additional opportunities. In other states that have no naturally occurring cold water habitats, such as Texas, managers have established artificial, year round, habitats for trout below dams where the water is discharged from the bottom of deep artificial reservoirs. While such
Eastern Brook Trout/Eric Engbretson, USFWS
Virginia’s Climate Modeling and Species Vulnerability AssessmentVirginia’s Climate Modeling and Species Vulnerability Assessment52
impoundments certainly have draw backs related to cost, disrupted hydrology, facility maintenance, and fish passage, this technique may allow managers to establish a limited system of refugia to maintain populations of brook trout and other cold water species in Virginia.
Frog and Toad Management Implications
Unlike many of the other groups that will require managers to mitigate against the impacts of climate change, the reptile and amphibian assessments indicate managers may have to facilitate species opportunities provided by climate change. Many of the woodland amphibian species may have access to a greater number of climatically suitable habitats than they currently enjoy. Unfortunately, these species tend to be poor dispersers, especially across human landscape features such as roads and urban areas. Management will be less a question of how to conserve these species in their existing range and more an issue of how enhance these new opportunities.
Assisted migration, the act of moving species into areas they have never been before, may be a viable tool for promoting the long-term conservation of amphibians (Marris, 2008). Wildlife managers in
Virginia and across the nation have used this technique to introduce white-tailed deer, turkey, freshwater mussels and, most recently, elk into vacant, former, habitats. Fisheries managers in Virginia have also introduced several game fish, such as rainbow trout and blue catfish into Virginia waters (Jenkins and Burkehead, 1993). Despite Virginia’s history of moving species to support conservation and recreation goals, there are legitimate concerns being debated within Virginia’s conservation community regarding the legal, biological, and ethical implications associated with assisted migration. These issues will have to be resolved before assisted migration should be incorporated as a major component of any management strategy for Virginia’s amphibians.
Invasive Species Management Implications
Dozens of invasive plants, animals, and pathogens have been introduced into Virginia and resource management agencies have developed a collaborative management plan to address problems caused by this species. The Virginia Invasive Species Management Plan (2012) calls upon natural resource managers to:
• Coordinate prevention and management efforts,• Prevent new invasive species from entering the state,• Promote the development and implementation of detection networks,• Rapidly implement eradication or containment procedures,• Work to control priority invasive species,
Management will be less a question of how to conserve these species in their existing range and more an issue of how enhance these new opportunities.
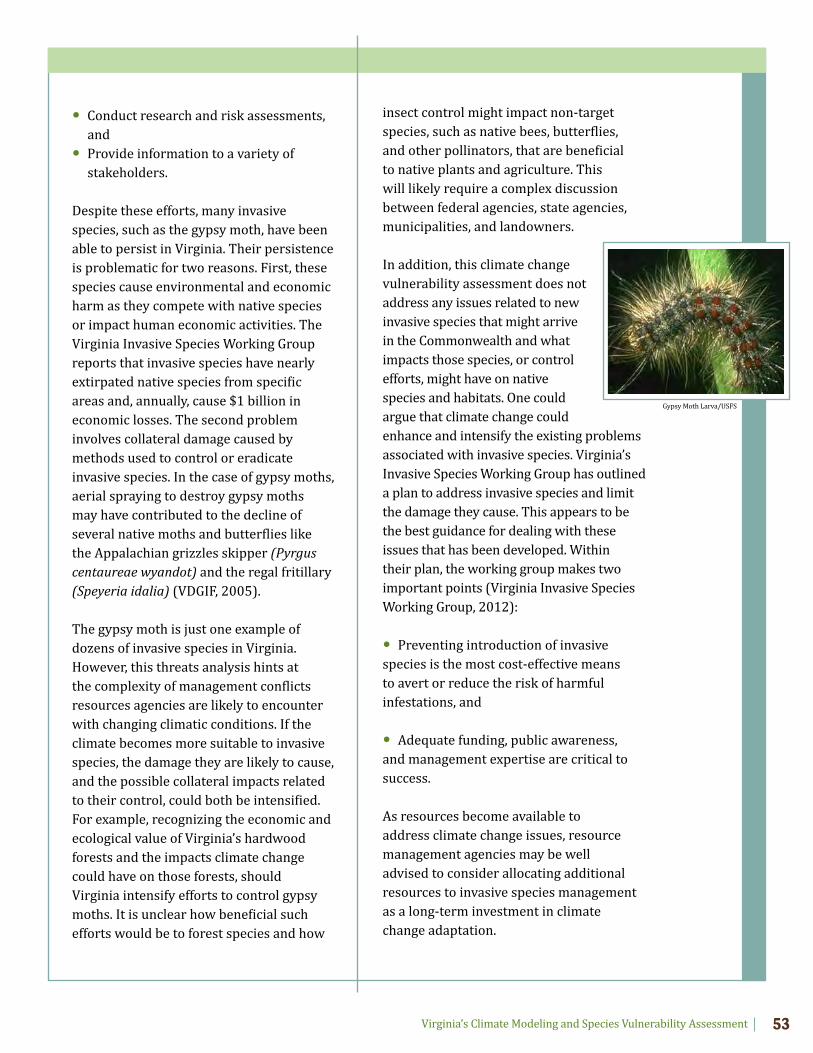
Virginia’s Climate Modeling and Species Vulnerability Assessment 53
• Conduct research and risk assessments, and• Provide information to a variety of stakeholders.
Despite these efforts, many invasive species, such as the gypsy moth, have been able to persist in Virginia. Their persistence is problematic for two reasons. First, these species cause environmental and economic harm as they compete with native species or impact human economic activities. The Virginia Invasive Species Working Group reports that invasive species have nearly extirpated native species from specific areas and, annually, cause $1 billion in economic losses. The second problem involves collateral damage caused by methods used to control or eradicate invasive species. In the case of gypsy moths, aerial spraying to destroy gypsy moths may have contributed to the decline of several native moths and butterflies like the Appalachian grizzles skipper (Pyrgus centaureae wyandot) and the regal fritillary (Speyeria idalia) (VDGIF, 2005).
The gypsy moth is just one example of dozens of invasive species in Virginia. However, this threats analysis hints at the complexity of management conflicts resources agencies are likely to encounter with changing climatic conditions. If the climate becomes more suitable to invasive species, the damage they are likely to cause, and the possible collateral impacts related to their control, could both be intensified. For example, recognizing the economic and ecological value of Virginia’s hardwood forests and the impacts climate change could have on those forests, should Virginia intensify efforts to control gypsy moths. It is unclear how beneficial such efforts would be to forest species and how
insect control might impact non-target species, such as native bees, butterflies, and other pollinators, that are beneficial to native plants and agriculture. This will likely require a complex discussion between federal agencies, state agencies, municipalities, and landowners.
In addition, this climate change vulnerability assessment does not address any issues related to new invasive species that might arrive in the Commonwealth and what impacts those species, or control efforts, might have on native species and habitats. One could argue that climate change could enhance and intensify the existing problems associated with invasive species. Virginia’s Invasive Species Working Group has outlined a plan to address invasive species and limit the damage they cause. This appears to be the best guidance for dealing with these issues that has been developed. Within their plan, the working group makes two important points (Virginia Invasive Species Working Group, 2012):
• Preventing introduction of invasive species is the most cost-effective means to avert or reduce the risk of harmful infestations, and
• Adequate funding, public awareness, and management expertise are critical to success.
As resources become available to address climate change issues, resource management agencies may be well advised to consider allocating additional resources to invasive species management as a long-term investment in climate change adaptation.
Gypsy Moth Larva/USFS
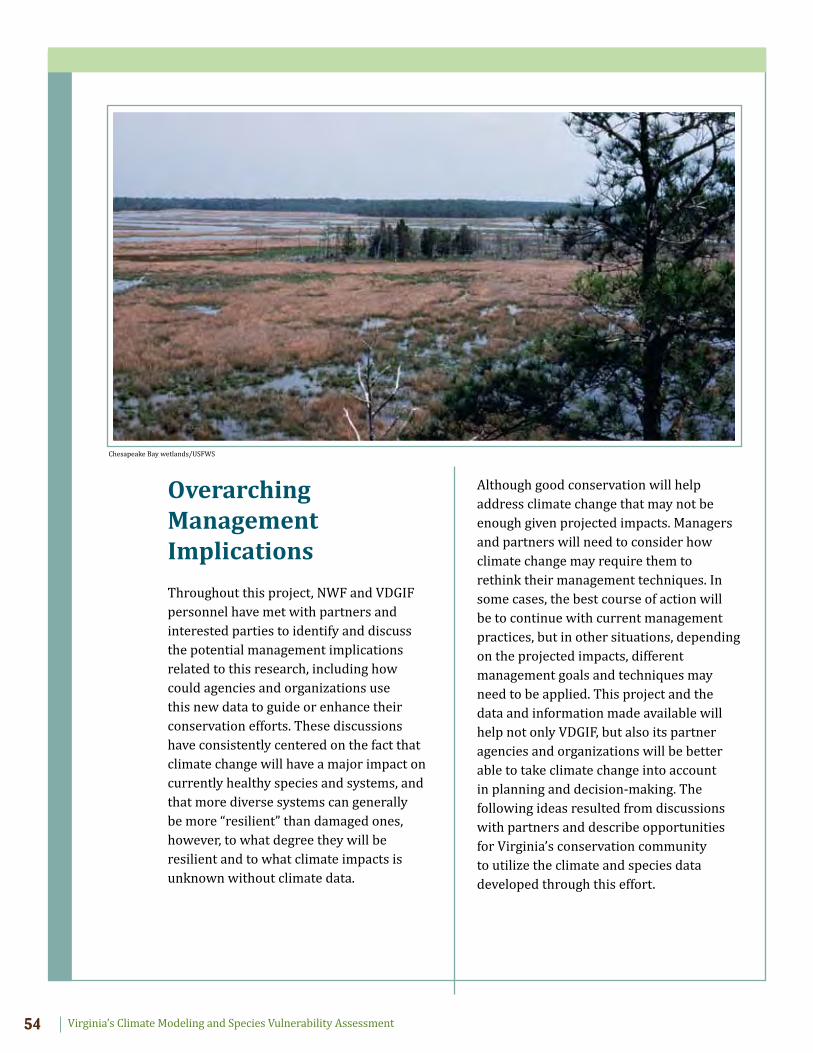
Virginia’s Climate Modeling and Species Vulnerability AssessmentVirginia’s Climate Modeling and Species Vulnerability Assessment54
Overarching Management Implications
Throughout this project, NWF and VDGIF personnel have met with partners and interested parties to identify and discuss the potential management implications related to this research, including how could agencies and organizations use this new data to guide or enhance their conservation efforts. These discussions have consistently centered on the fact that climate change will have a major impact on currently healthy species and systems, and that more diverse systems can generally be more “resilient” than damaged ones, however, to what degree they will be resilient and to what climate impacts is unknown without climate data.
Although good conservation will help address climate change that may not be enough given projected impacts. Managers and partners will need to consider how climate change may require them to rethink their management techniques. In some cases, the best course of action will be to continue with current management practices, but in other situations, depending on the projected impacts, different management goals and techniques may need to be applied. This project and the data and information made available will help not only VDGIF, but also its partner agencies and organizations will be better able to take climate change into account in planning and decision-making. The following ideas resulted from discussions with partners and describe opportunities for Virginia’s conservation community to utilize the climate and species data developed through this effort.
Chesapeake Bay wetlands/USFWS

Virginia’s Climate Modeling and Species Vulnerability Assessment 55
Land Conservation Strategies
Virginia’s Wildlife Action Plan identifies over 900 SGCN. Each of these is threatened by the loss or degradation of its habitat. Virginia’s conservation community has a number of tools to conserve lands and habitats to benefit both the SGCN and the people of Virginia. Agencies or organizations generally conserve land in two ways. First, they may acquire properties for their own portfolios (e.g., wildlife management areas, parks, wildlife refuges, etc.). Second, they may work with private landowners to establish legal protections without changing ownership (e.g., conservation easements, safe harbor agreements, and candidate conservation agreements). In either case, the conservation community is always working to ensure that acquisitions, easements, and agreements provide the greatest conservation benefit.
Agencies are also concerned that external forces, such as climate change, could alter the nature of a property and eliminate the conservation benefits that the property was acquired to provide. Previously, it was almost impossible to consider how the future value of a property might be influenced by changing climatic conditions during the middle of the 21st century. At a minimum, these new climate and species models will be able to inform managers of predicted future climatic conditions and likely species responses to those changes. Such information can influence the types of properties to be conserved, target specific locations for specific types of conservation, and guide the management of conservation lands to ensure the greatest long-term benefits (see Section V).
Integrate Species Projections and Climate Information into Species-Specific Management Plans
VDGIF and the U.S. Fish and Wildlife Service develop species-specific management plans to guide the conservation and management of many game, threatened, and endangered species in order to nurture and sustain healthy populations and habitats within the Commonwealth. These plans are periodically updated to address new issues, incorporate new data, and identify new management goals. The new climate data and species assessments resulting from this effort will provide insights into the long-term climate related issues that will affect and influence species and habitat management during the coming decades. For example, discussions of climate impacts on forest compositions should enhance Virginia’s next deer management plan, and projected temperature and precipitation data can be incorporated into aquatic species management plans.
Agencies are also concerned that external forces, such as climate change, could alter the nature of a property and eliminate the conservation benefits that the property was acquired to provide.
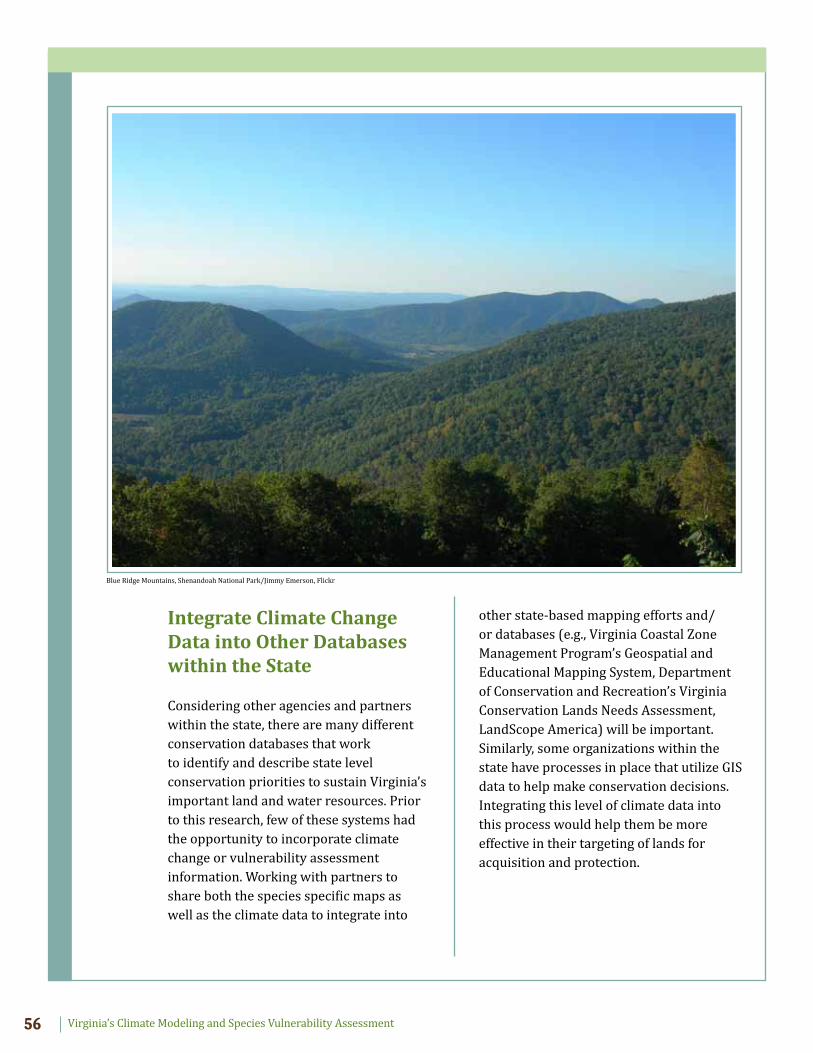
Virginia’s Climate Modeling and Species Vulnerability AssessmentVirginia’s Climate Modeling and Species Vulnerability Assessment56
Integrate Climate Change Data into Other Databases within the State
Considering other agencies and partners within the state, there are many different conservation databases that work to identify and describe state level conservation priorities to sustain Virginia’s important land and water resources. Prior to this research, few of these systems had the opportunity to incorporate climate change or vulnerability assessment information. Working with partners to share both the species specific maps as well as the climate data to integrate into
other state-based mapping efforts and/ or databases (e.g., Virginia Coastal Zone Management Program’s Geospatial and Educational Mapping System, Department of Conservation and Recreation’s Virginia Conservation Lands Needs Assessment, LandScope America) will be important. Similarly, some organizations within the state have processes in place that utilize GIS data to help make conservation decisions. Integrating this level of climate data into this process would help them be more effective in their targeting of lands for acquisition and protection.
Blue Ridge Mountains, Shenandoah National Park/Jimmy Emerson, Flickr

Virginia’s Climate Modeling and Species Vulnerability Assessment 57
VI. Next Steps
S everal immediate next steps are planned by the project partners. This project resulted in important species and habitat climate vulnerability information as well as an extensive amount of valuable climate data. These sets of information will be useful to VDGIF for updating its Action Plan and initiating follow on research projects. However, the climate data also are of interest to the broad range of stakeholders in the state and in the region. Making the data easily available and in a usable format is a priority for all partners in the project. Additionally, moving forward it will be important to identify where the conservation community and government agencies can focus their resources and efforts to address climate change, especially the impacts illuminated by this project.
Wildlife Action Plan Update
Virginia’s Wildlife Action Plan was written to help Virginia’s conservation community prevent species from becoming endangered. Although climate change was mentioned as a potential threat for several species within the original action plan, the resources did not exist to cover the issues in great detail. Efforts are currently underway to revise the Action Plan so that it may better address climate change and local conservation priorities. Specifically, these climate models and
species assessments will guide the review and revision of information related to the selection of species of greatest conservation need, conservation threats, and conservation actions. The revision of Virginia’s Wildlife Action Plan will be completed by October, 2015.
Climate Atlas Development
This climate modeling effort produced an unexpectedly large volume of data. So much information was produced that VDGIF does not have the capacity to manage all of this information and make it available to partners. To address this need, VDGIF will work with CMI to review the modeled climate data and develop an electronic Climate Atlas, including GIS shape files and PDF images of mapped climate variables for different greenhouse gas scenarios and timeframes. It is estimated this project could produce as many as 900 maps. Once created, these files will be made available either on the VDGIF website or another resource and available to all for download. Because the downscaled area includes most of West Virginia, Maryland, Washington, D.C., and Delaware, the data will be useful to the broader region. Arrangements are also being made to archive this data with the Northeast Climate Science Center, so that it can be made available to other researchers.
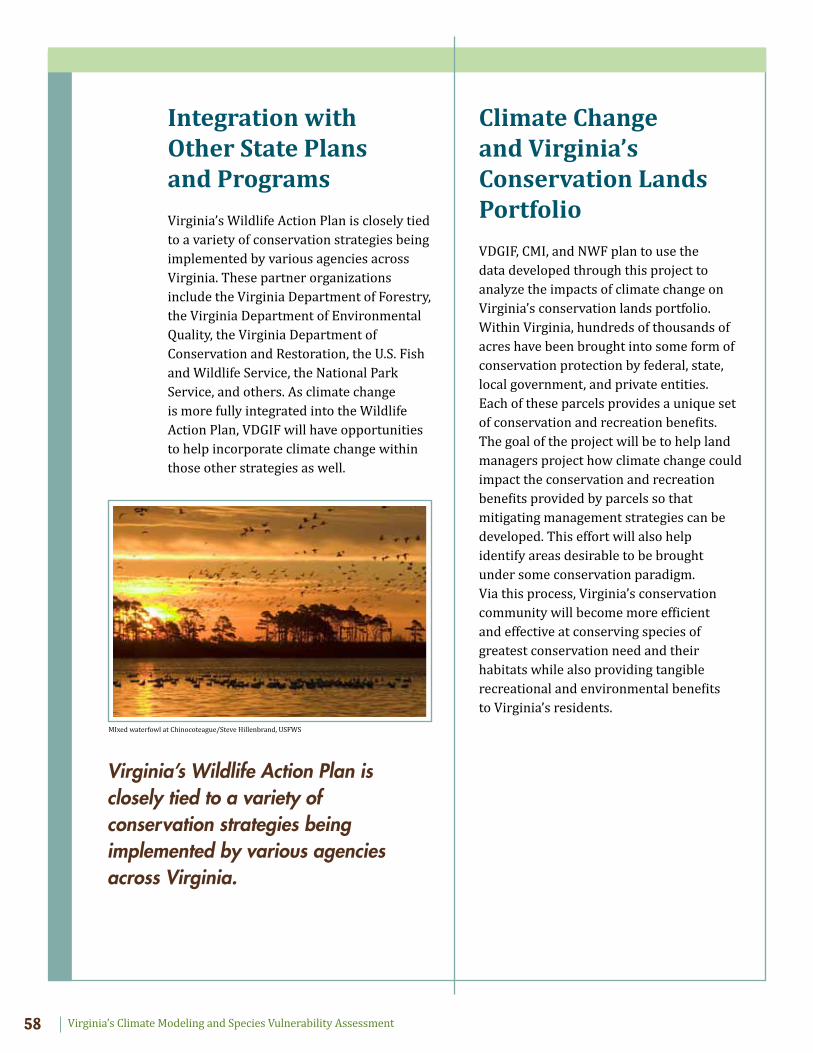
Virginia’s Climate Modeling and Species Vulnerability AssessmentVirginia’s Climate Modeling and Species Vulnerability Assessment58
MIxed waterfowl at Chinocoteague/Steve Hillenbrand, USFWS
Virginia’s Wildlife Action Plan is closely tied to a variety of conservation strategies being implemented by various agencies across Virginia.
Integration with Other State Plans and Programs
Virginia’s Wildlife Action Plan is closely tied to a variety of conservation strategies being implemented by various agencies across Virginia. These partner organizations include the Virginia Department of Forestry, the Virginia Department of Environmental Quality, the Virginia Department of Conservation and Restoration, the U.S. Fish and Wildlife Service, the National Park Service, and others. As climate change is more fully integrated into the Wildlife Action Plan, VDGIF will have opportunities to help incorporate climate change within those other strategies as well.
Climate Change and Virginia’s Conservation Lands Portfolio
VDGIF, CMI, and NWF plan to use the data developed through this project to analyze the impacts of climate change on Virginia’s conservation lands portfolio. Within Virginia, hundreds of thousands of acres have been brought into some form of conservation protection by federal, state, local government, and private entities. Each of these parcels provides a unique set of conservation and recreation benefits. The goal of the project will be to help land managers project how climate change could impact the conservation and recreation benefits provided by parcels so that mitigating management strategies can be developed. This effort will also help identify areas desirable to be brought under some conservation paradigm. Via this process, Virginia’s conservation community will become more efficient and effective at conserving species of greatest conservation need and their habitats while also providing tangible recreational and environmental benefits to Virginia’s residents.
Virginia’s Climate Modeling and Species Vulnerability Assessment 59
VII. ReferencesAnderson, P.; Palik, B. 2011. Silviculture for Climate Change. (October 10, 2011). U.S. Department of Agriculture, Forest Service, Climate Change Resource Center. http://www.fs.fed.us/ccrc/topics/silviculture/silviculture.shtml.
Burkehead, N. M. and R. E. Jenkins. 1991. Fishes – Virginia’s Endangered Species. Virginia Department of Game and Inland Fisheries. Richmond, Virginia.
Dimmick, R. W., M.J. Gudlin, and D.F. McKenzie. 2002. The Northern Bobwhite Conservation Initiative. Miscellaneouis publications of the Southeastern Association of Fish and Wildlife Agencies, South Carolina.
Dorcas, M. and W. Gibbons. 2008. Frogs and Toads of the Southeast. University of Georgia Press. 238pp.
Governor’s Commission on Climate Change. 2008. A Final Report: Climate Action Plan. Available at http://www.sealevelrisevirginia.net/main_CCC_files/.
Ernst, C. H. and E. M. Ernst. 2011. Venomous Reptiles of the United States, Canada, and Northern Mexico. The Johns Hopkins University Press. 352pp.
Hellmann, J., J. Byers, B. Bierwagen, and J. Dukes. 2008. Five Potential Consequences of Climate Change for Invasive Species. Conservation Biology. Volume 22 (3): 534–543.
Intergovernmental Panel on Climate Change (IPCC). 2007. Climate Change 2007: Impacts, Adaptation and Vulnerability. In M.L. Parry, O.F. Canziani, J.P. Palutikof, P.J. van der Linden, and C.E. Hanson (eds.). Fourth Assessment Report of the Intergovernmental Panel on Climate Change. Cambridge University Press, Cambridge, UK.
Iverson, L. R., Schwartz, M. W. and Prasad, A. M. 2004. How fast and far might tree species migrate in the eastern United States due to climate change? Global Ecology and Biogeography 13: 209–219.
Jenkins, R. E. and N. M. Burkehead. 1993. Freshwater Fishes of Virginia. American Fisheries Society, Bethesda, Maryland.
Klopfer, S., J. Sewall, A. Kane, and C. Burkett. 2012. Modeling Potential Climate Changes and their Related Impact on Select Species in Virginia. Conservation Management Institute, Virginia Tech. Available at http://cmi.vt.edu/Articles/Files/file_ClimateChangeReport.pdf.
Lannoo, M. 2005. Amphibian Declines, The Conservation Status of United States Species. University of California Press. 1093 pp.
Marris, E. 2008. Moving on Assisted Migration. Nature Reports Climate Change, Volume 2, September 2008. www.nature.com/reports/climatechange.
Masters, R. E. 2007. The Importance of Shortleaf Pine for Wildlife and Diversity in Mixed Oak-Pine Forests and in Pine-Grassland Woodlands: Available at: http://www.nrs.fs.fed.us/pubs/gtr/gtr_p-15%20papers/6masters-p-15.pdf.
Najjar, R, C. Pyke, M.B. Adams, D Breitburg, C Hershner, M Kemp, R Howarth, M. Mulholland, M. Paolisso, D. Secor, K. Sellner, D. Wardrop, and R. Wood. 2010. Potential climate-change impacts on the Chesapeake Bay. Estuarine, Coastal and Shelf Science 86: 1–20.
Neves, R. J. 1991. Mollusks - Virginia’s Endangered Species. Virginia Department of Game and Inland Fisheries. Richmond, Virginia.
Pearson, R.G., and T.P. Dawson. 2003. Predicting the impacts of climate change on the distribution of species: are bioclimatic envelope models useful? Global Ecology and Biogeography 12: 361–371.
Pyke, C. Najjar, M.B. Adams, D. Breitburg, M. Kemp, C. Hershner, R. Howarth, M. Mulholland, M. Paolisso, D. Secor, K. Sellner, D. Wardrop, and R. Wood. 2008. Climate Change and the Chesapeake Bay: State-of-the-Science Review and
Virginia’s Climate Modeling and Species Vulnerability Assessment60
Recommendations. A Report from the Chesapeake Bay Program Science and Technical Advisory Committee. Annapolis, MD.
Sallenger, A.H., Jr., K.S. Doran, and P.A. Howd. 2012. Hotspot of accelerated sea-level rise on the Atlantic Coast of North America. Nature Climate Change.
The Nature Conservancy (TNC). 2011. The Eastern Shore of Virginia: Strategies for Adapting to Climate Change.
U.S. Census Bureau, Population Division, Interim State Population Projections. 2005. Table A1: Interim Projections of the Total Population for the United States and States: April 1, 2000 to July 1, 2030. Available at http://www.census.gov/population/projections/files/stateproj/SummaryTabA1.pdf
U.S. Climate Change Science Program (CCSP). 2009. Coastal Sensitivity to Sea-Level Rise: A Focus on the Mid-Atlantic Region. U.S. Environmental Protection Agency, Washington D.C., USA.
U.S. Department of Agriculture, Forest Service (USDA). 1989. Forest Insect and Disease Leaflet 162 – Gypsy Moth. US Department of Agriculture, Forest Service, Washington, DC.
U.S. Department of Agriculture, Forest Service (USDA). 1990a. Silvics of North America, Volume 1. Conifers. Agricultural Handbook 654. US Department of Agriculture, Forest Service, Washington, DC. U.S. Department of Agriculture, Forest Service (USDA). 1990b. Silvics of North America, Volume 2. Hardwoods. Agricultural Handbook 654. US Department of Agriculture, Forest Service, Washington, DC.
U.S. Fish and Wildlife Service. 2007. Post-Delisting Monitoring Plan for the West Virginianorthern flying squirrel (Glaucomys sabrinus fuscus). West Virginia Field Office, Elkins, WestVirginia. 30 pp.
U.S. Geological Survey. 2012. USGS. The USGS Water Science School (webpage). Available at http://ga.water.usgs.gov/edu/watercycleinfiltration.html.
Virginia Department of Game and Inland Fisheries (DGIF). 1999. Atlas of Amphibians and Reptiles in Virginia. Virginia Department of Game and Inland Fisheries, Richmond, Virginia.
Virginia Department of Game and Inland Fisheries (DGIF). 2005. Virginia’s Comprehensive Wildlife Conservation Strategy. Virginia Department of Game and Inland Fisheries, Richmond, Virginia.
Virginia Department of Game and Inland Fisheries (DGIF). 2008. Northern Bobwhite Quail Action Plan for Virginia. Virginia Department of Game and Inland Fisheries, Richmond, Virginia.
Virginia Department of Game and Inland Fisheries (DGIF). 2013. Fish and Wildlife Information Service (website).
Virginia Department of Forestry (VDOF). 2007. Common Native Trees of Virginia. Virginia Department of Forestry, Charlottesville, Virginia.
Virginia Department of Forestry (VDOF). 2013. Economic Benefits of the Forest Industry in Virginia available at: http://www.dof.virginia.gov/econ/index.htm. Virginia Department of Forestry, Charlottesville, Virginia.
Virginia Institute of Marine Sciences. 2013. Recurrent Flooding Study for Tidewater Virginia (SJR 76, 2012) to the Governor and the General Assembly of Virginia. Senate Document No. 3. Available at http://leg2.state.va.us/dls/h&sdocs.nsf/By+Year/SD32013/$file/SD3.pdf.
Virginia Invasive Species Working Group. 2012. Natural Heritage Technical Document 12-13. Richmond, VA. 55 pages.
Virginia Tech College of Agriculture and Life Sciences. 2008. Gypsy Moth in Virginia. Virginia Tech University, Blacksburg, Virginia.
Maury River/Michael Smith, USFWS
Virginia’s Climate Modeling and Species Vulnerability AssessmentVirginia’s Climate Modeling and Species Vulnerability Assessment62
Richmond on the James River/Bill Dickinson, Flickr
Virginia’s Climate Modeling and Species Vulnerability Assessment 63
706 Giddings Avenue
Suite 1B
Annapolis, MD 21401
444.759.3400
www.nwf.org