waste energy recovery analysis of a diesel engine exhaust ... · waste energy recovery analysis of...
TRANSCRIPT

Waste energy recovery analysis of a diesel engine exhaust system
J. Merkisz, P. Fuc, P. Lijewski & A. Ziolkowski
Institute of Combustion Engines and Transport, Poznan University of Technology, Poland
Abstract
The problem of waste energy recuperation from the exhaust gas of diesel engines has been investigated for many years by the manufacturers of passenger vehicles, heavy-duty vehicles and non-road vehicles. Currently, the energy of the exhaust gas is manly used for driving turbochargers. However, only part of the energy contained in the exhaust gas is used for this process. The outstanding energy is wasted through a heat exchange from the exhaust gas through the exhaust pipe to ambient air. Many scientific research works are aimed at the recovery of energy through transferring it from the walls to heat exchangers. The objective of the authors was the analysis of the temperature distribution in a diesel engine exhaust system in the aspect of recuperation of energy lost through heat exchange. To complete the objective, temperature and gas flow measurements were performed on the exhaust system of a 1.3 dm3 diesel engine installed on a dynamic test stand. On the test stand a complete engine exhaust system was installed, identical to that used in a real vehicle. The tests were carried out in the NEDC homologation test that was reproduced on the dynamometer through ISAC 400 software made by AVL. For the measurements, the authors used thermoresistors and a mass flow meter for the exhaust gas mass flow measurement (part of the SEMTECH DS portable exhaust emissions analyzer). Keywords: energy losses, temperature distribution, NEDC test.
1 Introduction
The efficiency of piston combustion engines currently reaches 30–40%, with the exception of marine low speed two-stroke engines whose efficiency may reach up to 50%. When analyzing the energy balance in engines of automotive
www.witpress.com, ISSN 1743-3533 (on-line) WIT Transactions on Engineering Sciences, Vol 83, © 2014 WIT Press
Advanced Computational Methods and Experiments in Heat Transfer XIII 93
doi:10.2495/HT140091
applications we need to note that only 30–40% of the chemical energy delivered with fuel is converted into mechanical work. Hence, there exists a possibility of heat energy recuperation from the exhaust gas. In the work by Dingel et al. [1] methods of conversion of this type of energy have been presented and analyzed (conversion of thermal energy into electric energy using Thermoelectric Generator and Alkali Metal Thermal to Electric Converter technologies). A TEG generator is composed of a heat exchanger, whose task is to transfer thermal energy to the thermoelectric modules (TE), where voltage is generated [2, 3]. The TE modules are composed of many N and P type semiconductive elements, i.e. with a surplus and a deficit of electrons. They are connected in series in order to obtain the desired voltage and power. Commercially available TE modules are usually flat rectangular ceramic plates made from semi conductive thermoelectric materials (usually alloys of Bi2Te3 and Sb2Te3). The kind of applied thermoelectric materials influences the range of temperatures and conversion efficiency [3, 4]. Determining the thermal energy losses in the exhaust system in relation to the actual conditions of operation of vehicles is a complex process [5]. Until recently only determining the dependence of energy losses on the operating parameters (engine speed, torque and power output) generated by the vehicles was possible. For this purpose only engine dynamometers were used allowing tests under stationary and dynamic engine states. In this case, the recreation of the actual driving cycle of a vehicle on the engine dynamometer is difficult (the dependence of the vehicle speed on time). In the case of stationary tests (steady states) it is only possible to perform the measurements at individual points of work that are usually an approximation of the actual conditions of operation and do not allow recreating the variability of the driving conditions. Variability of engine operating conditions can be realized on dynamic engine test brakes (transient states). In this case, in the test, there is a possibility of introducing the course of engine speed and load as a function of time, including the negative torque (a simulation of engine braking). It is, however, difficult to simultaneously record the motion parameters and engine operating parameters under actual operating conditions, based on which it would be possible to recreate the profile on the engine dynamometer. Data recorders designed to read and record information from the vehicle OBD system are available but they usually record the engine speed only. Direct recording of the torque is difficult. Hence, indirect methods of its determination need to be used. Currently, there are tools available for recreation of the actual driving cycle on the engine dynamometers as a function f = V(t). One of them is the AVL DynoRoad engine brake fitted with ISAC 400 simulation software that allows recreation of the vehicle motion profile, vehicle parameters including the characteristics of the drivetrains and driver behavior. On this test stand the investigations of the temperature distribution and mass flow of the exhaust gas were performed in the recreated velocity profile of the homologation NEDC test in the aspect of the possibility of thermal energy recovery.
www.witpress.com, ISSN 1743-3533 (on-line) WIT Transactions on Engineering Sciences, Vol 83, © 2014 WIT Press
94 Advanced Computational Methods and Experiments in Heat Transfer XIII

2 Engine test bed for testing under dynamic conditions
2.1 AVL DynoRoad 120
AVL DynoRoad engine test bed is designed for testing of piston combustion engines under stationary, non-stationary and dynamic conditions. The test stand is composed of a dynamic brake (three phase cage-type electric machine), coupling shaft (engine-brake) and fuel conditioning and feed systems (Fig. 1). The test stand is fitted on a special plate damped with pneumatic cushions to compensate all type of vibrations generated during the measurement. The test stand, aside from the main systems, also has a variety of sensors measuring temperature, pressure, engine speed etc.
a) b)
Figure 1: AVL DynoRoad 120 kW: a) dynamic engine dynamometer, b) control panel.
The control of the test stand is realized with the use of PUMA Open (Test Bed and Measurement Automatic). It is an advanced system enabling automated control of the stand. This is realized through implemented research tests and monitoring of all parameters of operation of the engine and the test stand. The system enables determining of critical values of the individual parameters upon excess of which the test stand goes into a limp mode and shuts down the engine. This safeguards against uncontrolled malfunctions.
2.2 Simulation software ISAC
ISAC 400 software is designed to simulate the motion profile of a vehicle, traffic conditions, vehicle design and driver’s behavior. The software is used in combination with EMCON system (Engine Monitoring and Control) and PUMA Open on engine test beds fitted with high-tech dynamic engine brake by AVL (Fig. 2). Owing to ISAC 400 it is possible to perform tests that were thus far only possible to realize on chassis dynamometers, where the entire vehicle had to be tested. The advantages of the software are [6]:
www.witpress.com, ISSN 1743-3533 (on-line) WIT Transactions on Engineering Sciences, Vol 83, © 2014 WIT Press
Advanced Computational Methods and Experiments in Heat Transfer XIII 95

realistic load tests in early development stages; the engine does not have to be fitted into the vehicle; better accessibility of the engine (for fixing sophisticated measuring
equipment); reproducibility of tests, reduced dependence on road conditions and the
constitution of the test driver; all varieties of driver and vehicle behavior (from sporty drivers to
economic drivers) can be simulated; statutory test cycles (such as FTP75 and NEDC tests) can already be
carried out on the engine test bed; the advantages described above help reduce the development costs; simultaneous development of vehicle and engine prototypes.
Figure 2: Structure of the ISAC software [6].
In ISAC 400, NEDC and FTP 75 homologation test profiles are available. If a different profile of a driving cycle is recreated it is necessary to model its course. To this end, each step of the test needs to be defined via Step Sequence Editor (SSQ). Figure 3 shows the example configuration window of the individual steps of a new research cycle.
Figure 3: View of the test sequence in the Step Sequence Editor [7].
www.witpress.com, ISSN 1743-3533 (on-line) WIT Transactions on Engineering Sciences, Vol 83, © 2014 WIT Press
96 Advanced Computational Methods and Experiments in Heat Transfer XIII

3 Research methodology
Measurements of the mass flow and temperature of the exhaust gas were performed in the NEDC driving cycle on an AVL DynoRoad 120 kW dynamometer on which 1.3 SDE engine was installed. 1.3 SDE is a Euro 4 compliant diesel engine of the maximum power output of 66 kW producing 200 Nm of torque (tab. 1, Fig. 4).
Table 1: Characteristics of the tested 1.3 SDE engine.
Parameter Value Ignition Compression ignition
Number of cylinders / number of valves per cylinder
4/4
Injection system Common rail Displacement 1248 cm3
Maximum power output 66 kW @ 4000 rpm Maximum torque 200 Nm @ 1750 rpm Emission standard Euro 4
Aftertreatment DOC On the test stand a complete exhaust system was used (dedicated for this type of engine used in regular motor vehicles). The exhaust system was composed of a catalytic converter and a silencer. The length of the entire system was close to the actual length on a real vehicle. The temperature measurement was made using three thermoresistors as per the diagram presented below in figure 5.
Figure 4: Engine test bed used for the NEDC test.
www.witpress.com, ISSN 1743-3533 (on-line) WIT Transactions on Engineering Sciences, Vol 83, © 2014 WIT Press
Advanced Computational Methods and Experiments in Heat Transfer XIII 97

Figure 5: Location of the thermoresistors in the exhaust system of the tested 1.3 SDE engine.
For the measurement of the exhaust gas mass flow a mass flow meter was used included as a component of the portable PEMS exhaust gas analyzer (SEMTECH DS). The mass flow rate of the exhaust gas was determined based on the flow continuity and Bernoulli equations using the Pitot tube [8–10]:
PAREKm
)( (1)
where:
m – exhaust mass flow, A – the physical cross-section of the area of the flow tube assembly, K(RE) – the discharge coefficient for the flow tube assembly as a function of Reynolds Number, ρ – the density of the exhaust gas, ΔP – the difference between PHIGH and PLOW.
Figure 6 shows a cross-section of the SEMTECH EFM averaging Pitot tube flow sensor.
Figure 6: SEMTECH EFM flow tube assembly cross-section [10].
DOC
t2
Engine MUFFLER
t1 t3
www.witpress.com, ISSN 1743-3533 (on-line) WIT Transactions on Engineering Sciences, Vol 83, © 2014 WIT Press
98 Advanced Computational Methods and Experiments in Heat Transfer XIII

The exhaust density is determined by the SEMTECH portable emissions analyzer software based upon the exhaust temperature, upstream of the flow tube assembly, and the molecular mass of the exhaust gas. SEMTECH determines the molecular mass based on the measured constituent concentrations. SEMTECH then applies a correction to the raw flow readings based on the calculated density. As noted above, one difficulty with flow meters based on differential pressure (∆P) is a limited dynamic range. Because of the square-root relationship, large changes in ∆P reflect small changes in the flow. To overcome this problem, SEMTECH EFM has incorporated four ∆P sensors with ranges that span more than two orders of magnitude. Each sensor is selected specifically for certain portions of the total flow range. With this arrangement, vehicle exhaust can be measured accurately over its entire range from idle to maximum flow [10].
4 Results and discussion
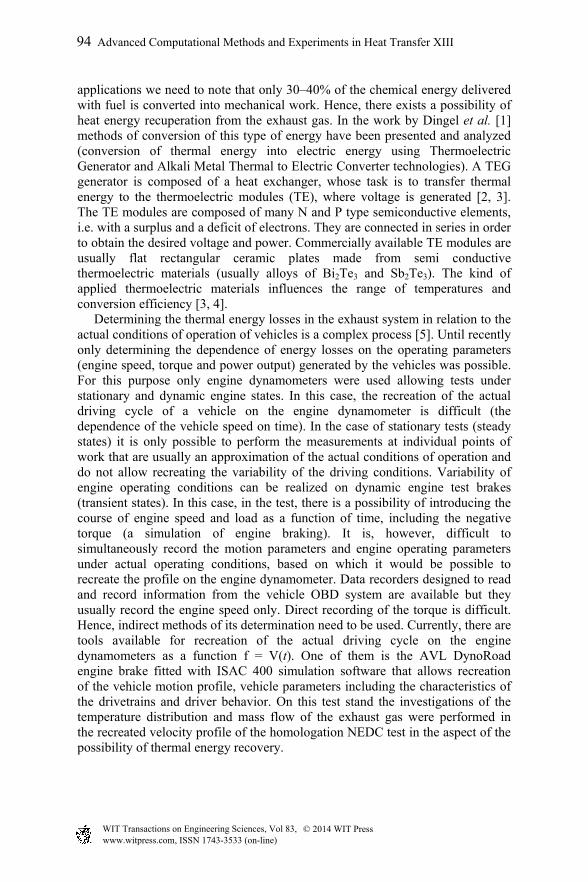
Analyzing the velocity profile obtained in the NEDC test performed on the engine test bed the authors confirmed that it is compliant with the profile prescribed by the standard. This is confirmed by the linear relation between the velocity demand and the actual velocity (Fig. 7). The presented model was described with linear regression whose coefficient of determination amounted to R2 = 0.9986. In previous works of the authors, similar relations were observed which confirms the reproducibility of the investigations in the NEDC test in the aspect of recreation of the velocity profile. The measurements in the NEDC homologation test are initiated from a cold engine start. However, the authors decided to stabilize the engine thermal state on the level of 60oC (temperature of coolant) prior to initiating the tests on the engine test bed. This aimed at eliminating the impact of the engine warm up phase on the thermal state of the exhaust system. It is noteworthy, at this point that in the warm up phase the greatest amount of thermal energy from the exhaust gas is used to heat up the catalytic supports and diesel particulate filters to reach light off temperature at which their conversion rate exceeds 50%. At this phase of the engine operation, it is disadvantageous to use any heat recovery systems because their efficiency will be very low. In the urban cycle of the NEDC test the exhaust gas temperature at all measurement points remained below 170oC (Fig. 8). Only in the expressway cycle high values of the temperature were recorded that amounted to t1 = 231.5oC, t2 = 202.3oC and t3 = 159oC. In the entire test, the highest temperature was recorded at the first measurement point that was closest to the oxidation catalyst. This is obvious because points t2 and t3 were at the end of the exhaust systems, which made the heat exchange area (exhaust gas - exhaust system walls - ambient air) greater than in the first case. It is particularly interesting that the greatest temperature drop was recorded between points t2 and t3 (in the exhaust silencer) (Fig. 9).
www.witpress.com, ISSN 1743-3533 (on-line) WIT Transactions on Engineering Sciences, Vol 83, © 2014 WIT Press
Advanced Computational Methods and Experiments in Heat Transfer XIII 99
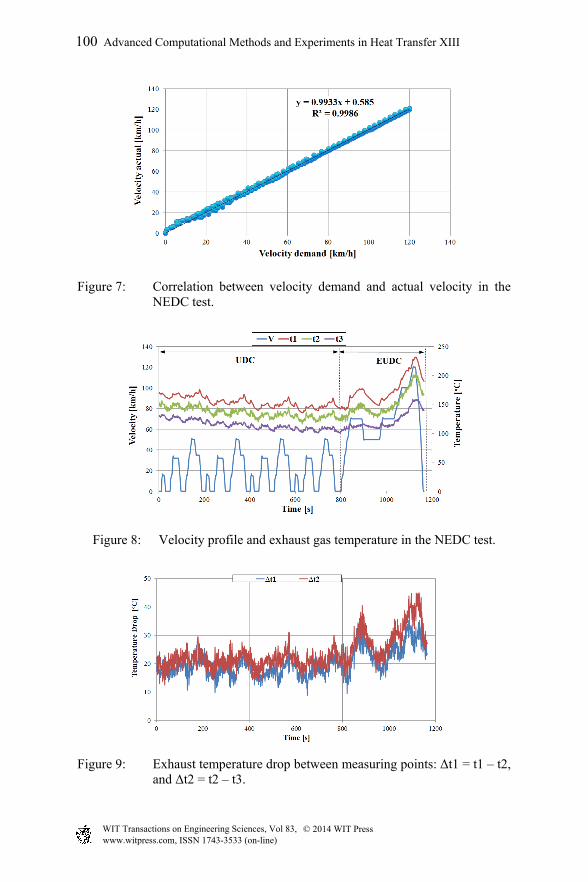
Figure 7: Correlation between velocity demand and actual velocity in the NEDC test.
Figure 8: Velocity profile and exhaust gas temperature in the NEDC test.
Figure 9: Exhaust temperature drop between measuring points: Δt1 = t1 – t2, and Δt2 = t2 – t3.
www.witpress.com, ISSN 1743-3533 (on-line) WIT Transactions on Engineering Sciences, Vol 83, © 2014 WIT Press
100 Advanced Computational Methods and Experiments in Heat Transfer XIII

Analyzing the temperature distribution in the exhaust system of the tested engine, the authors observed that its maximum value amounted to 170–231oC. This creates a potential for an application of a thermoelectric generator (TEG) utilizing the thermoelectric modules (TE) to recover thermal energy. Commercially available modules have a maximum hot side temperature of 175oC. This is extendable to 200oC if a special conducting PTFE paste is applied. When working on the application of thermoelectric generators in the exhaust system one should consider the sum of the flow resistances that will occur in the heat exchanger of the generator. Here, the key issue will be appropriate shape of it inlet and outlet part (diffuser and confusor of optimal dimensions and cross-sections adapted to the exhaust gas flow rate). In the performed tests, the maximum exhaust gas flow rate was 154.1 kg/h (Fig. 10). Its average value was 51.9 kg/h. The greatest surges were recorded when the vehicle drove off, which was related to an increased fuel consumption by the engine.
Figure 10: Exhaust mass flow rate in the NEDC test.
5 Conclusions
The authors adapted the exhaust system of the tested engine to most accurately reflect the actual exhaust system applied in vehicles (components, dimensions etc.). From the performed analysis of the temperature distribution of the exhaust gas in the NEDC test we know that: a) Its average value in the urban driving cycle (UDC) of the test was:
t1 = 160.1oC, t2 = 140.5oC, t3 = 116.9oC.
b) Its average value in the extra urban driving cycle (EUDC) of the test was:
t1 = 175.2oC, t2 = 156.4oC, t3 = 132.5oC.
www.witpress.com, ISSN 1743-3533 (on-line) WIT Transactions on Engineering Sciences, Vol 83, © 2014 WIT Press
Advanced Computational Methods and Experiments in Heat Transfer XIII 101

The obtained temperature values indicate a potential for an application of a thermal energy recovery system in the engine exhaust system. One of the possibilities is the application of a thermoelectric generator (TEG) that is used to convert thermal energy into electrical energy. In this case, however, its proper design in terms of heat conductivity and minimization of exhaust gas flow resistance are of paramount importance and so is the selection of the thermoelectric modules (TE) in terms of their maximum operating temperature.
Acknowledgement
The research was funded by the National Centre for Research and Development (Narodowe Centrum Badań i Rozwoju) – research project within the Applied Research Programme (contract No. PBS1/A6/7/2012).
References
[1] Dingel O, Semper T, Ambrosius V., Seebode J.: Waste Heat Recovery: What are the Alternatives to the thermoelectric Generator? Thermoelectrics Goes Automotive II (Thermoelectrics III), pp. 30-49, 2013.
[2] Hase S.: Prospects for TEG Practical Applications, by Physical Evaluation in varied Heat Recovery Technologies. Thermoelectrics Goes Automotive II (Thermoelectrics III), pp. 49-56, 2013.
[3] Wojciechowski, K.T., et al. Prototypical thermoelectric generator for waste heat conversion from combustion engines. Combustion Engines. 2013, 154(3), 60-71. ISSN 0138-0346.
[4] Jeffrey Snyder G., Toberer E. S.: Complex thermoelectric materials. Nature Materials 7, pp. 105-114 (2008).
[5] Penhalbel, L., Ferreira, E., Dantas de Araújo, J., Sobral, M. et al., “Methodology of Thermal Balance Test for Diesel engines”, SAE Technical Paper 2008-36-0205, 2008.
[6] ISAC 400 PUMA OPEN V1.5 User’s Guide. AVL, AT2775E, Rew. 12 July 2009.
[7] SSQ AVL PUMA OPEN 2011 User’s Guide. AVL, AT3475E, Rew. 14 April 2011.
[8] Merkisz, J. and Fuc, P., The Exhaust Emission from Light Duty Vehicles in Road Test in Urban Traffic, SAE Int. J. Fuels Lubr. 3(2):467-475, 2010.
[9] Merkisz J., Fuc P., Lijewski P., Ziolkowski A.: The on-road exhaust emissions from vehicles fitted with the start-stop system. Applied Mechanics and Materials Vol. 390 (2013), pp. 343-349.
[10] Vehicle Exhaust Flow Meter SEMTECH EFM. User’s Manual, Document 9510-085, Revision 1.4. Sensors Inc. 2001-2007.
www.witpress.com, ISSN 1743-3533 (on-line) WIT Transactions on Engineering Sciences, Vol 83, © 2014 WIT Press
102 Advanced Computational Methods and Experiments in Heat Transfer XIII