water chemistry of shoal creek and … chemistry of shoal creek and waller creek, austin, texas, and...
TRANSCRIPT
WATER CHEMISTRY OF SHOAL CREEK AND WALLER CREEK, AUSTIN, TEXAS, AND POTENTIAL SOURCES OF NITRATE
By Patricia B. Ging, Roger W. Lee, and Steven R. Silva
U.S. GEOLOGICAL SURVEY
Water-Resources Investigations Report 96-4167
Prepared in cooperation with the CITY OF AUSTIN
Austin, Texas 1996
U.S. DEPARTMENT OF THE INTERIOR
BRUCE BABBITT, Secretary
U.S. GEOLOGICAL SURVEY
Gordon P. Eaton, Director
Any use of trade, product, or firm names is for descriptive purposes only and does not imply endorsement by the U.S. Government.
For additional information write to: Copies of this report can be purchased from:
District Chief U.S. Geological SurveyU.S. Geological Survey Branch of Information Services8011 Cameron Rd. Box 25286Austin, TX 78754-3898 Denver, CO 80225-0286
CONTENTS
Abstract ............................................................................................................................^^ 1Introduction .......................................................................................................................................................................... 1
Purpose and Scope .................................................................................................................................................... 2Description of the Study Area and Historical Water-Chemistry Data ...................................................................... 2Nitrogen and Oxygen Isotopes in the Nitrate Ion ..................................................................................................... 2Acknowledgments..................................................................................................................................................... 7
Water Chemistry of Shoal Creek and Waller Creek ............................................................................................................. 7Collection of Samples ............................................................................................................................................... 7Chemical Characteristics .......................................................................................................................................... 7
Potential Sources of Nitrate ................................................................................................................................................. 12Conclusions .......................................................................................................................................................................... 17References ............................................................................................................................................................................ 20
FIGURES
1 3. Maps showing:1. Location of study area and sampling sites, Austin, Texas ......................................................................... 32. Land use for Shoal Creek and Waller Creek watersheds, Austin, Texas ................................................... 43. Soils for Shoal Creek and Waller Creek watersheds, Austin, Texas ......................................................... 5
4-8. Graphs showing:4. Approximate compositional ranges of 5 15N and 6 18O data for sources of nitrate .................................... 65. pH and alkalinity values grouped by sampling site for Shoal Creek and Waller Creek, Austin,
Texas .......................................................................................................................................................... 86. Dissolved calcium, magnesium, and sodium concentrations grouped by sampling site for
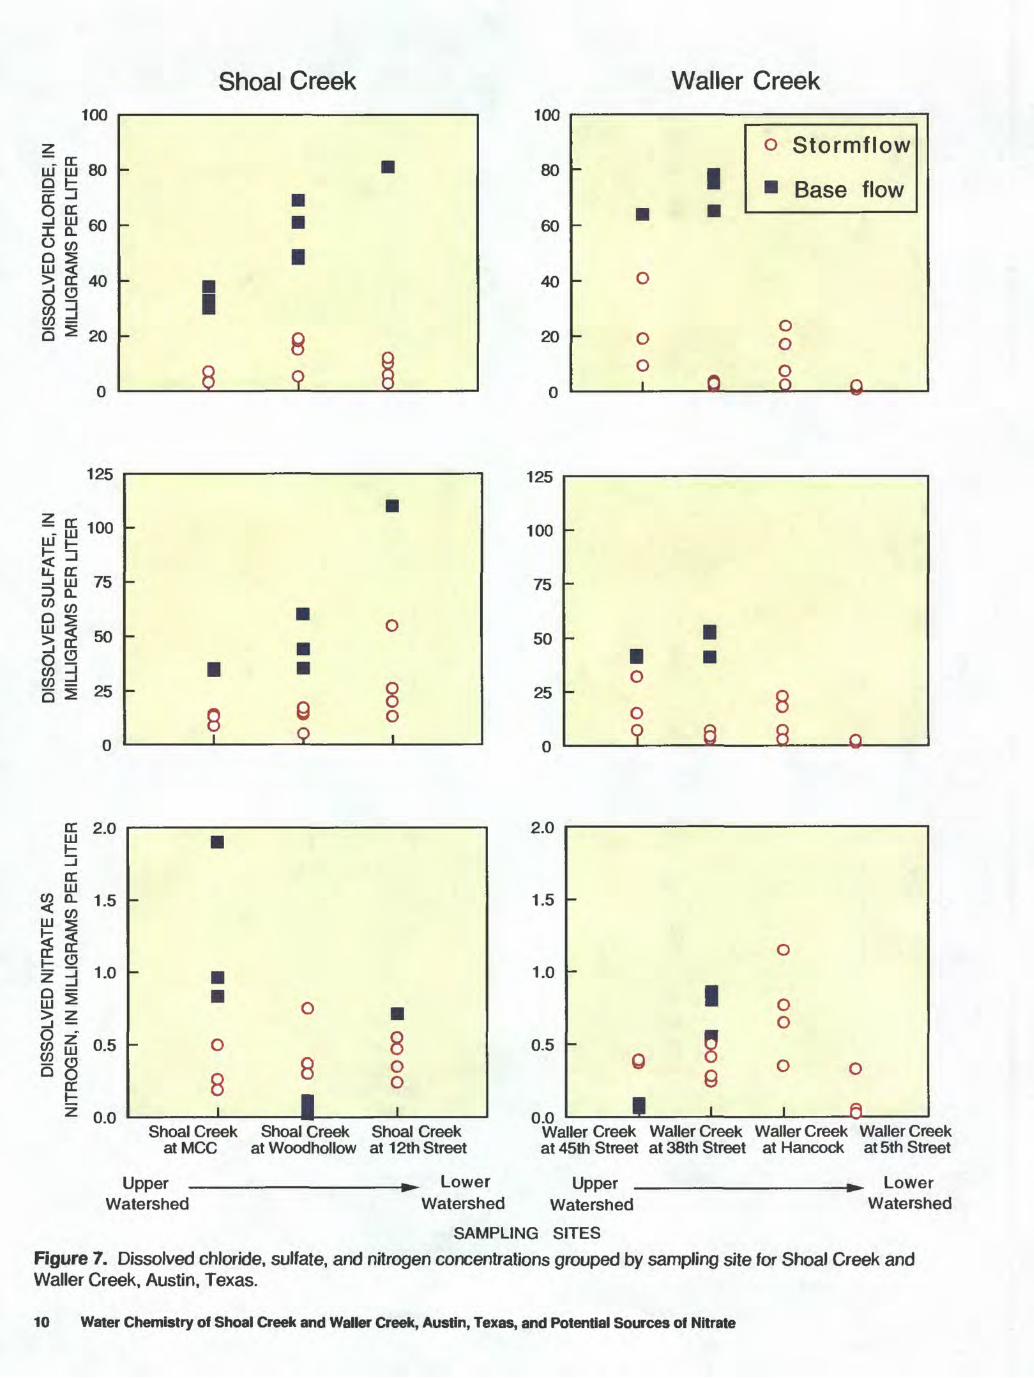
Shoal Creek and Waller Creek, Austin, Texas ........................................................................................... 97. Dissolved chloride, sulfate, and nitrogen concentrations grouped by sampling site for Shoal
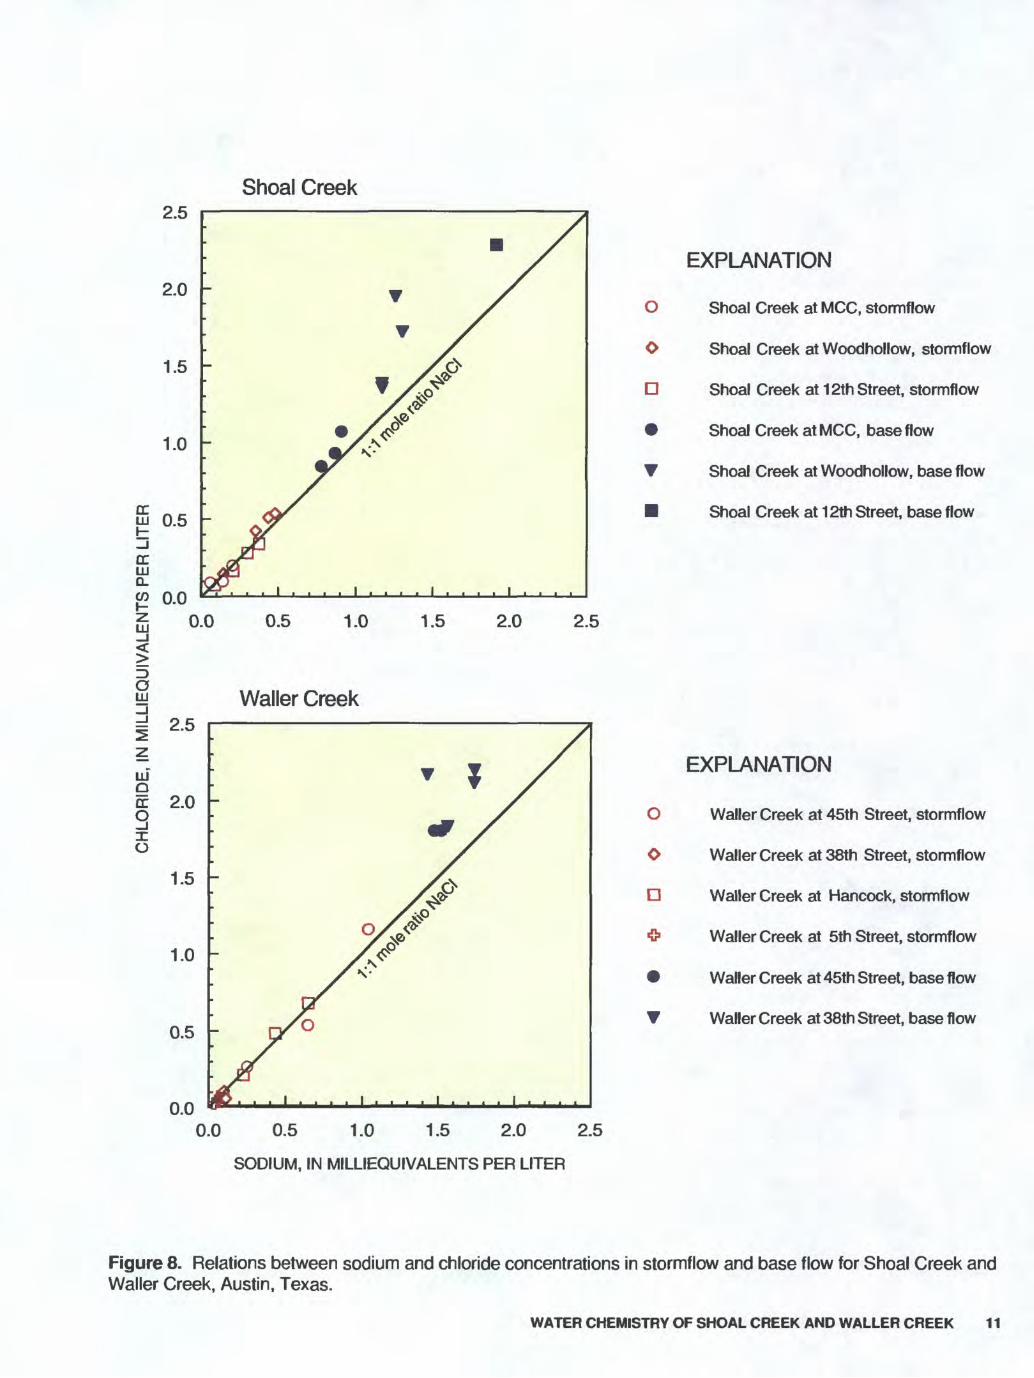
Creek and Waller Creek, Austin, Texas ..................................................................................................... 108. Relations between sodium and chloride concentrations in stormflow and base flow for Shoal
Creek and Waller Creek, Austin, Texas ..................................................................................................... 119 10. Trilinear diagrams of water from:
9. Shoal Creek, Austin, Texas ........................................................................................................................ 1310. WallerCreek, Austin, Texas ...................................................................................................................... 14
11 13. Graphs showing:11. 5 15N and 5 18O data for stormflow and base-flow samples from Shoal Creek and Waller Creek,
Austin, Texas, relative to compositional ranges for sources of nitrate ...................................................... 1512. 5 15N and 5 18O averages by sampling date for all sampling sites in Shoal Creek and Waller
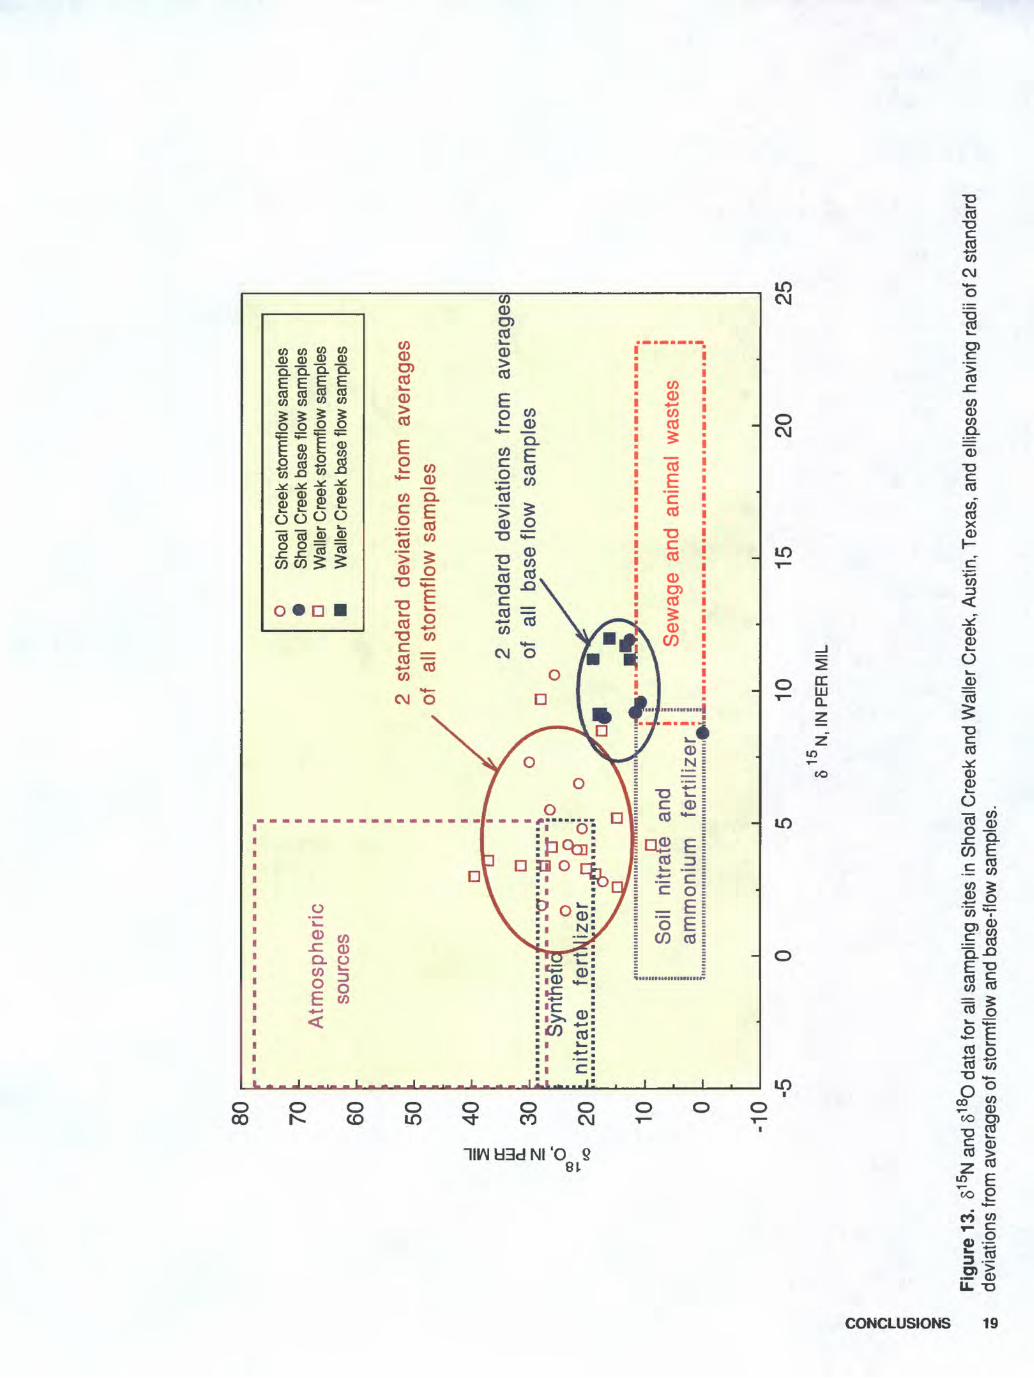
Creek, Austin, Texas .................................................................................................................................. 1813. 5 15N and 5 18O data for all sampling sites in Shoal Creek and Waller Creek, Austin, Texas,
and ellipses having radii of 2 standard deviations from averages of stormflow and base-flow samples ...................................................................................................................................................... 19
TABLES
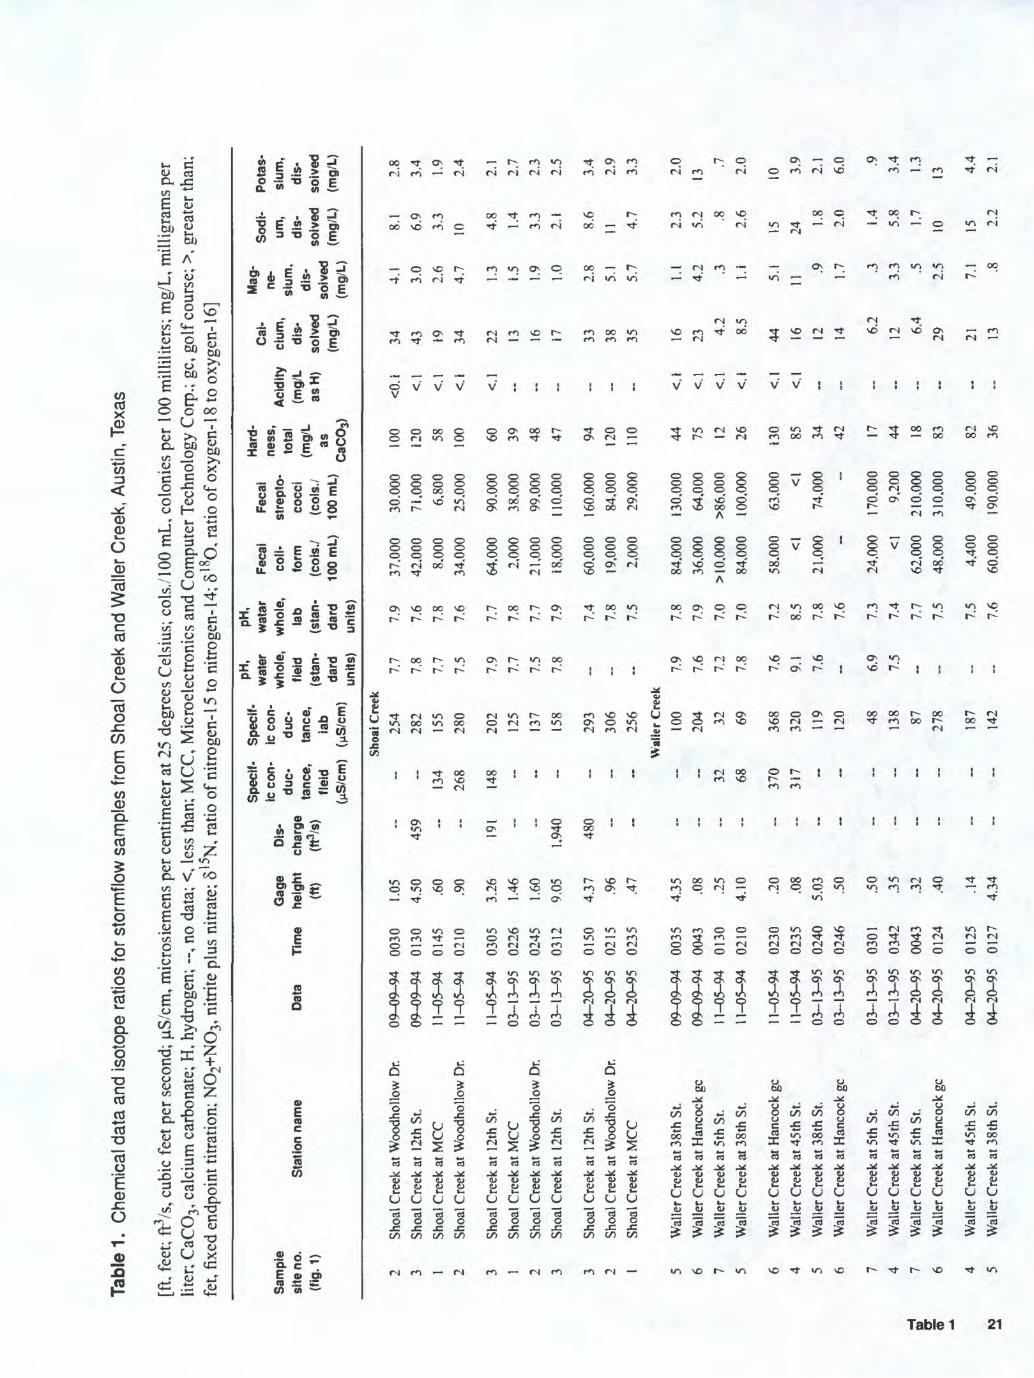
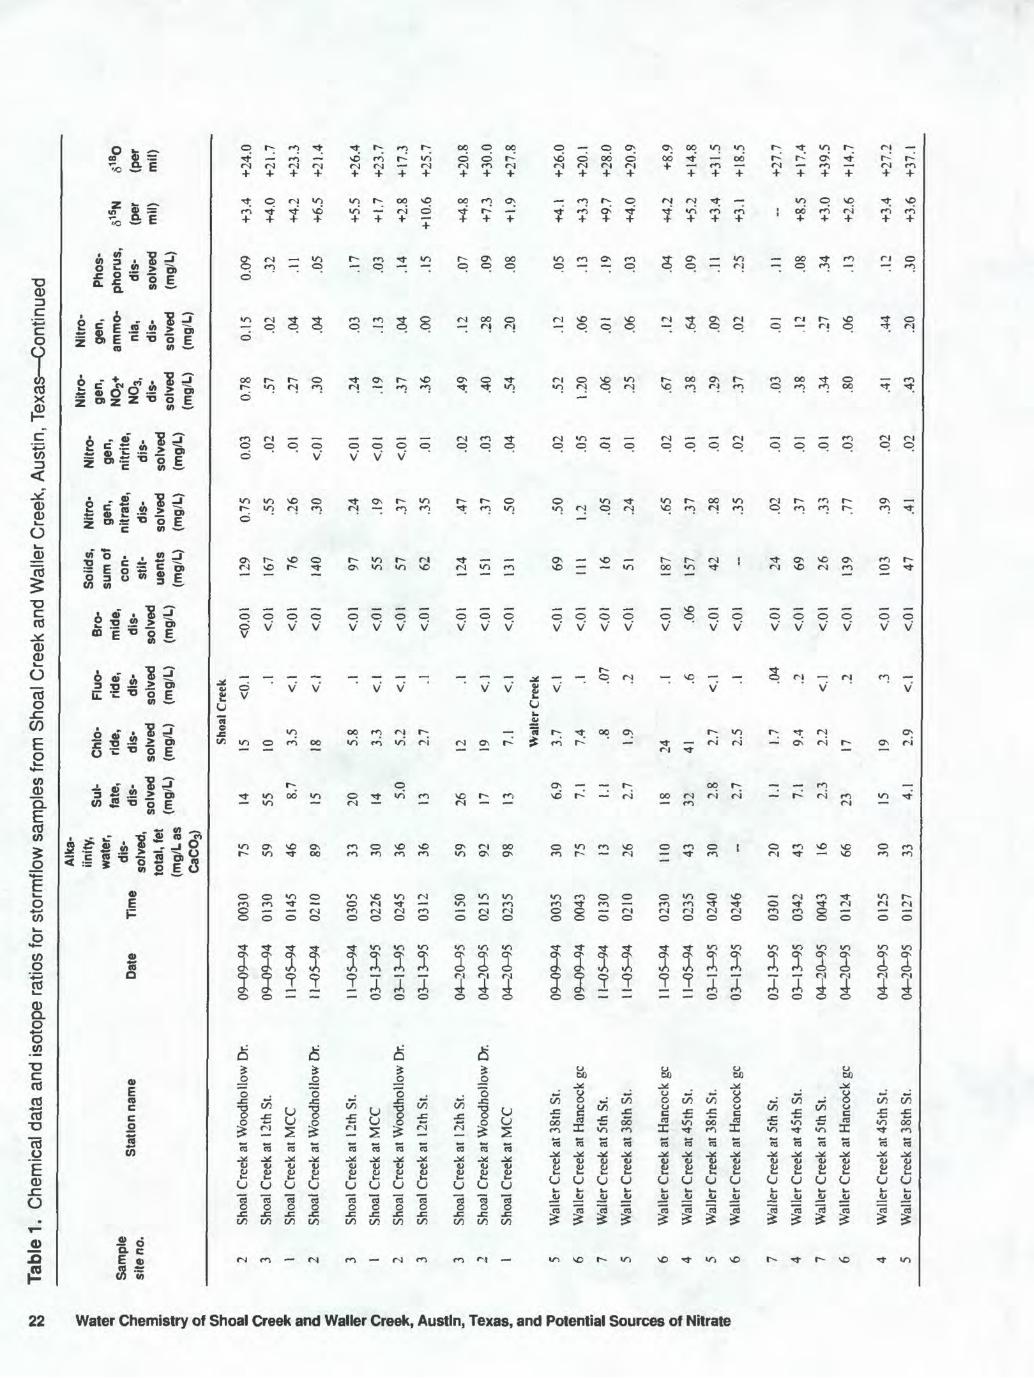
1. Chemical data and isotope ratios for stormflow samples from Shoal Creek and Waller Creek, Austin,Texas ..............................................................................................................................................................^ 21
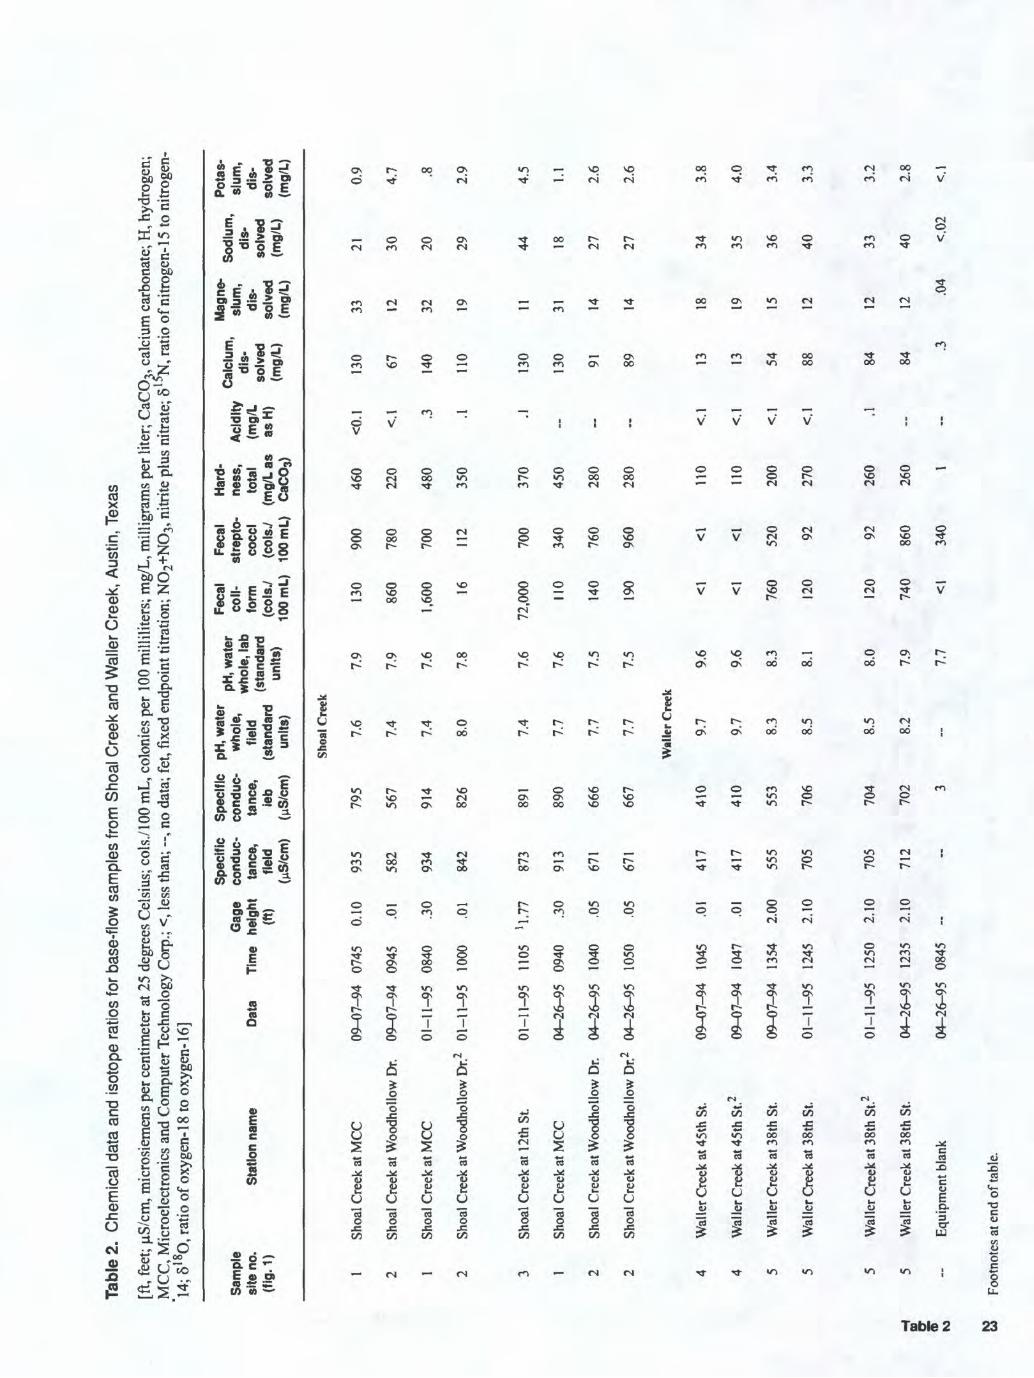
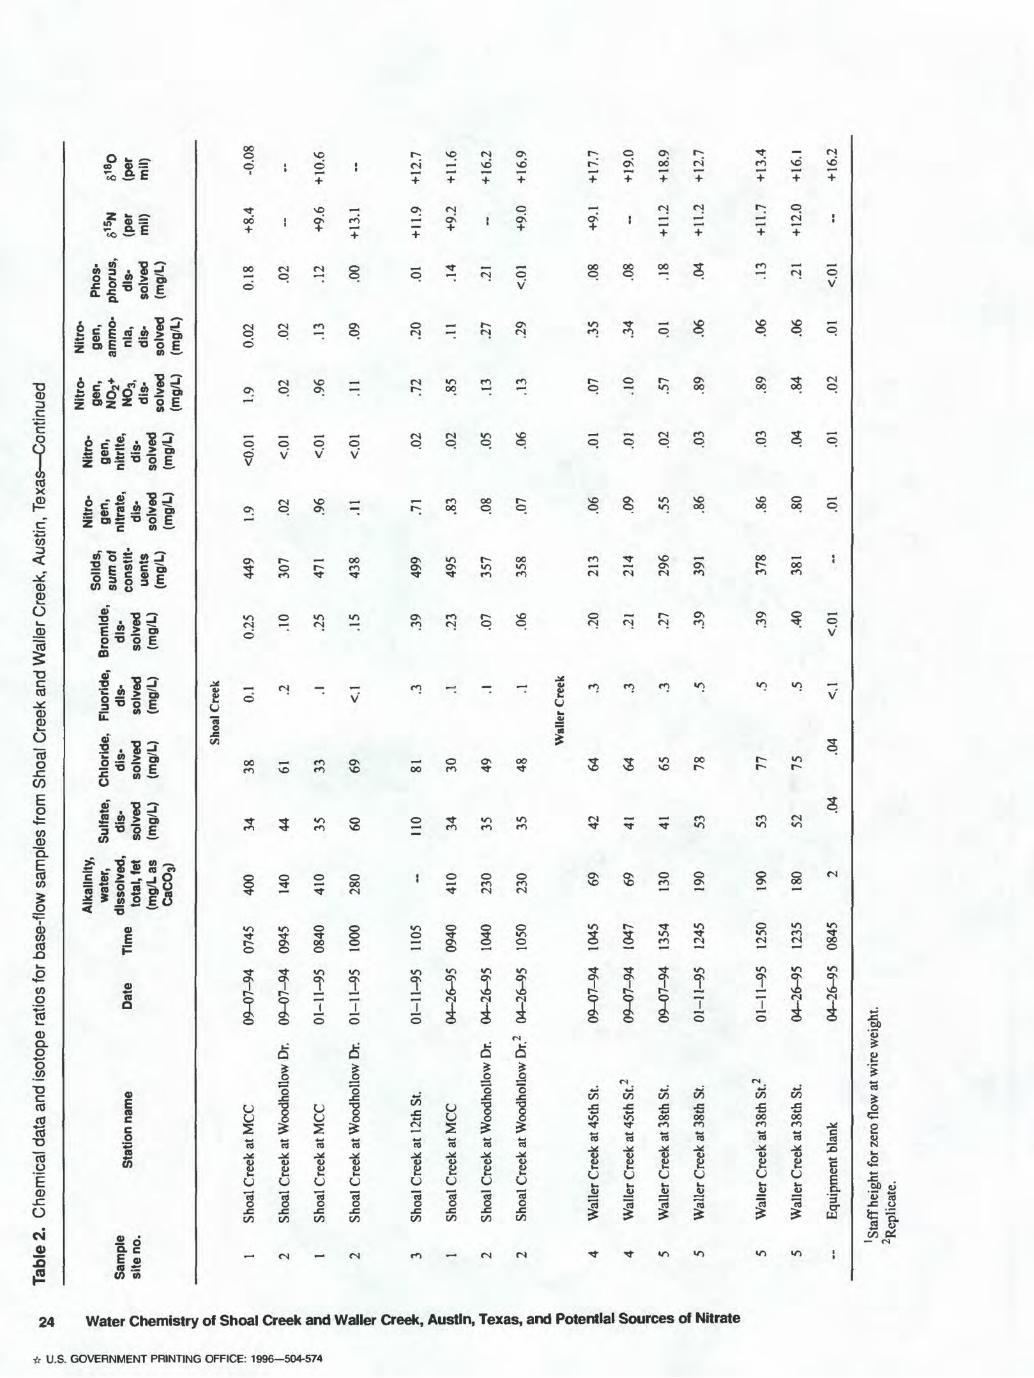
2. Chemical data and isotope ratios for base-flow samples from Shoal Creek and Waller Creek, Austin,Texas ..............................................................................................................................................................^ 23
3. Selected chemical data for rainfall samples taken near Shoal Creek and Waller Creek watersheds,Austin, Texas ........................................................................................................................................................ 16
4. Average nitrate concentrations, oxygen-18 values, and land-use information for stormflow and base- flow samples from Waller Creek, Austin, Texas .................................................................................................. 16
CONTENTS iii
Abbreviations and Acronyms
cols./ 1 00 mL, colonies per 100 millilitersft, footmi 2 , square milemg/L, milligram per literMCL, maximum contaminant levelMCC, Microelectronics and Computer Technology Corp.USGS, U.S. Geological Survey
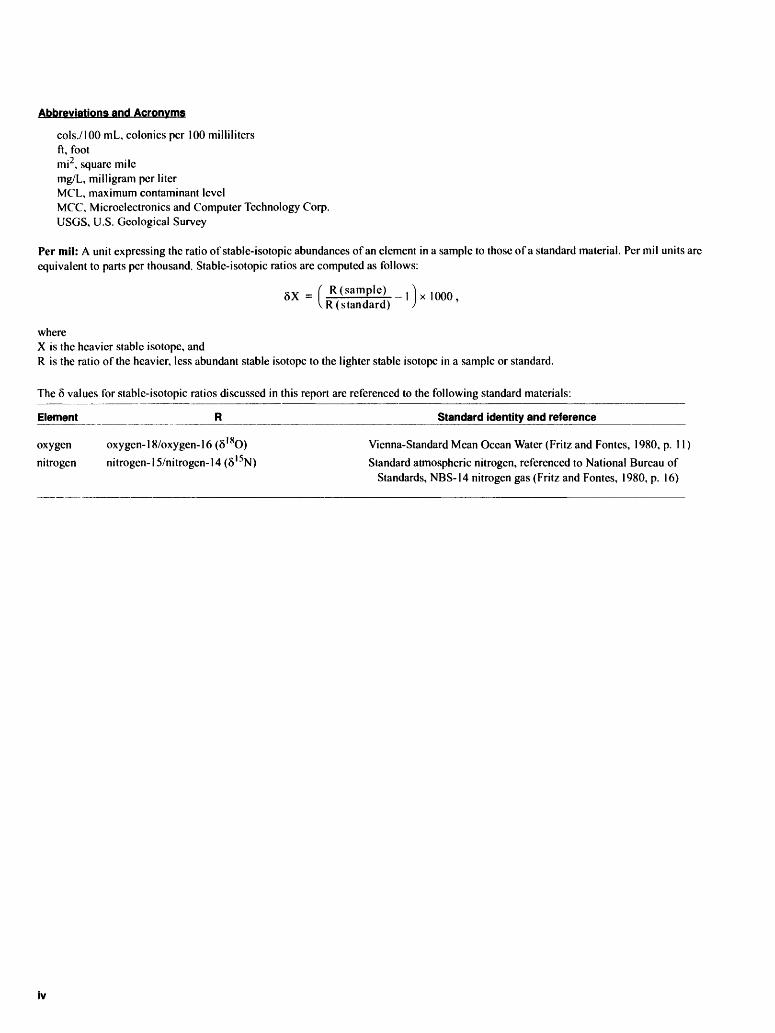
Per mil: A unit expressing the ratio of stable-isotopic abundances of an element in a sample to those of a standard material. Per mil units are equivalent to parts per thousand. Stable-isotopic ratios are computed as follows:
R (standard)-x^QQ,
whereX is the heavier stable isotope, andR is the ratio of the heavier, less abundant stable isotope to the lighter stable isotope in a sample or standard.
The 8 values for stable-isotopic ratios discussed in this report are referenced to the following standard materials:
Element ______________ R _______________________ Standard identity and reference _________
oxygen oxygen-!8/oxygen-16(6 18O) Vienna-Standard Mean Ocean Water (Fritz and Fontes, 1980, p. 11)
nitrogen nitrogen- 1 5/nitrogen- 1 4 (8 ' 5N) Standard atmospheric nitrogen, referenced to National Bureau ofStandards, NBS-14 nitrogen gas (Fritz and Fontes, 1980, p. 16)
IV
Water Chemistry of Shoal Creek and Waller Creek, Austin, Texas, and Potential Sources of Nitrate
By Patricia B. Ging, Roger W. Lee, and Steven R. Silva
Abstract
Steep limestone slopes, thin soils, sparse vegetation, and impervious cover within the Shoal Creek and Waller Creek watersheds, Austin, Texas, contribute to rapid runoff that can quickly carry contaminants such as nitrate, into the creeks. Land use within the watershed is predominantly residen tial (single-family and multifamily dwellings). Impervious cover within both watersheds was about 55 percent during 1994 95.
Water samples were collected for chemical analysis at seven sites in the Shoal Creek and Waller Creek watersheds from September 1994 to April 1995. Samples were collected during 4 stormflow events and 3 base-flow periods. Water samples were analyzed for major ions and nutrients as well as for nitrogen and oxygen isotopes in the nitrate anion. Concentrations of dissolved constitu ents, including nitrate, are smaller in stormflow samples than in base-flow samples. Calculated dis solved solids range from 16 to 187 milligrams per liter for stormflow samples and from 213 to 499 milligrams per liter for base-flow samples.
Nitrogen and oxygen isotopes in dissolved nitrate in conjunction with water chemistry were used to indicate sources of nitrate in surface water. A combination of atmospheric nitrate, and soil nitrate and ammonium fertilizer is the most likely source of nitrate in stormflow samples (assuming that there is little or no use of synthetic nitrate fer tilizers in the watersheds). Nitrogen and oxygen isotopic data in nitrate for stormflow samples are in or near the isotopic composition ranges for atmo spheric nitrate, and soil nitrate and ammonium fer tilizer sources. Nitrogen and oxygen isotopic data in nitrate for base-flow samples are in or near the
isotopic composition ranges for soil nitrate and ammonium fertilizer, and sewage and animal waste sources of nitrate. Sewage is the most likely source of nitrate in base flow because of the potential for older sewer lines to leak, the proximity of sewer lines to creek beds, and an excess of chloride relative to sodium at some sampling sites (an indi cator of the presence of sewage) under base-flow conditions. Nitrate in the creeks at any given time is a mixture that results predominantly from sur face sources (atmospheric nitrate, soil nitrate and ammonium fertilizer) during stormflow and pre dominantly from subsurface sources (sewage) dur ing base flow.
INTRODUCTION
Urban development can have an appreciable influence on water-quality conditions. Impervious cover in developed areas can result in increased runoff, conveying contaminants from point and nonpoint sources to local streams (City of Austin, 1990b). Any contaminant on land surface has the potential to quickly enter Shoal Creek and Waller Creek during storms owing to a large amount of impervious cover. Data pre viously collected by the U.S. Geological Survey (USGS) and the City of Austin have indicated the pres ence of nitrate, as nitrogen, in Shoal Creek and Waller Creek (Welborn and Veenhuis, 1987; City of Austin, 1990a); however, the data are inadequate to determine the sources of nitrate in the watersheds. Shoal Creek and Waller Creek drain into Town Lake, which is one of the water supplies for Austin. Increased nitrate concen trations in Town Lake could affect the quality of Aus tin's public water supply. Application of 5 15N and5 18O isotopic data from dissolved nitrate can indicate sources of nitrate in the Shoal Creek and Waller Creek water sheds and could contribute information useful for the improvement of water quality in these creeks.
Abstract
Purpose and Scope
The purpose of this report is to characterize the water chemistry in the Shoal Creek and Waller Creek watersheds and to indicate potential sources of nitrate in these watersheds. Twenty-five water samples were collected during stormflow conditions, and 14 water samples were collected during base-flow conditions at sites on the creeks or adjacent storm sewers from Sep tember 1994 to April 1995. Concentrations of selected constituents and isotopes of nitrogen and oxygen in the nitrate ion are used to show the water chemistry and potential sources of nitrate in the watersheds.
Description of the Study Area and Historical Water-Chemistry Data
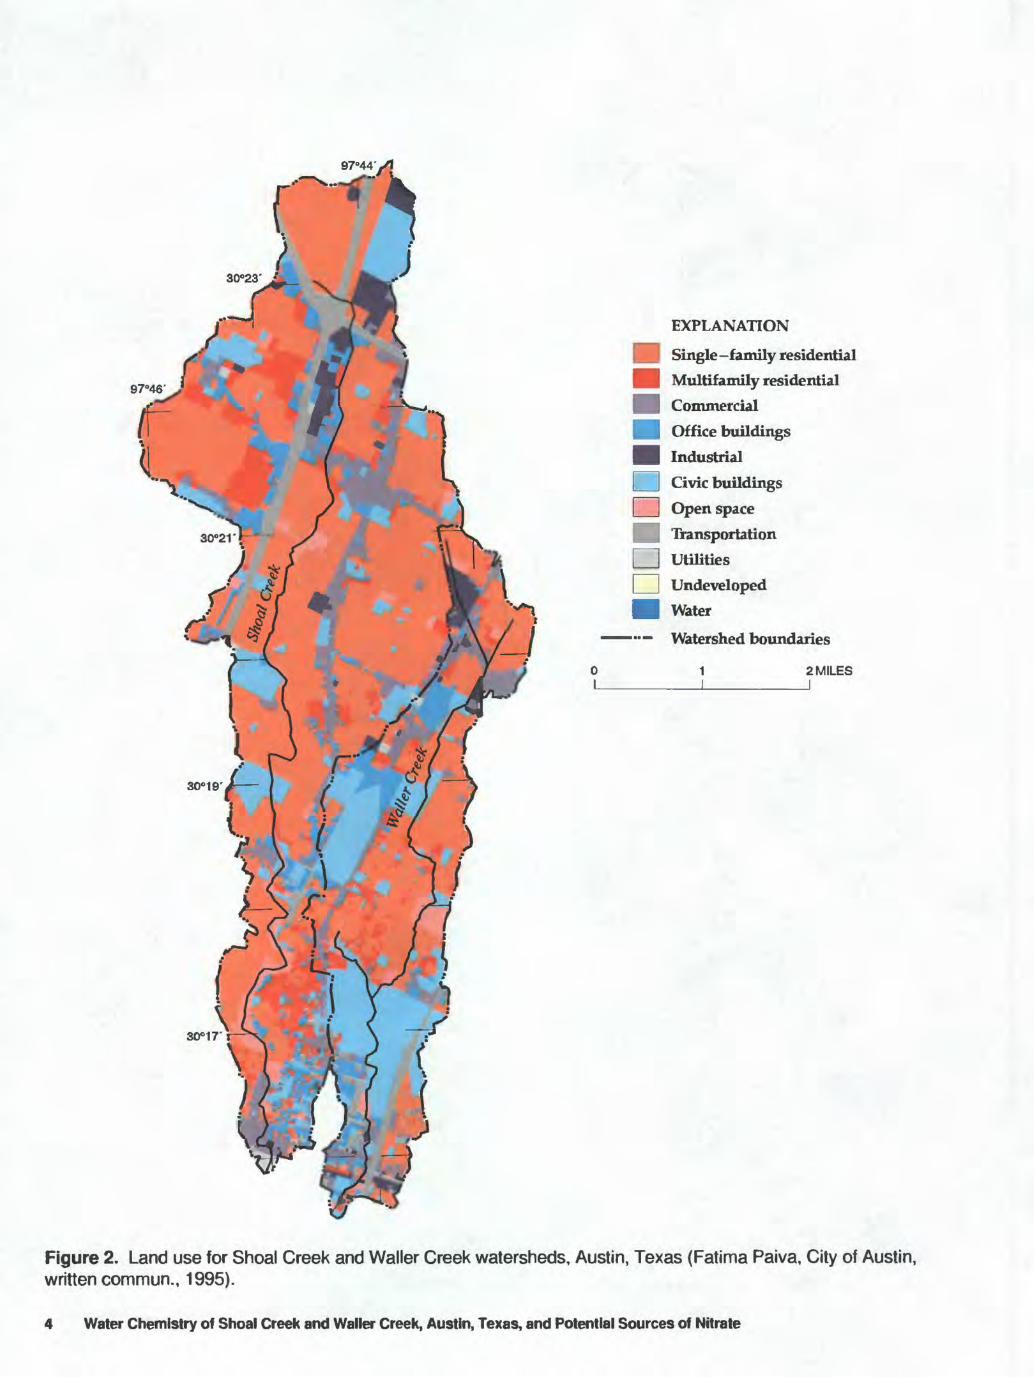
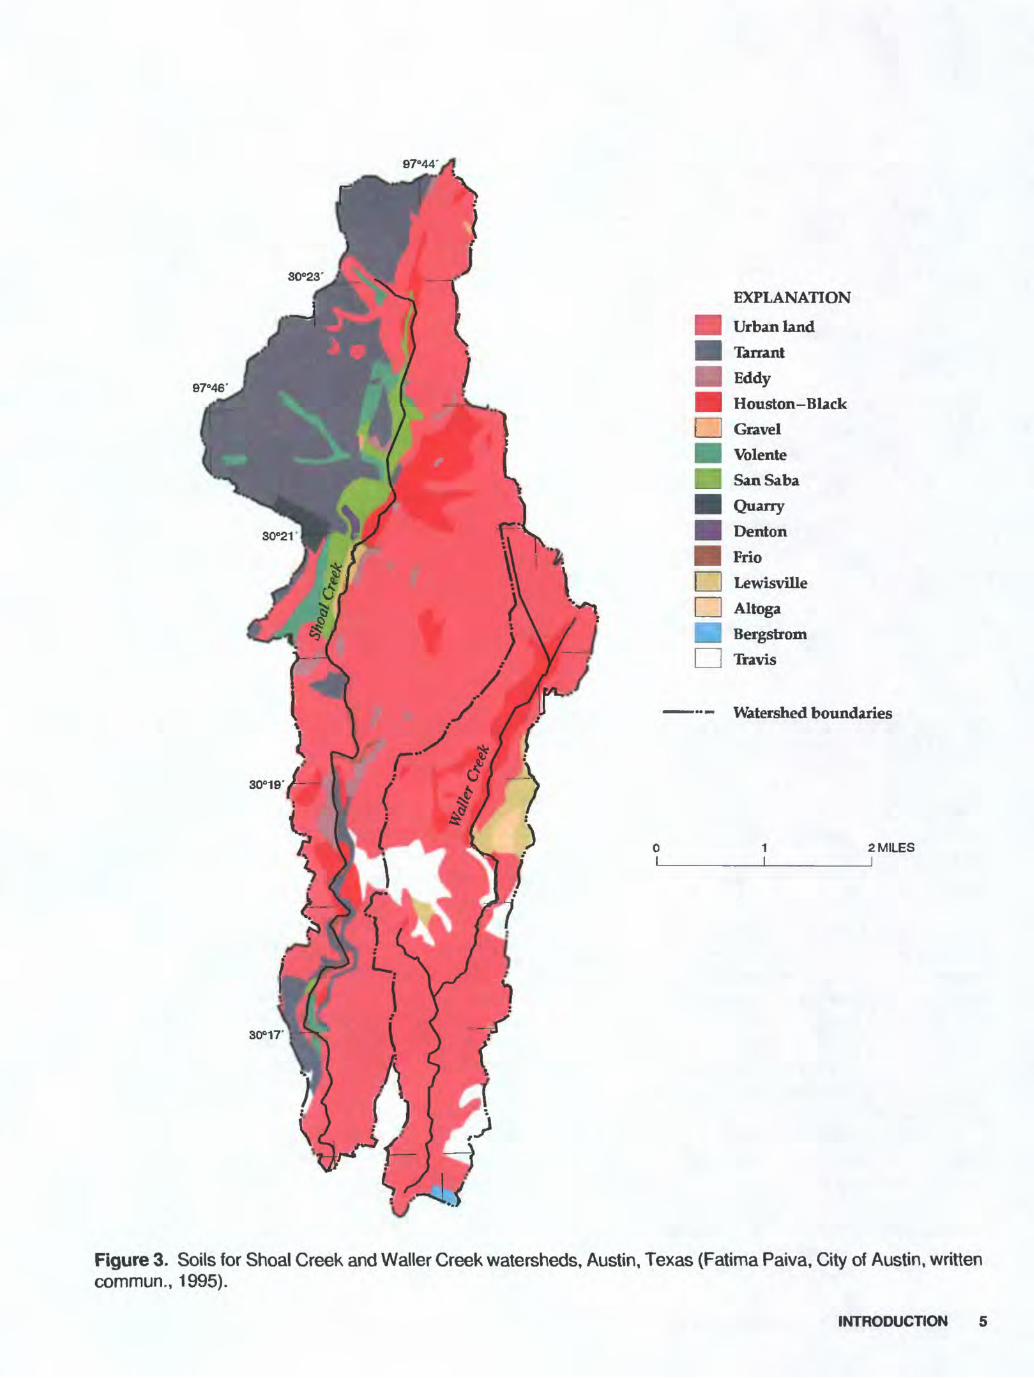
The Shoal Creek and Waller Creek watersheds in the City of Austin (fig. 1) contain steep limestone slopes, thin soils, sparse vegetation, and impervious cover. The Shoal Creek watershed has a drainage area of approximately 13 mi. There is a 320-ft decrease in altitude from the uppermost (highest elevations) part of the watershed to its outlet at Town Lake. The Shoal Creek watershed contains primarily residential areas with single-family dwellings (fig. 2). Soil type is pre dominantly "urban land" in the watershed (fig. 3) with about 55-percent impervious cover during 1994-95. The "urban land" soils classification represents soils altered and obscured by development that do not resemble soils described in the various series (U.S. Department of Agriculture, Soil Conservation Service, 1974).
The Waller Creek watershed has a drainage area of approximately 5.6 mi. As in the Shoal Creek watershed, altitude in the Waller Creek watershed decreases about 320 ft from the uppermost part of the watershed to its outlet at Town Lake. The Waller Creek watershed consists primarily of residential areas with single-family and multifamily dwellings. Soil types were predominantly urban land in the Waller Creek watershed with about 55-percent impervious cover during 1994^-95.
Both the Shoal Creek and Waller Creek water sheds contain wastewater lines for transport of sewage, but some septic tanks might exist in both watersheds (George Chang, City of Austin, oral commun., 1995). The exact location and condition of the septic tanks, if any, were not be determined during this investigation. One landfill located in the Waller Creek watershed con
tains drums filled with chemicals (George Chang, City of Austin, oral commun., 1995).
Historical water-chemistry data available for the Shoal Creek and Waller Creek watersheds were exam ined to determine variability of nitrate concentrations in the creeks. Although chemical data were collected as early as 1942, no consistent dataset of long-term water-quality monitoring was extant to determine tem poral trends in water chemistry in the watersheds. The USGS collected water-chemistry data at six locations along Shoal Creek from 1942 to 1946 and from Shoal Creek at 12th Street (station 08156800) from January 1975 to present (1995). The USGS collected water- chemistry data from Waller Creek at 38th Street (sta tion 08157000) from August 1954 to December 1962 and from Waller Creek at 23d Street (station 08157500) from October 1970 to August 1971. Dissolved nitrate concentrations (as nitrogen) generally ranged from 0 to 2 mg/L for both creeks (Raymond Slade, Jr., U.S. Geological Survey, oral commun., 1995) and were below the MCL of 10 mg/L for drinking water recom mended by the U.S. Environmental Protection Agency (1996). City of Austin staff also have collected water- chemistry data at Shoal Creek at Woodhollow and at various locations along Waller Creek from 1992 to present. Dissolved nitrite plus nitrate concentrations (as N) ranged from 0 to 2 mg/L and total nitrogen con centrations (as N) ranged from 0 to 7.5 mg/L, also below the recommended drinking-water standard (George Chang, City of Austin, oral commun., 1994).
Nitrogen and Oxygen Isotopes in the Nitrate Ion
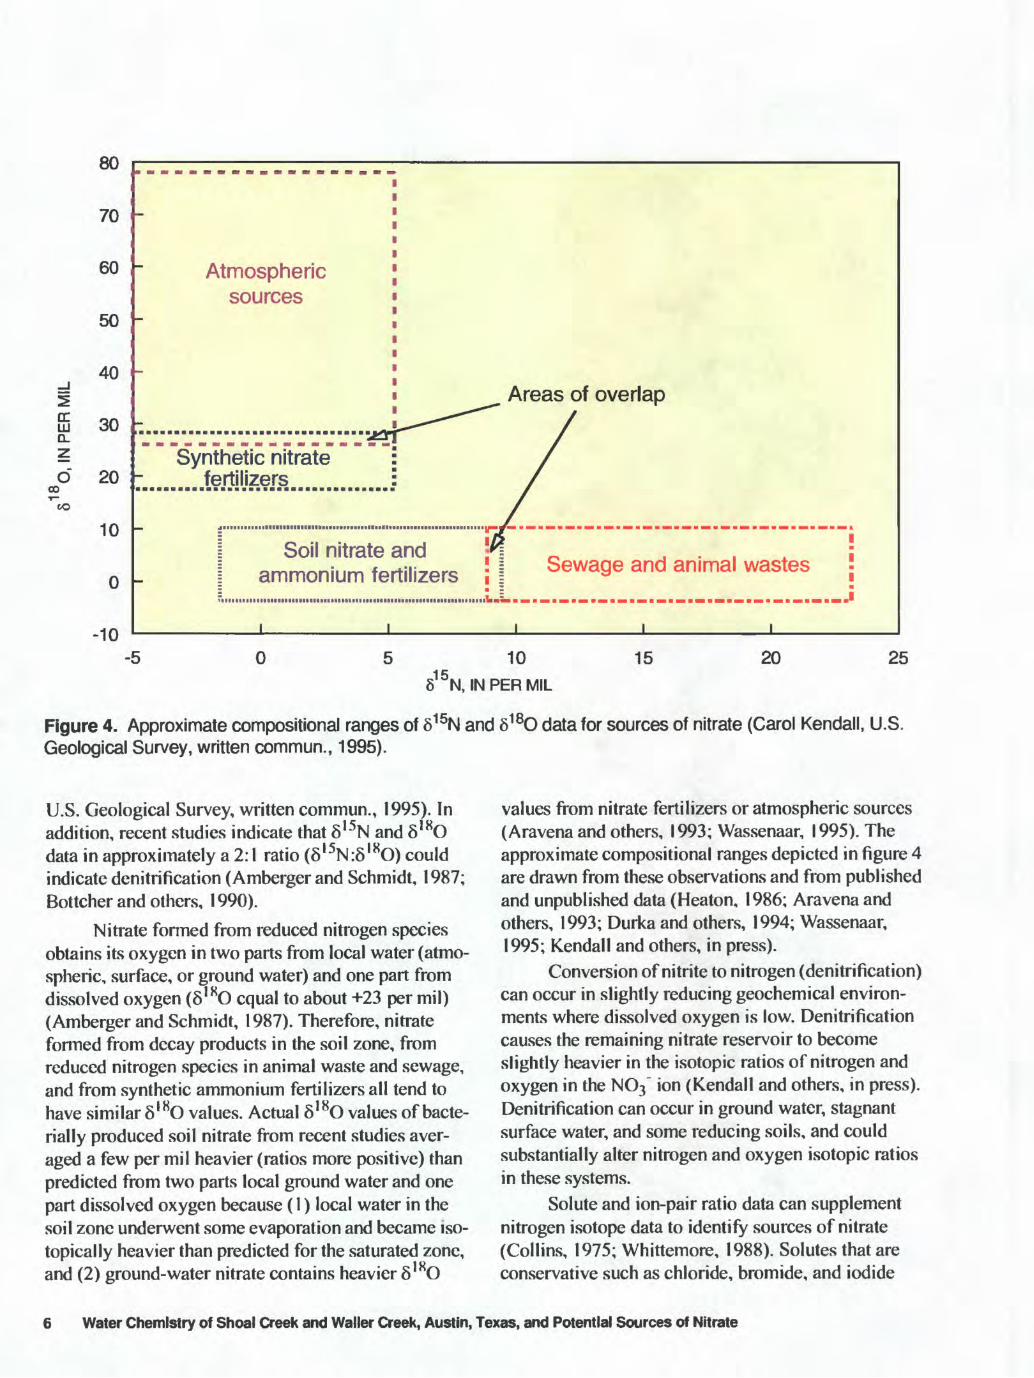
The combined stable isotopic ratios I5N/ I4N (8 I5N in per mil) and I8O/ I6O (8 I8O in per mil) in the nitrate ion, NO3 ", can be useful in surface- and ground-water investigations to determine sources of nitrate. Nitrate in surface and ground water can be derived from one or more of the following sources: (1) microbial decay of organic matter in soils, (2) ani mal waste and sewage, (3) synthetic fertilizers, and (4) rainfall. The usefulness of 8 I5N alone in identifying these sources is limited by overlapping ranges of 8 I5N values and by changes in the 8 I5N values of the sources caused by microbial denitrification and other processes. However, by combining 8 I5N and 8 I8O analyses, identifiable separations for all sources of nitrate except ammonium fertilizers and bacterially produced soil nitrate are possible (Carol Kendall,
Water Chemistry of Shoal Creek and Waller Creek, Austin, Texas, and Potential Sources of Nitrate

97°44'/J
97-46
EXPLANATION
Watershed boundaries
Location and number of sampling site. Sites not on streams are on storm sewers or tributaries. Site numbers refer to tables land 2
Waller Creek watershed
Shoal Creek watershed
2 MILES
Figure 1. Location of study area and sampling sites, Austin, Texas.
INTRODUCTION
97°46
30°17r
EXPLANATION
Single-family residential
^| Multifamily residential
^| Commercial
Of f ice buildings
^| Industrial
1, | Civic buildings
I | Open space
__, Transportation
[~~1 Utilities
I | Undeveloped
Water
..._ Watershed boundaries
1 2 MILES
Figure 2. Land use for Shoal Creek and Waller Creek watersheds, Austin, Texas (Fatima Paiva, City of Austin, written commun., 1995).
4 Water Chemistry of Shoal Creek and Waller Creek, Austin, Texas, and Potential Sources of Nitrate
97M4',
EXPLANATION
^| Urban land
H Tarrant
Eddy
^| Houston-Black
I | Gravel
H Volente
H SanSaba
^| Quarry
^| Denton
H Frio
| | Lewisville
I I Altoga
^| Bergstrom
| | Travis
- Watershed boundaries
2 MILES
30°17
Figure 3. Soils for Shoal Creek and Waller Creek watersheds, Austin, Texas (Fatima Paiva, City of Austin, written commun., 1995).
INTRODUCTION
80
70
60
50
40
S 30
O 20DOI
OO
10
0
-10-5
Atmospheric sources
Areas of overlap
Synthetic nitrate .....fertilizers.......
Soil nitrate and ammonium fertilizers ! | Sewage and animal wastes
zIMlliM«
0 10
815 N, IN PER MIL
15 20 25
Figure 4. Approximate compositional ranges of 515N and 518O data for sources of nitrate (Carol Kendall, U.S. Geological Survey, written commun., 1995).
U.S. Geological Survey, written commun., 1995). In addition, recent studies indicate that 8 15N and 8 18O data in approximately a 2:1 ratio (8 I5N:8 I8O) could indicate denitrification (Amberger and Schmidt, 1987; Bottcher and others, 1990).
Nitrate formed from reduced nitrogen species obtains its oxygen in two parts from local water (atmo spheric, surface, or ground water) and one part from dissolved oxygen (8 18O equal to about +23 per mil) (Amberger and Schmidt, 1987). Therefore, nitrate formed from decay products in the soil zone, from reduced nitrogen species in animal waste and sewage, and from synthetic ammonium fertilizers all tend to have similar 8 I8O values. Actual 8 18O values of bacte- rially produced soil nitrate from recent studies aver aged a few per mil heavier (ratios more positive) than predicted from two parts local ground water and one part dissolved oxygen because (1) local water in the soil zone underwent some evaporation and became iso- topically heavier than predicted for the saturated zone, and (2) ground-water nitrate contains heavier 8 18O
values from nitrate fertilizers or atmospheric sources (Aravenaand others, 1993; Wassenaar, 1995). The approximate compositional ranges depicted in figure 4 are drawn from these observations and from published and unpublished data (Heaton, 1986; Aravena and others, 1993; Durka and others, 1994; Wassenaar, 1995; Kendall and others, in press).
Conversion of nitrite to nitrogen (denitrification) can occur in slightly reducing geochemical environ ments where dissolved oxygen is low. Denitrification causes the remaining nitrate reservoir to become slightly heavier in the isotopic ratios of nitrogen and oxygen in the NO3" ion (Kendall and others, in press). Denitrification can occur in ground water, stagnant surface water, and some reducing soils, and could substantially alter nitrogen and oxygen isotopic ratios in these systems.
Solute and ion-pair ratio data can supplement nitrogen isotope data to identify sources of nitrate (Collins, 1975; Whittemore, 1988). Solutes that are conservative such as chloride, bromide, and iodide
6 Water Chemistry of Shoal Creek and Waller Creek, Austin, Texas, and Potential Sources of Nitrate
serve as tracers when transported with nitrate, resulting in ratios that might identify a nitrate source. Bromide and iodide tracers can identify components of fertilizer entering surface water. Dissolved chloride in conjunc tion with 8 I5N data has been used to identify nitrate sources for municipal sewage (Avimelech and Raveh, 1976).
Acknowledgments
The project was done in cooperation with the City of Austin. Members of the Environmental and Conser vation Services Department who participated in the project are George Chang, Project Manager; Jim Hubka and David Johns, scientific staff; Tom Brown, Steve Raymond, John Watkins, and Rene Avila, data collec tion. USGS staff who assisted with data collection are Mike Dorsey, Searcy Jacobs, Sonya Jones, and Joy Lizarraga.
WATER CHEMISTRY OF SHOAL CREEK AND WALLER CREEK
Collection of Samples
Samples were collected for chemical analysis at 7 sites in the 2 watersheds, 3 in the Shoal Creek water shed and 4 in the Waller Creek watershed, from Septem ber 1994 to April 1995 (fig. 1; tables 1, 2 at end of report). Samples were collected during 4 stormflow events and 3 base-flow periods for a total of 39 samples. Some sites did not sustain base flow and therefore base- flow samples were not collected at those sites. One sam pling site. Shoal Creek at MCC (site I), was used as the best available background site. The other sampling sites were Shoal Creek at Woodhollow Drive (site 2), Shoal Creek at 12th Street (site 3), Waller Creek at 45th Street (site 4), Waller Creek at 38th Street (site 5), Waller Creek at Hancock golf course (site 6), and Waller Creek at 5th Street (site 7). Waller Creek at 45th Street and Waller Creek at 5th Street sampling sites are storm sew ers draining into Waller Creek and are not on the main stem of the creek. Waller Creek at Hancock golf course sampling site is on a small tributary to Waller Creek. All other sampling sites are located on the main channels.
Sample collection was done primarily by the USGS. Staff of the City of Austin collected storm samples from sites 5, 6, and 7. For quality assurance, replicate samples and one equipment blank also were collected. An equipment blank is a sample of the deion- ized water used to decontaminate field equipment.
Three replicate samples from three locations at different times indicated that chemical constituent concentra tions were within acceptable limits. The equipment blank showed no significant amounts of chemical con stituents or fecal coliform. However, fecal streptococci measured 340 cols./100 mL in the equipment blank, indicating that some contamination of equipment was possible (table 2) and these data should be interpreted with caution.
Temperature, specific conductance, pH, and alkalinity were measured in the field when possible. Water samples were analyzed at the USGS National Water Quality Laboratory in Denver, Colo., for major cations, major anions, and nutrients. The stable isotopes of nitrate, 8 I5N and 8 I8O, were analyzed by the USGS in Menlo Park, Calif. Fecal coliform and fecal strepto cocci bacteria were measured at the USGS laboratory in Austin, Tex.
Chemical Characteristics
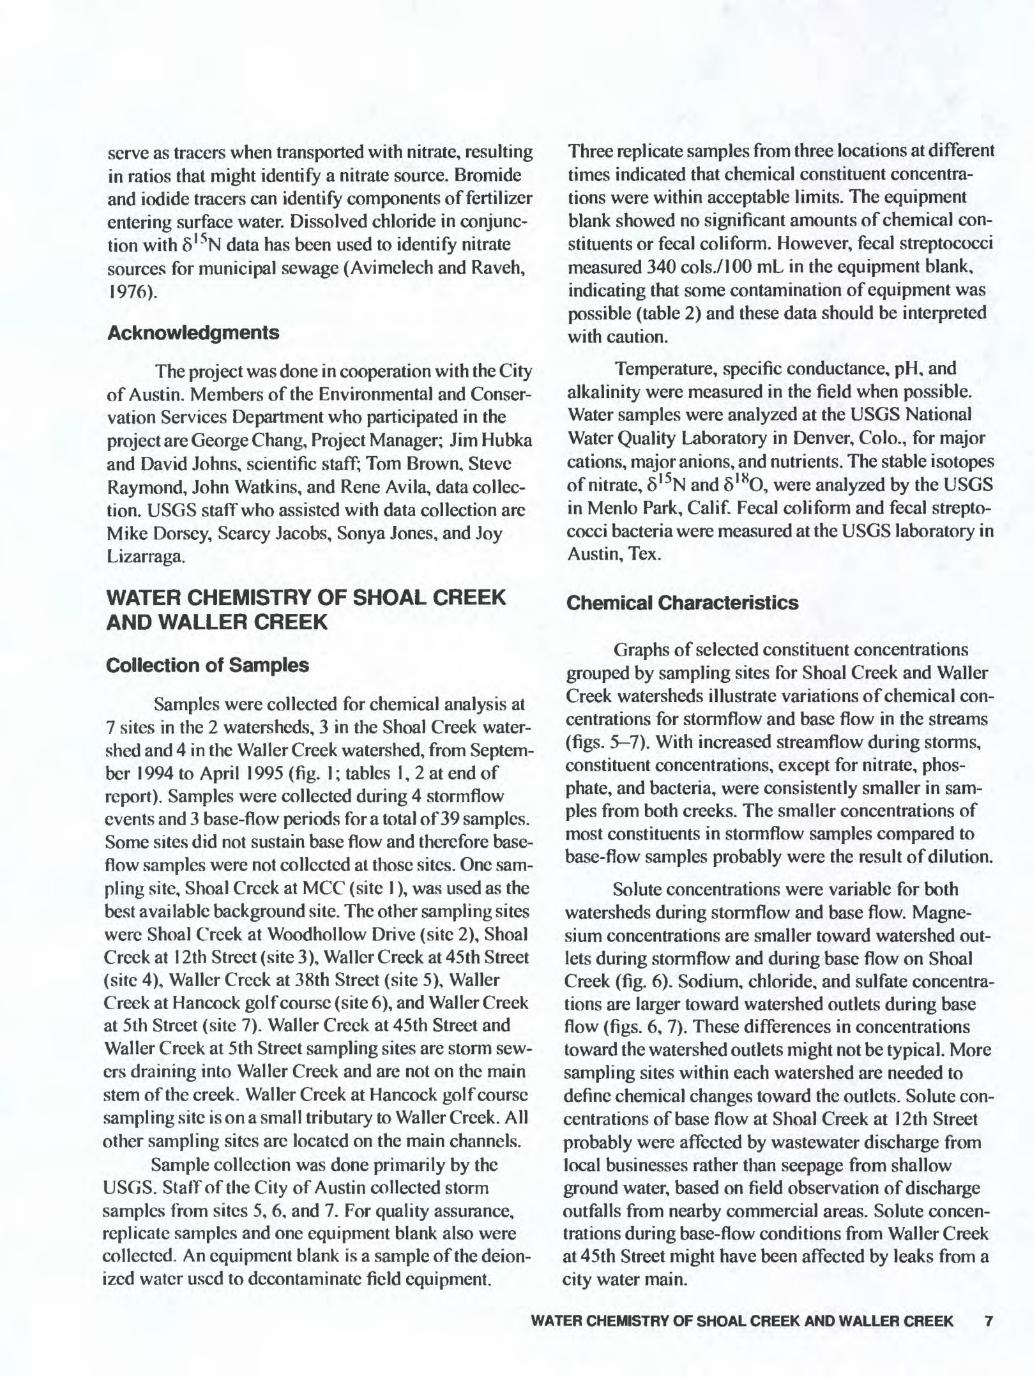
Graphs of selected constituent concentrations grouped by sampling sites for Shoal Creek and Waller Creek watersheds illustrate variations of chemical con centrations for stormflow and base flow in the streams (figs. 5 7). With increased streamflow during storms, constituent concentrations, except for nitrate, phos phate, and bacteria, were consistently smaller in sam ples from both creeks. The smaller concentrations of most constituents in stormflow samples compared to base-flow samples probably were the result of dilution.
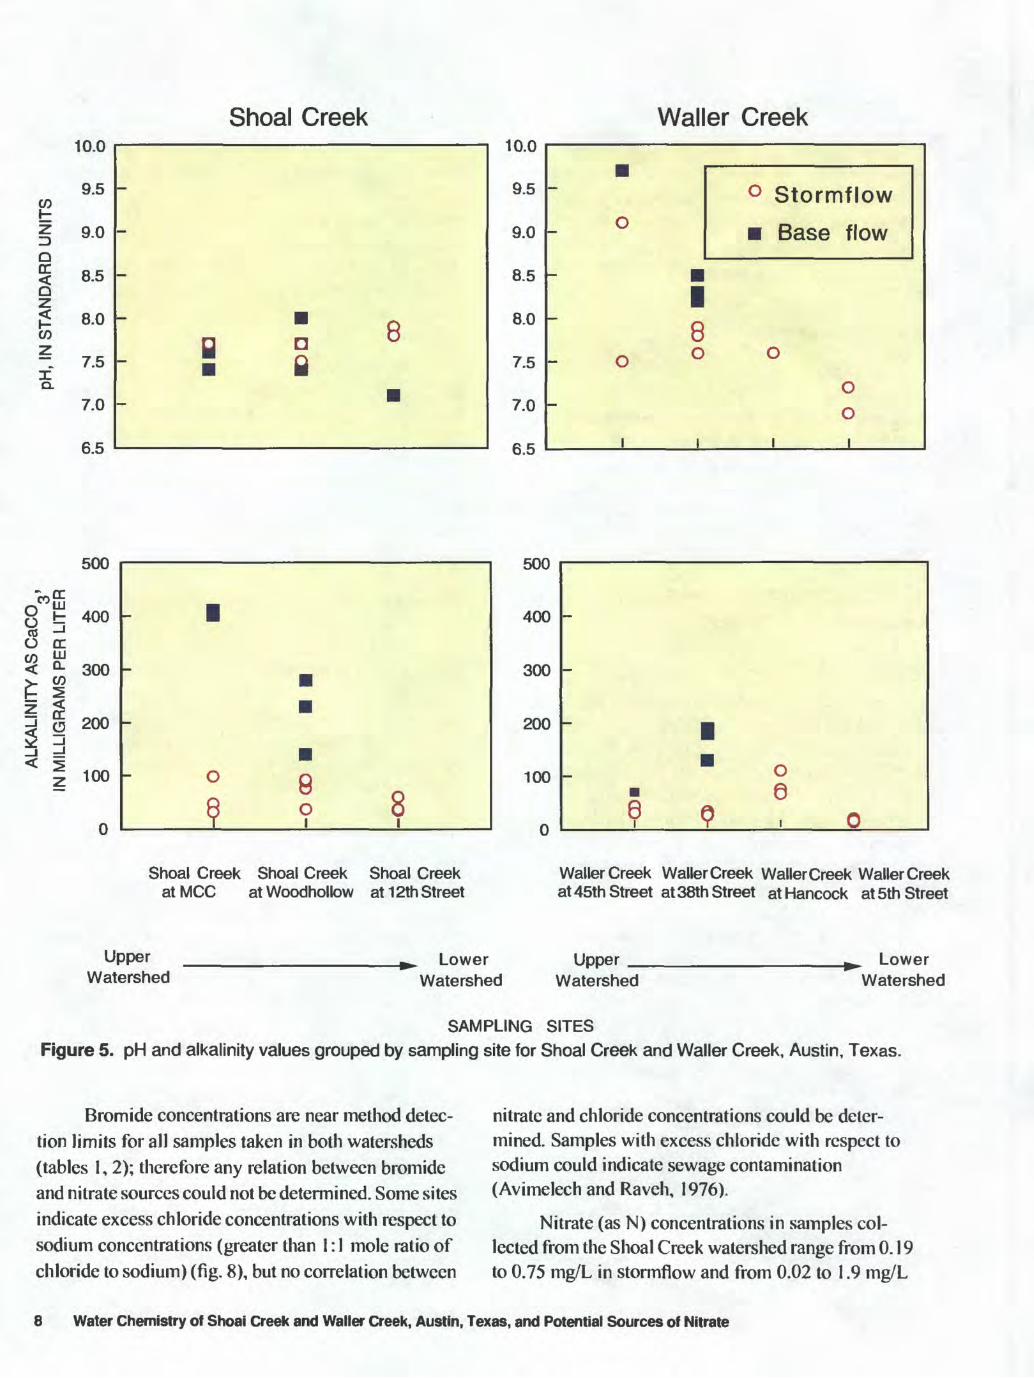
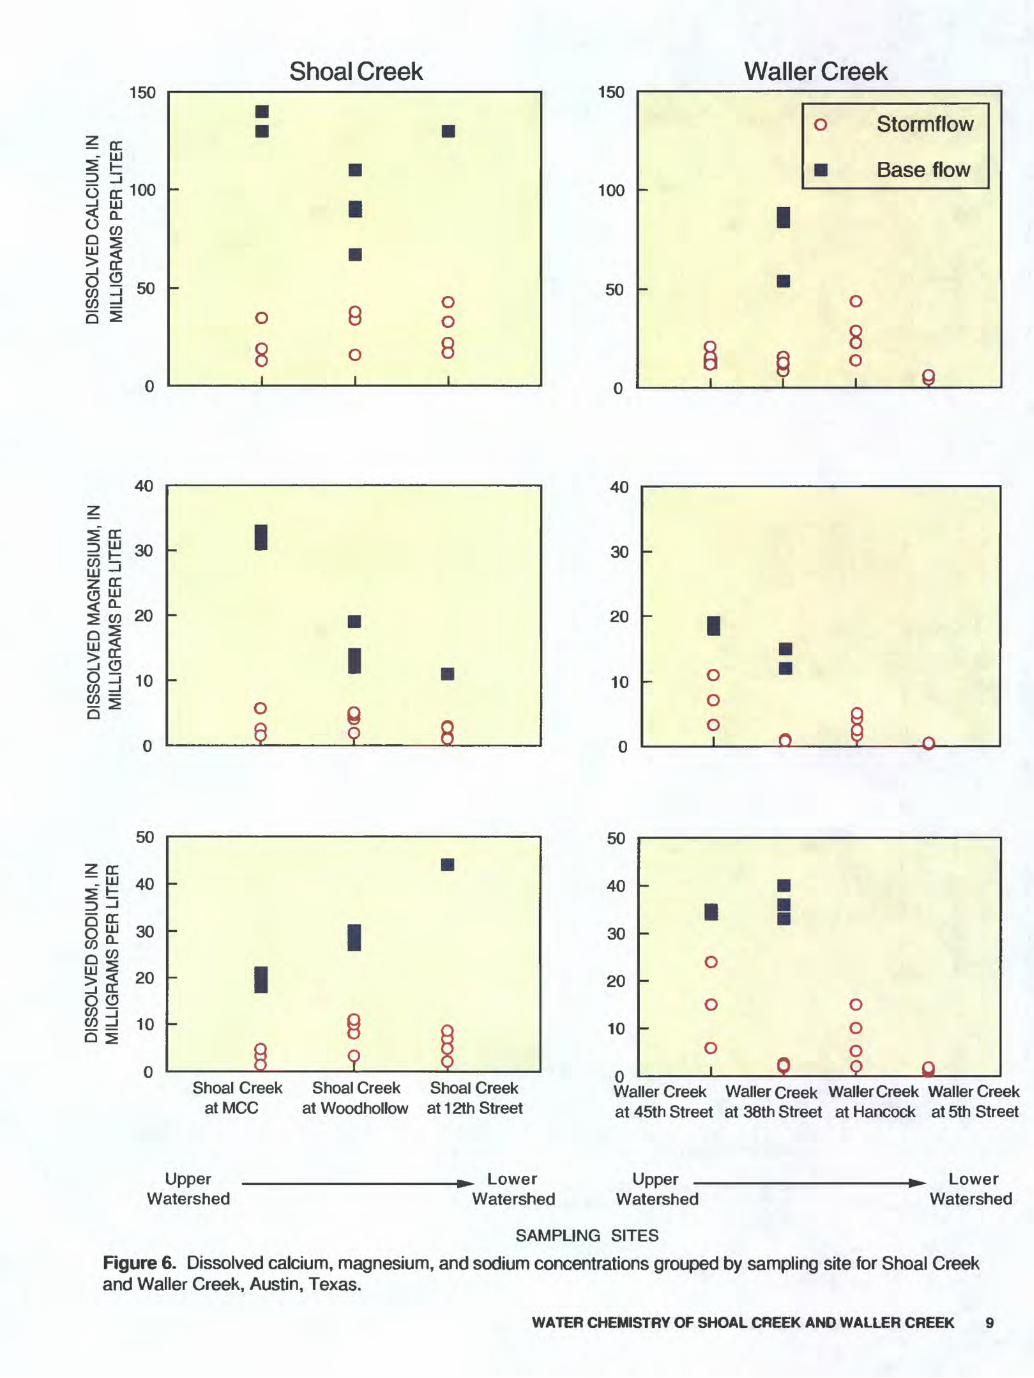
Solute concentrations were variable for both watersheds during stormflow and base flow. Magne sium concentrations are smaller toward watershed out lets during stormflow and during base flow on Shoal Creek (fig. 6). Sodium, chloride, and sulfate concentra tions are larger toward watershed outlets during base flow (figs. 6, 7). These differences in concentrations toward the watershed outlets might not be typical. More sampling sites within each watershed are needed to define chemical changes toward the outlets. Solute con centrations of base flow at Shoal Creek at 12th Street probably were affected by wastewater discharge from local businesses rather than seepage from shallow ground water, based on field observation of discharge outfalls from nearby commercial areas. Solute concen trations during base-flow conditions from Waller Creek at 45th Street might have been affected by leaks from a city water main.
WATER CHEMISTRY OF SHOAL CREEK AND WALLER CREEK 7
co
zD Qcc
CO
0.
>
10.0
9.5
9.0
8.5
8.0
7.5
7.0
RR
Shoal Creek
f y n ft m fi
10.0
9.5
9.0
8.5
8.0
7.5
7.0
fi R
Waller Creek
0 Stormflow
° Base flow
I8
- o o o
I 1 I I
"c
83tr\<
LKALINITY
>cc^UJ
ccUJ0.
ILLIGRAMS
*
OUU
400
300
200
100
n
_
5 ? ?
500
400
300
200
100
0
o 6
Shoal Creek Shoal Creek Shoal Creek at MCC at Woodhollow at 12th Street
Waller Creek WallerCreek Waller Creek Waller Creek at 45th Street at 38th Street at Hancock at 5th Street
Upper Watershed
. Lower Watershed
UpperWatershed
_ Lower Watershed
SAMPLING SITES Figure 5. pH and alkalinity values grouped by sampling site for Shoal Creek and Waller Creek, Austin, Texas.
Bromide concentrations are near method detec tion limits for all samples taken in both watersheds (tables 1,2); therefore any relation between bromide and nitrate sources could not be determined. Some sites indicate excess chloride concentrations with respect to sodium concentrations (greater than I: I mole ratio of chloride to sodium) (fig. 8), but no correlation between
nitrate and chloride concentrations could be deter mined. Samples with excess chloride with respect to sodium could indicate sewage contamination (Avimelech and Raveh, 1976).
Nitrate (as N) concentrations in samples col lected from the Shoal Creek watershed range from 0.19 to 0.75 mg/L in stormflow and from 0.02 to 1.9 mg/L
8 Water Chemistry of Shoai Creek and Waller Creek, Austin, Texas, and Potential Sources of Nitrate
Shoal Creek Waller Creek10U
^ cc
0 cc 100-J LU < Q.
0 W
U _ enCO '
Q 2
0
z
1^ 30CO 5LU 'Z CC° CL
1 co 20Q ^
O j 10CO ^
0
enov
Z CC i'H 40
|g 30
Q £
§| ^O
§ ~j _ =! 10 Q 2
1
0 0 ° o o o
8 o 8
I
1
898
11
Q
8 9 8
IOU
mnIUU
50
0
40
30
20
10
0
enou
40
30
20
10
o Stormflow
Base flow
I
o
? 9 ? Q
o oo g
i O v o
. :o
o oo
0 °i 0 O Q0 u
Shoal Creek Shoal Creek Shoal Creek Waller Creek Waller Creek Waller Creek Waller CreekatMCC atWoodhollow at 12th Street at 45th Street at 38th Street at Hancock at 5th Street
Upper ^ 1 nwer Upper ^ 1 nwer
Watershed Watershed Watershed Watershed
SAMPLING SITES
Figure 6. Dissolved calcium, magnesium, and sodium concentrations grouped by sampling site for Shoal Creek and Waller Creek, Austin, Texas.
WATER CHEMISTRY OF SHOAL CREEK AND WALLER CREEK 9
DIS
SO
LVE
D N
ITR
AT
E A
S
NIT
RO
GE
N,
IN M
ILLI
GR
AM
S P
ER
LIT
ER
DIS
SO
LVE
D S
ULF
AT
E,
IN
MIL
LIG
RA
MS
PE
R L
ITE
RD
ISS
OLV
ED
CH
LOR
IDE
, IN
M
ILLI
GR
AM
S P
ER
LIT
ER
I
?^
P
P
g
-
N
oS
SollS
o
8
o
o
o
$ o
w
c
g ^ o
5>
"§
w35
' §5
<
" m"
"^
^ o
"3
" A
CD
o
^ Q
)*^
^
QB
^^
?
x
2
1 "1
1
=D>
Q
) 3
*"
* tt
®
n
3 3
S.
CQ
1
^^ ~
«
03 8- ; Shoal
Creek
at
Woodhollow aw
- (D
3"
IT
|
g
| n
^3
f
3
OJ
CD
0
JJ ?
r
"_
S
>
<»
1r1
<D
^
3-
(D
1 1
1
- 0
0
0
00
0
- o
oo
o
i i
i i
-09
O<
D
- O
OO
O
i i
i
00
-0
OO
GO
OD
B 1
S
&"
M
fl>
L
.
i ° i
- -
g_3^
p
p
.-^
7*
10
rouivioro
§s 3
H s.
c
a?b-
....
c m
CD -^
3"
-1S
I
|?
S3
O
O"
CL
z
S
W
ff <a
§
0)
O ^~ O
i
m
0>
2
fD
CD
CD
a§
^ =
Ro
2
CD
i
Q> S
m
o> i~
JB
=3
(f
o
3° 5
Q-
75
S
Wn
T-
o>
=t a
1 1
1
0
- C
DO
d
0
00
0
3)
01
i i
i i
-OO
O
H
0)
DO
O
O
Di
i i
i
- O
0
0
I
D
1
00 00
D
§
§
(D 0
O cB CD
§ 8
'
I I
o03
03
Qj
i^1
co
oCD
5
-K
H,
o
5"5
<
1 CD O cB CD
Shoal Creek2.5
2.0
1.5
1.0
0.5
DC 1110-
0.0
I3 oyj
i 2.5
0.0 0.5 1.0 1.5 2.0
UJ Q
o
2.0
1.5
1.0
0.5
0.0
Waller Creek
2.5
O
O
n
o
o
n
*
EXPLANATION
Shoal Creek at MCC, stormflow
Shoal Creek at Woodhollow, stormflow
Shoal Creek at 12th Street, stormflow
Shoal Creek at MCC, base flow
Shoal Creek at Woodhollow, base flow
Shoal Creek at 12th Street, base flow
EXPLANATION
Waller Creek at 45th Street, stormflow
Waller Creek at 38th Street, stormflow
Waller Creek at Hancock, stormflow
Waller Creek at 5th Street, stormflow
Waller Creek at 45th Street, base flow
Waller Creek at 38th Street, base flow
0.0 0.5 1.0 1.5 2.0 2.5
SODIUM, IN MILLIEQUIVALENTS PER LITER
Figure 8. Relations between sodium and chloride concentrations in stormflow and base flow for Shoal Creek and Waller Creek, Austin, Texas.
WATER CHEMISTRY OF SHOAL CREEK AND WALLER CREEK 11
in base flow (below the MCL of 10 mg/L) (tables 1,2). In samples collected from the Waller Creek watershed, nitrate (as N) concentrations range from 0.02 to 1.2 mg/L in stormflow and from 0.06 to 0.86 mg/L in base flow. Nitrate concentrations are larger in stormflow samples in Waller Creek at Hancock golf course (where no base flow occurred) than in stormflow at the other sites.
In the combined Shoal Creek and Waller Creek watersheds, fecal coliform counts range from less than 1 to 84,000 cols./100 mL, and fecal streptococci counts range from less than 1 to 310,000 cols./100 mL in stormflow, indicating relatively high levels of fecal bacteria in runoff (table 1). Ratios of fecal coliform to fecal streptococci below 0.7 indicate animal sources of fecal bacteria (American Public Health Association, 1981). Ratios above 4.1 indicate human sources. Ratios in the range of 0.7 to 4.1 indicate mixes from both sources. Most ratios of fecal coliform to fecal strepto cocci are less than 0.7 in stormflow samples, indicating that the source of bacteria is predominantly from ani mal wastes. In base flow, fecal coliform counts range from less than 1 to 1,600 cols./lOO mL, and fecal strep tococci counts range from less than 1 to 960 cols./100 mL for both watersheds, indicating much lower levels of fecal bacteria in base flow than stormflow in the watersheds (table 2). Less than 1 col./100 mL recorded for bacteria at various times at the Waller Creek at 45th Street site might be a result of chlorinated water leak ing from a water line into the creek, killing most or all fecal bacteria. pH values exceeding 9.0 with low alka linity at this site, similar to values for city of Austin tap water (P.C. Bennett, University of Texas at Austin, oral commun., 1995), also indicate a leaking water line.
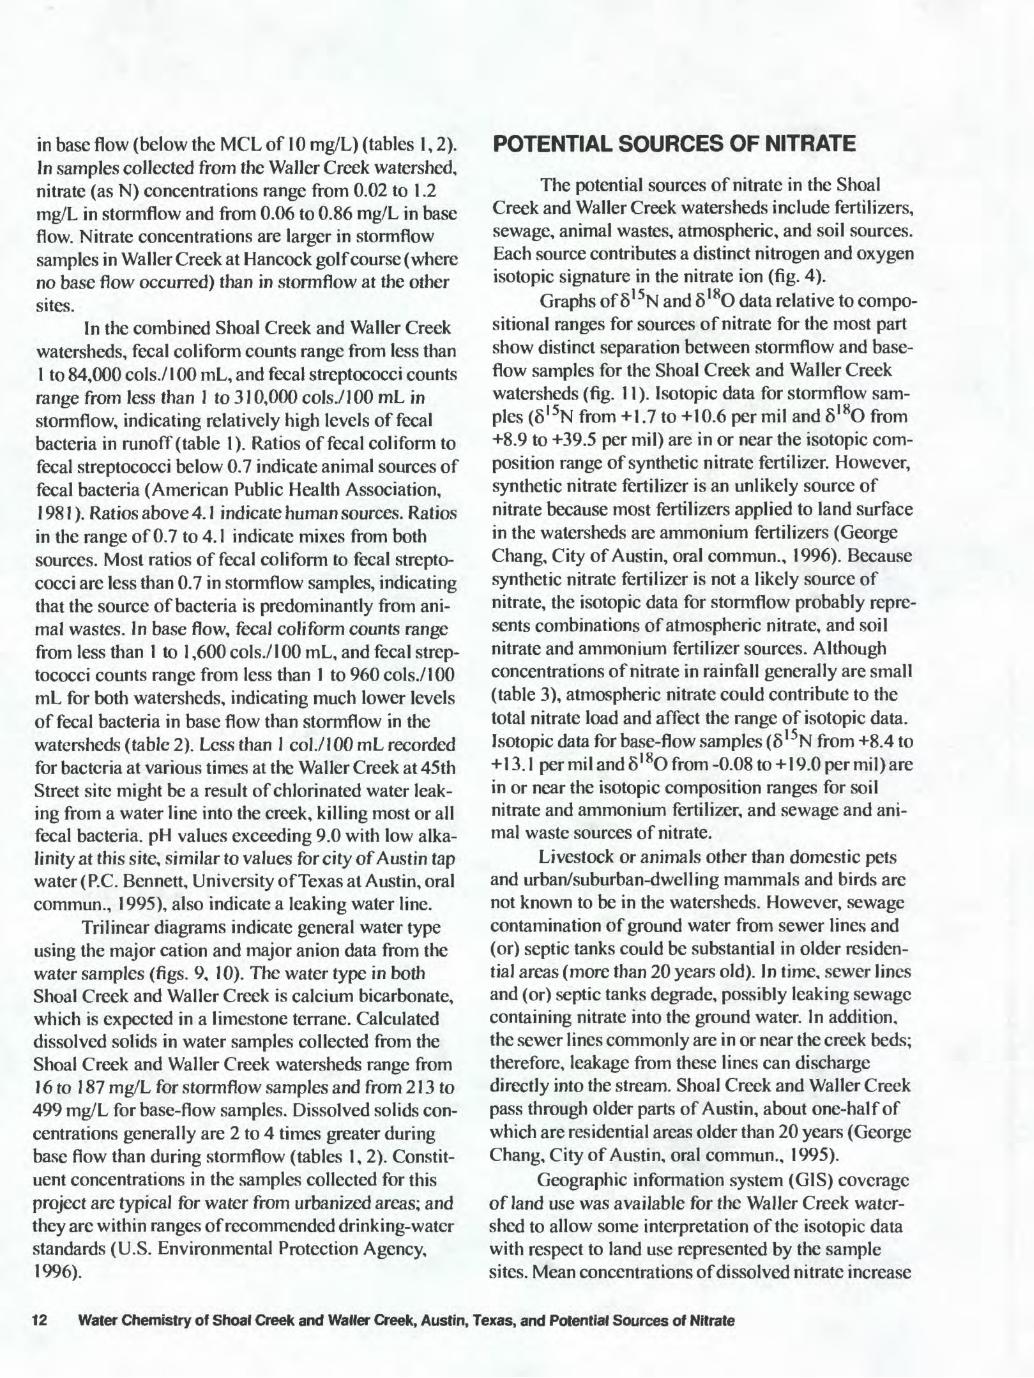
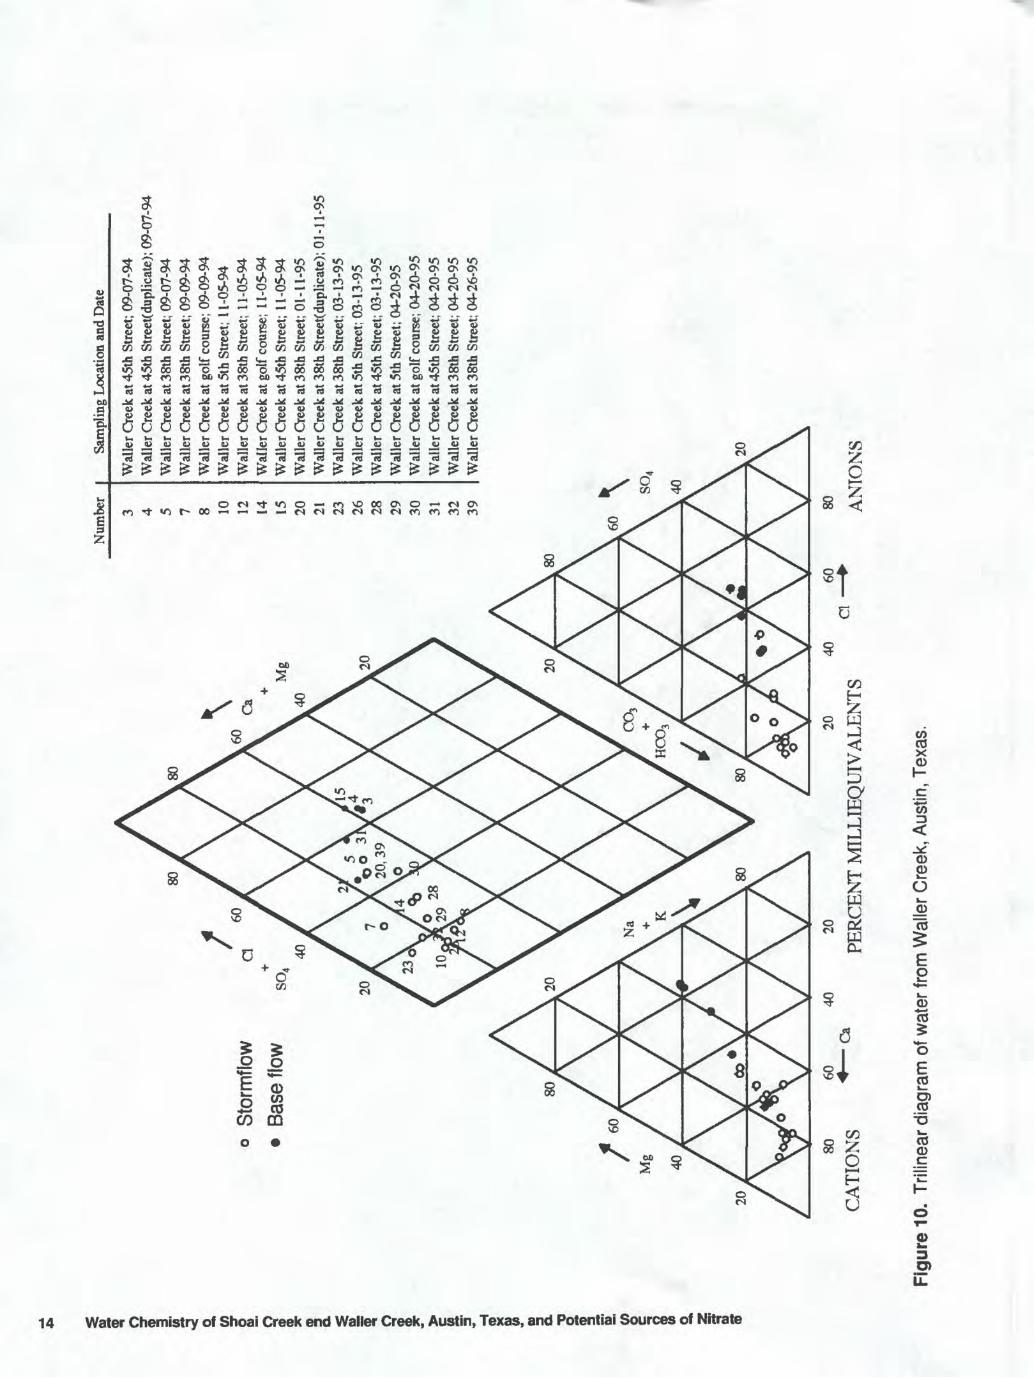
Trilinear diagrams indicate general water type using the major cation and major anion data from the water samples (figs. 9, 10). The water type in both Shoal Creek and Waller Creek is calcium bicarbonate, which is expected in a limestone terrane. Calculated dissolved solids in water samples collected from the Shoal Creek and Waller Creek watersheds range from 16 to 187 mg/L for stormflow samples and from 213 to 499 mg/L for base-flow samples. Dissolved solids con centrations generally are 2 to 4 times greater during base flow than during stormflow (tables 1, 2). Constit uent concentrations in the samples collected for this project are typical for water from urbanized areas; and they are within ranges of recommended drinking-water standards (U.S. Environmental Protection Agency, 1996).
POTENTIAL SOURCES OF NITRATE
The potential sources of nitrate in the Shoal Creek and Waller Creek watersheds include fertilizers, sewage, animal wastes, atmospheric, and soil sources. Each source contributes a distinct nitrogen and oxygen isotopic signature in the nitrate ion (fig. 4).
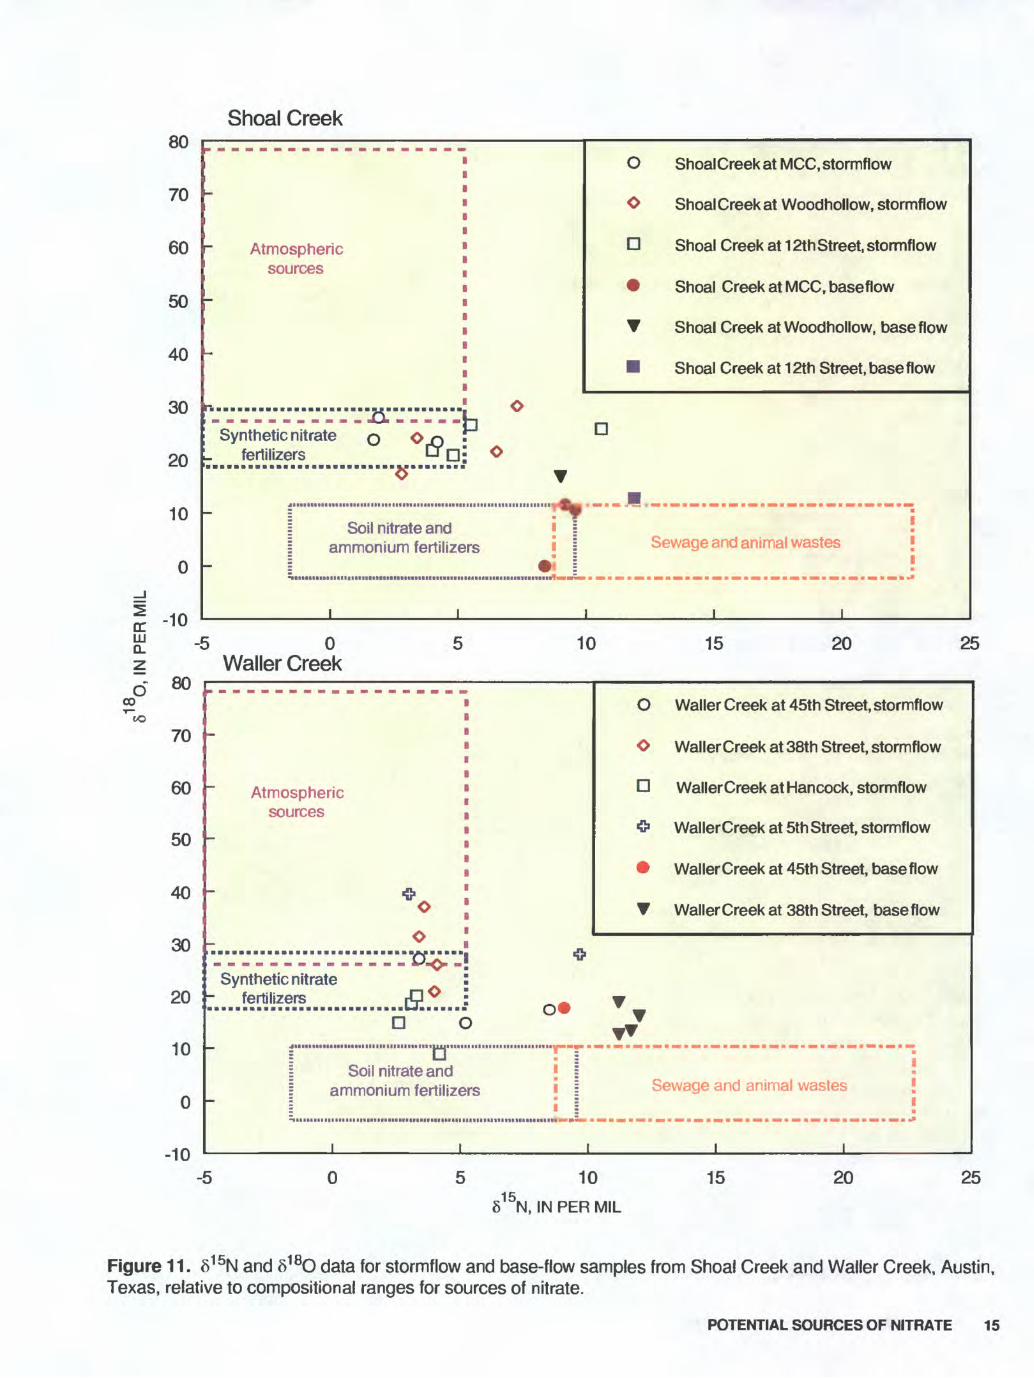
Graphs of 6 I5N and 6 I8O data relative to compo sitional ranges for sources of nitrate for the most part show distinct separation between stormflow and base- flow samples for the Shoal Creek and Waller Creek watersheds (fig. 11). Isotopic data for stormflow sam ples (6 I5N from +1.7 to +10.6 per mil and 6 I8O from +8.9 to +39.5 per mil) are in or near the isotopic com position range of synthetic nitrate fertilizer. However, synthetic nitrate fertilizer is an unlikely source of nitrate because most fertilizers applied to land surface in the watersheds are ammonium fertilizers (George Chang, City of Austin, oral commun., 1996). Because synthetic nitrate fertilizer is not a likely source of nitrate, the isotopic data for stormflow probably repre sents combinations of atmospheric nitrate, and soil nitrate and ammonium fertilizer sources. Although concentrations of nitrate in rainfall generally are small (table 3), atmospheric nitrate could contribute to the total nitrate load and affect the range of isotopic data. Isotopic data for base-flow samples (5 I5N from +8.4 to +13.1 per mil and 6 I8O from-0.08 to+19.0 per mil)are in or near the isotopic composition ranges for soil nitrate and ammonium fertilizer, and sewage and ani mal waste sources of nitrate.
Livestock or animals other than domestic pets and urban/suburban-dwelling mammals and birds are not known to be in the watersheds. However, sewage contamination of ground water from sewer lines and (or) septic tanks could be substantial in older residen tial areas (more than 20 years old). In time, sewer lines and (or) septic tanks degrade, possibly leaking sewage containing nitrate into the ground water. In addition, the sewer lines commonly are in or near the creek beds; therefore, leakage from these lines can discharge directly into the stream. Shoal Creek and Waller Creek pass through older parts of Austin, about one-half of which are residential areas older than 20 years (George Chang, City of Austin, oral commun., 1995).
Geographic information system (G1S) coverage of land use was available for the Waller Creek water shed to allow some interpretation of the isotopic data with respect to land use represented by the sample sites. Mean concentrations of dissolved nitrate increase
12 Water Chemistry of Shoal Creek and Waller Creek, Austin, Texas, and Potential Sources of Nitrate
Num
ber
Sam
plin
g Lo
catio
n an
d D
ate
80
o St
orm
flow
Ba
se fl
ow
60\ Ca 40
Mg 20
1 2 6 9 11 13 16 17 18 22 24 27 33 34 35 36 37 38
20
40
60
8080
60
40
20
Shoa
l Cre
ek a
t MC
C; 0
9-07
-94
Shoa
l Cre
ek a
t Woo
dhol
low
Driv
e; 0
9-07
-94
Shoa
l Cre
ek a
t Woo
dhol
low
Driv
e; 0
9-09
-94
Shoa
l Cre
ek a
t 12
th S
treet
; 09-
09-9
4Sh
oal C
reek
at M
CC
; 11
-05-
94Sh
oal C
reek
at W
oodh
ollo
w D
rive;
11-
05-9
4Sh
oal C
reek
at
12th
Stre
et;
11-0
5-94
Shoa
l Cre
ek a
t MC
C; 0
1-11
-95
Shoa
l Cre
ek a
t Woo
dhol
low
Driv
e; 0
1-11
-95
Shoa
l Cre
ek a
t MC
C; 0
3-13
-95
Shoa
l Cre
ek a
t Woo
dhol
low
Driv
e; 0
3-13
-95
Shoa
l Cre
ek a
t 12
th S
treet
; 03-
13-9
5Sh
oal C
reek
at
12th
Stre
et; 0
4-20
-95
Shoa
l Cre
ek a
t Woo
dhol
low
Driv
e; 0
4-20
-95
Shoa
l Cre
ek a
t M
CC
; 04-
20-9
5Sh
oal C
reek
at M
CC
; 04-
26-9
5Sh
oal C
reek
at W
oodh
ollo
w D
rive;
04-
26-9
5Sh
oal C
reek
at W
oodh
ollo
w D
rive(
dupl
icat
e);
04-2
6-95
\
PER
CEN
T M
ILLI
EQU
IVA
LEN
TSA
NIO
NS
I £ Fi
gure
9.
Trili
near
dia
gram
of w
ater
from
Sho
al C
reek
, A
ustin
, Tex
as.
Num
ber
Stor
mflo
w
Base
flow
Sam
plin
g Lo
catio
n an
d D
ate
Wal
ler C
reek
at 4
5th
Stre
et; 0
9-07
-94
Wal
ler C
reek
at 4
5th
Stre
et(d
uplic
ate)
; 09-
07-9
4 W
alle
r Cre
ek a
t 38t
h St
reet
; 09-
07-9
4 W
alle
r Cre
ek a
t 38t
h St
reet
; 09-
09-9
4 W
alle
r Cre
ek a
t gol
f cou
rse;
09-
09-9
4 W
alle
r Cre
ek a
t 5th
Stre
et;
11-0
5-94
W
alle
r Cre
ek a
t 38t
h St
reet
; 11
-05-
94
Wal
ler C
reek
at g
olf c
ours
e; 1
1-05
-94
Wal
ler C
reek
at 4
5th
Stre
et;
11-0
5-94
W
alle
r Cre
ek a
t 38t
h St
reet
; 01-
11-9
5 W
alle
r Cre
ek a
t 38t
h St
reet
(dup
licat
e); 0
1-11
-95
Wal
ler C
reek
at 3
8th
Stre
et; 0
3-13
-95
Wal
ler C
reek
at 5
th S
treet
; 03-
13-9
5 W
alle
r Cre
ek a
t 45t
h St
reet
; 03-
13-9
5 W
alle
r Cre
ek a
t 5th
Stre
et; 0
4-20
-95
Wal
ler C
reek
at g
olf c
ours
e; 0
4-20
-95
Wal
ler C
reek
at 4
5th
Stre
et; 0
4-20
-95
Wal
ler C
reek
at 3
8th
Stre
et; 0
4-20
-95
Wal
ler C
reek
at 3
8th
Stre
et; 0
4-26
-95
80
60
40
20
20
40
60
80
CA
TIO
NS
*~
a
PER
CE
NT
MIL
LIE
QU
IVA
LE
NT
S ° ~
~*
AN
TON
S
Figu
re 1
0. T
rilin
ear d
iagr
am o
f wat
er fr
om W
alle
r Cre
ek, A
ustin
, Tex
as.
Shoal Creek
trLU Q.
«u
70
60
50
40
on
?o
10
0
in
0
O
Atmospheric ^ sources
T
------_---_.O.--...l-, Synthetic nitrate Q O o
fertilizers ^D; ^
. ..... . ..... .... ....................................^ _.. P
[ Soil nitrate and \ I = ammonium fertilizers ii «N
i i i
ShoalCreekat MCC, stormflow
Shoal Creek at Woodhollow, stormflow
Shoal Creek at 12th Street, stormflow
Shoal Creek at MCC, baseflow
Shoal Creek at Woodhollow, baseflow
Shoal Creek at 12th Street, base flow
iSewage and animal wastes ;
i
! ,
-5 0
Waller Creek10 15 20 25
00
70
60
50
40
30
20
10
0
in
Atmospheric sources
*0
O
Synthetic nitrate j
D O.......................................JUJ..............................,, .
Soil nitrate and | ammonium fertilizers
i
i i i
O Waller Creek at 45th Street, stormflow
O WallerCreek at 38th Street, stormflow
D WallerCreek at Hancock, stormflow
* WallerCreek at 5th Street, stormflow
WallerCreek at 45th Street, baseflow
T Waller Creek at 38th Street, base flow
T
1*i
Sewage and animal wastes ! i
, ,
-5 0 10
515N, IN PER MIL
15 20 25
Figure 11. 515N and 518O data for stormflow and base-flow samples from Shoal Creek and Waller Creek, Austin, Texas, relative to compositional ranges for sources of nitrate.
POTENTIAL SOURCES OF NITRATE 15
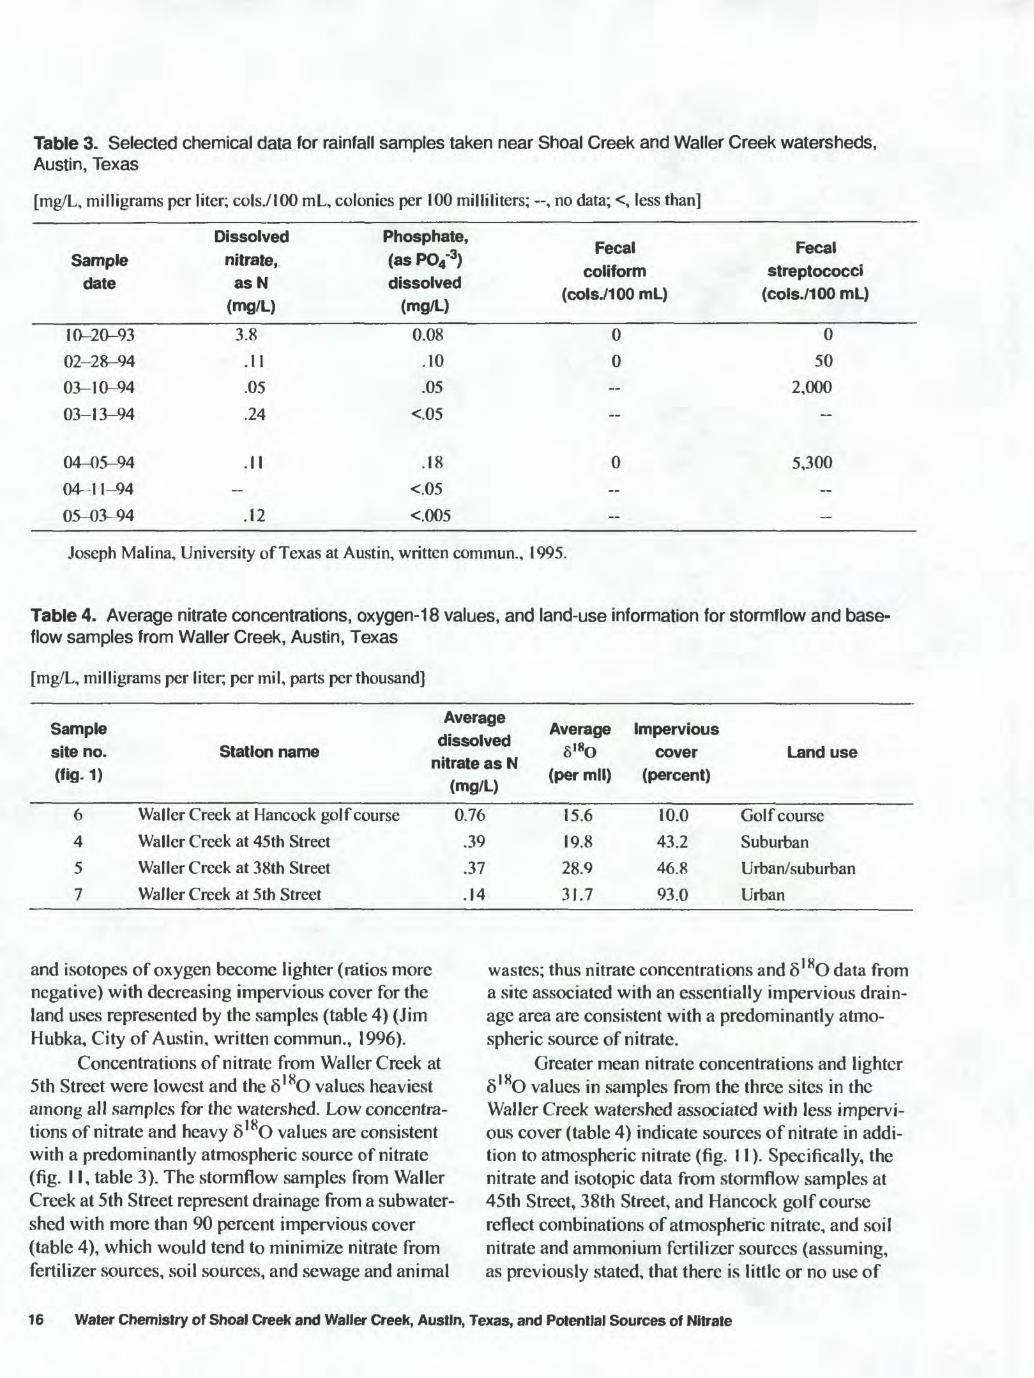
Table 3. Selected chemical data for rainfall samples taken near Shoal Creek and Waller Creek watersheds, Austin, Texas
[mg/L, milligrams per liter; cols./lOO mL, colonies per 100 milliliters; , no data; <, less than]
Sample date
10-20-93
02-28-94
03-10-94
03-13-94
04-05-94
04-1 1-9405-03-94
Dissolved nitrate, asN
(mg/L)
3.8
.11
.05
.24
.11
.12
Phosphate, (asPCV3) dissolved
(mg/L)
0.08
.10
.05
<.05
.18
<.05
<.005
Fecal coliform
(cols./100 mL)
0
0-
-
0
~
-
Fecal streptococci
(cols./100 mL)
0
50
2,000--
5,300
-
Joseph Malina, University of Texas at Austin, written commun., 1995.
Table 4. Average nitrate concentrations, oxygen-18 values, and land-use information for stormflow and base- flow samples from Waller Creek, Austin, Texas
[mg/L, milligrams per liter; per mil, parts per thousand]
Samplesite no.(fig- D
6
4
5
7
Station name
Waller Creek at Hancock golf course
Waller Creek at 45th Street
Waller Creek at 38th Street
Waller Creek at 5th Street
Average
dissolvednitrate as N
(mg/L)
0.76
.39
.37
.14
Average8 180
(per mil)
15.6
19.8
28.9
31.7
Imperviouscover
(percent)
10.0
43.2
46.8
93.0
Land use
Golf course
Suburban
Urban/suburban
Urban
and isotopes of oxygen become lighter (ratios more negative) with decreasing impervious cover for the land uses represented by the samples (table 4) (Jim Hubka, City of Austin, written commun., 1996).
Concentrations of nitrate from Waller Creek at 5th Street were lowest and the 6 I8O values heaviest among all samples for the watershed. Low concentra tions of nitrate and heavy 6 I8O values are consistent with a predominantly atmospheric source of nitrate (fig. 11, table 3). The stormflow samples from Waller Creek at 5th Street represent drainage from a subwater- shed with more than 90 percent impervious cover (table 4), which would tend to minimize nitrate from fertilizer sources, soil sources, and sewage and animal
wastes; thus nitrate concentrations and 6 I8O data from a site associated with an essentially impervious drain age area are consistent with a predominantly atmo spheric source of nitrate.
Greater mean nitrate concentrations and lighter 6 I8O values in samples from the three sites in the Waller Creek watershed associated with less impervi ous cover (table 4) indicate sources of nitrate in addi tion to atmospheric nitrate (fig. 11). Specifically, the nitrate and isotopic data from stormflow samples at 45th Street, 38th Street, and Hancock golf course reflect combinations of atmospheric nitrate, and soil nitrate and ammonium fertilizer sources (assuming, as previously stated, that there is little or no use of
16 Water Chemistry of Shoal Creek and Waller Creek, Austin, Texas, and Potential Sources of Nitrate

synthetic nitrate fertilizers in the watershed); whereas the nitrate and isotopic data from base-flow samples from Waller Creek at 45th and 38th Streets are most consistent with a sewage and animal waste source of nitrate.
Excess chloride concentrations relative to sodium have been used in previous investigations at other loca tions as tracers of sewage contamination (Avimelech and Ravch, 1976). Graphs of relations between sodium and chloride concentrations in stormflow and base flow indicate a source of excess chloride relative to sodium at some sampling sites, particularly under base-flow conditions (fig. 8). These sites are Shoal Creek at Wood- hollow, Shoal Creek at 12th Street, Waller Creek at 45th Street, and Waller Creek at 38th Street. Excess chloride concentrations relative to sodium at Waller Creek at 45th Street could be the result of chlorinated drinking water leaking into the creek. Chloride-to-sodium molar ratios greater than 1 at the other sites indicate that base flows in Shoal Creek and Waller Creek could have con tained sewage effluent, which would be consistent with the6 l5Nand6 l8Odata.
Figure 12 shows 8 I5 N and 8 I8O averages by sam pling date. The correspondence in trends between 8 I5N and 5 I8O from one sampling date to the next indicates that the measured values are responding to varying pro portions of two general endmember compositions: one of relatively low 8 I5N and high 8 I8O and the other of relatively high 8 I5N and low 8 I8O. Figure 13 shows all of the isotopic data for the stormflow and base-flow samples and ellipses having radii of 2 standard devia tions from average superimposed to highlight the dis tinction between sources of nitrate in stormflow and base-flow samples. The data of figures 12 and 13 are consistent with the conclusion that nitrate concentra tions in the creeks at any given time are mixtures result ing from surface sources (atmospheric nitrate, and soil nitrate and ammonium fertilizer) during stormflow and predominantly from subsurface sources (sewage and soil nitrate and ammonium fertilizer) during base flow.
Denitrification is not a likely cause of the heavy 8 I5N values because the samples were collected from oxygenated surface waters. Furthermore, there is no apparent tendency among the base-flow samples toward heavier isotopic ratios of 8 18O in the nitrate ion (fig. 11), a likely characteristic if dcnitrification were occurring (Kendall and others, in press).
CONCLUSIONS
In general, stormflow in the Shoal Creek and Waller Creek watersheds contains smaller amounts of dissolved constituents than base flow. Magnesium con centrations decrease toward basin outlets during base- flow conditions; whereas, other constituent concentra tions (sodium, chloride, and sulfate) increase toward basin outlets during base-flow conditions. Nitrate (as N) concentrations are below the MCL of 10 mg/L. Fecal bacteria counts are greater in stormflow samples than in base-flow samples.
The general water type in the Shoal Creek and Waller Creek watersheds is calcium bicarbonate, which is common in limestone terranes.
8 I5N and 8 I8O isotopic data from dissolved nitrate indicate that the sources of nitrate in stormflow of both watersheds probably arc not the same as the sources of nitrate in base flow.
8 I5N and 8 I8O isotopic data in nitrate for storm- flow samples are in or near the isotopic composition ranges for atmospheric nitrate, and soil nitrate and ammonium fertilizer sources. A combination of atmo spheric nitrate, and soil nitrate and ammonium fertilizer sources is the most likely cause of nitrate in stormflow samples (assuming that there is little or no use of syn thetic nitrate fertilizers in the watersheds).
8 I5N and 8 I8O isotopic data in nitrate for base- flow samples are in or near the isotopic composition ranges for soil nitrate and ammonium fertilizer, and sewage and animal waste sources of nitrate. A combina tion of sewage nitrate and soil nitrate and ammonium fertilizer sources is the most likely source of nitrate in base-flow samples. Sewage is considered the predomi nant source because of the potential for older sewer lines to degrade, the proximity of sewer lines to creek beds, and an excess of chloride relative to sodium at some sampling sites (an indicator of the presence of sewage) under base-flow conditions.
Impervious cover could restrict the primary nitrate source to atmospheric. In the Waller Creek watershed, nitrate concentrations, and 8 I5N and 8 I8O isotopic data in nitrate for stormflow samples from one site that represents drainage from an essentially imper vious subwatershed indicate an atmospheric source is most likely; whereas nitrate and isotopic data from stormflow samples representing three subwatersheds with less than 50-percent impervious cover indicate possible soil nitrate and ammonium fertilizer sources in addition to atmospheric sources.
CONCLUSIONS 17
a w I I f (D
X 0> E.
tr LU
Q. o 0. 130 25 20 15 10
o'
9-7-
94
9-9-
94
11-5
-94
1-11
-95
3-13
-95
4-20
-95
4-26
-95
base
flow
sto
rmflo
w
sto
rmflow
ba
seflo
w
sto
rmflow
sto
rmflo
w
base
flow
SA
MP
LIN
G D
AT
E
Figu
re 1
2. 5
15N
and
518O
ave
rage
s by
sam
plin
g da
te fo
r all
sam
plin
g si
tes
in S
hoal
Cre
ek a
nd W
alle
r Cre
ek, A
ustin
, Tex
as.
00
80
70
60
50
^ 40
QC
LU $ 30
20
10 0
-10
Atm
osp
heric
sour
ces
Shoa
l Cre
ek s
torm
flow
sam
ples
Sh
oal C
reek
bas
e flo
w s
ampl
es
Wal
ler C
reek
sto
rmflo
w s
ampl
es
Wal
ler C
reek
bas
e flo
w s
ampl
es
"""
Syr
itTie
fi L n
itra
te
fert
Viz
er
2 st
anda
rd
devi
atio
ns
from
av
erag
es
of
all
stor
mflo
w s
ampl
es
2 st
anda
rd
devi
atio
ns
from
av
erag
es
of
all
base
flo
w
sam
ples
| S
oil
nitr
afe
and
j j-
Sew
age
and
anim
al
was
tes
I am
mon
ium
fe
rtili
zer
! j
-50
10
6 15
N,
IN P
ER
MIL
15
2025
Figu
re 1
3. 8
15N
and
818O
dat
a fo
r all
sam
plin
g si
tes
in S
hoal
Cre
ek a
nd W
alle
r Cre
ek, A
ustin
, Tex
as, a
nd e
llipse
s ha
ving
rad
ii of
2 s
tand
ard
£ de
viat
ions
from
ave
rage
s of
sto
rmflo
w a
nd b
ase-
flow
sam
ples
.

REFERENCES
Amberger, A., and Schmidt, H., 1987, Naturliche iso- topengehalte von nitrat als indikatoren fur dessen herkunft: Geochimica et Cosmochimica Acta, v. 51, p. 2,699-2,705.
American Public Health Association, 1981, Standard meth ods for the examination of water and wastewater: 15thed.
Aravena, R., Evans, M., and Cherry, J., 1993, Stable isotopes of oxygen and nitrogen in source identification of nitrate from septic systems: Groundwater, v. 31, p. 180-186.
Avimelech, Y., and Raveh, J., 1976, Nitrate leakage from soils differing in texture and nitrogen load: Journal of Environmental Quality, v. 5, p. 79 81.
Bottcher, J., Strebel, O., Voerkelius, S., and Schmidt, H., 1990, Using isotope fractionation of nitrate-nitrogen and nitrate-oxygen for evaluation of microbial denitrifi- cation in a sandy aquifer: Journal of Hydrology, v. 114, p. 413^24.
City of Austin, Environmental and Conservation Services Department, 1990a, Removal efficiencies of storm- water control structures: 42 p.
____1990b, Stonnwater pollutant loading characteristics for various land uses in the Austin area: 77 p.
Collins, A., 1975, Geochemistry of oilfield waters, in Devel opments in petroleum science: New York, Elsevier Publishing Co.. p. 496.
Durka, W., Schulze, E., Gebauer, G., and Voerkelius, S., 1994, Effects of forest decline on uptake and leaching of deposited nitrate determined from I5N and I8O mea surements: Nature, v. 372, p. 765 769.
Fritz, Peter, and Fontes, J.C., 1980, Introduction, in Fritz, Peter, and Fontes, J.C., eds., Handbook of environmen tal isotope geochemistry, v. 1, The terrestrial environ ment, A: Amsterdam, The Netherlands, Elsevier Publishing Co., p. 1-19.
Heaton, T, 1986, Isotopic studies of nitrogen pollution in the hydrosphere and atmosphere A review: Chemical Geology, v. 59, p. 87-102.
Kendall, C., Silva, S., Chang, C., Burns, D., Campbell, D., and Shanley, J., in press. Use of the 8 I5N and 8 |8O of nitrate to determine sources of nitrate in early spring runoff in forested catchments, in Conference and Inter national Symposium on Isotopes in Water Resources Management, Vienna, Austria, March 20-14, 1995, Proceedings: International Atomic Energy Agency.
U.S. Department of Agriculture, Soil Conservation Service, 1974, Soil survey of Travis County, Texas: Washington, D.C., 123 p.
U.S. Environmental Protection Agency, 1996, Drinking water regulations and health advisories: Washington, D.C., Office of Water, 16 p.
Wassenaar, L., 1995, Evaluation of the origin and fate of nitrate in the Abbotsford aquifer using the isotopes of I5N and I8O in NO3": Applied Geochemistry, v. 10, p. 391^105.
Welborn, C.T., and Veenhuis, J.E., 1987, Effects of runoff controls on the quantity and quality of urban runoff at two locations in Austin, Texas: U.S. Geological Survey Water-Resources Investigations Report 87-4004, 101 p.
Whittemore, D., 1988, Bromide as a tracer in ground-water studies Geochemistry and analytical determination, in Conference on Ground Water Geochemistry, Denver, Colo., February 16-18, 1988, Proceedings: p. 339-354.
20 Water Chemistry of Shoal Creek and Waller Creek, Austin, Texas, and Potential Sources of Nitrate
w *
Tabl
e 1.
Che
mic
al d
ata
and
isot
ope
ratio
s fo
r st
orm
flow
sam
ples
from
Sho
al C
reek
and
Wal
ler C
reek
, A
ustin
, Te
xas
[ft, f
eet;
fVVs
, cub
ic f
eet p
er s
econ
d; (
^S/c
m, m
icro
siem
ens
per c
entim
eter
at 2
5 de
gree
s C
elsi
us; c
ols./
lOO
mL,
col
onie
s pe
r 10
0 m
illili
ters
; mg/
L, m
illig
ram
s pe
r lit
er; C
aCO
3, ca
lciu
m c
arbo
nate
; H, h
ydro
gen;
,
no d
ata;
<, l
ess
than
; M
CC
, M
icro
elec
troni
cs a
nd C
ompu
ter T
echn
olog
y C
orp.
; gc
, gol
f cou
rse;
>, g
reat
er th
an;
fet,
fixed
end
poin
t titr
atio
n; N
O2+
NC>3
, nitr
ite p
lus
nitra
te; 8
l5N
, rat
io o
f nitr
ogen
-15
to n
itrog
en-1
4; 8
l8O
, rat
io o
f oxy
gen-
18 to
oxy
gen-
16]
Sam
ple
site
no.
St
atio
n na
me
(fig-
1)
2 3 1 2 3 1 2 3 3 2 1 5 6 7 5 6 4 5 6 7 4 7 6 4 5
Shoa
l Cre
ek a
t Woo
dhol
low
Dr.
Shoa
l Cre
ek a
t 12
th S
t.Sh
oal C
reek
at M
CC
Shoa
l Cre
ek a
t Woo
dhol
low
Dr.
Shoa
l Cre
ek a
t 12
th S
t.Sh
oal C
reek
at M
CC
Shoa
l Cre
ek a
t Woo
dhol
low
Dr.
Shoa
l Cre
ek a
t 12
th S
t.
Shoa
l Cre
ek a
t 12
th S
t.Sh
oal C
reek
at W
oodh
ollo
w D
r.Sh
oal C
reek
at M
CC
Wal
ler C
reek
at 3
8th
St.
Wal
ler C
reek
at H
anco
ck g
cW
alle
r Cre
ek a
t 5th
St.
Wal
ler C
reek
at 3
8th
St.
Wal
ler C
reek
at H
anco
ck g
cW
alle
r Cre
ek a
t 45t
h St
.W
alle
r Cre
ek a
t 38t
h St
.W
alle
r Cre
ek a
t Han
cock
gc
Wal
ler C
reek
at 5
th S
t.W
alle
r Cre
ek a
t 45t
h St
.W
alle
r Cre
ek a
t 5th
St.
Wal
ler C
reek
at H
anco
ck g
c
Wal
ler C
reek
at 4
5th
St.
Wal
ler C
reek
at 3
8th
St.
Dat
a
09-0
9-94
09-0
9-94
1 1-0
5-94
11-0
5-94
1 1-0
5-94
03-1
3-95
03-1
3-95
03-1
3-95
04-2
0-95
04-2
0-95
04-2
0-95
09-0
9-94
09-0
9-94
1 1-0
5-94
1 1-0
5-94
1 1-0
5-94
1 1-0
5-94
03-1
3-95
03-1
3-95
03-1
3-95
03-1
3-95
04-2
0-95
04-2
0-95
04-2
0-95
04-2
0-95
Tim
e
0030
0130
0145
0210
0305
0226
0245
0312
0150
0215
0235
0035
0043
0130
0210
0230
0235
0240
0246
0301
0342
0043
0124
0125
0127
Gag
e he
ight
(ft
)
1.05
4.50 .6
0.9
0
3.26 1.46
1.60
9.05
4.37 .9
6.4
7
4.35 .0
8.2
54.
10 .20
.08
5.03 .5
0
.50
.35
.32
.40
.14
4.34
Spec
if-
Spec
if-
P '
_.
ic c
on-
ic c
on-
Dis-
.
. w
hole
, du
e-
due-
ch
arge
fie
ld
(nS/
cm)
(nS/
cm)
Shoa
l Cre
ek25
445
9 -
282
134
155
268
280
191
148
202
125
137
1.94
0 -
158
480
-
293
306
256
Wal
ler
Cre
ek
100
204
32
3268
69
370
368
317
320
119
120 48 138 87 278
187
142
7.7
7.8
7.7
7.5
7.9
7.7
7.5
7.8
- - 7.9
7.6
7.2
7.8
7.6
9.1 7.6
- 6.9
7.5
- - -
pH,
wat
ar
who
le,
lab
(sta
n
dard
un
its)
7.9
7.6
78 7.6
7.7
7.8
7.7
7.9
7.4
7.8
7.5
7.8
7.9
7.0
7.0
7.2
8.5
7.8
7.6
7.3
7.4
7.7
7.5
7.5
7.6
Feca
i co
n
form
(c
ois.
/ 10
0 m
L)
37.0
0042
.000
8.00
034
.000
64.0
002,
000
21,0
0018
,000
60,0
0019
,000
2,00
0
84.0
0036
.000
> 10
.000
84,0
00
58.0
00 <l
21,0
00 -
24.0
00 <1
62,0
0048
.000
4,40
060
.000
Feca
i H
afd"
stre
pto-
ne
SS>
Aci
dity
COCc
i (m
g°L
(mg/
L (c
ols.
/ l
9 as
H)
100
mL)
C
aC03
)
30.0
0071
,000
6,80
025
.000
90.0
0038
.000
99.0
0011
0,00
0
160.
000
84,0
0029
.000
130,
000
64.0
00>8
6,00
010
0,00
0
63,0
00 <l
74,0
00 -
170.
000
9,20
021
0,00
031
0.00
0
49.0
0019
0.00
0
100
<0.i
i20
<.l
58
<.l
100
<.i
60
<.l
39 48 47 94 120
110 44
<.i
75
<.l
12
<.l
26
<.i
i30
<.l
85
<.l
34 42 17 44 18 83 82 36
Cal
cium
, di
s
solv
ed(m
g/L)
34 43 i9 34 22 13 16 17 33 38 35 16 23 4.2
8.5
44 16 12 14 6.2
12 6.4
29 21 13
Mag
ne
si
um,
dis
so
lved
(m
g/L)
4.1 3.0
2.6
4.7 1.3 i.5 1.9 1.0
2.8
5.1 5.7 1.1 4.2 .3 l.i
5.1
11.9 1.7 .3 3.3 .5 2.5 7.1 .8
Sodi
um
, di
s
solv
ed
(mg/
L)
8.1
6.9
3.3
10 4.8 1.4
3.3
2.1
8.6
11 4.7
2.3
5.2 .8 2.6
15 241.
82.
0 i.4 5.8 1.7
10 15 2.2
Pota
s
sium
, di
s
solv
ed(m
g/L)
2.8
3.4 1.9
2.4
2.1
2.7
2.3
2.5
3.4
2.9
3.3
2.0
13.7 2.0
10 3.9
2.1
6.0 .9 3.4 1.3
13 4.4
2.1
I'll'>O -C7 C
£It
I g- i a .2 I B,z g) E «= TJ o E
«I **SI:5 I 8 S I i1o> co 3 ~^
2 -g £ > oi0 'c 8 5.
D>3 S.2en a TJ
rr*Al530>
P
0>
ic o
5 co
E o>
f.(J_ot/5
0
01
§0
0
OO
o
oo
VIf-
o
ONO-l
ov
o V
VI
^J-
r""
o
8
J
I
,
Io 9
1 Creek at Wot
1t/5
0,
^
oT
01O
O
VI
r
oV
0
l/">VI
IT)
0
0
Jo
L/J
1 Creek at 1 2rt
S
«
">
¥01
T
S
o
CN
NO
O
V
V
ff)
^OO
^
rr
o
J2
; j
1 Creek at MC
801
-
^CN
O
S
0
oV
o
o
0V
V
00
Vl
00
0
0
!2
&o0 9
1 Creek at Wot
01
CN
^.
CN+
1/11/1
r--
0
0
V
Ol
ON
O
V
00VI
O01
r*i
0
O
J5
</)
1 Creek at 12rt
1
«
^
¥
o
ON
oV
ON
1/1
oV
V
mrn
^+.
0
0
5I
; j
1 Creek at MC
101
-
r*j l~^r~ vi7 ¥00 sOoi O
S 8
,.
O 0
V
r*i f")
1/1 NO
0 0
V V
V
ot r-1/1 01
Om en
r*i r*i
VI 01
0 O
5 5rn r*"i 0 O
,
1J ~"O w
1 Creek at Wot 1 Creek at 12tt
1 1C/} t/)
01 f^
00 O
0 O 01 ro
00 rn
T £
S §
01 OO
-* "fr
01 f^0 O
^" f*i
"t 01 Vl
o oV V
V
01 ON
so t-~01
0^ 01Vl ON
0 Vl
0 O
Vi V->
O C>
H
&*
- ^
1 Creek at 1 2th 1 Creek at Wot
J |C/} t/)
00
01
ON
T
oo0
.
s
OVI
'
OV
V
f-^
f-Tj
ooON
VI
01o
v»s3
o
1 Creek at MC
1
-
0NO 01
T
0
=
01 VI
010
OVI
ONNO
0
V
S vu
^ r-i m
ONNO
O
VI
O0
!1
.jj;
er Creek at 38!
iV,
, _
+
+
sO O
O 01 '
VI0
01
""
"
OV
rrI~^
_f-^
VIr-
°
Io
ay
1ra
0
iNO
Ooo
0^
O
0
VIo
sD
OV
00
_
0
0
?2
t/5
er Creek at 5th
1-
ON
0
¥
o
0
NOo
1/10}
0
rf0}
i/l
O
v
ON
__
j^
01
so01
O
01o
J2
er Creek at 38t
1
VI
ON
OO
01
T
S
01
so
010
VIso
r-oo
oV
rr0|
oo
0
0
010
5V)
2
&u
er Creek at Ha
iso
OO
01
0
S
00
o
r*i
r-Vi
§
so
. ,"*
01
"*
VI
01o
5V)
2
^
_e
er Creek at 45t
1-
v>
Tf
+
g
ON
O
OO01
01
oV
V
I Ol
oo01
o
010
sJ,o
fcj
j200
1VI
Vi
00
VI01
010
r-
01O
VIr*i
ov
1/101
^01
.
sOrr01o
ViJo
ay
er Creek at Ha
1
NO
^
01
O
s
o
o
0}
O
v
S
^__
_
001
0
o
ViJo
VI
er Creek at 5th
1
-
rrr-
VI00
ooo
01
00
o
r*}
NO
O
v
01
ON
.
f-^
rr
01
sViJ0
,J
^;Vi
(Jt-
1-
^
oT
r-
o
m
Nf>0}
0V
V
01CN
mCN
NO
8
5
VI
er Creek at 5th
1
-
^
7
¥
o
§
o
f~
ON
oV
f-~
r*")01
^
O
V)
I
ay
er Creek at Ha
iNO
0,
¥
01
S
ON
0
oV
ON
m
0
>/1Ol
0
V)
i
_;
j;
er Creek at 45t
1
-
_ .
sO
O
o01
s
rf
^
oV
V
ON
01
_
m
01
o
V)
I
erCreekat38t
1
VI
22 Water Chemistry of Shoal Creek and Waller Creek, Austin, Texas, and Potential Sources of Nitrate
Tabl
e 2.
Che
mic
al d
ata
and
isot
ope
ratio
s fo
r ba
se-fl
ow s
ampl
es fr
om S
hoal
Cre
ek a
nd W
alle
r C
reek
, Au
stin
, Tex
as
[ft,
feet
; (iS
/cm
, mic
rosi
emen
s pe
r cen
timet
er a
t 25
degr
ees C
elsi
us; c
ols./
lOO
mL,
col
onie
s pe
r 10
0 m
illili
ters
; mg/
L, m
illig
ram
s pe
r lite
r; C
aCO
i, ca
lciu
m c
arbo
nate
; H, h
ydro
gen;
M
CC
, Mic
roel
ectro
nics
and
Com
pute
r Tec
hnol
ogy
Cor
p.; <
, les
s th
an; , n
o da
ta; f
et, f
ixed
end
poin
t titr
atio
n; N
Oj+
NC
^, n
itrite
plu
s ni
trate
; 5
N, r
atio
of n
itrog
en-1
5 to
nitr
ogen
- 14
; 518
O, r
atio
of o
xyge
n-18
to o
xyge
n-16
]
Sam
ple
site
no.
Stat
ion
nam
e (fi
g.1)
Table
2
1 2 1 2 3 1 2 2 4 4 5 5 5 5
Shoa
l Cre
ek a
t MC
C
Shoa
l Cre
ek a
t Woo
dhol
low
Dr.
Shoa
l Cre
ek a
t MC
C
Shoa
l Cre
ek a
t Woo
dhol
low
Dr.2
Shoa
l Cre
ek a
t 12
th S
t.
Shoa
l Cre
ek a
t MC
C
Shoa
l Cre
ek a
t Woo
dhol
low
Dr.
Shoa
l Cre
ek a
t Woo
dhol
low
Dr.2
Wal
ler C
reek
at 4
5th
St.
Wal
ler C
reek
at 4
5th
St.2
Wal
ler C
reek
at 3
8th
St.
Wal
ler C
reek
at 3
8th
St.
Wal
ler C
reek
at 3
8th
St.2
Wal
ler C
reek
at 3
8th
St.
Equi
pmen
t bla
nk
Dat
a
09-0
7-94
09-0
7-94
01-1
1-95
01-1
1-95
01-1
1-95
04-2
6-95
04-2
6-95
04-2
6-95
09-0
7-94
09-0
7-94
09-0
7-94
01-1
1-95
01-1
1-95
04-2
6-95
04-2
6-95
Tim
e
0745
0945
0840
1000
1105
0940
1040
1050
1045
1047
1354
1245
1250
1235
0845
Gag
e he
ight
(ft
)
0.10 .0
1
.30
.01
'1.7
7
.30
.05
.05
.01 .01 2.00
2.10
2.10
2.10
Spec
ific
cond
uc
tanc
e,
field
(n
S/cm
)
935
582
934
842
873
913
671
671
417
417
555
705
705
712
Spec
ific
cond
uc
tanc
e,
ieb
(nS/
cm)
795
567
914
826
891
890
666
667
410
410
553
706
704
702 3
H. «
Shoa
l Cre
ek
7.6
7.4
7.4
8.0
7.4
7.7
7.7
7.7
Wili
er C
reek
9.7
9.7
8.3
8.5
8.5
8.2
Feca
l Fe
cal
£ £
aun
iisj
.,_-
, .
.,
. .
loo
mL)
10
0 m
L)
7.9
130
900
7.9
860
780
7.6
1,60
0 70
0
7.8
16
112
7.6
72,0
00
700
7.6
110
340
7.5
140
760
7.5
190
960
9.6
<1
<1
9.6
<1
<1
8.3
- 76
0 52
0
8.1
120
92
8.0
120
92
7.9
740
860
7.7
<l
340
Har
d
ness
, A
cidi
ty
tota
l (m
g/L
(mg/
L as
as
H)
CaC
O3)
460
<0.1
220
<.l
480
.3
350
.1
370
.1
450
280
280
110
<.l
110
<.l
200
<.l
270
<.l
260
.1
260 1
Cal
cium
, di
s
solv
ed
(mg/
L)
130 67 140
110
130
130 91 89 13 13 54 88 84 84
.3
Mag
ne
sium
, di
s
solv
ed
(mg/
L)
33 12 32 19 11 31 14 14 18 19 15 12 12 12 .0
4
Sodi
um,
dis
so
lved
(m
g/L)
21 30 20 29 44 18 27 27 34 35 36 40 33 40 <.02
Pota
s
sium
, di
s
solv
ed
(mg/
L)
0.9
4.7 .8 2.9
4.5 1.1 2.6
2.6
3.8
4.0
3.4
3.3
3.2
2.8
w
Foot
note
s at
end
of t
able
.
£ £ a I I I § Q > | H S3
I § 0 1 o st .
laoi
ez.
unem
icai
aai
a an
a is
oiop
e
Sam
ple
site
no.
St
atl0
" na
me
1 Sh
oal C
reek
at M
CC
2 Sh
oal C
reek
at W
oodh
ollo
w D
r.
1 Sh
oal C
reek
at M
CC
2 Sh
oal C
reek
at W
oodh
ollo
w D
r.
3 Sh
oal C
reek
at
12th
St.
1 Sh
oal C
reek
at M
CC
2 Sh
oal C
reek
at W
oodh
ollo
w D
r.
2 Sh
oal C
reek
at W
oodh
ollo
w D
r.2
4 W
alle
r Cre
ek a
t 45t
h St
.
4 W
alle
r Cre
ek a
t 45t
h St
.2
5 W
alle
r Cre
ek a
t 38t
h St
.
5 W
alle
r Cre
ek a
t 38t
h St
.
5 W
alle
r Cre
ek a
t 38t
h St
.2
5 W
alle
r Cre
ek a
t 38t
h St
.
Equi
pmen
t bla
nk
ratio
s io
r
Dat
e
09-0
7-94
09-0
7-94
01-1
1-95
01-1
1-95
01-1
1-95
04-2
6-95
04-2
6-95
04-2
6-95
09-0
7-94
09-0
7-94
09-0
7-94
01-1
1-95
01-1
1-95
04-2
6-95
04-2
6-95
oase
-Tio
w s
amp
Alk
alin
ity,
wat
er,
_
diss
olve
d,
Tim
e to
tal,
fet
(mg/
L as
C
aC03
)
0745
40
0
0945
14
0
0840
41
0
1000
28
0
1105
0940
41
0
1040
23
0
1050
23
0
1045
69
1047
69
1354
13
0
1245
19
0
1250
19
0
1235
18
0
0845
2
lies i
rom
bno
ai u
reeK
ana
v
Sulfa
te,
Chl
orid
e,
Fluo
ride,
di
s-
dis-
di
s
solv
ed
solv
ed
solv
ed
(mg/
L)
(mg/
L)
(mg/
L)
Shoa
l Cre
ek
34
38
0.1
44
61
.2
35
33
.1
60
69
<.l
110
81
.3
34
30
.1
35
49
.1
35
48
.1
Wal
ler C
reek
42
64
.3
41
64
.3
41
65
.3
53
78
.5
53
77
.5
52
75
.5
.04
.04
<.l
vane
r ur
eeK
, au
sun,
lex
a
Solid
s N
itro-
B
rom
ide,
;°
"a*
j ge
n,dl
s-
cSQUnm
° ni
trate
, so
lved
c^
'1-
dis-
(mfl/L)
w
n
"5-
0.25
44
9 1.
9
.10
307
.02
.25
471
.96
.15
438
.11
.39
499
.71
.23
495
.83
.07
357
.08
.06
358
.07
.20
213
.06
.21
214
.09
.27
296
.55
.39
391
.86
.39
378
.86
.40
381
.80
<.01
--
.01
is uo
nui
Nitr
o
gen,
ni
trite
, di
s
solv
ed
(mg/
L)
0.01 <.01
<.01
<.01 .0
2
.02
.05
.06
.01
.01 .02
.03
.03
.04
.01
nuea
Nitr
o
gen,
N
02+
N03
, di
s
solv
ed
(mg/
L)
1.9 .0
2
.96
.11 .72
.85
.13
.13
.07
.10
.57
.89
.89
.84
.02
Nitr
o
gen,
am
mo
ni
a,
dis
so
lved
(m
g/L)
0.02 .0
2
.13
.09
.20
.11 .27
.29
.35
.34
.01
.06
.06
.06
.01
Phos
ph
orus
, 81
5N
8180
dl
s-
(per
(p
er
solv
ed
mil)
m
il)
(mg/
L)
0.18
+8
.4
-0.0
8
.02
.12
+9.6
+1
0.6
.00
+13.
1
.01
+11.
9 +1
2.7
.14
+9.2
+1
1.6
.21
- +1
6.2
<.01
+9
.0
+16.
9
.08
+9.1
+1
7.7
.08
- +1
9.0
.18
+11.
2 +1
8.9
.04
+11.
2 +1
2.7
.13
+11.
7 +1
3.4
.21
+12.
0 +1
6.1
<.01
--
+16.
2
' Sta
ff h
eigh
t for
zer
o flo
w a
t wire
wei
ght.
2Rep
licat
e.