water resourse baseline & impact assessment for the
TRANSCRIPT

Water Resource Baseline & Impact
Assessment for the proposed
upgrading of the Balfour Wastewater
Treatment Works
Balfour, Mpumalanga
July 2019
CLIENT
Prepared for:
SLR Consulting (Africa) (Pty) Ltd
Prepared by:
The Biodiversity Company
Cell: +27 81 319 1225
Fax: +27 86 527 1965
www.thebiodiversitycompanycom

Water Resource Baseline & Impact Assessment Balfour WWTW Upgrade
www.thebiodiversitycompany.com
i
Upstream of Balfour WWTW, Mpumalanga
Report Name WATER RESOURSE BASELINE & IMPACT ASSESSMENT FOR THE
PROPOSED UPGRADING OF THE BALFOUR WWTW
Submitted to
Report Writer (Wetlands)
Andrew Husted (Pr. Sc. Nat. 400213/11)
Report Writer (Aquatics)
Michael Ryan (SASS 5 Accredited)
Report Reviewer Christian Fry
(Pr. Sc. Nat. 119082)
Declaration
The Biodiversity Company and its associates operate as independent consultants under the auspice of the South African Council for Natural Scientific Professions. We declare that we have no affiliation with or vested financial interests in the proponent, other than for work performed under the Ecological Assessment Regulations, 2017. We have no conflicting interests in the undertaking of this activity and have no interests in secondary developments resulting from the authorisation of this project. We have no vested interest in the project, other than to provide a professional service within the constraints of the project (timing, time and budget) based on the principals of science.

Water Resource Baseline & Impact Assessment Balfour WWTW Upgrade
www.thebiodiversitycompany.com
ii
Executive Summary
The Biodiversity Company was commissioned to conduct a water resource assessment,
consisting of baseline aquatic and a wetland assessment, as part of the Water Use Licence
(WUL no. 08/C21F/FG/2778) amendment for the watercourse including an impact assessment
for the proposed upgrading of the Balfour Wastewater Treatment Works (WWTW) in the
Balfour area, Mpumalanga. The project entails the upgrade of the existing Balfour WWTW,
increasing the capacity of the facility to 12 ML. A single (aquatic and wetland assessment) site
visit was conducted on the 3rd of July 2019, which would constitute a dry season survey.
This report, after taking into consideration the findings and recommendations provided by the
specialist herein, should inform and guide the Environmental Assessment Practitioner (EAP),
enabling informed decision making as to the ecological viability of the proposed development
and to provide an opinion on the whether any environmental authorisation process or licensing
is required for the proposed activities.
Wetlands
Two (2) HGM units were identified and delineated within the project area. These HGM types
include a channelled valley bottom wetland and a dammed depression. The dam is considered
to be an artificial system and as a result of this, an ecological assessment was only completed
for the (natural) channelled valley bottom wetland system.
The ecological status of the system was determined to be that of Moderately Modified (C)
system. The Ecological Importance & Sensitivity was calculated to have a Moderate (C) level
of importance. The Hydrological Functionality of the wetland was determined to have a
Moderate (C) level of importance. The wetlands’ hydrology ensured that there was a constant
water source within the area. The Direct Human Benefits were calculated to have a Marginal
(D) level of importance.
Aquatics
The current state of the tributary associated Suikerbosrant reach associated with the proposed
Balfour wastewater treatment works upgrade was found to be in a seriously/critically modified
state. This was predominantly due to a culmination of water quality, habitat, and flow
modifications within the reach. Instream and riparian habitat modifications were predominantly
due to extensive solid waste disposal, indigenous vegetation clearing and alien vegetation
encroachment and bank erosion within the system. According to in situ water quality analysis
the system was found to be natural upstream of the wastewater treatment works and poor
water quality downstream of the wastewater treatment works due to sewage disposal
decreasing dissolved oxygen in water and conductivity. The condition of the local aquatic
macroinvertebrates within the system was rated as seriously/critically modified according to
the biological bands and MIRAI findings. These findings do not align with the desktop
assessment, which indicated the PES was classed D (largely modified), moderate ecological
importance and sensitivity, and the recommended ecological category is class C. The
proposed Balfour wastewater treatment works upgrade may provide opportunities to improve
the current impacts on the system by good maintenance of the wastewater treatment works,
as the results indicate that raw sewage is currently being released into the system and
discouraging people that dispose solid waste into the system.

Water Resource Baseline & Impact Assessment Balfour WWTW Upgrade
www.thebiodiversitycompany.com
iii
Risk Assessment
Impacts were assessed in terms of the construction and operational phases of the plant,
assuming upgrades are within the extent of the existing facility only.
Risks associated with the project ranged from low to moderate. Some of the moderate risks
could be mitigated to a low level of risk. Some risks could not be adequately mitigated to
reduce the level of risk from a moderate to a low level of risk. Low risks are expected for the
construction phase of the project, with low and moderate risks expected for the operational
phase of the facility. Moderate risks (post mitigation) are associated with the altered flows
within the system due to discharge, and the resulting alterations to water quality due to the
input of treated effluent.
In accordance with the GA in terms of section 39 of the NWA, for water uses as defined in
section 21 (c) or section 21 (i) a GA does not apply “to any water use in terms of section 21
(c) or (i) of the Act associated with the construction, installation or maintenance of any sewer
pipelines, pipelines carrying hazardous materials and to raw water and waste water treatment
works”. Owing to the fact that this project is for the upgrade of a sewer network that does
contain hazardous material, a General Authorisation would not be permissible for the project
and a full water use licence will be required
Professional Opinion
It is the specialist’s opinion that while there are moderate risks, no fatal flaws were identified
for the proposed activities, and that the WWTW upgrade should proceed.

Water Resource Baseline & Impact Assessment Balfour WWTW Upgrade
www.thebiodiversitycompany.com
iv
Table of Contents
1 Introduction .................................................................................................................... 1
1.1 Objectives ............................................................................................................... 1
2 Key Legislative Requirements ........................................................................................ 2
2.1 National Water Act (Act No. 36 of 1998) ................................................................. 2
2.2 National Environmental Management Act (Act No. 107 of 1998) ............................. 2
3 Project Area ................................................................................................................... 3
4 Methodology .................................................................................................................. 3
4.1 Desktop Assessment .............................................................................................. 3
4.1.1 Wetland Identification and Mapping ................................................................. 4
4.1.2 Wetland Delineation ......................................................................................... 4
4.1.3 Wetland Functional Assessment ...................................................................... 5
4.1.4 Determining the Present Ecological Status of wetlands ................................... 5
4.1.5 Determining the Ecological Importance and Sensitivity of Wetlands ................ 5
4.1.6 Ecological Classification and Description ......................................................... 6
4.1.7 Buffer Determination ........................................................................................ 6
4.2 Aquatic Assessment ............................................................................................... 6
4.2.1 Water Quality ................................................................................................... 6
4.2.2 Aquatic Habitat Integrity ................................................................................... 6
4.2.3 Aquatic Macroinvertebrate Assessment ........................................................... 7
4.3 Risk Assessment .................................................................................................... 9
5 Limitations ...................................................................................................................... 9
6 Desktop Assessment ................................................................................................... 11
6.1 Climate ................................................................................................................. 11
6.2 Vegetation Types .................................................................................................. 11
6.3 Desktop Soils ........................................................................................................ 12
6.4 NFEPA (National Freshwater Ecosystem Priority Areas Status) ........................... 12
6.4.1 NFEPA’s for sub-quaternary catchment C21B- 1578 ..................................... 12
6.4.2 Present Ecological Status (PES) of sub-quaternary reach C21B- 1578.......... 13
7 Results and Discussion ................................................................................................ 14
7.1 Wetland Assessment ............................................................................................ 14
Water Resource Baseline & Impact Assessment Balfour WWTW Upgrade
www.thebiodiversitycompany.com
v
7.1.1 Wetland Unit Setting ...................................................................................... 17
7.1.2 Present Ecological State ................................................................................ 17
7.1.3 Ecosystem Services Assessment .................................................................. 18
7.1.4 Ecological Importance & Sensitivity ............................................................... 18
7.2 Aquatic Assessment ............................................................................................. 20
7.2.1 In situ water quality ........................................................................................ 21
7.2.2 Habitat Integrity Assessment ......................................................................... 22
7.2.3 Aquatic Macroinvertebrate Assessment ......................................................... 23
7.3 Present Ecological State ....................................................................................... 25
8 Risk Assessment ......................................................................................................... 26
8.1 Mitigation measures .............................................................................................. 31
8.1.1 General Mitigation .......................................................................................... 31
8.1.2 Operation of Heavy Machinery ....................................................................... 32
8.1.3 Physical Maintenance .................................................................................... 32
8.1.4 Increased Runoff mitigation ........................................................................... 32
8.2 Recommendations ................................................................................................ 33
9 Conclusion ................................................................................................................... 33
10 References ............................................................................................................... 35

Water Resource Baseline & Impact Assessment Balfour WWTW Upgrade
www.thebiodiversitycompany.com
vi
Tables
Table 1: Classes for determining the likely extent to which a benefit is being supplied .......... 5
Table 2: The Present Ecological Status categories (Macfarlane, et al., 2009) ....................... 5
Table 3: Description of Ecological Importance and Sensitivity categories.............................. 6
Table 4: Criteria used in the assessment of habitat integrity (Kleynhans, 1996) .................... 7
Table 5: Descriptions used for the ratings of the various habitat criteria ................................ 7
Table 6: Integrated Habitat Assessment System Scoring Guidelines .................................... 8
Table 7: Significance ratings matrix ....................................................................................... 9
Table 8: The land type data for the project .......................................................................... 12
Table 9: NFEPA’s for the Balfour WWTW project area ........................................................ 13
Table 10: Summary of the Present Ecological State of the SQRs associated with the Balfour
WWTW project area ............................................................................................................ 13
Table 11: Wetland classification as per SANBI guideline (Ollis et al., 2013) ........................ 15
Table 12: Summary of the scores for the PES: HGM 2 ....................................................... 17
Table 13: The EcoServices being provided by the wetlands................................................ 18
Table 14: The EIS results for the delineated wetland .......................................................... 19
Table 15: Photos, co-ordinates and descriptions for the sites sampled (July 2019) ............. 20
Table 16: In situ surface water quality results (July 2019) ................................................... 21
Table 17: Intermediate Habitat Integrity Assessment for the associated Suikerbosrant tributary
........................................................................................................................................... 22
Table 18: IHAS score at each site during the July 2019 survey ........................................... 23
Table 19: Biotope availability at the sites (Rating 0-5) ......................................................... 24
Table 20: Macroinvertebrate assessment results recorded during the survey (July 2019) ... 24
Table 21: MIRAI Score for the Suikerbosrant reach (2019) ................................................. 25
Table 22: The Present Ecological Status of the Suikerbosrant reach .................................. 25
Table 23: Potential impacts associated with the WWTW upgrade ....................................... 28
Table 24: DWS Risk Impact Matrix for the proposed project ............................................... 29
Table 25: DWS Risk Impact Matrix for the proposed project continued ............................... 30

Water Resource Baseline & Impact Assessment Balfour WWTW Upgrade
www.thebiodiversitycompany.com
vii
Figures
Figure 1: The regional layout of the project site ..................................................................... 3
Figure 2: Cross section through a wetland, indicating how the soil wetness and vegetation
indicators change (Ollis et al. 2013) ...................................................................................... 4
Figure 3: Biological Bands for the Highveld - Lower Ecoregion, calculated using percentiles 9
Figure 4: Construction activities underway within the facility and the upgrade of the perimeter
fence ................................................................................................................................... 10
Figure 5: The climate summary for Balfour area (Climate-Data.org) .................................... 11
Figure 6: Map illustrating fish and river FEPAs for the project area, the project area is
represented by the yellow square (Nel et al., 2011) ............................................................ 13
Figure 7: Photographs of the soil characteristics. A) Vertic soils, Rensburg soil form. B) Signs
of mottling. C) Orthic-A horizon. D) Melanic soils, Willowbrook form ................................... 14
Figure 8: Photographs of the wetland systems. A & B) The channelled valley bottom wetland.
C) The breached dam wall. D) The channel below the dam ................................................ 15
Figure 9: The delineated watercourses within 500 m of the project area ............................. 16
Figure 10: Amalgamated diagram of HGM 1, highlighting the dominant water inputs,
throughputs and outputs, SANBI guidelines (Ollis et al. 2013) ............................................ 17
Figure 11: Illustration of sampling points for the Balfour wastewater treatment works upgrade
........................................................................................................................................... 21
Figure 12: Photograph illustrating the railway crossing and livestock passing resulting in
riparian and instream modification (July 2019) .................................................................... 23
Figure 13: Photographs of untreated (or partially) treated sewerage being diverted into the
land scape .......................................................................................................................... 26
Figure 14: The mitigation hierarchy as described by the DEA (2013) .................................. 28

Water Resource Baseline & Impact Assessment Balfour WWTW Upgrade
www.thebiodiversitycompany.com
viii
Declaration
I, Andrew Husted declare that:
• I act as an independent specialist in this application;
• I will perform the work relating to the application in an objective manner, even if this
results in views and findings that are not favourable to the applicant;
• I declare that there are no circumstances that may compromise my objectivity in
performing such work;
• I have expertise in conducting the specialist report relevant to this application, including
knowledge of the relevant Acts, regulations and any guidelines that have relevance
to the proposed activity;
• I will comply with the Act, regulations and all other applicable legislation;
• I have no, and will not engage in, conflicting interests in the undertaking of the activity;
• I undertake to disclose to the applicant and the competent authority all material
information in my possession that reasonably has or may have the potential of
influencing any decision to be taken with respect to the application by the competent
authority; and the objectivity of any report, plan or document to be prepared by myself
for submission to the competent authority;
• all the particulars furnished by me in this form are true and correct; and
• I realise that a false declaration is an offence in terms of Regulation 48 of the EIA
Regulations, 2014 (as amended).
Andrew Husted (Pr. Sci. Nat. 400213/11)
The Biodiversity Company
19 July 2019
Water Resource Baseline & Impact Assessment Balfour WWTW Upgrade
www.thebiodiversitycompany.com
ix
Declaration
I, Christian Fry declare that:
• I act as the independent specialist in this application;
• I will perform the work relating to the application in an objective manner, even if this
results in views and findings that are not favourable to the applicant;
• I declare that there are no circumstances that may compromise my objectivity in
performing such work;
• I have expertise in conducting the specialist report relevant to this application, including
knowledge of the Act, regulations and any guidelines that have relevance to the
proposed activity;
• I will comply with the Act, regulations and all other applicable legislation;
• I have no, and will not engage in, conflicting interests in the undertaking of the activity;
• I undertake to disclose to the applicant and the competent authority all material
information in my possession that reasonably has or may have the potential of
influencing any decision to be taken with respect to the application by the competent
authority; and the objectivity of any report, plan or document to be prepared by myself
for submission to the competent authority;
• All the particulars furnished by me in this form are true and correct; and
• I realise that a false declaration is an offence in terms of Regulation 71 and is
punishable in terms of Section 24F of the Act.
Christian Fry (Pr. Sci. Nat. 119082)
Aquatic Specialist
The Biodiversity Company
19 July 2019

Water Resource Baseline & Impact Assessment Balfour WWTW Upgrade
www.thebiodiversitycompany.com
1
1 Introduction
The modification of land use within a river catchment has the potential to degrade local water
resources (Wepener et al., 2005). Industrial developments thus have the potential to
negatively impact on local water resources and ecosystem services. In order to holistically
manage water resources in South Africa, the use of standard water quality sampling methods
is considered in-effective. Non-point and point source pollutants are dynamic and can fluctuate
according to several factors such as rainfall, industrial discharges and extensive pollutant
seepage. Aquatic ecology is permanently exposed to the dynamic conditions within water
bodies and can therefore be an effective reflection of the environmental conditions within a
management area. Considering this, the monitoring of aquatic ecology is regarded as an
effective tool in water management strategies.
The Biodiversity Company was commissioned by SLR to conduct a water resource
assessment, consisting of baseline aquatic and a wetland assessment, as part of the Water
Use Licence (WUL no. 08/C21F/FG/2778) amendment for the watercourse including an
impact assessment for the proposed upgrading of the Balfour Wastewater Treatment Works
(WWTW) in the Balfour area, Mpumalanga.
The project entails the upgrade of the existing Balfour WWTW, increasing the capacity of the
facility to 12 ML. A single (aquatic and wetland assessment) site visit was conducted on the
3rd of July 2019, which would constitute a dry season survey.
This report, after taking into consideration the findings and recommendations provided by the
specialist herein, should inform and guide the Environmental Assessment Practitioner (EAP),
enabling informed decision making as to the ecological viability of the proposed development
and to provide an opinion on the whether any environmental authorisation process or licensing
is required for the proposed activities.
1.1 Objectives
The aim of the assessment is to provide the water resource baseline and impact assessment
for the proposed wastewater treatment works upgrade project. This was achieved through the
following:
• Determining the present ecological status of the local watercourses:
o The assessment of water quality;
o The assessment of habitat quality;
o The assessment of biological responses;
• The delineation and assessment of wetlands within 500 m regulation area;
• A risk assessment for the proposed wastewater treatment works upgrade; and
• The prescription of mitigation measures and recommendations for identified risks.

Water Resource Baseline & Impact Assessment Balfour WWTW Upgrade
www.thebiodiversitycompany.com
2
2 Key Legislative Requirements
2.1 National Water Act (Act No. 36 of 1998)
The Department of Water & Sanitation (DWS) is the custodian of South Africa’s water
resources and therefore assumes public trusteeship of water resources, which includes
watercourses, surface water, estuaries, or aquifers. The National Water Act (NWA) (Act No.
36 of 1998) allows for the protection of water resources, which includes:
• The maintenance of the quality of the water resource to the extent that the water
resources may be used in an ecologically sustainable way;
• The prevention of the degradation of the water resource; and
• The rehabilitation of the water resource.
A watercourse means:
• A river or spring;
• A natural channel in which water flows regularly or intermittently;
• A wetland, lake or dam into which, or from which, water flows; and
• Any collection of water which the Minister may, by notice in the Gazette, declare to be
a watercourse, and a reference to a watercourse includes, where relevant, its bed and
banks.
The NWA recognises that the entire ecosystem, and not just the water itself, and any given
water resource constitutes the resource and as such needs to be conserved. No activity may
therefore take place within a watercourse unless it is authorised by the DWS.
For the purposes of this project, a wetland area is defined according to the NWA (Act No. 36
of 1998): “Land which is transitional between terrestrial and aquatic systems where the water
table is usually at or near the surface, or the land is periodically covered with shallow water,
and which land in normal circumstances supports or would support vegetation typically
adapted to life in saturated soil”.
Wetlands have one or more of the following attributes to meet the NWA wetland definition
(DWAF, 2005):
• A high-water table that results in the saturation at or near the surface, leading to
anaerobic conditions developing in the top 50 cm of the soil;
• Wetland or hydromorphic soils that display characteristics resulting from prolonged
saturation, i.e. mottling or grey soils; and
• The presence of, at least occasionally, hydrophilic plants, i.e. hydrophytes (water
loving plants).
2.2 National Environmental Management Act (Act No. 107 of 1998)
The National Environmental Management Act (NEMA) (Act 107 of 1998) and the associated
Regulations as amended in April 2017, states that prior to any development taking place within
a wetland or riparian area, an environmental authorisation process needs to be followed. This

Water Resource Baseline & Impact Assessment Balfour WWTW Upgrade
www.thebiodiversitycompany.com
3
could follow either the Basic Assessment Report (BAR) process or the Environmental Impact
Assessment (EIA) process depending on the scale of the impact.
3 Project Area
The project area is situated in the C21B quaternary catchment within the Vaal Water
Management Area (WMA). The water course for this study falls along the C21B - 1578 Sub
Quaternary Reach (SQR) (Suikerbosrant River) and one of its tributary, in the Highveld –
Lower Ecoregion. The system at a desktop level is regarded at moderately modified due to
agricultural and livestock activities in the surrounding areas. The sampling points for this study
were selected according to the location of the Wastewater Treatment Works, three sites from
upstream to downstream. The illustration of the sampling points associated with the project
area are presented in Figure 1.
Figure 1: The regional layout of the project site
4 Methodology
4.1 Desktop Assessment
The following information sources were considered for the desktop assessment;
• Aerial imagery (Google Earth Pro);
• Land Type Data (Land Type Survey Staff, 1972 - 2006);
• The National Freshwater Ecosystem Priority Areas (Nel et al., 2011);
• Mpumalanga Highveld Wetlands dataset; and

Water Resource Baseline & Impact Assessment Balfour WWTW Upgrade
www.thebiodiversitycompany.com
4
• Contour data (5 m).
4.1.1 Wetland Identification and Mapping
The survey primarily focussed on the development footprint area, but also considered the
extended 500m regulation area. The wetland areas were delineated in accordance with the
DWAF (2005) guidelines, a cross section is presented in Figure 2. The outer edges of the
wetland areas were identified by considering the following four specific indicators:
• The Terrain Unit Indicator helps to identify those parts of the landscape where wetlands
are more likely to occur;
• The Soil Form Indicator identifies the soil forms, as defined by the Soil Classification
Working Group (1991), which are associated with prolonged and frequent saturation.
o The soil forms (types of soil) found in the landscape were identified using the
South African soil classification system namely; Soil Classification: A
Taxonomic System for South Africa;
• The Soil Wetness Indicator identifies the morphological "signatures" developed in the
soil profile as a result of prolonged and frequent saturation; and
• The Vegetation Indicator identifies hydrophilic vegetation associated with frequently
saturated soils.
Vegetation is used as the primary wetland indicator. However, in practise the soil wetness
indicator tends to be the most important, and the other three indicators are used in a
confirmatory role.
Figure 2: Cross section through a wetland, indicating how the soil wetness and vegetation indicators change (Ollis et al. 2013)
4.1.2 Wetland Delineation
The wetland indicators described above are used to determine the boundaries of the wetlands
within the project area. These delineations are then illustrated by means of maps accompanied
by descriptions.

Water Resource Baseline & Impact Assessment Balfour WWTW Upgrade
www.thebiodiversitycompany.com
5
4.1.3 Wetland Functional Assessment
Wetland functionality refers to the ability of wetlands to provide healthy conditions for the wide
variety of organisms found in wetlands as well as humans. EcoServices serve as the main
factor contributing to wetland functionality.
The assessment of the ecosystem services supplied by the identified wetlands was conducted
per the guidelines as described in WET-EcoServices (Kotze et al. 2008). An assessment was
undertaken that examines and rates the following services according to their degree of
importance and the degree to which the services are provided (Table 1).
Table 1: Classes for determining the likely extent to which a benefit is being supplied
Score Rating of likely extent to which a benefit is being supplied
< 0.5 Low
0.6 - 1.2 Moderately Low
1.3 - 2.0 Intermediate
2.1 - 3.0 Moderately High
> 3.0 High
4.1.4 Determining the Present Ecological Status of wetlands
The overall approach is to quantify the impacts of human activity or clearly visible impacts on
wetland health, and then to convert the impact scores to a Present Ecological Status (PES)
score. This takes the form of assessing the spatial extent of impact of individual
activities/occurrences and then separately assessing the intensity of impact of each activity in
the affected area. The extent and intensity are then combined to determine an overall
magnitude of impact. The Present State categories are provided in Table 2.
Table 2: The Present Ecological Status categories (Macfarlane, et al., 2009)
Impact Category
Description Impact Score
Range PES
None Unmodified, natural 0 to 0.9 A
Small Largely Natural with few modifications. A slight change in ecosystem processes is discernible and a small loss of natural habitats and biota may have taken place.
1.0 to 1.9 B
Moderate Moderately Modified. A moderate change in ecosystem processes and loss of natural habitats has taken place, but the natural habitat remains predominantly intact.
2.0 to 3.9 C
Large Largely Modified. A large change in ecosystem processes and loss of natural habitat and biota has occurred.
4.0 to 5.9 D
Serious Seriously Modified. The change in ecosystem processes and loss of natural habitat and biota is great, but some remaining natural habitat features are still recognizable.
6.0 to 7.9 E
Critical Critical Modification. The modifications have reached a critical level and the ecosystem processes have been modified completely with an almost complete loss of natural habitat and biota.
8.0 to 10 F
4.1.5 Determining the Ecological Importance and Sensitivity of Wetlands
The method used for the EIS determination was adapted from the method as provided by
DWS (1999) for floodplains. The method takes into consideration PES scores obtained for
WET-Health as well as function and service provision to enable the assessor to determine the
most representative EIS category for the wetland feature or group being assessed. A series

Water Resource Baseline & Impact Assessment Balfour WWTW Upgrade
www.thebiodiversitycompany.com
6
of determinants for EIS are assessed on a scale of 0 to 4, where 0 indicates no importance
and 4 indicates very high importance. The mean of the determinants is used to assign the EIS
category as listed in Table 3, (Rountree et al., 2012).
Table 3: Description of Ecological Importance and Sensitivity categories
EIS Category Range of Mean Recommended Ecological
Management Class
Very High 3.1 to 4.0 A
High 2.1 to 3.0 B
Moderate 1.1 to 2.0 C
Low Marginal < 1.0 D
4.1.6 Ecological Classification and Description
The National Wetland Classification Systems (NWCS) developed by the South African
National Biodiversity Institute (SANBI) will be considered for this study. This system comprises
a hierarchical classification process of defining a wetland based on the principles of the
hydrogeomorphic (HGM) approach at higher levels, and then also includes structural features
at the lower levels of classification (Ollis et al. 2013).
4.1.7 Buffer Determination
The “Preliminary Guideline for the Determination of Buffer Zones for Rivers, Wetlands and
Estuaries” (Macfarlane, et al., 2014) was used to determine the appropriate buffer zone for
the proposed activity.
4.2 Aquatic Assessment
4.2.1 Water Quality
Water quality was measured in situ using a handheld calibrated Extech DO700 multi-meter.
The constituents considered that were measured included: pH, conductivity (µS/cm), water
temperature (°C) and Dissolved Oxygen (DO) in mg/l.
4.2.2 Aquatic Habitat Integrity
The Intermediate Habitat Assessment Index (IHIA) as described in the Procedure for Rapid
Determination of Resource Directed Measures for River Ecosystems (Section D), 1999 were
used to define the ecological status of the river reach.
The area covered in this assessment included the assessed Suikerbosrant River tributary.
This habitat assessment model compares current conditions with reference conditions that are
expected to have been present.
The IHIA model was used to assess the integrity of the habitats from a riparian and instream
perspective. The habitat integrity of a river refers to the maintenance of a balanced
composition of physico-chemical and habitat characteristics on a temporal and spatial scale
that are comparable to the characteristics of natural habitats of the region (Kleynhans, 1996).
The criteria and ratings utilised in the assessment of habitat integrity in the current study are
presented in Table 4 and Table 5 respectively.

Water Resource Baseline & Impact Assessment Balfour WWTW Upgrade
www.thebiodiversitycompany.com
7
Table 4: Criteria used in the assessment of habitat integrity (Kleynhans, 1996)
Criterion Relevance
Water abstraction Direct impact on habitat type, abundance and size. Also implicated in flow, bed, channel and water quality characteristics. Riparian vegetation may be influenced by a decrease in the supply of water.
Flow modification
Consequence of abstraction or regulation by impoundments. Changes in temporal and spatial characteristics of flow can have an impact on habitat attributes such as an increase in duration of low flow season, resulting in low availability of certain habitat types or water at the start of the breeding, flowering or growing season.
Bed modification
Regarded as the result of increased input of sediment from the catchment or a decrease in the ability of the river to transport sediment. Indirect indications of sedimentation are stream bank and catchment erosion. Purposeful alteration of the stream bed, e.g. the removal of rapids for navigation is also included.
Channel modification
May be the result of a change in flow, which may alter channel characteristics causing a change in marginal instream and riparian habitat. Purposeful channel modification to improve drainage is also included.
Water quality modification
Originates from point and diffuse point sources. Measured directly or alternatively agricultural activities, human settlements and industrial activities may indicate the likelihood of modification. Aggravated by a decrease in the volume of water during low or no flow conditions.
Inundation Destruction of riffle, rapid and riparian zone habitat. Obstruction to the movement of aquatic fauna and influences water quality and the movement of sediments.
Exotic macrophytes Alteration of habitat by obstruction of flow and may influence water quality. Dependent upon the species involved and scale of infestation.
Exotic aquatic fauna
The disturbance of the stream bottom during feeding may influence the water quality and increase turbidity. Dependent upon the species involved and their abundance.
Solid waste disposal
A direct anthropogenic impact which may alter habitat structurally. Also, a general indication of the misuse and mismanagement of the river.
Indigenous vegetation removal
Impairment of the buffer the vegetation forms to the movement of sediment and other catchment runoff products into the river. Refers to physical removal for farming, firewood and overgrazing.
Exotic vegetation encroachment
Excludes natural vegetation due to vigorous growth, causing bank instability and decreasing the buffering function of the riparian zone. Allochtonous organic matter input will also be changed. Riparian zone habitat diversity is also reduced.
Bank erosion
Decrease in bank stability will cause sedimentation and possible collapse of the river bank resulting in a loss or modification of both instream and riparian habitats. Increased erosion can be the result of natural vegetation removal, overgrazing or exotic vegetation encroachment.
Table 5: Descriptions used for the ratings of the various habitat criteria
Impact Category
Description Score
None No discernible impact or the modification is located in such a way that it has no impact on habitat quality, diversity, size and variability.
0
Small The modification is limited to very few localities and the impact on habitat quality, diversity, size and variability are also very small.
1-5
Moderate The modifications are present at a small number of localities and the impact on habitat quality, diversity, size and variability are also limited.
6-10
Large The modification is generally present with a clearly detrimental impact on habitat quality, diversity, size and variability. Large areas are, however, not influenced.
11-15
Serious The modification is frequently present and the habitat quality, diversity, size and variability in almost the whole of the defined area are affected. Only small areas are not influenced.
16-20
Critical The modification is present overall with a high intensity. The habitat quality, diversity, size and variability in almost the whole of the defined section are influenced detrimentally.
21-25
4.2.3 Aquatic Macroinvertebrate Assessment
Macroinvertebrate assemblages are good indicators of localised conditions because many
benthic macroinvertebrates have limited migration patterns or a sessile mode of life. They are
particularly well-suited for assessing site-specific impacts (upstream and downstream studies)

Water Resource Baseline & Impact Assessment Balfour WWTW Upgrade
www.thebiodiversitycompany.com
8
(Barbour et al., 1999). Benthic macroinvertebrate assemblages are made up of species that
constitute a broad range of trophic levels and pollution tolerances, thus providing strong
information for interpreting cumulative effects (Barbour et al., 1999). The assessment and
monitoring of benthic macroinvertebrate communities forms an integral part of the monitoring
of the health of an aquatic ecosystem.
4.2.3.1 Integrated Habitat Assessment System
The quality of the instream and riparian habitat influences the structure and function of the
aquatic community in a stream; therefore, the assessment of the habitat is critical to any
assessment of ecological integrity. The Integrated Habitat Assessment System (IHAS, version
2) was applied at each of the sampling sites in order to assess the availability of habitat
biotopes for macroinvertebrates. The IHAS was developed specifically for use with the SASS5
index and rapid biological assessment protocols in South Africa (McMillan, 1998). The index
considers sampling habitat and stream characteristics. The sampling habitat is broken down
into three sub-sections namely Stones-In-Current (SIC), Vegetation (VEG), Gravel Sand &
Mud (GSM) and other habitat/ general. It is presently thought that a total IHAS score of over
65% represents good habitat conditions, a score over 55% indicates adequate/fair habitat
conditions and a score below 55% indicates poor habitat (McMillan, 1998) (Table 6).
Table 6: Integrated Habitat Assessment System Scoring Guidelines
IHAS Score Description
> 65% Good
55-65% Adequate/Fair
< 55% Poor
Macroinvertebrate assemblages are good indicators of localised conditions because many
benthic macroinvertebrates have limited migration patterns or a sessile mode of life. They are
particularly well-suited for assessing site-specific impacts (upstream and downstream studies)
(Barbour et al., 1999). Benthic macroinvertebrate assemblages are made up of species that
constitute a broad range of trophic levels and pollution tolerances, thus providing strong
information for interpreting cumulative effects (Barbour et al., 1999). The assessment and
monitoring of benthic macroinvertebrate communities forms an integral part of the monitoring
of the health of an aquatic ecosystem.
4.2.3.2 South African Scoring System
The South African Scoring System version 5 (SASS5) is the current index being used to
assess the status of riverine macroinvertebrates in South Africa. According to Dickens and
Graham (2002), the index is based on the presence of aquatic invertebrate families and the
perceived sensitivity to water quality changes of these families. Different families exhibit
different sensitivities to pollution, these sensitivities range from highly tolerant families (e.g.
Chironomidae) to highly sensitive families (e.g. Perlidae). SASS results are expressed both
as an index score (SASS score) and the Average Score Per recorded Taxon (ASPT value).
Sampled invertebrates were identified using the “Aquatic Invertebrates of South African
Rivers” Illustrations book, by Gerber and Gabriel (2002). Identification of organisms was made
to family level (Thirion et al., 1995; Dickens and Graham, 2002; Gerber and Gabriel, 2002).

Water Resource Baseline & Impact Assessment Balfour WWTW Upgrade
www.thebiodiversitycompany.com
9
All SASS5 and ASPT scores are compared with the SASS5 Data Interpretation Guidelines
(Dallas, 2007) for the Highveld - lower ecoregion (Figure 3). This method seeks to develop
biological bands depicting the various ecological states and is derived from data contained
within the Rivers Database and supplemented with other data not yet in the database.
Figure 3: Biological Bands for the Highveld - Lower Ecoregion, calculated using percentiles
4.3 Risk Assessment
The risk assessment will be completed in accordance with the requirements of the DWS
General Authorisation (GA) in terms of Section 39 of the NWA for water uses as defined in
Section 21(c) or Section 21(i) (GN 509 of 2016). The significance of the impact is calculated
according to Table 7.
Table 7: Significance ratings matrix
Rating Class Management Description
1 – 55 (L) Low Risk Acceptable as is or consider requirement for mitigation. Impact to watercourses and resource quality small and easily mitigated. Wetlands may be excluded.
56 – 169 M) Moderate Risk Risk and impact on watercourses are notably and require mitigation measures on a higher level, which costs more and require specialist input. Wetlands are excluded.
170 – 300 (H) High Risk Always involves wetlands. Watercourse(s)impacts by the activity are such that they impose a long-term threat on a large scale and lowering of the Reserve.
5 Limitations
The following aspects were considered as limitations:
• Site B2 was found dry, therefore it was not sampled;

Water Resource Baseline & Impact Assessment Balfour WWTW Upgrade
www.thebiodiversitycompany.com
10
• The downstream site B3 had excessive sewage impacting water quality, limiting
macroinvertebrate communities, and further considered hazardous to the aquatics
practitioner;
• Due to the size of the project area, its incised topography and limited road access
some areas relied on extrapolation of field data and satellite imagery for delineation;
• Wetlands within the 500 m regulated area were considered but not explicitly sampled
and delineated in-field, wetland delineations within these areas should be considered
desktop;
• The GPS used for water resource delineations is accurate to within five meters.
Therefore, the wetland delineation plotted digitally may be offset by at least five meters
to either side;
• No buffer was applied to the identified wetland as this is for the upgrade of the facility,
with all activities located within the extent of the WWTW; and
• It was apparent that construction of the facility was underway at the time of the site
assessment (pictured below). The risk assessment is there based on expected and
observed risks.
Figure 4: Construction activities underway within the facility and the upgrade of the perimeter fence

Water Resource Baseline & Impact Assessment Balfour WWTW Upgrade
www.thebiodiversitycompany.com
11
6 Desktop Assessment
6.1 Climate
This region is classified as warm and temperate. Balfour has more rainfall in summer than
winter season, with an average annual rainfall of 694 mm. The average temperature for this
region is 15.4 °C. The coldest month for Balfour is June with an average temperature of 8.6
°C. Köppen and Geiger classified the area as experiencing Subtropical highland climate. See
Figure 5 (Climate-Data.org).
Figure 5: The climate summary for Balfour area (Climate-Data.org)
6.2 Vegetation Types
The project area is predominantly associated the Andesite Mountain Bushveld (SVcb11)
vegetation type.
Distribution: Gauteng, North-West, Mpumalanga and Free State Provinces: Several separate
occurrences of which the main are: the Bronberg Ridge in eastern Pretoria extending to
Welbekend; from Hartebeesthoek in the west along the valley between the two parallel ranges
of hills to Atteridgeville; hills in southern Johannesburg; several hills encompassing Nigel,
Willemsdal, Coalbrook and Suikerbosrand (in part); and the outer ring of ridges of the
Vredefort Dome and some hills to the northwest around Potchefstroom. Altitude about 1 350–
1 800 m.
Vegetation & Landscape: Features Dense, medium-tall thorny bushveld with a well-
developed grass layer on hill slopes and some valleys with undulating landscape.
Climate: Summer rainfall with very dry winters. MAP from about 550 mm in the southwest to
about 750 mm in the northeast. Frequent frost in winter, but less on the ridges and hills. See
also climate diagram for SVcb 11 Andesite Mountain Bushveld.
Conservation: Least threatened. Target 24%. About 7% statutorily conserved mainly in the
Suikerbosrand Nature Reserve and Magaliesberg Nature Area. An additional 1–2% conserved
Water Resource Baseline & Impact Assessment Balfour WWTW Upgrade
www.thebiodiversitycompany.com
12
in other reserves mainly in the Hartbeesthoek Radio Astronomy Observatory. Some 15%
already transformed, mainly cultivated and some urban and built-up areas. Some of the unit
fringes on major urban areas. Erosion is generally very low.
6.3 Desktop Soils
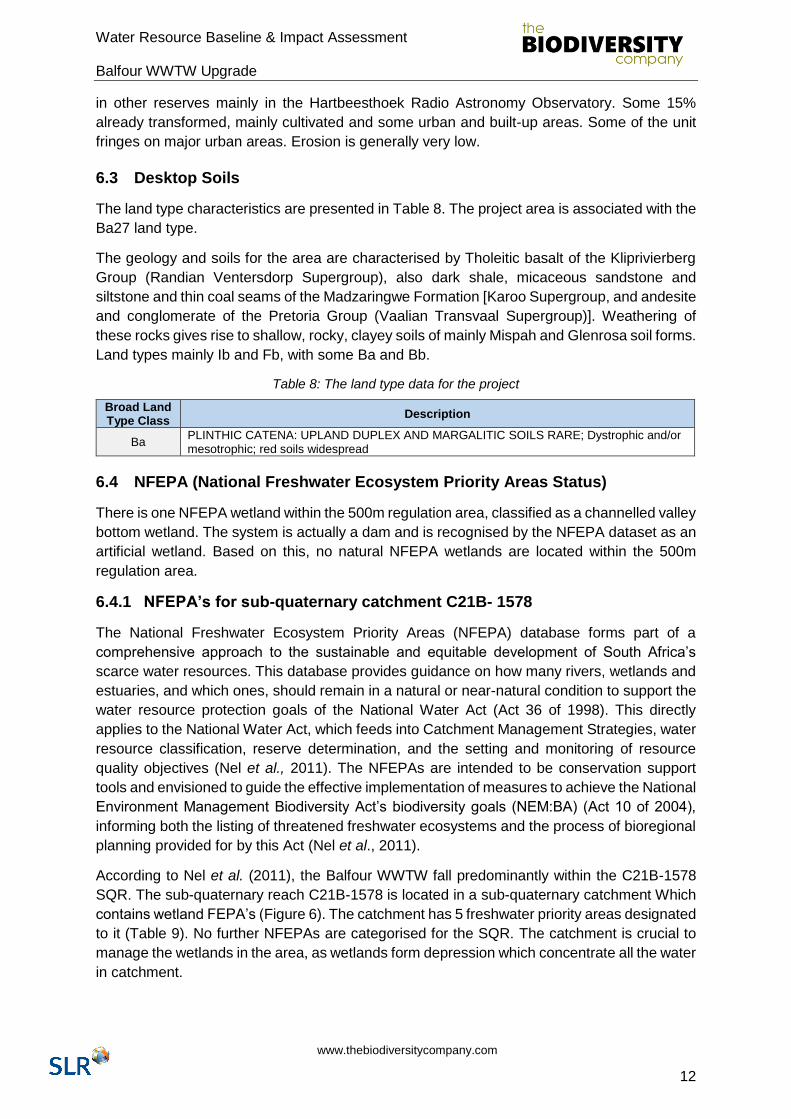
The land type characteristics are presented in Table 8. The project area is associated with the
Ba27 land type.
The geology and soils for the area are characterised by Tholeitic basalt of the Kliprivierberg
Group (Randian Ventersdorp Supergroup), also dark shale, micaceous sandstone and
siltstone and thin coal seams of the Madzaringwe Formation [Karoo Supergroup, and andesite
and conglomerate of the Pretoria Group (Vaalian Transvaal Supergroup)]. Weathering of
these rocks gives rise to shallow, rocky, clayey soils of mainly Mispah and Glenrosa soil forms.
Land types mainly Ib and Fb, with some Ba and Bb.
Table 8: The land type data for the project
Broad Land Type Class
Description
Ba PLINTHIC CATENA: UPLAND DUPLEX AND MARGALITIC SOILS RARE; Dystrophic and/or mesotrophic; red soils widespread
6.4 NFEPA (National Freshwater Ecosystem Priority Areas Status)
There is one NFEPA wetland within the 500m regulation area, classified as a channelled valley
bottom wetland. The system is actually a dam and is recognised by the NFEPA dataset as an
artificial wetland. Based on this, no natural NFEPA wetlands are located within the 500m
regulation area.
6.4.1 NFEPA’s for sub-quaternary catchment C21B- 1578
The National Freshwater Ecosystem Priority Areas (NFEPA) database forms part of a
comprehensive approach to the sustainable and equitable development of South Africa’s
scarce water resources. This database provides guidance on how many rivers, wetlands and
estuaries, and which ones, should remain in a natural or near-natural condition to support the
water resource protection goals of the National Water Act (Act 36 of 1998). This directly
applies to the National Water Act, which feeds into Catchment Management Strategies, water
resource classification, reserve determination, and the setting and monitoring of resource
quality objectives (Nel et al., 2011). The NFEPAs are intended to be conservation support
tools and envisioned to guide the effective implementation of measures to achieve the National
Environment Management Biodiversity Act’s biodiversity goals (NEM:BA) (Act 10 of 2004),
informing both the listing of threatened freshwater ecosystems and the process of bioregional
planning provided for by this Act (Nel et al., 2011).
According to Nel et al. (2011), the Balfour WWTW fall predominantly within the C21B-1578
SQR. The sub-quaternary reach C21B-1578 is located in a sub-quaternary catchment Which
contains wetland FEPA’s (Figure 6). The catchment has 5 freshwater priority areas designated
to it (Table 9). No further NFEPAs are categorised for the SQR. The catchment is crucial to
manage the wetlands in the area, as wetlands form depression which concentrate all the water
in catchment.

Water Resource Baseline & Impact Assessment Balfour WWTW Upgrade
www.thebiodiversitycompany.com
13
Table 9: NFEPA’s for the Balfour WWTW project area
Type of FEPA map category Biodiversity features
Suikerbosrant C21B-1578
FEPA: Number of wetland clusters 1 Wet Cluster FEPA
FEPA: Wetland ecosystem type Mesic Highveld Grassland Group 3_Depression
FEPA: Wetland ecosystem type Mesic Highveld Grassland Group 3_Flat
FEPA: Wetland ecosystem type Mesic Highveld Grassland Group 3_Floodplain wetland
FEPA: Wetland ecosystem type Mesic Highveld Grassland Group 3_Valleyhead seep
Figure 6: Map illustrating fish and river FEPAs for the project area, the project area is represented by the yellow square (Nel et al., 2011)
6.4.2 Present Ecological Status (PES) of sub-quaternary reach C21B- 1578
Desktop information for SQR’s was obtained from DWS, 2018. The C21B-1578 SQR spans
22 km of the Suikerbosrant tributary. The PES category of the reach is classed as largely
modified (class D) (Table 10). The largely modified state of the reach was due to large to
serious impacts to instream habitat, wetland and riparian zone continuity, flow modifications
and moderate potential impacts on physico-chemical conditions (water quality). Anthropogenic
impacts identified within the associated Suikerbosrant sub-quaternary catchment include low
water crossings, agricultural activities, small instream dams, bank erosion, and effluent from
the Balfour wastewater treatment works.
Table 10: Summary of the Present Ecological State of the SQRs associated with the Balfour WWTW project area
SQR Desktop PES EI* ES** REC***
C21B-1578 D Moderate Moderate C
*EI – Ecological Importance; **ES – Ecological Sensitivity; **REC Recommended Ecological Category

Water Resource Baseline & Impact Assessment Balfour WWTW Upgrade
www.thebiodiversitycompany.com
14
7 Results and Discussion
7.1 Wetland Assessment
The wetland area was delineated in accordance with the DWAF (2005) guidelines (see Figure
9), indicating some of the wetland sampling sites. Two (2) hydro-geomorphic (HGM) wetland
types were identified and delineated for this assessment. The two systems include a
channelled valley bottom wetland, and a depression (or dam). The dam has been breached
downstream of the delineated valley bottom system and is regarded as an artificial system.
For the purposes of this assessment, the ecological assessments were only undertaken for
the natural wetland system, namely the channelled valley bottom wetland. Photographs of the
dominant soil characteristics identified for the assessment are presented in Figure 7. The two
dominant wetland soil forms identified for the assessment include the Willowbrook and
Rensburg forms.
Figure 7: Photographs of the soil characteristics. A) Vertic soils, Rensburg soil form. B) Signs of mottling. C) Orthic-A horizon. D) Melanic soils, Willowbrook form
The vertic A horizon of the Rensburg soil form has clearly visible slickensides in the transition
to the lower layers and is characteristically cracked when dry. The vertic A horizon ranges
from moist to dry depending on the frequency and duration of wetting when the soils are
flooded. The underlying G horizon is often saturated unless the system has been drained and
has typical grey matrix colours often with blue or green tint with or without mottling. In places
in the project area, this form was calcareous in the upper G horizon.
The Willowbrook soil form has been identified within the project area. This soil form consists
of a Melanic A-horizon on top of a G-horizon. The Melanic clays are very similar to that of the
Vertic clays in saturated conditions, especially those located at the bottom of an eroded and
saturated stream channel. The high erodibility of Melanic soil types has resulted in large
volumes of this soil form being eroded away in a stream channel with high energy after high
intensity rainfall events, only leaving behind the portions with high concentrations of clay.
Melanic clays have extremely good structure, which therefore allows for rapid infiltration and

Water Resource Baseline & Impact Assessment Balfour WWTW Upgrade
www.thebiodiversitycompany.com
15
percolation without the possibility of precipitation accumulating within the first 50cm. Melanic
clays will have a blocky structure which are approximately 5cm in diameter with extremely
dark colours being present.
The wetland classification as per SANBI guidelines (Ollis et al. 2013) is presented in Table 11.
The two (2) wetland types delineated for the assessment include a channelled valley bottom
wetland and a dammed depression. Photographs of the identified and delineated wetland
systems are presented in Figure 8.
Table 11: Wetland classification as per SANBI guideline (Ollis et al., 2013)
Wetland Name
Level 1 Level 2 Level 3 Level 4
System DWS
Ecoregion/s NFEPA Wet Veg Group/s
Landscape Unit
4A (HGM) 4B 4C
HGM 1 Inland Highveld Central
Bushveld Group 1
Valley Floor
Channelled Valley Bottom
N/A N/A
HGM 2 Inland Highveld Central
Bushveld Group 1
Valley Floor
Depression Dammed With channel
inflow
Figure 8: Photographs of the wetland systems. A & B) The channelled valley bottom wetland. C) The breached dam wall. D) The channel below the dam

Water Resource Baseline & Impact Assessment Balfour WWTW Upgrade
www.thebiodiversitycompany.com
16
Figure 9: The delineated watercourses within 500 m of the project area

Water Resource Baseline & Impact Assessment Balfour WWTW Upgrade
www.thebiodiversitycompany.com
17
7.1.1 Wetland Unit Setting
HGM 1 is located on the “valley floor” landscape unit. Channelled valley-bottom wetlands are
typically found on valley-floors with a clearly defined, finite stream channel and lacks floodplain
features, referring specifically to meanders. Channelled valley-bottom wetlands are known to
undergo loss of sediment in cases where the wetlands’ slope is high and the deposition thereof
in cases of low relief. Figure 10 presents a diagram of HGM 1, showing the dominant
movement of water into, through and out of the system.
Figure 10: Amalgamated diagram of HGM 1, highlighting the dominant water inputs, throughputs and outputs, SANBI guidelines (Ollis et al. 2013)
7.1.2 Present Ecological State
The PES for the assessed HGM unit is presented in Table 12. The overall wetland health for
HGM was determined to be that of Moderately Modified (C) systems. Although the wetlands
are impacted upon, the wetlands maintained the habitat structure and functioning.
Table 12: Summary of the scores for the PES: HGM 2
Component PES
Score PES
Rating Description
Hydrology 2.8 C
Moderately Modified: The modifications in the hydrological component are as a result of the development of the catchment. These developments include an access route and the WWTW facility on the periphery of the system. The dam downstream of the system is now breached and has a reduced impact on the hydrology of the overall system. Activities associated with the WWTW, namely trenches and diversions of untreated sewerage into the landscape have also negligibly contributed to altered flows.
Geomorphology 3.8 C/D Moderate (to Largely) Modified: Due to the increase in flow volumes and velocities across the system, erosion is evident. This has resulted in

Water Resource Baseline & Impact Assessment Balfour WWTW Upgrade
www.thebiodiversitycompany.com
18
an incised channel in selected reaches, and the straightening of the watercourse in these reaches.
Vegetation 3.1 C
Moderate Modified: The general development (and disturbance) to the catchment area has resulted in the alteration in the natural vegetation through the establishment and encroachment of alien vegetation, especially onto the embankments of the system. Alien vegetation is well established in areas that have been disturbed by the WWTW, and encroachment of alien vegetation into adjoining areas is evident.
Overall 3.2 C Moderately Modified. A moderate change in ecosystem processes and loss of natural habitats has taken place, but the natural habitat remains predominantly intact.
7.1.3 Ecosystem Services Assessment
The Ecosystem services provided by the HGM unit present at the site was assessed and rated
using the WET-EcoServices method (Kotze, et al. 2009). The summarised results for the HGM
units are shown in Table 13. HGM 1 had an overall Intermediate level of service. The wetland
showed an elevated functionality for flood attenuation and streamflow regulation. Although the
wetland are impacted upon, in the local setting, the wetland areas allow for floods to be
attenuated and slowed down and minimise damage. The direct benefits provided by the
system are largely rated from low to moderately low.
Table 13: The EcoServices being provided by the wetlands
Wetland Unit HGM 1
Ec
os
ys
tem
Se
rvic
es S
up
plied
by
We
tla
nd
s
Ind
irec
t B
en
efi
ts
Reg
ula
tin
g a
nd
su
pp
ort
ing
be
ne
fits
Flood attenuation 2,2
Streamflow regulation 2,2
Wa
ter
Qualit
y
en
ha
ncem
en
t
be
ne
fits
Sediment trapping 2.0
Phosphate assimilation 2,0
Nitrate assimilation 1,8
Toxicant assimilation 2,0
Erosion control 1,8
Carbon storage 0,7
Dir
ec
t B
en
efi
ts
Biodiversity maintenance 1,5
Pro
vis
ion
be
ne
fits
Provisioning of water for human use 1,1
Provisioning of harvestable resources 0,4
Provisioning of cultivated foods 1,0
Cu
ltu
ral
be
ne
fits
Cultural heritage 0,0
Tourism and recreation 1,0
Education and research 0,8
Overall 20,5
Average 1,3
7.1.4 Ecological Importance & Sensitivity
The EIS assessment was applied to the HGM unit described in the previous section in order
to assess the levels of sensitivity and ecological importance of the wetlands. The results of
the assessment are shown in Table 14.

Water Resource Baseline & Impact Assessment Balfour WWTW Upgrade
www.thebiodiversitycompany.com
19
The EIS for the HGM unit was calculated to have a Moderate (C) level of importance. The EIS
was determined to be moderate as there were no signs of ecologically important taxa within
the wetland areas and none had been recorded within the area. The wetland did however,
provide a suitable habitat for birds and other faunal species.
The Hydrological Functionality of the wetland was determined to have a Moderate (C) level of
importance. The wetlands’ hydrology ensured that there was a constant water source within
the area. Furthermore, the flood attenuation and streamflow regulation offered by the wetlands
contributes to the protection of the local area from flooding and drought. The Direct Human
Benefits were calculated to have a Marginal (D) level of importance.
Table 14: The EIS results for the delineated wetland
Wetland Importance and Sensitivity
HGM 1
Ecological Importance & Sensitivity 1.8
Hydrological/Functional Importance 1.8
Direct Human Benefits 0.7

Water Resource Baseline & Impact Assessment Balfour WWTW Upgrade
www.thebiodiversitycompany.com
20
7.2 Aquatic Assessment
The aquatic assessment was conducted at points along the reach, from upstream to downstream
of the proposed Wastewater Treatment Works upgrade (Figure 11). A single reach was assessed
for the study. The sites were selected to effectively determine current state of the aquatic systems,
and to determine risks associated with the proposed upgrading of WWTW. Site photographs and
GPS coordinates are presented in Table 15.
Table 15: Photos, co-ordinates and descriptions for the sites sampled (July 2019)
Upstream Downstream
B1
GPS 26°38'56.48"S 28°34'56.02"E
B2
GPS 26°38'15.04"S 28°34'51.95"E
B3
GPS 26°37'59.50"S 28°34'19.29"E

Water Resource Baseline & Impact Assessment Balfour WWTW Upgrade
www.thebiodiversitycompany.com
21
Figure 11: Illustration of sampling points for the Balfour wastewater treatment works upgrade
7.2.1 In situ water quality
In situ water quality analysis was conducted during the study. Results have been compared to
limits stipulated in the Target Water Quality Range (TWQR) for aquatic ecosystems (DWS,
1996a). The results of the July 2019 assessment are presented in Table 16.
Table 16: In situ surface water quality results (July 2019)
Site pH Conductivity (µS/cm) DO (mg/l) Temperature (°C)
TWQR* 6.5-8.5** - >5.00* 5-30*
B1 7.13 373 10.2 6.7
B2 Dry
B3 6.98 1380 3.2 11.6
*TWQR – Target Water Quality Range; Levels exceeding guideline levels are indicated in red
In situ water quality at B1 indicated largely natural water quality conditions within the system
observed during the survey, reflected by all parameters falling within the TWQR. The pH ranged
from 7.13 at B1 upstream to 6.98 at B3 downstream. There was a significant increase in
Conductivity between upstream and downstream ranged from 373 µS/cm at B1 to 1380 µS/cm at
B3, which indicates an influx of contaminants into the system from the Balfour WWTW, as site B2
was dry. The dissolved oxygen at B3 would be considered as a limiting factor to sensitive local

Water Resource Baseline & Impact Assessment Balfour WWTW Upgrade
www.thebiodiversitycompany.com
22
aquatic biota. All temperatures of the sampled sites during the survey were within the expected
ranges for the region during the low flow survey.
In situ water quality results indicate a deterioration in water quality between the upstream and
downstream sites. Water quality within the downstream reach would be considered a limiting
factor to local aquatic biota.
7.2.2 Habitat Integrity Assessment
The IHIA was completed for the associated Suikerbosrant tributary as described in the IHIA
methodology component of this study, and the results thereof are shown in Table 17.
Table 17: Intermediate Habitat Integrity Assessment for the associated Suikerbosrant tributary
The results of the instream and riparian habitat assessment in the associated Suikerbosrant
tributary indicates seriously/critically modified state (class E/F). The modified state can be
attributed to the modification of riparian habitat due to channel modification, inundation, bank
erosion (Figure 12) and flow modification. Impacts to instream habitat includes flow and channel
Criterion Impact Score Weighted Score
Instream
Water abstraction 11 6.2
Flow modification 18 9.4
Bed modification 20 10.4
Channel modification 18 9.4
Water quality 21 11.8
Inundation 20 8.0
Exotic macrophytes 0 0.0
Exotic fauna 0 0.0
Solid waste disposal 21 5.0
Total Instream Score 39.9
Instream Category class E/F
Riparian
Indigenous vegetation removal 14 7.3
Exotic vegetation encroachment 15 7.2
Bank erosion 18 10.1
Channel modification 18 8.6
Water abstraction 11 5.7
Inundation 19 8.4
Flow modification 17 8.2
Water quality 21 10.9
Total Riparian Score 33.6
Riparian Category class E/F

Water Resource Baseline & Impact Assessment Balfour WWTW Upgrade
www.thebiodiversitycompany.com
23
modification through instream impoundments, extensive solid waste, strong odour due to raw
sewage ‘in the downstream reach, and inundation.
Figure 12: Photograph illustrating the railway crossing and livestock passing resulting in riparian and instream modification (July 2019)
7.2.3 Aquatic Macroinvertebrate Assessment
7.2.3.1 The Integrated Habitat Assessment System
The Integrated Habitat Assessment System (IHAS) index was developed by McMillan (1998) for
use in conjunction with the SASS5 protocol. The IHAS results are presented in Table 18
Table 18: IHAS score at each site during the July 2019 survey
Site B1 B2 B3
Score 60 DRY
42
Suitability Adequate Poor
Based on the IHAS results, habitat availability for aquatic macroinvertebrates was varied through
the tributary of the Suikerbosrant River. Upstream of the WWTW at B1 there was considered
adequate while downstream of the WWTW the habitat was poor. Habitat has a large influence on
the aquatic macroinvertebrates which inhabit a reach. Poor habitat limits the potential
macroinvertebrate diversity found in a system.

Water Resource Baseline & Impact Assessment Balfour WWTW Upgrade
www.thebiodiversitycompany.com
24
An indication of the available instream biotopes (habitat) sampled during the low flow survey are
presented in Table 19. Biological assessments were completed at representative site in the
considered river reach. The invertebrate habitat at the site was assessed using the South African
Scoring System version 5 (SASS5) biotope rating assessment as applied in Tate and Husted
(2015). The results of the biotope assessment are provided below (Table 19). A rating system of
0 to 5 was applied, 0 being not available. The weightings for lower foothills rivers (slope class E)
were used to categorize biotope ratings (Rowntree et al. 2000; Rowntree and Ziervogel, 1999).
Table 19: Biotope availability at the sites (Rating 0-5)
Biotope Weighting B1 B2 B3
Stones in current 18 3
DRY
1
Stones out of current 12 3 1
Bedrock 3 2 0
Aquatic Vegetation 1 3 2
Marginal Vegetation In Current 2 2 1
Marginal Vegetation Out Of Current 2 3 2
Gravel 4 3 2
Sand 2 1 2
Mud 1 1 2
Biotope Score 21 13
Weighted Biotope Score (%) 55 23
Biotope Category (Tate and Husted, 2015) C F
Moderate habitat availability was observed during the survey at B1. This is largely due to diversity
of presence of stones in and out of current, presence of marginal vegetation and availability of
gravel. There was a very poor habitat availability at site B3 categorized as class F (Tate and
Husted, 2015). This site had a very low biotope score that can be attributed to the limited diversity
of stones, and marginal vegetation in current biotopes. The B2 site was dry, no sampling was
conducted. The biotope results at B1 indicate that the habitat availability would not be a limiting
factor for the macroinvertebrate community, however, habitat diversity at site B3 was limited.
7.2.3.2 South African Scoring System
The aquatic macroinvertebrate results for the survey are presented in Table 20.
Table 20: Macroinvertebrate assessment results recorded during the survey (July 2019)
Site SASS Score No. of Taxa ASPT* Category
(Dallas, 2007)**
B1 39 10 3.9 E/F
B2 DRY
B3 14 4 3.5 E/F
*ASPT: Average score per taxon; **Highveld - Lower ecoregion

Water Resource Baseline & Impact Assessment Balfour WWTW Upgrade
www.thebiodiversitycompany.com
25
The SASS5 assessment results generated a SASS5 scores that ranged from 39 at B1 to 14 at
B3. The number of taxa sampled during the survey was found to vary from 10 at B1 to 4 at B3.
The average score per taxon (ASPT) indicated that tolerant macroinvertebrates assemblages
collected during this low flow survey were dominant. Including Chironomidae and Oligochaeta at
B1 that generated an ASPT score of 3.9. Therefore, classifying B1 as seriously/critically modified
(class E/F; Dallas, 2007). The ASPT of B3 was found to be 3.5, categorized as class E/F
(seriously/critically modified) according to the biological bands (Dallas,2007). Both sites (B1 and
B3) indicate the absence of key taxa and provide evidence for water quality deterioration within
the reach.
7.2.3.3 Macroinvertebrate Response Assessment Index
The Macroinvertebrate Response Assessment Index (MIRAI) methodology was conducted
according to Thirion, (2007). Data collected from the SASS5 method was applied to the MIRAI
model. The MIRAI model provides a habitat-based cause-and-effect foundation to interpret the
deviation of the aquatic invertebrate community (assemblage) from the reference condition
(unmodified river). Results for the reaches assessed are presented in Table 21. The results
indicate that modifications to water quality and habitat drivers are the dominant factors driving
modifications to the macroinvertebrate communities, further, flow modifications contribute to biotic
integrity deterioration.
Table 21: MIRAI Score for the Suikerbosrant reach (2019)
Invertebrate Metric Group Score
Flow Modifications 32.0
Habitat 25.0
Water Quality 22.5
Ecological Score 26.5
Category E
7.3 Present Ecological State
The Present Ecological State of the reach assessed for the study is presented in Table 22. The
findings of the study were based on a single survey, of which time constraints limit sampling effort
within the reaches, and therefore the confidence of the findings are low.
Table 22: The Present Ecological Status of the Suikerbosrant reach
Category Score Ecological Category
Riparian 33.6 E/F
Macroinvertebrate 26.5 E/F
EcoStatus E/F

Water Resource Baseline & Impact Assessment Balfour WWTW Upgrade
www.thebiodiversitycompany.com
26
8 Risk Assessment
The construction of infrastructure in proximity to a watercourse creates potential for negative
effects to downstream waterbodies. In this case the WWTW which is being upgraded was
constructed within a historic wetland, with its outlet in a tributary of the Suikerbosrant. Soluble
construction materials have the potential to dissolve in runoff of the area. This can result in the
increase of dissolved solids in downstream waterbodies resulting in a water quality impact.
Further to this, suspended materials emanating from the construction area may alter the physical
water parameters and result in the sedimentation of downstream areas which will have negative
effects to local aquatic ecology. This impact will only occur during the construction phase and it
is anticipated that no further impacts can be anticipated beyond the construction phase.
Figure 13 presents photographs of sewerage stemming from the exiting facility being diverted into
the landscape. It was apparent from the site assessment that measures have been taken to divert
this sewerage away from the facility into the watercourse. Evidence of sewerage was also present
in the dam that has been breached. Based on this, the upgrade of the facility is necessary and
urgent.
Figure 13: Photographs of untreated (or partially) treated sewerage being diverted into the land scape
The current plant is functioning under capacity which results in raw sewage being released into
the receiving environment. The release of treated water will increase the overall water quality of

Water Resource Baseline & Impact Assessment Balfour WWTW Upgrade
www.thebiodiversitycompany.com
27
the surrounding systems as all effluent can be treated. The upgrade does however signify a larger
capacity for effluent with will result in a larger discharge into the receiving watercourses resulting
in the physical change in velocity flow classes downstream of the discharge point. This direct
modification to flows will have an impact on the hydrology, geomorphology and vegetation of the
channel. Activities that would form part of the project include the following:
Construction Phase
• Clearance of vegetation;
• Earthworks – excavations, levelling, soil movement etc.;
• Installation of water supply pipelines, electrical cables;
• Storm water management;
• Building – construction of infrastructure; and
• Existing discharge of untreated (or partially) treated effluent.
Operational Phase
• Treated water discharge (improved water quality);
• Flow modification within the channel;
• Erosion casing incised banks of the channel;
• Habitat modification resulting in differential biota assemblages colonising the system; and
• Altered landscape (visual).
The impact assessment considered both direct and indirect impacts, if any, to the water
resources. The mitigation hierarchy as discussed by the Department of Environmental Affairs
(2013) will be considered for this component of the study (Figure 14). In accordance with the
mitigation hierarchy, the preferred mitigatory measure is to avoid impacts by considering options
in project location, sitting, scale, layout, technology and phasing to avoid impacts. Findings from
the DWS aspect and impact register / risk assessment are provided in Table 23,Table 24 and
Table 25. The points of direct impact or risk are presented in Figure 14.

Water Resource Baseline & Impact Assessment Balfour WWTW Upgrade
www.thebiodiversitycompany.com
28
Figure 14: The mitigation hierarchy as described by the DEA (2013)
Table 23: Potential impacts associated with the WWTW upgrade
Christian Fry Pr. Sci. Nat. 119082
Activity Aspect Impacts
Construction and upgrade of WWTW
• Site clearing and preparation
• Excavation of foundations and erection of buildings/infrastructure.
• Delivery of building material (heavy vehicles)
• Soil stockpile management
• Operation of machinery and vehicles within watercourse area
• Final landscaping and shaping
• Post-construction rehabilitation
• Diversion of effluent
• Increase in sediment inputs & turbidity
• Vegetation removal
• Alteration to flow volumes (underlying wetland)
• Alteration of patterns of flows (increased flood peaks)
• Increase in sediment inputs & turbidity
• Inputs of toxic organic contaminants
• Alteration of acidity (pH)
Operation of WWTW
• Alteration of in channel flows
• Alteration of surface drainage and runoff
• Establishment of alien plants on disturbed areas
• Solid waste disposal
• Discharge of treated water
• Human disturbance in wetland areas
• Conducting routine maintenance
• Alteration to flow volumes
• Alteration of patterns of flows (increased flood peaks)
• Increase in sediment inputs & turbidity
• Inputs of toxic heavy metal contaminants
• Alteration of acidity (pH)
• Inputs of toxic organic contaminants
• Altered flow dynamics.
• Physico-chemical modifications.
• Disturbance of interflow of water.
• Loss of aquatic habitat.
• Erosion of watercourse.
• Flow sediment equilibrium change.

Water Resource Baseline & Impact Assessment Balfour WWTW Upgrade
www.thebiodiversitycompany.com
29
Table 24: DWS Risk Impact Matrix for the proposed project
Aspect Flow
Regime Water
Quality Habitat Biota Severity
Spatial scale
Duration Consequence
Construction Phase
Site clearing and preparation 2 2 3 1 2 2 2 6
Excavation of foundations and erection of buildings/infrastructure 4 3 3 1 2.75 2 2 6.75
Delivery of building material (heavy vehicles) 2 2 2 1 1.75 2 2 5.75
Soil stockpile management 2 2 2 1 1.75 2 2 5.75
Operation of machinery and vehicles within watercourse area 4 3 3 1 2.75 2 2 6.75
Final landscaping and shaping 2 2 3 1 2 2 2 6
Post-construction rehabilitation 2 2 3 1 2 2 2 6
Operational Phase
Alteration of in-channel flows 4 2 3 3 3 3 4 10
Alteration of surface drainage and runoff 4 2 3 2 2.75 2 5 9.75
Establishment of alien plants on disturbed areas 2 2 3 3 2.5 2 4 8.5
Solid waste disposal 1 3 2 3 2.25 2 4 8.25
Discharge of treated water (Increased organic pollutants) 1 3 2 3 2.25 3 4 9.25
Human disturbance in wetland areas 1 3 2 3 2.25 2 4 8.25
Conducting routine maintenance 1 2 2 1 1.5 2 4 7.5

Water Resource Baseline & Impact Assessment Balfour WWTW Upgrade
www.thebiodiversitycompany.com
30
Table 25: DWS Risk Impact Matrix for the proposed project continued
Aspect Frequency of activity
Frequency of impact
Legal Issues
Detection Likelihoo
d Sig.
Without Mitigation
With Mitigation
Construction Phase
Site clearing and preparation 1 2 1 1 5 30 Low Low
Excavation of foundations 1 2 1 2 6 40.5 Low Low
Delivery of building material (heavy vehicles) 1 1 1 1 4 23 Low Low
Soil stockpile management 1 1 1 1 4 23 Low Low
Operation of machinery and vehicles within watercourse area 1 2 1 1 5 33.75 Low Low
Final landscaping and shaping 1 2 1 1 5 30 Low Low
Post-construction rehabilitation 1 1 1 1 4 24 Low Low
Operational Phase
Alteration of in-channel flows 5 4 5 2 16 160 Moderate Moderate
Alteration of surface drainage and runoff 5 2 1 3 11 107,25 Moderate Low
Establishment of alien plants on disturbed areas 3 2 1 3 9 76.5 Moderate* Low
Solid waste disposal 2 2 1 2 7 54.25 Low Low
Discharge of treated water (Increased organic pollutants) 5 3 5 4 17 157.25 Moderate Moderate
Human disturbance in wetland areas 2 2 1 2 7 54.25 Low Low
Conducting routine maintenance 2 1 1 3 7 52.5 Low Low
( * ) denotes - In accordance with General Notice 509 “Risk is determined after considering all listed control / mitigation measures. Borderline Low / Moderate risk scores can
be manually adapted downwards up to a maximum of 25 points (from a score of 80) subject to listing of additional mitigation measures detailed below.”

Water Resource Baseline & Impact Assessment Balfour WWTW Upgrade
www.thebiodiversitycompany.com
31
The construction phase of the project identifies no risks to be of moderate significance. This
is largely attributed to the fact that the upgrade will only be conducted within the extent of the
existing facility, with no direct risks posed to the local water resources. The aspects considered
for the construction phase pose an indirect risk to the systems, specifically considering the
position of the WWTW (upslope) of the resource and the proximity to the system. These
indirect risks are unavoidable however are short term and can be further mitigated.
As the physical upgrade of the existing network and facilities occurs there would typically be
sewerage leakages and spillages which could prove detrimental to the health of the water
resource, it is the specialist’s opinion that leakages are unlikely to occur if the responsible
party takes appropriate precautionary measures. The proposed upgrade of the WWTW should
eliminates any current outflows of raw sewage as experienced on site due to the increased
capacity which should in turn improve the systems water quality. This is only identified at a
moderate risk due to the current state where raw effluence is leaving the WWTW and there is
potential for this to continue or occur if there are malfunctions, leaks, spillages etc.
In the operational phase of the Balfour WWTW there are two notable risks identified as of
moderate risk which cannot be reduced to a low risk, despite the prescription of mitigation
measures. The identified concerns are: Alteration of in-channel flows and the discharge of
treated water. For the purposes of this risk assessment, only upgrades within the facility have
been considered, and not the associated infrastructure. The first three risks are all as a result
of the increase of flow within the system which has the potential to change the geomorphology
of the catchment area. The establishment of alien vegetation can be managed with mitigation
measure to be considered a low risk.
In accordance with the GA in terms of section 39 of the NWA, for water uses as defined in
section 21 (c) or section 21 (i) a GA does not apply “to any water use in terms of section 21
(c) or (i) of the Act associated with the construction, installation or maintenance of any sewer
pipelines, pipelines carrying hazardous materials and to raw water and waste water treatment
works”. Owing to the fact that this project is for the upgrade of a sewer network that does
contain hazardous material, a General Authorisation would not be permissible for the project
and a full water use licence will be required.
8.1 Mitigation measures
The mitigation measures for the project include the following:
8.1.1 General Mitigation
• The upgrade of the facility must be within the existing facility only, gaining access from
the existing point of entry along the provincial dirt road;
• The contractors used for the construction should have spill kits available prior to
construction to ensure that any fuel, oil or hazardous substance spills are cleaned-up
and discarded correctly;
• The construction activities, laydown yards, camps or dumping of construction material
are to be restricted to within the existing facility;
• It is preferable that construction takes place during the dry season (as much as
possible) to reduce the erosion potential of the exposed surfaces;

Water Resource Baseline & Impact Assessment Balfour WWTW Upgrade
www.thebiodiversitycompany.com
32
• During construction activities, all rubble generated must be removed from the site and
not dumped in the instream, nor within the wetland habitats;
• Contamination of the watercourse with unset cement or cement powder should be
negated as it is detrimental to aquatic biota. It is preferable that on-site mixing is
avoided and that prefabricated materials be prioritised (where feasible);
• Temporary stormwater management systems must be in place and preferential runoff
channels be filled with aggregate and/or logs (branches included) to dissipate flows,
limiting erosion and sedimentation;
• All contractors and employees should undergo induction which is to include a
component of environmental awareness. The induction is to include aspects such as
the need to avoid littering, the reporting and cleaning of spills and leaks and general
good “housekeeping”;
• Have action plans on site, and training for contactors and employees in the event of
spills, leaks and other impacts to the aquatic systems;
• All stockpiles must be protected from erosion, stored on flat areas where run-off will be
minimised, and be surrounded by bunds;
• Any exposed earth should be rehabilitated promptly by planting suitable vegetation
(vigorous indigenous grasses) to protect the exposed soil; and
• All waste generated on-site during construction must be adequately managed.
Separation and recycling of different waste materials should be supported.
8.1.2 Operation of Heavy Machinery
• Machinery (small trucks and other vehicles) required for the proposed activities should
only be allowed to use existing roads (including dirt roads); and
• Machinery is permitted within the extent of the WWTW facility, but not beyond this
facility where existing roads are not available.
8.1.3 Physical Maintenance
• In order to avoid leakages during the upgrade, all systems under interrogation must be
blocked off and pumped clean to ensure that no raw sewage leaks from the system;
• The diversion and discharge of untreated (or partially) treated effluent into the
landscape must be stopped, and treated prior to the release; and
• The areas contaminated with effluent must be cleaned, this will require the expertise
of a soil contamination specialist.
8.1.4 Increased Runoff mitigation
• A suitable stormwater management plan must be compiled for the development. This
plan must attempt to displace and divert stormwater from the facility and discharge the
water into adjacent areas without eroding the receiving areas. It is preferable that run-

Water Resource Baseline & Impact Assessment Balfour WWTW Upgrade
www.thebiodiversitycompany.com
33
off velocities be reduced with energy dissipaters and flows discharged into the local
watercourses;
• Stormwater infrastructure should be maintained regularly;
• Energy dissipation methods should be used at the outflow point of the WWTW. This
point source has high erosive power and needs to be controlled. It is suggested that
gabion baskets are installed as well as water cushions or spillways downstream; and
• Encouraged indigenous vegetation growth within the disturbed area to assist in bank
stability and minimise erosion.
8.2 Recommendations
The following recommendations are proposed for the upgrade of the WWTW:
• The existing plant and equipment be brought up to full operational capacity;
• Emergency overflow to be constructed to convey excess flows to the temporary
storage pond;
• An alien vegetation control and eradication plan must be compiled and implemented
for the areas adjacent to the facility, prioritise the delineated wetland areas;
• Water quality and biomonitoring be conducted for the facility, with biomonitoring to be
conducted on a bi-annual basis. Water quality monitoring, consisting of a single
upstream and downstream site should be conducted on a monthly basis.
9 Conclusion
Wetlands
Two (2) HGM units were identified and delineated within the project area. These HGM types
include a channelled valley bottom wetland and a dammed depression. The dam is considered
to be an artificial system and as a result of this, an ecological assessment was only completed
for the (natural) channelled valley bottom wetland system.
The ecological status of the system was determined to be that of Moderately Modified (C)
system. The Ecological Importance & Sensitivity was calculated to have a Moderate (C) level
of importance. The Hydrological Functionality of the wetland was determined to have a
Moderate (C) level of importance. The wetlands’ hydrology ensured that there was a constant
water source within the area. The Direct Human Benefits were calculated to have a Marginal
(D) level of importance.
Aquatics
The current state of the tributary associated Suikerbosrant reach associated with the proposed
Balfour wastewater treatment works upgrade was found to be in a seriously/critically modified
state. This was predominantly due to a culmination of water quality, habitat, and flow
modifications within the reach. Instream and riparian habitat modifications were predominantly
due to extensive solid waste disposal, indigenous vegetation clearing and alien vegetation
encroachment and bank erosion within the system. According to in situ water quality analysis
the system was found to be natural upstream of the wastewater treatment works and poor
water quality downstream of the wastewater treatment works due to sewage disposal

Water Resource Baseline & Impact Assessment Balfour WWTW Upgrade
www.thebiodiversitycompany.com
34
decreasing dissolved oxygen in water and conductivity. The condition of the local aquatic
macroinvertebrates within the system was rated as seriously/critically modified according to
the biological bands and MIRAI findings. These findings do not align with the desktop
assessment, which indicated the PES was classed D (largely modified), moderate ecological
importance and sensitivity, and the recommended ecological category is class C. The
proposed Balfour wastewater treatment works upgrade may provide opportunities to improve
the current impacts on the system by good maintenance of the wastewater treatment works,
as the results indicate that raw sewage is currently being released into the system and
discouraging people that dispose solid waste into the system.
Risk Assessment
The proposed activity includes the upgrade of the Balfour WWTW to increase its capacity to
manage effluent discharge. Impacts were assessed in terms of the construction and
operational phases of the plant, assuming upgrades are within the extent of the existing facility
only.
Risks associated with the project ranged from low to moderate. Some of the moderate risks
could be mitigated to a low level of risk. Some risks could not be adequately mitigated to
reduce the level of risk from a moderate to a low level of risk. Low risks are expected for the
construction phase of the project, with low and moderate risks expected for the operational
phase of the facility. Moderate risks (post mitigation) are associated with the altered flows
within the system due to discharge, and the resulting alterations to water quality due to the
input of treated effluent.
In accordance with the GA in terms of section 39 of the NWA, for water uses as defined in
section 21 (c) or section 21 (i) a GA does not apply “to any water use in terms of section 21
(c) or (i) of the Act associated with the construction, installation or maintenance of any sewer
pipelines, pipelines carrying hazardous materials and to raw water and waste water treatment
works”. Owing to the fact that this project is for the upgrade of a sewer network that does
contain hazardous material, a General Authorisation would not be permissible for the project
and a full water use licence will be required
Professional Opinion
It is the specialist’s opinion that while there are moderate risks, no fatal flaws were identified
for the proposed activities, and that the WWTW upgrade should proceed.

Water Resource Baseline & Impact Assessment Balfour WWTW Upgrade
www.thebiodiversitycompany.com
35
10 References
Barbour, M.T., Gerritsen, J. & White, J.S. 1996. Development of a stream condition index
(SCI) for Florida. Prepared for Florida Department of Environmental Protection: Tallahassee,
Florida.
Dallas, H.F. 1997. A preliminary evaluation of aspects of SASS (South African Scoring
System) or the rapid bioassessment of water in rivers with particular reference to the
incorporation of SASS in a national biomonitoring programme. South African Journal of
Aquatic Science, 23: 79-94.
Dallas, H.F. 2007. River Health Programme: South African Scoring System (SASS) Data
Interpretation Guidelines. Report produced for the Department of Water Affairs and Forestry
(Resource Quality Services) and the Institute of Natural Resources.
Department of Water and Sanitation (DWS). 1996. South African Water Quality Guidelines.
Volume 7: Aquatic Ecosystems. Department of Water Affairs and Forestry, Pretoria.
Department of Water Affairs and Forestry (DWAF). 2005. A Practical Field Procedure for
Identification and Delineation of Wetlands and Riparian Areas.
Department of Water and Sanitation (DWS). 2005. River Ecoclassification: Manual for
Ecostatus Determination. First Draft for Training Purposes. Department of Water Affairs and
Forestry.
Department of Water and Sanitation (DWS). 2018. A Desktop Assessment of the Present
Ecological State, Ecological Importance and Ecological Sensitivity per Sub Quaternary
Reaches for Secondary Catchments in South Africa. Draft. Compiled by RQS-RDM.
Dickens, C. W. S. and Graham, P.M. 2002. The South African Scoring System (SASS) Version
5: Rapid bioassessment method for rivers. African Journal of Aquatic Science. 27 (1): 1 -10.
Gerber, A. & Gabriel, M.J.M. 2002. Aquatic Invertebrates of South African Rivers Field Guide.
Institute for Water Quality Studies. Department of Water Affairs and Forestry. 150pp
Hellawell, J.M. 1977. Biological Surveillance and Water Quality Monitoring. In: JS Alabaster
(Ed). Biological monitoring of inland fisheries. Applied Science, London. Pp 69-88.
International Union for Conservation of Nature and Natural Resources (IUCN). 2018. Red list
of threatened species - 2017.1. www.iucnredlist.org. Accessed 20th May 2017
Kleynhans, CJ. 1996. A qualitative procedure for the assessment of the habitat integrity status
of the Luvuvhu River (Limpopo System, South Africa) Journal of Aquatic Ecosystem Health
5:41-54.
Kotze, D.C., Marneweck, G.C., Batchelor, A.L., Lindley, D.C., and Collins, N.B. 2009. A
Technique for rapidly assessing ecosystem services supplied by wetlands. Mondi Wetland
Project.
Macfarlane, D.M., Kotze, D.C., Ellery, W.N., Walters, D., Koopman, V., Goodman, P. and
Goge, C. 2007. A technique for rapidly assessing wetland health: WET-Health. WRC Report
TT 340/08.

Water Resource Baseline & Impact Assessment Balfour WWTW Upgrade
www.thebiodiversitycompany.com
36
Macfarlane, D.M., Bredin, I.P., Adams, J.B., Zungu, M.M., Bate, G.C. and Dickens, C.W.S.
2014. Preliminary guideline for the determination of buffer zones for rivers, wetlands and
estuaries. Final Consolidated Report. WRC Report No TT 610/14, Water Research
Commission, Pretoria.
McMillan, P.H. 1998. An Invertebrate Habitat Assessment System (IHASv2), for the Rapid
Biological Assessment of Rivers and Streams. A CSIR research project, number ENV – P-I
98132 for the Water Resource Management Program, CSIR. Ii + 44p.
Nel JL, Murray KM, Maherry AM, Petersen CP, Roux DJ, Driver A, Hill L, Van Deventer H,
Funke N, Swartz ER, Smith-Adao LB, Mbona N, Downsborough L and Nienaber S. 2011.
Technical Report for the National Freshwater Ecosystem Priority Areas project. WRC Report
No. K5/1801.
Ollis DJ, Snaddon CD, Job NM, and Mbona N. 2013. Classification System for Wetlands and
other Aquatic Ecosystems in South Africa. User Manual: Inland Systems. SANBI Biodiversity
Series 22. South African Biodiversity Institute, Pretoria.
Plafkin, J.L., Barbour, M.T., Porter, K.D., Gross S.K., Hughes, R.M., 1989. Rapid Bio-
assessment protocols for use in streams and rivers: benthic macroinvertebrates and fish. U.S.
Environmental Protection Agency.
South African National Biodiversity Institute (SANBI). 2009. Further Development of a
Proposed National Wetland Classification System for South Africa. Primary Project Report.
Prepared by the Freshwater Consulting Group (FCG) for the South African National
Biodiversity Institute (SANBI).
Skelton, P.H. 2001. A complete guide to the freshwater fishes of southern Africa. Struik
Publishers, South Africa.
Thirion, C.A., Mocke, A. & Woest, R. 1995. Biological monitoring of streams and rivers using
SASS4. A User’s Manual. Internal Report No. N 000/00REQ/1195. Institute for Water Quality
Studies. Department of Water Affairs and Forestry. 46