water supply and demand in california - … 032_version1.pdf1 | w a t e r s u p p l y by stephanie...
TRANSCRIPT

1 | W a t e r S u p p l y
By Stephanie Anagnoson College of the Canyons 2018
Version 1
Photo By Jani Brumat
Water Supply
and Demand in California
By Stephanie Anagnoson College of the Canyons 2017
Version 1 Photo by Nathan Roser on Unsplash
2 | W a t e r S u p p l y
Attributions
Castaic Lake Water Agency
College of the Canyons
College of the Canyons - Water Systems Technology
College of the Canyons - Open Educational Resources
This textbook is licensed under CC BY 4.0

3 | W a t e r S u p p l y
Table of Contents
Introduction to Water Supply 4
Part One: Water All Around Us 5 Section 1.1 Water Cycle 6 Section 1.2 Water Management Concepts 10 Section 1.3 Water Rights 16 Section 1.4 Stakeholder Concepts 20
Part Two: Supply-Side Management 24 Section 2.1 Los Angeles Aqueduct 26 Section 2.2 Central Valley Project 29 Section 2.3 Colorado River Aqueduct 33 Section 2.4 State Water Project 37 Section 2.5 Alternative Water Supplies 41
Part Three: Demand-Side Management 49 Section 3.1 Regulations 50 Section 3.2 Water Loss 55 Section 3.3 Water Rates 58 Section 3.4 Indoor Water Use 61 Section 3.5 Outdoor Water Use 66 Section 3.6 CII Water Use 72 Section 3.7 Social Marketing Campaigns 77

4 | W a t e r S u p p l y
Introduction to Water Supply
You’re about to understand water demand and water supply more deeply. This understanding
is going to change how you look at your water bill, grass in your yard and around town, and all
those canals you see while driving around in California.
Understanding the connection between demand and supply is critical to anyone working in the
water industry today. Water demand is our need and use of water. Water supply refers to our
sources of water.
This textbook has three primary parts.
In Part One, you will learn
foundational concepts in water
supply, including the water cycle,
water management concepts,
water rights and stakeholder
concepts.
In Part Two, you will apply what you learned in Part One to
water development projects and supply side management
including the Los Angeles Aqueduct, Central Valley Project,
Colorado River Aqueduct and State Water Project. There are
voluminous books written on each of these projects, so you
will not learn everything about each project here, but rather
key details that characterize each project’s purpose,
stakeholders, development, and future. You will also explore
alternative water supplies, including desalination.
In Part Three, you will learn about demand
management, which includes using legislation and
regulatory tools, water rates, and conservation programs
to manage water use. Rather than simply understanding
demand management as conservation program-based,
you will learn that there are powerful ways, sometimes
far more useful at times than conservation programs, to
decrease demand in the long-term.
Photo used with permission of Castaic Lake Water Agency
Photo used with permission of Castaic Lake Water Agency
Photo by the U.S. Bureau of Reclamation is in the public domain
5 | W a t e r S u p p l y
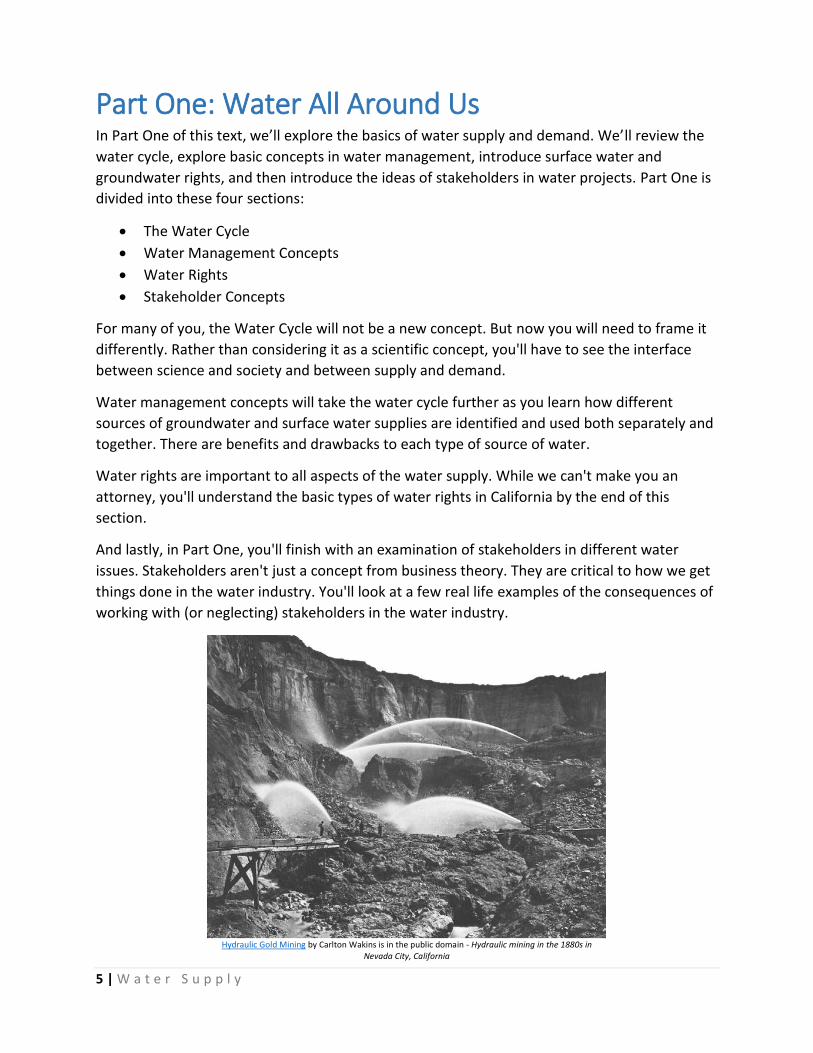
Part One: Water All Around Us In Part One of this text, we’ll explore the basics of water supply and demand. We’ll review the
water cycle, explore basic concepts in water management, introduce surface water and
groundwater rights, and then introduce the ideas of stakeholders in water projects. Part One is
divided into these four sections:
The Water Cycle
Water Management Concepts
Water Rights
Stakeholder Concepts
For many of you, the Water Cycle will not be a new concept. But now you will need to frame it
differently. Rather than considering it as a scientific concept, you'll have to see the interface
between science and society and between supply and demand.
Water management concepts will take the water cycle further as you learn how different
sources of groundwater and surface water supplies are identified and used both separately and
together. There are benefits and drawbacks to each type of source of water.
Water rights are important to all aspects of the water supply. While we can't make you an
attorney, you'll understand the basic types of water rights in California by the end of this
section.
And lastly, in Part One, you'll finish with an examination of stakeholders in different water
issues. Stakeholders aren't just a concept from business theory. They are critical to how we get
things done in the water industry. You'll look at a few real life examples of the consequences of
working with (or neglecting) stakeholders in the water industry.
Hydraulic Gold Mining by Carlton Wakins is in the public domain - Hydraulic mining in the 1880s in Nevada City, California

6 | W a t e r S u p p l y
Section 1.1 Water Cycle In this section, we’ll dive deeper into the water cycle in terms of how it affects water supply.
After reading this section, you should be able to:
identify processes in the water cycle that influence the water supply;
analyze situations in terms of precipitation, condensation, evaporation and
transpiration; and
Evaluate yearly data for evapotranspiration.
You've probably heard on the news the statewide water supply in California described in terms
of snowpack and rainfall. These are critical measures of how much water is available for human
use. Water managers in California follow both snowpack measurements and rainfall
measurements closely. In the diagram above from the United States Geological Survey
(U.S.G.S.), you can see that precipitation is shown as rainfall and snow.
Precipitation also includes something you don’t see too often in California: hail and sleet. All
forms of water that fall from the sky, including rain, snow, hail and sleet, are forms of
precipitation. Rainfall can provide much needed water in the ground by the process of
infiltration, the process by which water seeps into the ground and eventually recharges our
groundwater, water stored in the ground. Using the diagram above, you can also trace the flow
of groundwater in some cases to both rivers, lakes, and even to the ocean.
Above ground, rainfall can also be stored on earth’s surface in lakes. Precipitation in California
also provides snow for snowpack, which can be our largest area of storage of water in the
winter. In fact, it is common for water managers to view the snowpack in the Sierra as a
The Water Cycle by John Evans and Howard Perlman is in the public domain
7 | W a t e r S u p p l y
reservoir; it is simply a seasonal reservoir that melts in the spring. Snowmelt runoff from the
snowpack can fill streams and lakes. Runoff from rainfall is also captured in streams and lakes
and can serve to recharge aquifers through percolation and infiltration.
The diagram also shows the key process of evaporation, or the process through which liquid
water turns into a gas. Evaporation occurs over bodies of water like the ocean or lakes, but also
over the land. If you own a home with a pool, you have probably noticed that if you leave the
pool without a cover in the summer, you have to add water more often in the summer than in
the winter. This is because the rate of evaporation is higher in the summer than the winter,
often dramatically so.
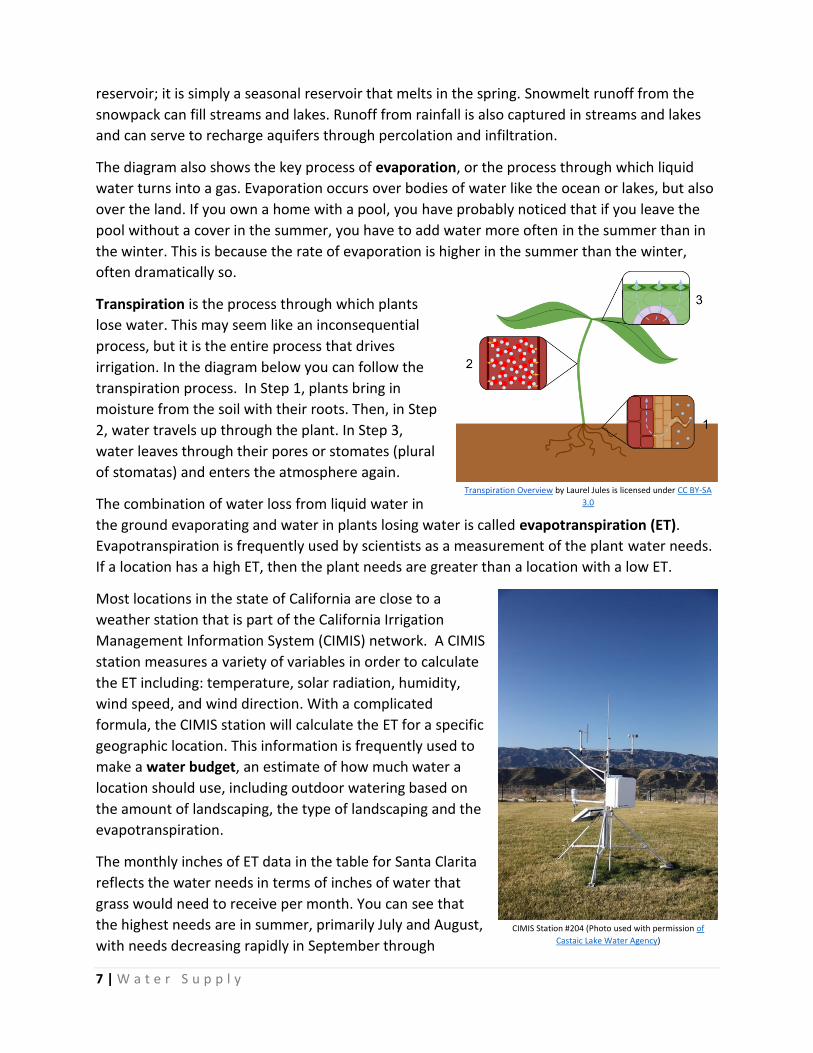
Transpiration is the process through which plants
lose water. This may seem like an inconsequential
process, but it is the entire process that drives
irrigation. In the diagram below you can follow the
transpiration process. In Step 1, plants bring in
moisture from the soil with their roots. Then, in Step
2, water travels up through the plant. In Step 3,
water leaves through their pores or stomates (plural
of stomatas) and enters the atmosphere again.
The combination of water loss from liquid water in
the ground evaporating and water in plants losing water is called evapotranspiration (ET).
Evapotranspiration is frequently used by scientists as a measurement of the plant water needs.
If a location has a high ET, then the plant needs are greater than a location with a low ET.
Most locations in the state of California are close to a
weather station that is part of the California Irrigation
Management Information System (CIMIS) network. A CIMIS
station measures a variety of variables in order to calculate
the ET including: temperature, solar radiation, humidity,
wind speed, and wind direction. With a complicated
formula, the CIMIS station will calculate the ET for a specific
geographic location. This information is frequently used to
make a water budget, an estimate of how much water a
location should use, including outdoor watering based on
the amount of landscaping, the type of landscaping and the
evapotranspiration.
The monthly inches of ET data in the table for Santa Clarita
reflects the water needs in terms of inches of water that
grass would need to receive per month. You can see that
the highest needs are in summer, primarily July and August,
with needs decreasing rapidly in September through CIMIS Station #204 (Photo used with permission of
Castaic Lake Water Agency)
Transpiration Overview by Laurel Jules is licensed under CC BY-SA
3.0

8 | W a t e r S u p p l y
December. Even though September is typically almost as hot as August, the days are shorter
and the sun is less intense so the evapotranspiration is less in September than August. This
means the plant needs for irrigation are significantly less.
CIMIS Station #204 Santa Clarita - 2016 Evapotranspiration Data
Months Jan Feb Mar Apr May Jun Jul Aug Sep Oct Nov Dec Monthly ET (in) 1.97 4.80 4.51 5.24 5.77 7.77 8.99 8.13 6.30 4.68 3.40 2.69
1
Knowledge of evapotranspiration has a practical application - in Southern California, many
people find they can turn off their irrigation systems for grass in normal years from November
through February and that their plants’ water needs will be met with rainfall alone.
The opposite process of evaporation is condensation, the process through which water as a gas
turns into liquid water again. Condensation is the process through which clouds form. This is
also the process through which water beads on the outside of a glass of iced tea on a humid day
or on a mirror in a steamy bathroom. In terms of the water supply picture, condensation is the
key process that can lead to precipitation, so clouds are carefully monitored by scientists.
What makes the water cycle work? In short, gravity and the sun. Notice that there is always
groundwater flow and streamflow from a higher altitude to a lower altitude. Gravity drives this
flow of water in the water cycle, and is also a key force in most water distribution systems. If
you’re not using gravity, you’re going to need a pump to go from a lower elevation to a higher
elevation. Systems are generally designed to avoid pumps if possible and use the force of
gravity. The sun drives the water cycle in a different way, by heating the water and causing it to
evaporate. It also melts the snowpack in the mountains while gravity causes the water to flow
into streams, rivers and lakes.
In Section 1.1, you've learned the basic processes in the water cycle: precipitation, infiltration,
evaporation, transpiration, and condensation. Next, you'll see how these processes create
surface and groundwater supplies and how these supplies are used for water management.
Try It!
Describe a process at work in each scenario and how the process works:
1. Analyze the effect on the water cycle if California had no precipitation for a year.
2. You hang a wet swimsuit out on the balcony to dry overnight. What process is at work?
How is water changing states?
1 California Irrigation Management Information System, www.cimis.water.ca.gov, monthly 2016 report for station #204 retrieved on 5/7/17

9 | W a t e r S u p p l y
3. Using the CIMIS web site (http://www.cimis.water.ca.gov/), register for an account
(free). Then under the Data tab, find the nearest CIMIS station to your home create a
monthly web report for 12 consecutive months, which should include ET. When should
you water the most? When should you water the least?
Key Terms
condensation – the process through which water as a gas turns into liquid water again;
opposite of evaporation
evaporation – the process through which liquid water turns into a gas; opposite of
condensation
evapotranspiration - The combination of water loss from liquid water in the ground
evaporating and water in plants losing water
groundwater – water stored in the ground
infiltration – the process through which water seeps into the ground
precipitation – All forms of water that fall from the sky, including rain, snow, hail and sleet
transpiration – the process through which plants lose water
water budget – an estimate of how much water a location should use, including outdoor
watering based on the amount of landscaping, the type of landscaping and the
evapotranspiration

10 | W a t e r S u p p l y
Section 1.2 Water Management Concepts Let's engage in a little thought experiment.
If a zombie apocalypse happened right now and you ran for the hills, you would have to find
water to survive. How would you go about doing this? In this section, you’ll identify sources of
water supply. This section is critical to an understanding of water management, both personally
as well as regionally and statewide. After reading this section, you should be able to:
describe various sources of surface and groundwater supply;
give examples of water storage; and
evaluate a situation in terms of conjunctive use.
Now back to the zombie apocalypse. If you had to find water, you would probably:
1. try to find a stream or lake; or/and
2. start digging a well
Notice that you didn’t start with the ocean. This is important because most of us intuitively
understand the amount of energy it takes to make ocean water drinkable. Although most of the
water on earth is in the oceans, bays, and seas, it’s not drinkable without expensive treatment.
Who would have time for that level of treatment in the zombie apocalypse? And you also didn’t
start with the ice caps (too far and too many zombies in the way). What you have intuitively
chosen is the right solution—surface water and groundwater. And your strategy reveals
another challenge for water managers—most of the water on earth is not accessible or easily
potable (drinkable).
Most of the water on earth is
in the ocean (97%). For the 3%
that remains as fresh water,
most of it is trapped in glaciers
and ice caps (68.7%). That
leaves only groundwater and
surface water making up less
than 1% of the water on earth.
You can see why people refer
to water as precious! In fact,
20% of all freshwater on earth
is in one enormous lake in
Russia, Lake Baikal, which is
inaccessible to most of us on
earth.
Surface water can be broken into different types, but it is easiest to think of surface water as
either bodies of water and flowing water. Surface water can occur as a lake or pond, both
Distribution of Earth's Water by the U.S. Geological Survey is in the public domain

11 | W a t e r S u p p l y
bodies of water at low places in the land where water has accumulated. Most lakes have both
inflow and outflow. Some lakes lack inflow and/or outflow and they become salty over time
(e.g., Great Salt Lake, Dead Sea, Salton Sea). A reservoir is a lake that is manmade by making a
dam across a river.
Surface water can be flowing water, such as a creek, stream, or river. It can also be water
stored in a lake or reservoir. People tend to use the terms creek, stream or river
interchangeably. Rivers (or streams or creeks) form when water moves from higher ground to
lower ground. You’ll remember that in the water cycle, gravity is a driving force—all water
flows downhill. When water falls from the sky as rain in the water cycle, it may infiltrate into
the ground, but it also may runoff and form creeks and streams. Eventually, creeks and streams
flow together and form rivers and rivers eventually meet the oceans.
As a source of water, surface water has both benefits and drawbacks.
Benefits of Surface Water Drawbacks of Surface Water
Easy to access Water is lost to evaporation.
Lakes and reservoirs can provide flood control in addition to a water supply.
Lakes and reservoirs may experience a build-up of sediment, especially after fires.2
Distribution requires a network of pipes and/or canals.
Well, nothing is perfect in the study of water supply. If surface water isn’t the perfect supply,
perhaps groundwater is better. In the diagram below, you can see both surface water and
groundwater. The water table is the line at which soil becomes saturated with water. The soil
above the water table is unsaturated and the water below the water table is saturated.
Groundwater is stored in aquifers, which are areas underground of soil or rock that can hold
and transmit water beneath the water table.
2 County of Santa Barbara, Santa Barbara Grand Jury Report, Lake Cachuma - Protecting a Valuable Resource, 2014-2015
Chart of soil layers and water by the U.S. Geological Survey is in the public domain
12 | W a t e r S u p p l y
Misconception Alert! Frequently, people will describe an aquifer as an underground swimming pool. While this does illustrate the idea that water is stored underground, it is really misleading. A swimming pool contains water entirely. An aquifer is mostly sediment or rock with water in the pores between grains of rock or sediment.
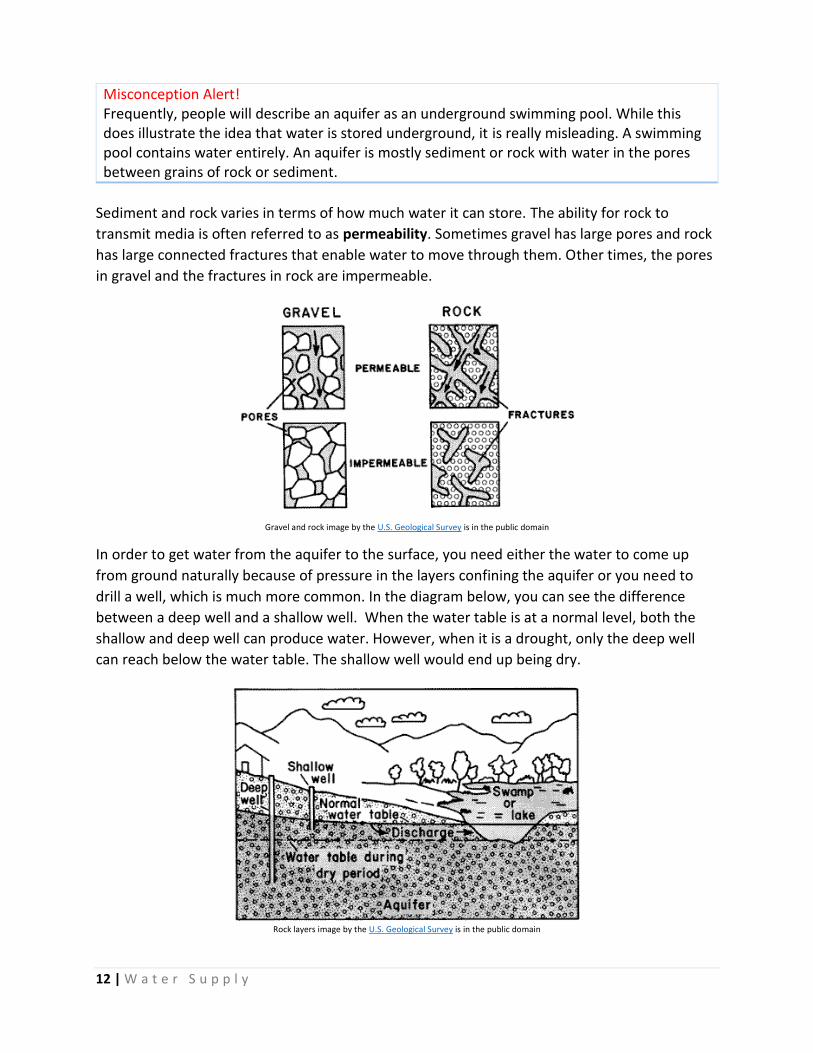
Sediment and rock varies in terms of how much water it can store. The ability for rock to
transmit media is often referred to as permeability. Sometimes gravel has large pores and rock
has large connected fractures that enable water to move through them. Other times, the pores
in gravel and the fractures in rock are impermeable.
In order to get water from the aquifer to the surface, you need either the water to come up
from ground naturally because of pressure in the layers confining the aquifer or you need to
drill a well, which is much more common. In the diagram below, you can see the difference
between a deep well and a shallow well. When the water table is at a normal level, both the
shallow and deep well can produce water. However, when it is a drought, only the deep well
can reach below the water table. The shallow well would end up being dry.
Gravel and rock image by the U.S. Geological Survey is in the public domain
Rock layers image by the U.S. Geological Survey is in the public domain
13 | W a t e r S u p p l y
Groundwater as a water supply also has benefits and drawbacks that communities consider
when they build their water supply portfolios.
Some communities use both surface water and groundwater as a supply. In years of heavy
snowfall and deep snowpack, there may be abundant surface water available. In this case,
surface water would be used for water supply while groundwater supplies could be allowed to
replenish naturally through infiltration of rainfall. In addition, surface water could be stored in
groundwater basins to aid in replenishment. In the reverse situation, in years of light rainfall
and little snowpack, groundwater would be relied on as a primary source because surface water
was not a sufficient supply. The practice of alternating water supplies to meet the needs in a
community is called conjunctive use.
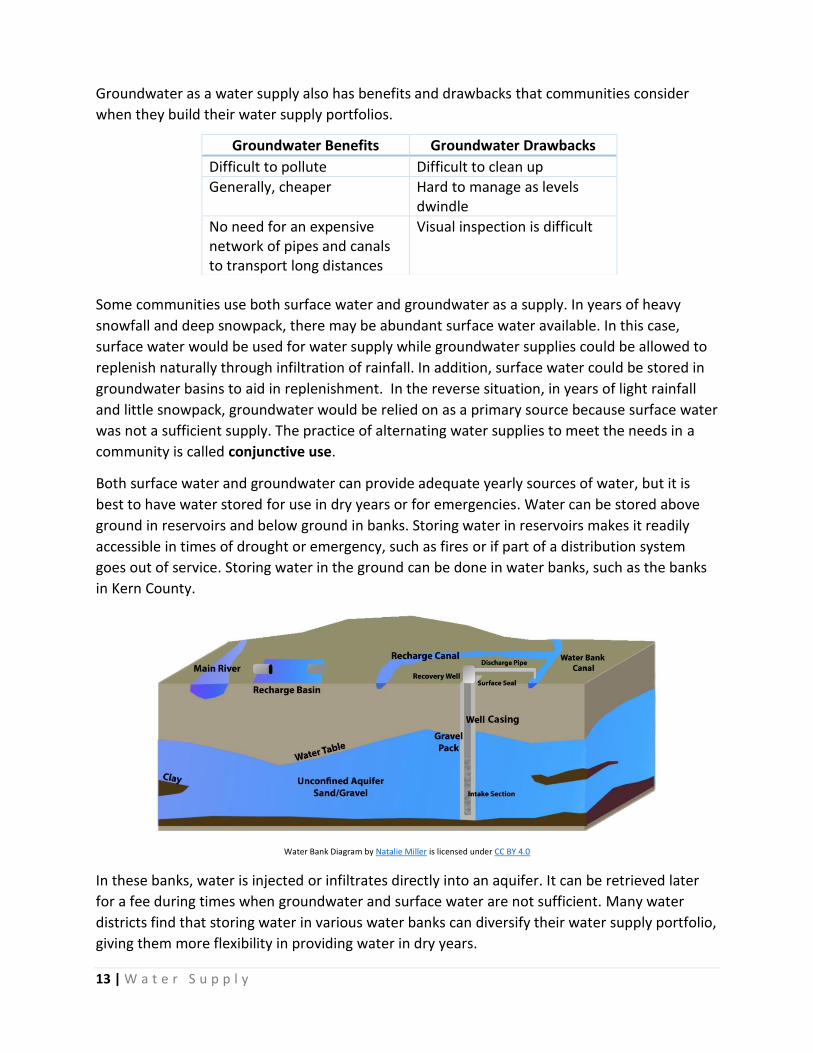
Both surface water and groundwater can provide adequate yearly sources of water, but it is
best to have water stored for use in dry years or for emergencies. Water can be stored above
ground in reservoirs and below ground in banks. Storing water in reservoirs makes it readily
accessible in times of drought or emergency, such as fires or if part of a distribution system
goes out of service. Storing water in the ground can be done in water banks, such as the banks
in Kern County.
Water Bank Diagram by Natalie Miller is licensed under CC BY 4.0
In these banks, water is injected or infiltrates directly into an aquifer. It can be retrieved later
for a fee during times when groundwater and surface water are not sufficient. Many water
districts find that storing water in various water banks can diversify their water supply portfolio,
giving them more flexibility in providing water in dry years.
Groundwater Benefits Groundwater Drawbacks
Difficult to pollute Difficult to clean up
Generally, cheaper Hard to manage as levels dwindle
No need for an expensive network of pipes and canals to transport long distances
Visual inspection is difficult

14 | W a t e r S u p p l y
How can you make your water supply more reliable? Think of the last drought. You probably
noticed lower levels in surface water at lakes and reservoirs and even in streams. In the photo
comparison, you can see the difference in just over a month's time in 2014 in the visible
shoreline. In this example, more water has been taken from the reservoir to treatment facilities
during the late spring in 2014 with a very visible effect on the appearance of the lake!
Images of Castaic Lake (Photo used with permission of Castaic Lake Water Agency)
In California, typically, it is only through a combination of water supplies that you can have a
reliable water supply. The best scenario is that you have a water supply that consists of multiple
sources of groundwater and surface water. That way, when one source is dry or less reliable
due to a drought or unusable due to a water quality issue, you have a backup. The ultimate
scenario for water supply reliability also includes a supply of water in storage.
In Santa Clarita, there are multiple sources of water supply for the water retail companies.
Sources of supply include relatively shallow groundwater wells into the alluvium, clay, silt and
gravel, as well as deeper groundwater wells into the Saugus formation. While the shallower
alluvial wells provide a source of relatively inexpensive supply, they also tend to be more
sensitive to droughts. Imported water from the State Water Project makes up roughly 50% of
the water supply in a normal year though the amount in this supply relies entirely on the
snowpack in the Sierra Nevada Mountains.
During the last drought in Santa Clarita when water deliveries from the State Water Project
were at a minimum, groundwater pumping was increased above normal year levels. When
deliveries from the State Water Project returned to pre-drought levels in 2017, groundwater
wells were pumped less in order to let the well levels recover. This is a classic example of
conjunctive use that brings together what you've learned about groundwater and surface water
because of the alternation of supplies in order to achieve greater reliability.

15 | W a t e r S u p p l y
Now that you understand the concepts used to manage groundwater and surface water, let's
take a look at water rights in California.
Try It!
1. Identify at least three potential sources of water that you could use during the zombie
apocalypse.
2. Describe the drawbacks of surface water and groundwater.
3. Many communities in California rely on groundwater and surface water. Explain how
conjunctive use might apply.
Key Terms
alluvium – clay, silt, or gravel left from old rivers
aquifers – areas underground of soil or rock that can hold and transmit water
conjunctive use – use of alternating water supplies to meet the water demands
permeability – the ability to transmit water
potable – drinkable water
reservoir – a lake that is manmade by making a dam across a river
surface water – flowing water, such as a creek, stream, or river; also still river stored in a lake
or reservoir
water table – the line at which soil becomes saturated with water
16 | W a t e r S u p p l y
Section 1.3 Water Rights In order to understand the types of water rights that you’ll find in California, you’ll have to take
a bit of a trip back in time, not just in California history, but in British history as well. You will be
able to apply what you have learned about surface and groundwater. After reading this section,
you should be able to:
distinguish between surface water and groundwater rights;
describe types of water rights found in California; and
analyze a situation involving water rights to determine which rights should prevail.
You probably recall that California was not always a state within the United States. For many
years, it was a settlement of the Spanish government, and later, the Mexican government.
Pueblos and settlements of the Spanish and Mexican government have pueblo rights to both
the surface and groundwater within the settlement limits. These rights are considered to have
the highest priority compared to all other right types and cannot be lost.
The City of Los Angeles has exercised pueblo rights several times in its history, illustrating
interesting features of pueblo rights:
1. A pueblo water right can increase in quantity as the population increases. As the
population of Los Angeles has increased, the pueblo water right to flows of the Los
Angeles River as well as to groundwater have increased in terms of quantity;
2. A pueblo water right can be extended to newly annexed areas of the original pueblo,
such as when the City of Los Angeles annexed the San Fernando Valley.3
You can see how pueblo water rights are extremely encompassing and useful.
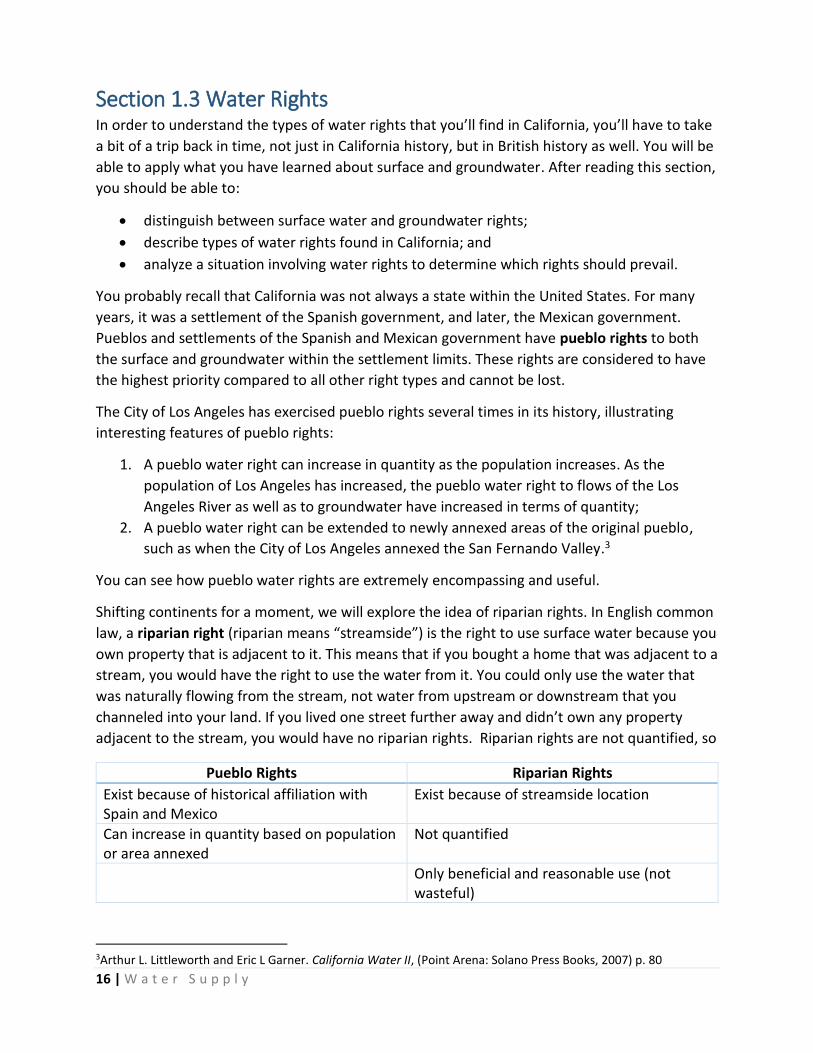
Shifting continents for a moment, we will explore the idea of riparian rights. In English common
law, a riparian right (riparian means “streamside”) is the right to use surface water because you
own property that is adjacent to it. This means that if you bought a home that was adjacent to a
stream, you would have the right to use the water from it. You could only use the water that
was naturally flowing from the stream, not water from upstream or downstream that you
channeled into your land. If you lived one street further away and didn’t own any property
adjacent to the stream, you would have no riparian rights. Riparian rights are not quantified, so
3Arthur L. Littleworth and Eric L Garner. California Water II, (Point Arena: Solano Press Books, 2007) p. 80
Pueblo Rights Riparian Rights
Exist because of historical affiliation with Spain and Mexico
Exist because of streamside location
Can increase in quantity based on population or area annexed
Not quantified
Only beneficial and reasonable use (not wasteful)

17 | W a t e r S u p p l y
if you owned that house on the stream, you may only use as much water to make reasonable
and beneficial use of it.4
Now taking what you’ve learned
about pueblo water rights and
riparian rights, let's shift back to
California to the mid-1800s
when gold mining was thriving.
An appropriative right stems
from mining practices in which
miners worked on public land
using the water to dislodge soil
to expose gold. Often, water
had to be channeled a distance
from its origin to where it was
used. This was considered an
appropriation of water. Miners
literally posted a notice about
their diversion of water to stake
a claim to that water. Whereas riparian rights are not quantitative, an appropriative right is a
specific amount of water for specific purpose in a specific place. If there is not enough water for
all appropriators, the ones with the older appropriations get their water first. 5
The most famous legal case involving surface water rights is Lux v. Haggin (1886), which
established the existence of both riparian rights and appropriative rights and the relationship
between the types of rights. In this case, Haggin owned the upstream Kern Valley Land and
Water Company, which diverted water for irrigation. Because Haggin did not own land that was
adjacent to the water, he was exercising appropriative rights and not riparian rights. Miller-Lux
owned downstream land that was adjacent to the Kern River and exercised riparian rights.
During a drought, Haggin continued to use upstream water and cattle owned by Miller-Lux died
due to lack of available water. Miller-Lux sued Haggin. The primary question in this case was
whether an upstream appropriator could divert water in a way that hurt a downstream holder
of riparian rights. In a surprising outcome, the California Supreme Court ruled that
appropriators (Haggin) could have senior rights if the rights were established prior to
downstream riparian use.6
In Herminghaus v. Southern California Edison (1926), riparian and appropriative rights faced off
again. Herminghaus was using riparian rights to irrigate by letting water from the San Joaquin
River flood his crops. Southern California Edison wanted to build an upstream power plant
using appropriative rights. The California Supreme Court ruled that downstream riparian use
4 Ibid., p. 39 5 Ibid., pp. 49-50 6 Ibid., p. 40
Hydraulic Gold Mining by Carlton Wakins is in the public domain - Hydraulic mining in the 1880s in Nevada City, California
18 | W a t e r S u p p l y
had the right to the entire flow of the San Joaquin River for flood irrigation. In other words, the
California Supreme Court ruled that the downstream riparian right trumped the appropriative
right, which meant Southern California Edison received no water rights.7
Currently appropriative rights are governed by a “first in time, first in right” philosophy and
regulated by the State Water Resources Control Board. A “first in time, first in right” philosophy
means that if you are using the water first, you have seniority in terms of water use. In times of
water shortage, you will get your water first. Much like you saw in the previous court cases, you
do not need to own the land in order to have an appropriative right to water. However, you do
need to use the water in a reasonable and beneficial way with an appropriative right. This
means that wasteful use may not be allowed. 8
While surface water rights have hundreds of years of history, groundwater rights are relatively
recent and currently changing in California. Currently in California, the Groundwater
Management Act (AB 3030) requires development of groundwater management plans and
agencies to manage them. Basins in California have been ranked according to their priority for
development of a groundwater management plan into high, medium, and low priority. Basins
with high ranking are currently developing plans for agency formation.9
Groundwater rights can be overlying or appropriative. Remember your streamside house? It
had riparian rights to use water from the stream. You would also own overlying rights, the
rights to drill a well and pump water to use water on your own land. If your neighbor behind
you wanted to pump water to take the water off of the land, he would be using appropriative
rights. Appropriative rights in groundwater are similar to rights in surface water. “First in time,
first in right” means that groundwater appropriators are evaluated in terms of when they
started using the water.
Although groundwater and surface water rights have some of the same names, it is important
to note that they are managed as if they are not related. For surface water rights, you can have
pueblo water rights if the land was originally a Spanish or a Mexican settlement, riparian rights
if you are using the water streamside and appropriative rights if you are using the water away
from the source. For groundwater rights, you can have overlying rights or appropriative rights.
From studying the water cycle, you already understand that surface water and groundwater are
related. It would make sense if their rights were connected rather than treated as separate
entities.
7 Ibid., p. 41 8 Ibid., p. 41 9 California, California Groundwater, “Sustainable Groundwater Management,” http://groundwater.ca.gov/ (accessed 8/6/17)

19 | W a t e r S u p p l y
Try It!
1. You own a home and would like to dig a well in the backyard. What type of water rights
would be involved?
2. You would like to run a pipe from your neighbor’s creek to your home to engage in flood
irrigation. What types of rights are involved? What issues might come up
3. When might you have a surge in water rights disputes?
Key Terms
appropriative right – right to move water from its source; quantities for a specific purpose in a specific
location; often called “first in time, first in right” rights
overlying rights – groundwater rights for water underneath land
pueblo rights – rights that pueblos and settlements of the Spanish and Mexican government have for
surface and groundwater rights; pueblo water rights can increase in quantity as population increases
and can extended to newly annexed areas
riparian right – streamside right to surface water

20 | W a t e r S u p p l y
Section 1.4 Stakeholder Concepts Who are stakeholders in your water supply?
While you might immediately think of your water utility, city or county agencies, you are also a
stakeholder in the water supply. You are a resident and you use the water in some fashion (e.g.,
drinking, cooking, cleaning yourself and clothes, irrigating, and swimming).
How much interest do you have in the water supply? And how much power do you wield in
critical discussions about water? After reading this section, you should be able to:
Identify and classify stakeholders; and
Differentiate among stakeholders according to the level of interest and the level of
power.
Stakeholders are people with a “stake” in an idea or project. These could be people who are
financially related to the idea or project, interested in the environmental impacts, or just plain
curious. In many nationwide issues, like the presidential election, health insurance, or gasoline
prices, all residents of the United States have a “stake.” Some issues are much more regional,
such as water supply issues or air pollution issues, in which residents in a smaller geographic
area have a stake while some issues, such as health care, are nationwide issues
Stakeholders are typically classified as internal or external. An internal stakeholder is a person
within an organization, such as a staff person or board member, while an external stakeholder
is outside an organization. For example, suppose that staff at a water agency was considering
changing the rules for a turf grass removal program, commonly called "Cash for Grass," in order
to stop rebating artificial turf. Here is a table of the internal and external stakeholders who
have a “stake” in this proposal to remove artificial turf from the Cash for Grass program:
Internal Stakeholders External Stakeholders
Staff at the water agency Residents in the area
Management at the water agency Landscapers (who install plant material)
Board members at the water agency Contractors (who install artificial turf)
Why is it important to identify stakeholders and categorize them? As you work in the water
industry, you will find that reaching out, listening to, and working with stakeholder groups is
critical to your success. In the example above, what would happen if staff didn't reach out to
contractors who install artificial turf? It's possible that they would become very angry. They
might make phone calls to managers and board members. They might attend board meetings
to speak and protest during public comment. Their anger might have been moderated if staff
had reached out ahead of time to explain the reason for the rule change and offer some
alternative strategies to move ahead.
Let's take another example from the water industry. Let's say the customer service manager
decided to implement a new software program that sent work orders to field representatives.

21 | W a t e r S u p p l y
The customer service manager bought the software with her own manager's approval, but
chose not to introduce customer service and field staff to the new product. Instead, the
customer service manager rolled out the product at a meeting after the software was
purchased. How do you think staff felt? They may have had valid concerns about the software,
but the entire purchase was presented to them like a done deal. The customer service manager
should have identified her stakeholders, including internal stakeholders like customer service
and field staff, ahead of time.
Stakeholders are people very specifically interested in an idea or concept whether it's artificial
turf or work order software. Stakeholders are specific to the locale as well as the concept. For
example, the City of Beverly Hills developed a cultural plan, which included an extensive list of
stakeholder groups: residents, businesses, chamber of commerce, entertainment industry,
faith-based communities, fashion community, financial sector, gay community, homeowners
associations, Iranian community, lawyers associations, media, private galleries, restaurants,
senior community, service clubs, and the tourist industry, including hotels and visitors.
A cultural plan for a different city would have different stakeholder groups and, a stakeholder
list for a different issue in the same city would have different stakeholders. Let’s look at what
would happen if we looked at a different issue, like water supply reliability, and identify internal
and external stakeholders in Beverly Hills. Stakeholders who were added to the list are in blue
text. Many of the stakeholder groups that were interested in a cultural plan do not appear
below because they may not be interested in water supply reliability.
Internal Stakeholders for Water Supply Plan External Stakeholders for Water Supply Plan
City of Beverly Hills staff Residents
City of Beverly Hills management Businesses
Beverly Hills City Manager Chamber of Commerce
Beverly Hills City Council Environmental Groups
Metropolitan Water District (wholesale supplier of water)
Homeowners’ Associations (HOAs)
Large Residential Users (A Top 100 List)
Media
Restaurants
Tourism & Hotel Industry
Visitors 10
The list is by no means all inclusive, but shows that there are some groups that will be constant
in an area because they are powerful (HOAs, tourism & hotel industry, and restaurants) and
10 City of Beverly Hills, “Beverly Hills Cultural Plan” http://www.lacountyarts.org/UserFiles/File/Grants/Beverly_Hills_Cultural_Plan.pdf p. 12 (5/23/16)

22 | W a t e r S u p p l y
some groups that are specific to an issue (e.g., Environmental Groups and Top 100 water users).
This list is shorter and more focused on where the water is used.
Once you have identified your stakeholders, you can arrange them according to their level of
interest and power.
In terms of water issues, most
of the public, most of the
time, unfortunately, has a
relatively low level of interest
and low level of power, which
would classify them as
Apathetics. But come drought
time? You will have a much
higher level of interest for
most people and they will
shift from the Apathetics to
the Defenders. They may not
have a high level of power,
but their interest in water
supply reliability is much
higher.
Not everyone who is powerful
is interested in all issues. For
water supply, there are
frequently groups that simply
do not perceive water supply to be an issue, and choose to focus their energy elsewhere. They
would be considered Latents (“latent” means that the interest is lying dormant, but could be
expressed with the right circumstances). A Latent stakeholder might become more interested in
water supply reliability if he/she were involved in a development that needed water, if there
was a drought, or if there were mandatory watering schedules or penalties that affected
his/her interests.
One of the most important issues in water supply management in the state of California is the
challenge of the Sacramento-San Joaquin Bay Delta. Formed by the confluence of the
Sacramento and the San Joaquin Rivers, the Bay Delta, south of Sacramento is the source of
continual stakeholder challenges. Who are the stakeholders in the Bay Delta? At first, it seems
obvious: there are residents and farmers who live and work in the Delta. While they are the
most visible stakeholders, the water supply for much of Southern California flows through the
Delta so Central Valley farmers and Southern Californians are also stakeholders (most Southern
Californians would be Latents though until a crisis arises). Likewise, Northern Californians are
stakeholders, because this is water that is leaving their area. Frequently discussions about the
Bay Delta are framed around the strong interest and immense amounts of power that Southern
Stakeholders Matrix by Zirguezi is licensed under CC0 1.0 - Power vs. Interest Chart

23 | W a t e r S u p p l y
California wields and the high interest, but low amounts of power that the farmers in the Bay
Delta hold. We will discuss more about the Bay Delta in the section on the State Water Project.
You've learned about the importance of involving stakeholders and that stakeholders can be
classified as internal or external and in terms of power and influence as well as interest. In Part
Two of this text, you'll look at four major surface water development projects in terms of
stakeholders.
Try It!
1. Identify a water-related issue in your area. Try typing into google "water issues" and the
name of the community. Who are the stakeholders? Classify them as internal or
external. Classify each stakeholder on a grid in terms of their interest and power.
2. In the water-related issue you chose above, what are ways (other than the drought) to
increase the level of interest of stakeholders in the issue?
3. Add the stakeholders in the conservation program rule change scenario to a chart in
terms of interest and power. Who has both a lot of interest and a lot of power? Who has
neither interest nor power?
Key Terms
stakeholders – people or organizations with a “stake” in an idea or concept

24 | W a t e r S u p p l y
Part Two: Supply-Side Management In Part Two of this text, we’ll explore supply-side management. A supply-side management
approach to water concentrates on securing more water supplies through engineering feats.
Supply-side management was frequently done by building massive engineering projects to
move water hundreds of miles. While they were impressive projects at the time, today, there
are more significant regulatory hurdles to building supply-side projects, including
environmental regulations. The difficulty of building major infrastructure projects has led to
more work being done with exploring alternative supplies and reducing demand.
For a long time, human beings have related to nature as if nature was something to be
conquered. In the United States, until the 1960s, the natural environment was viewed as mostly
inconsequential to expansion and development. The environmental movement, beginning with
the publication of Rachel Carson’s Silent Spring in 1962 and continuing with the Cuyahoga River
catching on fire due to pollution in 1969, began to change the way we related to nature.
Perhaps nature wasn’t something to be vanquished as an enemy. Perhaps nature isn’t limitless.
As you examine four large public works projects in California, it is important to keep the shifting
mentality of these times in mind. Each project was a feat to build at the time, and in some cases
seen as a battle of man against nature. With current regulatory requirements, these projects
would be just about impossible to build today.
In Part Two, we will cover these topics:
Water Development Projects
Los Angeles Aqueduct
Colorado Aqueduct
Central Valley Project
State Water Project
Alternative Water Sources
Recycled water
Gray water
Storm water
Desalination
Water Development Projects
The primary challenge in water supply planning in California is usually framed as spatial. Most
of the water is in the northern part of the state and most of the people live in the southern part
of the state. In other words, the supply does not exist where the demand is. However, there is
an additional challenge as well. Much of California receives water during the winter and early
spring when the demands are the least, and not during the summer and fall when the demands
are the greatest. This creates a temporal (time) challenge because the supply has to be stored
until it is needed.

25 | W a t e r S u p p l y
The map below shows the population centers in the Bay Area and Los Angeles Area as well as
the volume of storage at various reservoirs throughout California. Notice how storage is
concentrated in central and Northern California away from Southern California. This frames
many of the water development projects.
Water in California by Shannon1 is licensed under CC BY-SA 4.0

26 | W a t e r S u p p l y
Section 2.1 Los Angeles Aqueduct After reading this section, you should be able to:
identify driving factors in the construction of the Los Angeles Aqueduct;
classify stakeholders in the construction of the Los Angeles Aqueduct; and
evaluate the impacts of Decision 1631.
To understand current day Los Angeles, you need to understand the population explosion in the
last two hundred years in the Los Angeles basin. Los Angeles was initially a Spanish pueblo
when founded in 1781 and it had a small population. A combination of surface water from the
Los Angeles River and groundwater from artesian springs remained sufficient supply for a long
time. As you know, Los Angeles was entitled to these supplies of surface water and
groundwater because of pueblo water rights.11 While the supplies were sufficient for the
existing population, the introduction of cattle ranching and citrus cultivation in the 1880s
coupled with a drought resulted in strained water supplies.12
Now, imagine you are the superintendent of this water system
within California, which has been reliable under current conditions,
but is strained by more and more people.
Ack! Look at those numbers! You're going to run out of water!
In 50 years, the population
increased from just over fifteen
hundred to over one hundred thousand people. This is the fix
William Mulholland found himself in as superintendent of the
water system: a burgeoning population and a dwindling water
supply.13 His friend and colleague, former mayor of Los Angeles,
Fred Eaton, suggested the Owens River as a potential supply. The
Owens River relied on snowmelt from the Sierras. In order to
obtain the rights for the water, the land surrounding the river
was purchased to obtain water rights. 14
Both Eaton and Mulholland were engineers. They were intrigued
by the idea that the water could be conveyed entirely by gravity
11 City of Los Angeles, Department of Water and Power, “The City Owns Its Water,” https://www.ladwp.com/ladwp/faces/wcnav_externalId/a-w-fact-hist?_adf.ctrl-state=b73kdu4vf_4&_afrLoop=792998873720315 (accessed 5/18/16) 12 Arthur L. Littleworth and Eric L. Garner, California Water II (Point Arena: Solano, 2007) p. 14 13 City of Los Angeles, Department of Water and Power, “A New Supply,” https://www.ladwp.com/ladwp/faces/wcnav_externalId/a-w-fact-hist?_adf.ctrl-state=b73kdu4vf_4&_afrLoop=792998873720315 (accessed 8/6/17) 14 City of Los Angeles, Department of Water and Power, “The Owens Valley is the Only Source,” https://www.ladwp.com/ladwp/faces/wcnav_externalId/a-w-fact-hist?_adf.ctrl-state=b73kdu4vf_4&_afrLoop=792998873720315 (accessed 8/6/17)
Year Population
1850 1,610
1860 4,385
1870 5,728
1880 11,183
1890 50,395
1900 102,479
Photographic portrait of William Mulholland with a surveyor's scope on a tripod by University of Southern California Libraries and California
Historical Society is licensed under CC BY 3.0

27 | W a t e r S u p p l y
with a slight slope in the aqueduct from more than 3800 feet above sea level to 1400 feet
above sea level. The energy from the water was even enough to generate electricity at a
number of power plants that were built along the way. In many ways, their fascination with the
engineering aspects of the project may have kept them from fully considering other ethical
concerns as they orchestrated purchases of land in the Owens Valley.
Eaton and Mulholland certainly seemed to disregard stakeholders in this potential project. For
example, the residents of the Owens Valley, including farmers, ranchers and the indigenous
Paiute people, were certainly going to be impacted by directing the water to Southern
California. These stakeholders, whose lives were dependent on the water, had very little power
to mount a protest at the time. And, in fact, they generally were not asked for permission. The
purchases of land in the Owens Valley were conducted in ways that seemed underhanded and
non-transparent, including agents for the City of Los Angeles representing themselves as from
the Bureau of Reclamation.15 At the point when actual stakeholders in Southern California were
brought in to fund and approve the project, the land was already purchased. This is a classic
example of stakeholders not being consulted until the project is almost a fait accompli.
Even though Mulholland had found enough water for the existing
population in Los Angeles, the population continued to grow. By
1923, Mulholland had explored the possibility of bringing water from
the Colorado River as well as the second portion of the Los Angeles
Aqueduct to Mono Lake. Both projects moved ahead because it was
clear that the original Los Angeles Aqueduct was not enough.
And, in the end, even the second addition to the Los Angeles
Aqueduct was not enough. The Los Angeles Aqueduct was completed
in three parts:
Part One: 1913 - Los Angeles voted 10 to 1 to authorize $23 million
for the first Los Angeles Aqueduct and it is subsequently built.16
Part Two: 1940 - Los Angeles votes to extend the Los Angeles Aqueduct to the Mono Lake
watershed for $40 million and the extension is built.17
15 City of Los Angeles, Department of Water and Power, “The Last Spike is Driven,” https://www.ladwp.com/ladwp/faces/wcnav_externalId/a-w-fact-hist?_adf.ctrl-state=b73kdu4vf_4&_afrLoop=792998873720315 (accessed 8/6/17) 16 City of Los Angeles, Department of Water and Power, “A Hundred or a Thousand Fold More Important,” https://www.ladwp.com/ladwp/faces/wcnav_externalId/a-w-fact-hist?_adf.ctrl-state=b73kdu4vf_4&_afrLoop=792998873720315 (accessed 8/16/17) 17 City of Los Angeles, Department of Water and Power, “The Mono Basin Project,” https://www.ladwp.com/ladwp/faces/wcnav_externalId/a-w-fact-hist?_adf.ctrl-state=b73kdu4vf_4&_afrLoop=792998873720315 (accessed 5/18/16)
Year Population
1910 319,198
1920 576,673
1930 1,238,048
1940 1,504,277
1950 1,970,358
1960 2,479,015
1970 2,811,801
1980 2,968,579
1990 3,485,398
2000 3,694,742
2010 3,792,621
28 | W a t e r S u p p l y
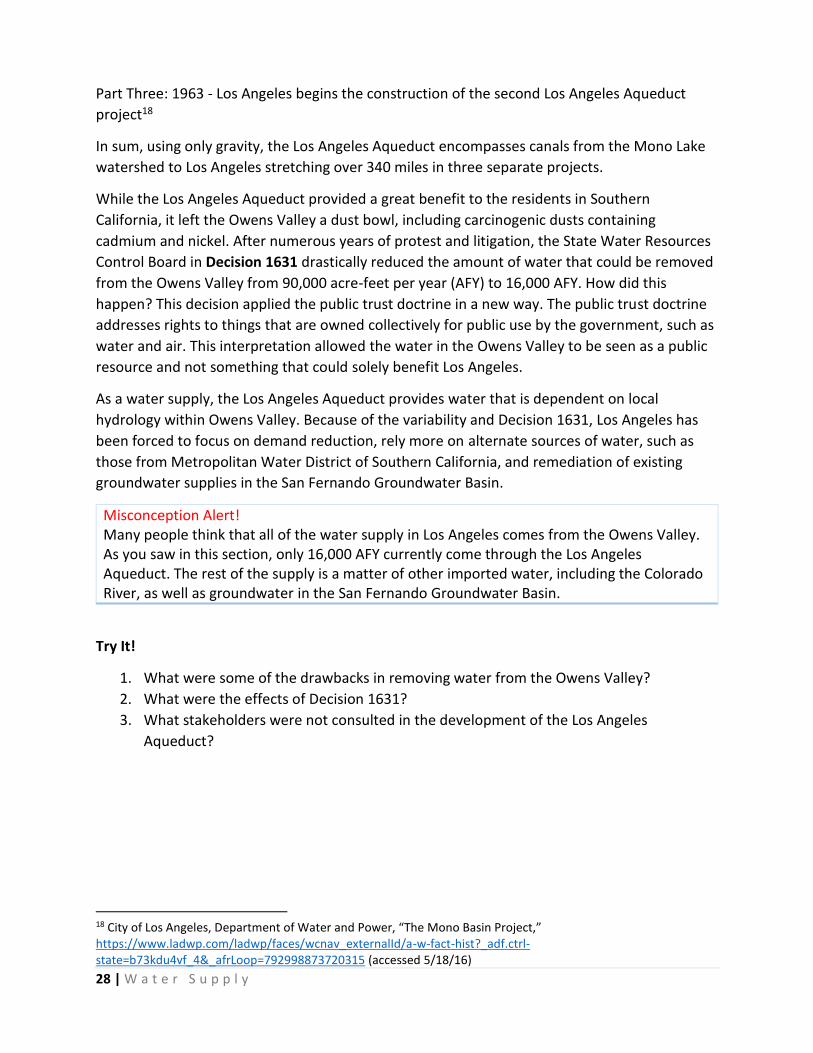
Part Three: 1963 - Los Angeles begins the construction of the second Los Angeles Aqueduct
project18
In sum, using only gravity, the Los Angeles Aqueduct encompasses canals from the Mono Lake
watershed to Los Angeles stretching over 340 miles in three separate projects.
While the Los Angeles Aqueduct provided a great benefit to the residents in Southern
California, it left the Owens Valley a dust bowl, including carcinogenic dusts containing
cadmium and nickel. After numerous years of protest and litigation, the State Water Resources
Control Board in Decision 1631 drastically reduced the amount of water that could be removed
from the Owens Valley from 90,000 acre-feet per year (AFY) to 16,000 AFY. How did this
happen? This decision applied the public trust doctrine in a new way. The public trust doctrine
addresses rights to things that are owned collectively for public use by the government, such as
water and air. This interpretation allowed the water in the Owens Valley to be seen as a public
resource and not something that could solely benefit Los Angeles.
As a water supply, the Los Angeles Aqueduct provides water that is dependent on local
hydrology within Owens Valley. Because of the variability and Decision 1631, Los Angeles has
been forced to focus on demand reduction, rely more on alternate sources of water, such as
those from Metropolitan Water District of Southern California, and remediation of existing
groundwater supplies in the San Fernando Groundwater Basin.
Misconception Alert! Many people think that all of the water supply in Los Angeles comes from the Owens Valley. As you saw in this section, only 16,000 AFY currently come through the Los Angeles Aqueduct. The rest of the supply is a matter of other imported water, including the Colorado River, as well as groundwater in the San Fernando Groundwater Basin.
Try It!
1. What were some of the drawbacks in removing water from the Owens Valley?
2. What were the effects of Decision 1631?
3. What stakeholders were not consulted in the development of the Los Angeles
Aqueduct?
18 City of Los Angeles, Department of Water and Power, “The Mono Basin Project,” https://www.ladwp.com/ladwp/faces/wcnav_externalId/a-w-fact-hist?_adf.ctrl-state=b73kdu4vf_4&_afrLoop=792998873720315 (accessed 5/18/16)

29 | W a t e r S u p p l y
Section 2.2 Central Valley Project
California’s Central Valley is known as one of the most productive agricultural regions on earth,
but it was not always this way. For a long time, the Central Valley was ranching country. And
then it was farming country, but was farmed “dry,” meaning without supplemental irrigation. It
Central Valley Project by Shannon1 is licensed under CC BY-SA 4.0

30 | W a t e r S u p p l y
wasn’t until the population influx in the 1850s with the gold miners and the development of a
pump that there was a drive to make the Central Valley intensively agricultural. 19
After decades of pumping water for irrigation in the Central Valley and a drought from 1928-
1934, the Central Valley Project was conceived as a plan to ensure water supply reliability and
protect it from floods. After reading this section, you should be able to:
Identify and critique the purposes of the Central Valley Project; and
Anticipate the future crises for the Central Valley Project.
The Central Valley typifies the challenge of California’s water supply. Most of the rainfall occurs
in five months, from December to April. There is enough rain to regularly produce flooding in
these months. But when the needs of the plants are the greatest for food production (spring
and summer), there is little natural rainfall. Pumping supplemental water made the
groundwater levels drop significantly in the Central Valley causing subsidence. Diverting river
flows for irrigation brought in the salt waters to the Sacramento-San Joaquin Bay Delta, which
meant saltier water, sometimes unfit for irrigation, came inland. 20
The state of California authorized the California Central Valley Project Act of 1933 to sell bonds
to fund the project. However, due to the Great Depression, the bonds didn’t sell. The federal
government took control of the project with the Rivers and Harbors Act of 1935 and the
project was finally approved in 1935 for construction by the federal Bureau of Reclamation,
which eventually took over operation. 21
The Central Valley Project was authorized with three key elements in its mission: flood control,
water for irrigation and power generation. Water quality was added later to the mission as well
as recreation and fish and wildlife enhancement.22
Although the Central Valley Project is the largest of the federal water reclamation projects and
includes reservoirs capable of storing 11 million acre-feet of water, it has a fairly simple
structure. Water is stored in Shasta Reservoir and Shasta Dam acts as flood control for the
Sacramento River. The Trinity River supplements the Sacramento River. The San Joaquin River
supplies areas south of the Delta. 23
19 Littleworth and Garner, California Water II, p. 21 20 U.S. Department of the Interior, Bureau of Reclamation, “Central Valley Project Overview,” Eric A. Stene, Bureau of Reclamation http://www.usbr.gov/mp/cvp/docs/cvp-overview.pdf (accessed 8/6/17) 21 Littleworth and Garner, California Water II, p. 22 22 U.S. Department of the Interior, Bureau of Reclamation, Eric A. Stene. Central Valley Project Overview. Bureau of Reclamation http://www.usbr.gov/mp/cvp/docs/cvp-overview.pdf p. 8 (accessed 8/6/17) 23 Littleworth and Garner, California Water II, p 23

31 | W a t e r S u p p l y
The Central Valley Project shares some facilities including San Luis Reservoir with the State
Water Project. The photo below shows Shasta Dam, which is exclusively used by the Central
Valley Project.
Misconception Alert! Many people believe that Shasta Lake is part of the State Water Project. As you learned in this section, this is part of the Central Valley Project. The State Water Project has another larger reservoir that stores water in Northern California, Lake Oroville. These reservoirs are typically confused by many people.
The Central Valley Project Improvement Act in 1992 allocated water for fishery restoration.
This is similar to Decision 1631 in that a water development project was re-evaluated with
current environmental norms. The allocation for fishery restoration is 800,00 AFY, which is
perceived as enormous by some. This was a considerable change in the mission of the Central
Valley Project from water supply reliability, irrigation and power generation to fish and wildlife
enhancement.24
Try It!
1. Compare and contrast the Los Angeles Aqueduct and Central Valley Project.
2. Investigate potential challenges to the Central Valley Project in the future.
Key Terms
California Central Valley Project Act of 1933 – authorized by the state of California to sell
bonds to fund the Central Valley Project. However, due to the Great Depression, the bonds
didn’t sell.
24 U.S. Department of the Interior, Bureau of Reclamation, “Central Valley Project (CVP) Water Quantities for Delivery 2016,” http://www.usbr.gov/mp/cvp-water/docs/5-9-16-1-cvp-water-quantities-only.pdf (accessed 5/20/16)
Shasta Dam, California by Apaliwal is licensed under CC BY 3.0

32 | W a t e r S u p p l y
Central Valley Project Improvement Act in 1992 – allocated water for fishery restoration in the
Central Valley Project
Rivers and Harbors Act of 1935 – authorized by the federal government to fund the Central
Valley Project in 1935 for construction by the federal Bureau of Reclamation

33 | W a t e r S u p p l y
Section 2.3 Colorado River Aqueduct Metropolitan Water District was formed in 1928 with the explicit purpose of picking up on
where the City of Los Angeles left off with the planning for the use of the Colorado River. The
Colorado River Aqueduct was funded by voters three years later in 1931, begun in 1933 and
completed in 1935. Water first began to flow in 1939. Even though this time frame is relatively
short, the Colorado River Aqueduct was the result of a series of lengthy and heated
negotiations, which we will now explore. Collectively the agreements that govern the Colorado
River are known as The Law of the River.
After reading this section, you should be able to:
differentiate among key agreements that are part of The Law of the River; and
conjecture as to possible sources of future disagreement.
The primary tension with all Law of the River
negotiations is similar to the tension in
California: spatial. The water doesn’t exist
where the population centers are. But the
geography of the Western United States is
much more vast than just California. There are
seven states considered to be within the
Colorado River Basin: Wyoming, Colorado,
Utah, New Mexico, Arizona, Nevada, and
California. These are all primary stakeholders in
the use of the Colorado River. The upper basin
states include Wyoming, Colorado, Utah and
New Mexico. Upper basin states were
especially sparse in population and anticipated
that they might need the Colorado River water at some point as their populations increased or
industries like natural gas extraction grew, but they didn’t have an immediate need for the
water. The lower basin states included California, Arizona and Nevada, most of whom had
burgeoning populations. The upper basin states were originally concerned that if the lower
basin states constructed dams, including Hoover Dam, and began to use the Colorado River that
under the doctrine of prior appropriation, the upper basin states would not be able to use the
Colorado River’s water again.
The first important agreement in The Law of the River is the Colorado River Compact of 1922,
which divided the basin in half. Each basin had the right to use 7.5 MAF of water based on an
average flow of the Colorado River of 18 million acre-feet per year, plus a small allocation to
Mexico. While most states ratified this agreement, it took Arizona 22 years to ratify it, which is
Colorado River Aqueduct by Matthew Trump is licensed under CC BY-SA 3.0

34 | W a t e r S u p p l y
a window into the contentiousness. Arizona was greatly concerned about not receiving enough
water eventually and of California taking water that Arizona was entitled to.25
The second important agreement in The Law of the River was the Boulder Canyon Project Act
of 1928. Negotiations for this agreement lasted seven years, and including four bills being
introduced and a filibuster. In this agreement, the lower basin was apportioned among the
states:
Arizona - 2.8 MAF
California - 4.4 MAF
Nevada - 0.3 MAF
The Secretary of the Interior was directed to function as the authority for water use in the
lower basin, including the ability to commission studies on feasibility for dams and storage. 26 It
is interesting to note how small the apportionment for Nevada is.
As a slightly less important agreement in the Law of the River, the California Seven Party
Agreement of 1931 is an agreement for division of water among seven entities. The parties
included Palo Verde Irrigation District, Yuma Project, Imperial Irrigation District, Coachella
Valley Irrigation District, Metropolitan Water District, and the City and County of San Diego.
This agreement temporarily settled longstanding disagreements between agricultural and
urban users. 27
The third important act in The Law of The River is an international treaty. In the Mexican Water
Treaty of 1944, 1.5 MAF of the Colorado River flow were committed to be received in Mexico.
While the amount was agreed upon, the quality of the water remained undetermined. Due to
agricultural and urban use, the quality of the Colorado River becomes worse the further south
the river flows. A desalting plant for removing salt was eventually built in Yuma, Arizona to
increase the quality of the water released to Mexico.
In the fourth important agreement in The Law of the River, the Upper Colorado River Basin Act
of 1948, the upper Colorado River Commission was created and the Upper Basin was
apportioned:
Colorado - 51.75%
New Mexico - 11.25%
Utah - 23%
Wyoming - 14%28
25 U.S. Department of the Interior, Bureau of Reclamation, “Law of the River,” http://www.usbr.gov/lc/region/g1000/lawofrvr.html (accessed 8/6/17) 26 U.S. Department of the Interior, Bureau of Reclamation, “Boulder Canyon Project Compact,” https://www.usbr.gov/lc/region/pao/pdfiles/bcpact.pdf (accessed 8/6/17) 27 U.S. Department of the Interior, Bureau of Reclamation, “Law of the River,” http://www.usbr.gov/lc/region/g1000/lawofrvr.html (accessed 8/6/17) 28 Ibid

35 | W a t e r S u p p l y
During the negotiations, it was noted that the originally agreed upon amount of 18 million acre-
feet of normal flow for the Colorado River might be an overestimation and that agreements
would be better done by percent rather than flat allocations of water.29
The Law of the River is a complicated set of agreements, and the previous pages only covered
the major agreements. It should be clear that there will be issues of allocations, water rights,
and urban v. agricultural differences for many years to come. Several recent modifications to
the Law of the River were made because of droughts. In 2007, interim guidelines for allocating
the Colorado River during water shortages through 2026 were signed by the Secretary of the
Interior. Water shortages were determined based on the surface elevation of Lake Mead. In
2012, the United States and Mexico signed Minute 319 that addressed how Mexico’s allocation
of 1.5 MAF would change in drought conditions also based on the surface elevation of Lake
Mead.30
Try It!
1. What is the difference between the Upper Colorado Basin Act and the Boulder Canyon
Project Act?
2. What is a likely source of disagreement in the future?
Key Terms
Boulder Canyon Project Act of 1928 – Apportioned the lower Colorado River basin among three states:
Arizona - 2.8 MAF
California - 4.4 MAF
Nevada - 0.3 MAF
Colorado River Compact of 1922 – which divided the basin in half; each basin had the right to
use 7.5 MAF of water based on an average flow of the Colorado River of 18 million acre-feet per
year, plus a small allocation to Mexico
The Law of the River – collectively the laws and regulations that govern the Colorado River
Mexican Water Treaty of 1944 – committed 1.5 MAF of the Colorado River flow to Mexico; did
not describe quality of water, just quantity
29 Ibid 30U.S. Department of the Interior, Bureau of Reclamation, “Interior Secretary Salazar and Reclamation Commissioner Connor Join U.S. and Mexico Delegations for Historic Colorado River Water Agreement Ceremony,” http://www.usbr.gov/lc/region/feature/minute319.html (accessed 8/6/17)

36 | W a t e r S u p p l y
Minute 319 – an international agreement between the United States and Mexico regarding the
Colorado River that addressed how Mexico’s allocation of 1.5 MAF would change in drought
conditions also based on the surface elevation of Lake Mead
Upper Colorado River Basin Act of 1948 – apportioned the Upper Colorado River Basin by percent:
Colorado - 51.75%
New Mexico - 11.25%
Utah - 23%
Wyoming - 14%

37 | W a t e r S u p p l y
Section 2.4 State Water Project The last major water infrastructure project undertaken for water supply in California was the
State Water Project (SWP) and it still isn’t quite finished! The SWP major features were outlined
in 1957 in the California Water Plan and it was funded by the Burns-Porter Act in 1960 in $1.75
Billion in general obligation bonds. After reading this section, you should be able to:
identify the major stakeholder groups and their needs;
analyze major threats to the Sacramento-San Joaquin Delta in terms of water supply;
and
project future impacts to the State Water Project.
The State Water Project is a massive infrastructure project that involves several major
stakeholder groups throughout the state of California, all of which have been stakeholders in
other water development projects that you’ve learned about:
Northern California communities that wanted flood control protection (as a result of
devastating floods on the Feather River in 1955);
San Joaquin-Sacramento River Delta communities that wanted flood protection, but also
access to high quality water for farming;
San Joaquin farmers who wanted access to water for expansion of agriculture, but also
because of groundwater overdraft issues; and
Southern California residents who wanted water for future growth and for water supply
reliability.31
The State Water Project brought together these stakeholder groups with a combined mission of
providing water supply to the San Joaquin Valley farmers as well as Southern California.
The State Water Contract was among 32 public water agencies all over the state, including
some agencies that formed specifically to contract for SWP water supplies. The terms of the
contract were 75 years minimum or until the bonds were repaid. The State of California was
obligated to make reasonable efforts to complete the project. The Contractors were obligated
to pay even if the water supplies were reduced or the project was not complete. As you might
guess, these aren’t great contract terms (paying for a project that is incomplete or reduced in
some way).32
The State Water Project had several purposes: flood control (specifically at Lake Oroville),
recreation (e.g., Pyramid Lake, Castaic Lake) and water supply (including primary reservoirs at
Oroville and San Luis and terminal reservoirs at Pyramid and Castaic Lake, Lake Perris and Lake
De Val). Facilities to convey water through the Delta and for additional storage were not
completed.
31 California, Department of Water Resources, “History of California State Water Project,” http://www.water.ca.gov/swp/history.cfm (accessed 8/6/17) 32 California, “California State Water Project Overview,” http://www.water.ca.gov/swp/ (accessed 8/6/17)

38 | W a t e r S u p p l y
The Delta
The Sacramento-San Joaquin Delta (sometimes referred to only as “the Bay-Delta" or “the
Delta”) is one of the most interesting places in California to study in terms of stakeholders,
science and water supply.
In terms of stakeholders, the Delta is home to historic towns and family farms. Many farms are
under sea level with manmade levees their only protection. The Delta is also fully used for
recreation - boating, fishing, sightseeing, bird watching (and duck hunting). There are also
millions of stakeholders south of the Delta that rely on the water supply that passes through
the Delta. So combine various stakeholders with a location that is literally described as the
“heart” of the water supply and you can see how there might be inherent conflicts.
Image of the Sacramento-San Joaquin Bay-Delta by the U.S. Geological Survey is in the public domain

39 | W a t e r S u p p l y
The Delta has been altered by farmers over the past 150 years and it has also been altered by
the operation of the State Water Project and Central Valley Project. It is currently threatened by
three primary issues:
Seismic - A large earthquake could break down the manmade levee system, allowing
seawater into the Delta, and essentially making the water supply undrinkable for anyone
south of the Delta.
Subsidence - Land within the Delta is made of peat soil, which is excellent for farming, but
compacts and subsides over time, leading to levees sinking and needing to be repaired and
strengthened.
Sea Level Rise - Sea level rise also threatens the Delta as there is often only a few feet
between the top of the water and the top of the levee.33
The most likely path forward are two twin tunnels under the Delta. This is known as the
California Water Fix (formerly known as the Bay Delta Conservation Plan).
Try It!
1. Identify three purposes of the State Water Project.
2. Write a letter advocating a plan to fix the Delta.
33 Bay Delta Conservation Plan, “About the Problem,” http://baydeltaconservationplan.com/AboutTheDelta/AbouttheProblem.aspx (accessed 8/6/17)
Sacramento Delta by Matthew Trump is licensed under CC BY-SA 3.0

40 | W a t e r S u p p l y
Key Terms
Burns-Porter Act – Funded the State Water Project in 1.75 billion in general obligation bonds in
1960
This table summarizes the four major infrastructure projects covered.
Los Angeles Aqueduct
Central Valley Project
Colorado River Aqueduct
State Water Project
Purpose Water supply reliability
Flood control Water for irrigation Power
Water supply Water supply Flood control Irrigation for farms
Stakeholders Southern California residents Owens Valley ranchers, farmers, Paiute tribe
San Joaquin Valley farmers
Wyoming, Colorado, Utah, New Mexico, Nevada, Arizona, California
Southern California residents San Joaquin Valley farmers Northern California communities with flood protection needs
Legislation
California
Central Valley
Project Act of 1933 Rivers and Harbors Act of 1935 Central Valley Project Improvement Act in 1992
All under The Law of The River: Colorado River compact of 1922 Boulder Canyon Project Act of 1948 Mexican Water Treaty of 1944 Upper Colorado River Basin Act of 1948 Minute 319
California Water Plan Burns-Porter Act
Major Features Owens Lake Mono Lake
Lake Shasta San Luis Reservoir
Lake Powell Lake Mead
Lake Oroville San Luis Reservoir

41 | W a t e r S u p p l y
Section 2.5 Alternative Water Supplies Alternative Water Supplies are supplies other than groundwater and surface water. Frequently,
they are “reused” supplies, meaning they were potable water supplies that were captured for
use individually or system wide after being used once.
Here are a few quick definitions to begin:
Recycled Water Gray water Storm water Desalinated Water
Heavily treated wastewater that is used for irrigation, groundwater replenishment and as a subsurface barrier against seawater intrusion; typically in California, recycled water is used for irrigation
Household wastewater, including water from the washing machine, shower, bathroom sinks, that is captured and reused, but excluding blackwater, which is water from toilets and kitchen sinks; commonly referred to as "lightly used" water
Runoff from precipitation (rain or snowmelt) that flows overland; may mobilize pollutants and is better to capture on site to replenish groundwater
Ocean or brackish water that has had the salt removed to make it potable; two primary methods are used worldwide, but in the United States, reverse osmosis is most frequently used
After reading this section, you should be able to:
analyze the water supply portfolio for several geographic locales in terms of the
likelihood of adding an alternative water supply
differentiate among types of alternative supplies and their appropriateness given
different situations
Recycled Water
You may hear “recycled water” used in a variety of ways in the United States and abroad. In
California, specifically, there is some confusion in terminology. Changes to a variety of codes
occurred in 1995 when “recycled water” became the term of choice rather than “reclaimed
water.” These are essentially the same thing. Regulations for the level of treatment for various
uses are in Title 22 of the California Code of Regulations. 34
What happens to wastewater when it leaves your house? It travels through a series of larger
and larger pipes to a wastewater treatment facility. Alternatively, if you live rurally, your
wastewater may be held and separated in a septic tank on your own property. Wastewater that
has undergone primary treatment has had the solids removed. Wastewater that has undergone
secondary treatment has had organic materials removed through biological processes.
Secondary treated wastewater can be used for groundwater recharge and irrigation. Water that
34 Littleworth and Garner, California Water II, p. 276

42 | W a t e r S u p p l y
has undergone tertiary treatment has undergone sedimentation, chemical flocculation and
filtration. As you might imagine, water that has undergone tertiary treatment has a range of
uses, even those involving body contact, such as recreational use in lakes, as well as irrigation.
Recycled water has only system-wide applications in that individual homes are not creating and
using recycled water. You may be familiar with recycled water for irrigation of golf courses,
medians, but it also can be used for groundwater recharge, including to act as a seawater
intrusion barrier. Orange County Water District treats recycled water in a three step process of
microfiltration, reverse osmosis and ultraviolent treatment. The treated water is then injected
into the groundwater basin. The water serves as a barrier against the intrusion of ocean water
into the aquifer. 35
Recycled water seems like an important source to add to a water supply portfolio. After all,
what community in California wouldn't want a reliable source of water for irrigation of
landscapes? And what coastal community wouldn't want water to inject into the ground as a
barrier of seawater intrusion. Overall, recycled water can decrease the demand for potable
water by providing an addition to a water supply portfolio. But recycled water is expensive.
Next to desalination, it is one of the most expensive options out there (think of the treatment
costs!). Like many aspects of infrastructure, recycled water is politically appealing to residents,
but the added costs are not.
Gray water
Certainly the water that you drink, wash your clothes in and use to bathe needs to be potable.
But what about the water that you flush your toilets with? What about the water that you
irrigate with? The premise of gray water use is that not all water that we use on a daily basis
needs to be potable. Keeping this in mind, you then have to consider what can be reused in
your indoor water use.
Wastewater from toilets and wastewater from the kitchen sink both contain bacteria from
feces or meats. But wastewater from a washing machine can be reused without many concerns,
assuming diapers are not washed or clothes are not highly soiled, greasy or contaminated.
The easiest gray water system to construct is called “Laundry to Landscape.” Wastewater from
the washing machine is directed to a drip irrigation system outside the house. Water isn’t
stored in any fashion - when you run a load of clothes in the wash, you are irrigating with the
wastewater directly afterwards. You can see that you would need to time your laundry -
washing everything on Sunday would lead to too much water for irrigation. Doing a load of
wash every other day might be enough water for irrigation in the summer.
35 Orange County Water District, Groundwater Replenishment System http://www.ocwd.com/gwrs/ (accessed 4/8/16)

43 | W a t e r S u p p l y
What do you need in order to have a simple Laundry to Landscape system?
Your washing machine should be located close to an exterior wall in order to run a pipe
to the outside of the house;
Your house should be slightly above the area that you are irrigating so you can use
gravity to direct the water to the drip system and the plants without a pump (though
pumps that remove water from washing machines can be powerful and enough to move
water some distance);
You need to have plants that can be irrigated with drip irrigation (shrubs or trees); and
You need to install a diverter valve at the washing machine that would allow especially
dirty loads of laundry to drain toward the sewer or septic tank and not into your
irrigation system.
There are more complicated gray
water systems that involve storing
gray water in tanks and using
pumps and filters, but most gray
water practitioners agree that
simple is best.
Here are some best practices in residential gray water systems:
Don’t store gray water.
Minimize body contact with gray water.
Allow gray water to infiltrate the soil with drip irrigation, not pool on the surface.
Simple is better. Avoid pumps and filters.
Install a diverter valve.
Match needs of plants.
Please note that these are best practices, but not necessarily rules and regulations. Rules and
regulations vary by city and county.
In a recent study of graywater systems in the Bay Area, it was noted that the most common
problem in gray water systems was clogs, but this wasn't much of a surprise because most
people reported performing no maintenance on the system. Plants were generally just as
healthy as with a standard irrigation system and some were overwatered and some were under
watered. Overall, people saw an average reduction in water use of 26%. There was at least one
Photo of a diverter valve by Stephanie Anagnoson is licensed under CC BY 4.0
44 | W a t e r S u p p l y
unintended consequence - with an abundance of water to irrigate, some people planted more
plants and their irrigated area increased in size. 36
There are a number of institutional hurdles to expanding gray water use. The primary hurdle is
one related to the construction of homes: homes are plumbed with intermingled graywater and
blackwater. This means that the wastewater from the entire home is treated as blackwater and
sent to the sewer or septic tank. Additionally, if you check the city, county and state code
related to graywater, they are frequently contradictory. California code, Title 24, Part 6,
Chapter 16 a, Part 1 establishes minimum requirements for gray water regulations.
Additionally, AB 849 (Gatto) prohibits local jurisdictions from banning gray water. However, a
city or county may impose additional regulations so that it becomes too complicated to
establish gray water in the home. Furthermore, as you can imagine, setting up a gray water
system relies on a knowledge base of basic plumbing and wastewater. It is probably not an
overstatement to say that most customers try not to think about this.
Misconception Alert! Many people use “graywater” to refer to all sorts of alternative supplies, including recycled water and stormwater. This is simply incorrect, but a common misuse of language. Graywater must be water from indoor use that can be reused, typically for irrigation. It is not wastewater or stormwater.
Stormwater
Picture the last rain storm that you remember in Southern California. Was there gentle rain for
a long time? Or was there a short burst of rainfall? When there is an entire day (or even just an
afternoon) of gentle rain, the rain is usually able to infiltrate into the ground, and eventually
recharge the aquifers beneath the surface. But much of the rainfall that we receive in California
is in bursts with heavy downpours and then days, weeks, and even years of nothing. This type
of heavy rain results in a lot of run off. Stormwater is run off that can be captured.
Stormwater becomes a problem when it encounters a lot of impervious surfaces, such as
asphalt and concrete. These surfaces may hold visible pollutants (e.g., trash, dog poop) and
invisible residues (e.g., pesticides, herbicides). When stormwater encounters impervious
surfaces and pollutants, it turns can drain pollutants into storm drains and eventually the
ocean.
What slows down stormwater? Vegetation and pervious surfaces. These sorts of textured
surfaces allow water to infiltrate the soil. Parkways, the area in between the sidewalk and the
street, can slow water from running off properties and into the street. Planter beds near
36 Laura Allen, “Greywater in the Real World: A Study of 83 Greywater Systems” (presentation made at Water Smart Innovations, Las Vegas, Nevada, October 2013). https://www.watersmartinnovations.com/documents/sessions/2013/2013-W-1335.pdf

45 | W a t e r S u p p l y
downspouts can let water percolate rather than run into the street. Plants, whether shrubs, or
groundcover, or even trees, can slow water down on slopes and hillsides.
What about rain barrels? Aren't they a good way to capture stormwater? Rain barrels are
typically used on a residential site to capture water that comes off the roof through the rain
gutters. In many parts of the country, rain barrels work well because the water needs of the
plant correspond to the times when there are heavy rains. In much of California, the rainfall
occurs in the cooler times of the year when the plant water needs are minimal. This means that
water in a rain barrel must be stored for lengthy periods of time. And this is where we run into
issues with creating the perfect habitat to breed mosquitoes - it’s still water available for
irrigation, but it may be there for more than 4-7 days, which is all mosquitoes need to breed.
There are other (and better) ways to capture rainfall. On a small scale keeping vegetation on
hillsides and parkways, directing downspouts to planter beds, and keeping lots of green plants
will decrease stormwater run-off. On a larger scale, stormwater can be captured within a
neighborhood. Several neighborhoods within Los Angeles are tackling this. Elmer Avenue in Los
Angeles has a stormwater capture area. Catch basins with soft bottoms allow water to
percolate into the groundwater rather than re-enter the stormwater system and get flushed
into the ocean. There are also bioswales in the yards near the catch basin to slow the water and
allow it to infiltrate rather than run off.37
Desalination
You may hear desalination or “desal” frequently touted as the solution to all water supply
problems. You may wonder why there are not more desalination plants around if it is such the
perfect solution. Good question—read on.
There are two primary methods of desalination: thermal and membrane. In thermal
desalination, water is heated in a boiling chamber, it then condenses in a dome, and collects in
a chamber leaving all the salt behind. In membrane desalination, seawater is screened, filtered,
and pushed through a reverse osmosis membrane under high pressure, and then the distilled
water is treated to drinking water standards. These methodologies aren’t that complicated, but
they do tend to use large amounts of energy, leading to a high cost.
For both methods of desalination, there are similar hurdles:
Seawater intake - Seawater needs to be removed from the ocean very carefully so as not to
hurt plant and animal life. Typically, a speed slower than the ocean current is best.
Power consumption – Typically, the reverse osmosis process uses the most energy, which
contributes to the highest costs
37 Amy Quinton, “Stormwater Capture: California’s Untapped Supply,” Capital Public Radio http://www.capradio.org/articles/2015/06/23/stormwater-capture-californias-untapped-supply/ (accessed 5/18/16)

46 | W a t e r S u p p l y
Brine - While brine can be returned to the ocean, most plants and animals thrive in a small
range of salinities. There may be environmental consequences associated with creating
areas of higher than normal salinity.
Santa Barbara, California, provides an interesting case study in desalination work. As a result of
the drought in the 1980s, the City of Santa Barbara along with Montecito and Goleta
constructed a desalination facility with a capacity of 7,500 acre feet per year (AFY) with
expansion to 10,000 AFY. Construction costs of $34 million were shared based on proportions
of water provided for the City of Santa Barbara of 3,181 AFY, Montecito of 1,250 AFY and
Goleta of 3,069 AFY.38
By the time the desalination facility was built, the drought had ended and a period of heavy
rainfall had begun. The plant operated for March, April, May and June of 1992 during and after
a time of heavy rainfall. Then the desalination plant was put on standby. After it was paid off
over 5 years, Goleta and Montecito decided not to renew the contract and subtracted
desalination from their water supply portfolio.39
Santa Barbara has recently decided to re-activate the desalination plant as the sole funder of
this enterprise. The facility will produce 3,125 acre-feet per year or roughly 30% of Santa
Barbara's water supply in a year. In terms of hurdles, the intake is 2,500 feet off shore with
openings of 1 millimeter and takes in water at a rate of 0.5 feet per second, which is slower
than the existing current. Additionally, the power consumption for reverse osmosis has
decreased by 40% since the facility was designed. 40 The brine has twice the salinity of seawater
and will be discharged at an outfall shared with the wastewater treatment facility. A study was
recently completed with Scripps Institute of Oceanography, which suggested the city can
comply with discharge requirements. 41
It probably goes without saying, but let's say it anyway: desalination is more appropriate for
coastal communities, such as Santa Barbara, San Diego or Santa Cruz. For an inland community
to fund desalination, the inland community would also be evaluating an expensive pipeline to
transport water or negotiating a water exchange with a coastal community in order to avoid
building the pipeline. Proximity to the source is everything in desalination.
38 City of Santa Barbara, Public Works, “Desalination,” http://www.santabarbaraca.gov/gov/depts/pw/resources/system/sources/desalination.asp (accessed 5/15/17) 39 Ibid, (accessed 5/15/17) 40 City of Santa Barbara, "Desalination Facility Update " http://www.santabarbaraca.gov/civicax/filebank/blobdload.aspx?BlobID=170771 (accessed 5/15/17) 41 Ibid, (accessed 5/15/17)

47 | W a t e r S u p p l y
Alternative Supply
What is it? What are the benefits?
What are the drawbacks?
System-wide Opportunities?
Desalinated water
Potable water that was ocean or brackish water that has the salt removed to make it potable
A drought-proof supply
Generally, the most expensive source of supply. Disposal of the brine can be problematic. High energy use.
Yes
Gray water Non-potable household wastewater, including water from the washing machine, shower, bathroom sinks, that is held and reused; excludes blackwater, which is water from toilets and kitchen sinks
Cost-effective method for residential irrigation
Supply and demand must be balanced. Easy to end up with too much supply Water can contain pathogens.
No
Recycled water Non-potable water that is treated wastewater that is used for irrigation, groundwater replenishment and as a barrier against seawater intrusion
Non-potable use of water; can recharge groundwater
Expensive; requires separate plumbing system of purple pipes
Yes
Stormwater Non-potable water that is runoff from precipitation (rain or snowmelt) that flows overland; may mobilize pollutants
Can recharge groundwater
Must be captured, retained and allowed to percolate
Yes
48 | W a t e r S u p p l y
Try It!
1. A coastal community in Southern California is considering diversifying their water supply
with an alternative water supply. Which type of water supply is considered “drought-
proof”? Why?
2. An inland community is looking for an alternative supply to use for recharge. Which type
of supply (ies) make sense to use for recharge? Why?
Key Terms
desalinated water – Potable water that was ocean or brackish water that has the salt removed
to make it potable; considered a drought-proof supply
gray water – Non-potable household wastewater, including water from the washing machine,
shower, bathroom sinks, that is held and reused; excludes blackwater, which is water from
toilets and kitchen sinks
recycled – Non-potable water that is treated wastewater that is used for irrigation,
groundwater replenishment and as a barrier against seawater intrusion
stormwater – Non-potable water that is runoff from precipitation (rain or snowmelt) that flows
overland; may mobilize pollutants

49 | W a t e r S u p p l y
Part Three: Demand-Side Management In Part Three, you will shift from supply-side to demand-side management. When we manage
the water demand, which is to say the water “need” or water “consumption” you tend to lessen
the need for supply-side management. That is to say, if you can get people to need less water,
you do not need to go out and find more water for them to use. In Part Three, we will cover:
Regulations that affect conservation in California
Water loss
Water rates
Indoor water use and conservation
Outside water use and conservation
CII water use and conservation
Social marketing campaigns
Everything listed above addresses ways of decreasing demand for water, whether it is a
regulation that mandates watering schedules, an aggressive leak detection program run by a
water district, higher water rates for higher consumption or toilet rebates.
There are many ways to control demand of water. One of the most effective ways is with
regulation. This frequently isn’t what people expect to or want to hear, but between statewide
legislation, statewide mandates from the Water Resources Control Board and California
Building Code requirements, demand was substantially regulated during the drought in
California. In this section, you will:
analyze potential outcomes of the requirements of SBX7-7
identify the prohibited measures by the State Water Resources Control Board
interpret requirements of building codes in California for water conservation

50 | W a t e r S u p p l y
Section 3.1 Regulations SBX7-7
For many years, water agencies conducted water conservation programs as public outreach.
They often set goals of fairly minimal savings over long periods of time—in other words, goals
that were easy to achieve. Rebates were intended to help people save water, but also make
them feel good and appreciate the water agency at the same time. Meanwhile, water agencies
often had their own revenues in mind. They did not want people to be wasteful with water, but
they also calculated a certain demand in order to set rates. They did not want too much
conservation without planning for a reduction in revenue.
SBX7-7 changed everything. In 2009, Governor Schwarzenegger signed into law SBX7-7, the
Water Conservation Act of 2009, which required retail water suppliers to determine their
baseline per capita water use and reduce water use by 20% of their baseline by 2020.42
What happens if a retail water supplier misses its target? Compliance with SBX7-7 determines
eligibility for state water grants and loans. Failure to meet the target establishes a violation of
law for administrative or judicial proceedings. This means a supplier wouldn’t be eligible for
many grants and loans that suppliers rely on to fund infrastructure, and could have legal actions
taken against it.
No doubt in 2020 some water suppliers will not meet SBX7-7 goals either intentionally or
unintentionally. What will actually happen to them? Sometimes it is worth making a distinction
between agencies that are making an effort and those that are deliberately ignoring the law.
Some may be penalized with proceedings and some may not be because they made a good
faith effort. This will be interesting to see.
State Water Resources Control Board Mandatory Measures
While SBX7-7 set a long-term goal of 20% by 2020, in July of 2014, mandatory measures from
the State Water Resources Control Board (SWRCB) were enacted to combat the severity of the
drought. The table below walks you through the executive and regulatory decision about the
drought.
42 California, Department of Water Resources, “SB X7-7,” http://www.water.ca.gov/wateruseefficiency/sb7/ (accessed 6/11/17)

51 | W a t e r S u p p l y
43 California, Office of Edmund G. Brown, Junior, “Governor Brown Declares Drought State of Emergency,” https://www.gov.ca.gov/news.php?id=18368 (accessed 5/18/17) 44 California, Office of Edmund G. Brown, Junior, “Governor Brown Issues Executive Order to Redouble State Drought Actions,” https://www.gov.ca.gov/news.php?id=18496 (accessed 6/18/17) 45 California, State Water Resources Control Board, “State Water Board Approves Emergency Regulation To Ensure Agencies and Residences Increase Water Conservation,” http://www.swrcb.ca.gov/press_room/press_releases/2014/pr071514.pdf (accessed 6/18/17) 46 California, State Water Resources Control Board, “State Water Board Expands and Extends Emergency Water Conservation Regulation,” http://www.swrcb.ca.gov/press_room/press_releases/2015/pr031715_renewed_emergency_wtr_regs.pdf (accessed 7/8/17 47 California, Office of Edmund G. Brown, Junior, “Governor Brown Directs First Ever Statewide Mandatory Water Reductions,” https://www.gov.ca.gov/news.php?id=18910 (accessed 7/8/17) 48 California, State Water Resources Control Board, “State Water Resources Control Board Resolution 2015-0032,” http://www.waterboards.ca.gov/board_decisions/adopted_orders/resolutions/2015/rs2015_0032.pdf (accessed 7/8/17)
January 2014 Governor Brown declared a drought state of emergency.43
April 2014 Governor Brown signed an Executive Order (April 2014 Proclamation), which asked for reductions of 20% by all Californians with an emphasis on outdoor conservation. The order prohibited HOAs from punishing homeowners who limit their watering,44
July 2014 State Water Resource Control Board (SWRCB) asked for mandatory reductions with an emphasis on outdoor reductions.45
March 2015 SWRCB adopted an expanded mandatory emergency conservation regulation, which prohibited:
non-recirculating fountains
hosing sidewalks and driveways to clean
washing a car without a shut-off nozzle
run-off from over-irrigating Water suppliers are tasked with enforcement and ordered to report data monthly to the SWRCB.46
April 2015 Governor Brown directed the SWRCB to implement mandatory water reductions in urban areas to reduce urban use overall by 25% compared to 2013. Instructions to the SWRCB included considering relative per capita water usage of each supplier’s service area and requiring areas with higher use to cut consumption more.47
May 2015 SWRCB adopted an emergency conservation regulation with residential gallons per capita per day (R-GPCD targets).
January 2016 Mandatory measures are extended through October 2016 with adjustments to R-GPCD possible for suppliers for climate and growth.
May 2016 Prohibited measures described above become permanent. Water suppliers are allowed to “self-certify” their conservation targets by analyzing their water demand (average of 2013 and 2014) and their water supply and using a target for any shortfall. 48

52 | W a t e r S u p p l y
So while SBX7-7 concentrated on long-term conservation goals compared to a baseline of total
water production, the SWRCB mandatory measures concentrated on short-term conservation
goals, particularly in the residential sector and particularly outdoors.
The goals (or targets) were widely criticized for not being fair. This is usually referred to as
having "equity issues." While the SWRCB separated out commercial, industrial and institutional
water use and concentrated strictly on a residential water reduction, it tended to penalize the
water suppliers with higher per capita consumption with larger goals. Water suppliers with
higher per capita consumption tended to be inland areas with higher water demand—meaning
it was simply hotter inland and the plant water needs were much greater.
And then the winter of 2017 was wet. In Northern California, it was unbelievably wet breaking
records49. In Southern California, it was slightly wetter than average. In the Santa Clarita Valley,
while it "felt" like a break from the drought, you can see that Water Year 16/17 (October 2016 –
September 2017) was only slightly wetter than average with around 20 inches of rain for the
entire year.
Is the drought over? Certainly if you rely on imported water from the State Water Project, there
was plenty of water in 2017. But most Southern California communities that used groundwater
still found their groundwater supplies below average. For some parts of Southern California,
including Ventura and Santa Barbara Counties, the drought was definitely not over. Looking at
the graph above, would you say the drought was over in the Santa Clarita Valley?
49 "Janburied: Snow Breaks Records in Sierra Nevada," https://weather.com/news/weather/news/record-january-snow-sierra-mammoth-mountain-california (retrieved 7/8/17)
Used with permission of Castaic Lake Water Agency

53 | W a t e r S u p p l y
As of this writing, the State Water Resources Control Board is implementing targets by service
area to include an indoor component, a landscape component, a water loss requirement and
separate measures for commercial, industrial and institutional users. 50
Building Codes
What type of regulations govern the building of a home? In terms of water use, how does a
developer decide what type of toilet to use? Or aerators to install? Or landscaping to put in?
These sorts of choices are governed by layers of codes, including city, county, state, and federal.
In most instances, when there are overlapping standards, the most stringent apply.
Cal Green Building Code (2014 update)
Indoors Water Use
Toilets 1.28 gallons per flush
Showerheads 2.0 gallons per minute at 80 psi
Bathroom faucets 1.2 gallons at 60 psi
Kitchen faucets 1.8 gallons at 60 psi
Outdoor
Controllers All controllers shall be weather-based or soil-moisture-based and shall have a rain shut off
51
All of the indoor devices listed above have a specific flow or flush rate. This is the rate from the
manufacturer and may not be the rate in real life. Toilets, for example, leak over time, and may
use more than 1.28 gallons per flush. Similarly, faucets have a rating at 60 pounds per square
inch, but it is entirely possible to have more pressure inside a house, and use more water
because of it.
Building codes are very useful in driving long-term demand downwards, primarily inside the
home. In California; if there was a change to the code that forbid turf grass from being installed
in new homes, demand could be driven down further outside rather than simply relying on
controllers.
50 California, Department of Water Resources. "Making Water Conservation a California Watery of Life," http://www.water.ca.gov/wateruseefficiency/conservation/docs/20170407_EO_B-37-16_Final_Report.pdf (retrieved 7/8/17) 51 California, Department of General Services, “2016 CalGreen Residential Mandatory Measures,” https://codes.iccsafe.org/public/public/chapter/content/2057/?chapter_name=CHAPTER+4+-+RESIDENTIAL+MANDATORY+MEASURES(accessed 7/8/17)

54 | W a t e r S u p p l y
The graph above shows the savings in 2020 in the Santa Clarita Valley as a result of various
measures, including incentives (rebates), plumbing code and standards, pricing and water loss
reduction. Note that 9% of the savings are from conservation pricing and 25% of the savings are
from plumbing codes and standards. These are powerful ways to drive demand down
Try It!
Conduct a quick inventory of a bathroom at home. What can you tell about the flow rate of
these devices?
Toilets _____ gallons per flush
Showerheads _____ gallons per minute at 80 psi
Bathroom faucets _____ gallons at 60 psi
1. Which type of regulation (SBX7-7, SWRCB restrictions, or Building Code) do you think
will result in the most savings over time?
2. Which measure prohibited by the SWRCB would be the most difficult for customers to
prevent?
Image used with permission of Castaic Lake Water Agency
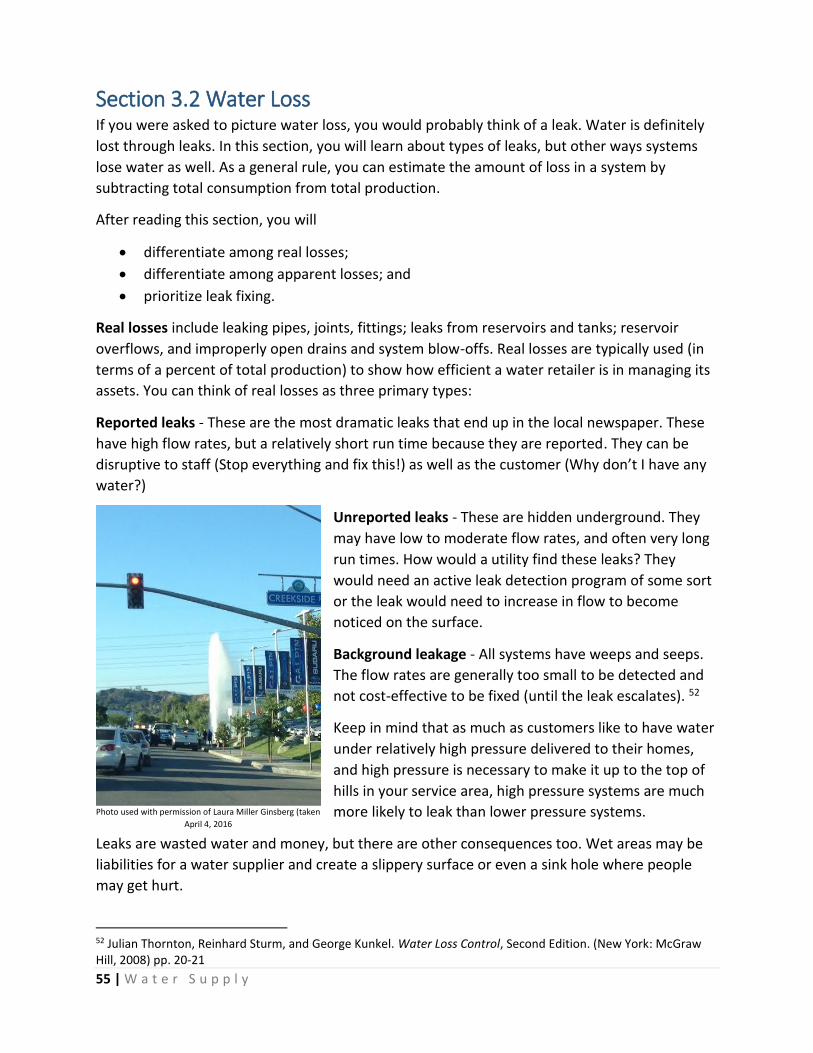
55 | W a t e r S u p p l y
Section 3.2 Water Loss If you were asked to picture water loss, you would probably think of a leak. Water is definitely
lost through leaks. In this section, you will learn about types of leaks, but other ways systems
lose water as well. As a general rule, you can estimate the amount of loss in a system by
subtracting total consumption from total production.
After reading this section, you will
differentiate among real losses;
differentiate among apparent losses; and
prioritize leak fixing.
Real losses include leaking pipes, joints, fittings; leaks from reservoirs and tanks; reservoir
overflows, and improperly open drains and system blow-offs. Real losses are typically used (in
terms of a percent of total production) to show how efficient a water retailer is in managing its
assets. You can think of real losses as three primary types:
Reported leaks - These are the most dramatic leaks that end up in the local newspaper. These
have high flow rates, but a relatively short run time because they are reported. They can be
disruptive to staff (Stop everything and fix this!) as well as the customer (Why don’t I have any
water?)
Unreported leaks - These are hidden underground. They
may have low to moderate flow rates, and often very long
run times. How would a utility find these leaks? They
would need an active leak detection program of some sort
or the leak would need to increase in flow to become
noticed on the surface.
Background leakage - All systems have weeps and seeps.
The flow rates are generally too small to be detected and
not cost-effective to be fixed (until the leak escalates). 52
Keep in mind that as much as customers like to have water
under relatively high pressure delivered to their homes,
and high pressure is necessary to make it up to the top of
hills in your service area, high pressure systems are much
more likely to leak than lower pressure systems.
Leaks are wasted water and money, but there are other consequences too. Wet areas may be
liabilities for a water supplier and create a slippery surface or even a sink hole where people
may get hurt.
52 Julian Thornton, Reinhard Sturm, and George Kunkel. Water Loss Control, Second Edition. (New York: McGraw Hill, 2008) pp. 20-21
Photo used with permission of Laura Miller Ginsberg (taken
April 4, 2016

56 | W a t e r S u p p l y
Misconception Alert! Many people think of real losses as the only type of losses. But there are losses that occur in all sorts of ways, which you’ll learn about below. Imagine what has to happen from the meter read to the actual delivery of the bill. Inaccuracies can be introduced in any number of ways.
Real losses are not the only source of leaks; they are just the most obvious ones. Water can be
lost because of under-recording customer meters or theft. These are considered apparent
losses. With an apparent loss, water may not be actually lost from the system. You can think of
apparent losses as stemming from these sources:
1. Customer metering inaccuracies - It is considered a best practice for all connections
to be metered (though in some communities this is certainly not the case). Metering
allows customers to make a connection between volume of water used and cost of
water. It also provides information for water resource planners in terms of
consumption trends. As meters age, they slow down. Without a meter replacement
program, a water utility could easily be under billing based on customer metering
inaccuracies.
2. Customer billing system errors and data handling errors - Think of the process to get
information from the customer meter to the customer water bill - there are a
number of steps, including the actual read of the meter and transfer of information
into customer information system to billing. At any point in data transfer, an error
can occur, but data errors can also be introduced in analysis if estimates are used or
accounts are closed or not transferred between customers.
3. Unauthorized consumption - You would be surprised how much water is stolen! Yes,
intentionally stolen! This could be an illegal opening of a fire hydrant, illegal
connection or tampering with a meter. Some customers will reactivate their own
service connection after the service connection has been terminated for non-
payment.53
As you can see, there are a half dozen ways a water utility can lose water. The biggest reason
for recovering water lost through real and apparent losses is revenue. This is literally money
that is lost, whether it is by a medium-sized leak under ground, a broken main above ground,
theft, or meter reading errors. Other than weeps and seeps, all of these losses can be fixed,
and usually cost-effectively.
53 Julian Thornton, Reinhard Sturm, and George Kunkel. Water Loss Control, Second Edition. (New York: McGraw Hill, 2008) pp. 25-29

57 | W a t e r S u p p l y
Try It!
1. If a water agency tracks the difference between consumption (the sum of all meter reads)
and production (the sum of all water pumped from the ground or imported), would the
difference between consumption and production be real or apparent losses?
2. What is the relationship between pressure and leaks?
3. What might be an argument to implement a leak detection program?
Key Terms
Apparent losses – losses from customer metering inaccuracies, customer billing system errors
and inaccuracies, and unauthorized consumption (theft)
Background leakage – weeps and seeps that have small flow rates and are not cost-effective to
fix
Real losses – leaking pipes, joints, fittings; leaks from reservoirs and tanks; reservoir overflows
and improperly open drains and system blow offs
Reported leaks – leaks that are reported with high flow rates, but short run times
Unreported leaks – leaks that are most likely hidden underground with moderate flow rates
and long run times

58 | W a t e r S u p p l y
Section 3.3 Water Rates Retail water suppliers generally include both a fixed and variable (volumetric) charge on a water
bill. The fixed charge is the same for each month regardless of the water consumption because
it is based on the size of the pipe coming in and the costs that remain the same for the water
agency; the variable rate is volumetric and based on consumption (water use). In this section,
you will
differentiate among types of water rates; and
classify rates according to whether they encourage conservation.
You can look at the ways that water suppliers can organize a volumetric rate structure:
Type of Rate Description Benefits Drawbacks
Uniform Rate a constant unit price for all volumetric water sales
Simple and perceived as equitable; easy to implement (not a lot of math!); some revenue stability
Not much of a conservation signal
Declining Block Rates the unit price for each block of water use is charged at a lower unit rate than the previous block
High-water users benefit from lower rates than in other structures
Perceptions of inequity, does not encourage conservation; complicated to design
Increasing Block Rates
the unit price for each block of water use is charged at a higher unit rate than the previous block
Encourages conservation
Perceptions of inequity; complicated to design
Seasonal Rates the unit price varies by time period (generally a higher price during peak demand months)
Encourages conservation
Complicated to design and administer
The common wisdom is to encourage conservation, you need to make people aware of how
much water they use, and increase the price as they use more. In this way, customers get a
price signal to be conscious of their water use and are intentional about their water use and
conserving.
You can see in the chart above, two rate types (uniform and declining block rates) do not
encourage conservation. They actually could encourage an increase in demand. Why do these
rate types exist? A uniform rate exists for one reason: equity (or perceptions of equity). A
uniform rate treats the smallest customer and the largest customer exactly the same with the

59 | W a t e r S u p p l y
same volumetric rate. A declining block rate exists when the agency wants to increase water
use, presumably by commercial and industrial users who would benefit.
Why not increase rates across the board to increase conservation? Rates are considered
governed by Proposition 218 and have to go through a public process that ties the rates to
actual costs from the water retailer. In short, a water retailer cannot charge more than
proportional costs of the water per parcel served. This means that the water retailer can’t
charge high fees just because it wants to decrease consumption overall. 54
In the case of Capistrano Taxpayers Association v. City of San Juan Capistrano, the trial court
decided that the City of San Juan Capistrano had not provided enough justification for their
costs for the higher tiers. This has been interpreted by some as making tiered rates illegal, but
this isn’t really the case. Rate calculations need to be able to be justified by the cost of service.
If it is costing a significant amount more to purchase an additional source of expensive supply
because of high water users, these costs can be passed on to the high water users. But you
can’t simply charge high water users more because you want to decrease their consumption.
Misconception Alert! Many people disregard the fixed charge on their bills and focus on the volumetric charges. While the volumetric charges are a measure of how much water is used, they may not actually be the bulk of the cost. Much of the cost may be in the fixed charge. There is just very little you can do about the fixed charge.
Try It!
1. Check out your water bill. How are you billed? Is there a fixed and volumetric rate? What
type of rate is the volumetric rate?
2. What types of rates will encourage conservation? Why?
Key Terms
Declining block rates – the unit price for each block of water is charged at a lower unit rate
than the previous block
Increasing block rates – the unit price for each block for water use is charged at a higher unit
rate than the previous block
Proposition 218 – the legislation that governs the public process for rate setting
54 California, Legislative Analyst’s Office, “Understanding Prop 218,” http://www.lao.ca.gov/1996/120196_prop_218/understanding_prop218_1296.html (accessed 5/25/16)

60 | W a t e r S u p p l y
Seasonal rates – the unit price varies by time period, generally with a higher price during peak
demand months
Uniform rates – a constant unit price for all volumetric water sales

61 | W a t e r S u p p l y
Section 3.4 Indoor Water Use When you start to talk to people about conservation, they generally want to discuss ways of
reducing their indoor water consumption, particularly bathing less. This is a problem - most of
the water in the residential sector in California is used outside! And, frankly, no one in
conservation wants to decrease basic hygiene of the general public. Still, indoor water use and
conservation is not a bad place to start because it is a place people are very familiar with.
In this section, you will
analyze indoor water consumption; and
audit and track your own indoor water use.
In the graph below, based on real data from residential homes, you can see that toilets are the
biggest users of water in the home, followed by showers and faucets, and then clothes washers.
Surprisingly, 14% of all water metered to the home is also lost to leaks. That puts an interesting
spin letting a leaky faucet drip. It’s using only a little less water than your faucets!
Let’s return to our inventory of your bathroom fixtures. What did you discover when you
inventoried your bathroom?
Toilets _____ gallons per flush
Showerheads _____ gallons per minute at 80 psi
Bathroom faucets _____ gallons at 60 psi
Toilets
How many gallons does your toilet use?
Residential Indoor Demand by the EPA is in the public domain

62 | W a t e r S u p p l y
Sometimes it is difficult to tell how many gallons per flush a toilet has by
observation. But if you remove the tank lid, often the number of gallons
per flush is stamped somewhere on the inside of the tank at the top. In
some toilets, you can also find the gallons per flush on the flat surface
behind the seat lid. And, of course, in a store, the gallons per flush is
written on the box. If you are browsing in a store, a toilet with the
WaterSense label guarantees that the product is 1.28 gallons per flush. 55
In the United States (as of 2017), you can purchase 1.6 gallon per flush
toilets in most states, which is the federal standard, but in California, you
can only purchase 1.28 gallon per flush toilets. This is 20% less water
used per flush. (1.28 compared to 1.6). Yuck! you may say. That’s not enough water. Actually,
it’s plenty. Some of us remember the early 1990s, which was the time “low-flush” (a.k.a. low-
flow) toilets came on the market in California. These were the first toilets that used 1.6 gallons
per flush. Unfortunately, most of them were not re-engineered from the 3.5 gallon per flush
toilets of the previous generation. A 1.6 gallon per flush toilet was pretty much a 3.5 gallon per
flush toilet with less water. And these did not work well. Water agencies up and down the state
of California had to deal with angry customers who felt that the water agency rebate had
“recommended” a toilet with poor performance. No one wants a repeat of this. The current
1.28 gallon and 1.6 gallon per flush toilets work well. To check the performance rating of your
toilet, see map-testing.com for an entire database of toilet rankings.
Toilet-Related Conservation
Toilet rebates are a “classic” conservation program and a favorite of many in conservation.
Why? The toilet stays in place for a long time. The savings are essentially “hard-wired” into the
home. In this type of rebate program, a customer buys an approved product from a list, and the
water agency gives a check or a credit on the bill after the purchase of the toilet. In order to
receive the credit or check, the customer must present the receipt and purchase from the list.
The approved list is important. It is a best practice to only rebate fixtures that are more efficient
than what is standard in the market. Otherwise, you are essentially rebating for people to
replace something with a fixture they would have purchased anyway. So if a high-efficiency
toilet (1.28 gallons per flush) is on the market, customers shouldn’t be rebated for purchasing it
because you are not incentivizing an increase in efficiency. They should be rebated for
purchasing an ultra-high-efficiency toilet (1.0 gallon per flush or less).
Sometimes retail water suppliers will run a one-day toilet giveaway program. In this
conservation program, people come to a central location, such as a big park, and pick up a new
toilet after providing a driver’s license for identification purposes and a water bill (with a
matching name). They are allowed to take the toilet home, but they must return two weeks
later to drop off the old toilet to the park (in a giant dumpster) or they will be charged for the
55 U.S. Environmental Protection Agency, WaterSense, “Toilets,” http://www3.epa.gov/watersense/products/toilets.html (accessed 7/8/17)
WaterSense Label by the EPA is in the public domain

63 | W a t e r S u p p l y
new toilet on their bill. This guarantees (almost!) that the new toilet is installed at the home in
the service area. This is one model for success, but involves a lot of coordination and disposal of
old toilets.
Misconception Alert! You have probably heard, “If it’s yellow, let it mellow. If it’s brown, flush it down.” Do not do this. Please keep flushing your toilets. This is advice from the 1980s when toilets used 3.5 gallons per flush or more. It wasn’t bad advice then (though still sort of gross), but it’s terrible advice now. Upgrade your old toilet with a 1.28 gallon per flush toilet and keep flushing. We don’t want to keep waste in our homes, and if you have kids, it’s a hard-to-break habit if they learn not to flush. Keep flushing!
Showerheads
It may be hard to tell how many gallons per minute a showerhead uses just by looking at it.
Many showerheads are labeled with this information, but calcium and magnesium in hard
water build up to obscure the numbers. In the United States, you can buy showerheads with up
to a 2.5 gallons per minute rating, but in California, the only showerhead you can buy is 2.0
gallons per minute or less. To earn a WaterSense label, a showerhead would also need to use
2.0 gallons per minute or less.
Shower-Related Conservation
Many water agencies have giveaway programs with showerheads. One of the
challenges with a giveaway program is that the water agency typically does not
know that the product is installed properly (or installed at all). So the water
agency may “count” on the savings from purchasing and distributing
showerheads, but not necessarily receive the savings as a decrease in overall
consumption.
Additionally, and equally problematic to conservation program design,
showers are seen as “sacred” by many people. It’s their “me” time and they do
not want you to mess with their shower, including affecting the quality with a
sub-par showerhead and length of shower.56
Washing Machines
A traditional style washing machine uses 40-50 gallons per load of laundry. That’s a lot! A high-
efficiency washing machine uses about half of that (20-25 gallons). That’s a significant savings.
But, of course, high-efficiency washing machines cost more - typically $200 more than a
traditional machine (as of 2016). A high-efficiency machine typically soaks the clothes longer to
56 U.S. Environmental Protection Agency,” Showerheads” http://www3.epa.gov/watersense/products/showerheads.html (accessed 5/26/16)
Shower Better image by the EPA is in the public
domain

64 | W a t e r S u p p l y
remove stains and dirt rather than using a central agitator. The loads of wash may take longer
in a high-efficiency machine.
Washing-Machine-related Conservation
Many water agencies operate washing machine rebates, which offer a rebate of $100-300 to
make the purchase more cost-effective for consumers. Washing machines rebates have mostly
replaced toilet rebates in popularity in California. While it’s possible that a customer may
receive the rebate and move out of the water agency’s service area, it’s also equally possible
that a customer may move in with a high-efficiency machine already.
Faucets
A standard faucet purchased in the United States uses
2.2 gallons per minute. A WaterSense approved
faucet will use 1.5 gallons per minute. Aerators can be
added to standard faucets to inject air into the water
flow and make the flow seem fuller with less water.57
Faucet-related Conservation
Aerators are typically available at water agencies for
free and are given away at events. As with
showerheads, aerators are difficult to track and
impossible to make sure they are installed properly. They can also present problems in
giveaway programs in that customers may need a male or female threaded aerator, but take
one of each to hedge their bets.
Audits
Do you remember the table where you quantified your measurements of indoor fixtures? An
“audit” is really an extension of that exercise. You make a list of all the water-using fixtures in
the house, quantify their use, decide on a number of times per day, and come up with a total.
Completing the table below will help you audit your own home.
57 U.S. Environmental Protection Agency, WaterSense, “Bathroom Sink Faucets,”
http://www3.epa.gov/watersense/products/bathroom_sink_faucets.html (accessed 5/26/16)
Image of sink faucet by the EPA is in the public domain
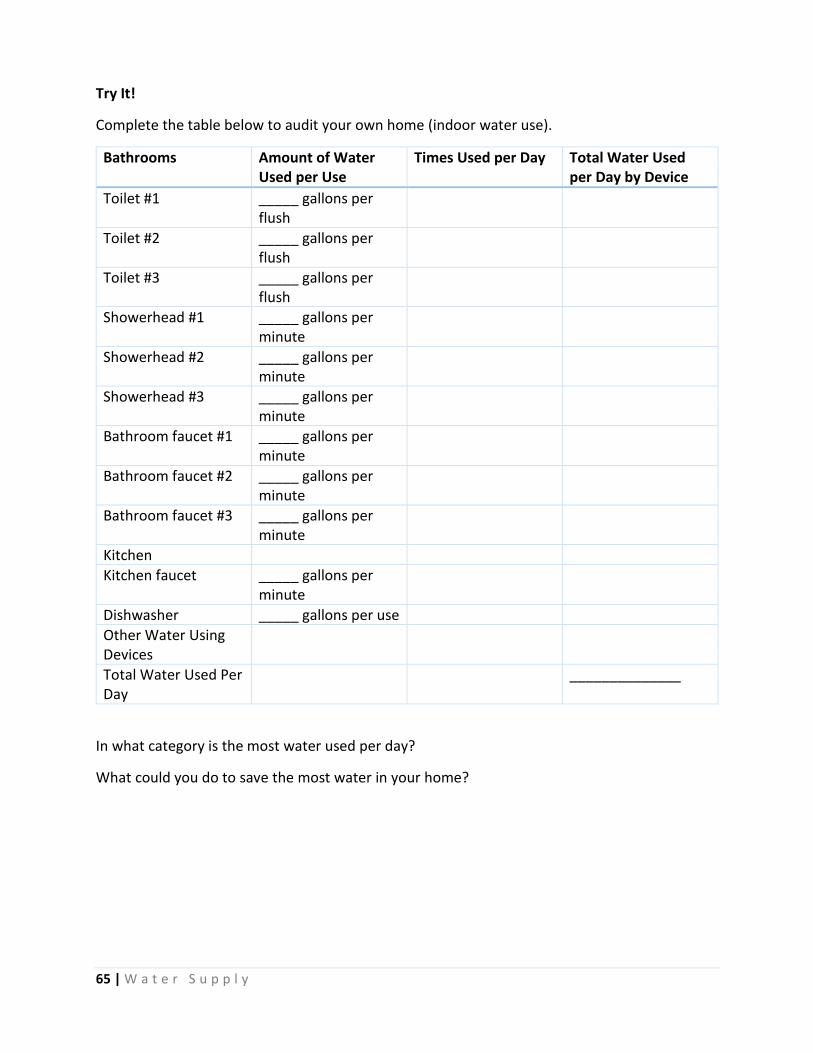
65 | W a t e r S u p p l y
Try It!
Complete the table below to audit your own home (indoor water use).
Bathrooms Amount of Water Used per Use
Times Used per Day Total Water Used per Day by Device
Toilet #1 _____ gallons per flush
Toilet #2 _____ gallons per flush
Toilet #3 _____ gallons per flush
Showerhead #1 _____ gallons per minute
Showerhead #2 _____ gallons per minute
Showerhead #3 _____ gallons per minute
Bathroom faucet #1 _____ gallons per minute
Bathroom faucet #2 _____ gallons per minute
Bathroom faucet #3 _____ gallons per minute
Kitchen
Kitchen faucet _____ gallons per minute
Dishwasher _____ gallons per use
Other Water Using Devices
Total Water Used Per Day
______________
In what category is the most water used per day?
What could you do to save the most water in your home?

66 | W a t e r S u p p l y
Section 3.5 Outdoor Water Use How much water is used outdoors? Most estimates for outdoor water use in the United States
suggest that it is more than 50% of all water used for residential use.58 In general, the hotter
the locale, the more water is used for landscaping.
In this section, you will:
identify the benefits and needs of landscape;
differentiate among types of irrigation;
classify plants according to their watering needs; and
design a landscape with best practices in mind.
Why don’t we get rid of all the landscape, cover the ground with cement, and save all that
water? Landscape serves a variety of purposes, and is considered a beneficial use of water.
After all, plants make oxygen, and we humans love oxygen. Plants also lower the air
temperature. An entirely paved landscape would be a hot one - check out the center of a
parking lot in the summer. And soil acts as a giant sponge, absorbing and filtering water, which
eventually allows for aquifers to replenish. So, keeping landscape is a given, and acknowledging
that live plants in the landscapes need water is important. However, choosing a waterwise
landscape and giving it just the water it needs is essential.
Couldn’t all of our irrigation problems be solved if we saved the rainwater that falls from the
sky? Doesn't that just go to waste if it runs into the ocean? We do save it in both surface
reservoirs and in groundwater aquifers. Water isn’t wasted if it infiltrates. And even when it
runs into the ocean, it is still part of the water cycle.
Sometimes, rain barrels are presented as the perfect solution to irrigating landscape. However,
rain barrels bring with them a host (no pun intended) of other problems, including providing
the perfect breeding ground for mosquitoes. We are poised on having a worldwide explosion
of babies with microcephaly, caused by the Zika virus, which is spread by mosquitoes.
58 .U.S. Environmental Protection Agency, WaterSense, “Outdoor Water Use in the United States,”
https://www3.epa.gov/watersense/pubs/outdoor.html (accessed 5/22/16)
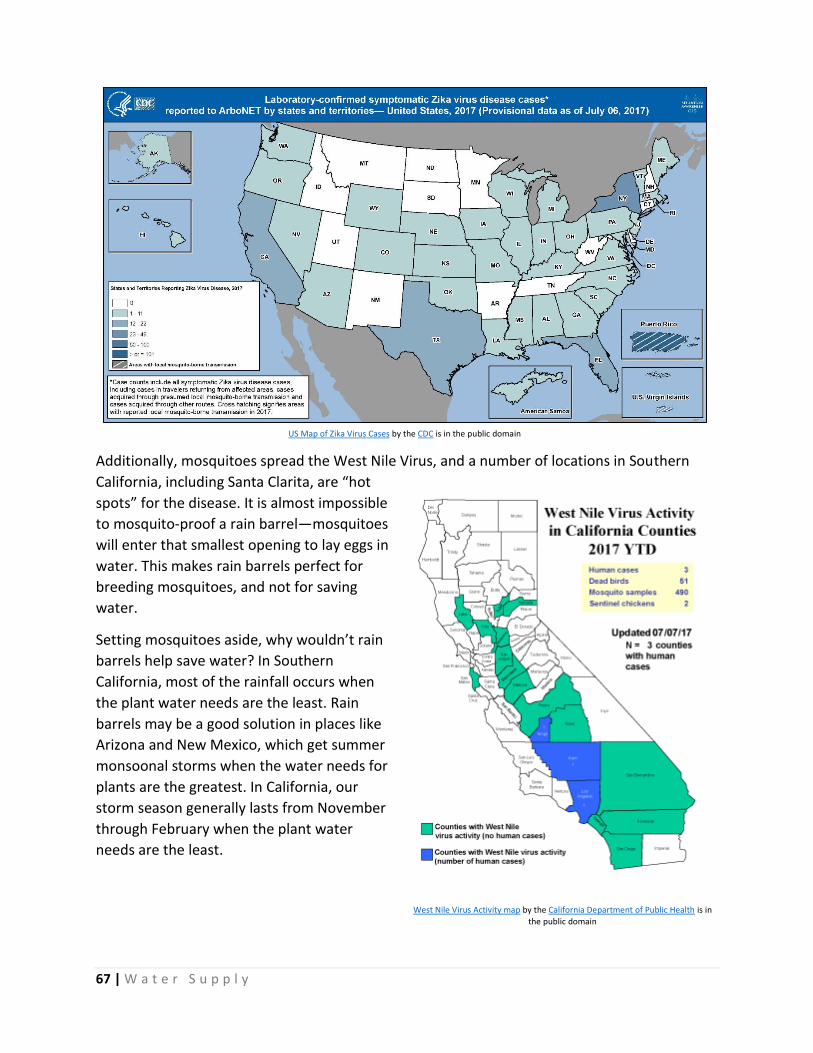
67 | W a t e r S u p p l y
Additionally, mosquitoes spread the West Nile Virus, and a number of locations in Southern
California, including Santa Clarita, are “hot
spots” for the disease. It is almost impossible
to mosquito-proof a rain barrel—mosquitoes
will enter that smallest opening to lay eggs in
water. This makes rain barrels perfect for
breeding mosquitoes, and not for saving
water.
Setting mosquitoes aside, why wouldn’t rain
barrels help save water? In Southern
California, most of the rainfall occurs when
the plant water needs are the least. Rain
barrels may be a good solution in places like
Arizona and New Mexico, which get summer
monsoonal storms when the water needs for
plants are the greatest. In California, our
storm season generally lasts from November
through February when the plant water
needs are the least.
US Map of Zika Virus Cases by the CDC is in the public domain
West Nile Virus Activity map by the California Department of Public Health is in
the public domain

68 | W a t e r S u p p l y
Best Practices in Landscapes
It is a much better idea to look beyond rain barrels and beyond eliminating landscape entirely
to principles that would help landscape use water more efficiently. These are practices that are
a compromise between what is called “all or nothing” thinking. You will hear a lot of this sort of
thinking as you hear people talk about their landscape. This is the sort of thinking that says, “If I
can’t have my grass in the front and backyard, then I’m going to pave over everything” or “If I
can only water twice a week, I’m just going to give up and let everything die.” In the next part,
you will learn a few of the principles that landscape professionals use to create and maintain
drought-tolerant landscapes. There is a middle ground between paving everything and having
no landscape and having turf grass everywhere.
Maintain the irrigation system - This means conducting a regular review of the system while it
is running to look for common problems (overspray, clogged nozzles, blocked heads). Much like
we learned in the section on alternative water supplies, including gray water, frequently
maintenance is a hurdle that homeowners do not want to overcome. If something needs
maintenance, such as a gray water system or an irrigation system, it may simply be avoided and
neglected. There is water-saving potential in conducting maintenance.
Mulch the exposed soil - Any surface that is not covered by a plant (or a six inch space around a
plant) should be covered with three to five inches of mulch. Mulch has a ton of benefits
including keeping the soil temperature more moderate (warmer in the winter and cooler in the
summer), preventing weeds from sprouting in soil and decreasing the evaporation. Mulch does
need to be raked periodically and re-applied year to year, but it makes a great improvement in
the aesthetics and health of a planted surface.
Hydrozone - The highest water use plants used in California landscapes are types of turf,
including cool season turf, which has slender blades of darker green color, and warm season
turf, which has wider blades of medium-green color. You can see in the table below how the
water needs, measured in evapotranspiration in inches per day, vary tremendously among
types of turf grasses. Typically, when someone admires a lawn, the lawn is Kentucky blue grass
or another cool season turf grass. There are low water using options, such as Buffalo grass,
which can easily use half as much water. But grass overall is still a very water thirsty plant.
Relative Ranking ET in inches/day Cool Season Warm Season
Very low < 0.24 Buffalo grass
Low 0.24-0.28 Bermuda grass Zoysia grass
Medium 0.28-0.33 Red fescue St. Augustine
High 0.33-0.39 Perrential Rye grass Kikuyu grass
Very high > 0.39 Annual bluegrass Kentucky blue grass Annual rye grass

69 | W a t e r S u p p l y
Hydrozoning or separating your plants by their water needs, helps you water the right amount
in each zone. In the table below, you can see how you might group plants according to their
high, moderate, low and very low water needs. Each plant is compared to a cool season turf
grass of 4-7 inches tall that is not stressed. This is the plant with the highest water need. Trees
and shrubs should be in their own zone. Anything drought-tolerant typically has a low water
need and should be in a separate zone. And anything with a very low water need typically does
not need irrigation. Note that a plant with moderate water needs only needs 40-60% of the
water of a cool season turf grass. That means that typically anything other than turf grass will
need half as much water - this is truly astounding.
Water Needs Percent of Reference ET Types of Plants
High 70-90% ET Most turf grasses
Moderate 40-60% ET Most trees and shrubs
Low 10-30% ET Drought-tolerant plants, like salvia (sages)
Very Low <10% ET Cacti
Irrigate deeply and water infrequently - Daily watering isn’t necessary for most plants,
including turf grass, even during the summer. Irrigation depends on a number of factors,
including:
Soil type - Both clay and sandy soil in your yard mean you must irrigate in short bursts and
allow water to sink in in between bursts. This is typically called cycle and soak because you
allow the controller to cycle on once and then let the water soak in before cycling on again.
Depth of roots - If you water grass multiple times a day, you train the grass to have short
roots, which mean the roots cannot reach other available water deeper in the soil. Try to
water less frequently to encourage deeper roots to grow.
Seasonal variation - Plants have greater water needs in the summer than the spring, fall or
winter. This is intuitive, but many people water the same amount of time all year round.
Types of plant material - Would you water your lawn and a cactus the same amount? Of
course not. But many people water everything in their yard the same amount, which usually
results in over-irrigation of most non-grass plants. This is why separating your yard into
hydrozones is so important.
Irrigation system type - Spray heads put out water much faster than rotating heads or than
drip irrigation - you need to understand this when you program your system. Spray heads
and rotating heads can be high-efficiency, meaning they apply water at a slower rate. Spray
and rotating nozzles are appropriate for grass, but drip irrigation is a more appropriate
choice for shrubs and trees. The table below summarizes the four major types of irrigation,
including their water pattern, ideal use, and precipitation (precip) rate, which is the amount
of water that the irrigation type puts out.
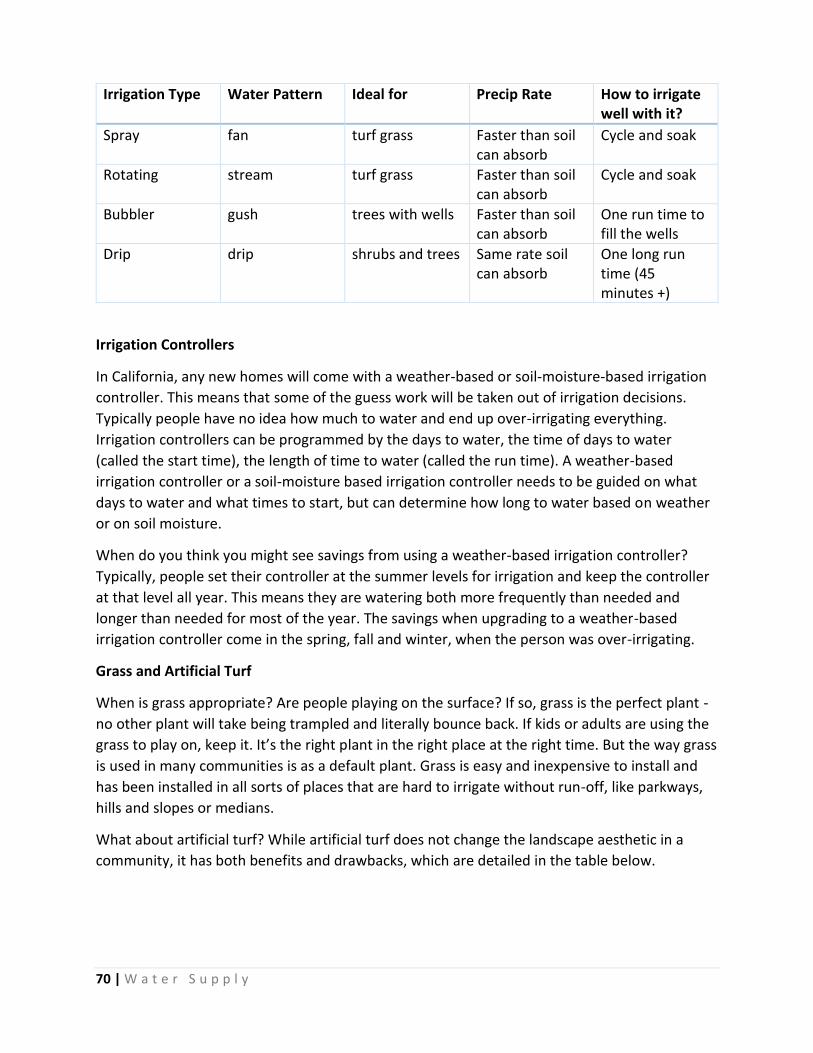
70 | W a t e r S u p p l y
Irrigation Type Water Pattern Ideal for Precip Rate How to irrigate well with it?
Spray fan turf grass Faster than soil can absorb
Cycle and soak
Rotating stream turf grass Faster than soil can absorb
Cycle and soak
Bubbler gush trees with wells Faster than soil can absorb
One run time to fill the wells
Drip drip shrubs and trees Same rate soil can absorb
One long run time (45 minutes +)
Irrigation Controllers
In California, any new homes will come with a weather-based or soil-moisture-based irrigation
controller. This means that some of the guess work will be taken out of irrigation decisions.
Typically people have no idea how much to water and end up over-irrigating everything.
Irrigation controllers can be programmed by the days to water, the time of days to water
(called the start time), the length of time to water (called the run time). A weather-based
irrigation controller or a soil-moisture based irrigation controller needs to be guided on what
days to water and what times to start, but can determine how long to water based on weather
or on soil moisture.
When do you think you might see savings from using a weather-based irrigation controller?
Typically, people set their controller at the summer levels for irrigation and keep the controller
at that level all year. This means they are watering both more frequently than needed and
longer than needed for most of the year. The savings when upgrading to a weather-based
irrigation controller come in the spring, fall and winter, when the person was over-irrigating.
Grass and Artificial Turf
When is grass appropriate? Are people playing on the surface? If so, grass is the perfect plant -
no other plant will take being trampled and literally bounce back. If kids or adults are using the
grass to play on, keep it. It’s the right plant in the right place at the right time. But the way grass
is used in many communities is as a default plant. Grass is easy and inexpensive to install and
has been installed in all sorts of places that are hard to irrigate without run-off, like parkways,
hills and slopes or medians.
What about artificial turf? While artificial turf does not change the landscape aesthetic in a
community, it has both benefits and drawbacks, which are detailed in the table below.

71 | W a t e r S u p p l y
Benefits of Artificial Turf Drawbacks of Artificial Turf
It’s green. It can become hot in the sun (and contribute to a heat island effect on your property).
It saves water. Many installers recommend hosing down artificial turf for dust control and to clean pet waste.
No mowing is necessary. It can photodegrade in the sun (10 year lifespan).
No fertilizers are necessary It will smell of pet waste if not cleaned effectively.
Costs incurred are most likely one time charges (until time for replacement in around 10 years).
Typically, artificial turf is $10-15 a square foot.
There are other types of outdoor water use, but they are negligible in the greater scheme of
things when compared to landscaping. For example, leaks may occur outdoors in the irrigation
system. Water can also be used for cleaning hardscape (pavement, sidewalks, driveways),
washing vehicles, filling fountains and swimming pools.
Try It!
1. Propose a strategy for landscaping an area that you see frequently, such as your home,
a local park, or your school. This could be your front or backyard, a common area, or an
area at work. Consider the types of plants that you might install, an arrangement for
them, the irrigation system you should use, and what obstacles you might encounter
along the way. Identify the best practices you have used.
2. A friend wants to install artificial turf in his front and backyard. Give an overview of the
benefits and drawbacks of artificial turf.
Key Terms
Cycle and soak – irrigating in short bursts and allow water to sink in in between bursts
Hydrozoning - separating your plants by their water needs, which helps you water the right
amount in each zone
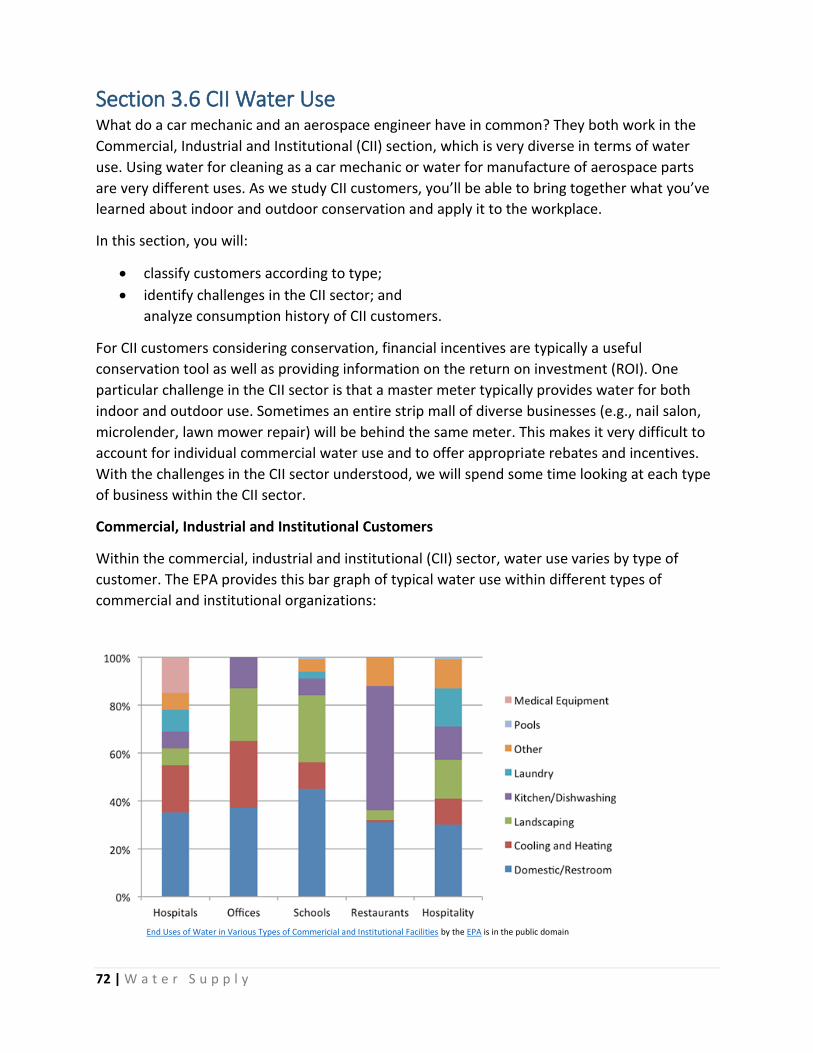
72 | W a t e r S u p p l y
Section 3.6 CII Water Use What do a car mechanic and an aerospace engineer have in common? They both work in the
Commercial, Industrial and Institutional (CII) section, which is very diverse in terms of water
use. Using water for cleaning as a car mechanic or water for manufacture of aerospace parts
are very different uses. As we study CII customers, you’ll be able to bring together what you’ve
learned about indoor and outdoor conservation and apply it to the workplace.
In this section, you will:
classify customers according to type;
identify challenges in the CII sector; and
analyze consumption history of CII customers.
For CII customers considering conservation, financial incentives are typically a useful
conservation tool as well as providing information on the return on investment (ROI). One
particular challenge in the CII sector is that a master meter typically provides water for both
indoor and outdoor use. Sometimes an entire strip mall of diverse businesses (e.g., nail salon,
microlender, lawn mower repair) will be behind the same meter. This makes it very difficult to
account for individual commercial water use and to offer appropriate rebates and incentives.
With the challenges in the CII sector understood, we will spend some time looking at each type
of business within the CII sector.
Commercial, Industrial and Institutional Customers
Within the commercial, industrial and institutional (CII) sector, water use varies by type of
customer. The EPA provides this bar graph of typical water use within different types of
commercial and institutional organizations:
End Uses of Water in Various Types of Commericial and Institutional Facilities by the EPA is in the public domain

73 | W a t e r S u p p l y
There are a few key observations you can make, most of which are intuitive:
Most customers have a sizable proportion of domestic or restroom water use. This suggests
that a program that rebates toilets, urinals, and aerators might be useful to many types of
customers.
Schools, offices and hospitality (hotels) use a significant amount of water for
landscaping. This suggests that a rebate program for smart irrigation controllers,
sprinkler nozzles, landscape audits or checkups or for turf grass removal might be useful.
Some types of customers, such as hospitals or offices, have sizable amounts of water
used for heating and cooling (including cooling towers, which can recirculate water).
Kitchens and hotels (hospitality) use a significant amount of water in the kitchen.
Commercial Customers
Restaurant water use is typically about 50% used in the kitchen, primarily for dishwashing. This
suggests that a dishwasher rebate for a water-efficient dishwasher might be in order. And, of
course, there is typically a third of total water used for restrooms, which suggests a toilet and
urinal rebate program might be well received and needed.
Restaurants have other uses of water
in the kitchen, including woks and
dipper wells, both of which may have
continuous flows of water. The next
time you are in an Asian restaurant, if
the restaurant has an open kitchen,
check out the wok. Many restaurants
have a continuous flow of water in a
faucet behind the wok to use while
cooking and to cool the wok. Similarly
dipper wells in ice cream parlors may
also have a continuous flow of water
to keep the ice cream scoop clean. For kitchen clean-up, pre-rinse spray valves, which are used
to pre-clean dishes before going in the dishwasher, can also be upgraded to less gallons per
minute, and are a common rebate program.
The EPA features a case study in conservation in a restaurant in Chicago, Illinois. The restaurant
is called Uncommon Grounds and it conducted three stages of upgrades:
1. Aerators on prep sinks, more efficient pre-rinse spray valves and water only
served on request;
2. Dishwasher and ice machine upgrades to ENERGY STAR qualified models; and
3. Rooftop garden with a drip irrigation system that uses a rainwater collection
system.
End Uses of Water in Restaurants by the EPA is in the public domain
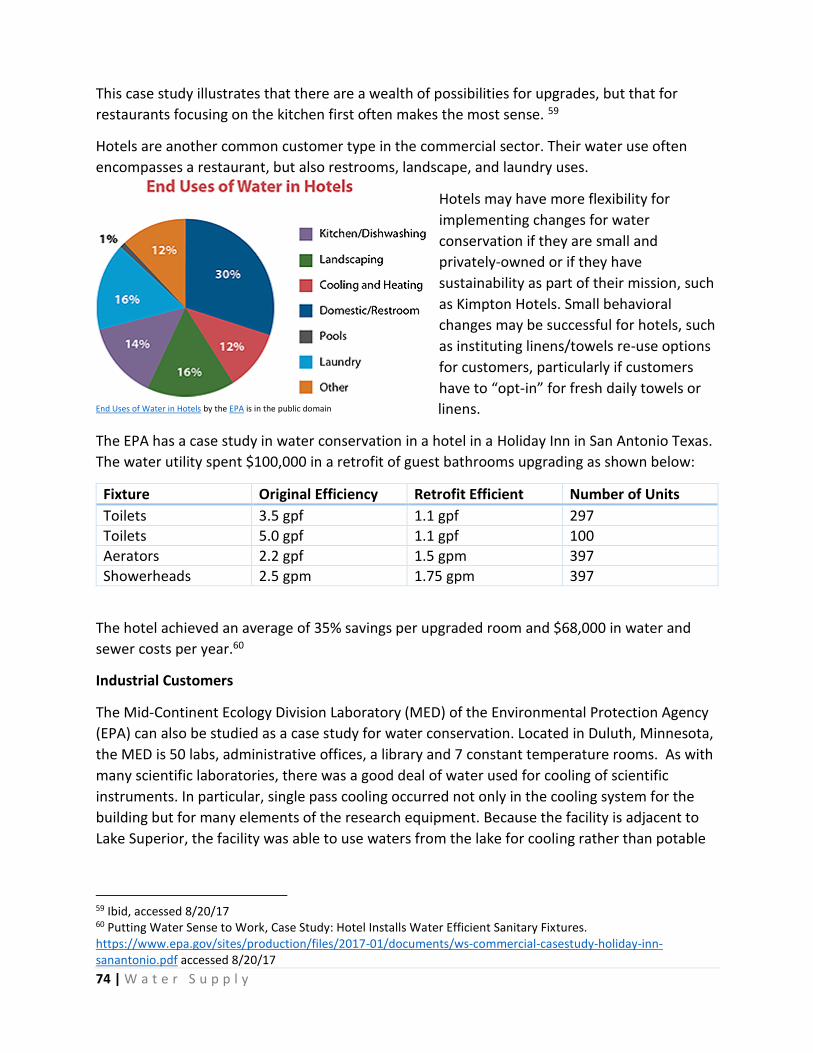
74 | W a t e r S u p p l y
This case study illustrates that there are a wealth of possibilities for upgrades, but that for
restaurants focusing on the kitchen first often makes the most sense. 59
Hotels are another common customer type in the commercial sector. Their water use often
encompasses a restaurant, but also restrooms, landscape, and laundry uses.
Hotels may have more flexibility for
implementing changes for water
conservation if they are small and
privately-owned or if they have
sustainability as part of their mission, such
as Kimpton Hotels. Small behavioral
changes may be successful for hotels, such
as instituting linens/towels re-use options
for customers, particularly if customers
have to “opt-in” for fresh daily towels or
linens.
The EPA has a case study in water conservation in a hotel in a Holiday Inn in San Antonio Texas.
The water utility spent $100,000 in a retrofit of guest bathrooms upgrading as shown below:
Fixture Original Efficiency Retrofit Efficient Number of Units
Toilets 3.5 gpf 1.1 gpf 297
Toilets 5.0 gpf 1.1 gpf 100
Aerators 2.2 gpf 1.5 gpm 397
Showerheads 2.5 gpm 1.75 gpm 397
The hotel achieved an average of 35% savings per upgraded room and $68,000 in water and
sewer costs per year.60
Industrial Customers
The Mid-Continent Ecology Division Laboratory (MED) of the Environmental Protection Agency
(EPA) can also be studied as a case study for water conservation. Located in Duluth, Minnesota,
the MED is 50 labs, administrative offices, a library and 7 constant temperature rooms. As with
many scientific laboratories, there was a good deal of water used for cooling of scientific
instruments. In particular, single pass cooling occurred not only in the cooling system for the
building but for many elements of the research equipment. Because the facility is adjacent to
Lake Superior, the facility was able to use waters from the lake for cooling rather than potable
59 Ibid, accessed 8/20/17 60 Putting Water Sense to Work, Case Study: Hotel Installs Water Efficient Sanitary Fixtures. https://www.epa.gov/sites/production/files/2017-01/documents/ws-commercial-casestudy-holiday-inn-sanantonio.pdf accessed 8/20/17
End Uses of Water in Hotels by the EPA is in the public domain

75 | W a t e r S u p p l y
water, which reduced its total potable use by 90 percent. Additionally, the water can be
returned to Lake Superior after it is used to cool the building or equipment.
This use of lakewater for cooling is innovative. In California, lakes are much more sporadically
occurring than in Minnesota and this would be more of a challenge both in finding a lake to use
and in not having detrimental environmental effects. Also, aquatic species tend to like water
within a temperature range so any water that is returned to the lake would need to be similar
in temperature to the lake water. 61
Institutional Customers
Although decreasing water use by 90% in the case of the MED or 35% for the Holiday Inn seems
extreme, the types of processes and analyses that occurred at the MED are the sorts of
processes that would need to occur are typical of ways to save with other industrial customers
as well as institutional customers. Institutional customers are typically schools and universities,
hospitals, houses of worship, and city and county agencies. These are typically the sorts of
customers who may have many people visiting their facilities for a short period of time. They
may also have a variety of different types of use in one building, such as a church that also has a
school during the weekdays and group counseling or AA meetings in the weekday evenings.
Stanford University is useful as a case study because of the wide ranging uses of the facility
ranging from scientific research to residential housing. At Stanford University, conservation
staff met with each department to attempt to quantify water use and potential reductions.
Important to this effort was the involvement of stakeholders in the process, which include
professors and research staff, but also building and grounds staff who understand how the
buildings function, particularly the cooling systems. 62
In the end, a variety of conservation measures were chosen from removal of unnecessary turf
grass and installation of weather-based irrigation controllers as outdoor measures to upgrading
most bathrooms on campus and replacing one-pass sterilizing equipment, to real-time metering
to provide feedback on water use, and especially on leaks.63
In the same vein as Stanford University, a case study from the EPA found a wide range of
possible upgrades for a hospital in Olympia, Washington, to decrease water use. These water
conservation measures concentrated on:
Upgrading sterilizer equipment
Recovering condensate from the sterilizer for re-use (non-potable use); and
Upgrading water-using equipment with non-water using equipment.
61 Mid-Contintent Ecology Division, https://www.epa.gov/greeningepa/mid-continent-ecology-division-laboratory retrieved 8/20/17 62Stanford University, Sustainability and Energy Management, “Water Efficiency,” http://lbre.stanford.edu/sem/Water_Efficiency (accessed 5/26/16) 63 Stanford University, Stanford University Water Efficiency Fact Sheet http://lbre.stanford.edu/sem/sites/all/lbre-shared/files/sem/files/shared/sem_WE_Program.pdf (accessed 5/26/16)

76 | W a t e r S u p p l y
This process resulted in a savings of 5.9 million gallons once the retrofits were completed and a
cost savings of $140,000 per year. So while it may seem like the CII sector is technical, case
studies such as this one illustrate that by identifying the high-water using appliances and
equipment and researching upgrades, there is a significant potential for water savings.64
Try It!
1. Where is most water used in a restaurant? Where is most water used in a school?
2. College of the Canyons is considered an “institutional customer.” Where might the
greatest water savings lie?
64 Putting WaterSense to Work: Hospital Installs Water Efficient Laboratory and Medical Equipment. https://www.epa.gov/sites/production/files/2017-01/documents/ws-commercial-casestudy-provst-peter-hospital.pdf accessed 8/20/17

77 | W a t e r S u p p l y
Section 3.7 Social Marketing Campaigns How do you get people to change? It’s a good question and one with which numerous
governmental agencies struggle, particularly those in the health and healthcare fields, where
there are the most social marketing campaigns of any field.
As you have seen, there are major water infrastructure projects that can be relied on to a
certain extent to bring water to the thirsty parts of California. But how can you decrease the
amount of water that is needed in the first place? This is called managing demand. You’ve
learned a variety of tools from regulation to restrict water use or limit waste, to building codes
that require more efficient devices to water loss detection to conservation programs.
Decreasing demand is both an art and a science. One additional way to reduce demand is to
engage in a social marketing campaign with residents.
In this section, you will:
differentiate between awareness campaigns and social marketing campaigns;
identify behaviors that most water utilities target; and
design a social marketing campaign.
Typically, public outreach campaigns in the water industry
have focused on awareness. That is to say the campaign wants
you to be aware of the importance of water or the amount of
water that you use. In the Santa Clarita Valley, a campaign in
2010 focused on residents knowing their "water number," the
amount of water that they used in one day. This campaign
relied on the jarring realization that the amount of water that
people used was much more than they expected.
An awareness campaign might also focus on a rebate program
by promoting toilet or washing machine rebates. The goal of
an awareness campaign is to make more people aware of
something, but it isn’t necessarily to make people change
their behavior. There isn’t a clear call to action.
In the image above, the viewer is made aware that funds are still available for a Cash for Grass
Program (called Lawn Replacement). This ad assumes that most people do not know that there
is still money available, and is attempting to raise awareness of this. In Southern California,
water agencies, such as Castaic Lake Water Agency, frequently have challenges with messaging
that contradicts the messaging from Metropolitan Water District of Southern California, which
What’s Your Water Number? (Image used with permission of Castaic Lake Water Agency)
Images used with permission of Castaic Lake Water Agency

78 | W a t e r S u p p l y
is a much larger wholesale agency. In this case, Castaic Lake Water Agency has funds available
for a cash for grass program, while Metropolitan Water District has run out of funds. Customers
who do not know who their water wholesaler was were confused about the availability of
funds.
Success or failure of the campaign could be measured in a change of awareness in rebates with
a phone or email survey of a representative sample of residents. Awareness of the rebate could
be measured before the campaign launches to establish a baseline (e.g., 20% of residents
surveyed in the Santa Clarita Valley are aware there are funds available for the Lawn
Replacement Program) and then a follow-up phone survey after the campaign runs for 3-12
months to see if there is any increase in awareness (e.g., 3 months later, 30% of residents
surveyed in the Santa Clarita Valley are aware there are funds available for the Lawn
Replacement Program).
Another awareness campaign that you may have seen is a
drought awareness campaign. Most water agencies had to
launch some sort of drought awareness campaign that
combined with efforts from the State of California to make
people aware of the severity of the drought. San Diego
County Water Authority has an effective ad to make people
aware of state-mandated conservation. Using a modified
image from the Drought Monitor of the state of California,
the campaign make some suggestions for conservation, but
is mostly focused on awareness of the drought and
restrictions in place.
A similar awareness campaign from the Family of Water Suppliers in
Santa Clarita, including Castaic Lake Water Agency, focuses slightly
differently on a common misconception: when it rains, the drought is
over. This awareness campaign reminds people that just because it
rains, the drought is not over.
A social marketing campaign differs from an awareness campaign
significantly. A social marketing campaign is a campaign that tries to
change behavior. By presenting images that motivate people to do the
“right” thing (or that poke fun of people doing the “wrong” thing), public agencies can gently
move people to better practices that are good for the residents and good for the public agency.
However, most of the time, you can’t just tell people to do the right thing. It generally doesn't
work. People have too much going on in their lives to listen, unless you make it extremely
relevant. You need to have a campaign that refines your message.
Image used with permission of San Diego County Water
Authority)
Image used with permission of
Castaic Lake Water Agency

79 | W a t e r S u p p l y
These are the sorts of questions that are used in campaign planning:
Who are we targeting?
What is our message?
What partnerships will help with our message?
What are the barriers to being understood (or listened to)?
During the last drought, many water agencies in California had to tackle how to let people know
it was okay to let their lawn get less water and go dormant (yellow). Because green lawns are
one way that people tend to rate their status (i.e., I have a green lawn, so I must be financially
secure), this is a particularly challenging task. San Diego County Water Authority has a social
marketing campaign that tackles this in a unique way.
In the image from San Diego County Water Authority, the Authority has chosen to reframe
brown grass as “tan” grass, most likely hoping that this will make it seem more appealing. This
is a variation of “Brown is the new green,” a phrase made popular by Governor Brown in the
same drought, but working with language that may be more appealing (i.e., tan rather than
brown).
Castaic Lake Water Agency has a similar goal of reducing water use for turf grass, but has taken
a different tactic by focusing on the appealing aspects of replacing a lawn (more color, more
fun, more time):
Image used with permission of San Diego County Water Authority
Images used with permission of Castaic Lake Water Agency

80 | W a t e r S u p p l y
Many social marketing campaigns have concentrated on the behavior that was prohibited
initially during the drought in California, including stopping irrigation run-off, but also refraining
from watering sidewalks or washing cars without shut-off nozzles, or using even non-
recirculating fountains. While raising awareness of the drought is important, these were all
behaviors that were targeted by many water companies in social marketing efforts to behavior
change.
Try It!
1. Do a quick scan through a newspaper or click through a few websites starting with an
online newspaper. Give an example of an awareness campaign and an example of a
social marketing campaign. Examples do not need to be from the water industry.
2. Design a social marketing campaign and present your results. Answer these questions:
a. Who are you trying to target?
b. What is the message?
c. What are the hurdles?
Key Terms
awareness campaign – a campaign to make more people aware of something, but it isn’t
necessarily to make people change their behavior
social marketing campaign – a campaign that tries to change behavior

81 | W a t e r S u p p l y
Bibliography Allen, Laura. “Greywater in the Real World: A Study of 83 Greywater Systems.”(Presentation made at
Water Smart Innovations, Las Vegas, Nevada, October 2013).
https://www.watersmartinnovations.com/documents/sessions/2013/2013-W-1335.pdf
AWWA Manual M1. Principles of Water rates, Fees, and Charges. Denver: American Water Works
Association, 2000.
Bay Delta Conservation Plan. “About the Problem.” n.d.
http://baydeltaconservationplan.com/AboutTheDelta/AbouttheProblem.aspx (5/30/16)
California. Department of Finance. “Historical Census 1850-2010.” n.d.
http://www.dof.ca.gov/research/demographic/state_census_data_center/historical_census_1850-20
10/view.php (accessed5/18/16)
California. Department of General Services, Green Residential Building Code. “2013 Cal Green Residential
Mandatory Measures.” n.d.
http://www.documents.dgs.ca.gov/bsc/documents/2013/2013-Green-Residential-Mandatory.pdf
(accessed 5/19/16)
California. Department of Water Resources. “California State Water Project Overview.”
http://www.water.ca.gov/swp/ n.d. (accesed 6/4/16)
-----.“History of California State Water Project.” http://www.water.ca.gov/swp/history.cfm n.d. (accessed
6/4/16)
California. Department of Water Resources. “Senate Bill SB X7-7.” n.d.
http://www.water.ca.gov/wateruseefficiency/sb7/ (accessed 5/19/16)
California. Groundwater Management Act.”Sustainable Groundwater Management.” n.d.
http://groundwater.ca.gov/ (accessed 5/24/16)
California Irrigation Management Information System, Reports for Stations #204 and #52 for 2015 data
(accessed 2/15/16)
California. Legislative Analyst’s Office. “Understanding Prop 218.” December 1996.
http://www.lao.ca.gov/1996/120196_prop_218/understanding_prop218_1296.html (accessed
5/25/16)
California. Office of Governor Edmund G. Brown, Junior. “Governor Brown Declares State of Emergency.”
January 17, 2014 https://www.gov.ca.gov/news.php?id=18368 (accessed 5/19/16)
-----. “Governor Brown Directs First Ever Statewide Mandatory Water Reductions.” April 1, 2015.

82 | W a t e r S u p p l y
https://www.gov.ca.gov/news.php?id=18910 (accessed 5/19/16)
-----. “Governor Brown Issues Executive Order to Redouble State Drought Actions.” April 25, 2014.
https://www.gov.ca.gov/news.php?id=18496 (accessed 5/19/16)
California. State Water Resources Control Board. “State Water Board Adopts ‘Stress Test’ Approach to
Water Conservation Regulation.” May 18, 2016.
http://www.waterboards.ca.gov/press_room/press_releases/2016/pr051816_waterconsreg.pdf
-----. “State Water Board Approves Emergency Regulation to Ensure Agencies and State Residents
Increase Water Conservation.” July 15, 2014.
http://www.swrcb.ca.gov/press_room/press_releases/2014/pr071514.pdf (accessed 5/19/16)
-----. “State Water Board Expands and Extends Emergency Water Conservation Regulation.” March 17,
2015.http://www.swrcb.ca.gov/press_room/press_releases/2015/pr031715_renewed_emergency_wtr
_regs.pdf (accessed 5/19/16)
-----.“State Water Resources Control Board Resolution
2015-0032.” n.d.
http://www.waterboards.ca.gov/board_decisions/adopted_orders/resolutions/2015/rs2015_0032.pdf
(accessed 5/19/16)
-----.“State Water Resources Control Board Resolution
2016-0007.” n.d.
http://www.waterboards.ca.gov/water_issues/programs/conservation_portal/docs/rs2016_0007_with
%20adopted%20regs.pdf (accessed 5/19/16)
City of Beverly Hills. Beverly Hills Cultural Plan
http://www.lacountyarts.org/UserFiles/File/Grants/Beverly_Hills_Cultural_Plan.pdf p. 12 (accessed
5/23/16)
City of Los Angeles. Department of Water and Power. “A Hundred or a Thousand Fold More Important.”
http://wsoweb.ladwp.com/Aqueduct/historyoflaa/hundred.htm n.d. (accessed 5/18/16)
------. “A New Supply.”
http://wsoweb.ladwp.com/Aqueduct/historyoflaa/newsupply.htm n.d. (accessed 5/18/16)
------. “The City Owns Its Water.”
http://wsoweb.ladwp.com/Aqueduct/historyoflaa/cityownswater.htm n.d. (accessed 5/18/16)
------.“The Last Spike Is Driven.”
http://wsoweb.ladwp.com/Aqueduct/historyoflaa/lastspike.htm n.d. (accessed 5/18/16)

83 | W a t e r S u p p l y
------. “The Owens Valley Is The Only Source.”
http://wsoweb.ladwp.com/Aqueduct/historyoflaa/onlysource.htm n.d. (accessed 5/18/16)
City of Santa Barbara, Public Works,
http://www.santabarbaraca.gov/gov/depts/pw/resources/system/sources/desalination.asp (accessed
5/18/16)
County of Santa Barbara. Santa Barbara Grand Jury Report, Lake Cachuma - Protecting a Valuable Resource. 2014-
2015.
D’Oreo, Bill. Peter Mayer, Benedykt Dziegielewski and Jack Kiefer. Single Family Residential End Uses of
Water Update. Denver: Water Research Foundation, 2016.
Harivandi, M. Ali, James Baird, Janet Hartin, Michael Henry, and David Shaw. Publication 8395. Managing
Turfgrass During a Drought. Davis: University of California, Division of Agriculture and Natural
Resources http://anrcatalog.ucanr.edu/pdf/8395.pdf (accessed 5/2/16)
Littleworth, Arthur L. and Eric L Garner. California Water II. Point Arena: Solano Press Book., 2007.
Orange County Water District. “Groundwater Replenishment System.” http://www.ocwd.com/gwrs/ n.d.
(accessed 4/8/16)
Quinton, Amy. “Stormwater Capture: California’s Untapped Supply.” Capital Public Radio.
http://www.capradio.org/articles/2015/06/23/stormwater-capture-californias-untapped-supply/
(accessed 5/18/16)
Stanford University. Stanford University Water Efficiency Fact Sheet
http://lbre.stanford.edu/sem/sites/all/lbre-shared/files/sem/files/shared/sem_WE_Program.pdf
(accessed 5/26/16)
Stanford University. Sustainability and Energy Management. “Water Efficiency.”
http://lbre.stanford.edu/sem/Water_Efficiency (accessed 5/26/16)
Thornton, Julian, Reinhard Sturm, and George Kunkel. Water Loss Control, Second Edition. New York:
McGraw Hill, 2008.
U.S. Department of the Interior. Bureau of Reclamation. “Boulder Canyon Project Act.” December 21, 1928.
https://www.usbr.gov/lc/region/pao/pdfiles/bcpact.pdf (accessed 5/18/16)
-----.Central Valley Project Overview, by Eric A. Stene. Bureau of Reclamation. Washington, D.C.,
http://www.usbr.gov/mp/cvp/docs/cvp-overview.pdf
-----. “Central Valley Project Water Quantities for Delivery 2016.” May 9, 2016.
http://www.usbr.gov/mp/cvp-water/docs/5-9-16-1-cvp-water-quantities-only.pdf (accessed 5/20/16)
-----. “Interior Secretary Salazar and Reclamation Commissioner Connor Join U.S. and Mexico Delegations

84 | W a t e r S u p p l y
for Historic Colorado River Water Agreement Ceremony.” November 20, 2012.
http://www.usbr.gov/lc/region/feature/minute319.html (accessed 5/18/16)
-----. “The Law of the River.” March 2008. http://www.usbr.gov/lc/region/g1000/lawofrvr.html (accessed
5/18/16)
U.S. Environmental Protection Agency. WaterSense. “Bathroom Sink Faucets.” n.d.
http://www3.epa.gov/watersense/products/bathroom_sink_faucets.html (accessed 5/26/16)
-----. “Hospitals.” n.d. https://www3.epa.gov/watersense/commercial/types.html#tabs-hospitals (accessed
5/23/16)
------. “Outdoor Water Use in the United States.” n.d. https://www3.epa.gov/watersense/pubs/outdoor.html
(accessed 5/22/16)
-----. “Putting WaterSense to Work: Hotel Installs Water-Efficient Sanitary Features.” July 2014.
https://www3.epa.gov/watersense/docs/ci_casestudy_holidayinnsanantonioairport_508.pdf
(accessed 5/27/16)
-----. “Putting WaterSense to Work: Laboratory Eliminates Single Pass Cooling.” July 2014.
http://www3.epa.gov/watersense/docs/ci_casestudy_epamedlab_508.pdf (accessed 5/22/16)
-----. “Putting WaterSense to Work: Restaurants Install Water-Efficient Commercial Kitchen Equipment.”
July 2014. https://www3.epa.gov/watersense/docs/ci_casestudy_GRAcertifiedrestaurants_508.pdf
(accessed 5/27/16)
-----. “Showerheads.” n.d. http://www3.epa.gov/watersense/products/showerheads.html (accessed 5/26/16)
-----. “Toilets.”n.d. http://www3.epa.gov/watersense/products/toilets.html (accessed 5/26/16)
-----. WaterSense at Work: Best Management Practices for Commercial and Institutional Facilities.
Washington, D.C.: U.S. EPA. 2012.
http://www.epa.gov/watersense/commercial/docs/watersense_at_work/#/294/zoomed (accessed
5/22/16)
U.S.Geological Survey. “Water Use Trends.” May 2, 2016. http://water.usgs.gov/watuse/wutrends.html
(accessed 5/23/16)
University of California, Cooperative Extension. A Guide to Estimating Irrigation Water Needs of Landscape
Plantings in California. Sacramento: California Department of Water Resources. 2000.