weekly reversal levels for january 24, 2015
TRANSCRIPT

Weekly Reversal levels for January 24, 2015.
Quick intro:
Full instructions are in the final pages of this PDF, here is the quick start info:
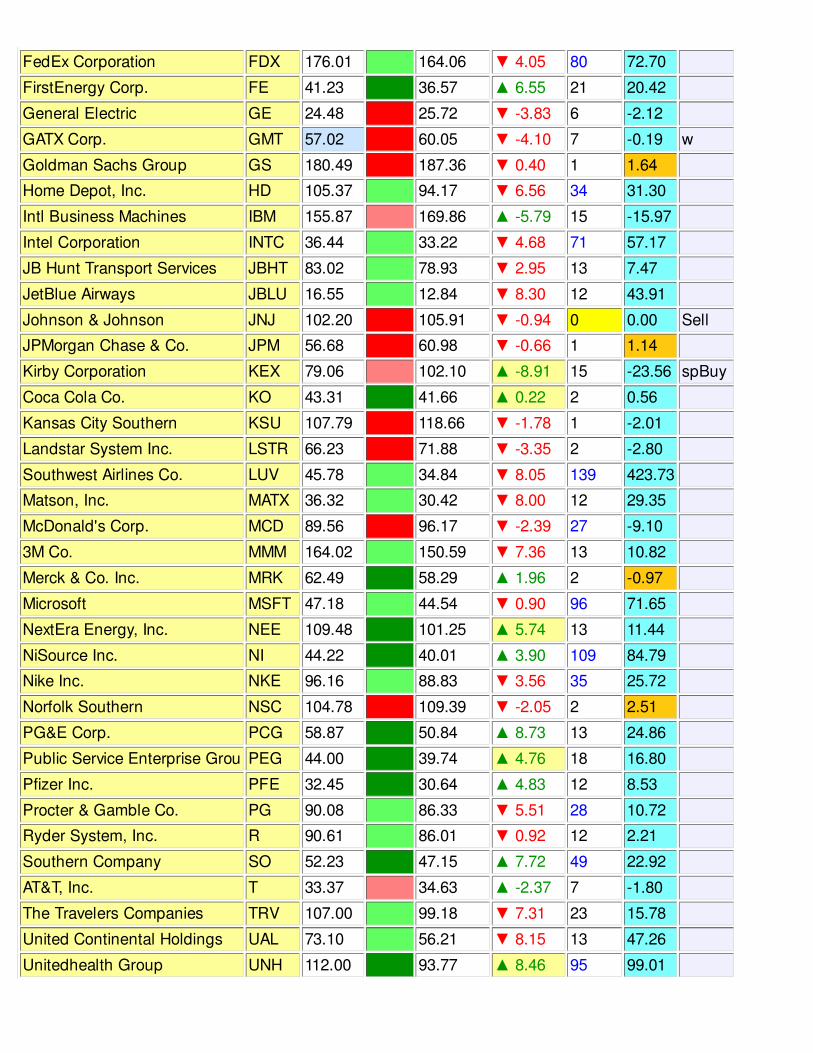
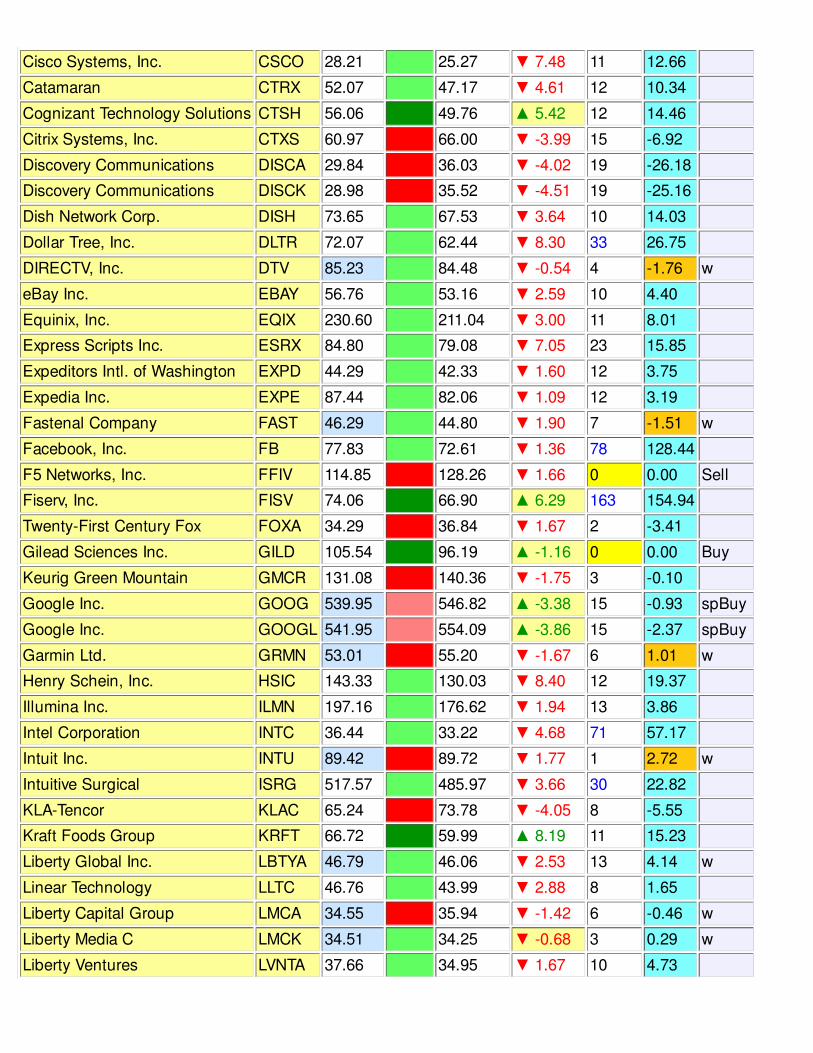
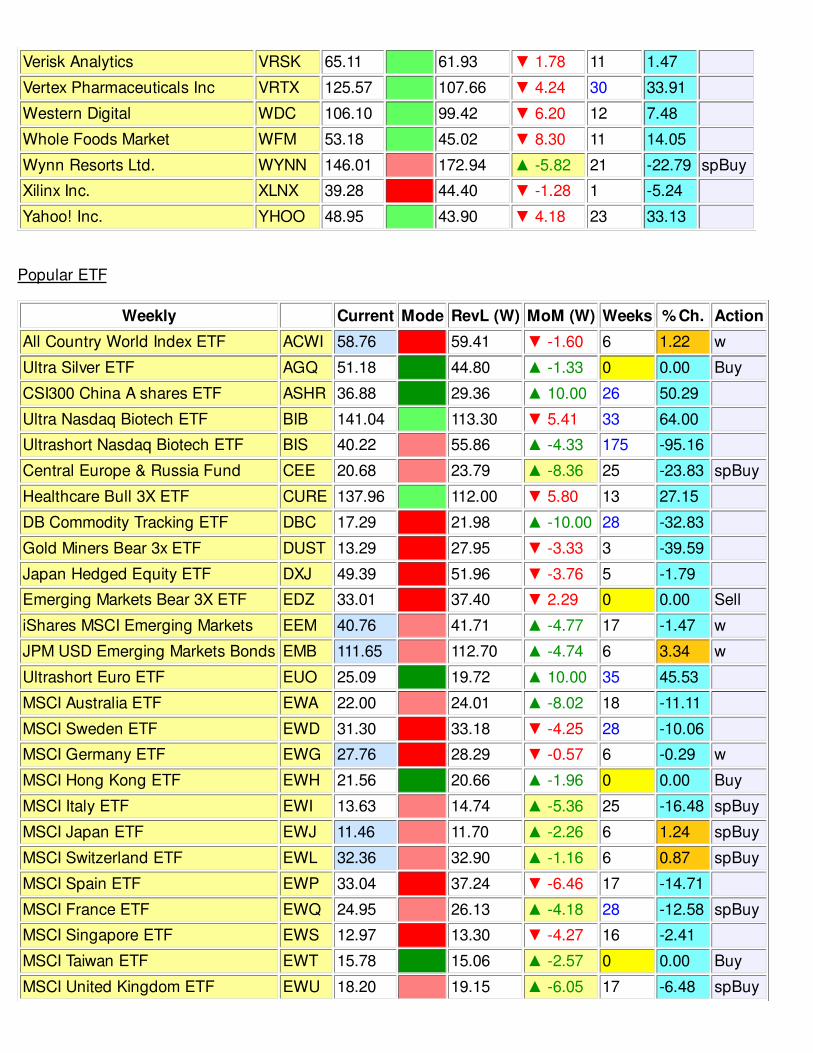
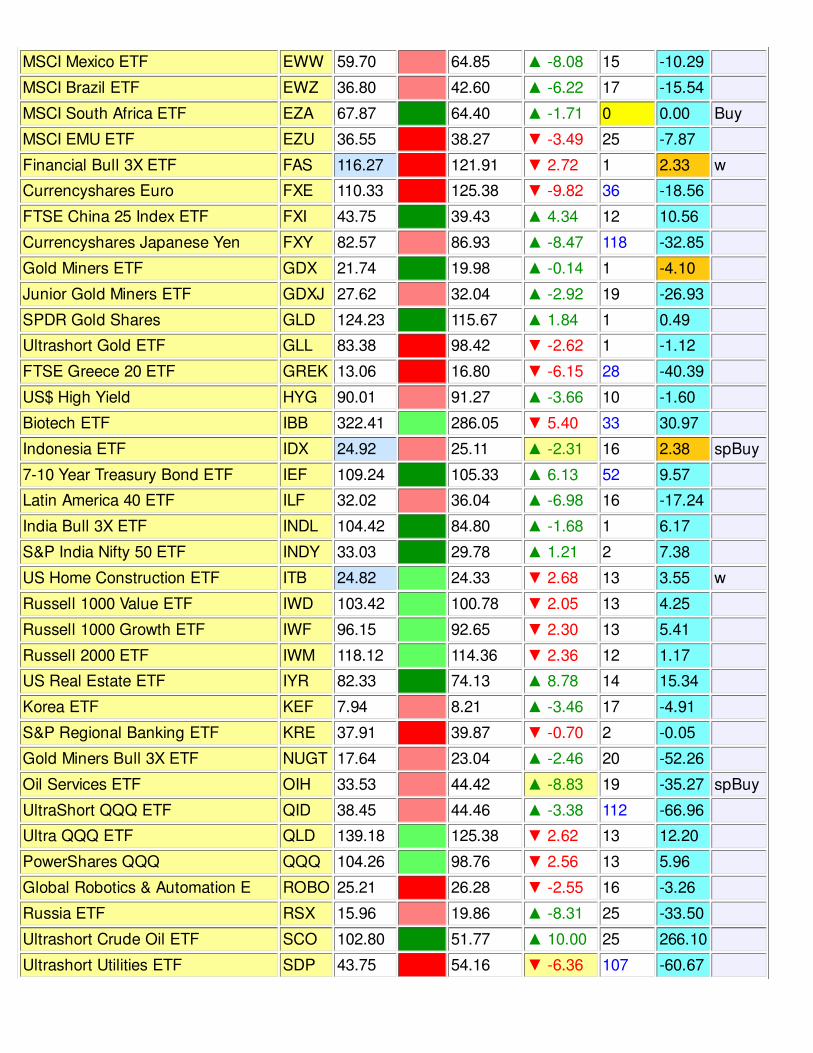
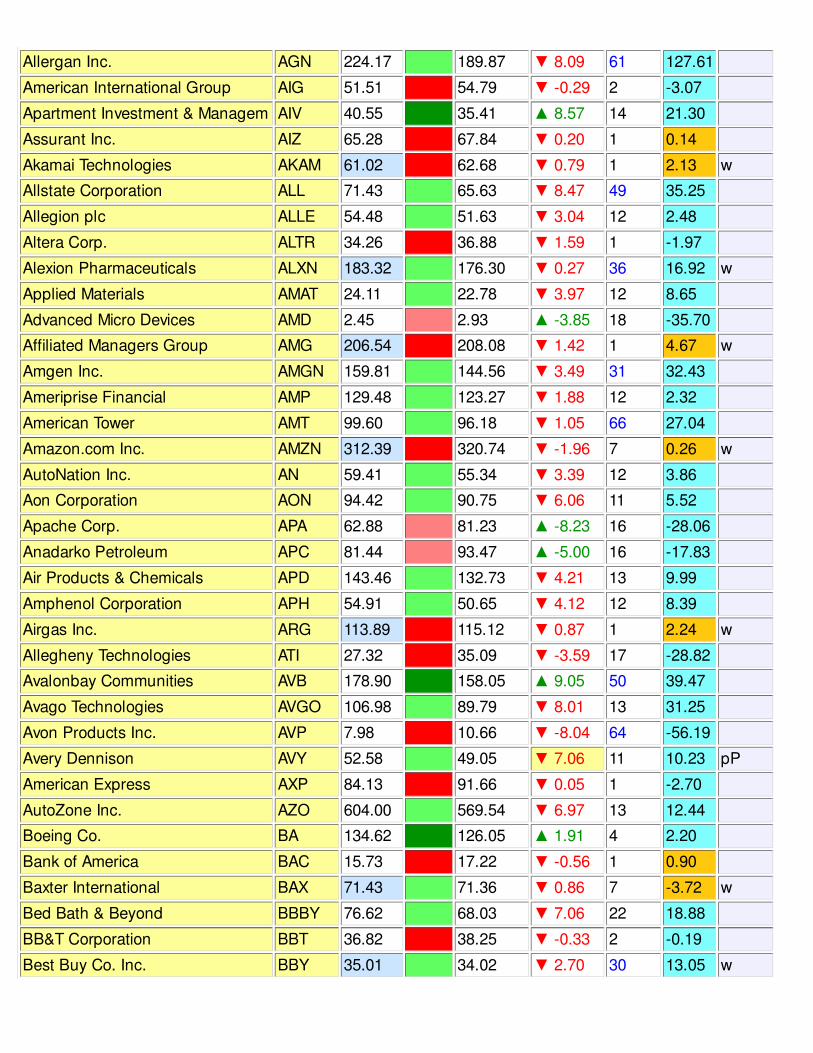
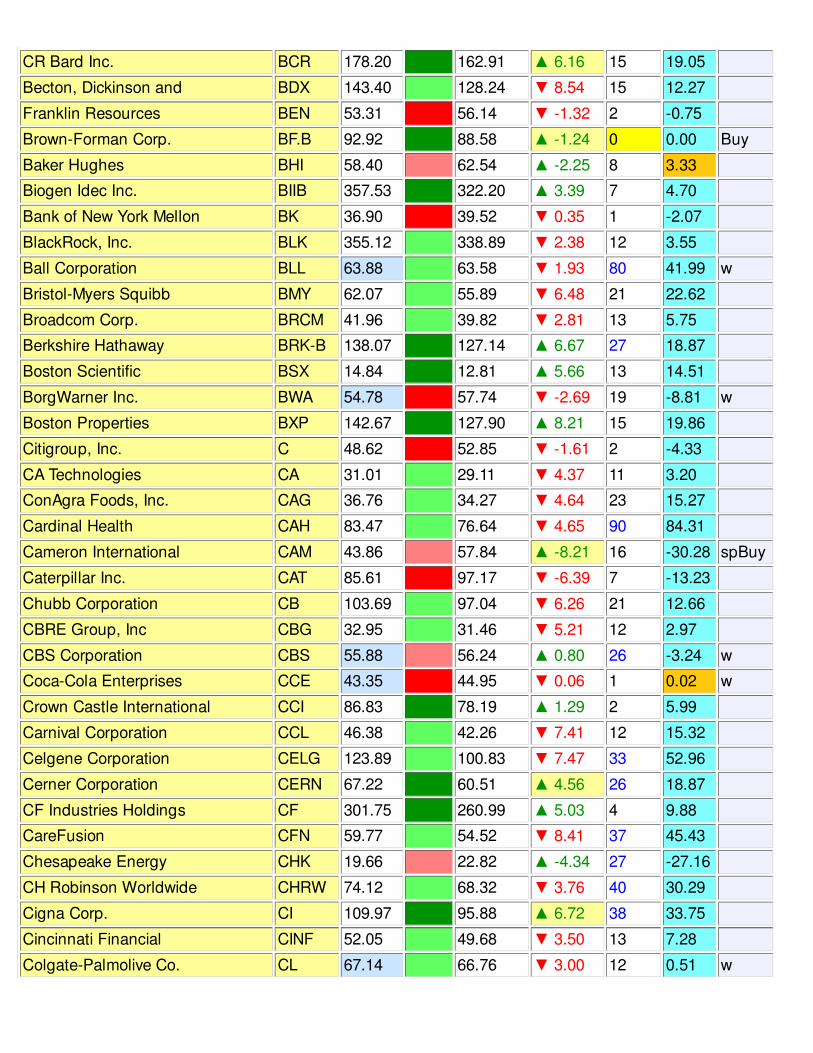
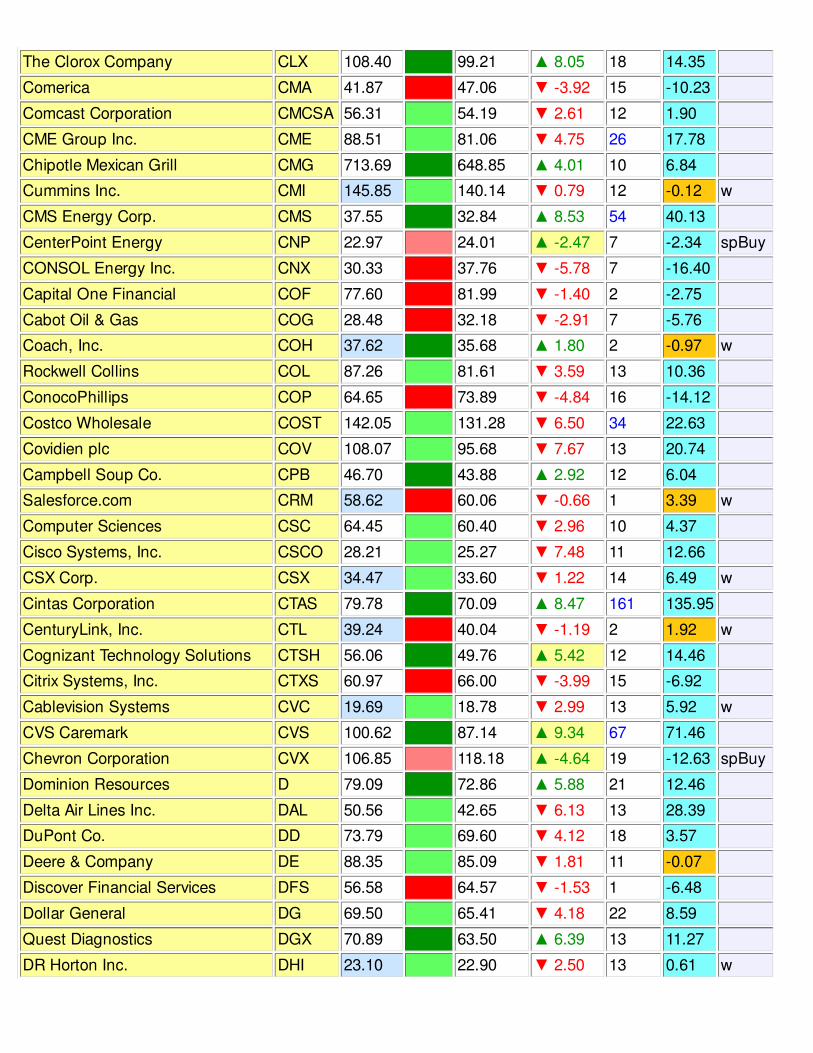
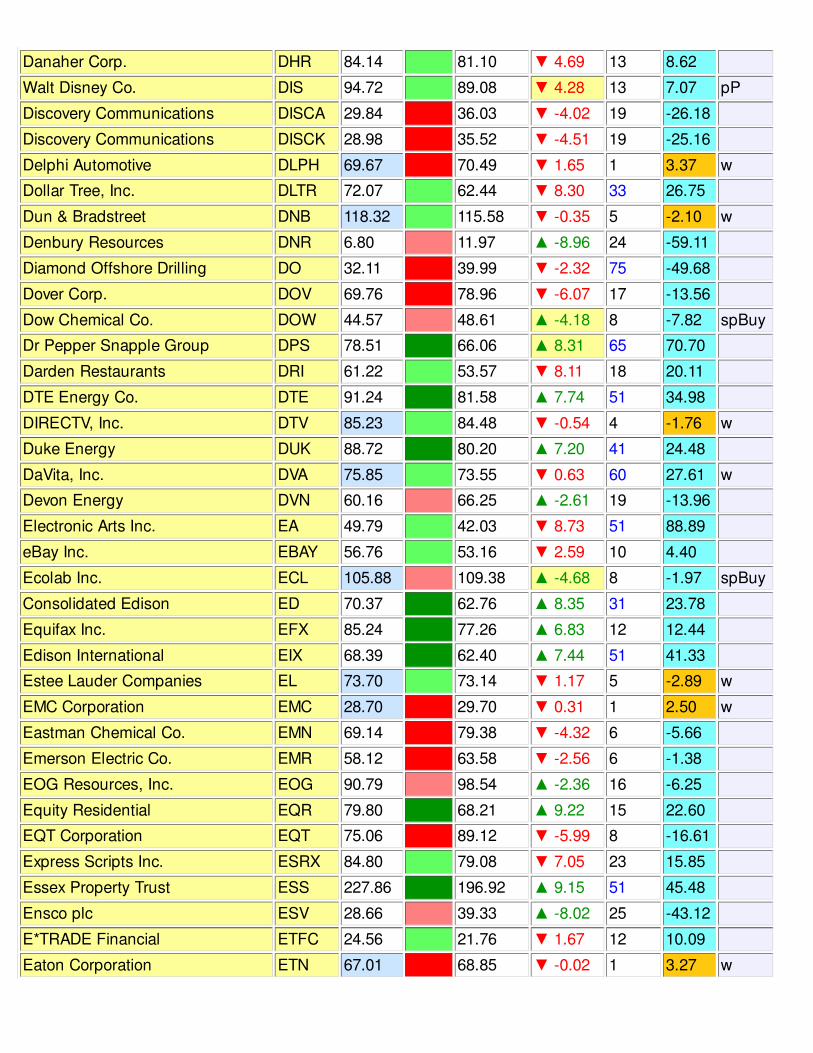
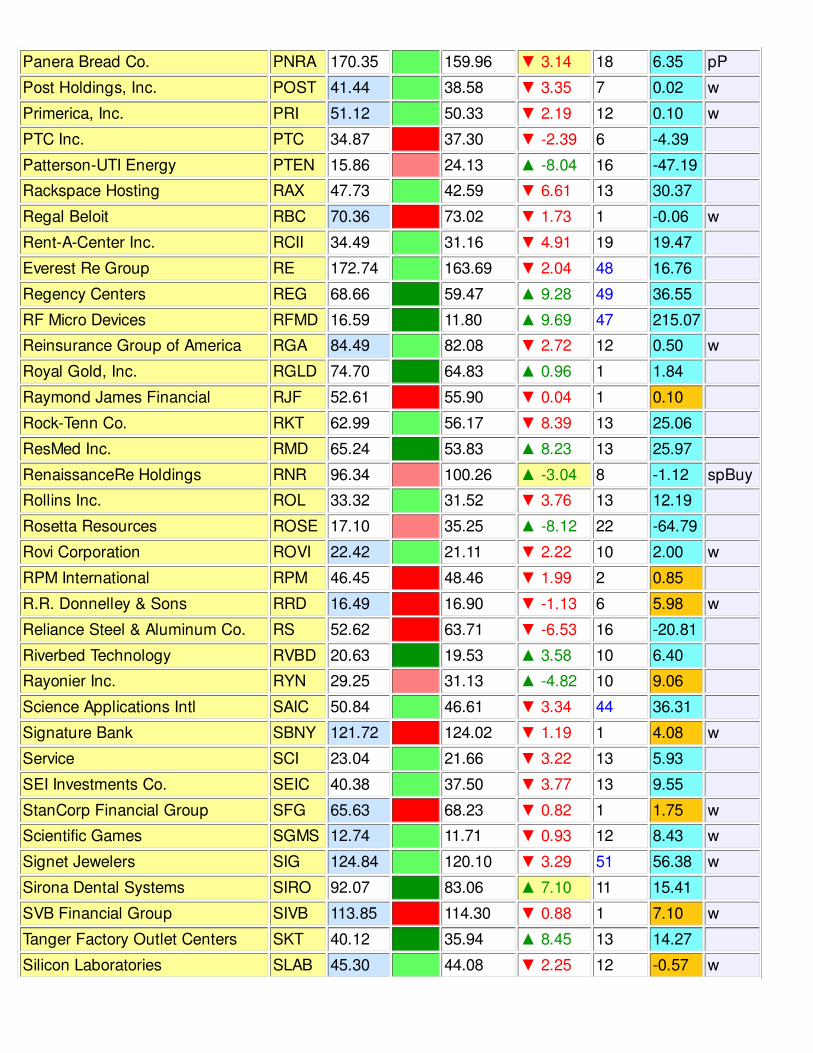
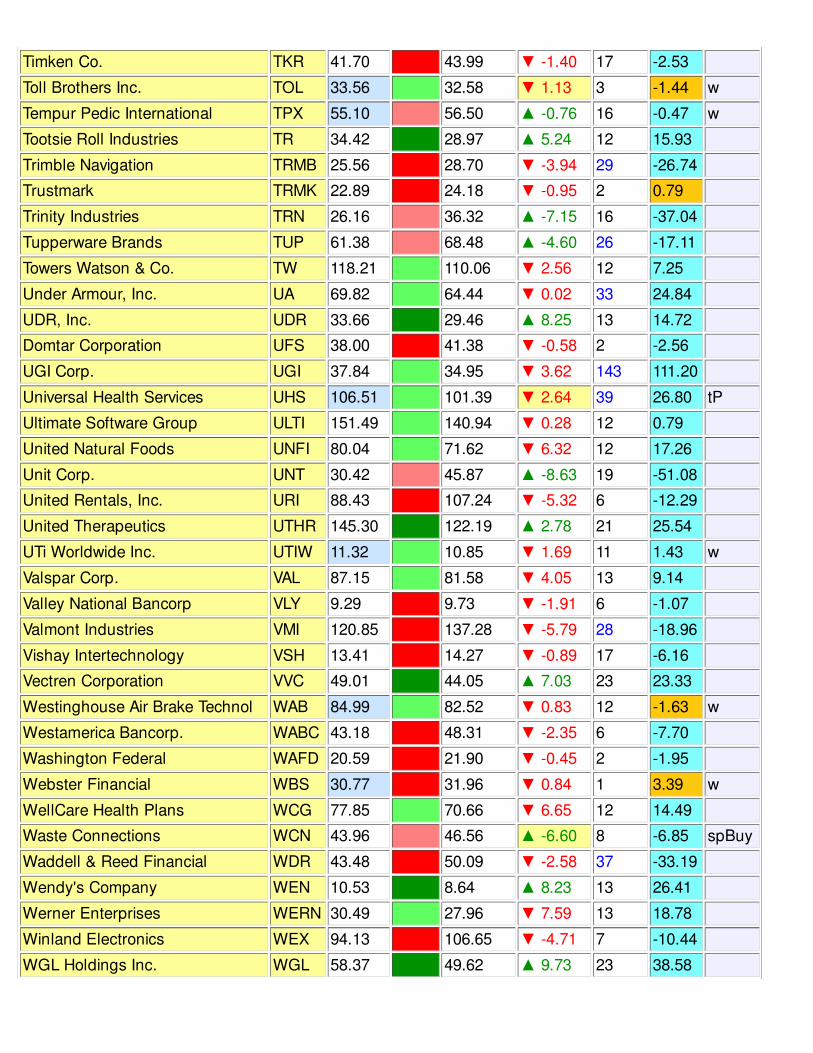
Weekly reversal levels can be used for market orientation and long term investing. The color codes indicatethe current Mode of the market:* Green: bullish with upward momentum (MoM). Market is above its reversal level and climbing higher.Rallying.* Pale Green: bullish with downward momentum (MoM). Market is above its reversal level and mean revertingtowards it. Sideways pause or correcting.* Red: bearish with downward momentum (MoM). Market is below its reversal level and heading lower.Declining* Pink: bearish with upward momentum (MoM). Market is below its reversal level and mean reverting towardsit. Sideways pause or rebounding.
The tables below give the weekly Mode, the weekly reversal level (RevL) and the weekly MoM. You can seehow many weeks have passed since the last standard Buy or Sell signal and the % change since that signal(blue = profitable and orange = loss).
The action column gives quick info for trading:* Buy, Sell, weak Buy (wBuy) or weak Sell (wSell) -> regular buy and sell signal based on the reversal level.* Speculative Buy (spBuy) -> MoM turning up, can give you a great entry point for stocks you want to buy onweakness.* Partial profits (pP) -> a chance to take some money off the table. You can always scale back in when the uptrend resumes (see: "Add").* Add -> this is where you can add to positions.* Add short (AddSh) -> good opportunity to add or initiate short positions.* Watch (w) -> stock to watch, very close to reversal level. The reversal level tends to reject prices, which canbe used for special entry techniques (More on that later).
The MoM indicator shows the current "mood" tendency of the stock based on a proprietary formula. It is usedto detect speculative buy opportunities in stocks that have become very oversold.The buy and sell signals generated by the reversal levels are a trend following method. The signalsgenerated by MoM indicator are a method based on mean reversal. By combining both we have a hybridsystem.
Tip: Yellow boxes in the "MoM" or "Weeks" column help you to spot where the action is. These are stocks withmomentum changes or with new buy or sell signals.
Tip2: To find a certain stock quickly you can use the "Find" function in Acrobat Reader. Just click "Ctrl+F" andit will bring up a little search box. Typing in the name or ticker of the stock you are looking for will locate it inthe list.
More details and strategies for use can be found at the end of this PDF. There is also a little FAQ.

Major indexes
Weekly Current Mode RevL (W) MoM (W) Weeks % Ch. Action
Nasdaq Nasdaq 4757.88 4548.39 ▼ 2.75 13 6.46
S&P 500 S&P 500 2051.82 1989.96 ▼ 2.36 13 4.53
Nikkei Nikkei 17511.75 16317.64 ▼ 4.28 12 4.66
FTSE 100 FTSE 100 6832.83 6463.53 ▲ -0.34 0 0.00 Buy
DAX DAX 10649.58 9525.91 ▲ 3.97 9 9.54
20+ Year Tr. Bond ETF Bonds (TLT) 134.77 120.87 ▲ 8.97 47 26.83
Gold (spot) Gold (spot) 1293.81 1198.70 ▲ 1.50 1 1.10
$EURUSD $EURUSD 1.1203 1.2726 ▼ -9.29 36 -18.16
Oil (CL) Oil (CL) 45.59 74.80 ▲ -9.88 28 -54.62 spBuy
Dow Jones Composite stocks
Weekly Current Mode RevL (W) MoM (W) Weeks % Ch. Action
American Electric Power Co. AEP 64.52 56.88 ▲ 8.08 21 20.24
AES Corporation AES 12.68 14.04 ▼ -1.97 2 -1.48
Alaska Air Group ALK 68.65 52.16 ▲ 8.70 13 36.45
American Express AXP 84.13 91.66 ▼ 0.05 1 -2.70
Boeing Co. BA 134.62 126.05 ▲ 1.91 4 2.20
Caterpillar Inc. CAT 85.61 97.17 ▼ -6.39 7 -13.23
CH Robinson Worldwide CHRW 74.12 68.32 ▼ 3.76 40 30.29
CenterPoint Energy CNP 22.97 24.01 ▲ -2.47 7 -2.34 spBuy
Con-way Inc. CNW 43.07 47.83 ▼ -1.08 2 -4.82
Cisco Systems, Inc. CSCO 28.21 25.27 ▼ 7.48 11 12.66
CSX Corp. CSX 34.47 33.60 ▼ 1.22 14 6.49 w
Chevron Corporation CVX 106.85 118.18 ▲ -4.64 19 -12.63 spBuy
Dominion Resources D 79.09 72.86 ▲ 5.88 21 12.46
Delta Air Lines Inc. DAL 50.56 42.65 ▼ 6.13 13 28.39
DuPont Co. DD 73.79 69.60 ▼ 4.12 18 3.57
Walt Disney Co. DIS 94.72 89.08 ▼ 4.28 13 7.07 pP
Duke Energy DUK 88.72 80.20 ▲ 7.20 41 24.48
Consolidated Edison ED 70.37 62.76 ▲ 8.35 31 23.78
Edison International EIX 68.39 62.40 ▲ 7.44 51 41.33
Exelon Corporation EXC 37.37 34.90 ▼ 3.06 20 10.53
Expeditors Intl. of Washington EXPD 44.29 42.33 ▼ 1.60 12 3.75
FedEx Corporation FDX 176.01 164.06 ▼ 4.05 80 72.70
FirstEnergy Corp. FE 41.23 36.57 ▲ 6.55 21 20.42
General Electric GE 24.48 25.72 ▼ -3.83 6 -2.12
GATX Corp. GMT 57.02 60.05 ▼ -4.10 7 -0.19 w
Goldman Sachs Group GS 180.49 187.36 ▼ 0.40 1 1.64
Home Depot, Inc. HD 105.37 94.17 ▼ 6.56 34 31.30
Intl Business Machines IBM 155.87 169.86 ▲ -5.79 15 -15.97
Intel Corporation INTC 36.44 33.22 ▼ 4.68 71 57.17
JB Hunt Transport Services JBHT 83.02 78.93 ▼ 2.95 13 7.47
JetBlue Airways JBLU 16.55 12.84 ▼ 8.30 12 43.91
Johnson & Johnson JNJ 102.20 105.91 ▼ -0.94 0 0.00 Sell
JPMorgan Chase & Co. JPM 56.68 60.98 ▼ -0.66 1 1.14
Kirby Corporation KEX 79.06 102.10 ▲ -8.91 15 -23.56 spBuy
Coca Cola Co. KO 43.31 41.66 ▲ 0.22 2 0.56
Kansas City Southern KSU 107.79 118.66 ▼ -1.78 1 -2.01
Landstar System Inc. LSTR 66.23 71.88 ▼ -3.35 2 -2.80
Southwest Airlines Co. LUV 45.78 34.84 ▼ 8.05 139 423.73
Matson, Inc. MATX 36.32 30.42 ▼ 8.00 12 29.35
McDonald's Corp. MCD 89.56 96.17 ▼ -2.39 27 -9.10
3M Co. MMM 164.02 150.59 ▼ 7.36 13 10.82
Merck & Co. Inc. MRK 62.49 58.29 ▲ 1.96 2 -0.97
Microsoft MSFT 47.18 44.54 ▼ 0.90 96 71.65
NextEra Energy, Inc. NEE 109.48 101.25 ▲ 5.74 13 11.44
NiSource Inc. NI 44.22 40.01 ▲ 3.90 109 84.79
Nike Inc. NKE 96.16 88.83 ▼ 3.56 35 25.72
Norfolk Southern NSC 104.78 109.39 ▼ -2.05 2 2.51
PG&E Corp. PCG 58.87 50.84 ▲ 8.73 13 24.86
Public Service Enterprise Grou PEG 44.00 39.74 ▲ 4.76 18 16.80
Pfizer Inc. PFE 32.45 30.64 ▲ 4.83 12 8.53
Procter & Gamble Co. PG 90.08 86.33 ▼ 5.51 28 10.72
Ryder System, Inc. R 90.61 86.01 ▼ 0.92 12 2.21
Southern Company SO 52.23 47.15 ▲ 7.72 49 22.92
AT&T, Inc. T 33.37 34.63 ▲ -2.37 7 -1.80
The Travelers Companies TRV 107.00 99.18 ▼ 7.31 23 15.78
United Continental Holdings UAL 73.10 56.21 ▼ 8.15 13 47.26
Unitedhealth Group UNH 112.00 93.77 ▲ 8.46 95 99.01

Union Pacific UNP 120.09 121.58 ▼ 0.49 32 19.66 w
United Parcel Service UPS 102.93 107.55 ▼ 4.80 0 0.00 Sell
United Technologies UTX 119.98 110.09 ▲ 5.64 7 6.89
Visa, Inc. V 258.29 240.37 ▼ 7.79 12 7.18
Verizon Communications VZ 47.15 49.17 ▲ -3.41 7 -3.32 spBuy
Williams Companies WMB 43.35 50.41 ▼ -7.73 7 -12.16
Wal-Mart Stores Inc. WMT 88.51 80.99 ▼ 8.01 11 12.61
Exxon Mobil XOM 90.89 96.57 ▲ -2.52 25 -7.95
Nasdaq 100 stocks
Weekly Current Mode RevL (W) MoM (W) Weeks % Ch. Action
Apple Inc. AAPL 112.98 100.01 ▼ 2.97 39 39.53
Adobe Systems Inc. ADBE 74.06 69.42 ▼ 2.01 12 5.91
Analog Devices Inc. ADI 54.51 51.74 ▼ 4.83 11 8.67
Automatic Data Processing ADP 86.85 77.22 ▼ 7.02 38 28.01
Autodesk, Inc. ADSK 58.19 55.99 ▼ 1.10 12 0.73 w
Akamai Technologies AKAM 61.02 62.68 ▼ 0.79 1 2.13 w
Altera Corp. ALTR 34.26 36.88 ▼ 1.59 1 -1.97
Alexion Pharmaceuticals ALXN 183.32 176.30 ▼ 0.27 36 16.92 w
Applied Materials AMAT 24.11 22.78 ▼ 3.97 12 8.65
Amgen Inc. AMGN 159.81 144.56 ▼ 3.49 31 32.43
Amazon.com Inc. AMZN 312.39 320.74 ▼ -1.96 7 0.26 w
Activision Blizzard ATVI 20.65 21.37 ▲ -1.77 17 -2.13 spBuy
Avago Technologies AVGO 106.98 89.79 ▼ 8.01 13 31.25
Bed Bath & Beyond BBBY 76.62 68.03 ▼ 7.06 22 18.88
Baidu, Inc. BIDU 233.32 212.05 ▼ 0.11 35 38.85
Biogen Idec Inc. BIIB 357.53 322.20 ▲ 3.39 7 4.70
Broadcom Corp. BRCM 41.96 39.82 ▼ 2.81 13 5.75
CA Technologies CA 31.01 29.11 ▼ 4.37 11 3.20
Celgene Corporation CELG 123.89 100.83 ▼ 7.47 33 52.96
Cerner Corporation CERN 67.22 60.51 ▲ 4.56 26 18.87
Check Point Software Techn. CHKP 80.06 74.42 ▼ 6.35 13 10.34
CH Robinson Worldwide CHRW 74.12 68.32 ▼ 3.76 40 30.29
Charter Communications CHTR 158.93 152.83 ▼ 2.05 13 1.14 w
Comcast Corporation CMCSA 56.31 54.19 ▼ 2.61 12 1.90
Costco Wholesale COST 142.05 131.28 ▼ 6.50 34 22.63
Cisco Systems, Inc. CSCO 28.21 25.27 ▼ 7.48 11 12.66
Catamaran CTRX 52.07 47.17 ▼ 4.61 12 10.34
Cognizant Technology Solutions CTSH 56.06 49.76 ▲ 5.42 12 14.46
Citrix Systems, Inc. CTXS 60.97 66.00 ▼ -3.99 15 -6.92
Discovery Communications DISCA 29.84 36.03 ▼ -4.02 19 -26.18
Discovery Communications DISCK 28.98 35.52 ▼ -4.51 19 -25.16
Dish Network Corp. DISH 73.65 67.53 ▼ 3.64 10 14.03
Dollar Tree, Inc. DLTR 72.07 62.44 ▼ 8.30 33 26.75
DIRECTV, Inc. DTV 85.23 84.48 ▼ -0.54 4 -1.76 w
eBay Inc. EBAY 56.76 53.16 ▼ 2.59 10 4.40
Equinix, Inc. EQIX 230.60 211.04 ▼ 3.00 11 8.01
Express Scripts Inc. ESRX 84.80 79.08 ▼ 7.05 23 15.85
Expeditors Intl. of Washington EXPD 44.29 42.33 ▼ 1.60 12 3.75
Expedia Inc. EXPE 87.44 82.06 ▼ 1.09 12 3.19
Fastenal Company FAST 46.29 44.80 ▼ 1.90 7 -1.51 w
Facebook, Inc. FB 77.83 72.61 ▼ 1.36 78 128.44
F5 Networks, Inc. FFIV 114.85 128.26 ▼ 1.66 0 0.00 Sell
Fiserv, Inc. FISV 74.06 66.90 ▲ 6.29 163 154.94
Twenty-First Century Fox FOXA 34.29 36.84 ▼ 1.67 2 -3.41
Gilead Sciences Inc. GILD 105.54 96.19 ▲ -1.16 0 0.00 Buy
Keurig Green Mountain GMCR 131.08 140.36 ▼ -1.75 3 -0.10
Google Inc. GOOG 539.95 546.82 ▲ -3.38 15 -0.93 spBuy
Google Inc. GOOGL 541.95 554.09 ▲ -3.86 15 -2.37 spBuy
Garmin Ltd. GRMN 53.01 55.20 ▼ -1.67 6 1.01 w
Henry Schein, Inc. HSIC 143.33 130.03 ▼ 8.40 12 19.37
Illumina Inc. ILMN 197.16 176.62 ▼ 1.94 13 3.86
Intel Corporation INTC 36.44 33.22 ▼ 4.68 71 57.17
Intuit Inc. INTU 89.42 89.72 ▼ 1.77 1 2.72 w
Intuitive Surgical ISRG 517.57 485.97 ▼ 3.66 30 22.82
KLA-Tencor KLAC 65.24 73.78 ▼ -4.05 8 -5.55
Kraft Foods Group KRFT 66.72 59.99 ▲ 8.19 11 15.23
Liberty Global Inc. LBTYA 46.79 46.06 ▼ 2.53 13 4.14 w
Linear Technology LLTC 46.76 43.99 ▼ 2.88 8 1.65
Liberty Capital Group LMCA 34.55 35.94 ▼ -1.42 6 -0.46 w
Liberty Media C LMCK 34.51 34.25 ▼ -0.68 3 0.29 w
Liberty Ventures LVNTA 37.66 34.95 ▼ 1.67 10 4.73

Marriott International MAR 78.51 68.20 ▼ 5.98 71 82.50
Mattel Inc. MAT 28.04 32.40 ▼ -4.67 52 -34.16
Mondelez International MDLZ 36.94 35.85 ▼ 1.54 11 -2.02 w
Monster Beverage MNST 119.31 99.20 ▲ 8.02 24 72.29
Microsoft MSFT 47.18 44.54 ▼ 0.90 96 71.65
Micron Technology MU 30.95 33.51 ▼ -0.09 1 4.88
Maxim Integrated Products MXIM 33.76 30.18 ▲ 4.45 7 8.17
Mylan, Inc. MYL 54.21 52.26 ▼ 2.54 16 7.09 w
Netflix, Inc. NFLX 437.45 355.59 ▲ -3.68 0 0.00 Buy
NetApp, Inc. NTAP 39.48 41.34 ▼ -1.08 1 1.52
NVIDIA Corporation NVDA 20.71 19.35 ▼ 1.99 12 3.60
NXP Semiconductors NV NXPI 80.23 70.08 ▼ 4.34 13 22.73
O'Reilly Automotive ORLY 190.08 172.07 ▼ 8.24 114 110.97
Paychex, Inc. PAYX 48.38 45.00 ▼ 3.19 27 14.89
PACCAR Inc. PCAR 64.55 63.71 ▼ 2.30 12 -1.00 w
priceline.com Inc PCLN 1037.99 1150.14 ▼ -2.81 11 -5.02
QUALCOMM Inc QCOM 72.18 75.31 ▼ -0.39 1 0.60
Liberty Interactive QVCA 28.66 27.01 ▼ 4.15 13 12.04
Regeneron Pharmaceuticals REGN 420.21 372.23 ▼ 3.41 29 34.64
Ross Stores Inc. ROST 94.67 83.23 ▼ 8.66 22 27.33
SBA Communications SBAC 118.38 108.43 ▲ -0.08 38 25.16
Starbucks SBUX 88.22 77.61 ▲ 4.21 11 13.63
Sigma-Aldrich Corp SIAL 137.69 123.72 ▼ 8.45 112 91.00
SIRIUS XM Radio Inc. SIRI 3.57 3.41 ▲ 0.89 10 1.42
SanDisk Corp. SNDK 79.68 96.47 ▼ -1.91 1 1.69
Staples, Inc. SPLS 16.79 14.59 ▼ 9.79 20 31.17 pP
Stericycle, Inc. SRCL 135.10 124.95 ▼ 7.11 13 10.45
Seagate Technology STX 63.98 60.84 ▼ 3.61 12 1.67 w
Symantec Corporation SYMC 26.65 24.15 ▼ 3.57 13 11.23
TripAdvisor Inc. TRIP 69.77 81.83 ▲ -3.41 17 -23.52
Tractor Supply Co TSCO 79.71 71.95 ▼ 5.75 13 11.37
Tesla Motors, Inc. TSLA 201.29 232.29 ▼ -3.99 7 -9.01
Texas Instruments TXN 55.06 51.21 ▼ 4.76 12 11.01
Viacom, Inc. VIAB 67.80 76.29 ▼ -2.14 25 -17.57
VimpelCom Ltd. VIP 3.93 5.77 ▲ -7.24 52 -65.92
Vodafone Group plc VOD 35.93 33.53 ▼ 1.43 10 0.93
Verisk Analytics VRSK 65.11 61.93 ▼ 1.78 11 1.47
Vertex Pharmaceuticals Inc VRTX 125.57 107.66 ▼ 4.24 30 33.91
Western Digital WDC 106.10 99.42 ▼ 6.20 12 7.48
Whole Foods Market WFM 53.18 45.02 ▼ 8.30 11 14.05
Wynn Resorts Ltd. WYNN 146.01 172.94 ▲ -5.82 21 -22.79 spBuy
Xilinx Inc. XLNX 39.28 44.40 ▼ -1.28 1 -5.24
Yahoo! Inc. YHOO 48.95 43.90 ▼ 4.18 23 33.13
Popular ETF
Weekly Current Mode RevL (W) MoM (W) Weeks % Ch. Action
All Country World Index ETF ACWI 58.76 59.41 ▼ -1.60 6 1.22 w
Ultra Silver ETF AGQ 51.18 44.80 ▲ -1.33 0 0.00 Buy
CSI300 China A shares ETF ASHR 36.88 29.36 ▲ 10.00 26 50.29
Ultra Nasdaq Biotech ETF BIB 141.04 113.30 ▼ 5.41 33 64.00
Ultrashort Nasdaq Biotech ETF BIS 40.22 55.86 ▲ -4.33 175 -95.16
Central Europe & Russia Fund CEE 20.68 23.79 ▲ -8.36 25 -23.83 spBuy
Healthcare Bull 3X ETF CURE 137.96 112.00 ▼ 5.80 13 27.15
DB Commodity Tracking ETF DBC 17.29 21.98 ▲ -10.00 28 -32.83
Gold Miners Bear 3x ETF DUST 13.29 27.95 ▼ -3.33 3 -39.59
Japan Hedged Equity ETF DXJ 49.39 51.96 ▼ -3.76 5 -1.79
Emerging Markets Bear 3X ETF EDZ 33.01 37.40 ▼ 2.29 0 0.00 Sell
iShares MSCI Emerging Markets EEM 40.76 41.71 ▲ -4.77 17 -1.47 w
JPM USD Emerging Markets Bonds EMB 111.65 112.70 ▲ -4.74 6 3.34 w
Ultrashort Euro ETF EUO 25.09 19.72 ▲ 10.00 35 45.53
MSCI Australia ETF EWA 22.00 24.01 ▲ -8.02 18 -11.11
MSCI Sweden ETF EWD 31.30 33.18 ▼ -4.25 28 -10.06
MSCI Germany ETF EWG 27.76 28.29 ▼ -0.57 6 -0.29 w
MSCI Hong Kong ETF EWH 21.56 20.66 ▲ -1.96 0 0.00 Buy
MSCI Italy ETF EWI 13.63 14.74 ▲ -5.36 25 -16.48 spBuy
MSCI Japan ETF EWJ 11.46 11.70 ▲ -2.26 6 1.24 spBuy
MSCI Switzerland ETF EWL 32.36 32.90 ▲ -1.16 6 0.87 spBuy
MSCI Spain ETF EWP 33.04 37.24 ▼ -6.46 17 -14.71
MSCI France ETF EWQ 24.95 26.13 ▲ -4.18 28 -12.58 spBuy
MSCI Singapore ETF EWS 12.97 13.30 ▼ -4.27 16 -2.41
MSCI Taiwan ETF EWT 15.78 15.06 ▲ -2.57 0 0.00 Buy
MSCI United Kingdom ETF EWU 18.20 19.15 ▲ -6.05 17 -6.48 spBuy
MSCI Mexico ETF EWW 59.70 64.85 ▲ -8.08 15 -10.29
MSCI Brazil ETF EWZ 36.80 42.60 ▲ -6.22 17 -15.54
MSCI South Africa ETF EZA 67.87 64.40 ▲ -1.71 0 0.00 Buy
MSCI EMU ETF EZU 36.55 38.27 ▼ -3.49 25 -7.87
Financial Bull 3X ETF FAS 116.27 121.91 ▼ 2.72 1 2.33 w
Currencyshares Euro FXE 110.33 125.38 ▼ -9.82 36 -18.56
FTSE China 25 Index ETF FXI 43.75 39.43 ▲ 4.34 12 10.56
Currencyshares Japanese Yen FXY 82.57 86.93 ▲ -8.47 118 -32.85
Gold Miners ETF GDX 21.74 19.98 ▲ -0.14 1 -4.10
Junior Gold Miners ETF GDXJ 27.62 32.04 ▲ -2.92 19 -26.93
SPDR Gold Shares GLD 124.23 115.67 ▲ 1.84 1 0.49
Ultrashort Gold ETF GLL 83.38 98.42 ▼ -2.62 1 -1.12
FTSE Greece 20 ETF GREK 13.06 16.80 ▼ -6.15 28 -40.39
US$ High Yield HYG 90.01 91.27 ▲ -3.66 10 -1.60
Biotech ETF IBB 322.41 286.05 ▼ 5.40 33 30.97
Indonesia ETF IDX 24.92 25.11 ▲ -2.31 16 2.38 spBuy
7-10 Year Treasury Bond ETF IEF 109.24 105.33 ▲ 6.13 52 9.57
Latin America 40 ETF ILF 32.02 36.04 ▲ -6.98 16 -17.24
India Bull 3X ETF INDL 104.42 84.80 ▲ -1.68 1 6.17
S&P India Nifty 50 ETF INDY 33.03 29.78 ▲ 1.21 2 7.38
US Home Construction ETF ITB 24.82 24.33 ▼ 2.68 13 3.55 w
Russell 1000 Value ETF IWD 103.42 100.78 ▼ 2.05 13 4.25
Russell 1000 Growth ETF IWF 96.15 92.65 ▼ 2.30 13 5.41
Russell 2000 ETF IWM 118.12 114.36 ▼ 2.36 12 1.17
US Real Estate ETF IYR 82.33 74.13 ▲ 8.78 14 15.34
Korea ETF KEF 7.94 8.21 ▲ -3.46 17 -4.91
S&P Regional Banking ETF KRE 37.91 39.87 ▼ -0.70 2 -0.05
Gold Miners Bull 3X ETF NUGT 17.64 23.04 ▲ -2.46 20 -52.26
Oil Services ETF OIH 33.53 44.42 ▲ -8.83 19 -35.27 spBuy
UltraShort QQQ ETF QID 38.45 44.46 ▲ -3.38 112 -66.96
Ultra QQQ ETF QLD 139.18 125.38 ▼ 2.62 13 12.20
PowerShares QQQ QQQ 104.26 98.76 ▼ 2.56 13 5.96
Global Robotics & Automation E ROBO 25.21 26.28 ▼ -2.55 16 -3.26
Russia ETF RSX 15.96 19.86 ▲ -8.31 25 -33.50
Ultrashort Crude Oil ETF SCO 102.80 51.77 ▲ 10.00 25 266.10
Ultrashort Utilities ETF SDP 43.75 54.16 ▼ -6.36 107 -60.67

UltraShort S&P500 ETF SDS 22.08 24.07 ▲ -3.26 13 -10.97
Short S&P500 ETF SH 21.82 22.74 ▲ -3.26 13 -5.50
Silver ETF SLV 17.51 16.13 ▲ -0.67 0 0.00 Buy
Semiconductor ETF SMH 55.11 51.85 ▼ 3.84 12 7.11
Social Media ETF SOCL 18.40 19.05 ▲ -2.97 7 0.66 spBuy
Semiconductor Bull 3X ETF SOXL 129.99 115.57 ▼ 3.55 12 15.66
S&P500 Bull 3X ETF SPXL 86.51 79.52 ▼ 2.25 12 4.61
S&P500 Bear 3X ETF SPXS 20.59 23.78 ▲ -3.42 137 -81.84
SPDR S&P 500 SPY 204.97 198.88 ▼ 2.11 13 4.72
Ultra S&P 500 ETF SSO 127.20 119.81 ▼ 2.39 13 9.85
Ultrashort 20+ Year Treasury E TBT 40.38 51.66 ▼ -8.11 53 -45.30
Technology Bull 3X ETF TECL 139.44 120.79 ▼ 2.61 13 16.91
MSCI Thailand ETF THD 81.57 78.49 ▲ -3.42 0 0.00 Buy
20+ Year Tr. Bond ETF TLT 134.77 120.87 ▲ 8.97 47 26.83
Daily 20+ Yr Treasury Bull 3X TMF 104.60 77.80 ▲ 9.62 52 106.23
Small Cap Bull 3X ETF TNA 77.29 71.14 ▼ 1.88 12 1.71 w
Turkey ETF TUR 57.36 52.69 ▲ 2.38 10 5.40
Daily 2x VIX ETN TVIX 2.82 3.83 ▲ -0.66 164 -99.93
Small Cap Bear 3X ETF TZA 12.27 14.18 ▲ -3.21 12 -9.04
Ultra 20+ Year Treasury ETF UBT 91.69 74.84 ▲ 9.14 52 63.80
Ultra Crude Oil ETF UCO 7.14 21.59 ▲ -9.11 25 -79.00
DB US Dollar Index Bearish ETF UDN 22.47 25.06 ▼ -10.00 35 -16.62
3X Long Natural Gas ETN UGAZ 3.63 12.55 ▼ -4.14 10 -75.32
Ultra Gold ETF UGL 45.96 40.12 ▲ 1.51 1 1.12
US Natural Gas ETF UNG 14.97 20.18 ▼ -7.53 7 -20.25
Ultra Utilities ETF UPW 115.56 98.32 ▲ 7.77 22 34.15
Uranium ETF URA 10.11 12.80 ▼ -5.45 38 -32.69
Ultra Real Estate ETF URE 121.24 98.16 ▲ 9.41 14 34.64
United States Oil ETF USO 17.00 27.73 ▲ -10.00 25 -53.04
DB US Dollar Index Bullish ETF UUP 25.21 22.99 ▲ 10.00 26 16.61
FTSE Europe ETF VGK 52.81 54.76 ▲ -3.87 25 -7.32 spBuy
Vietnam ETF VNM 18.65 20.59 ▲ -7.10 14 -11.02 spBuy
Vanguard REIT ETF VNQ 87.88 78.58 ▲ 8.89 14 17.49
FTSE Pacific ETF VPL 57.77 59.51 ▲ -4.22 11 -2.92 spBuy
FTSE Emerging Markets ETF VWO 41.66 41.83 ▲ -3.63 6 7.57 w
S&P 500 VIX ST Futures ETN VXX 32.10 29.96 ▲ 1.17 1 -6.58 w

Materials Select Sector ETF XLB 48.25 49.31 ▼ -0.82 6 2.73 w
Energy Select Sector ETF XLE 76.66 86.76 ▲ -6.67 17 -15.58 spBuy
Financial Select Sector ETf XLF 23.77 24.32 ▼ 1.82 1 0.89 w
Industrial Select Sector ETF XLI 55.99 54.33 ▼ 1.70 13 4.50
Technology Select Sector ETF XLK 41.45 39.17 ▼ 2.82 13 5.93
Consumer Staples Select Sector XLP 49.65 46.35 ▼ 7.09 47 20.36
Utilities Select Sector ETF XLU 49.14 45.11 ▲ 6.78 54 32.02
Health Care Select Sector ETF XLV 70.94 65.57 ▼ 5.70 137 101.93
Consumer Discrectionary Select XLY 70.93 68.41 ▼ 3.37 12 3.91
S&P Oil & Gas Explor & Prodtn XOP 45.52 59.14 ▲ -8.00 19 -37.71
Ultrashort Yen YCS 86.22 79.53 ▼ 8.45 25 29.73
China Bull 3X ETF YINN 41.15 30.62 ▲ 4.82 12 32.83
S&P 500 stocks
Weekly Current Mode RevL (W) MoM (W) Weeks % Ch. Action
Agilent Technologies A 38.81 45.55 ▲ -6.87 15 -27.77
Alcoa, Inc. AA 15.76 15.04 ▼ -1.27 2 -3.90 w
Apple Inc. AAPL 112.98 100.01 ▼ 2.97 39 39.53
AbbVie Inc. ABBV 62.43 61.67 ▼ 2.81 13 3.45 w
AmerisourceBergen ABC 94.73 83.51 ▼ 8.55 36 38.23
Abbott Laboratories ABT 43.86 42.61 ▼ 3.22 13 3.37 w
ACE Limited ACE 112.88 108.35 ▼ 3.75 23 8.69
Accenture plc ACN 89.22 84.51 ▼ 6.06 12 10.11
Actavis plc ACT 279.12 246.63 ▲ 4.25 148 326.14
Adobe Systems Inc. ADBE 74.06 69.42 ▼ 2.01 12 5.91
Analog Devices Inc. ADI 54.51 51.74 ▼ 4.83 11 8.67
Archer Daniels Midland ADM 47.87 50.11 ▼ 0.40 1 1.44
Automatic Data Processing ADP 86.85 77.22 ▼ 7.02 38 28.01
Alliance Data Systems ADS 298.54 272.19 ▼ 3.53 13 9.36
Autodesk, Inc. ADSK 58.19 55.99 ▼ 1.10 12 0.73 w
ADT Corporation ADT 34.97 35.80 ▼ -0.01 1 3.52 w
Ameren Corporation AEE 46.33 42.49 ▼ 7.12 13 12.37
American Electric Power Co. AEP 64.52 56.88 ▲ 8.08 21 20.24
AES Corporation AES 12.68 14.04 ▼ -1.97 2 -1.48
Aetna Inc. AET 94.48 85.46 ▲ 5.49 12 14.13
AFLAC Inc. AFL 58.73 60.42 ▼ 0.41 2 0.21 w
Allergan Inc. AGN 224.17 189.87 ▼ 8.09 61 127.61
American International Group AIG 51.51 54.79 ▼ -0.29 2 -3.07
Apartment Investment & Managem AIV 40.55 35.41 ▲ 8.57 14 21.30
Assurant Inc. AIZ 65.28 67.84 ▼ 0.20 1 0.14
Akamai Technologies AKAM 61.02 62.68 ▼ 0.79 1 2.13 w
Allstate Corporation ALL 71.43 65.63 ▼ 8.47 49 35.25
Allegion plc ALLE 54.48 51.63 ▼ 3.04 12 2.48
Altera Corp. ALTR 34.26 36.88 ▼ 1.59 1 -1.97
Alexion Pharmaceuticals ALXN 183.32 176.30 ▼ 0.27 36 16.92 w
Applied Materials AMAT 24.11 22.78 ▼ 3.97 12 8.65
Advanced Micro Devices AMD 2.45 2.93 ▲ -3.85 18 -35.70
Affiliated Managers Group AMG 206.54 208.08 ▼ 1.42 1 4.67 w
Amgen Inc. AMGN 159.81 144.56 ▼ 3.49 31 32.43
Ameriprise Financial AMP 129.48 123.27 ▼ 1.88 12 2.32
American Tower AMT 99.60 96.18 ▼ 1.05 66 27.04
Amazon.com Inc. AMZN 312.39 320.74 ▼ -1.96 7 0.26 w
AutoNation Inc. AN 59.41 55.34 ▼ 3.39 12 3.86
Aon Corporation AON 94.42 90.75 ▼ 6.06 11 5.52
Apache Corp. APA 62.88 81.23 ▲ -8.23 16 -28.06
Anadarko Petroleum APC 81.44 93.47 ▲ -5.00 16 -17.83
Air Products & Chemicals APD 143.46 132.73 ▼ 4.21 13 9.99
Amphenol Corporation APH 54.91 50.65 ▼ 4.12 12 8.39
Airgas Inc. ARG 113.89 115.12 ▼ 0.87 1 2.24 w
Allegheny Technologies ATI 27.32 35.09 ▼ -3.59 17 -28.82
Avalonbay Communities AVB 178.90 158.05 ▲ 9.05 50 39.47
Avago Technologies AVGO 106.98 89.79 ▼ 8.01 13 31.25
Avon Products Inc. AVP 7.98 10.66 ▼ -8.04 64 -56.19
Avery Dennison AVY 52.58 49.05 ▼ 7.06 11 10.23 pP
American Express AXP 84.13 91.66 ▼ 0.05 1 -2.70
AutoZone Inc. AZO 604.00 569.54 ▼ 6.97 13 12.44
Boeing Co. BA 134.62 126.05 ▲ 1.91 4 2.20
Bank of America BAC 15.73 17.22 ▼ -0.56 1 0.90
Baxter International BAX 71.43 71.36 ▼ 0.86 7 -3.72 w
Bed Bath & Beyond BBBY 76.62 68.03 ▼ 7.06 22 18.88
BB&T Corporation BBT 36.82 38.25 ▼ -0.33 2 -0.19
Best Buy Co. Inc. BBY 35.01 34.02 ▼ 2.70 30 13.05 w
CR Bard Inc. BCR 178.20 162.91 ▲ 6.16 15 19.05
Becton, Dickinson and BDX 143.40 128.24 ▼ 8.54 15 12.27
Franklin Resources BEN 53.31 56.14 ▼ -1.32 2 -0.75
Brown-Forman Corp. BF.B 92.92 88.58 ▲ -1.24 0 0.00 Buy
Baker Hughes BHI 58.40 62.54 ▲ -2.25 8 3.33
Biogen Idec Inc. BIIB 357.53 322.20 ▲ 3.39 7 4.70
Bank of New York Mellon BK 36.90 39.52 ▼ 0.35 1 -2.07
BlackRock, Inc. BLK 355.12 338.89 ▼ 2.38 12 3.55
Ball Corporation BLL 63.88 63.58 ▼ 1.93 80 41.99 w
Bristol-Myers Squibb BMY 62.07 55.89 ▼ 6.48 21 22.62
Broadcom Corp. BRCM 41.96 39.82 ▼ 2.81 13 5.75
Berkshire Hathaway BRK-B 138.07 127.14 ▲ 6.67 27 18.87
Boston Scientific BSX 14.84 12.81 ▲ 5.66 13 14.51
BorgWarner Inc. BWA 54.78 57.74 ▼ -2.69 19 -8.81 w
Boston Properties BXP 142.67 127.90 ▲ 8.21 15 19.86
Citigroup, Inc. C 48.62 52.85 ▼ -1.61 2 -4.33
CA Technologies CA 31.01 29.11 ▼ 4.37 11 3.20
ConAgra Foods, Inc. CAG 36.76 34.27 ▼ 4.64 23 15.27
Cardinal Health CAH 83.47 76.64 ▼ 4.65 90 84.31
Cameron International CAM 43.86 57.84 ▲ -8.21 16 -30.28 spBuy
Caterpillar Inc. CAT 85.61 97.17 ▼ -6.39 7 -13.23
Chubb Corporation CB 103.69 97.04 ▼ 6.26 21 12.66
CBRE Group, Inc CBG 32.95 31.46 ▼ 5.21 12 2.97
CBS Corporation CBS 55.88 56.24 ▲ 0.80 26 -3.24 w
Coca-Cola Enterprises CCE 43.35 44.95 ▼ 0.06 1 0.02 w
Crown Castle International CCI 86.83 78.19 ▲ 1.29 2 5.99
Carnival Corporation CCL 46.38 42.26 ▼ 7.41 12 15.32
Celgene Corporation CELG 123.89 100.83 ▼ 7.47 33 52.96
Cerner Corporation CERN 67.22 60.51 ▲ 4.56 26 18.87
CF Industries Holdings CF 301.75 260.99 ▲ 5.03 4 9.88
CareFusion CFN 59.77 54.52 ▼ 8.41 37 45.43
Chesapeake Energy CHK 19.66 22.82 ▲ -4.34 27 -27.16
CH Robinson Worldwide CHRW 74.12 68.32 ▼ 3.76 40 30.29
Cigna Corp. CI 109.97 95.88 ▲ 6.72 38 33.75
Cincinnati Financial CINF 52.05 49.68 ▼ 3.50 13 7.28
Colgate-Palmolive Co. CL 67.14 66.76 ▼ 3.00 12 0.51 w
The Clorox Company CLX 108.40 99.21 ▲ 8.05 18 14.35
Comerica CMA 41.87 47.06 ▼ -3.92 15 -10.23
Comcast Corporation CMCSA 56.31 54.19 ▼ 2.61 12 1.90
CME Group Inc. CME 88.51 81.06 ▼ 4.75 26 17.78
Chipotle Mexican Grill CMG 713.69 648.85 ▲ 4.01 10 6.84
Cummins Inc. CMI 145.85 140.14 ▼ 0.79 12 -0.12 w
CMS Energy Corp. CMS 37.55 32.84 ▲ 8.53 54 40.13
CenterPoint Energy CNP 22.97 24.01 ▲ -2.47 7 -2.34 spBuy
CONSOL Energy Inc. CNX 30.33 37.76 ▼ -5.78 7 -16.40
Capital One Financial COF 77.60 81.99 ▼ -1.40 2 -2.75
Cabot Oil & Gas COG 28.48 32.18 ▼ -2.91 7 -5.76
Coach, Inc. COH 37.62 35.68 ▲ 1.80 2 -0.97 w
Rockwell Collins COL 87.26 81.61 ▼ 3.59 13 10.36
ConocoPhillips COP 64.65 73.89 ▼ -4.84 16 -14.12
Costco Wholesale COST 142.05 131.28 ▼ 6.50 34 22.63
Covidien plc COV 108.07 95.68 ▼ 7.67 13 20.74
Campbell Soup Co. CPB 46.70 43.88 ▲ 2.92 12 6.04
Salesforce.com CRM 58.62 60.06 ▼ -0.66 1 3.39 w
Computer Sciences CSC 64.45 60.40 ▼ 2.96 10 4.37
Cisco Systems, Inc. CSCO 28.21 25.27 ▼ 7.48 11 12.66
CSX Corp. CSX 34.47 33.60 ▼ 1.22 14 6.49 w
Cintas Corporation CTAS 79.78 70.09 ▲ 8.47 161 135.95
CenturyLink, Inc. CTL 39.24 40.04 ▼ -1.19 2 1.92 w
Cognizant Technology Solutions CTSH 56.06 49.76 ▲ 5.42 12 14.46
Citrix Systems, Inc. CTXS 60.97 66.00 ▼ -3.99 15 -6.92
Cablevision Systems CVC 19.69 18.78 ▼ 2.99 13 5.92 w
CVS Caremark CVS 100.62 87.14 ▲ 9.34 67 71.46
Chevron Corporation CVX 106.85 118.18 ▲ -4.64 19 -12.63 spBuy
Dominion Resources D 79.09 72.86 ▲ 5.88 21 12.46
Delta Air Lines Inc. DAL 50.56 42.65 ▼ 6.13 13 28.39
DuPont Co. DD 73.79 69.60 ▼ 4.12 18 3.57
Deere & Company DE 88.35 85.09 ▼ 1.81 11 -0.07
Discover Financial Services DFS 56.58 64.57 ▼ -1.53 1 -6.48
Dollar General DG 69.50 65.41 ▼ 4.18 22 8.59
Quest Diagnostics DGX 70.89 63.50 ▲ 6.39 13 11.27
DR Horton Inc. DHI 23.10 22.90 ▼ 2.50 13 0.61 w
Danaher Corp. DHR 84.14 81.10 ▼ 4.69 13 8.62
Walt Disney Co. DIS 94.72 89.08 ▼ 4.28 13 7.07 pP
Discovery Communications DISCA 29.84 36.03 ▼ -4.02 19 -26.18
Discovery Communications DISCK 28.98 35.52 ▼ -4.51 19 -25.16
Delphi Automotive DLPH 69.67 70.49 ▼ 1.65 1 3.37 w
Dollar Tree, Inc. DLTR 72.07 62.44 ▼ 8.30 33 26.75
Dun & Bradstreet DNB 118.32 115.58 ▼ -0.35 5 -2.10 w
Denbury Resources DNR 6.80 11.97 ▲ -8.96 24 -59.11
Diamond Offshore Drilling DO 32.11 39.99 ▼ -2.32 75 -49.68
Dover Corp. DOV 69.76 78.96 ▼ -6.07 17 -13.56
Dow Chemical Co. DOW 44.57 48.61 ▲ -4.18 8 -7.82 spBuy
Dr Pepper Snapple Group DPS 78.51 66.06 ▲ 8.31 65 70.70
Darden Restaurants DRI 61.22 53.57 ▼ 8.11 18 20.11
DTE Energy Co. DTE 91.24 81.58 ▲ 7.74 51 34.98
DIRECTV, Inc. DTV 85.23 84.48 ▼ -0.54 4 -1.76 w
Duke Energy DUK 88.72 80.20 ▲ 7.20 41 24.48
DaVita, Inc. DVA 75.85 73.55 ▼ 0.63 60 27.61 w
Devon Energy DVN 60.16 66.25 ▲ -2.61 19 -13.96
Electronic Arts Inc. EA 49.79 42.03 ▼ 8.73 51 88.89
eBay Inc. EBAY 56.76 53.16 ▼ 2.59 10 4.40
Ecolab Inc. ECL 105.88 109.38 ▲ -4.68 8 -1.97 spBuy
Consolidated Edison ED 70.37 62.76 ▲ 8.35 31 23.78
Equifax Inc. EFX 85.24 77.26 ▲ 6.83 12 12.44
Edison International EIX 68.39 62.40 ▲ 7.44 51 41.33
Estee Lauder Companies EL 73.70 73.14 ▼ 1.17 5 -2.89 w
EMC Corporation EMC 28.70 29.70 ▼ 0.31 1 2.50 w
Eastman Chemical Co. EMN 69.14 79.38 ▼ -4.32 6 -5.66
Emerson Electric Co. EMR 58.12 63.58 ▼ -2.56 6 -1.38
EOG Resources, Inc. EOG 90.79 98.54 ▲ -2.36 16 -6.25
Equity Residential EQR 79.80 68.21 ▲ 9.22 15 22.60
EQT Corporation EQT 75.06 89.12 ▼ -5.99 8 -16.61
Express Scripts Inc. ESRX 84.80 79.08 ▼ 7.05 23 15.85
Essex Property Trust ESS 227.86 196.92 ▲ 9.15 51 45.48
Ensco plc ESV 28.66 39.33 ▲ -8.02 25 -43.12
E*TRADE Financial ETFC 24.56 21.76 ▼ 1.67 12 10.09
Eaton Corporation ETN 67.01 68.85 ▼ -0.02 1 3.27 w
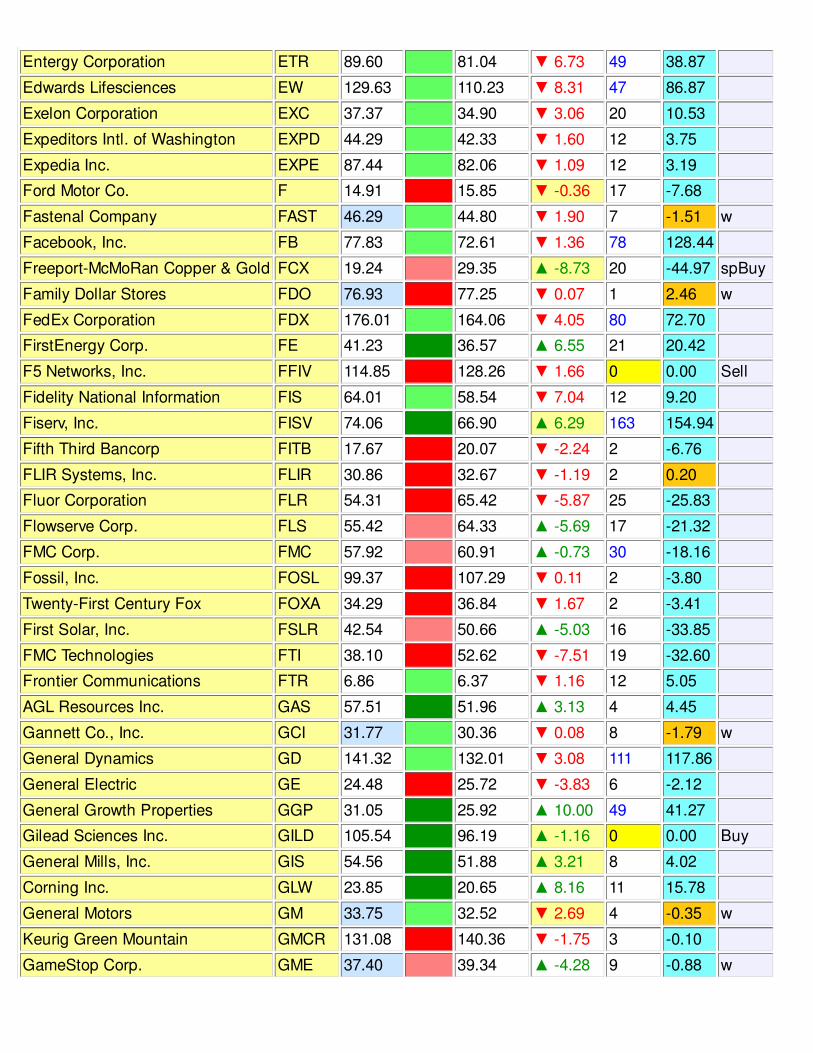
Entergy Corporation ETR 89.60 81.04 ▼ 6.73 49 38.87
Edwards Lifesciences EW 129.63 110.23 ▼ 8.31 47 86.87
Exelon Corporation EXC 37.37 34.90 ▼ 3.06 20 10.53
Expeditors Intl. of Washington EXPD 44.29 42.33 ▼ 1.60 12 3.75
Expedia Inc. EXPE 87.44 82.06 ▼ 1.09 12 3.19
Ford Motor Co. F 14.91 15.85 ▼ -0.36 17 -7.68
Fastenal Company FAST 46.29 44.80 ▼ 1.90 7 -1.51 w
Facebook, Inc. FB 77.83 72.61 ▼ 1.36 78 128.44
Freeport-McMoRan Copper & Gold FCX 19.24 29.35 ▲ -8.73 20 -44.97 spBuy
Family Dollar Stores FDO 76.93 77.25 ▼ 0.07 1 2.46 w
FedEx Corporation FDX 176.01 164.06 ▼ 4.05 80 72.70
FirstEnergy Corp. FE 41.23 36.57 ▲ 6.55 21 20.42
F5 Networks, Inc. FFIV 114.85 128.26 ▼ 1.66 0 0.00 Sell
Fidelity National Information FIS 64.01 58.54 ▼ 7.04 12 9.20
Fiserv, Inc. FISV 74.06 66.90 ▲ 6.29 163 154.94
Fifth Third Bancorp FITB 17.67 20.07 ▼ -2.24 2 -6.76
FLIR Systems, Inc. FLIR 30.86 32.67 ▼ -1.19 2 0.20
Fluor Corporation FLR 54.31 65.42 ▼ -5.87 25 -25.83
Flowserve Corp. FLS 55.42 64.33 ▲ -5.69 17 -21.32
FMC Corp. FMC 57.92 60.91 ▲ -0.73 30 -18.16
Fossil, Inc. FOSL 99.37 107.29 ▼ 0.11 2 -3.80
Twenty-First Century Fox FOXA 34.29 36.84 ▼ 1.67 2 -3.41
First Solar, Inc. FSLR 42.54 50.66 ▲ -5.03 16 -33.85
FMC Technologies FTI 38.10 52.62 ▼ -7.51 19 -32.60
Frontier Communications FTR 6.86 6.37 ▼ 1.16 12 5.05
AGL Resources Inc. GAS 57.51 51.96 ▲ 3.13 4 4.45
Gannett Co., Inc. GCI 31.77 30.36 ▼ 0.08 8 -1.79 w
General Dynamics GD 141.32 132.01 ▼ 3.08 111 117.86
General Electric GE 24.48 25.72 ▼ -3.83 6 -2.12
General Growth Properties GGP 31.05 25.92 ▲ 10.00 49 41.27
Gilead Sciences Inc. GILD 105.54 96.19 ▲ -1.16 0 0.00 Buy
General Mills, Inc. GIS 54.56 51.88 ▲ 3.21 8 4.02
Corning Inc. GLW 23.85 20.65 ▲ 8.16 11 15.78
General Motors GM 33.75 32.52 ▼ 2.69 4 -0.35 w
Keurig Green Mountain GMCR 131.08 140.36 ▼ -1.75 3 -0.10
GameStop Corp. GME 37.40 39.34 ▲ -4.28 9 -0.88 w
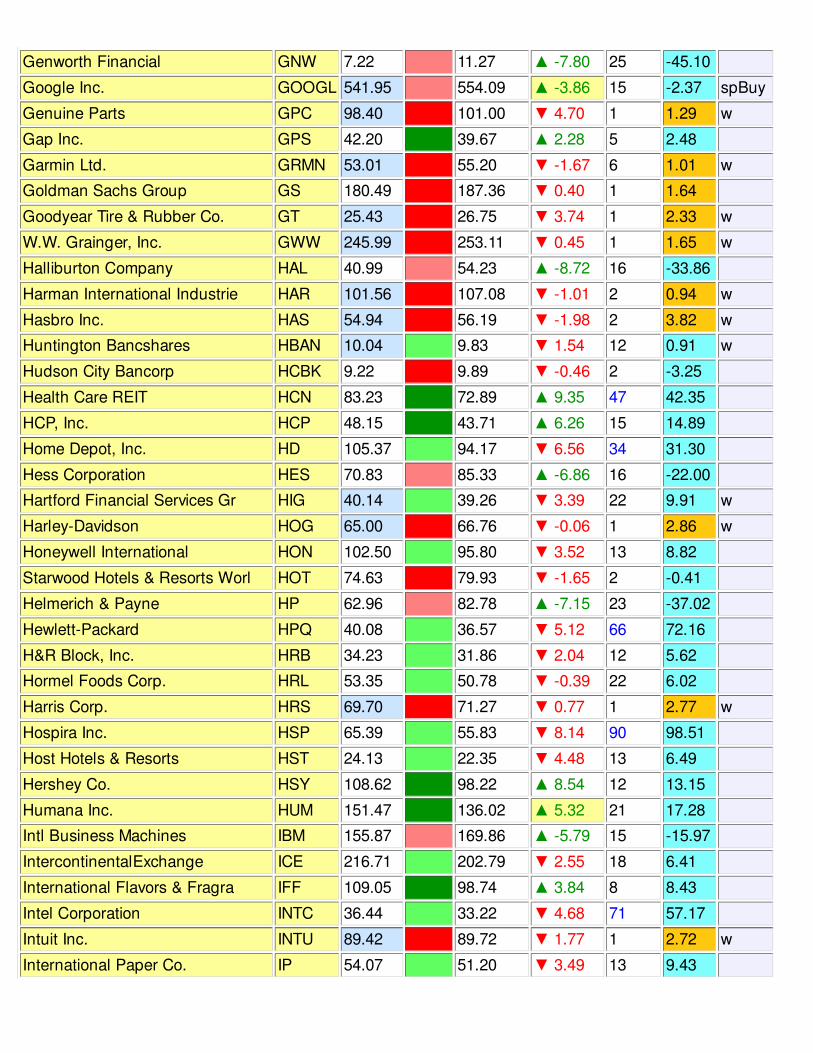
Genworth Financial GNW 7.22 11.27 ▲ -7.80 25 -45.10
Google Inc. GOOGL 541.95 554.09 ▲ -3.86 15 -2.37 spBuy
Genuine Parts GPC 98.40 101.00 ▼ 4.70 1 1.29 w
Gap Inc. GPS 42.20 39.67 ▲ 2.28 5 2.48
Garmin Ltd. GRMN 53.01 55.20 ▼ -1.67 6 1.01 w
Goldman Sachs Group GS 180.49 187.36 ▼ 0.40 1 1.64
Goodyear Tire & Rubber Co. GT 25.43 26.75 ▼ 3.74 1 2.33 w
W.W. Grainger, Inc. GWW 245.99 253.11 ▼ 0.45 1 1.65 w
Halliburton Company HAL 40.99 54.23 ▲ -8.72 16 -33.86
Harman International Industrie HAR 101.56 107.08 ▼ -1.01 2 0.94 w
Hasbro Inc. HAS 54.94 56.19 ▼ -1.98 2 3.82 w
Huntington Bancshares HBAN 10.04 9.83 ▼ 1.54 12 0.91 w
Hudson City Bancorp HCBK 9.22 9.89 ▼ -0.46 2 -3.25
Health Care REIT HCN 83.23 72.89 ▲ 9.35 47 42.35
HCP, Inc. HCP 48.15 43.71 ▲ 6.26 15 14.89
Home Depot, Inc. HD 105.37 94.17 ▼ 6.56 34 31.30
Hess Corporation HES 70.83 85.33 ▲ -6.86 16 -22.00
Hartford Financial Services Gr HIG 40.14 39.26 ▼ 3.39 22 9.91 w
Harley-Davidson HOG 65.00 66.76 ▼ -0.06 1 2.86 w
Honeywell International HON 102.50 95.80 ▼ 3.52 13 8.82
Starwood Hotels & Resorts Worl HOT 74.63 79.93 ▼ -1.65 2 -0.41
Helmerich & Payne HP 62.96 82.78 ▲ -7.15 23 -37.02
Hewlett-Packard HPQ 40.08 36.57 ▼ 5.12 66 72.16
H&R Block, Inc. HRB 34.23 31.86 ▼ 2.04 12 5.62
Hormel Foods Corp. HRL 53.35 50.78 ▼ -0.39 22 6.02
Harris Corp. HRS 69.70 71.27 ▼ 0.77 1 2.77 w
Hospira Inc. HSP 65.39 55.83 ▼ 8.14 90 98.51
Host Hotels & Resorts HST 24.13 22.35 ▼ 4.48 13 6.49
Hershey Co. HSY 108.62 98.22 ▲ 8.54 12 13.15
Humana Inc. HUM 151.47 136.02 ▲ 5.32 21 17.28
Intl Business Machines IBM 155.87 169.86 ▲ -5.79 15 -15.97
IntercontinentalExchange ICE 216.71 202.79 ▼ 2.55 18 6.41
International Flavors & Fragra IFF 109.05 98.74 ▲ 3.84 8 8.43
Intel Corporation INTC 36.44 33.22 ▼ 4.68 71 57.17
Intuit Inc. INTU 89.42 89.72 ▼ 1.77 1 2.72 w
International Paper Co. IP 54.07 51.20 ▼ 3.49 13 9.43
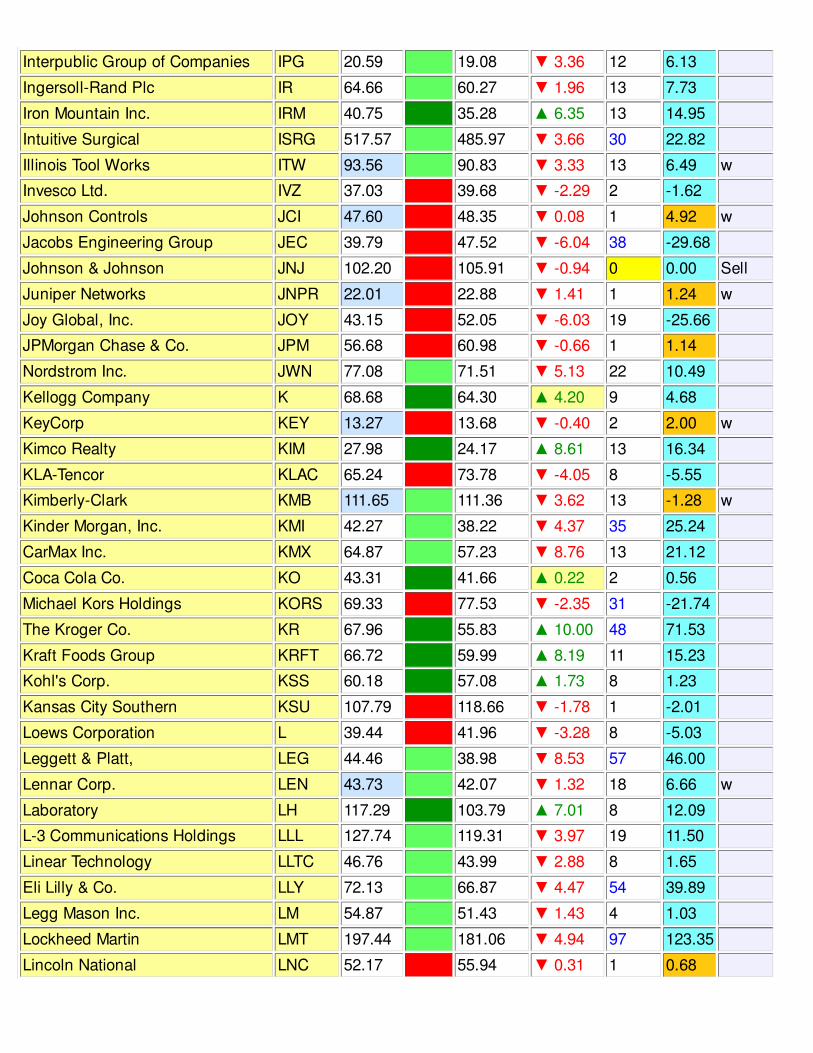
Interpublic Group of Companies IPG 20.59 19.08 ▼ 3.36 12 6.13
Ingersoll-Rand Plc IR 64.66 60.27 ▼ 1.96 13 7.73
Iron Mountain Inc. IRM 40.75 35.28 ▲ 6.35 13 14.95
Intuitive Surgical ISRG 517.57 485.97 ▼ 3.66 30 22.82
Illinois Tool Works ITW 93.56 90.83 ▼ 3.33 13 6.49 w
Invesco Ltd. IVZ 37.03 39.68 ▼ -2.29 2 -1.62
Johnson Controls JCI 47.60 48.35 ▼ 0.08 1 4.92 w
Jacobs Engineering Group JEC 39.79 47.52 ▼ -6.04 38 -29.68
Johnson & Johnson JNJ 102.20 105.91 ▼ -0.94 0 0.00 Sell
Juniper Networks JNPR 22.01 22.88 ▼ 1.41 1 1.24 w
Joy Global, Inc. JOY 43.15 52.05 ▼ -6.03 19 -25.66
JPMorgan Chase & Co. JPM 56.68 60.98 ▼ -0.66 1 1.14
Nordstrom Inc. JWN 77.08 71.51 ▼ 5.13 22 10.49
Kellogg Company K 68.68 64.30 ▲ 4.20 9 4.68
KeyCorp KEY 13.27 13.68 ▼ -0.40 2 2.00 w
Kimco Realty KIM 27.98 24.17 ▲ 8.61 13 16.34
KLA-Tencor KLAC 65.24 73.78 ▼ -4.05 8 -5.55
Kimberly-Clark KMB 111.65 111.36 ▼ 3.62 13 -1.28 w
Kinder Morgan, Inc. KMI 42.27 38.22 ▼ 4.37 35 25.24
CarMax Inc. KMX 64.87 57.23 ▼ 8.76 13 21.12
Coca Cola Co. KO 43.31 41.66 ▲ 0.22 2 0.56
Michael Kors Holdings KORS 69.33 77.53 ▼ -2.35 31 -21.74
The Kroger Co. KR 67.96 55.83 ▲ 10.00 48 71.53
Kraft Foods Group KRFT 66.72 59.99 ▲ 8.19 11 15.23
Kohl's Corp. KSS 60.18 57.08 ▲ 1.73 8 1.23
Kansas City Southern KSU 107.79 118.66 ▼ -1.78 1 -2.01
Loews Corporation L 39.44 41.96 ▼ -3.28 8 -5.03
Leggett & Platt, LEG 44.46 38.98 ▼ 8.53 57 46.00
Lennar Corp. LEN 43.73 42.07 ▼ 1.32 18 6.66 w
Laboratory LH 117.29 103.79 ▲ 7.01 8 12.09
L-3 Communications Holdings LLL 127.74 119.31 ▼ 3.97 19 11.50
Linear Technology LLTC 46.76 43.99 ▼ 2.88 8 1.65
Eli Lilly & Co. LLY 72.13 66.87 ▼ 4.47 54 39.89
Legg Mason Inc. LM 54.87 51.43 ▼ 1.43 4 1.03
Lockheed Martin LMT 197.44 181.06 ▼ 4.94 97 123.35
Lincoln National LNC 52.17 55.94 ▼ 0.31 1 0.68

Lorillard, Inc. LO 66.02 60.45 ▲ 3.36 72 53.04
Lowe's Companies LOW 69.71 58.33 ▼ 9.93 29 44.93 pP
Lam Research LRCX 80.42 72.74 ▼ 2.90 13 6.55
Leucadia National LUK 23.04 23.52 ▲ -2.97 17 -5.03 w
Southwest Airlines Co. LUV 45.78 34.84 ▼ 8.05 139 423.73
Level 3 Communications LVLT 49.94 44.99 ▼ 2.92 12 6.46
LyondellBasell Industries NV LYB 80.80 90.19 ▲ -5.43 16 -20.78
Macy's, Inc. M 65.83 61.20 ▼ 3.69 11 9.99
Mastercard MA 84.39 80.53 ▼ 3.41 12 0.68
Macerich Co. MAC 88.94 72.86 ▲ 10.00 15 34.37
Marriott International MAR 78.51 68.20 ▼ 5.98 71 82.50
Masco Corporation MAS 24.65 23.46 ▼ 2.92 11 5.52 w
Mattel Inc. MAT 28.04 32.40 ▼ -4.67 52 -34.16
McDonald's Corp. MCD 89.56 96.17 ▼ -2.39 27 -9.10
Microchip Technology MCHP 46.52 43.66 ▲ 1.15 7 1.02
McKesson Corporation MCK 217.67 199.43 ▲ 4.30 120 145.91
Moody's Corp. MCO 93.78 92.34 ▼ -0.74 100 96.29 w
Mondelez International MDLZ 36.94 35.85 ▼ 1.54 11 -2.02 w
Medtronic, Inc. MDT 76.95 69.18 ▼ 5.39 13 15.85
MetLife, Inc. MET 48.77 53.83 ▼ -2.12 6 -8.53
McGraw Hill Financial MHFI 91.82 86.46 ▼ 1.63 13 9.00
Mohawk Industries MHK 167.09 147.78 ▲ 6.49 12 17.31
Mead Johnson Nutrition MJN 98.36 95.38 ▼ 1.12 46 18.75 w
McCormick & Co. Inc. MKC 74.18 71.55 ▼ 4.55 12 5.00
Martin Marietta Materials MLM 109.83 119.55 ▼ -3.78 7 -6.43
Marsh & McLennan Companies MMC 56.65 54.59 ▼ 4.70 12 4.33
3M Co. MMM 164.02 150.59 ▼ 7.36 13 10.82
Mallinckrodt Plc MNK 106.98 89.54 ▲ 5.70 56 108.13
Monster Beverage MNST 119.31 99.20 ▲ 8.02 24 72.29
Altria Group Inc. MO 54.19 46.45 ▲ 8.10 46 49.16
Monsanto Co. MON 118.45 115.50 ▼ 2.05 10 -0.18 w
The Mosaic Company MOS 47.94 44.86 ▲ 1.86 9 4.20
Marathon Petroleum MPC 87.16 90.68 ▼ -0.96 1 12.52 w
Merck & Co. Inc. MRK 62.49 58.29 ▲ 1.96 2 -0.97
Marathon Oil MRO 26.52 33.36 ▲ -8.05 16 -27.84
Morgan Stanley MS 35.15 36.57 ▼ 2.69 1 3.38 w
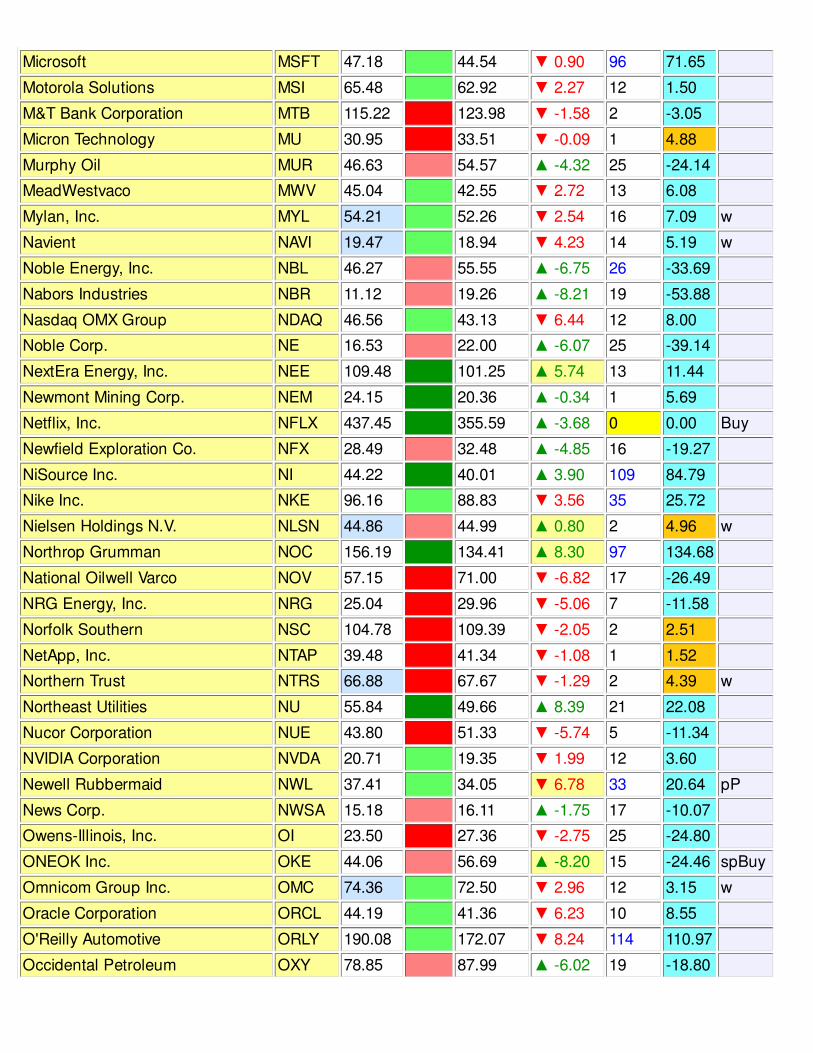
Microsoft MSFT 47.18 44.54 ▼ 0.90 96 71.65
Motorola Solutions MSI 65.48 62.92 ▼ 2.27 12 1.50
M&T Bank Corporation MTB 115.22 123.98 ▼ -1.58 2 -3.05
Micron Technology MU 30.95 33.51 ▼ -0.09 1 4.88
Murphy Oil MUR 46.63 54.57 ▲ -4.32 25 -24.14
MeadWestvaco MWV 45.04 42.55 ▼ 2.72 13 6.08
Mylan, Inc. MYL 54.21 52.26 ▼ 2.54 16 7.09 w
Navient NAVI 19.47 18.94 ▼ 4.23 14 5.19 w
Noble Energy, Inc. NBL 46.27 55.55 ▲ -6.75 26 -33.69
Nabors Industries NBR 11.12 19.26 ▲ -8.21 19 -53.88
Nasdaq OMX Group NDAQ 46.56 43.13 ▼ 6.44 12 8.00
Noble Corp. NE 16.53 22.00 ▲ -6.07 25 -39.14
NextEra Energy, Inc. NEE 109.48 101.25 ▲ 5.74 13 11.44
Newmont Mining Corp. NEM 24.15 20.36 ▲ -0.34 1 5.69
Netflix, Inc. NFLX 437.45 355.59 ▲ -3.68 0 0.00 Buy
Newfield Exploration Co. NFX 28.49 32.48 ▲ -4.85 16 -19.27
NiSource Inc. NI 44.22 40.01 ▲ 3.90 109 84.79
Nike Inc. NKE 96.16 88.83 ▼ 3.56 35 25.72
Nielsen Holdings N.V. NLSN 44.86 44.99 ▲ 0.80 2 4.96 w
Northrop Grumman NOC 156.19 134.41 ▲ 8.30 97 134.68
National Oilwell Varco NOV 57.15 71.00 ▼ -6.82 17 -26.49
NRG Energy, Inc. NRG 25.04 29.96 ▼ -5.06 7 -11.58
Norfolk Southern NSC 104.78 109.39 ▼ -2.05 2 2.51
NetApp, Inc. NTAP 39.48 41.34 ▼ -1.08 1 1.52
Northern Trust NTRS 66.88 67.67 ▼ -1.29 2 4.39 w
Northeast Utilities NU 55.84 49.66 ▲ 8.39 21 22.08
Nucor Corporation NUE 43.80 51.33 ▼ -5.74 5 -11.34
NVIDIA Corporation NVDA 20.71 19.35 ▼ 1.99 12 3.60
Newell Rubbermaid NWL 37.41 34.05 ▼ 6.78 33 20.64 pP
News Corp. NWSA 15.18 16.11 ▲ -1.75 17 -10.07
Owens-Illinois, Inc. OI 23.50 27.36 ▼ -2.75 25 -24.80
ONEOK Inc. OKE 44.06 56.69 ▲ -8.20 15 -24.46 spBuy
Omnicom Group Inc. OMC 74.36 72.50 ▼ 2.96 12 3.15 w
Oracle Corporation ORCL 44.19 41.36 ▼ 6.23 10 8.55
O'Reilly Automotive ORLY 190.08 172.07 ▼ 8.24 114 110.97
Occidental Petroleum OXY 78.85 87.99 ▲ -6.02 19 -18.80

Paychex, Inc. PAYX 48.38 45.00 ▼ 3.19 27 14.89
People's United Financial PBCT 14.57 15.00 ▼ 0.33 1 1.75 w
Pitney Bowes Inc. PBI 24.29 25.31 ▼ -1.52 18 -5.96 w
PACCAR Inc. PCAR 64.55 63.71 ▼ 2.30 12 -1.00 w
PG&E Corp. PCG 58.87 50.84 ▲ 8.73 13 24.86
Plum Creek Timber Co. PCL 44.75 41.49 ▲ 5.93 5 5.52
priceline.com Inc PCLN 1037.99 1150.14 ▼ -2.81 11 -5.02
Precision Castparts PCP 207.85 236.12 ▼ -2.08 2 -9.31
Patterson Companies PDCO 51.19 45.53 ▼ 8.68 22 25.74
Public Service Enterprise Grou PEG 44.00 39.74 ▲ 4.76 18 16.80
Pepsico, Inc. PEP 98.53 92.34 ▲ 1.93 46 20.82
PetSmart, Inc. PETM 81.50 75.52 ▼ 8.15 13 17.79
Pfizer Inc. PFE 32.45 30.64 ▲ 4.83 12 8.53
Principal Financial Group PFG 48.76 52.26 ▼ -1.85 1 0.95
Procter & Gamble Co. PG 90.08 86.33 ▼ 5.51 28 10.72
Progressive Corp. PGR 26.49 25.92 ▼ 1.81 21 4.21 w
Parker Hannifin PH 121.97 126.49 ▼ 1.40 1 1.46 w
PulteGroup, Inc. PHM 20.69 19.94 ▼ 3.75 13 6.54 w
PerkinElmer Inc. PKI 44.29 44.52 ▲ 0.19 6 5.63 spBuy
Prologis, Inc. PLD 45.31 41.44 ▲ 6.63 13 11.79
Pall Corp. PLL 100.72 92.56 ▼ 8.08 21 19.31
Philip Morris International PM 82.82 85.79 ▼ -3.37 6 -2.02
PNC Financial Services Group PNC 86.28 89.23 ▼ 1.30 1 1.83 w
Pentair, Inc. PNR 64.25 67.79 ▲ -1.00 29 -10.68
Pinnacle West Capital PNW 72.26 63.33 ▲ 9.22 21 26.68
Pepco Holdings, Inc. POM 27.39 26.51 ▲ 0.65 51 42.68
PPG Industries Inc. PPG 227.81 209.44 ▼ 7.98 12 11.64
PPL Corporation PPL 35.77 34.38 ▼ 2.50 15 5.64
Perrigo Co. PRGO 157.00 153.63 ▼ 2.86 16 0.87 w
Prudential Financial PRU 80.69 88.34 ▼ -0.48 2 -5.63
Public Storage PSA 202.75 183.73 ▲ 8.11 13 15.23
Phillips 66 PSX 68.52 74.84 ▼ -4.28 16 -11.82
PVH Corp. PVH 112.01 122.95 ▼ -0.51 2 -5.08
Quanta Services PWR 27.35 30.88 ▲ -7.16 15 -14.98 spBuy
Praxair Inc. PX 126.34 129.81 ▼ -0.30 1 1.99 w
Pioneer Natural Resources Co. PXD 152.86 181.35 ▲ -5.45 23 -24.81
QUALCOMM Inc QCOM 72.18 75.31 ▼ -0.39 1 0.60
QEP Resources, Inc. QEP 20.25 25.28 ▲ -6.58 19 -36.08
Ryder System, Inc. R 90.61 86.01 ▼ 0.92 12 2.21
Reynolds American RAI 69.01 61.68 ▲ 4.79 104 68.27
Royal Caribbean Cruises RCL 84.51 69.00 ▼ 9.26 80 141.83
Regeneron Pharmaceuticals REGN 420.21 372.23 ▼ 3.41 29 34.64
Regions Financial RF 9.01 10.20 ▼ -1.07 2 -7.59
Robert Half International RHI 59.42 51.30 ▼ 7.27 80 74.19
Red Hat, Inc. RHT 66.06 60.71 ▼ 6.68 31 20.37
Transocean Ltd. RIG 15.67 29.55 ▲ -9.14 26 -62.67
Ralph Lauren RL 168.77 176.90 ▼ 1.97 1 -1.22
Rockwell Automation ROK 106.86 113.10 ▼ -1.54 6 1.42
Roper Industries ROP 149.70 155.31 ▼ -0.27 1 1.77
Ross Stores Inc. ROST 94.67 83.23 ▼ 8.66 22 27.33
Range Resources RRC 48.64 66.57 ▼ -7.71 28 -40.36
Republic Services RSG 41.01 38.82 ▲ 3.67 49 19.42
Raytheon Co. RTN 106.80 101.77 ▼ 3.72 22 10.10
Science Applications Intl SAIC 50.84 46.61 ▼ 3.34 44 36.31
Starbucks SBUX 88.22 77.61 ▲ 4.21 11 13.63
SCANA Corp. SCG 63.74 56.25 ▲ 8.88 13 19.79
Charles Schwab Corp. SCHW 27.19 29.21 ▼ 0.27 1 0.70
Spectra Energy Corp. SE 33.77 38.79 ▼ -5.78 17 -13.19
Sealed Air SEE 40.04 39.18 ▼ 6.99 12 10.43 w
Sherwin-Williams Co. SHW 274.01 234.97 ▲ 9.87 70 50.65
Sigma-Aldrich Corp SIAL 137.69 123.72 ▼ 8.45 112 91.00
J. M. Smucker Co. SJM 106.49 99.87 ▲ 0.71 4 3.33
Schlumberger Limited SLB 82.00 95.08 ▲ -6.19 19 -19.63 spBuy
Snap-on Inc. SNA 134.34 124.56 ▼ 4.23 14 9.73
SanDisk Corp. SNDK 79.68 96.47 ▼ -1.91 1 1.69
Scripps Networks Interactive SNI 72.69 78.32 ▼ -1.58 3 -3.66
Southern Company SO 52.23 47.15 ▲ 7.72 49 22.92
Simon Property Group SPG 203.11 180.68 ▲ 8.50 13 17.49
Staples, Inc. SPLS 16.79 14.59 ▼ 9.79 20 31.17 pP
Stericycle, Inc. SRCL 135.10 124.95 ▼ 7.11 13 10.45
Sempra Energy SRE 115.08 107.06 ▲ 3.14 171 137.97
SunTrust Banks, Inc. STI 39.45 40.66 ▼ 1.49 2 1.91 w

St. Jude Medical STJ 64.99 63.80 ▼ 1.52 12 1.26 w
State Street Corp. STT 72.40 72.03 ▼ 1.81 13 1.27 w
Seagate Technology STX 63.98 60.84 ▼ 3.61 12 1.67 w
Constellation Brands STZ 110.61 93.96 ▲ 8.65 101 155.45
Stanley Black & Decker SWK 93.39 91.30 ▼ 1.74 13 3.91 w
Southwestern Energy Co. SWN 25.35 34.19 ▼ -7.66 28 -41.20
Safeway Inc. SWY 35.29 34.67 ▲ 2.31 12 1.41
Stryker Corp. SYK 92.70 88.93 ▼ 5.48 13 10.13
Symantec Corporation SYMC 26.65 24.15 ▼ 3.57 13 11.23
Sysco Corp. SYY 40.98 38.91 ▼ 4.35 13 7.73
AT&T, Inc. T 33.37 34.63 ▲ -2.37 7 -1.80
Molson Coors Brewing TAP 78.09 71.96 ▲ 1.43 49 43.87
Teradata Corporation TDC 43.35 42.33 ▼ 0.53 4 -3.26 w
TECO Energy, Inc. TE 21.65 19.35 ▲ 7.16 15 20.61
Integrys Energy Group TEG 82.33 72.79 ▲ 8.39 49 49.37
TE Connectivity Ltd. TEL 62.89 60.22 ▼ 3.05 12 2.95
Target Corp. TGT 75.29 68.54 ▼ 8.49 11 16.08
Tenet Healthcare THC 43.88 53.39 ▼ -2.85 11 -9.38
Tiffany & Co. TIF 91.08 102.56 ▼ -0.49 1 1.34
TJX Companies TJX 67.63 61.44 ▼ 6.02 22 13.66
Torchmark Corp. TMK 51.76 55.53 ▼ -0.87 29 -6.27
Thermo Fisher Scientific TMO 124.87 120.75 ▼ 3.38 9 -0.80 w
TripAdvisor Inc. TRIP 69.77 81.83 ▲ -3.41 17 -23.52
T. Rowe Price Group TROW 82.17 81.02 ▼ 2.13 12 0.58 w
The Travelers Companies TRV 107.00 99.18 ▼ 7.31 23 15.78
Tractor Supply Co TSCO 79.71 71.95 ▼ 5.75 13 11.37
Tyson Foods Inc. TSN 41.27 38.93 ▼ 0.39 16 -1.50
Tesoro Corporation TSO 79.62 65.13 ▼ 3.40 39 43.80
Total System Services TSS 34.86 32.30 ▼ 4.21 12 2.95
Time Warner Cable TWC 144.16 142.50 ▼ 1.13 8 -3.26 w
Time Warner Inc. TWX 79.97 79.07 ▼ 3.10 13 1.72 w
Texas Instruments TXN 55.06 51.21 ▼ 4.76 12 11.01
Textron Inc. TXT 42.37 39.75 ▼ 3.52 13 9.68
Tyco International TYC 42.39 42.07 ▼ 0.33 4 -4.31 w
Under Armour, Inc. UA 69.82 64.44 ▼ 0.02 33 24.84
Universal Health Services UHS 106.51 101.39 ▼ 2.64 39 26.80 tP

Unitedhealth Group UNH 112.00 93.77 ▲ 8.46 95 99.01
Unum Group UNM 32.12 34.43 ▼ -1.10 2 -2.70
Union Pacific UNP 120.09 121.58 ▼ 0.49 32 19.66 w
United Parcel Service UPS 102.93 107.55 ▼ 4.80 0 0.00 Sell
Urban Outfitters URBN 34.80 32.89 ▲ 1.91 4 -0.06 w
United Rentals, Inc. URI 88.43 107.24 ▼ -5.32 6 -12.29
U.S. Bancorp USB 43.32 44.24 ▼ 1.22 2 0.79 w
United Technologies UTX 119.98 110.09 ▲ 5.64 7 6.89
Visa, Inc. V 258.29 240.37 ▼ 7.79 12 7.18
Varian Medical Systems VAR 87.23 84.23 ▼ 2.77 12 3.13
V.F. Corporation VFC 71.13 69.29 ▼ 4.80 101 83.93 w
Viacom, Inc. VIAB 67.80 76.29 ▼ -2.14 25 -17.57
Valero Energy VLO 50.16 50.61 ▼ -0.37 19 3.57 w
Vulcan Materials VMC 69.74 63.16 ▲ 3.21 11 7.21
Vornado Realty Trust VNO 114.30 106.74 ▼ 7.50 14 9.53
VeriSign, Inc. VRSN 56.81 55.53 ▼ -0.42 26 2.62 w
Ventas, Inc. VTR 80.43 69.94 ▲ 8.55 15 22.44
Verizon Communications VZ 47.15 49.17 ▲ -3.41 7 -3.32 spBuy
Walgreen Co. WAG 76.05 65.20 ▲ 6.78 7 14.46
Waters Corp. WAT 114.45 109.36 ▼ 3.97 13 5.77
Western Digital WDC 106.10 99.42 ▼ 6.20 12 7.48
Wisconsin Energy WEC 56.95 48.83 ▲ 8.80 15 25.14
Wells Fargo & WFC 53.26 53.95 ▼ 1.04 1 2.50 w
Whole Foods Market WFM 53.18 45.02 ▼ 8.30 11 14.05
Whirlpool Corp. WHR 200.92 173.17 ▼ 8.66 13 27.43
Windstream WIN 8.23 9.69 ▼ -7.22 11 -14.18
WellPoint Inc. WLP 128.71 113.50 ▲ 5.35 101 113.49
Waste Management WM 53.00 48.19 ▲ 8.21 39 22.32
Williams Companies WMB 43.35 50.41 ▼ -7.73 7 -12.16
Wal-Mart Stores Inc. WMT 88.51 80.99 ▼ 8.01 11 12.61
Western Union Co. WU 17.61 17.04 ▼ 1.56 11 -1.73 w
Weyerhaeuser Co. WY 36.04 33.50 ▼ 7.15 37 18.40
Wyndham Worldwide WYN 87.23 79.72 ▼ 5.15 10 9.96
Wynn Resorts Ltd. WYNN 146.01 172.94 ▲ -5.82 21 -22.79 spBuy
Cimarex Energy Co. XEC 100.25 120.23 ▼ -4.04 16 -17.20
Xcel Energy Inc. XEL 37.76 33.94 ▲ 8.21 15 19.65
XL Group plc XL 35.43 33.52 ▲ 2.79 12 4.76
Xilinx Inc. XLNX 39.28 44.40 ▼ -1.28 1 -5.24
Exxon Mobil XOM 90.89 96.57 ▲ -2.52 25 -7.95
DENTSPLY International XRAY 50.89 50.47 ▼ 2.79 12 0.55 w
Xerox Corp. XRX 13.80 13.09 ▼ 1.85 44 22.78
Xylem Inc. XYL 35.17 37.49 ▼ -0.64 2 -0.48
Yahoo! Inc. YHOO 48.95 43.90 ▼ 4.18 23 33.13
Yum! Brands, Inc. YUM 74.11 74.63 ▼ -0.22 5 3.49 w
Zions Bancorp. ZION 24.81 28.05 ▼ -3.15 6 -8.45
Zimmer Holdings ZMH 116.98 107.97 ▼ 5.46 13 11.23
Zoetis Inc. ZTS 44.12 38.09 ▼ 8.32 33 38.83
S&P 400 stocks (Mid Caps)
Weekly Current Mode RevL (W) MoM (W) Weeks % Ch. Action
Aaron's, Inc. AAN 32.38 27.10 ▲ 6.87 10 18.52
Advance Auto Parts AAP 155.78 145.84 ▼ 5.83 68 88.35
American Campus Communities ACC 44.43 39.74 ▲ 8.21 14 15.43
ACI Worldwide, Inc. ACIW 18.85 19.70 ▼ 0.45 2 0.91 w
AECOM Technology ACM 25.96 32.04 ▼ -5.08 16 -21.33
Acxiom Corporation ACXM 19.34 20.64 ▼ 1.19 42 -39.66 w
Advent Software ADVS 37.04 30.96 ▲ 1.30 1 -0.30
American Eagle Outfitters AEO 14.39 12.85 ▲ 1.44 4 5.81
Astoria Financial AF 12.76 13.25 ▼ -0.37 6 -0.93 w
American Financial Group AFG 59.59 58.64 ▼ 0.83 13 1.72 w
AGCO Corporation AGCO 43.62 46.79 ▲ -1.39 28 -18.85
Aspen Insurance Holdings AHL 43.40 42.37 ▼ 0.27 16 -0.46 w
Arthur J Gallagher & Co. AJG 45.51 47.69 ▼ -0.11 1 -1.49
Albemarle Corp. ALB 56.84 62.76 ▼ -1.14 25 -8.01
Alexander & Baldwin ALEX 39.34 37.57 ▼ 0.54 5 -2.58 w
Align Technology ALGN 57.46 53.44 ▼ 3.80 10 5.68
Alaska Air Group ALK 68.65 52.16 ▲ 8.70 13 36.45
AMC Networks Inc. AMCX 66.57 60.23 ▲ 2.15 8 3.10
Advanced Micro Devices AMD 2.45 2.93 ▲ -3.85 18 -35.70
Affiliated Managers Group AMG 206.54 208.08 ▼ 1.42 1 4.67 w
Abercrombie & Fitch Co. ANF 26.86 31.67 ▲ -4.28 17 -26.59
ANN INC ANN 33.78 38.04 ▼ -2.44 15 -7.45
Alpha Natural Resources ANR 1.02 2.34 ▼ -4.57 54 -83.58
Ansys, Inc. ANSS 84.71 78.82 ▼ 2.83 11 5.89
AOL, Inc. AOL 48.49 43.16 ▲ 3.03 12 11.65
AO Smith Corp. AOS 55.55 52.40 ▼ 4.63 13 9.14
Apollo Group Inc. APOL 25.99 30.40 ▼ 0.31 2 -3.53
Alexandria Real Estate Equitie ARE 98.40 83.58 ▲ 9.76 15 26.79
Arrow Electronics ARW 56.85 58.15 ▼ 0.19 1 1.92 w
Associated Banc-Corp ASBC 18.42 17.88 ▼ 2.02 7 -2.92 w
Ashland Inc. ASH 117.93 111.20 ▼ 6.91 13 10.99
Ascena Retail Group ASNA 11.23 14.32 ▼ -5.43 53 -43.48
Alliant Techsystems ATK 131.84 114.00 ▲ -0.14 1 9.24
Atmel Corporation ATML 8.47 7.82 ▲ 2.70 7 3.55
Atmos Energy ATO 58.66 52.86 ▲ 6.36 13 13.86
AptarGroup, Inc. ATR 63.76 63.43 ▼ 2.49 11 -1.67 w
Atwood Oceanics ATW 28.76 38.54 ▲ -8.20 28 -41.78
Avnet Inc. AVT 43.14 43.72 ▼ -0.06 1 3.35 w
Acuity Brands, Inc. AYI 151.87 133.94 ▲ 4.36 21 22.03
Bill Barrett Corp. BBG 10.20 14.97 ▲ -4.86 27 -58.64
Brunswick BC 51.72 47.99 ▼ 6.16 13 15.83
Brinks Co. BCO 23.54 24.54 ▲ 1.47 50 -24.55 w
BE Aerospace Inc. BEAV 61.18 73.81 ▼ -7.91 25 -28.27
General Cable Corp. BGC 11.26 16.23 ▼ -3.49 45 -60.04
Sotheby's BID 41.52 39.58 ▼ 2.50 10 1.02 w
Big Lots Inc. BIG 46.76 41.94 ▲ -2.85 1 2.43
Bio-Rad Laboratories BIO 114.70 120.17 ▼ 2.07 0 0.00 Sell
Black Hills BKH 50.94 53.98 ▼ -1.05 6 -2.06
BioMed Realty Trust BMR 24.68 21.63 ▲ 7.42 13 13.94
Bemis Company, Inc. BMS 45.12 41.24 ▼ 8.76 8 13.14
Bob Evans Farms Inc. BOBE 56.34 49.57 ▲ 3.53 14 17.74
Bank of Hawaii BOH 56.68 58.55 ▼ -0.90 2 1.50 w
Broadridge Financial Solutions BR 47.64 43.84 ▲ 5.22 13 12.31
Brown & Brown Inc. BRO 31.75 31.63 ▼ 0.39 33 3.08 w
BancorpSouth, Inc. BXS 20.84 22.24 ▼ -0.96 2 1.12
Cabela's Inc. CAB 55.89 57.08 ▲ -0.30 17 -3.39 w
The Cheesecake Factory CAKE 54.13 47.84 ▲ 6.38 11 10.63
Cathay General Bancorp CATY 24.54 25.70 ▼ -1.90 6 -1.45 w
CBOE Holdings, Inc. CBOE 65.87 56.75 ▼ 8.06 23 28.53
Commerce Bancshares CBSH 41.58 43.89 ▼ -3.42 8 -2.19
Cubist Pharmaceuticals CBST 101.94 82.55 ▲ 10.00 12 42.26
Cabot Corp. CBT 41.26 47.29 ▲ -4.62 25 -22.12
Cadence Design Systems CDNS 18.45 17.72 ▼ 2.13 12 2.96 w
Corporate Executive Board Co. CEB 70.27 67.83 ▼ 1.27 12 -4.67 w
Cullen/Frost Bankers CFR 63.77 71.62 ▼ -7.45 8 -14.45
Church & Dwight Co. CHD 81.99 74.54 ▲ 8.98 20 18.84
Chico's FAS Inc. CHS 16.84 15.44 ▲ 2.97 4 5.12
CIENA Corp. CIEN 19.69 17.55 ▲ 4.30 6 6.95
CLARCOR Inc. CLC 63.96 65.76 ▼ 0.06 2 1.64 w
Cliffs Natural Resources CLF 7.49 10.44 ▲ -4.07 54 -66.97
CoreLogic, Inc. CLGX 34.46 30.71 ▲ 4.83 13 13.62
Clean Harbors, Inc. CLH 48.57 52.83 ▲ -2.96 25 -14.94
Mack-Cali Realty CLI 19.58 19.82 ▲ -0.49 19 -2.78 w
Commercial Metals CMC 12.99 16.65 ▼ -4.72 34 -27.06
Compass Minerals International CMP 90.85 86.04 ▲ 1.80 2 -0.86
Centene Corp. CNC 110.43 92.60 ▼ 8.81 39 65.27
Cinemark Holdings CNK 36.68 34.08 ▼ 1.75 12 3.59
Cleco Corporation CNL 54.73 53.06 ▼ 2.78 13 2.40 w
Con-way Inc. CNW 43.07 47.83 ▼ -1.08 2 -4.82
The Cooper Companies COO 161.75 155.52 ▼ 0.69 38 22.00 w
Copart, Inc. CPRT 36.90 33.98 ▼ 4.25 11 7.99
Camden Property Trust CPT 79.69 73.57 ▲ 4.14 13 7.68
Crane Co. CR 57.42 62.75 ▲ -4.40 25 -15.45 spBuy
Cree, Inc. CREE 36.81 37.71 ▲ -2.78 28 -25.40 w
Carter's, Inc. CRI 84.78 79.79 ▼ 3.39 26 9.04 pP
Charles River Laboratories Int CRL 68.79 61.72 ▲ 4.06 24 21.00
CARBO Ceramics Inc. CRR 33.49 62.97 ▲ -6.15 25 -72.77
Carpenter Technology CRS 39.92 50.86 ▼ -5.15 27 -33.10
Carlisle Companies CSL 89.54 85.79 ▼ 4.52 13 4.92
CST Brands, Inc. CST 44.08 39.69 ▼ 7.75 38 36.56
Covance Inc. CVD 106.72 94.62 ▼ 8.95 11 6.04
Convergys CVG 19.75 19.44 ▼ 0.95 12 -1.84 w
CommVault Systems CVLT 47.95 51.85 ▼ 0.47 2 -0.79
Corrections CXW 38.90 35.78 ▲ 4.25 24 10.83
Cypress Semiconductor CY 15.26 12.20 ▼ 9.90 9 45.33
Community Health Systems CYH 48.00 52.60 ▼ 0.83 0 0.00 Sell
City National Corp. CYN 88.99 75.55 ▲ 1.73 0 0.00 Buy
Cytec Industries CYT 43.96 47.93 ▼ -3.52 18 -11.67
Diebold, DBD 31.05 35.49 ▼ -3.75 24 -15.40
Donaldson Company DCI 37.34 39.36 ▼ -3.50 9 -5.76
3D Systems Corp. DDD 29.86 40.10 ▲ -3.98 46 -53.80
Deckers Outdoor DECK 78.33 93.45 ▼ -1.11 1 -9.65
Dean Foods Company DF 19.21 16.51 ▼ 8.43 10 15.72
Dick's Sporting Goods DKS 54.68 47.96 ▲ 6.11 10 14.23
Deluxe Corp. DLX 63.97 58.36 ▲ 3.24 13 9.63
Domino's Pizza, Inc. DPZ 98.10 87.89 ▼ 8.57 23 31.13
Dresser-Rand Group DRC 81.20 76.83 ▼ 2.67 23 20.33
Duke Realty Corp. DRE 22.12 18.90 ▲ 9.24 13 20.28
Dril-Quip, Inc. DRQ 75.50 86.48 ▲ -5.70 25 -24.42 spBuy
DST Systems Inc. DST 96.53 92.47 ▼ 1.78 12 0.32
DeVry, Inc. DV 43.93 46.59 ▼ -1.88 3 0.23
DreamWorks Animation SKG DWA 19.67 23.95 ▼ -1.23 6 -10.14
Brinker International EAT 62.04 54.59 ▲ 7.92 22 25.16
Energen Corp. EGN 63.31 71.26 ▲ -2.22 25 -21.08
Endo Pharmaceuticals Holdings ENDP 78.87 69.83 ▲ 4.78 11 14.54
Energizer Holdings ENR 130.34 123.35 ▼ 4.43 13 7.72
Equinix, Inc. EQIX 230.60 211.04 ▼ 3.00 11 8.01
Equity One Inc. EQY 27.04 24.24 ▲ 8.59 12 12.57
Esterline Technologies ESL 113.22 113.89 ▲ -1.47 6 9.12 spBuy
Eaton Vance Corp. EV 40.11 41.19 ▼ 0.87 2 2.61 w
East West Bancorp EWBC 37.74 36.08 ▼ 2.59 12 2.75
Eagle Materials Inc. EXP 71.49 84.38 ▼ -5.03 15 -12.59
Extra Space Storage EXR 66.50 55.32 ▲ 8.87 15 24.60
First American Financial FAF 34.50 31.38 ▼ 8.06 14 22.38
Fortune Brands Home & Security FBHS 44.85 42.61 ▼ 2.50 12 3.65
FTI Consulting, Inc. FCN 40.29 37.01 ▲ 1.24 5 2.36
Fairchild Semiconductor Intl FCS 16.27 15.54 ▼ 2.29 8 1.75 w
FactSet Research Systems FDS 144.32 127.48 ▼ 7.40 13 13.96
FEI Company FEIC 82.63 87.10 ▼ 1.32 1 2.94 w
First Horizon National FHN 13.00 13.18 ▼ 2.16 1 4.00 w
Fair Isaac Corp. FICO 78.82 66.18 ▼ 7.80 12 26.21
Federated Investors FII 31.78 32.56 ▼ 2.38 1 2.72 w
Foot Locker, Inc. FL 53.45 55.87 ▼ -0.45 1 2.02 w
Flowers Foods, Inc. FLO 20.00 18.82 ▲ 1.54 9 0.96
FirstMerit FMER 17.27 18.49 ▼ -0.31 2 -1.26
Fidelity National Financial FNF 36.42 31.20 ▲ 8.82 13 24.51
First Niagara Financial Group FNFG 8.03 8.33 ▼ -0.54 17 -4.41 w
Federal Realty Investment Trus FRT 145.07 127.60 ▲ 8.55 52 35.44
Fortinet Inc. FTNT 31.93 27.20 ▲ 8.29 13 25.07
Fulton Financial FULT 11.34 12.18 ▼ 0.81 1 -2.49
Greif, Inc. GEF 39.59 48.12 ▼ -1.71 26 -24.23
Guess' Inc. GES 19.83 22.79 ▼ -3.19 45 -30.54
Graco Inc. GGG 77.30 79.55 ▼ 1.33 1 1.80 w
Greenhill & Co. GHL 38.98 44.69 ▼ -3.52 42 -21.99
GATX Corp. GMT 57.02 60.05 ▼ -4.10 7 -0.19 w
Gentex Corp. GNTX 17.62 30.20 ▼ -8.62 3 -0.62
Global Payments Inc. GPN 88.28 78.13 ▲ 4.77 77 83.76
Gulfport Energy GPOR 39.29 48.27 ▼ -4.58 37 -36.16
Granite Construction GVA 35.11 34.64 ▼ 1.38 12 1.77 w
Genesee & Wyoming GWR 84.98 92.70 ▼ -4.68 7 -5.71
Great Plains Energy GXP 29.87 26.67 ▲ 6.66 13 14.31
Hain Celestial Group HAIN 54.38 96.82 ▼ -8.56 3 -5.41
Hancock Holding Co. HBHC 25.91 31.03 ▼ -6.17 8 -20.38
Hanesbrands Inc. HBI 114.45 102.95 ▼ 1.85 137 300.52
HCC Insurance Holdings HCC 54.25 50.66 ▼ 5.45 46 19.41
Hawaiian Electric Industries HE 34.09 29.53 ▲ 10.00 21 33.69
HollyFrontier HFC 33.92 40.73 ▼ -6.18 19 -25.94
Huntington Ingalls Industries HII 119.61 104.41 ▲ 5.75 161 275.28
Highwoods Properties HIW 47.48 42.36 ▲ 8.31 13 13.48
Helix Energy Solutions Group HLX 18.49 23.20 ▼ -5.57 8 -17.68
Home Properties Inc. HME 72.57 63.96 ▲ 8.19 13 14.77
HMS Holdings Corp. HMSY 20.42 20.08 ▼ 0.40 13 -3.41 w
HNI Corp. HNI 49.46 45.20 ▼ 7.27 14 25.12
Health Net, Inc. HNT 55.95 47.23 ▼ 6.79 39 65.78
Hologic Inc. HOLX 29.34 25.48 ▲ 5.15 12 9.36
Hospitality Properties Trust HPT 32.79 30.06 ▲ 7.05 13 13.78
Hill-Rom Holdings HRC 48.71 44.09 ▲ 4.67 36 23.76
Harsco Corporation HSC 15.48 20.79 ▼ -5.75 24 -35.87
Henry Schein, Inc. HSIC 143.33 130.03 ▼ 8.40 12 19.37
HSN, Inc. HSNI 74.72 68.10 ▼ 7.18 30 26.97
Hubbell Inc. HUB.B 106.98 111.80 ▲ -2.53 15 0.23 w
International Bancshares IBOC 23.73 26.00 ▼ -1.90 6 0.21
IdaCorp, Inc. IDA 69.55 61.99 ▲ 8.14 14 21.70
InterDigital, Inc. IDCC 52.23 46.67 ▼ 5.81 14 25.95
Integrated Device Technology IDTI 18.93 17.00 ▼ 3.50 12 15.01
IDEXX Laboratories IDXX 167.06 137.34 ▲ 7.96 13 23.45
IDEX Corporation IEX 73.13 76.30 ▼ 0.25 1 1.36
Ingram Micro Inc. IM 25.75 27.40 ▼ -0.14 1 0.16
Informatica INFA 38.43 35.48 ▼ 3.04 12 7.29
Ingredion INGR 85.70 78.30 ▼ 5.57 12 10.82
World Fuel Services INT 48.75 43.00 ▼ 4.44 11 9.77
IPG Photonics Corp IPGP 75.00 70.35 ▼ 1.73 12 2.18
Intrepid Potash IPI 13.36 14.58 ▼ -1.24 7 -3.82
International Rectifier IRF 39.98 38.57 ▼ 3.25 20 2.22
International Speedway ISCA 30.52 31.83 ▼ -0.73 6 -0.33 w
Intersil Corporation ISIL 14.46 13.41 ▲ 2.18 5 3.07
Gartner Inc. IT 85.60 79.94 ▼ 3.59 113 81.90
Itron, Inc. ITRI 37.85 41.19 ▼ 0.14 1 0.80
ITT Corporation ITT 36.08 42.54 ▼ -5.48 16 -18.61
Jarden Corp. JAH 48.93 43.46 ▼ 6.41 22 24.40
JB Hunt Transport Services JBHT 83.02 78.93 ▼ 2.95 13 7.47
Jabil Circuit Inc. JBL 20.79 20.24 ▼ 2.42 5 -3.17 w
JetBlue Airways JBLU 16.55 12.84 ▼ 8.30 12 43.91
J. C. Penney Company JCP 7.52 8.04 ▲ -2.37 15 2.45 w
JDS Uniphase JDSU 13.65 12.89 ▼ 1.89 12 1.34 w
Jack Henry & Associates JKHY 64.14 59.24 ▼ 5.77 12 6.65
Jones Lang Lasalle JLL 151.46 135.61 ▼ 8.32 12 11.96
Janus Capital Group JNS 18.27 14.48 ▲ 6.40 17 18.41
John Wiley & Sons JW.A 61.23 57.10 ▲ 1.38 12 4.90
Kate Spade & Co. KATE 28.69 31.14 ▼ -0.17 2 1.63 w
KB Home KBH 12.20 16.45 ▼ -2.82 6 -22.00
KBR, Inc. KBR 17.60 19.15 ▲ -4.39 59 -45.21 spBuy

Kirby Corporation KEX 79.06 102.10 ▲ -8.91 15 -23.56 spBuy
Kemper Corporation KMPR 36.17 34.69 ▲ 0.16 0 0.00 Buy
Kennametal Inc. KMT 31.92 38.24 ▼ -6.83 28 -28.73
Knowles Corp. KN 21.12 24.89 ▲ -0.28 17 -21.43
Kilroy Realty Corp. KRC 74.74 65.52 ▲ 8.72 14 19.80
Lamar Advertising Co. LAMR 56.03 52.21 ▲ 4.21 12 8.12
Lancaster Colony LANC 93.65 89.96 ▼ 2.25 12 2.27
Leidos Holdings LDOS 42.70 39.73 ▼ 6.93 11 9.60
Lincoln Electric Holdings LECO 66.89 70.41 ▼ -2.38 6 -1.63
Lennox International LII 98.62 88.82 ▼ 6.15 13 12.38
LKQ Corp. LKQ 26.98 28.23 ▼ -1.40 1 4.98 w
Alliant Energy LNT 70.20 62.16 ▲ 8.36 14 20.91
Lifepoint Hospitals LPNT 67.98 67.30 ▼ 1.24 7 -5.00 w
Liberty Property Trust LPT 40.35 35.99 ▲ 8.53 7 12.52
Louisiana-Pacific LPX 15.51 15.06 ▼ 3.48 13 5.08 w
Landstar System Inc. LSTR 66.23 71.88 ▼ -3.35 2 -2.80
Life Time Fitness LTM 56.68 52.01 ▼ 2.92 20 13.29
Lexmark International LXK 38.52 43.32 ▼ -2.75 17 -8.33
Mid-America Apartment Communit MAA 82.11 72.65 ▲ 8.66 9 13.08
ManpowerGroup MAN 67.67 71.65 ▲ -1.02 25 -12.99
ManTech International MANT 31.90 29.15 ▲ 3.40 11 9.10
Masimo Corporation MASI 26.42 24.29 ▼ 4.05 12 4.43
Matthews International MATW 47.19 44.67 ▼ 2.31 12 2.59
Mercury General MCY 57.63 53.45 ▼ 5.47 40 25.26
MEDNAX, Inc. MD 65.53 60.86 ▼ 7.22 12 4.85
MDC Holdings Inc. MDC 24.87 26.99 ▼ 0.16 1 -1.15
Meredith Corp. MDP 52.92 49.36 ▼ 3.27 13 8.58
Allscripts Healthcare Solution MDRX 12.66 13.57 ▲ -1.33 25 -18.53 w
MDU Resources Group MDU 23.38 27.25 ▲ -6.29 25 -25.61
Mentor Graphics MENT 22.75 21.11 ▲ 1.43 12 8.08
Herman Miller Inc. MLHR 28.59 30.31 ▼ -2.72 5 -3.64
Martin Marietta Materials MLM 109.83 119.55 ▼ -3.78 7 -6.43
Mallinckrodt Plc MNK 106.98 89.54 ▲ 5.70 56 108.13
Mine Safety Appliances Co. MSA 45.44 53.16 ▼ -3.02 6 -11.13
MSCI Inc. MSCI 54.22 47.94 ▲ 5.23 12 16.18
MSC Industrial Direct Co. MSM 76.00 82.24 ▼ -3.61 17 -11.74
Mettler-Toledo Intl MTD 303.05 270.89 ▼ 7.17 11 9.21
Minerals Technologies MTX 61.49 69.28 ▼ -2.57 2 -3.88
Murphy USA Inc. MUSA 70.06 59.59 ▼ 8.95 38 60.91
National Instruments NATI 30.56 31.78 ▼ -1.34 2 0.83 w
NCR Corp. NCR 26.50 29.49 ▼ -2.24 16 -17.45
Nordson Corporation NDSN 72.50 77.80 ▼ -1.00 2 -2.37
NewMarket Corp. NEU 436.50 389.81 ▲ 4.05 5 10.00
National Fuel Gas Co. NFG 68.25 70.44 ▼ -1.47 17 -1.46 w
National Retail Properties NNN 43.79 38.29 ▲ 8.25 14 18.83
NeuStar, Inc. NSR 27.92 28.08 ▲ 1.14 68 -40.70 w
NVR Inc. NVR 1262.58 1198.26 ▼ 3.03 25 11.49 pP
New York Community Bancorp NYCB 15.77 16.05 ▼ 0.00 1 1.94 w
New York Times Co. NYT 13.11 13.37 ▼ 0.39 1 7.72 w
Realty Income Corp. O 53.54 46.63 ▲ 8.33 13 19.03
Omnicare Inc. OCR 75.70 68.04 ▼ 7.90 13 13.90
Old Dominion Freight Line ODFL 74.86 71.54 ▼ 1.92 129 153.82
Office Depot, Inc. ODP 7.82 6.89 ▼ 9.06 11 20.49
Corporate Office Properties Tr OFC 29.56 27.71 ▲ 4.70 11 6.18
OGE Energy Corp. OGE 35.70 36.21 ▲ -2.17 8 0.54 spBuy
ONE Gas, Inc. OGS 46.11 38.50 ▲ 8.50 13 26.53
Omega Healthcare Investors OHI 44.50 38.03 ▲ 8.34 14 19.37
Oceaneering International OII 52.35 64.43 ▼ -6.05 8 -16.13
Oil States International OIS 41.96 53.98 ▼ -7.75 16 -29.48
Olin Corp. OLN 25.20 23.28 ▲ -2.99 0 0.00 Buy
Owens & Minor Inc. OMI 35.31 33.80 ▼ 2.51 8 3.82
Old Republic International ORI 13.87 15.09 ▼ -2.02 26 -10.34
Oshkosh Corporation OSK 41.42 47.32 ▼ -1.80 2 -3.79
VeriFone Systems, Inc PAY 33.01 36.66 ▼ 0.76 1 -4.12
Prosperity Bancshares PB 47.44 55.35 ▼ -5.76 8 -14.97
Potlatch Corporation PCH 42.20 41.06 ▲ 0.40 34 4.74 Add
Polaris Industries PII 135.96 150.26 ▼ -2.15 6 -6.30
Packaging PKG 80.06 73.83 ▼ 7.16 13 15.74
Protective Life PL 69.95 68.68 ▲ 1.25 110 157.62
Polycom, Inc. PLCM 13.40 12.56 ▼ 1.53 12 2.53
Plantronics, Inc. PLT 52.13 49.64 ▼ 2.85 12 1.03
PNM Resources, Inc. PNM 30.63 27.85 ▼ 5.12 13 9.24
Panera Bread Co. PNRA 170.35 159.96 ▼ 3.14 18 6.35 pP
Post Holdings, Inc. POST 41.44 38.58 ▼ 3.35 7 0.02 w
Primerica, Inc. PRI 51.12 50.33 ▼ 2.19 12 0.10 w
PTC Inc. PTC 34.87 37.30 ▼ -2.39 6 -4.39
Patterson-UTI Energy PTEN 15.86 24.13 ▲ -8.04 16 -47.19
Rackspace Hosting RAX 47.73 42.59 ▼ 6.61 13 30.37
Regal Beloit RBC 70.36 73.02 ▼ 1.73 1 -0.06 w
Rent-A-Center Inc. RCII 34.49 31.16 ▼ 4.91 19 19.47
Everest Re Group RE 172.74 163.69 ▼ 2.04 48 16.76
Regency Centers REG 68.66 59.47 ▲ 9.28 49 36.55
RF Micro Devices RFMD 16.59 11.80 ▲ 9.69 47 215.07
Reinsurance Group of America RGA 84.49 82.08 ▼ 2.72 12 0.50 w
Royal Gold, Inc. RGLD 74.70 64.83 ▲ 0.96 1 1.84
Raymond James Financial RJF 52.61 55.90 ▼ 0.04 1 0.10
Rock-Tenn Co. RKT 62.99 56.17 ▼ 8.39 13 25.06
ResMed Inc. RMD 65.24 53.83 ▲ 8.23 13 25.97
RenaissanceRe Holdings RNR 96.34 100.26 ▲ -3.04 8 -1.12 spBuy
Rollins Inc. ROL 33.32 31.52 ▼ 3.76 13 12.19
Rosetta Resources ROSE 17.10 35.25 ▲ -8.12 22 -64.79
Rovi Corporation ROVI 22.42 21.11 ▼ 2.22 10 2.00 w
RPM International RPM 46.45 48.46 ▼ 1.99 2 0.85
R.R. Donnelley & Sons RRD 16.49 16.90 ▼ -1.13 6 5.98 w
Reliance Steel & Aluminum Co. RS 52.62 63.71 ▼ -6.53 16 -20.81
Riverbed Technology RVBD 20.63 19.53 ▲ 3.58 10 6.40
Rayonier Inc. RYN 29.25 31.13 ▲ -4.82 10 9.06
Science Applications Intl SAIC 50.84 46.61 ▼ 3.34 44 36.31
Signature Bank SBNY 121.72 124.02 ▼ 1.19 1 4.08 w
Service SCI 23.04 21.66 ▼ 3.22 13 5.93
SEI Investments Co. SEIC 40.38 37.50 ▼ 3.77 13 9.55
StanCorp Financial Group SFG 65.63 68.23 ▼ 0.82 1 1.75 w
Scientific Games SGMS 12.74 11.71 ▼ 0.93 12 8.43 w
Signet Jewelers SIG 124.84 120.10 ▼ 3.29 51 56.38 w
Sirona Dental Systems SIRO 92.07 83.06 ▲ 7.10 11 15.41
SVB Financial Group SIVB 113.85 114.30 ▼ 0.88 1 7.10 w
Tanger Factory Outlet Centers SKT 40.12 35.94 ▲ 8.45 13 14.27
Silicon Laboratories SLAB 45.30 44.08 ▼ 2.25 12 -0.57 w

SL Green Realty SLG 128.51 112.56 ▲ 8.80 14 18.74
Silgan Holdings Inc. SLGN 52.15 50.41 ▼ 5.14 8 3.35
Solera Holdings Inc. SLH 54.02 56.57 ▲ -3.52 25 -14.27 w
Salix Pharmaceuticals SLXP 125.92 128.59 ▲ -1.46 11 38.37 w
SM Energy Company SM 35.91 49.04 ▲ -7.14 16 -51.12
Scotts Co. SMG 63.65 59.29 ▼ 3.46 13 10.54
Semtech Corp. SMTC 27.07 25.58 ▼ 2.47 7 0.33 w
Senior Housing Properties Trus SNH 23.41 22.28 ▲ 2.17 1 -1.18
Synopsys Inc. SNPS 43.52 41.35 ▼ 3.21 12 5.99
Synovus Financial SNV 25.23 26.19 ▼ 1.90 1 0.92 w
Sonoco Products Co. SON 44.43 41.87 ▼ 5.22 11 7.61
Superior Energy Services SPN 19.56 26.52 ▲ -7.22 16 -36.39
SPX Corporation SPW 83.20 91.36 ▲ -4.20 17 -12.08 spBuy
Steris Corp. STE 66.18 58.92 ▼ 6.10 23 22.01
Steel Dynamics Inc. STLD 17.02 21.21 ▼ -6.06 6 -16.94
Questar Corporation STR 26.02 23.90 ▲ 5.23 13 12.11
SunEdison, Inc. SUNE 19.35 18.29 ▼ -0.06 9 -14.87 w
SUPERVALU Inc. SVU 10.12 8.77 ▲ 3.70 10 12.95
SolarWinds, Inc. SWI 49.54 45.46 ▼ 4.34 26 11.78
Skyworks Solutions SWKS 80.86 57.18 ▲ 9.21 64 209.33
Sensient Technologies SXT 61.24 57.13 ▼ 3.53 12 3.29
TCF Financial TCB 14.77 15.63 ▼ -1.52 6 -2.12
Taubman Centers Inc. TCO 83.80 74.90 ▲ 5.40 50 27.49
Telephone & Data Systems TDS 24.16 25.40 ▼ -1.02 6 3.07 w
Tidewater Inc. TDW 30.08 39.00 ▲ -5.72 28 -40.16
Tech Data Corp. TECD 58.06 62.36 ▼ -0.82 2 -2.60
Techne Corp. TECH 93.40 90.13 ▲ 0.55 5 -0.10 w
Teradyne Inc. TER 19.01 19.69 ▼ 0.77 1 1.93 w
Terex Corp. TEX 22.83 30.34 ▼ -4.62 27 -41.08
Teleflex TFX 111.71 113.92 ▼ 0.60 1 0.28 w
Triumph Group, Inc. TGI 63.70 67.14 ▼ -1.71 6 -1.33
Hanover Insurance Group THG 71.13 67.26 ▼ 4.25 49 20.98
Thor Industries Inc. THO 55.38 53.61 ▼ 1.19 10 -0.74 w
Thoratec Corp. THOR 37.09 30.22 ▲ 8.12 10 23.63
Treehouse Foods THS 90.33 81.30 ▲ 4.24 49 32.39
TIBCO Software Inc. TIBX 24.03 22.12 ▼ 5.64 9 1.65
Timken Co. TKR 41.70 43.99 ▼ -1.40 17 -2.53
Toll Brothers Inc. TOL 33.56 32.58 ▼ 1.13 3 -1.44 w
Tempur Pedic International TPX 55.10 56.50 ▲ -0.76 16 -0.47 w
Tootsie Roll Industries TR 34.42 28.97 ▲ 5.24 12 15.93
Trimble Navigation TRMB 25.56 28.70 ▼ -3.94 29 -26.74
Trustmark TRMK 22.89 24.18 ▼ -0.95 2 0.79
Trinity Industries TRN 26.16 36.32 ▲ -7.15 16 -37.04
Tupperware Brands TUP 61.38 68.48 ▲ -4.60 26 -17.11
Towers Watson & Co. TW 118.21 110.06 ▼ 2.56 12 7.25
Under Armour, Inc. UA 69.82 64.44 ▼ 0.02 33 24.84
UDR, Inc. UDR 33.66 29.46 ▲ 8.25 13 14.72
Domtar Corporation UFS 38.00 41.38 ▼ -0.58 2 -2.56
UGI Corp. UGI 37.84 34.95 ▼ 3.62 143 111.20
Universal Health Services UHS 106.51 101.39 ▼ 2.64 39 26.80 tP
Ultimate Software Group ULTI 151.49 140.94 ▼ 0.28 12 0.79
United Natural Foods UNFI 80.04 71.62 ▼ 6.32 12 17.26
Unit Corp. UNT 30.42 45.87 ▲ -8.63 19 -51.08
United Rentals, Inc. URI 88.43 107.24 ▼ -5.32 6 -12.29
United Therapeutics UTHR 145.30 122.19 ▲ 2.78 21 25.54
UTi Worldwide Inc. UTIW 11.32 10.85 ▼ 1.69 11 1.43 w
Valspar Corp. VAL 87.15 81.58 ▼ 4.05 13 9.14
Valley National Bancorp VLY 9.29 9.73 ▼ -1.91 6 -1.07
Valmont Industries VMI 120.85 137.28 ▼ -5.79 28 -18.96
Vishay Intertechnology VSH 13.41 14.27 ▼ -0.89 17 -6.16
Vectren Corporation VVC 49.01 44.05 ▲ 7.03 23 23.33
Westinghouse Air Brake Technol WAB 84.99 82.52 ▼ 0.83 12 -1.63 w
Westamerica Bancorp. WABC 43.18 48.31 ▼ -2.35 6 -7.70
Washington Federal WAFD 20.59 21.90 ▼ -0.45 2 -1.95
Webster Financial WBS 30.77 31.96 ▼ 0.84 1 3.39 w
WellCare Health Plans WCG 77.85 70.66 ▼ 6.65 12 14.49
Waste Connections WCN 43.96 46.56 ▲ -6.60 8 -6.85 spBuy
Waddell & Reed Financial WDR 43.48 50.09 ▼ -2.58 37 -33.19
Wendy's Company WEN 10.53 8.64 ▲ 8.23 13 26.41
Werner Enterprises WERN 30.49 27.96 ▼ 7.59 13 18.78
Winland Electronics WEX 94.13 106.65 ▼ -4.71 7 -10.44
WGL Holdings Inc. WGL 58.37 49.62 ▲ 9.73 23 38.58
Western Refining WNR 35.69 40.62 ▼ -4.26 10 -12.65
VCA Antech Inc. WOOF 51.28 43.03 ▼ 8.22 35 59.21
Worthington Industries WOR 28.41 34.64 ▼ -8.09 25 -27.97
WPX Energy, Inc. WPX 10.90 16.40 ▲ -7.46 15 -41.96
Westar Energy, Inc. WR 43.49 38.21 ▲ 8.29 14 22.51
W.R. Berkley WRB 49.90 48.05 ▼ 1.36 39 15.75
Weingarten Realty Investors WRI 37.39 33.96 ▲ 4.13 14 12.96
Williams-Sonoma Inc. WSM 79.45 69.72 ▲ 6.63 10 14.12
Watsco Inc. WSO 110.74 99.05 ▼ 6.61 13 14.82
Aqua America Inc. WTR 27.45 25.70 ▲ 4.11 13 8.63
WhiteWave Foods Co. WWAV 32.92 35.64 ▼ -1.67 1 -0.57
Woodward, Inc. WWD 45.36 49.75 ▼ -3.20 6 -6.36
Cimarex Energy Co. XEC 100.25 120.23 ▼ -4.04 16 -17.20
Exelis, Inc. XLS 17.84 16.94 ▼ -0.54 0 0.00 wBuy
Alleghany Corp. Y 454.33 437.02 ▼ 3.23 46 12.56
Zebra Technologies ZBRA 84.19 72.87 ▲ 5.05 7 10.43
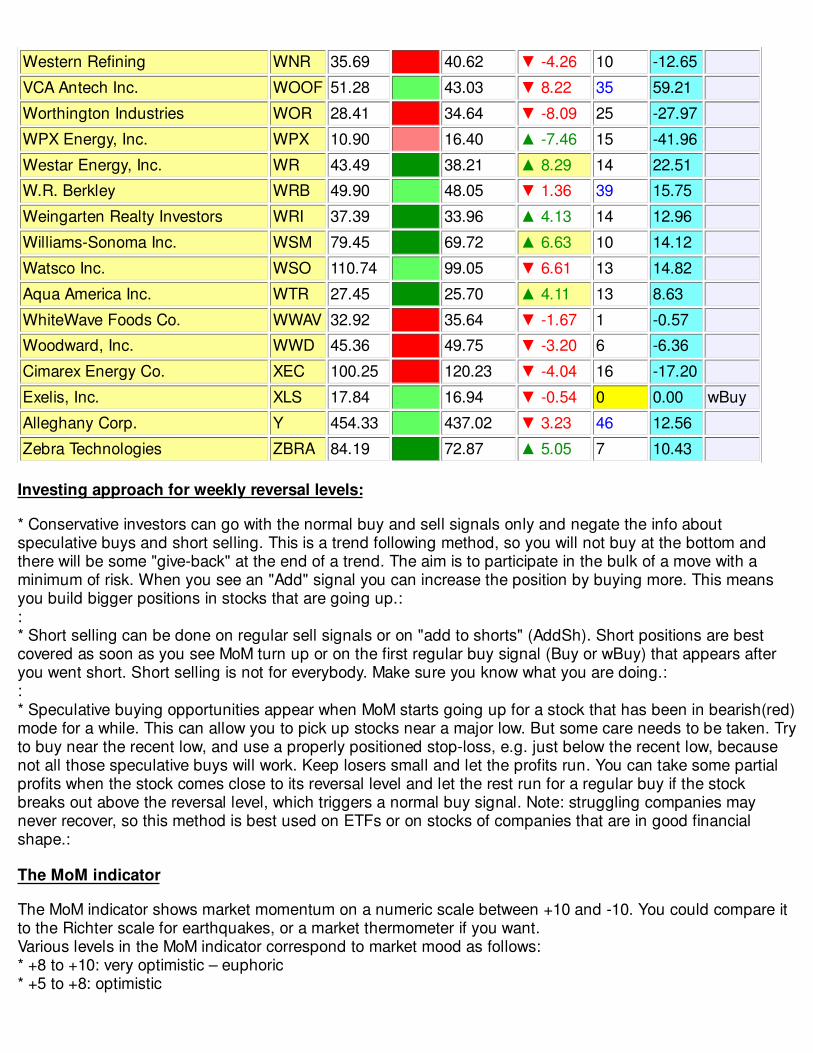
Investing approach for weekly reversal levels:
* Conservative investors can go with the normal buy and sell signals only and negate the info aboutspeculative buys and short selling. This is a trend following method, so you will not buy at the bottom andthere will be some "give-back" at the end of a trend. The aim is to participate in the bulk of a move with aminimum of risk. When you see an "Add" signal you can increase the position by buying more. This meansyou build bigger positions in stocks that are going up.::* Short selling can be done on regular sell signals or on "add to shorts" (AddSh). Short positions are bestcovered as soon as you see MoM turn up or on the first regular buy signal (Buy or wBuy) that appears afteryou went short. Short selling is not for everybody. Make sure you know what you are doing.::* Speculative buying opportunities appear when MoM starts going up for a stock that has been in bearish(red)mode for a while. This can allow you to pick up stocks near a major low. But some care needs to be taken. Tryto buy near the recent low, and use a properly positioned stop-loss, e.g. just below the recent low, becausenot all those speculative buys will work. Keep losers small and let the profits run. You can take some partialprofits when the stock comes close to its reversal level and let the rest run for a regular buy if the stockbreaks out above the reversal level, which triggers a normal buy signal. Note: struggling companies maynever recover, so this method is best used on ETFs or on stocks of companies that are in good financialshape.:
The MoM indicator
The MoM indicator shows market momentum on a numeric scale between +10 and -10. You could compare itto the Richter scale for earthquakes, or a market thermometer if you want.Various levels in the MoM indicator correspond to market mood as follows:* +8 to +10: very optimistic – euphoric* +5 to +8: optimistic

* +3 to +5 : positive* -3 to +3: neutral* -3 to -5: negative* -8 to -5: pessimistic* -10 to -8: very pessimistic – depressed
Besides the level itself, we also pay attention to the direction. In a healthy bull market, the MoM will be risingtogether with the market. When MoM starts going down in a bull market (green), it is a first indication that themarket may have peaked (or about to do so), and that’s when market mode sets to light green. In a risingmarket you will typically find MoM hovering between +3 and +10. Market pullbacks will generally end withMoM bottoming out in the neutral zone ( -3 to +3) before turning back up. In a declining market you willtypically find MoM hovering between -3 and -10. Market rebounds will generally end with MoM peaking out inthe neutral zone ( -3 to +3) before turning back down.
Q & A
Q: I prefer swing trading and your weekly signals seem to be rather slow. Do you have something faster too?A: Sure. We also publish daily reversal levels, which are tailored for swing trading. Check it out on the contactaddresses given below.
Q: Where can I find more information about these reversal levels and MoM indicator?A: You can find more materials here: http://lunatictrader.wordpress.com/key-reversal-levels/. More will beadded in the near future as well as example trades.
Q: I am a fundamental investor, can I do anything with these reversal levels?A: Well, even if you select stocks based on fundamentals it will make a difference *when* you buy (sell) them.Better timing can make a big difference, even for a long term buy and hold investor. For example if youranalysis shows you that company XYZ is great value, then you can still wait until the reversal levels give abuy signal ( or a speculative buy) to get in. Just try and see whether it improves your results.
Q: Your predictions for last week didn't work very well. But your table always shows a lot of blue (profits). Whyshould I believe this?A: The reversal levels are not a prediction, they are an approach to trading. All you can do is try it in your owntrading (even paper trading) and see how it works. It will naturally take more than one week to see if a methodis good or not. You are also not required to believe anything. You can verify the "%Ch." numbers if you want.Just take the Open on the Monday after the buy (sell) signal was given and calculate the change to date. Itshould match what you find in the table. If that is not the case, feel welcome to contact us with your question.
Q: A stock I own is already trading below its reversal level, so it will probably turn to bearish mode this week.Do I need to wait for the next Monday's Open to sell this stock?A: If going into the close on Friday you see that one of your stocks is almost certain to close below the weeklyreversal level then you can already sell it with a MOC (market on close) order. Sometimes this will give you aslightly better exit than waiting for next Monday's open.
Q: Do I need to take all buy signals in the list?A: No. Maybe you don like IBM, or the leveraged and reverse ETF in the list, that's up to you of course. Also,whenever a buy signal appears we can always check how far the stock is above its reversal level. That givesus an estimate how much risk is in this trade, because the stock will be sold if it drops and closes below thereversal level. E.g. it is possible that a stock jumps 20% on good news and is already too far above thereversal level when the buy signal appears. In that case you can wait until the price comes back to thereversal level to pick it up. So, that's where you can always use some discretion.
Q: Do I need to take all sell signals for stocks I own? What if I am sure my stock will recover soon?A: If you intend to use the reversal levels properly, then the answer is: yes, always sell when a stock hasclosed below its reversal level. Take the profit (or loss) and move on to the next chance. True, sometimes astock will come right back after giving a sell signal, but many more times that doesn't happen and the stockjust keeps sinking for some reason that you may not hear about until weeks later (and maybe 20% lower).Then you will be happy if you sold on the reversal sell signal. This is a discipline thing. Also remember, if thestock happens to come right back then it will climb back above its reversal level and give a buy signal again.We can then just buy it right back. That would costs us a few %, but that's a small price to pay for avoidingbig losers. What we try to do is get in on some big trending moves. We will take small losses on the tradesthat do not work, and that's the price we pay to get in on big profitable moves.
Q: Shouldn't we buy more when a stock we own is down, in order to reduce our average cost basis?A: With this method we do not add to losing positions. Only with the speculative buy signals we can decide inadvance to buy in up to 2 tranches, because we can have several speculative buy signals before a stockfinally gets into bullish Mode. A good strategy is to buy a half position on a speculative buy signal and thenbuy another half postion on the next regular Buy signal. That gives us a full position and from then on wetrade it normally. The "Add" signals you see in the tables are always at subsequently higher prices, which is a"doubling up" strategy (anti-Martingale). So, with reversal levels we do not double down on losers, we justsell them and wait for the next buy signal. This has the advantage that we don't end up with overly bigpositions in poorly performing stocks that may keep going nowhere for weeks or months.
Q: How many winners can I expect with this method?A: It is better to ask how big the winners will be versus the losers. You may have only 40% winners and stillcome out well ahead because the average win is much larger than the average loss. You can see in the tablewhat kind of winners you can expect. There are always stocks that show 20% or better profits (see "% Ch.") ifyou had taken the latest buy signal (or shorted the latest sell). If you stick to buying stocks that are not too farabove their reversal levels when they give a buy signal then you will keep most of your losses small.
Q: If a stock crashes 50% and falls below the reversal level then it will give a Sell signal at the end of thisweek. But, that doesn't help me today and I do not want to suffer the risk of such big losses. What can I do?A: A large adverse move overnight can never be ruled out. A well diversified portfolio will offer some protectionalready. But you can use a disaster stop-loss, which I would put 10 or 20% below the reversal level. That willsometimes get you out of a crashing stock before the losses get even bigger. There is no such thing asinvesting without the risk for losses.
If you have questions, then you can contact me on my blog:http://LunaticTrader.wordpress.comOn Twitter: https://twitter.com/lunatictrader1Or find me on Scutify.com and ask away:http://www.scutify.com/profiles/scutifier.aspx?q=LunaticTrader
Happy Trading,Danny (aka LunaticTrader)
© 2015 LunaticTrader.Wordpress.com
DisclaimerInvesting in stocks, forex or commodities is risky. No guarantee can be given that the opinions or predictions given on this site will becorrect. LunaticTrader cannot in any way be responsible for eventual losses you may incur if you trade based on the information givenon this site. Hypothetical or simulated performance results have certain inherent limitations. Unlike an actual performance record,

simulated results do not represent actual trading. Also, since the trades have not actually been executed, the results may have under-or over-compensated for the impact, if any, of certain market factors, such as lack of liquidity. Simulated trading programs in generalare also subject to the fact that they are designed with the benefit of hindsight. No representation is being made that any account willor is likely to achieve profits or losses similar to those shown. The information on this site should not be considered as arecommendation to engage in the purchase and/or sale of any stock, futures contract and/or options. You should be aware of all therisks associated with trading, and seek the advice from your own independent financial advisor before you make any investmentdecisions. Trade at your own risk and responsibility.