western cape government provincial treasury · western cape government provincial treasury...
TRANSCRIPT

Western Cape Government
Provincial Treasury
Socio-economic Profile
Langeberg Municipality 2015 Working Paper

To obtain additional information of this document, please contact: Western Cape Provincial Treasury Local Government Budget Office Private Bag X9165 7 Wale Street Cape Town tel: +27 21 483 3386 fax: +27 21 483 4680 This publication is available online at www.westerncape.gov.za

i
Contents Langeberg: At a Glance
Introduction 1
1. Demographics 2
2. Education 4
3. Health 7
4. Poverty 12
5. Safety and security 13
6. Basic services 14
7. Economy 17
8. Labour market 20
9. Environment 23
10. Broadband penetration 30
11. Concluding remarks 31
Annexure: Langeberg: Ward specific access to basic services, 2011 33
Tables
Table 1 Cape Winelands District: Household estimates, 2011 - 2015 4
Table 2 Cape Winelands District municipalities: Education indicators 5
Table 3 Cape Winelands District municipalities: Education facilities, 2014 6
Table 4 Cape Winelands District municipalities: Education outcomes, 2013 - 2014
6
Table 5 Cape Winelands District: Healthcare services, 2015 7
Table 6 Western Cape: Healthcare personnel, 2015 8
Table 7 Cape Winelands District: HIV, AIDS and Tuberculosis prevalence and care, 2015
9
Table 8 Cape Winelands District: Child and maternal health, 2014/15 10
Table 9 Cape Winelands District: Community based services, 2015 11
Table 10 Cape Winelands District: Household income, 2011 12
Table 11 Cape Winelands District: Per capita income, 2011 - 2013 12
Table 12 Cape Winelands District: Access to water, 2014 15
Table 13 Cape Winelands District: Access to refuse removal, 2014 16
Table 14 Cape Winelands District: Access to electricity, 2014 16
Table 15 Cape Winelands District: Access to sanitation, 2014 17
ii
Table 16 Cape Winelands District: Types of housing structures, 2014 17
Table 17 Cape Winelands District: GDPR growth, 2000 - 2013 19
Table 18 Cape Winelands District: Sectoral growth, 2005 - 2013 19
Table 19 Cape Winelands District: GDPR growth vs net employment, 2005 - 2013
22
Table 20 Cape Winelands District municipalities: Employment per skills sector, 2005 - 2013
22
Figures
Figure 1 Cape Winelands District municipalities: Population projections, 2015 - 2020
2
Figure 2 Langeberg: Population age cohort, 2015 3
Figure 3 Langeberg: Population age distribution: 2015 and 2020 3
Figure 4 Langeberg: Crime statistics, 2005/06 to 2014/15 13
Figure 5 Cape Winelands District: Crime statistics per 100 000, 2014/15 14
Figure 6 Cape Winelands District municipalities: GDPR growth, 2005 - 2013 18
Figure 7 Langeberg: Sectoral composition, 2013 20
Figure 8 Cape Winelands District municipalities: Municipal GDPR vs municipal employment, 2013
20
Figure 9 Cape Winelands District: Municipal GDPR vs municipal employment, 2005 - 2013
21
Figure 10 Langeberg: Employment by sector, 2013 21
Figure 11 Cape Winelands District: Internet access, 2011 30

Economy BroadbandLabour
Access to Basic Service Delivery, 2014 Minimum service level
Largest 3 Sectors, 2013
Health, 2015
Safety and Security Actual number of crimes in 2014/15 year
Demographics, 2015
PovertyEducation
4.3% -0.4%
28.0%
12
97.8% 72.0% 94.3% 89.2%
ManufacturingWholesale and Retail Trade, Catering
and Accommodation Services
31.6% 13.1%
Agriculture, Forestry and Fishing
18.3%
616 1 432171 26 126
Langeberg: At a Glance
8 0.072.6% 9.8%
101 543 27 566
12.0%
R34 592
84.2%
75.3%
GDP Growth 2005 – 2013
Employment Growth 2005 – 2013
Percentage of HH with access to Internet 2011
Wi-FI Hotspots by 2017
Water Refuse Removal Electricity Sanitation
Primary Health Care Facilities
Immunisation Rate
Teenage Pregnancies - Delivery rate to women U/18
Residential Burglaries Drug-relatedDUI Murder Sexual Crimes
Population Households
Households earning less than R400 in 2011
Per Capita Income 2013Literacy Rate 2011
Matric Pass Rate 2014
Maternal Mortality Ratio (per 100 000 live births)


Langeberg Municipality
1
Introduction
Regional profiles provide the Western Cape municipalities with valuable data and information which assist in planning, budgeting and the prioritisation of municipal services. It is acknowledged that municipalities across the Western Cape have different capacities and therefore will use the information in this publication to suit their own needs.
The 2015 Socio-economic Profiles builds upon the success of previous editions by providing updated information relating to demographics, education, health, poverty, safety and security, basic service delivery, economy, labour market and environmental management. New information has also been added in the form of ward specific basic service delivery statistics, broadband penetration rates as well as municipal specific Wi-Fi roll-out data.
The profile furthermore complements the socio-economic performance analysis of the Municipal Economic Review and Outlook (MERO) 2015 which was published in October 2015.
In all, the profile reflects the socio-economic reality of municipalities. As such, valuable insight can be gained as to the developmental challenges faced by communities residing within a specific geographical area.
This profile primarily uses data sourced from Statistics South Africa, administrative data from sector departments, the 2015 MERO and Quantec. The data sourced from sector departments are the most recent that is available. The latest survey data available at municipal level from Statistics South Africa includes the 2011 Census. The updated population forecasts by the Department of Social Development will assist municipalities with future planning.
The information contained in this profile therefore highlights information for the Langeberg Municipality in relation to the broader Western Cape Province.

Socio-economic Profile 2015
2
1. Demographics
1.1 Population
According to Census 2011 data, the Western Cape population grew at 2.6 per cent per annum between 2001 and 2011. This rate, which was higher than the national population growth rate of 1.5 per cent, can largely be attributed to an influx of individuals from other provinces that move to the Western Cape in search of job opportunities.
From this growth base, the Western Cape Department of Social Development was able to make accurate population growth estimates for each municipality for the period 2015 - 2020. These projections will assist municipalities to align their budget allocations with basic service delivery priorities.
Figure 1 Cape Winelands District municipalities: Population projections, 2015 - 2020
Source: Western Cape Department of Social Development, 2015
Of the five local municipalities within the Cape Winelands District, Langeberg has the lowest population which is estimated to be 101 543 in 2015. This total gradually increases across the 2015/16 MTREF years and is projected to reach 106 016 by 2020. This total equates to an approximate 4.4 per cent growth off the 2015 base estimate.
Witzenberg Drakenstein Stellenbosch Breede Valley Langeberg
2015 124 492 263 912 167 572 174 198 101 543
2016 126 573 267 013 170 572 176 008 102 472
2017 128 614 270 070 173 557 177 793 103 389
2018 130 605 273 068 176 519 179 548 104 287
2019 132 546 275 984 179 463 181 262 105 160
2020 134 440 278 794 182 373 182 938 106 016
0
50 000
100 000
150 000
200 000
250 000
300 000
Langeberg Municipality
3
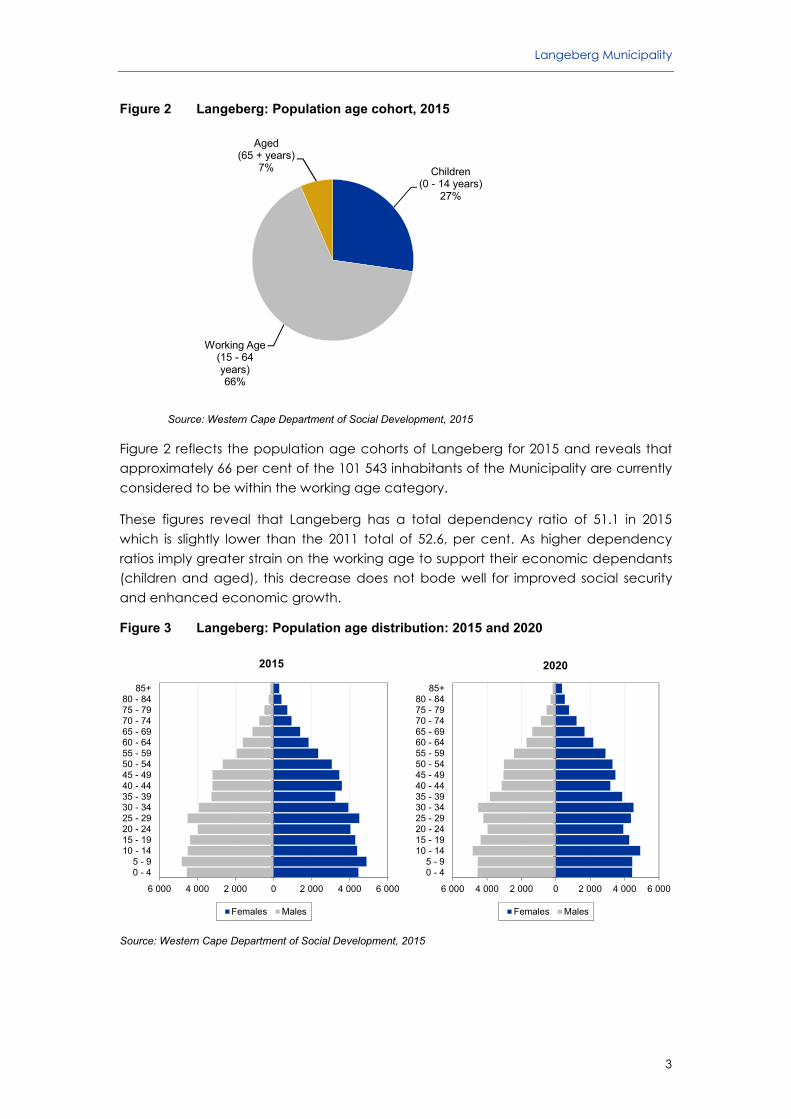
Figure 2 Langeberg: Population age cohort, 2015
Source: Western Cape Department of Social Development, 2015
Figure 2 reflects the population age cohorts of Langeberg for 2015 and reveals that approximately 66 per cent of the 101 543 inhabitants of the Municipality are currently considered to be within the working age category.
These figures reveal that Langeberg has a total dependency ratio of 51.1 in 2015 which is slightly lower than the 2011 total of 52.6, per cent. As higher dependency ratios imply greater strain on the working age to support their economic dependants (children and aged), this decrease does not bode well for improved social security and enhanced economic growth.
Figure 3 Langeberg: Population age distribution: 2015 and 2020
Source: Western Cape Department of Social Development, 2015
Children (0 - 14 years)
27%
Working Age (15 - 64 years)66%
Aged (65 + years)
7%
6 000 4 000 2 000 0 2 000 4 000 6 000
0 - 45 - 9
10 - 1415 - 1920 - 2425 - 2930 - 3435 - 3940 - 4445 - 4950 - 5455 - 5960 - 6465 - 6970 - 7475 - 7980 - 84
85+
2015
Females Males
6 000 4 000 2 000 0 2 000 4 000 6 000
0 - 45 - 9
10 - 1415 - 1920 - 2425 - 2930 - 3435 - 3940 - 4445 - 4950 - 5455 - 5960 - 6465 - 6970 - 7475 - 7980 - 84
85+
2020
Females Males

Socio-economic Profile 2015
4
A population pyramid is a visual representation of a society’s age and sex distribution and provides policymakers and scholars alike with valuable insight as to fertility, mortality and immigration rates. When comparing the shape of the 2015 and 2020 population pyramids, population increases are particularly noticeable at young ages, particularly from 10 to14 years, as well as in the working age population between 35 and 44 years. The significant increase in the age group 10 -14 years will have particular implications for the provision of educational facilities and services related to children about to enter (and already attending) high school. The growth in the labour force will result in a greater need for employment opportunities.
1.2 Households
In addition to population projections, the projections on the number of households form the basis of municipal service delivery planning and essentially inform budget allocations towards basic services such as water, electricity, sanitation and refuse removal. It is therefore vital that for budget planning and implementation purposes a municipality rely on credible and accurate household estimates.
Table 1 Cape Winelands District: Household estimates, 2011 - 2015
Municipality 2011 2012 2013 2014 2015
Cape Winelands District 204 909 208 265 211 646 215 104 218 620
Witzenberg 28 262 28 766 29 268 29 785 30 305
Drakenstein 61 859 62 818 63 785 64 768 65 778
Stellenbosch 44 953 45 695 46 446 47 219 48 008
Breede Valley 43 832 44 599 45 374 46 163 46 963
Langeberg 26 003 26 387 26 773 27 169 27 566
Source: Quantec Research, 2015
As per Table 1, the total number of households in the Langeberg Municipality was estimated to be 27 566 in 2015 which equates to 1.46 per cent growth from 2014; the slowest growth rate within the Cape Winelands District.
2. Education
Education and training improves access to employment opportunities and helps to sustain and accelerate overall development. It expands the range of options available from which a person can choose to create opportunities for a fulfilling life. Through indirect positive effects on health and life expectancy, the level of education of a population also influences its welfare.

Langeberg Municipality
5
2.1 Literacy
Literacy is used as a benchmark to indicate a minimum education level attained. A simple definition of literacy is the ability to read and write, but it is more strictly defined as the successful completion of a minimum of 7 years of formal education. Since most learners start school at the age of 7 years, the literacy rate is calculated as the proportion of those 14 years and older who have successfully completed a minimum of 7 years of formal education. The literacy rate in Langeberg was recorded at 75.3 per cent in 2011 which is slightly lower than the average literacy rate of the Western Cape at 87.2 per cent.
2.2 Learner enrolment, the learner-teacher ratio and learner dropout rate
Population dynamics, which include knowledge of the current population profile and projected learner growth, provide a basis for sound education planning. Knowing the learner enrolment numbers of a municipality enables the Western Cape Education Department (WCED) to determine the level of demands placed on schools for the current year as well as anticipated demands for future years. Having a sense of the exit points allows the WCED to plan more effectively with respect to Further Education and Training (FET). The learner-teacher ratio is very important, because it is closely related to the amount of money spent per child. It also has an impact on the education outcomes.
Table 2 Cape Winelands District municipalities: Education indicators
Municipality
Learner enrolment Dropout rate Learner-teacher ratio
2013 (Gr 1 - 12 + LSEN) ASS 2014
Average dropout rate 2012
Crude dropout rate using
Yr 2013 - Gr 10 and Yr 2015 - Gr 12
Average learner-teacher
ratio 2012
ASS 2014: ALL state+sgb+
substitutes teachers excl. practitioners
and other
Witzenberg 17 922 18 038 38.00% 29.00% 27.3 29.3
Drakenstein 46 821 46 474 28.60% 27.00% 26.6 28.8
Stellenbosch 26 657 25 274 31.90% 21.80% 21.5 26.3
Breede Valley 32 004 32 076 40.90% 32.20% 27.3 29.3
Langeberg 17 415 17 226 48.30% 38.70% 26.8 29.4
Source: Western Cape Department of Education, Annual Survey of public and independent schools (ASS) 2014
According to the Annual Survey of Public and Independent Schools (ASS) done by the WCED in 2014, learner enrolment in Langeberg has decreased slightly from 17 415 in 2013 to 17 226 in 2014. The average school dropout rate in Langeberg was recorded at 48.30 per cent in 2012, however the dropout rate measured amongst Grade 10 learners of 2013 and Grade 12 learners at the start of 2015 were 38.70 per cent. The average learner-teacher ratio for Langeberg has increased between 2012 and 2014 from 26.8 to 29.4 indicating either greater learner enrolment or lower teacher employment.

Socio-economic Profile 2015
6
2.3 Education facilities
The availability of adequate education facilities such as schools, FET colleges and schools equipped with libraries and media centres could affect academic outcomes positively. Langeberg had 55 schools in 2014 which had to accommodate 17 226 learners at the start of 2014. In an effort to alleviate some of the funding challenges the Western Cape Department of Education offer certain fee-paying schools to become no fee schools. The proportion of no fees schools however decreased from 90.90 per cent in 2012 to 87.30 per cent in 2014. Langeberg, Witzenberg and Stellenbosch each have nine (9) of Public FET Colleges whose mandate is to ensure that education, training and skills development initiatives respond to the economy, rural development challenges and an informed and critical citizenry. The number of schools in Langeberg with libraries or media centres decreased from 19 to 17 between 2012 and 2014 which could be considered a concern.
Table 3 Cape Winelands District municipalities: Education facilities, 2014
Municipality
Total number of schools
Number/proportion of no fee schools
Public FET colleges - main + sat
Education facilities: Number of schools with libraries/media centres
2014 Dec 2012 2014 Dec ASS 2014 Lib 2012 2014
Witzenberg 53 67.90% 84.90% 9 16 16
Drakenstein 68 58.80% 67.70% 17 45 48
Stellenbosch 40 67.50% 65.00% 9 32 29
Breede Valley 56 66.07% 80.40% 15 31 33
Langeberg 55 90.90% 87.30% 9 19 17
Source: Western Cape Department of Education, Annual Survey of public and independent schools (ASS) 2014
2.4 Educational outcomes (matric pass rate)
Education remains one of the key avenues through which the state is involved in the economy. In preparing individuals for future engagement in the labour market, policy choices and decisions in the sphere of education play a critical role in determining the extent to which future economic and poverty reduction plans can be realised.
Table 4 Cape Winelands District municipalities: Education outcomes, 2013 - 2014
Municipality
Education outcomes: Matric pass rate
2013 2014
Witzenberg 84.7% 75.1%
Drakenstein 89.4% 83.8%
Stellenbosch 88.1% 87.2%
Breede Valley 81.7% 82.1%
Langeberg 88.9% 84.2%
Source: Western Cape Department of Education, Annual Survey of public and independent schools (ASS) 2014
Langeberg Municipality
7
The 2014 matric results for all municipalities except for Breede Valley dropped from the previous year’s outcomes. In the case of Langeberg the results declined from 88.9 per cent in 2013 to 84.2 per cent in 2014. The overall drop in the matric results is mainly attributed to stricter assessments and marking criteria used in the 2014 examinations.
3. Health1
Good health is vital to achieving and maintaining a high quality of life. A diverse range of factors play a role in ensuring the good health of communities and that disease, especially preventable and contagious/communicable ones, are kept at bay. Some of the factors include lifestyle features that also depend on the provision of high quality municipal services, such as clean water, sanitation and the removal of solid waste.
The information provided by the Department of Health as detailed in this section, pertains only to public sector healthcare institutions. Any privately provided facilities or services are not reflected in the information below.
3.1 Healthcare services: Facilities and personnel
Access to healthcare facilities is directly dependent on the number and spread of facilities within a geographic space. South Africa’s healthcare system is geared in such a way that people have to move from primary, with a referral system, to secondary and tertiary levels.
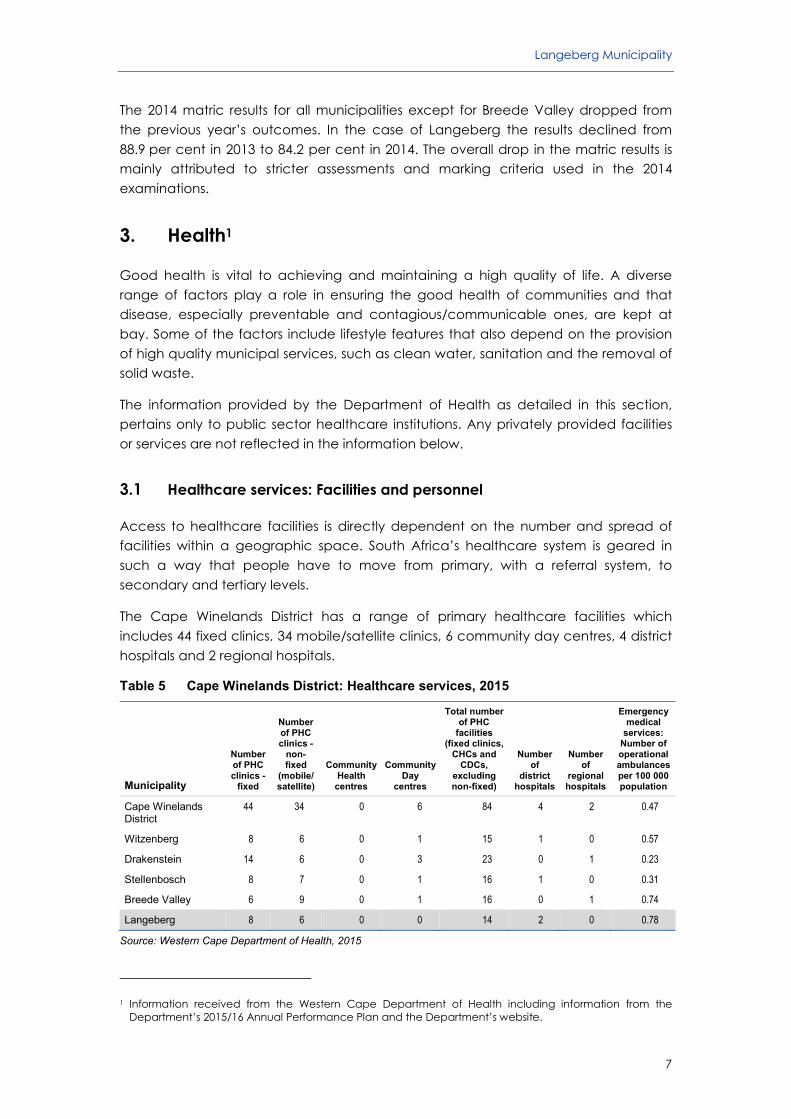
The Cape Winelands District has a range of primary healthcare facilities which includes 44 fixed clinics, 34 mobile/satellite clinics, 6 community day centres, 4 district hospitals and 2 regional hospitals.
Table 5 Cape Winelands District: Healthcare services, 2015
Municipality
Number of PHC clinics -
fixed
Number of PHC clinics -
non-fixed
(mobile/ satellite)
Community Health centres
Community Day
centres
Total number of PHC
facilities (fixed clinics,
CHCs and CDCs,
excluding non-fixed)
Number of
district hospitals
Number of
regional hospitals
Emergency medical
services: Number of operational ambulances per 100 000 population
Cape Winelands District
44 34 0 6 84 4 2 0.47
Witzenberg 8 6 0 1 15 1 0 0.57
Drakenstein 14 6 0 3 23 0 1 0.23
Stellenbosch 8 7 0 1 16 1 0 0.31
Breede Valley 6 9 0 1 16 0 1 0.74
Langeberg 8 6 0 0 14 2 0 0.78
Source: Western Cape Department of Health, 2015
1 Information received from the Western Cape Department of Health including information from the Department’s 2015/16 Annual Performance Plan and the Department’s website.

Socio-economic Profile 2015
8
Currently in 2015, there are 16 healthcare facilities operational in the Langeberg municipal area. These include 8 fixed clinics, 6 mobile/satellite clinics and 2 district hospitals situated within the Langeberg area. There are no regional hospitals situated in the Langeberg municipal area. These healthcare facilities must service 101 543 people within Langeberg which implies one fixed/mobile/satellite primary healthcare facility for every 7 253 people, indicating the need for more healthcare facilities within the municipal area.
Due to rural distances between towns and health facilities being much greater than in the metropole, combined with the relatively lower population per square kilometre in rural areas, ambulance coverage is greater in rural areas in order to maintain adequate coverage for rural communities. Within the Cape Winelands District, Langeberg (0.78) has the highest number of ambulances per 100 000 population.
Healthcare personnel is also variedly spread across the districts; overall within the Western Cape, the Cape Winelands District fairs comparably in terms of average number of personnel when compared to other districts.
Table 6 Western Cape: Healthcare personnel, 2015
Regional area Number of
medical officers*Number of
professional nurses* Number of staff
nurses* Number of nursing
assistants*
Western Cape 33.4 99.2 40.3 66.5
City of Cape Town 42.1 107.8 42.4 79.1
West Coast District 9.3 63.8 31.8 34.8
Cape Winelands District 22.3 84.8 41.4 49.2
Overberg District 11.5 70.6 24.7 31.9
Eden District 20.7 97.1 39.0 45.8
Central Karoo District 19.4 132.8 38.7 74.7
* Per 100 000 people
Source: Western Cape Department of Health, 2015
3.2 HIV, AIDS and Tuberculosis treatment and care
Although treatment and care is essential in the management of HIV and AIDS, the need and importance of preventative care cannot be over-emphasised, especially since to date, there is no known cure.

Langeberg Municipality
9
Table 7 Cape Winelands District: HIV, AIDS and Tuberculosis prevalence and care, 2015
Municipality
HIV - Antiretroviral treatment Tuberculosis
ART patient
load March
2013
ART patient
load March
2014
ART patient
load March
2015
Mother-to-child
transmission rate
Number of ART clinics/
treatment sites 2015
Number of TB
patients 2012/13
Number of TB
patients 2013/14
Number of TB
patients 2014/15
Number of TB clinics/ treatment
sites 2015
Cape Winelands District 14 170 17 463 19 615 1.7% 44 7 213 7 327 7 382 94
Witzenberg 2 008 2 786 3 250 3.2% 5 1 066 1 112 1 035 19
Drakenstein 4 627 5 276 5 902 1.1% 15 2 208 2 137 2 067 27
Stellenbosch 2 940 3 574 4 021 2.6% 9 1 100 1 215 1 191 15
Breede Valley 3 358 4 248 4 584 1.2% 8 1 833 1 865 2 050 17
Langeberg 1 237 1 579 1 858 0.0% 7 1 006 998 1 039 16
Source: Western Cape Department of Health, 2015
At the end of June 2011, the Province highlighted that Antiretroviral treatment (ART) was provided to over 100 000 persons. By the end of March 2015, Langeberg’s patient load had increased to 1 858, administered from 7 treatment sites.
In addition to improving the quality of life of the patient, anti-retroviral treatment to mothers both before and at birth, also decreases the chances that infants will contract HIV from their mothers. The most recent information for Langeberg indicates a mother-to-child transmission rate of 0.0 per cent which compares favourably with a 1.7 per cent transmission rate for the District.
The number of TB patients in the Cape Winelands District has increased over past few years, to 7 382 in 2014/15, treated at 94 clinics or treatment sites. In the Langeberg municipal area, patient load has also shown an increase over the past year, reaching a patient load of 1 035 with treatment administered from 16 clinics or treatment sites.
3.3 Child health: Immunisation2, malnutrition, neonatal mortality, low birth weight
Immunisation: Immunisation protects both adults and children against preventable infectious diseases. Low immunisation rates speak to the need for parents to understand the critical importance of immunisation, as well as the need to encourage parents to have their young children immunised. In 2015, full immunisation coverage rate for the Langeberg Municipality of 73 per cent was lower than the District average of 79 per cent.
Malnutrition: Malnutrition (either under or over nutrition) refers to the condition whereby an individual does not receive adequate amounts or excessive amounts of nutrients. The number of malnourished children under five years in the Langeberg municipal area in 2015 was 2.62 per 100 000 population. This is the third highest after Drakenstein (3.65) and Witzenberg Municipality (3.64).
2 The immunisation rate is calculated as the number of children immunised as a percentage of the total number of children less than one year of age. If children who are one year or older are immunised, the immunisation rate for that year could be greater than 100 per cent because more than 100 per cent of children aged less than one year would have been immunised in that particular year.

Socio-economic Profile 2015
10
Table 8 Cape Winelands District: Child and maternal health, 2014/15
Child health Maternal health
Municipality
Full immunisation
coverage under 1 year
Severely malnutrition
rate under 5 years
Neonatal mortality
rateLow birth
weight
Maternal mortality
ratio
Delivery rate to women
under 18 years
Termination of
pregnancy rate
Cape Winelands District
79% 2.94 4.9 15% 20.8 7.3% 9.4%
Witzenberg 69% 3.64 11.6 16% 0.0 9.6% 1.1%
Drakenstein 78% 3.65 0.7 14% 35.8 6.7% 15.4%
Stellenbosch 86% 1.76 4.0 10% 0.0 4.8% 8.0%
Breede Valley 86% 2.60 6.8 19% 27.0 7.9% 10.7%
Langeberg 73% 2.62 10.8 16% 0.0 9.8% 2.9%
Source: Western Cape Department of Health, 2015
Neonatal mortality rate: The first 28 days of life – the neonatal period – represent the most vulnerable time for a child’s survival. The neonatal mortality rate is the number of neonates dying before reaching 28 days of age, per 1 000 live births in a given year. Langeberg’s (10.8) neonatal morality rates are currently not within the Province’s 2019 target of 6.0 per 1 000 live births.
Low birth weight: Low birth weight is defined as weight at birth of less than 2 500 g. Low birth weight is associated with a range of both short and long term consequences. In the Cape Winelands District, 15 per cent of babies had a low birth weight Langeberg and Witzenberg jointly had the second highest percentage of babies with low birth weight in the District.
3.4 Maternal health: Maternal mortality, births to teenage mothers, termination of pregnancy
Maternal health refers to the health of women during pregnancy, childbirth and the postpartum period.
Maternal mortality3: Maternal death is death occurring during pregnancy, childbirth and the puerperium4 of a woman while pregnant or within 42 days of termination of pregnancy, irrespective of the duration and site of pregnancy and irrespective of the cause of death (obstetric and non-obstetric).
Langeberg Municipality’s most recent figures show a maternal mortality ratio of 0.0 per 100 000 live births with the District’s ratio at 20.8. The Province has a maternal mortality ratio target of 65 by 2019.
Births to teenage mothers: Teenage pregnancy is almost always unplanned; as a result when young parents are placed in a position to care for their children, life can become particularly tough, especially if they do not have family or social support.
3 Maternal deaths per 100 000 live births in health facilities. 4 Puerperium is defined as the time from the delivery of the placenta through the first few weeks after the
delivery. This period is usually considered to be 6 weeks in duration.

Langeberg Municipality
11
In the 2014/15 financial year, the delivery rate to women under 18 years in the Cape Winelands was 7.3 per cent. Langeberg’s rate of 9.8 per cent was the highest in the District.
Termination of pregnancy: Government hospitals, designated private doctors and gynaecologists, and non-profit providers offer safe and legal termination of pregnancy. To have a free abortion, the request must be made at a primary healthcare clinic, where the pregnancy will be confirmed, counselling provided, an appointment made, and a referral letter be given to a facility where the procedure can be performed.
Langeberg’s termination of pregnancy rate5 of 2.9 per cent is the second lowest in the District and is below the District’s 9.4 per cent.
Reading the teenage delivery and termination of pregnancy rates together suggests that, especially within some local municipalities, there may be a particular challenge with respect to unplanned and unwanted pregnancies.
3.5 Community based services
Community Based Services (CBS) in the Western Cape are provided by non-profit organisations (NPOs). Home CBS does not replace the family as the primary caregiver; it is meant to be a complementary and supportive service to the family to prevent ‘burn-out’ for family caregivers who care for sick relatives.
Table 9 Cape Winelands District: Community based services, 2015
Community based services
Municipality
Total number of non-profit organisation appointed home carers
Total number of visits
Average number of monthly visits
per carer
Cape Winelands District 325 1 656 602 425
Witzenberg 43 225 827 438
Drakenstein 95 492 333 432
Stellenbosch 68 376 007 461
Breede Valley 63 375 992 497
Langeberg 56 186 443 277
Source: Western Cape Department of Health, 2015
The total number of NPO appointed carers in Cape Winelands District during 2014/15 was 325. On average, each carer carried out an average of 425 monthly visits. Within Langeberg municipality, the average number of monthly visits for the 56 carers was the lowest at 277.
5 Termination of pregnancy rate is calculated as the percentage of terminations as a proportion of the female population aged 15 to 44 years.

Socio-economic Profile 2015
12
4. Poverty
In an effort to eliminate poverty and reduce inequality, the National Development Plan has set the objective of having zero households earn less than R418 per month by 2030.
As per the Table 10, Langeberg Municipality was in 2011 still behind target with approximately 12 per cent of Langeberg’s households had an income of less than R400 per month households that earned less than R400 a month. Lower levels of household income increases indigent dependency on municipal support. Municipal resources are therefore strained in an effort to provide free basic services.
Table 10 Cape Winelands District: Household income, 2011
Municipality None
income R1 -
R4 800 R4 801 -
R9 600 R9 601 - R19 600
R19 601 - R38 200
R38 201 - R76 400
R76 401 - R153 800
R153 801 - R307 600
R307 601 - R614 400
R614 001 - R1 228 800
R1 228 801 - R2 457 600
R2 457 601 or more
Cape Winelands District
13.1 1.9 3.4 13.2 20.3 18.4 12.3 8.9 5.7 1.9 0.5 0.4
Witzenberg 6.4 1.9 4.0 18.5 25.8 20.9 10.4 6.8 3.9 0.9 0.3 0.2
Drakenstein 13.0 1.7 3.1 10.7 17.2 18.4 14.0 11.0 7.4 2.5 0.7 0.4
Stellenbosch 20.6 2.1 3.5 10.2 16.5 15.5 11.5 8.5 6.6 3.3 1.0 0.7
Breede Valley 12.0 1.7 2.9 14.9 22.2 19.0 12.6 8.5 4.7 1.0 0.3 0.2
Langeberg 9.7 2.3 4.4 15.5 24.9 20.0 11.0 7.3 3.6 0.8 0.2 0.2
Source: Statistics South Africa, Census 2011
Measuring levels of poverty and inequality for the period 2006 to 2011, Statistics South Africa’s 2014 Poverty Trends Report specifies that the lower-bound poverty line (LBPL) for March 2011 was set at R443 (per capita, inflation adjusted poverty line) meaning that any individual earning less than R443 a month would have to sacrifice essential food items in order to obtain non-food goods.
Compared to the above specified average household income for the Langeberg Municipality, it is concerning to note that 3 120 households in the municipal area earn less than R400 a month and must therefore survive on less than what an individual persons requires as per the LBPL measure.
Table 11 Cape Winelands District: Per capita income, 2011 - 2013
Regional area
Per capita income (R)
2011 2012 2013
Western Cape 43 614 44 291 44 553
Cape Winelands District 36 441 37 071 37 252
Witzenberg 21 243 21 640 21 787
Drakenstein 35 655 36 427 36 535
Stellenbosch 61 012 62 120 62 437
Breede Valley 25 807 25 969 25 923
Langeberg 33 872 34 204 34 592
Source: Own calculations, Department of Social Development, 2015 and Quantec, 2015
Langeberg Municipality
13
As per Table 11, per capita income in the Langeberg Municipality is the third lowest compare to the other local municipalities in the Cape Winelands region. The income levels for Langeberg increased by 1.1 per cent from R34 204 in 2012 to R34 592 in 2013. Langeberg Municipality therefore needs to make significant progress in order to achieve the 2030 target of R110 000 per person per annum.
5. Safety and security
The safety of persons and property is vitally important to the physical and emotional well-being of people and business. Without the respect of person and property, it would be impossible for people to live peacefully, without fear of attack and for businesses to flourish.
Crime has a significant impact on the economy. It can hamper growth and discourage investment and capital accumulation. If it is not tackled with seriousness, it has the potential to derail both social and economic prosperity.
Peoples’ general impressions, as well as the official statistics on safety and crime issues mould perceptions of areas as living spaces or place in which to establish businesses. The discussion in this section that follows is limited to the reported contact and property-related crime such as murder and sexual crimes, as well as crime heavily dependent on police action for detecting drug-related crimes and driving under the influence of alcohol/drugs; these are detailed in the Figure 4 below.
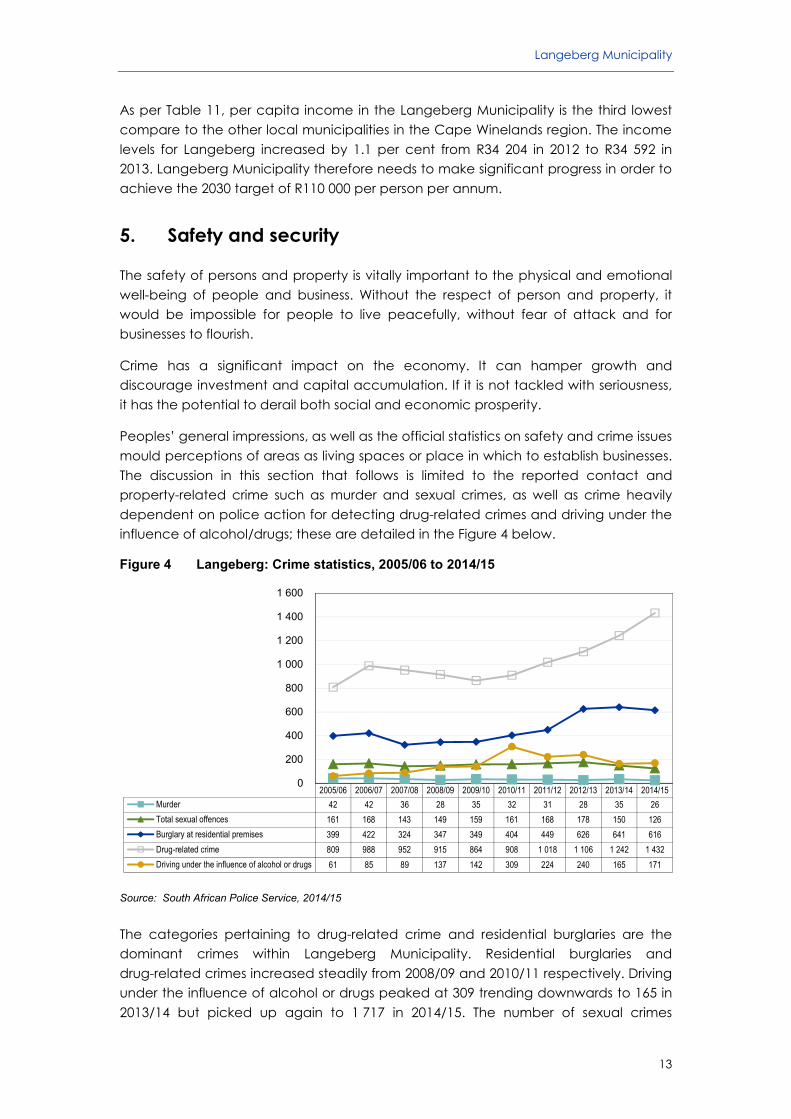
Figure 4 Langeberg: Crime statistics, 2005/06 to 2014/15
Source: South African Police Service, 2014/15
The categories pertaining to drug-related crime and residential burglaries are the dominant crimes within Langeberg Municipality. Residential burglaries and drug-related crimes increased steadily from 2008/09 and 2010/11 respectively. Driving under the influence of alcohol or drugs peaked at 309 trending downwards to 165 in 2013/14 but picked up again to 1 717 in 2014/15. The number of sexual crimes
2005/06 2006/07 2007/08 2008/09 2009/10 2010/11 2011/12 2012/13 2013/14 2014/15
Murder 42 42 36 28 35 32 31 28 35 26
Total sexual offences 161 168 143 149 159 161 168 178 150 126
Burglary at residential premises 399 422 324 347 349 404 449 626 641 616
Drug-related crime 809 988 952 915 864 908 1 018 1 106 1 242 1 432
Driving under the influence of alcohol or drugs 61 85 89 137 142 309 224 240 165 171
0
200
400
600
800
1 000
1 200
1 400
1 600

Socio-economic Profile 2015
14
increased unabated since 2008/09, peaking at 178 cases and then sloping downward to 126 cases in 2014/15. The number of murder cases declined from 35 in 2013/14 to 26 in 2014/15 financial year, the lowest level since 2005/06.
Figure 5 Cape Winelands District: Crime statistics per 100 000, 2014/15
Source: SAPS, Quantec Research, 2015
It is customary to express occurrences of crime per 100 000 as to allow for an easy comparison between areas with different population densities. In comparison to the other local municipalities in the region and the District average, crime per 100 000 population has been relatively low in Langeberg in 2014/15. To this extent, Langeberg had the lowest occurrences of murder, total sexual offences and burglary at residential premises. However, drug-related crimes and driving under the influence of alcohol/drugs remains a challenge within the municipal area as the Municipality has the second highest incidence of drug-related crimes and the highest incidence of driving under the influence of alcohol/drugs.
6. Basic services
Access to basic services within South Africa is a basic human right. It is also an indication of the quality of life of the inhabitants in the country. Access to basic services has a wider impact on education and health and therefore also on the economy. The Municipal Economic Review and Outlook of 2015 further highlights the positive economic impact of basic infrastructure spending on the overall economy.
The levels of access to basic services will be discussed below in terms of access to water, sanitation, energy, refuse removal and housing.
The 2015 Socio-economic Profile also contains a breakdown of access to basic services for each ward within the Langeberg Municipality as recorded by Census 2011 (hereto attached as an Annexure). This information provides the Municipality with a detailed overview of ground-level access to basic services that will assist in the allocation of resources towards the areas of most need. This data will also in future
MurderTotal sexual
offences
Burglary atresidentialpremises
Drug-related crimeDriving under the
influence ofalcohol or drugs
Witzenberg 38 143 748 2 426 136
Drakenstein 36 148 805 1 243 89
Stellenbosch 45 124 1 036 1 194 102
Breede Valley 36 138 795 1 153 137
Langeberg 25 124 606 1 411 168
Cape Winelands District 37 137 817 1 412 118
0
500
1 000
1 500
2 000
2 500

Langeberg Municipality
15
inform the Municipality’s service delivery budget and implementation plan which, as per MFMA Circular 13, must contain a ward-specific capital works plan.
6.1 Access to water
Table 12 indicates the levels of access to potable water within the Cape Winelands District in 2014.
Table 12 Cape Winelands District: Access to water, 2014
Regional area
Piped water inside
dwelling
Piped water inside
yard
Piped water less than
200 m from dwelling
Piped water more than
200 m from dwelling
Borehole/ rain-water
tank/well
Dam/river stream/ spring
Water-carrier tanker/water
vendor Other/
Unspecified
Western Cape 74.1 13.8 8.7 2.5 0.1 0.1 0.1 0.6
Cape Winelands District 75.6 13.7 8.0 1.8 0.1 0.1 0.0 0.6
Witzenberg 78.0 12.4 8.1 1.0 0.1 0.1 0.0 0.3
Drakenstein 79.3 13.9 5.4 0.8 0.1 0.1 0.0 0.4
Stellenbosch 73.9 8.6 12.9 3.4 0.1 0.1 0.0 0.8
Breede Valley 68.2 18.7 9.5 2.2 0.0 0.1 0.1 1.2
Langeberg 79.9 14.2 3.7 1.6 0.0 0.2 0.1 0.3
Source: Quantec Research, 2015
The data indicates that in Langeberg 79.9 per cent of households have access to water within their dwellings and a further 14.2 per cent have access within their yard. Households that have access to water at least 200 m from their dwelling is 3.7 per cent Compared to other local municipalities across the District, Langeberg potable water access levels are the 3rd highest in 2014.
The Blue Drop certification reflects on the actual quality of tap water within a municipality. It further acknowledges a municipality’s ability to sustain this quality and provides an indication of preparedness to deal with any incident that may pose a water related health risk to the public. The certification process attributes a weighted score according to a municipality’s performance measured against a specific set of water management criteria such as water safety planning, drinking water quality compliance etc. Municipalities that achieve overall scores above 95 per cent are officially awarded the prestigious Blue Drop status.
According to the 2012 Blue Drop status report, Langeberg Municipality achieved a blue drop score of 51.62 per cent, which could not be considered as satisfactory performance. However it was mentioned in the report that the Municipality has significant scope for improvement in their overall Blue Drop performance.
6.2 Access to refuse removal
Inadequate waste services lead to unpleasant living conditions and a contaminated, unhealthy environment. For this reason municipalities across the country provide their inhabitants with waste removal services.
Table 13 displays the levels of access to refuse removal within the Cape Winelands District in 2014.

Socio-economic Profile 2015
16
Table 13 Cape Winelands District: Access to refuse removal, 2014
Regional area
Removed at least
once a week Removed less often
Communal refuse dump
Own refuse dump
No rubbish disposal
Unspecified/other
Western Cape 89.8 1.2 2.8 4.6 1.0 0.6
Cape Winelands District 79.8 4.1 3.7 9.3 1.6 1.4
Witzenberg 69.7 8.7 6.9 11.4 1 2.3
Drakenstein 86.2 2.8 3.3 5.3 1 1.4
Stellenbosch 87.3 2.6 2.4 4.7 1 1.9
Breede Valley 75.1 5.2 5.1 11.3 2.9 0.4
Langeberg 72.0 2.7 1 20.8 2.1 1.4
Source: Quantec Research, 2015
The data indicates that within Langeberg municipal area, 72.0 per cent of households have their refuse removed at least once a week. Compared to other municipalities across the District, Langeberg access levels are the second lowest in 2014. Approximately, 21 per cent of households make use of own refuse dumps to dispose their refuse.
6.3 Access to electricity
Table 14 reflects the different sources of energy used for lighting by households in Langeberg.
Table 14 Cape Winelands District: Access to electricity, 2014
Municipality Electricity Gas Paraffin Candles Solar/other/unspecified
Cape Winelands District 93.1 0.2 3.1 2.9 0.6
Witzenberg 93.4 0.2 1.8 3.9 0.8
Drakenstein 94.9 0.2 2.5 1.9 0.5
Stellenbosch 95.3 0.3 1.8 2.0 0.7
Breede Valley 87.8 0.2 7.2 4.3 0.5
Langeberg 94.3 0.1 1.0 3.5 1.1
Source: Quantec Research, 2015
Table 14 indicates that the biggest source of energy in Langeberg is electricity at 94.3 per cent in 2014. This is the third highest compared to other local municipalities in the Cape Winelands region in 2014.
6.4 Access to sanitation
Access to sanitation is one of the most important basic services as it concerns the health and dignity of human beings. Table 15 shows the type of sanitation facilities available to households in Langeberg in 2014.

Langeberg Municipality
17
Table 15 Cape Winelands District: Access to sanitation, 2014
Municipality Flush or
chemical toilet Pit latrine Bucket latrine Not listed elsewhere
Cape Winelands District 90.8 0.7 2.6 5.9
Witzenberg 91.3 0.9 2.0 5.9
Drakenstein 93.6 0.5 2.9 2.9
Stellenbosch 90.4 0.9 3.0 5.7
Breede Valley 87.9 0.7 2.6 8.9
Langeberg 89.2 0.6 2.3 7.9
Source: Quantec Research, 2015
In 2014, 89.2 per cent of households had access to flush toilets (connected to sewerage/septic tank), however 7.9 per cent of households did not have access to sanitation in 2014 whilst 2.9 per cent of households made use of bucket latrine or pit latrines.
6.5 Housing
Decent housing with the relevant basic services is essential for human security, dignity and well-being.
Table 16 Cape Winelands District: Types of housing structures, 2014
Municipality
House or brick
structure on a
separate stand or
yard Traditional
dwelling
Flat in a block of
flats
Town/ cluster/
semi-detached
house (simplex, duplex or
triplex)
House/ flat/
room in backyard
Informal dwelling/s
hack in backyard
Informal dwelling/
shack NOT in backyard, e.g. in an informal/ squatter
settlement
Room/ flatlet not in
backyard but on a
shared property Other
Cape Winelands District 68.9 0.6 5.6 5.9 1.2 6.1 9.8 0.7 1.2
Witzenberg 77.5 0.8 1.2 5.6 0.6 3.6 8.6 0.6 1.4
Drakenstein 70.0 0.5 6.4 5.9 1.4 8.0 5.9 0.9 1.0
Stellenbosch 59.8 0.6 9.9 5.6 1.1 5.6 15.2 0.7 1.5
Breede Valley 61.0 0.7 5.7 8.0 1.6 5.6 15.4 0.6 1.4
Langeberg 84.7 0.4 1.4 3.2 0.9 6.0 2.3 0.2 0.8
Source: Quantec Research, 2015
Table 16 highlights the most common dwellings in Langeberg were: House or brick structure on a separate stand (84.7 per cent), Informal dwellings in an informal/squatter camp (6.0 per cent), Town/cluster/semi-detached house (3.2 per cent) and the informal dwelling/shack in the backyard (2.3 per cent in 2014).
7. Economy
Economic growth in South Africa has been deteriorating since 2012; GDP growth of 2.5 per cent, 2.2 per cent and 1.5 per cent was achieved in 2012, 2013 and 2014 respectively. Initiatives to bolster economic growth on a national scale have been undertaken and progress has been made, talks to establish a more sustainable labour relations environment have been undertaken and administrative reforms to reduce red tape have been implemented. Key structural issues which hinder the desired

Socio-economic Profile 2015
18
growth levels nevertheless remain entrenched. Given the close linkages between the municipalities in the Province and the national economy, the metro and the district (and thus local) municipalities in the Western Cape are impacted by current state and fluctuations in the national economy.
The Cape Winelands economy grew by 1.9 per cent in 2013, but growth slowed down to an estimated 1.4 per cent in 2014. These rates are unfortunately still below the District’s average long term (2005 - 2013) trend growth of 3.5 per cent. The forecasted average annual growth for the District is estimated at 2.8 per cent over the 2015 - 2020 period. This forecast was revised downwards in line with global, national and provincial growth forecasts from a more optimistic 3.1 per cent.
Figure 6 Cape Winelands District municipalities: GDPR growth, 2005 - 2013
Source: Municipal Economic Review and Outlook (MERO), 2015
The District is the largest non-metro district in the Western Cape economy, contributing 11.6 per cent of the Province’s GDPR and employing 13.3 per cent of the provincial workforce. Langeberg’s economy contributed 11.5 per cent of Cape Winelands District GDPR in 2013 and employed close to 12 per cent of the regional workforce. The Langeberg economy generated R5.8 billion of the District’s R50.2 billion gross value added.
Langeberg is the second fastest growing municipality in the Cape Winelands District and is ranked 7th in the Province. The ranking is determined by considering both the size and growth of the municipal economies. The Municipality’s real GDPR growth from 2005 - 2013 is 4.3 per cent per annum.
9 31 34 15 11
2.70
3.00
4.80
2.20
4.30
0
5
10
15
20
25
30
35
40
0.00
1.00
2.00
3.00
4.00
5.00
6.00
Witzenberg Drakenstein Stellenbosch Breede Valley Langeberg
Dis
tric
t G
DP
R, 2
013
(%)
GD
PR
Tre
nd
, 200
5 -
2013
(%
)
% District GDPR, 2013 GDPR Trend, 2005 - 2013

Langeberg Municipality
19
Table 17 Cape Winelands District: GDPR growth, 2000 - 2013
Municipality
Real GDPR growth (average yoy %)
Expansion Recession Recovery
2000 - 2007 2008 - 2009 2010 - 2013
Cape Winelands District 4.6 1.8 2.7
Witzenberg 3.8 3.2 1.5
Drakenstein 3.5 0.7 2.8
Stellenbosch 6.4 2.6 3.7
Breede Valley 3.0 0.4 1.6
Langeberg 6.0 3.2 2.4
Source: Municipal Economic Review and Outlook (MERO), 2015
As per Table 17, Langeberg managed to grow by 3.2 per cent per annum during the recessionary period (2008 - 2009). The Municipal economy slowed down further to 2.4 per cent during the recovery period (2010 - 2013) which is significantly off the trend rate of 4.3 per cent.
This growth is underscored by significant variations in industry-specific growth rates. Growth in a particular industry depends on a number of factors (economies of scale, technological developments and demand trends among others) which often diverge among industries. Table 18 displays the industry-specific growth rates for each municipality in the Cape Winelands District.
Table 18 Cape Winelands District: Sectoral growth, 2005 - 2013
Industry Witzenberg Drakenstein Stellenbosch Breede Valley Langeberg Cape Winelands
District
Agriculture, forestry and fishing
1.3 1.0 0.5 -0.1 0.3 0.6
Manufacturing 1.4 0.6 1.9 3 3.5 1.8
Construction 0.8 3.4 9.4 7.7 7.8 6.6
Commercial services 4.8 5.1 6.1 2.8 7.9 5.3
General government and Community, social and personal services
3.3 2.2 6.7 1.9 5.1 4
Other 0.5 4.1 4.3 -6 -0.4 1.8
Total 2.7 3 4.8 2.2 4.3 3.5
Source: Municipal Economic Review and Outlook (MERO), 2015
As mentioned previously, Langeberg has been the second fastest growing municipality in the District at 4.3 per cent for the period 2005 - 2013. This performance was largely supported by strong growth within the commercial services and construction services industry who maintained average growth of 7.9 and 7.8 per cent respectively.
Growth within the agriculture (0.3 per cent) and manufacturing (3.5 per cent) sectors were less favourable. At 3.5 per cent, manufacturing growth was nonetheless the highest compared to the other local municipalities and the District average of 1.8 per cent.

Socio-economic Profile 2015
20
Figure 7 Langeberg: Sectoral composition, 2013
Source: Municipal Economic Review and Outlook (MERO), 2015
As per Figure 7, the three largest contributors to GDPR in 2013 for Langeberg were the manufacturing (32 per cent), agriculture, forestry and fishing (18 per cent) as well wholesale and retail trade, catering and accommodation (13 per cent) sectors.
8. Labour market
In terms of contributions to GDPR, Langeberg is the fourth most dominant regional economy in the Cape Winelands District (11.5 per cent contribution in 2013). Figure 8 reveals that Langeberg employs 12 per cent of the District’s workforce which is relatively small in relation to Stellenbosch and Drakenstein which employ 29 and 28 per cent respectively.
Figure 8 Cape Winelands District municipalities: Municipal GDPR vs municipal employment, 2013
Source: Municipal Economic Review and Outlook (MERO), 2015
Agriculture, forestry and fishing
18%
Mining and quarrying
0%
Manufacturing32%
Electricity and water0%
Construction 3%
Wholesale and retail trade, catering and
accommodation13%
Transport, storage and
communication 9%
Finance, insurance, real
estate and business services
12%
Community, social and personal
services 4%
General government
9%
12% 28% 29% 18% 12%
4.4
15.4
16.9
7.4
5.8
0%
10%
20%
30%
40%
0.0
5.0
10.0
15.0
20.0
Witzenberg Drakenstein Stellenbosch Breede Valley Langeberg
Reg
ion
al e
mp
loym
ent,
%
Reg
ion
al G
DP
R, R
bil
lio
n
Regional employment as proportion of total District employment, 2013Regional GDPR, R billion
Langeberg Municipality
21
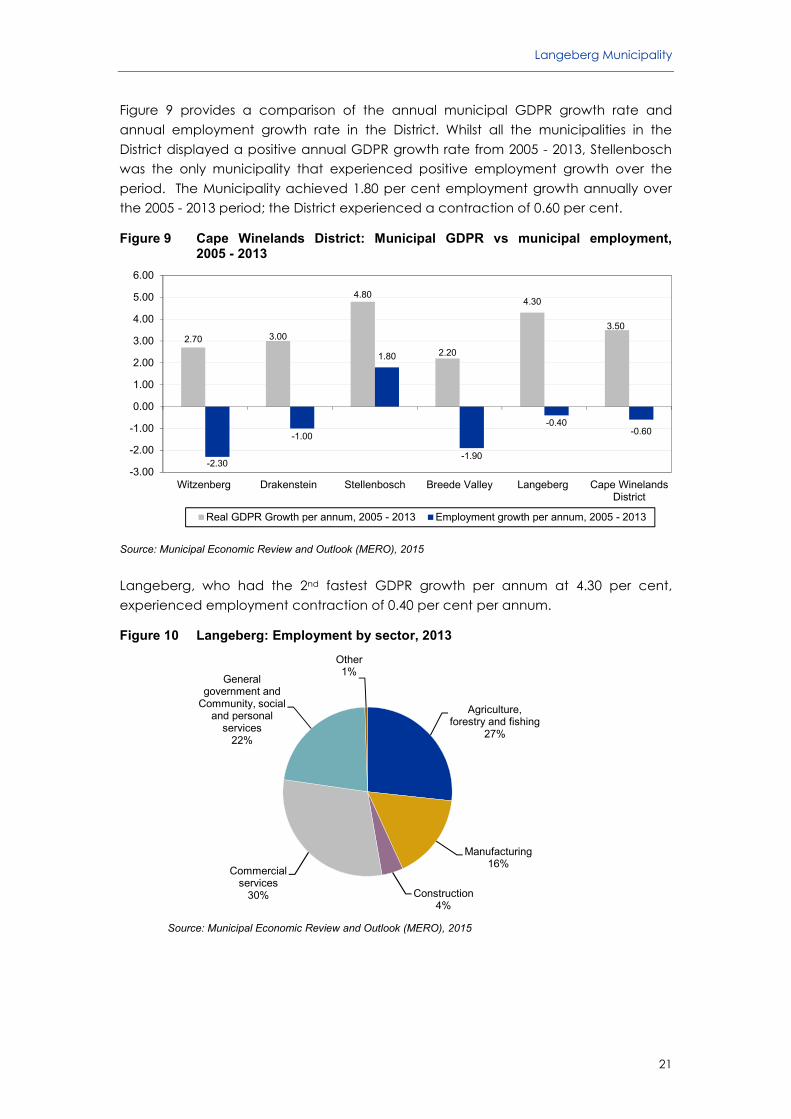
Figure 9 provides a comparison of the annual municipal GDPR growth rate and annual employment growth rate in the District. Whilst all the municipalities in the District displayed a positive annual GDPR growth rate from 2005 - 2013, Stellenbosch was the only municipality that experienced positive employment growth over the period. The Municipality achieved 1.80 per cent employment growth annually over the 2005 - 2013 period; the District experienced a contraction of 0.60 per cent.
Figure 9 Cape Winelands District: Municipal GDPR vs municipal employment, 2005 - 2013
Source: Municipal Economic Review and Outlook (MERO), 2015
Langeberg, who had the 2nd fastest GDPR growth per annum at 4.30 per cent, experienced employment contraction of 0.40 per cent per annum.
Figure 10 Langeberg: Employment by sector, 2013
Source: Municipal Economic Review and Outlook (MERO), 2015
2.70 3.00
4.80
2.20
4.30
3.50
-2.30
-1.00
1.80
-1.90
-0.40-0.60
-3.00
-2.00
-1.00
0.00
1.00
2.00
3.00
4.00
5.00
6.00
Witzenberg Drakenstein Stellenbosch Breede Valley Langeberg Cape WinelandsDistrict
Real GDPR Growth per annum, 2005 - 2013 Employment growth per annum, 2005 - 2013
Agriculture, forestry and fishing
27%
Manufacturing16%
Construction4%
Commercial services
30%
General government and
Community, social and personal
services22%
Other1%

Socio-economic Profile 2015
22
Figure 10, illustrates that Langeberg’s commercial services sector (30 per cent) and the agriculture sector (27 per cent) were the largest employers in the Municipality in 2013. This is followed by general government and community, social and personal (CSP) services (22 per cent) and manufacturing (16 per cent).
Table 19 Cape Winelands District: GDPR growth vs net employment, 2005 - 2013
Witzenberg Drakenstein Stellenbosch Breede Valley Langeberg Cape Winelands District
Industry GDPR trend
Net employment
GDPR trend
Net employment
GDPR trend
Net employment
GDPR trend
Net employment
GDPR trend
Net employment
GDPR trend
Net employment
Agriculture, forestry and fishing
1.30% -7 773 1.00% -8 396 0.50% -5 550 -0.10% -9 791 0.30% -6 313 0.60% -38 284
Manufacturing 1.40% -399 0.60% -1 338 1.90% 676 3.00% -72 3.50% 505 1.80% -557
Construction 0.80% -381 3.40% -1 805 9.40% -73 7.70% -241 7.80% -191 6.60% -2 699
Commercial services
4.80% 497 5.10% 3 675 6.10% 7 427 2.80% 91 7.90% 2 922 5.30% 15 597
General government and Community, social and personal services
3.30% 910 2.20% 581 6.70% 7 755 1.90% 420 5.10% 1 659 4.00% 11 856
Other 0.50% 19 4.10% 212 4.30% 94 -6.00% 23 -0.40% 81 1.80% 429
Total 2.70% -7 127 3.00% -7 071 4.80% 10 329 2.20% -8 670 4.30% -1 337 3.50% -13 658
Source: Municipal Economic Review and Outlook (MERO), 2015
Consequent to the very slow growth in the agricultural sector, net employment over the period stood at -6 313. Despite the robust economic growth experienced in the construction sector also experienced net job losses. The two fast growing sectors (commercial services and general government and CSP services) also created the most jobs in the Municipality overall, with 2 922 net jobs created in the commercial services sector and 1 659 net jobs created in the general government and CSP services sector.
Table 20 Cape Winelands District municipalities: Employment per skills sector, 2005 - 2013
Sector composition
Witzenberg Drakenstein Stellenbosch Breede Valley Langeberg
Number Growth p.a. 2005 - 2013 Number
Growth p.a. 2005 - 2013 Number
Growth p.a. 2005 - 2013 Number
Growth p.a. 2005 - 2013 Number
Growth p.a. 2005 - 2013
Highly skilled 2 730 1.1% 9 100 0.4% 9 028 3.3% 4 871 -0.5% 3 038 2.6%
Skilled 6 038 -0.5% 21 502 -0.5% 21 651 1.9% 11 249 -1.2% 7 526 1.7%
Semi- and unskilled 15 286 -4.6% 24 006 -4.3% 22 664 -1.9% 18 595 -4.9% 12 050 -4.3%
Informal 4 907 2.6% 16 060 4.5% 17 875 7.8% 10 475 4.7% 6 778 6.1%
Total employment 28 960 -2.3% 70 668 -1.0% 71 217 1.8% 45 190 -1.9% 29 392 -0.4%
Source: Municipal Economic Review and Outlook (MERO), 2015
Consideration of employment figures per skills sector indicates that there has been an increase in demand for highly skilled and skilled labour within the Langeberg municipal area as employment in these categories increased by 2.6 and 1.7 per cent respectively for the period 2015 - 2013.
As per Table 20, semi- and unskilled labour constitutes approximately 41 per cent of the total labour force in Langeberg. It is therefore concerning to note that employment within this skills sector contracted by 4.3 per cent. This pattern is

Langeberg Municipality
23
prevalent across the Cape Winelands District. The job losses in this sector are congruent with the job losses experienced in the agriculture and construction sectors and can, amongst other factors, be attributed to the mechanisation of certain labour practices within these industries.
9. Environment
The 2011 National Strategy for Sustainable Development for South Africa describes the concept of sustainability as composing of three overlapping developmental spheres namely, the natural environment, social context and economic activity. These spheres, which are underpinned by a system of governance, are interlinked and fully dependent on the extent and functionality of the others. A trade-off in one sphere will compromise the functionality of another with significant knock-on effects.
The natural environment, inclusive of elements such as land, inland water, biodiversity and oceans and coastlines are increasingly under pressure as a result of certain socio-economic factors such as population growth rates and increased land use. These pressures on natural resources also pose limitations to economic growth. Climate change also poses significant bio-physical and economic risks and as such, sustainable and effective resource-use and climate change response, should be both a Provincial as well as Municipal strategic priority.
The Environmental section outlines key focus areas relevant to the current state of the natural environment and the associated need for environmental management, specifically, within the sphere of local government. These broad focus areas – legislative reform, integrated waste management, climate change – are briefly discussed in the following section and where available, include a municipal specific overview.
This information is intended to strengthen municipal planning support, inform future budget allocations and promote resource efficiency and effectiveness to ultimately preserve the natural environment for future generations.
9.1 Law reform - Implementation of SPLUMA/LUPA in municipalities
It is paramount that municipalities have planning and decision-making mechanisms in place to support its service delivery obligations and growth objectives. The Spatial Planning and Land Use Management Act, Act No. 16 of 2013 (SPLUMA), implemented on 1 July 2015, and the Western Cape Land Use Planning Act 2014 (LUPA) ushers in a new era of planning and development decision-making where the responsibility rests largely on local municipalities to fulfil their role as land use planning decision-makers as per Constitutional mandates and obligations. Section 24(1) of SPLUMA determines that a municipality must, after consultation as prescribed in the Act, adopt and approve a single land use scheme for its entire area within five years from the commencement of this Act.

Socio-economic Profile 2015
24
This land use scheme serves as a tool for municipalities to guide and manage development according to their vision in terms of its Integrated Development Plan (IDP) and Spatial Development Framework (SDF). This will provide potential developers and land users with a clear indication of developable land and its associated land uses within the municipal space. Clarity in land use zones can avoid any future confusion and lengthy delays in terms of prospective developments/uses.
Currently many municipalities have a Land Use Management Scheme in place in the form of Zoning Schemes, which are compliant with the provisions of the Land Use Planning Ordinance, 1985 (Ordinance 15 of 1985) (LUPO). These are known as LUPO section 7 and 8 Schemes. The process has commenced to replace these schemes to meet the requirements for Integrated Zoning Schemes (Land Use Schemes) in terms of section 24 of SPLUMA.
Transitional arrangements following the planning law reform should be noted. The Department of Rural Development and Land Reform (DRD&LR) and SALGA Circular 1 of 2015 noted that a municipality can continue to operate within old order legislative parameters in so far as that legislation does not conflict with SPLUMA. The Circular proposed that the decision-making structures associated with SPLUMA must be applied.
The Western Cape Department of Environmental Affairs and Development Planning sought a legal opinion in this regard and subsequently adopted a different approach. After consultation, the Provincial Minister of Local Government, Environmental Affairs and Development Planning has decided against a blanket implementation of LUPA in the Western Cape. Instead, a staggered implementation approach will be adopted. LUPA will be implemented, and LUPO will be repealed, in a staggered manner as and when municipalities are ready.
During the transition period, Western Cape municipalities were advised not to adopt the ‘hybrid’ solution proposed by DRD&LR and SALGA (Circular 1 of 2015). Instead, municipalities were advised to utilise the old-order legislation in its entirety (including decision-making structures) until the Western Cape Land Use Planning Act, Act No. 3 of 2014 (LUPA) and the LUPA Municipal Planning By-law is adopted. This was communicated in WCG: EADP Departmental Circular 0009/2015.
In order to determine a municipality’s readiness, the Department developed a set of actions that each Municipality must complete before the Minister will consider recommending that the Premier repeal LUPO and implement LUPA in a particular municipality.
These actions, as communicated in WCG: EADP Departmental Circular 0006/2015, are as follows:
a) Municipalities must have adopted and gazetted their By-law on Municipal Land Use Planning.
b) Municipalities must be at an advanced stage of establishing their Municipal Planning Tribunal. An advanced stage is regarded as having completed Step 7 of the ‘Municipal Planning Tribunal Establishment Manual’.

Langeberg Municipality
25
c) Municipalities must have Council adopted delegations. This includes appointing the Authorised Official(s) and adopting their categorisation of land use applications.
d) Municipalities must have Council adopted tariff structures in place for receiving land use management applications in terms of the new legislation.
On completion of these actions, the Municipal Manager must submit a letter to the Department noting the completion thereof in addition to providing the Department with the necessary supporting documentation/proof. The Department will then initiate the process LUPA implementation by the Premier in that particular municipality. Municipalities should note that this process may take 4 – 6 weeks to complete.
The Premier issued a proclamation to bring the LUPA into effect on 7 October 2015 in Langeberg Municipality. The proclamation was published in the Provincial Gazette Extraordinary 7509 on Wednesday, 7 October 2015. As such, from 7 October 2015 all land use applications submitted to Langeberg Municipality must be submitted in terms of their Municipal By-law on Land Use Planning.
Langeberg Municipality currently has a Land Use Management Scheme in the form of Zoning Schemes compliant with the provisions of the Land Use Planning Ordinance No. 15 of 1985 (LUPO).
Langeberg Municipality currently has a draft integrated zoning scheme which they intend to approve themselves when LUPA is implemented in their municipal area.
9.2 From waste management to integrated waste management
There is a shortage of available landfill airspace across the Province. The recovery of waste material for the waste economy is only at 9 per cent. There is a need to move away from the landfill bias to integrated waste management. To achieve this, more integrated waste management infrastructure is urgently needed. This will increase the recovery of waste material and thereby save landfill airspace, promote the waste economy, reduce the environmental impacts of waste management and create jobs. A mind shift also is needed from municipalities to move away from seeing waste just as a nuisance and risk to realise the intrinsic value of waste and to utilise the potential value of it.
Due to the landfill airspace shortage, municipalities are exploring regional waste disposal options. Such options are however costly due to the high transport cost. The effective management of such regional facilities is also problematic due to the multi-party involvement. These regional facilities have to be operated by the district municipalities and unfortunately these municipalities do not receive any MIG Funding, which makes these facilities difficult to construct and operate. However, regionalisation of not just waste disposal facilities, but integrated waste management facilities have to be encouraged and alternative business cases such as private public ventures have to be explored.

Socio-economic Profile 2015
26
All the waste disposal facilities except one (application to obtain a waste management licence is currently in process) have waste management licences. Since 2013 the requirements for landfill operation has increased dramatically, therefore making it difficult and very expensive for municipalities to comply with. The compliance of landfills in the Province has to increase dramatically which means that more resources are needed to meet the new legislative requirements. The majority of the landfills in the Province have by now reached full capacity must be closed and rehabilitated. Due to the strict environmental requirements set by the national government for closure and rehabilitation of waste disposal facilities, it is very expensive to comply and municipalities find them in the difficult position that it does not have the necessary resources to rehabilitate these facilities.
Cost reflective waste tariffs are in general not charged by municipalities and combined with the high level of poverty with people who cannot afford high service charges, impacts negatively on the sustainability of the waste management service. Waste management should also be regarded as bulk infrastructure. If not, it further puts this service at a funding disadvantage. This is a perception that must be changed urgently so that waste management can also benefit equally from government funding for development and building of houses.
In general, the skill levels of municipal waste managers should be improved as well as the staff capacity available to render an effective and efficient waste management service. A further priority area for municipalities is to either align its waste management by-laws with national legislation or to publish a waste management by-law which will assist in the management of this service and facilitate interaction which the private sector to improve service delivery and to benefit from the waste economy and job creation.
9.3 Climate change
The science of human-caused climate change is undisputable6. The average global temperature has already increased by 0.8°C; at this rate we are on track to reach a 4°C global average warming by 2100. Evidence suggests Africa is warming faster than the global average which is having severe impacts for hard-won developmental gains across an already vulnerable continent. Climate change impacts are already evident in the Western Cape and are negatively impacting and undermining economic and social development. Infrastructure, basic resources (water, food and energy) and livelihoods will all be impacted on and these impacts will affect all sectors and stakeholders, with a particular impact on the poor and vulnerable sectors of our community. Substantial responses are required by all role-players in order to adapt to the changes that will be experienced.
6 The Intergovernmental Panel on Climate Change released its 5th global assessment report in 2013, and states “warming of the climate system is unequivocal, and since the 1950s, many of the observed changes are unprecedented over dates to millennia. The atmosphere and ocean have warmed, the amounts of snow and ice have diminished, sea level has risen, and the concentrations of greenhouse gasses have increased”.

Langeberg Municipality
27
To date, the implementation of climate change responses to this changed climate has been slow. Many stakeholders do not perceive that it is their responsibility or mandate to prepare for climate change, and state limited resources and the delivery of other basic services as a challenge. Climate change is everyone’s business and has to be incorporated into every facet of spatial and land use planning, service delivery, infrastructure development and economic planning. Failure would compromise basic service delivery, exacerbate poverty and undermine the most vulnerable communities.
The following are some recent observed trends in the Western Cape:
Climate Variable Observed trends Outlook and Comments
Temperature General trend of rising temperatures, including both minimum and maximum temperatures. Increased temperatures and increased evapotranspiration result in dry soils and vegetation which becomes more readily fire-prone. Tuesday March 3rd 2015 was the highest temperature ever recorded (in 100 years) in Cape Town at 42°C. This coincided with severe fires.
For example there has been a decrease in the number of very cold days to create the cold (or chill) units required for deciduous fruit cultivars to grow. Number and intensity of fires seem to be on the increase. Disaster funds for fires will need to increase, but more importantly proactive protection of ecosystems and water is the required long term response.
Precipitation (Rain, snow)
Reduction in rain days in autumn and summer especially on the Southern Coast. Evidence of a trend in increasing severity of rainfall events (i.e. more rain falls in a shorter time. Winter rainfall season starting later each year. Anecdotal information of reduction of winter snow in Karoo – may result in decreased groundwater recharge. Current status unknown.
City of Cape Town responding with increase flood preparedness plans in winter, and increasing standard requirements for storm water flows in infrastructure. Late onset of rainfall in winter of 2015 was very close to causing a major problem for wheat farmers (documented in SmartAgri Status Quo Assessment – DOA and DEADP).
Wind Wind velocity expected to increase, with stronger South Easters. Impacts currently unknown.
Impacts on tourism: e.g. Table Mountain cable car operations, Robben Island ferry operations, beach usability etc.
Sea level rise Sea level has been rising at the same rate as global trends. See discussion on ‘sea storm surges’ below.
There is global concern that previous estimates of the rates of sea level rise may have been too optimistic, and that decision makers need to be aware that worst case scenarios in this century may be possible.

Socio-economic Profile 2015
28
Climate Variable Observed trends Outlook and Comments
Ocean temperature
The Agulhas current has warmed by 1.5°C since 1980. Changes in the distributional range of fish and other marine species. Climate change is also responsible for shifts in the distribution of the West Coast rock lobster. However the full understanding of these changes is complex and cannot necessarily all be attributed to a changing climate.7
Impacts of shifting marine resources have implications for social and economic fabric of coastal communities.
Ocean Acidification8
Ocean acidification would have severe impacts on most ocean life. Currently the ocean has already acidified by 0.1 pH points as a global average (this varies from region to region).
Current impacts not evidently well described.
Between 2003 and 2008, direct damage (predominantly from floods and drought in the Eden and Central Karoo Districts), caused approximately R3 billion of damage in the Western Cape. If not closely monitored and managed, above variables could potentially cause other severe natural disasters which will be detrimental to human life. These include:
Climate Variable Observed trends Outlook and Comments
Floods/Droughts Numerous flood and drought events have occurred in the Western Cape in the past decades with frequency seeming to increase. Difficult to determine if these are all attributable to a changing climate, but likely, given similar trends globally. There is currently a drought in the north of South Africa which is impacting sugar and maize commodities. The Central Karoo might be entering a drought scenario (although some climate responses such as the water reuse plant in Beaufort West might be reducing these impacts currently).
ALERT: As at 20 September 2015, the Western Cape had 72 per cent of dam capacity at the end of the wet season (2014 were at 92 per cent of capacity).
7 SAEON. 2011 Observations in Environmental Change in South Africa. 8 As the ocean absorbs CO2 its pH changes.

Langeberg Municipality
29
Climate Variable Observed trends Outlook and Comments
Sea Storm Surges (big storm events)
In the past 15 years various big storm events have caused infrastructure damage along the Western Cape coastline. Studies reflect sea level has risen on the Western Cape coastline in accordance with global trends. Most impacts are due to inappropriate coastal development.
Coastal municipalities potentially having a big role to play here. Insurance companies are starting to withdraw from some vulnerable coastal areas.
Fire Observed increased fire incidences9 and potential increase in extent and severity of fires. 2015 fires occurred in record breaking heat temperatures: Economic implications to the Tourism industry unknown; costs to CapeNature and SANParks not yet documented.
Challenging to differentiate how much of increase in fires and intensity is climate change related but global trends indicate climate change has a role to play. GLOBAL ALERTS: Fires in the USA and Canada in 2015 are unprecedented in scale and costs; also on the back of a prolonged drought.
Hail There is anecdotal evidence that more hail storms are occurring in areas of the Western Cape that had never before experienced it, causing economic loses to agriculture (SmartAgri Status Quo Report).
Increased likelihood of hail storms is not well understood.
There is thus a unique opportunity in the immediate short term to radically shift planning and infrastructure development to become climate resilient, and to reduce greenhouse gas emissions that are directly driving the problem. The window of opportunity is however short and closing rapidly, implying that climate change response is urgent if the Western Cape aims to continue with a thriving local economy and to reducing inequality and poverty.
Current disaster funding approaches are not sufficient for responding to climate change. These funds are generally reactive. Disaster funding is often utilised to rebuild the exact same infrastructure in the exact same places. In order to respond effectively and responsibly to climate change all departments need to integrate climate change into infrastructure build, and planning, and to utilise standards appropriate for a changed climate regime. Furthermore, critical ecological infrastructure is required to support and buffer built infrastructure (such as dune barriers, wetlands and mountain catchments – our “natural water towers”).
9 http://www.iol.co.za/news/south-africa/western-cape/cape-fire-insurance-firms-brace-for-claims-
1.1827557#.VfnA8RGeDGc

Socio-economic Profile 2015
30
10. Broadband penetration
Broadband penetration offers immense economic benefits by fostering competition, encouraging innovation, developing human capital and by building infrastructure. Improved connectivity will attract new business and investments, reduce the cost of doing business and will offer small, medium and micro enterprises access to new markets.
The World Bank found that for every 10 per cent increase in broadband penetration in developing countries, there is an increase of 1.38 per cent in GDP growth. Municipal broadband initiatives (internet services provided by a municipality) also offer great potential for enhanced economic growth and development, provided they address the key pillars of access, readiness (skills) and usage (stimulating demand for the Internet).
Improved internet penetration and accessibility also offers direct benefits for local government entities to improve the efficiency and effectiveness of public services. These benefits include the roll-out of e-services that will allow for the online payment of municipal accounts, motor vehicle registrations, animal registrations, reporting of infrastructure defects, free indigent services applications, career applications as well as tender applications. Online feedback mechanisms via social media will also support the facilitation of public participation during the annual reporting process and will offer constituents a platform to express public satisfaction.
Greater connectivity will also allow public servants remote access to information such as previous traffic infringements, building plan applications and outstanding accounts, for example.
Figure 11 Cape Winelands District: Internet access, 2011
Source: Statistics South Africa, Census 2011
In 2011, 34.79 per cent households had access to the internet in Cape Winelands District. The Langeberg Municipality had the second lowest penetration rate (28.03 per cent) in the District. This rate does not offers great potential for economic growth within the municipal area as 71.97 households do not have access to the internet within the Langeberg municipal area.
34.79
23.55
38.86
45.29
29.6328.03
0.00
10.00
20.00
30.00
40.00
50.00
Cape WinelandsDistrict
Witzenberg Drakenstein Stellenbosch Breede Valley Langeberg
Per
cen
tag
e

Langeberg Municipality
31
In order to improve access and stimulate usage of the Internet, the Western Cape Broadband Initiative will be implementing Wi-Fi hotspots at a provincial government building in every ward across the Province over the next three years.
These hotspots will allow limited free access (250 Mb per month) to any citizen, as well as allow all gov.za websites to be accessed free of charge. Wi-Fi hotspots will be installed in 102 wards across the Cape Winelands, including a hotspot in each of the 12 in the Langeberg municipal area.
11. Concluding remarks
Langeberg Municipality has shown much improvement over the years with respect to all areas of its socio-economic environment as discussed above. The socio-economic profile illustrates how the socio-economic environment impacts on the standard of living within the Langeberg municipal area.
The low population growth rates in conjunction with the faster growing economy have led to decreasing unemployment rates in Langeberg. This has in turn led to increasing household and per capita income. Although unemployment has decreased between 2001 and 2011, it is still a challenge within the Langeberg Municipality.
The Municipality faces many educational challenges, the most noteworthy being a very high learner dropout rate. This rate is particularly concerning given the low employment opportunities on offer for semi- and unskilled workers.
Cape Winelands compares favourably in terms of above average healthcare personnel allocation when compared to the other districts within the Province. Langeberg has a relatively low antiretroviral treatment load which is serviced by only 7 treatment sites. Consequently, the Mother-to-child transmission rate of 0 per cent is the lowest in the District and well below the District and Provincial averages. The number of registered TB patients has however shown an increase.
Langeberg has a literacy rate of 75.3 per cent, which is the lowest in the Cape Winelands District. These literacy rates may have implications for employment, income and municipal revenue.
The Langeberg Municipality, being the second fastest growing municipality in the Cape Winelands District, witnessed a dramatic slowdown after 2009. The favourable conditions in its agri-processing industries appear to have deteriorated.
Given strong population growth and continued emphasis on economic growth and development, the need to conserve and better manage limited resources, including that of the environment, is becoming more pronounced. Observable trends and impacts related to climate change are also fast becoming tangible and something that requires behavioral changes, also from municipalities. The interface of the environment with social and economic sectors will likely require much more attention and emphasis in coming years.


Socio-economic Profile 2015
33
Annexure
Langeberg: Ward specific access to basic services, 2011
Water
Municipality/ Ward
Piped (tap) water inside
dwelling/ institution
Piped (tap) water inside yard
Piped (tap) water on
community stand: distance less than 200 m from dwelling/
institution
Piped (tap) water on community stand: distance between 200 m
and 500 m from dwelling/
institution
Piped (tap) water on community stand: distance
between 500 m and 1 000 m (1 km) from dwelling/
institution
Piped (tap) water on community stand: distance
greater than 1 000 m (1 km) from dwelling/
institution
No access to piped (tap)
water
Langeberg 20 175 3 532 884 320 46 18 150
Ward 1 1 573 94 3 2 0 0 1
Ward 2 2 058 282 508 66 11 1 33
Ward 3 1 600 356 3 1 0 1 2
Ward 4 1 356 283 116 73 17 5 9
Ward 5 1 116 164 10 0 0 0 10
Ward 6 1 662 328 11 109 0 0 14
Ward 7 2 216 380 86 6 2 0 12
Ward 8 2 183 368 65 36 3 6 27
Ward 9 1 429 247 31 7 0 1 4
Ward 10 1 176 395 5 3 0 0 2
Ward 11 1 229 111 21 6 0 0 9
Ward 12 2 576 524 25 11 15 3 25
Electricity
Municipality/ Ward Electricity Gas Paraffin
Candles (not a valid option) Solar None
Langeberg 23 665 39 241 902 76 202
Ward 1 1 656 1 1 13 0 3
Ward 2 2 681 12 188 73 2 2
Ward 3 1 865 5 1 33 3 57
Ward 4 1 742 2 12 95 1 6
Ward 5 1 279 0 0 13 3 5
Ward 6 2 048 2 0 43 2 30
Ward 7 2 472 4 19 154 17 36
Ward 8 2 528 1 0 145 7 7
Ward 9 1 655 0 7 51 2 4
Ward 10 1 536 1 9 25 2 7
Ward 11 1 280 5 0 78 8 6
Ward 12 2 922 5 3 180 28 40

Socio-economic Profile 2015
34
Refuse removal
Municipality/ Ward
Removed by local authority/private company at least
once a week
Removed by local authority/private
company less often
Communal refuse dump
Own refuse dump
No rubbish disposal Other
Langeberg 18 010 650 283 5 287 538 356
Ward 1 1 667 1 0 4 1 0
Ward 2 2 730 21 5 139 40 25
Ward 3 1 954 4 1 3 0 1
Ward 4 1 821 4 0 2 2 30
Ward 5 624 49 49 508 34 36
Ward 6 1 204 262 26 531 70 31
Ward 7 1 850 62 28 647 81 34
Ward 8 662 98 71 1 586 165 104
Ward 9 1 587 18 3 73 20 20
Ward 10 1 572 5 0 0 1 2
Ward 11 579 62 63 626 20 28
Ward 12 1 761 65 37 1 167 104 45
Sanitation
Municipality/ Ward
Flush toilet (connected to
sewerage system)
Flush toilet (with septic
tank) Chemical
toilet
Pit toilet with ventilation
(VIP)
Pit toilet without
ventilation Bucket toilet Other None
Langeberg 20 856 1 535 54 60 89 625 1 073 833
Ward 1 1 595 3 0 0 0 35 20 21
Ward 2 2 338 21 1 4 7 19 553 17
Ward 3 1 854 1 1 1 1 85 7 14
Ward 4 1 453 58 1 2 1 59 103 182
Ward 5 845 348 13 5 7 11 29 42
Ward 6 1 834 88 16 0 16 46 36 89
Ward 7 2 261 192 12 13 6 42 152 24
Ward 8 1 825 474 1 9 38 56 64 220
Ward 9 1 495 45 0 6 2 125 7 39
Ward 10 1 446 83 0 3 0 0 28 20
Ward 11 1 241 54 2 6 7 21 12 34
Ward 12 2 668 168 7 11 4 127 62 131